Web Usability Assessment of Hawaii’s Labor Market Information
56
Web Usability Assessment of Hawaii’s Labor Market Information Delivery System FINAL REPORT September 2011
Transcript of Web Usability Assessment of Hawaii’s Labor Market Information

Web Usability Assessmentof
Hawaii’sLabor Market Information
Delivery System
FINAL REPORT
September 2011
This workforce solution was funded by a grant awarded by the U.S. Department of Labor’s Employment and Training Administration. The solution was created by the grantee and does not necessarily reflect the official position of the U.S. Department of Labor. The Department of Labor makes no guarantees, warranties, or assurances of any kind, express or implied, with respect to such information, including any information on linked sites and including, but not limited to, accuracy of the infor-mation or its completeness, timeliness, usefulness, adequacy, continued availability, or ownership. This solution is copyrighted by the institution that created it. Internal use by an organization and/or personal use by an individual for non-commercial purposes is permissible. All other uses require the prior authorization of the copy-right owner.
This report is intended for informational purposes. References to specific products, services or companies are for illustrative purposes only, and do not reflect an en-dorsement by the State of Hawaii or Department of Labor and Industrial Relations.
State of HawaiiNeil Abercrombie, Governor
Department of Labor and Industrial Relations
Dwight Takamine, Director
Research and Statistics OfficeFrancisco Corpuz, Chief
Labor Market Information
Phyllis Dayao, Staff Supervisor
Labor Market Research SectionVicki Lau, Section Supervisor
Jeri Arucan, Research StatisticianMelonie Ogata, Research Statistician
Hawaii Green Jobs InitiativeCarolyn Weygan-Hildebrand, Program Analyst
Phone: 808-586-8999
Fax: 808-586-9022Email: [email protected]
Website: www.hiwi.org
Web
Usa
bilit
y As
sess
men
t of H
awai
i’s L
abor
Mar
ket I
nfor
mat
ion
Del
iver
y Sy
stem
Executive Summary ..................................................................................................................1
Introduction .................................................................................................................................3
Assessments
The Websites:
Hawaii Workforce Infonet .......................................................................................5
HireNet Hawaii .......................................................................................................... 15
Hawaii Green Jobs Initiative Portal ................................................................... 19
Career Kokua .............................................................................................................. 23
The Tools:
Local Employment Dynamics .............................................................................. 26
Economic Modeling Specialists Inc. ................................................................. 30
Transferable Occupational Relationship Quotient ..................................... 36
Help Wanted Online ................................................................................................ 40
Recommendations .................................................................................................................. 44
Conclusion ................................................................................................................................. 52
Table of ContentsW
eb U
sabi
lity
Asse
ssm
ent o
f Haw
aii’s
Lab
or M
arke
t Inf
orm
atio
n D
eliv
ery
Syst
em

Web
Usa
bilit
y As
sess
men
t of H
awai
i’s L
abor
Mar
ket I
nfor
mat
ion
Del
iver
y Sy
stem
1
A labor market information delivery system has to be evaluated and improved periodically for its users. To initiate immediate and long-term improvements, the Department of Labor and Industrial Relations’ Research and Statistics Office (R&S) responded to this need by conducting an internal usability assessment of the web-sites and related web tools that make up its delivery system.
The Hawaii Workforce Infonet (HIWI), the primary and official website for labor market information delivery in Hawaii, was the focus of this assessment. The assess-ment was extended to the other websites and supplemental web tools that deliver labor market information: HireNet Hawaii, Hawaii Green Jobs Initiative portal, Ca-reer Kokua, Local Employment Dynamics (LED), Economic Modeling Specialists Inc. (EMSI), Transferable Occupational Relationship Quotient (TORQ), and Help Wanted Online (HWOL).
The purpose of this report is to find the best application of the websites and tools so that the delivery of labor market information can be improved to better suit the needs of target user groups. This assessment involved an evaluation of the function-ality of the tools, the effectiveness of the web page layout, and the relevance of con-tent to a variety of customers. These are the major findings and recommendations:
• In the first six months after launching the new website developed by Geo-graphic Solutions Inc., visits to the HIWI website declined significantly after the third month. Therefore, compelling reasons for revisiting the website need to be generated, such as adding fresh content on a regular basis, tailor-ing it towards each of the targeted user groups (job seekers, employers, and researchers and analysts), reorganizing the layout, and simplifying the ter-minology used throughout the site to improve the user experience by making it easier to find the desired information.
• Users want to get to the data as quickly as possible so working with Geosol to incorporate some desired enhancements is key to improving HIWI: mini-mize the drill down (reduce the number of clicks required to get the data); create a Data Dashboard to provide instant access to the most popular data sets; incorporate a site-wide search function to help users find what they want; and build in an email notification system feature. The website can be further enhanced by adding breadcrumbs (displaying the path taken from the home page to the current page); being able to bookmark the area, occu-pational, or industry profiles; and having printable web pages.
Executive Summary

Web
Usa
bilit
y As
sess
men
t of H
awai
i’s L
abor
Mar
ket I
nfor
mat
ion
Del
iver
y Sy
stem
2
• The HireNet Hawaii website needs regular updates to Workforce Informa-tion Database (WID) data provided by R&S so that users can get the most up-to-date labor market information available. Also, HireNet’s advertised job database, which includes jobs listings garnered through “spidering” technol-ogy, needs to be routinely cleaned up so it can provide the most reliable data possible for HIWI, which also accesses it for historical trend analysis.
• The Hawaii Green Jobs Initiative web portal is a brand new product that launched in May 2011 and is currently being monitored for data quality. The portal displays some non-green information from HireNet Hawaii and the filtering of green information needs to be refined.
• The Career Kokua website provides career assessment tools and career exploration information that are essential for making career choices. This website will soon merge into a brand new student portal as part of a state-wide effort to streamline students’ transition from high school to college and to careers.
• The LED tools, provided through a partnership between R&S and the U.S. Census Bureau, are currently underutilized. Since it contains unprecedented details about jobs, workers, industries, and local economies, the data adds value to traditional labor market information by incorporating demographic and commuting patterns. LED’s value should be highlighted by producing more localized reports focusing on job creation and hiring.
• Of the three newly procured tools - EMSI, TORQ, and HWOL – the most versatile is the EMSI Analyst tool which offers a wide variety of data analysis options and supplements data produced by R&S. TORQ is geared towards career analysis and assessing the skills gap of transitioning from one job to another using a scoring system. HWOL focuses primarily on job listings us-ing historical trend analysis and identification of shortages for occupations and industries. The versatility of a tool and its value-adding content should be among the criteria in extending procurement of these supplementary tools.
Hawaii’s labor market information system benefits a wide range of user groups, such as job seekers, employers, training providers, workforce staff, and job or career center partners. Each website targets a different customer base and tailors the pre-sentation of data and content to suit their needs. Users will appreciate the value of the system if there is clearer complementarity and less confusing overlap among the websites. Each website must focus on their niche without trying to be everything to everyone. Ideally, the DLIR can work towards making the HIWI, HireNet, Green Jobs portal, and Career Kokua websites more complementary.
Web
Usa
bilit
y As
sess
men
t of H
awai
i’s L
abor
Mar
ket I
nfor
mat
ion
Del
iver
y Sy
stem
3
In December 2009, the State of Hawaii Department of Labor and Industrial Relations (DLIR) received a $1.2 million American Recovery and Reinvestment Act (ARRA) grant from the U.S. Department of Labor’s Employment and Training Administration (ETA) to assist the state in transitioning to a greener economy. The grant proposal articulated three benefits to the State of Hawaii:
1) Improvement in the quality of information about green jobs and industries and expansion of the labor market information structure to estimate or proj-ect workforce needs of the clean energy sector;
2) Expansion of the interface between labor market information and the work-force development systems to include ways of distinguishing green jobs from other types of jobs; and
3) Helping clean energy stakeholders better understand the capacity of the State’s labor market information system and its role in building a skilled workforce.
To realize these benefits, one of the grant project deliverables is an assessment of labor market information dissemination and user interface tools that are currently used by planners, program implementers, education and training providers, pro-gram administrators, One-Stop center staff, students, and jobseekers. This report contains the results of the usability assessment that was done internally by the DLIR Research and Statistics Office (R&S) for the following websites:
• Hawaii Workforce Infonet (www.hiwi.org)
• HireNet Hawaii (www.hirenethawaii.com)
• Hawaii Green Jobs Initiative portal (www.greenjobshawaii.org)
• Career Kokua (www.careerkokua.org)
• Local Employment Dynamics (lehd.did.census.gov/led)
• Economic Modeling Specialists Inc. (www.economicmodeling.com)
• Transferable Occupational Relationship Quotient (www.torqworks.com)
• Help Wanted Online (www.conference-board.org/data/helpwantedonline.cfm))
The labor market information delivery system (Figure 1) consists of websites that were conceptualized at different times for different purposes by different segments of workforce development stakeholders. Therefore, each website has a different
Introduction
Web
Usa
bilit
y As
sess
men
t of H
awai
i’s L
abor
Mar
ket I
nfor
mat
ion
Del
iver
y Sy
stem
4
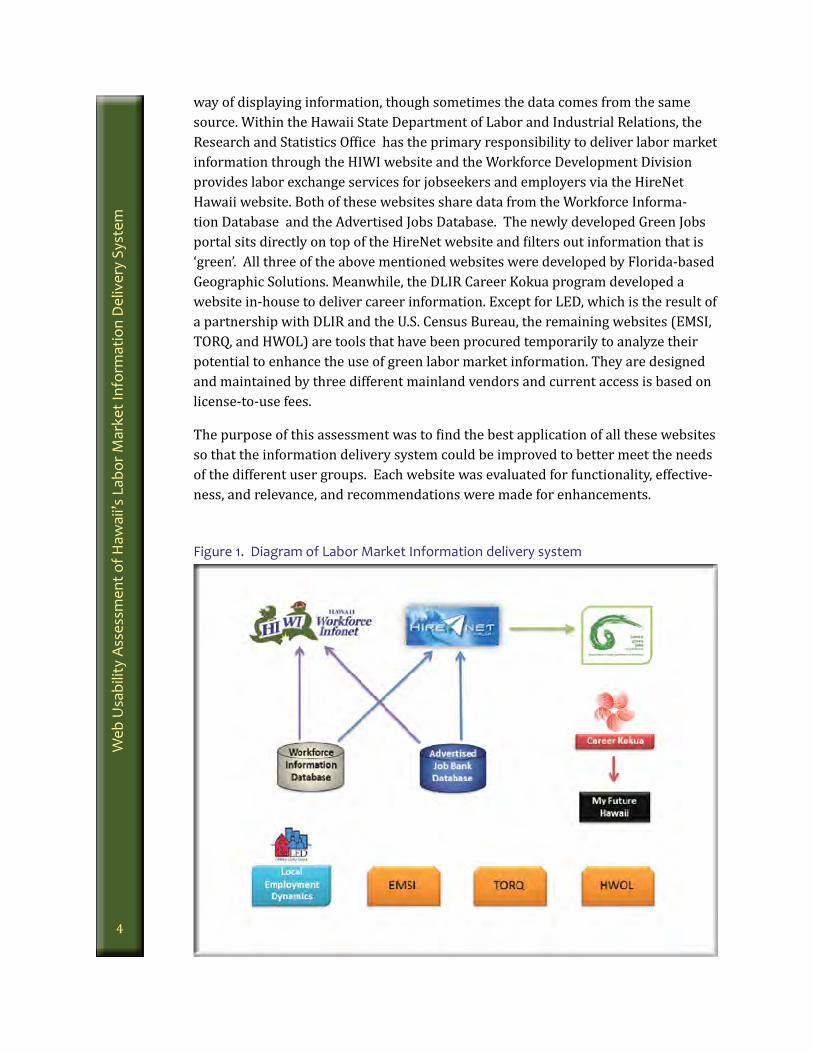
Figure 1. Diagram of Labor Market Information delivery system
way of displaying information, though sometimes the data comes from the same source. Within the Hawaii State Department of Labor and Industrial Relations, the Research and Statistics Office has the primary responsibility to deliver labor market information through the HIWI website and the Workforce Development Division provides labor exchange services for jobseekers and employers via the HireNet Hawaii website. Both of these websites share data from the Workforce Informa-tion Database and the Advertised Jobs Database. The newly developed Green Jobs portal sits directly on top of the HireNet website and filters out information that is ‘green’. All three of the above mentioned websites were developed by Florida-based Geographic Solutions. Meanwhile, the DLIR Career Kokua program developed a website in-house to deliver career information. Except for LED, which is the result of a partnership with DLIR and the U.S. Census Bureau, the remaining websites (EMSI, TORQ, and HWOL) are tools that have been procured temporarily to analyze their potential to enhance the use of green labor market information. They are designed and maintained by three different mainland vendors and current access is based on license-to-use fees.
The purpose of this assessment was to find the best application of all these websites so that the information delivery system could be improved to better meet the needs of the different user groups. Each website was evaluated for functionality, effective-ness, and relevance, and recommendations were made for enhancements.

Web
Usa
bilit
y As
sess
men
t of H
awai
i’s L
abor
Mar
ket I
nfor
mat
ion
Del
iver
y Sy
stem
5
Hawaii Workforce InfonetThe Hawaii Workforce Infonet (HIWI) website is a labor market information (LMI) delivery system. It is updated and maintained by the R&S Office’s Labor Market Re-search (LMR) Section to disseminate data and reports on the Internet, as mandated by ETA under the Workforce Information Grant. On November 1, 2010, the website debuted on a new platform developed by Geographic Solutions Inc. (Geosol), transi-tioning from the Ciber-based platform. A minor upgrade in version occurred on May 5, 2011, in conjunction with the launch of the new Green Portal and the upgrade of HireNet Hawaii.
The Home Page
The home page (Figure 2) design maintained a similar look and feel as the origi-nal HIWI website, with the intention that familiarity would make existing users feel comfortable with the transition to a new site even though the data tools would
Figure 2. HIWI home page
Web
Usa
bilit
y As
sess
men
t of H
awai
i’s L
abor
Mar
ket I
nfor
mat
ion
Del
iver
y Sy
stem
6
function differently. The goal was to keep the home page clean and simple, yet self-explanatory. The welcome message under the banner describes the purpose of the website. The ‘What’s New’ section features the newest reports on HIWI and the ‘Press Releases’ section has the monthly unemployment rate press release. The top right corner has a short list of Quick Links to various parts of the site that may be of great interest to users. The top (horizontal) navigation bar has links to dif-ferent modules of the website: Job Seekers, Employers, Analysts and Researchers, and Data and Publications. The left (vertical) navigation bar contains a menu of the interactive LMI tools which are designed to query data from the Workforce Informa-tion Database (WID).
Targeted User Groups
HIWI is structured for three primary user groups: job seekers, employers, and analysts/researchers. The links across the top navigation bar go to a page with a directory of services that pertain to that particular group’s interests and needs. Job seekers, or individuals, can look up information about careers, education, jobs, and labor market information. Employers can recruit for their job openings or research wages and other employers. The analyst or researcher is able to find all types of la-bor market information as well as real-time advertised job data that originates from the HireNet Hawaii website.
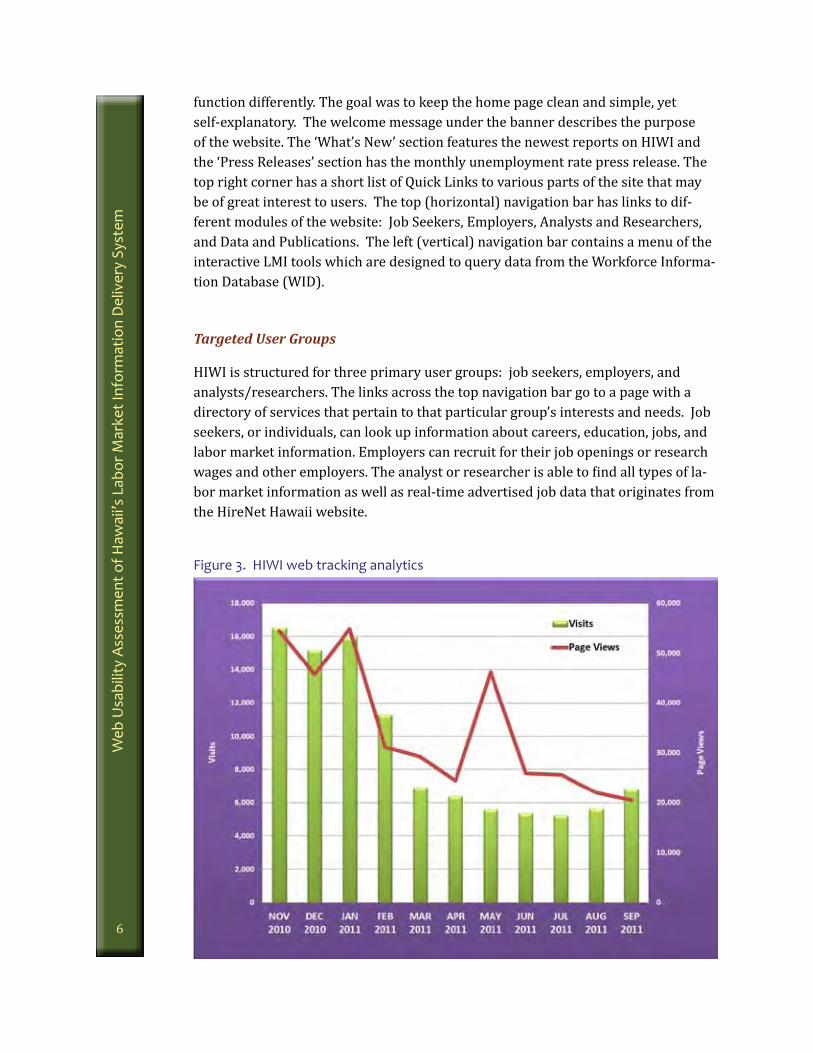
Figure 3. HIWI web tracking analytics

Web
Usa
bilit
y As
sess
men
t of H
awai
i’s L
abor
Mar
ket I
nfor
mat
ion
Del
iver
y Sy
stem
7
Summary of Usage
In the first 11 months since the new version of HIWI has gone live, November 2010 through September 2011, the site received over 100,880 visits and about 380,000 pages were viewed - or a monthly average of 9,171 visits and 34,549 page views. Figure 3 shows the number of monthly visits and page views on HIWI during the
Figure 4. HIWI labor market analysis page

Web
Usa
bilit
y As
sess
men
t of H
awai
i’s L
abor
Mar
ket I
nfor
mat
ion
Del
iver
y Sy
stem
8
11-month period. General usage of the site remained relatively stable in the first three months, then declined over the subsequent months only to rebound slightly in the last two months. Although the exact reasons for declining visitors are not known, one strategy to try and increase visits to the site would be to keep the web-site fresh by adding something new such as a monthly featured report or article on the home page. Once the site can be redesigned, then more content and marketing may encourage more usage. Efforts to promote the site whenever possible is a good idea. Marketing does not have to be expensive and it is not the same as advertising – it happens every day when talking to customers over the phone or via email, during presentations and meetings, and through published products.
About 80 percent of visitors to HIWI already knew about the website and arrived there directly, but the remaining 20 percent came to HIWI through another website such as hawaii.gov, google.com, and bls.gov. These are users that were referred to HIWI after visiting another government agency’s website such as the State of Hawaii government and Bureau of Labor Statistics, or visited the site after doing a search on Google or Bing. When users searched they frequently used the phrases “hiwi” or “hiwi.org” or some other variation. It can be concluded that the vast majority of HIWI’s users already knew about the site.
Most Popular Tools
According to information obtained from Google Analytics, the most viewed page in HIWI was the Labor Market Analysis page which is accessed by clicking on the ‘Researchers and Analysts’ link on the top navigation bar. This was an expected find-ing given the fact that HIWI was developed as a labor market information delivery website.
This page serves as a directory of services for labor market analysis (Figure 4) and lists the various tools available for the different data sessions. Divided into two main sections, there are the Current Data Analysis tools and the Historic Data Analy-sis tools. The first set of tools attempts to pull together all the latest data available for the particular critieria, such as area, occupation, or industry. There are profiles for areas, occupations, and industries.
Occupation ProfileEmployers
Employment & Wage DataArea Profile
Occupation Specific DataIndustry Profile
Education & Training DataAdvertised Job Data
Industry Specific DataArea Specific Data
ComparisonsSupply & Demand
Economic IndicatorsDemographics
Table 1. Labor market analysis tools

Web
Usa
bilit
y As
sess
men
t of H
awai
i’s L
abor
Mar
ket I
nfor
mat
ion
Del
iver
y Sy
stem
9
Other tools available are for education and training data and employers. The second set of tools allows the user to query more than the latest data, but a historical series for advertised jobs, employment and wages, economic indicators, and demographics.
The tools most used were the occupational profile and employer search (Table 1). Occupational information is always a popular item since people want to know what a particular job will pay and what the outlook may be. Requests for lists of compa-nies are frequent in LMR and the InfoGroup’s Employer Database supplies the in-formation utilized by this tool. Users may search business listings by keyword, area, industry, and occupation.
The Employment and Wage Data tool is divided into three sub-categories: Occupa-tion Data, Industry Data, and Labor Force Data. Of these three, the latter was the most popular selection, especially the unemployment rate and other labor force data. Occupation Data was the second most popular selection, mainly for the occupa-tional wage information.
Area profiles are frequently explored because users want to get data specific to a particular county. While statewide data is more widely available, sometimes the counties have different trends and outlooks because of the economic strengths that are unique to each island.
Industry profile and education and training data tools had lighter use than the tools previously mentioned but still prove to be useful to users.
The advertised job data tool is actually mining information from the HireNet Hawaii website, where employers post their job openings. The job bank database, which spi-ders from all sorts of public job boards, is also a part of this advertised job database.
Using the number of unemployed and advertised job openings, the supply and de-mand tool computes a ratio to illustrate this. It is a relatively new addition to HIWI, coming online around the time of the upgrade in May 2011. However, in this short amount of time, it has received more visits than the economic indica-tors and demographics tool which round out the bottom of the usage list.
The Occupation Specific Data, Industry Specific Data, Area Specific Data, and Comparisons tools are basically a duplication of what is available in the Pro-
Area ProfileOccupations with Most Openings
Highest Paying JobsOccupations with Least Openings
Occupations with Most EmploymentUnemployment rates
Fastest Growing OccupationsLowest Paying JobsLargest Employers
Table 2. Most popular labor market facts

Web
Usa
bilit
y As
sess
men
t of H
awai
i’s L
abor
Mar
ket I
nfor
mat
ion
Del
iver
y Sy
stem
10
Figure 5. HIWI labor market facts
file tools. If these tools are not being used with any significant frequency they could be removed to simplify the left navigation bar and make it easier for users to find what they need without going down the long list of tools that are currently available.
Web
Usa
bilit
y As
sess
men
t of H
awai
i’s L
abor
Mar
ket I
nfor
mat
ion
Del
iver
y Sy
stem
11
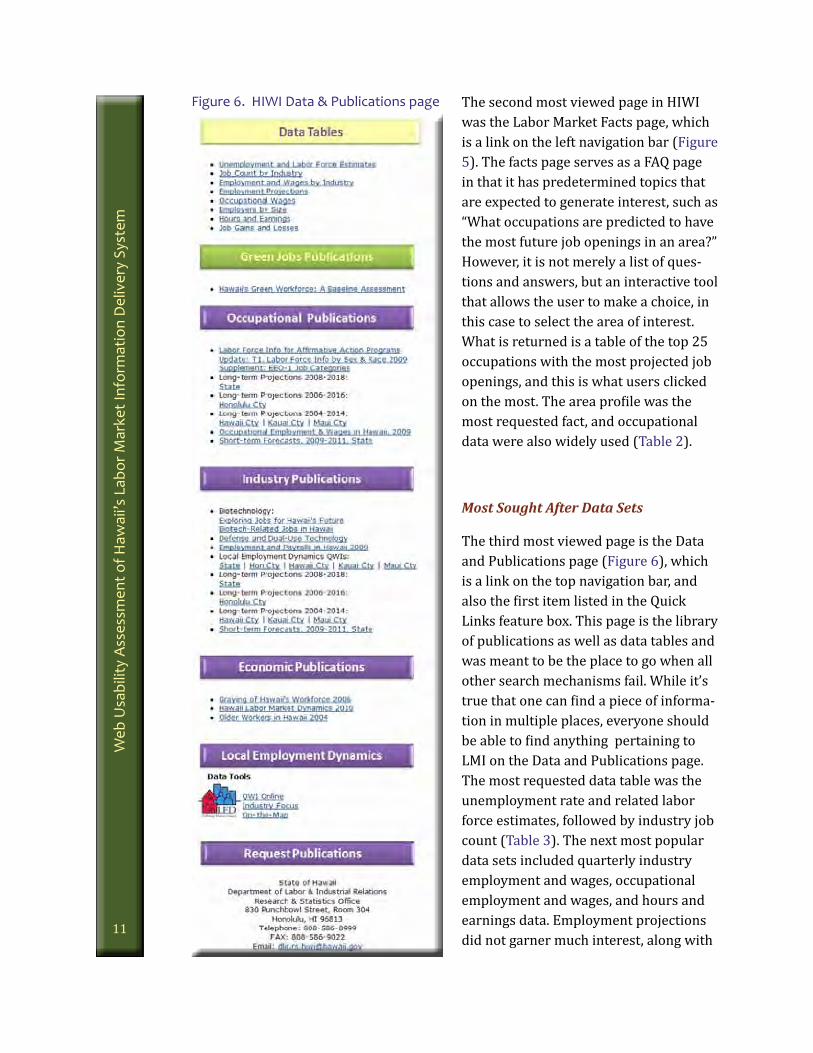
Figure 6. HIWI Data & Publications page The second most viewed page in HIWI was the Labor Market Facts page, which is a link on the left navigation bar (Figure 5). The facts page serves as a FAQ page in that it has predetermined topics that are expected to generate interest, such as “What occupations are predicted to have the most future job openings in an area?” However, it is not merely a list of ques-tions and answers, but an interactive tool that allows the user to make a choice, in this case to select the area of interest. What is returned is a table of the top 25 occupations with the most projected job openings, and this is what users clicked on the most. The area profile was the most requested fact, and occupational data were also widely used (Table 2).
Most Sought After Data Sets
The third most viewed page is the Data and Publications page (Figure 6), which is a link on the top navigation bar, and also the first item listed in the Quick Links feature box. This page is the library of publications as well as data tables and was meant to be the place to go when all other search mechanisms fail. While it’s true that one can find a piece of informa-tion in multiple places, everyone should be able to find anything pertaining to LMI on the Data and Publications page. The most requested data table was the unemployment rate and related labor force estimates, followed by industry job count (Table 3). The next most popular data sets included quarterly industry employment and wages, occupational employment and wages, and hours and earnings data. Employment projections did not garner much interest, along with

Web
Usa
bilit
y As
sess
men
t of H
awai
i’s L
abor
Mar
ket I
nfor
mat
ion
Del
iver
y Sy
stem
12
employers by size. In spite of this unexpected finding, the projections publications proved to be among the popu-lar downloads as discussed later in this report. The job gains and losses data had the lowest number of views.
Reviewing tracking statistics from Google Analytics for the most popular content is a good way to determine what users want. This data can help in planning the reorganization of the website so that the most popular types of data or reports are prominently located on the home page or near the top of the Data and Publications page. Perhaps the questions on the Labor Market Facts page can also be reordered to put the most sought after types of information at the top.
Each data tool on the left navigation menu has sub-categories , and a few such as those under the Historic Data Analysis section, have further sub-categories. This process can involve too many drill down selections, which can try users’ patience. Also, the selection process for area or time period requires the user to select the area by checking it off, and then an additional step to click a “Select” button.
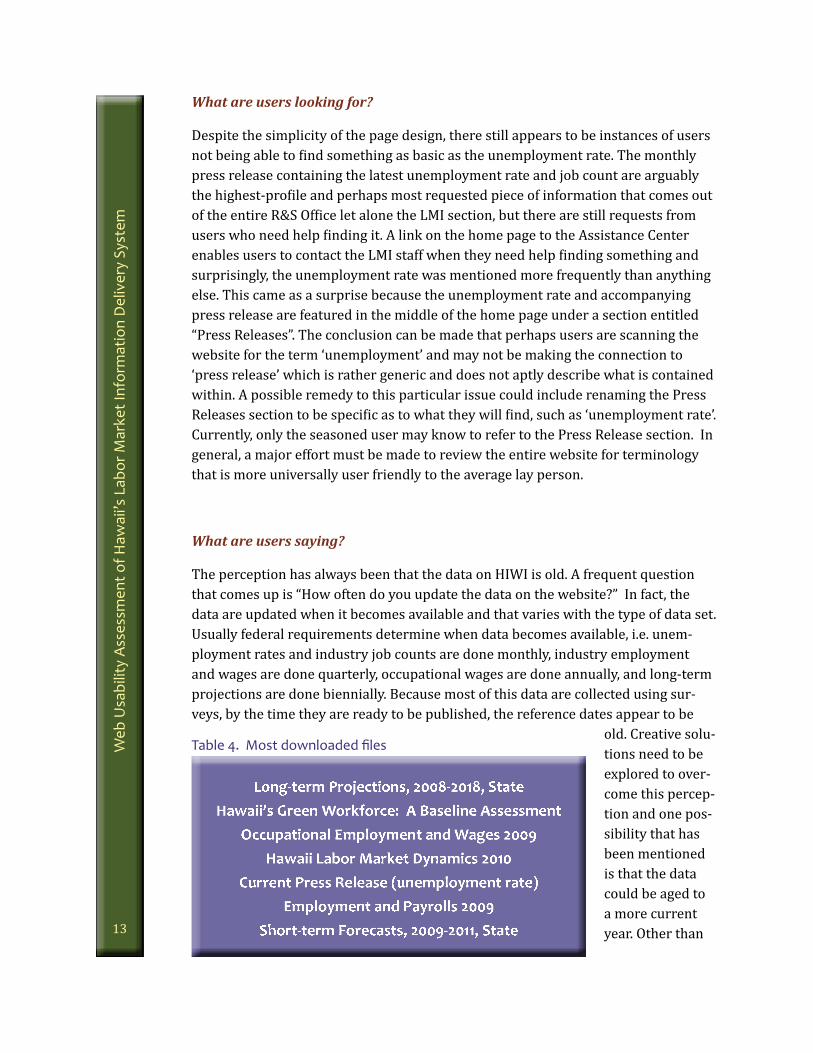
Top Downloads
Geosol does website tracking for HIWI and provides monthly summary reports that include a list of the top 25 most downloaded files (Table 4). After tabulating the downloads from November 2010 – September 2011, the most downloaded files were the 2008-2018 Long-term Projections report for the State of Hawaii and the special report “Hawaii’s Green Workforce: A Baseline Assessment”, by far. A distant third was the Occupational Employment and Wages 2009 publication. Other docu-ments that generated a lot of interest were: Hawaii Labor Market Dynamics 2010, the current monthly press release, Employment and Payrolls in Hawaii 2009, and the Short-term Forecasts 2009-2011. These files were featured under the What’s New section on the home page, as well as on the Data and Publications page. Be-ing front and center surely leads to more hits and therefore, LMR should continue to post all reports this way. The current monthly press release is under the Press Release section and although it is updated monthly, which should attract more hits, it was the fifth most popular download on HIWI.
Unemployment & Labor Force EstimatesJob Count by Industry
Employment & Wages by IndustryOccupational WagesHours and Earnings
Employment ProjectionsEmployers by Size
Job Gains and Losses
Table 3. Most popular data tables
Web
Usa
bilit
y As
sess
men
t of H
awai
i’s L
abor
Mar
ket I
nfor
mat
ion
Del
iver
y Sy
stem
13
What are users looking for?
Despite the simplicity of the page design, there still appears to be instances of users not being able to find something as basic as the unemployment rate. The monthly press release containing the latest unemployment rate and job count are arguably the highest-profile and perhaps most requested piece of information that comes out of the entire R&S Office let alone the LMI section, but there are still requests from users who need help finding it. A link on the home page to the Assistance Center enables users to contact the LMI staff when they need help finding something and surprisingly, the unemployment rate was mentioned more frequently than anything else. This came as a surprise because the unemployment rate and accompanying press release are featured in the middle of the home page under a section entitled “Press Releases”. The conclusion can be made that perhaps users are scanning the website for the term ‘unemployment’ and may not be making the connection to ‘press release’ which is rather generic and does not aptly describe what is contained within. A possible remedy to this particular issue could include renaming the Press Releases section to be specific as to what they will find, such as ‘unemployment rate’. Currently, only the seasoned user may know to refer to the Press Release section. In general, a major effort must be made to review the entire website for terminology that is more universally user friendly to the average lay person.
What are users saying?
The perception has always been that the data on HIWI is old. A frequent question that comes up is “How often do you update the data on the website?” In fact, the data are updated when it becomes available and that varies with the type of data set. Usually federal requirements determine when data becomes available, i.e. unem-ployment rates and industry job counts are done monthly, industry employment and wages are done quarterly, occupational wages are done annually, and long-term projections are done biennially. Because most of this data are collected using sur-veys, by the time they are ready to be published, the reference dates appear to be
old. Creative solu-tions need to be explored to over-come this percep-tion and one pos-sibility that has been mentioned is that the data could be aged to a more current year. Other than
Table 4. Most downloaded files
Long-term Projections, 2008-2018, StateHawaii’s Green Workforce: A Baseline Assessment
Occupational Employment and Wages 2009Hawaii Labor Market Dynamics 2010
Current Press Release (unemployment rate)Employment and Payrolls 2009
Short-term Forecasts, 2009-2011, State

Web
Usa
bilit
y As
sess
men
t of H
awai
i’s L
abor
Mar
ket I
nfor
mat
ion
Del
iver
y Sy
stem
14
that, there may be a limit to what can ultimately be done. If there is no way to speed up the release of data in a more timely fashion, there may be simple ways to try to alter the perception that the data are old. For example, in a report on employment projections for the 2008-2018 period, the title could read “Employment Outlook to 2018”, avoiding the reference base year of 2008 (which seems outdated).
Some of the data may appear to be unreliable, especially the online advertised job data, which comes from HireNet. This is data that are input by WDD staff, registered employers, or spidered jobs found by Geosol’s staff. It adds value to the traditional LMI information included in HIWI, but is not statistically valid. In the past, the real-time data did not have any respect by the LMI community, but when the recession hit and users found that traditional LMI data did not reflect what was happening in the down economy, the reputation of real-time data improved. Although it should be taken with a grain of salt, and should not stand alone, it can be a valuable supple-ment to the traditional LMI data. However, on HIWI it was found to be out dated. Job orders are posted by employers and, if they are not closed they continue to appear in the data reports. Some data anomalies were found in the advertised jobs data reports on HIWI, which are the same in HireNet, but because they appeared in the HIWI reports users perceived it to be HIWI data. This is why more collaboration between HIWI and HireNet staff is beneficial. The integrity of both websites are at stake and both stand to benefit from the other.

Web
Usa
bilit
y As
sess
men
t of H
awai
i’s L
abor
Mar
ket I
nfor
mat
ion
Del
iver
y Sy
stem
15
HireNet HawaiiHireNet Hawaii is a comprehensive workforce development website, providing services for individuals, employers, training providers, workforce staff, and one-stop partners. Like HIWI, it was developed by Geosol and is based on their Virtual OneStop system. The system was launched in 2006 and is maintained by the DLIR’s Workforce Development Division.
The HireNet home page (Figure 7) is essentially a portal page and prominently features the user registration box at the very top, followed by a handful of links: Find a Candidate, Find a Job, and UI Claimants. There are five modules to select from – Employers, Jobseekers, Veteran Services, Youth Services, and Hawaii Workforce Alliance.
Figure 7. HireNet Hawaii home page
Web
Usa
bilit
y As
sess
men
t of H
awai
i’s L
abor
Mar
ket I
nfor
mat
ion
Del
iver
y Sy
stem
16
Solutions for Employers
The first module, for Employers, presents five choices: post a job, find a candidate, labor market information, education and training, and SEE Hawaii Work. The system was designed with the understanding that employers are key customers in the workforce system, and so they can post a job order online, search resumes for quali-fied applicants, access industry statistics, among other resources.
Employers can advertise their job openings using standard job description tem-plates and are able to link to the latest labor market information to ensure their jobs offer competitive salaries.
The online recruiting process has advanced solutions including resume search tools, automated correspondence, and applicant tracking. It is touted as a focused recruit-ing tool for employers to find suitable candidates, not just a referral system.
Solutions for Jobseekers
The second module helps jobseekers find jobs, create resumes, supply career and labor market information, and locate suitable education and training. The benefit to jobseekers using HireNet is that they can access the services 24 hours a day, 7 days a week from any location with Internet connection, eliminating time waiting in line.
“Database Intelligence” techniques are used to allow rapid job searches based on comprehensive criteria. The website aggregates job postings daily from the largest job boards to the most obscure corporate website, including local newspapers, re-cruiters, hospitals, and government sites. The system is capable of searching beyond a simple keyword, permitting multiple search criteria including occupation, indus-try, skills, salary, employer name, and more. Jobs are coded using O*NET occupa-tions and NAICS industries classifications and even specialties such as “green jobs”.
The resume builder helps jobseekers gather essential background information, arrange skills, detail employment history, list education, and step-by-step build a professional-looking resume.
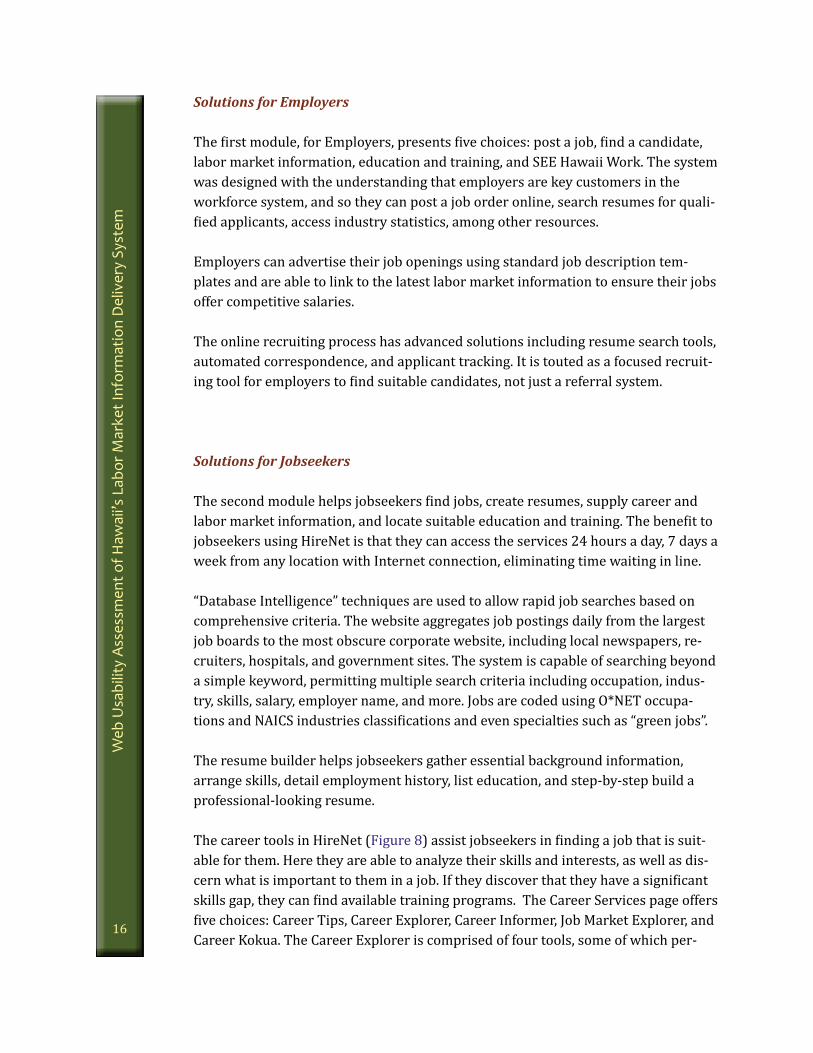
The career tools in HireNet (Figure 8) assist jobseekers in finding a job that is suit-able for them. Here they are able to analyze their skills and interests, as well as dis-cern what is important to them in a job. If they discover that they have a significant skills gap, they can find available training programs. The Career Services page offers five choices: Career Tips, Career Explorer, Career Informer, Job Market Explorer, and Career Kokua. The Career Explorer is comprised of four tools, some of which per-
Web
Usa
bilit
y As
sess
men
t of H
awai
i’s L
abor
Mar
ket I
nfor
mat
ion
Del
iver
y Sy
stem
17
Figure 8. HireNet career services for individuals
form the same function as the career tools in the Career Kokua website. There are tools to match your skills, interests and work values, and your current occupation to various occupations, and the new career ladder that shows users how other people in the same job transitioned to other careers or advanced.
Labor market information in any local area, occupation, or industry can help the individual effectively direct their search, resulting in a higher success rate. This is discussed further in the next section.
Exploring education and training providers and programs is useful when there is a skills gap to fill or simply to prepare an individual for a new career. The Education Services presented in this module include Training Providers and Schools, Training and Education Programs, and Education Program Completers – all of which come from the Workforce Information Database (WID) that resides with HIWI. Other ser-vices such as Hawaii Programs of Study and Training and Hawaii Schools are links to the Career Kokua website.
Labor Market Information
HireNet provides links to current and local labor market data in both the Employers and Jobseekers modules. The Labor Market Services (Figure 9) available are Labor

Web
Usa
bilit
y As
sess
men
t of H
awai
i’s L
abor
Mar
ket I
nfor
mat
ion
Del
iver
y Sy
stem
18
Figure 9. HireNet labor market services
Market Facts, Area Profile, Industry Profile, and Occupational Profile. The tools in this module are the same as on HIWI and the information that is presented are fundamentally the same. The number of tools available are fewer than what HIWI offers, probably, to make it easier for the target user groups to handle. All the user needs to decide is whether they are interested in a county, an industry, or a job and the tool will pull together all pertinent information into one comprehensive report with tables and the option for graphs and maps. The reports generated in this mod-ule pull data from both the WID and the real-time job bank database.
Job Spidering
The HireNet system prides itself on its use of inherent job spidering technology. This process happens every night, as Geosol staff manually search through more than 10,000 websites to determine which sites and sources should be spidered. Staff create robots that spider and collect the job information from the targeted web-sites. These websites include private job boards, state job boards, hospitals, military branch sites, government sites, recruiter sites, non-profits, corporate websites, newspapers, volunteer sites, and Chambers of Commerce. The spidering is supple-mented by direct imports of jobs from sites like Monster and Career Builder.

Web
Usa
bilit
y As
sess
men
t of H
awai
i’s L
abor
Mar
ket I
nfor
mat
ion
Del
iver
y Sy
stem
19
Hawaii Green Jobs Initiative PortalThe Hawaii Green Jobs Initiative website is a portal also developed by Geosol for the Hawaii State Department of Labor and Industrial Relations’ Research and Statistics Office. Using federal American Recovery and Reinvestment Act (ARRA) funding re-ceived in December 2009, the Green Jobs Initiative launched a web portal to further its efforts in growing Hawaii’s green economy.
The green portal is a brand new site that went live on May 5, 2011 and is still evolv-ing as this report is being written. After the initial launch, there was the need to add more content, modify the tab layout, and improve the filtering of “green” content. Because the portal sits directly on top of the HireNet Hawaii website, it accesses the advertised job database as well as the WID database.
The welcome message on the “green portal” home page (Figure 10) states the pur-pose of the website which is to feature current green job openings in Hawaii, as well as information on green training programs and providers and Hawaii’s green labor market. The accompanying graphic rotates green-related images and can also be used for announcements and to feature new content.
Figure 10. Hawaii Green Jobs Initiative Portal
Web
Usa
bilit
y As
sess
men
t of H
awai
i’s L
abor
Mar
ket I
nfor
mat
ion
Del
iver
y Sy
stem
20
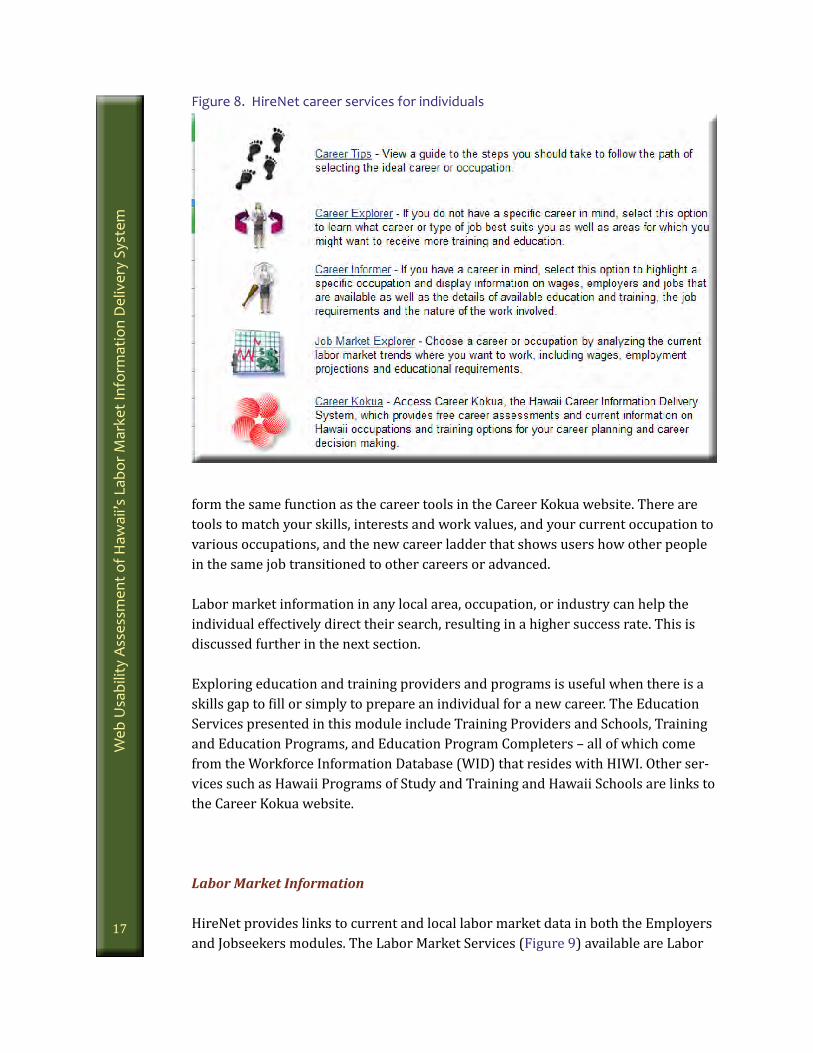
Search for Green Jobs
The main part of the website allows users to do a search for green jobs, based on a keyword and specified radius surrounding a zipcode. The list of jobs (Figure 11) that are found based on the user’s search criteria are all flagged as being a “green job”. These jobs are filtered using Hawaii’s definition of a green job, and proper des-ignation of green jobs are dependent on the employer’s determination at the time of the listing of the job opening on HireNet and also on WDD staff monitoring of the job database. Users are able to apply for these jobs the same way that users apply for jobs in HireNet.
Figure 11. Green Job Search results for Engineer
Web
Usa
bilit
y As
sess
men
t of H
awai
i’s L
abor
Mar
ket I
nfor
mat
ion
Del
iver
y Sy
stem
21
Data Dashboard
Area Numbers and Trends is a link to the HireNet Area Profile and includes all the data available in the database that pertain to an area such as the State or any of the four counties. The report includes “green” online advertised jobs by area and in-cludes a list of top employers offering green jobs. It displays non-green information such as the minimum education or work experience level required for job openings, including non-green jobs. Other non-green data from traditional LMI sources also appear in the summary reports.
The Industry Trends links to the HireNet Industry Profile. The list of industries deemed to be green based on results from the green jobs survey are available for selection. The report focuses on the specified green industry within an area and displays information such as green job openings, employers, wages, projections, average employment, and occupational employment distribution.
Similarly, the Occupational Profiles links to HireNet’s Occupational Profile which displays a list of green job titles. Some of the data appearing in this report are online advertised jobs, jobs in related occupations, employers with job openings, wages, projections, industry distribution, and related occupations.
Green-Related Links
The green tab bar situated across the middle of the home page consists of various links:
• ‘Green Jobs Hawaii’ is a brief explanation of the purpose of the Hawaii Green Jobs Initiative and some background information.
• The ‘Publications’ tab includes the 74-page publication “Hawaii’s Green Workforce: A Baseline Assessment” along with other reports produced by the Green Jobs Initiative as part of the grant requirements such as industry profiles, skills gap analysis, and a directory of green employers.
• ‘Green Videos’ lists six short videos on topics such as “What are green jobs?”, renewable energy, buildings and construction, transportation, production, and conservation and education. Currently, these are mainland-produced videos that do not reflect the local culture, but in the future there will be lo-cally produced ones featuring green workers in Hawaii. There are also televi-sion show videos produced by Hawaii News Now, a local television station.

Web
Usa
bilit
y As
sess
men
t of H
awai
i’s L
abor
Mar
ket I
nfor
mat
ion
Del
iver
y Sy
stem
22
• ‘Feedback’ is a user survey utilizing Survey Monkey for customers to provide information on their experience with the portal. Questions include whether a user found what they were looking for and how they would rate the con-tent, navigation, overall look, and usefullness of the portal. Users can provide suggestions for improvement and elect to subscribe to an email list.
• ‘Contact Us’ provides various ways to reach the Green Jobs Initiative team.
Tools and Resources
Under the ‘Jobseekers’ heading, users can search for jobs or learn about green ca-reers. The first one is a link to HireNet’s job search and the latter is a list of typically green occupations accompanied by information on work activities, skills, working conditions, wages, employment, outlook, preparation, hiring practices, licensing/certification requirements, and advancement opportunities.
The ‘Employers’ section provide links to two HireNet tools: Enter Job Orders and Search for Workers. The newest link for ‘Training for your Employees” goes to SESP Hawaii’s website, which offers green jobs training through the State Energy Sector Partnership and Job Training Program
‘Green Training’ has a section for programs and another for providers, and both of these link to the same website, Kumu A’o, which is Career Kokua’s Consumer Report Card System. This is where Hawaii’s designated Workforce Information Act (WIA) Eligible Training Provider List resides. To be more effective, the links should be more targeted to a specific page and not just land at the home page of Kumu A’o. The new link to SESP Hawaii’s website, offering green jobs training through the State Energy Sector Partnership and Job Training Program, appears a second time.
The ‘Resources’ section includes various links: Green Definitions, Partners, and About HireNet Hawaii and other DLIR web resources. The first item is a detailed description of what makes a job green. The Partners link provides the website of partners and the last item has links to the HireNet, HIWI, Research and Statistics Of-fice, Career Kokua, and Kumu A’o websites.
Web
Usa
bilit
y As
sess
men
t of H
awai
i’s L
abor
Mar
ket I
nfor
mat
ion
Del
iver
y Sy
stem
23
Career Kokua
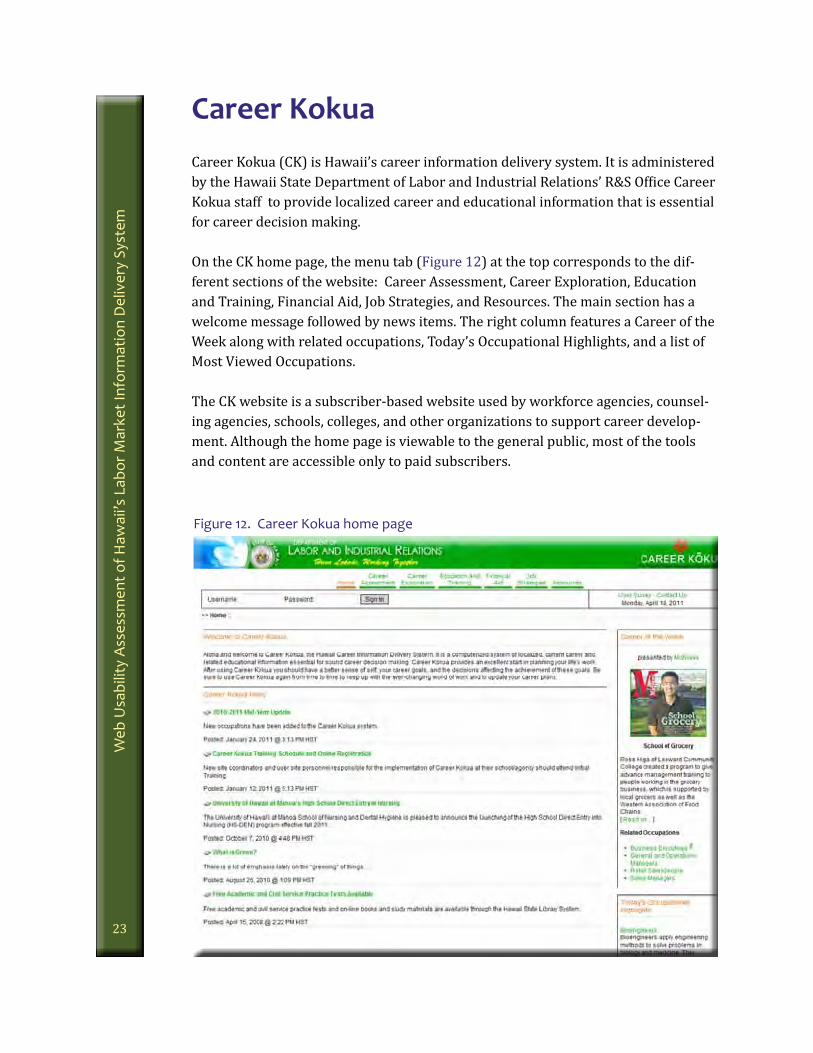
Figure 12. Career Kokua home page
Career Kokua (CK) is Hawaii’s career information delivery system. It is administered by the Hawaii State Department of Labor and Industrial Relations’ R&S Office Career Kokua staff to provide localized career and educational information that is essential for career decision making.
On the CK home page, the menu tab (Figure 12) at the top corresponds to the dif-ferent sections of the website: Career Assessment, Career Exploration, Education and Training, Financial Aid, Job Strategies, and Resources. The main section has a welcome message followed by news items. The right column features a Career of the Week along with related occupations, Today’s Occupational Highlights, and a list of Most Viewed Occupations.
The CK website is a subscriber-based website used by workforce agencies, counsel-ing agencies, schools, colleges, and other organizations to support career develop-ment. Although the home page is viewable to the general public, most of the tools and content are accessible only to paid subscribers.

Web
Usa
bilit
y As
sess
men
t of H
awai
i’s L
abor
Mar
ket I
nfor
mat
ion
Del
iver
y Sy
stem
24
Career Assessment Tools
Career assessments help users find occupations that match their desired criteria. This part of the website provides users practice in decision making by demonstrat-ing the consequences of their choices regarding work. Changing the selections gives users a different list of jobs and options to explore.
The CK website has a variety of career assessment tools: ‘Holland’ matches person-ality types to occupations; ‘Skills’ identifies occupations that match skills; ‘O*NET Interest Profiler’ matches interests to jobs; and the ‘O*NET Work Importance Loca-tor’ matches work values to jobs.
As mentioned earlier in this report, the HireNet Hawaii website has a few of these same tools to prepare the jobseeker for their job search.
Career Exploration Information
Career information is essential when making a sound career decision and the CK website provides is the only source of current Hawaii career information. In the November 2010 – March 2011 period, the occupations that registered the most hits on the CK website were: chefs, fast food cooks, accountants, pharmacists, nursing assistance, pediatricians, psychologists, actors, architects, and lawyers. Available information on occupations cover working conditions, physical demands, skills, high school courses, interests, wages, outlook, licensing/certification requirements, prep-aration needed, hiring practices, advancement opportunities, related occupations, educational programs, career pathways, and more. Industry information includes the services and products provided, the occupations they employ, the outlook, and other employment data.
Education and Training Data
Gathering information through a mail survey, CK is able to provide a comprehensive list of education and training providers, along with the programs they offer. The website describes licensed and accredited public and private colleges and universi-ties, community colleges, and private vocational schools and includes information on tuition, enrollment, admission requirements, housing, financial aid, and student ser-vices. CK users hit on the University of Hawaii Manoa Campus with great frequency during the November 2010 – March 2011 period. Descriptions of the program offer-ings at each institution include program length, related occupations and programs,

Web
Usa
bilit
y As
sess
men
t of H
awai
i’s L
abor
Mar
ket I
nfor
mat
ion
Del
iver
y Sy
stem
25
and specific degree and certificates offered. The most popular programs that users were interested in were accounting and nursing.
Transition to New Student Portal
A new broad-based college access system, My Future Hawaii, being developed by ConnectEDU will be launched in the coming months. This student portal will unite the efforts of the Hawaii P-20 Partnership for Education, Hawaii State Department of Labor and Industrial Relations’s Workforce Development Council, Department of Business, Economic Development, and Tourism, Department of Education, and the University of Hawaii. The objective for the creation of this website is to help all students transition from high school to college and careers with a specific focus on tailored strategies to reach the underserved populations. The approach will be to integrate college planning, application, and financial aid functions into a centralized online system, combined with training and support, which should ultimately result in increasing the number of students not merely attending college, but finishing the program and earning a degree.
The inclusion of student data such as school, courses taken, grade level, and test scores is a critical element in customizing each user’s experience. Each student will be able to access their academic records, do career exploration, explore colleges, fill out applications, and research financial aid options. To engage users to fully partici-pate in the system the website uses elements of gaming technology.
The CK website will be fully integrated into this new student portal. All of the lo-cal data contained in CK will be available in the new website. The portal will either use the national career assessment tools, possibly tailored to the local occupations, or the existing Career Kokua assessment tools. Unlike the current CK website, the new portal will be “free” and has been funded for two years. Beyond that, funding is uncertain and in the event that the portal cannot continue, the CK website may have to be brought back online.

Web
Usa
bilit
y As
sess
men
t of H
awai
i’s L
abor
Mar
ket I
nfor
mat
ion
Del
iver
y Sy
stem
26
Local Employment DynamicsThe Research and Statistics Office, in partnership with the U.S. Census Bureau, pro-vides expanded labor market data for the State and counties through the Local Em-ployment Dynamics (LED) program. A set of analytical tools are available free to the public on the LED website. This data set provides unprecedented details about jobs, workers, industries, and local economies. It uses administrative records on workers and employers and integrates it with censuses, surveys, and other administrative records to generate valid data for local areas that were not available before. This partnership produced three tools: QWI Online, On-the-Map, and Industry Focus.
QWI Online
The Quarterly Workforce Indicators (QWI), the flagship product of the LED Partner-ship, provides information on employment, hiring, job creation and destruction, and earnings by area, age group, gender, and industry. The user is able to select a time
Figure 13. LED QWI Online

Web
Usa
bilit
y As
sess
men
t of H
awai
i’s L
abor
Mar
ket I
nfor
mat
ion
Del
iver
y Sy
stem
27
Figure 14. LED On-the-Map
period, gender, age group, county, and industry (Figure 13) and view data for eight indicators based on that criteria: total employment, net job flows, job creation, new hires, separations, turnover, average monthly earnings, and average new hire earn-ings. The data are updated every quarter and currently, federal and state govern-ment are not included in the data set.
On-the-Map
The most visually exciting tool is On-the-Map (OTM), a web-based mapping and re-porting application that shows where workers live and where they work (Figure 14). The easy-to-use interface allows users to create, view, print, and download maps, profiles, and data for workforce related topics. New to the tool is race, ethnicity, and educational attainment data, which is not currently available in QWI Online and Industry Focus. The following are different types of analyses available and a sample question that can be answered by it:
• Area Profile – What are the distribution and characteristics of workers em-ployed in a city?
Web
Usa
bilit
y As
sess
men
t of H
awai
i’s L
abor
Mar
ket I
nfor
mat
ion
Del
iver
y Sy
stem
28
• Area Comparison – What are the distribution and characteristics of workers employed in a city by census tracts?
• Distance/Direction – From what distances and directions do a city’s workers commute?
• Destination – What county subdivisions do a city’s workers commute from?
• Inflow/Outflow – What are the characteristics of workers who commute in, out, and within a city?
• Paired Area – How many workers employed in a city live in another city and what are their characteristics?
Industry Focus
The Industry Focus tool determines the top industries in a local area based on criteria selected by the user: age group, gender, industry. The top industries can be ranked by employment, new hires, job change, or earnings.
Application of tools
LED data are a useful way to supplement traditional labor market information by providing demographic breakouts and commuting patterns.
On-the-Map can be used to answer questions such as:
• Where do young workers live who work in a specific geographic area?
• Where do workers living in a particular neighborhood go to work?
• How do specific employment areas compare in terms of worker origin pat-terns, worker ages, monthly earnings, and industry-sector employment?
• What percentage of high-wage workers live and work within a city, versus those who commute to a nearby city?
• How many potential customers/workers live or work near a proposed site location?

Web
Usa
bilit
y As
sess
men
t of H
awai
i’s L
abor
Mar
ket I
nfor
mat
ion
Del
iver
y Sy
stem
29
• How many workers that earn more than a certain amount per month live along a transit corridor and work downtown or in some other area along the same corridor?
QWI Online can address the following issues:
• Is employment in a particular industry declining and should we focus train-ing efforts on other industries?
• Which industries are most at risk of losing older workers?
• Are blue-collar industries such as construction seeing an increase in female workers?
• Are any industries still hiring workers in high-wage jobs?
• Which industries hire teenagers in the summer and do they pay high wages?
• Following the recession, are they hiring in construction yet?
The LED tools are available as links on the HIWI Data and Publications page. They are being “skinned” so that it looks as if they are in the HIWI website but they are actually using the tools on the LED website. However, it is safe to say that they are probably being underutilized. Users may not know about the data set and may need some instruction on how to use OTM. Geosol has also skinned the LED QWI Onine tool for the HIWI website under the Historical Data section of the left navigational menu. To raise awareness and usage of the LED data, it needs to be incorporated into more reports and data products that are published on HIWI. When state and federal government is included, then it will have more complete coverage of the workforce and can then be more easily integrated into the traditional labor market information products. There are no occupational breakouts but perhaps in the future there will be a way to accomplish this.

Web
Usa
bilit
y As
sess
men
t of H
awai
i’s L
abor
Mar
ket I
nfor
mat
ion
Del
iver
y Sy
stem
30
Economic Modeling Specialists, IncEconomic Modeling Specialists Inc. (EMSI), originally established as CCBenefits, provides labor market data and economic analysis through web-based tools and cus-tom reports. These tools help users understand various facets of employment and economic trends – industries, occupations, demographics, economic impacts, as well as things like job skills, job compatibility, and educational attainment at any level of geographic detail.
EMSI targets four main user groups – education professionals, workforce profession-als, economic developers, and businesses.
EMSI Database
The EMSI database utilizes data compiled by nearly 90 federal, state and private sources. This includes data from the following agencies: U.S. Department of Com-merce, U.S. Department of Labor, Employment and Training Administration (ETA), U.S. Department of Education National Center for Education Statistics, U.S. Depart-ment of Health and Human Services (National Center for Health Statistics), U.S. Postal Service, Internal Revenue Service, U.S. Railroad Retirement Board, State and sub-state industry projections produced by all 50 states, Nielsen Claritas Business Facts, and Indeed.com job-posting search engine. The database is updated four times a year.
Industry data is available for 2-6 digit NAICS industry codes and includes annual data from 2001 to 2020. Unemployment numbers can be generated by 2-digit NAICS codes. Users also have access to occupational data by detailed SOC codes, which also ranges from 2001 to 2020, and unemployment data by 2-digit SOC codes. Ten year projections are available for both industry and occupational data. Demographic data such as population by age, race, gender, and educational attainment can be gener-ated, too.
EMSI’s “Complete Employment” dataset includes the self-employed (proprietors and partnerships), agricultural workers, and others not captured by state data sources that contain only covered industry employment. EMSI also compiles another ver-sion of covered industry employment data referred to as “EMSI Covered Employ-ment.” This is based on the Quarterly Census of Employment and Wages (QCEW) produced by the Bureau of Labor statistics. Non-covered employment refers to all other paid jobs that are not in the Unemployment Insurance universe or railroad jobs. Volunteers and unpaid family workers are not included in any EMSI dataset.

Web
Usa
bilit
y As
sess
men
t of H
awai
i’s L
abor
Mar
ket I
nfor
mat
ion
Del
iver
y Sy
stem
31
EMSI Analyst tool
Analyst is a subscription-based tool (Figure 15) that generates data on the local labor market, demographics, educational attainment, and performs analysis by geo-graphic area (county, MSA, zip code, state, or a customized region). Each subscrip-tion receives a login for up to 10 people.
This tool consists of six modules - Workflows, Economic Forecaster, Economic Impact, Career Pathways, Educational Analyst, and EMSI GIS, spread across the top of the taskbar. Within each module, the data is further divided into more specific datasets that can be accessed by selecting the tabs at the top of the page. As the user clicks on each module, the color scheme also changes. Clicking on the tabs pro-vides more specific report options. (egs. within the “Economic Forecaster” module by choosing the “Industry” tab, report options include “Highest Ranked,” “Lowest Ranked,” etc). Area data is available for state, counties, and even zip codes. Areas can be combined to create a customized area. A drop-down box at the top left corner of the toolbar lets the user easily select the area to be analyzed. This can be changed at anytime without leaving the current task being performed. Users must choose between two datasets - Covered Employment or Complete Employment. While navigating through the website and generating reports, the taskbar representing the particular module as well as the area and the tabs that provide the different options are always present, therefore making it easier for the user to know exactly where they are within the website.
Figure 15. EMSI Analyst Tool
Web
Usa
bilit
y As
sess
men
t of H
awai
i’s L
abor
Mar
ket I
nfor
mat
ion
Del
iver
y Sy
stem
32
Comparing the 2008-2018 Hawaii projections data developed by the State of Hawaii, Research and Statistics Office to the same dataset utilized in EMSI revealed some dif-ferences. Using “EMSI Covered Employment,” the difference in the base year totals between the two datasets was a little over 1 percent. The projected values differed by about 6 percent. The Research and Statistics numbers posted a gain of 7.1 percent, while EMSI projected an increase of 1 percent. In both instances EMSI numbers were lower. However, when using the “EMSI Complete Employment” dataset, EMSI’s numbers were significantly higher, the base year data was about 25 percent higher and the projected year was 22 percent higher than the Research and Statistics Office figures.
Workflows
This is a newly created module that lets EMSI build reports that incorporate data from multiple modules. If there is a task performed regularly the user can perform that task in this area. The user needs to contact EMSI to set up this process.
Economic Forecaster
Users can examine industry, occupation, and demographic trends to assist in strate-gic planning. Within this module, the user has the option to select from the follow-ing tabs: Industry, Occupation, Demographics, and Economy Overview. The data-base contains annual data from 2001 to 2020 for any area (zip code, county, MSA, or state). Both the base and projected years are customizable according to the needs of the user. All years of data can be displayed on the industry and occupation reports. The most recent update occurred in the first quarter of 2011 so the most current base year is 2010.
Users can click on the “Industry” and “Occupation” tabs to access industry and oc-cupational data (including job counts, projections, earnings, unemployment, and staffing patterns) and run reports. Jobs by Industry and Jobs by Occupation reports can be generated to the greatest level of detail. This means 2 to 6 digit level NAICS and 2 to 5 digit level SOC codes. Users can view all industry and occupation data for the selected area or focus on selected subsets. Other reports generated here include the highest and lowest ranked, unemployment rates, staffing patterns and rank clus-ters (industry only). In addition to selecting the time frame, users have the option to display wages, location quotient, shift share, and for some reports the user can compare the base area with up to nine additional areas.
Demographic information (population by age, race/ethnicity, and gender) showing growth rates and cohort percentages are also available. Reports can be filtered by

Web
Usa
bilit
y As
sess
men
t of H
awai
i’s L
abor
Mar
ket I
nfor
mat
ion
Del
iver
y Sy
stem
33
these categories for different time frames. Information on national location quo-tients is also one of the selections.
Economic Impact
This module provides a platform on which to gauge the local economy by examining various economic factors and analyzing the impact on the job market due to chang-ing conditions in one or more industries. Scenarios can be run for a specified area based on a selected industry or industry cluster. The module allows modifications to jobs, earnings, or sales data. Results show the effects on jobs and industries impact-ed. The Gap Analysis report displays the dollar amounts an industry purchases from other industries, and the percent of the purchases that are satisfied from inside and outside of the area. This tool also provides a list of suggested new or existing indus-tries to expand to meet the needs of a particular cluster. Economic indicators affect-ing the workforce such as migration, demographics, and the educational attainment of the population for a particular year can also be examined.
Career Pathways
This tool utilizes the O*net database to assess the comparability between occupa-tions and to provide employment options for workers transitioning into and out of occupations based on the skill level possessed by the individual. Within this module, these tasks are accomplished through three options – Occupation Analysis, Transi-tion Workers, and Regional Overview.
Users can select occupations to view their skill requirements, compare the skills be-tween two occupations, and to locate educational programs for each occupation. The reports generated provide knowledge, skills, and abilities ranked by O*Net scores, wages, current job listings from indeed.com, education level, and training providers based on the Integrated Postsecondary Education Data System (IPEDS).
Reports originated in the “Transition Workers” tab provide lists of industries or occupations that area workers could feasibly either transition into, if the industry/occupation is growing, or transfer out of if the industry/occupation is declining. The occupations are ranked according to a compatibility index developed by EMSI to determine the ease of transition. Users can also explore several occupations by as-sessing wages, competency gaps, viewing current job listings, and locating available training providers.
Web
Usa
bilit
y As
sess
men
t of H
awai
i’s L
abor
Mar
ket I
nfor
mat
ion
Del
iver
y Sy
stem
34
The “Regional Overview” focuses on competency (skills, knowledge, abilities) re-ports detailing individual or group competencies, those embedded in the workforce and the region, and those required by a given industry. The reports developed are based on the competencies selected for the chosen time frame.
Educational Analyst
This module provides information on educational attainment and career cluster data which can be utilized by workforce, education, and training professionals to improve planning for the workforce needs of the area. This module consists of four tabs – Programs, Peer Comparison, Career Clusters, and Educational Capital.
The “Programs” option allows the user to view completions by programs for an institution and examine the occupational breakdown, change in occupation and/or completions by education level. Users can set the time frame, and can choose the programs by base institution.
“Peer Comparison” uses the Integrated Postsecondary Education Data System (IPEDS) to compile reports relating to students, institutional finances, institutions’ faculty and staff, and to compare a base institution to other peer institutions. In addition to selecting the year, users can select two institution for comparison pur-poses, and can choose different parameters such as tuition, financial aid, retention rates, SAT/ACT scores, applicant data, and asset information.
The “Career Clusters” option provides data for all career clusters in an area and can also be viewed by individual clusters. Data generated for the individual reports includes a summary by education level and also highlights top occupations by size, growth, and earnings. Another report ranks career clusters by growth and location quotients.
“Educational Capital” generates educational attainment data by ethnicity, gender, and educational level and can be filtered by a specific demographic group.
EMSI GIS (Geographic Information System)
Maps of nearly all the data in the other modules can be generated, making this tool useful for creating reports or presentations.

Web
Usa
bilit
y As
sess
men
t of H
awai
i’s L
abor
Mar
ket I
nfor
mat
ion
Del
iver
y Sy
stem
35
Application of tool
This tool provides a wide range of labor market data for a variety of users. The data does not focus on one type of dataset but encompasses an expansive scope of sourc-es that cover information on employment, education, economic information, and demographics. Each module offers various options that users can choose to gener-ate reports.
Of particular interest is the industry and occupational projections data generated through this site. Employment data can be viewed by industries and occupations for every year from 2001 to 2020 at the greatest level of detail. Not only is the data available at the state and county level, but also by zip code, and can be customized by combining areas. EMSI generates projections for every year up to 10 years be-yond the base year and updates it quarterly, whereas the Research and Statistics Of-fice’s Labor Market Research section is currently unable to produce projections for every year. Long-term projections are generated biennially for the even numbered years, while short-term projections are done annually and for a reference quarter. The projections generated through this EMSI can supplement and serve as a refer-ence for the short and long term projections produced in-house.
Another area that may be of value is the “Career Pathways” module. In addition to employment, wages, education, and competency (knowledge, skills, and abilities) information, EMSI calculates a compatibility index to assess the ease of transition-ing into industries or occupations. The information generated by this tool is a data source that can be utilized to assist in specialized labor market research studies.

Web
Usa
bilit
y As
sess
men
t of H
awai
i’s L
abor
Mar
ket I
nfor
mat
ion
Del
iver
y Sy
stem
36
Transferable Occupational Relationship Quotient
Transferable Occupational Relationship Quotient (TORQ) is a web-based tool pro-viding users with labor market information for career exploration and strategic planning purposes. Some examples include: workforce professionals working with jobseekers to help them match their skills to employment opportunities, support-ing re-employment transitioning efforts for mass layoffs by performing a skills gaps analysis, and helping to analyze the validity of business expansion or relocation. Primary users of TORQ are workforce professionals, career counselors, jobseekers, and businesses.
TORQ’s home page (Figure 16) is divided into 4 main sections:
1) The Project Launcher is where the primary work is performed and contains two blue buttons “Create New Project” and “Open Project.”
2) TORQ Tutorials familiarizes the user with TORQ;
3) TORQ In Action contains links to articles describing the usage of TORQ by other states.
Figure 16. TORQ tool

Web
Usa
bilit
y As
sess
men
t of H
awai
i’s L
abor
Mar
ket I
nfor
mat
ion
Del
iver
y Sy
stem
37
TORQ Data
In order to assess the difficulty of transitioning from one occupation to another, TORQ developed what they refer to as the “Grand TORQ Score.” The score is based on a weighted average of the O*Net attribute categories of abilities, skills and knowl-edge and a proprietary algorithm developed by TORQ. Scores range from 0-100, with the higher the number translating to an easier transition from the original occupation into another occupation. Individual scores are also available for knowl-edge, skills and abilities.
Using TORQ
TORQ’s step by step procedure provides a logical process for users to follow. Users are guided through each step and are also able to go back to a previous step at any time to make changes to their selections. Every process results in a report gener-ated within the system located in the report binder. This report is broken down by subject matter. Instead of one long report, the analyst can view each subject matter individually and opt whether or not to include each subject in the final downloaded version. Every project is automatically saved and can be retrieved so the user can review what was done and modify the final report.
Project Launcher
Analysts enter this section to either begin a new project or to open an existing proj-ect. Each project requires the user to go through a predetermined sequence of steps to generate the final report. Data is available for the state and counties. Both the area and occupation can be changed at anytime while viewing an occupation sum-mary. Information provided can be downloaded in Word or Excel through the Report Binder that is available throughout the system. Users are required to assign a name to their project and then can select from four different projects.
“Single Occupation View” allows the user to browse through one occupation at a time on one screen. The report produced contains the following data categories: Occupation Overview - which summarizes tasks performed, Work Experience - cat-egorized by length of experience at the national level, Education – a distribution of education levels according to O*Net and a listing of education and training providers based on the IPEDS database, compensation (not currently available), Employment Data –projected data and national staffing patterns, Current Job Postings – from SimplyHired Internet job board, and TORQ Transitions – that lists the top 10 occupa-

Web
Usa
bilit
y As
sess
men
t of H
awai
i’s L
abor
Mar
ket I
nfor
mat
ion
Del
iver
y Sy
stem
38
tions to transition into and the top 10 occupations to transition from (labor pool) and into the selected occupation, based on the Grand TORQ score. This same report format is generated for all project choices except for the Personal Employment Plan-ner. Users can then download and print the information generated from all projects by clicking on the “Download Report” located in the Report Binder.
“Reemployment Analysis” is a 3-step process to help determine the best path to transition from one occupation into another. This can be based on a single occupa-tion or multiple occupations. The first step is to select one or more occupations to analyze. Users can either type in the occupation title or use filters to search for the occupation. Step 2 involves selecting occupations to transition into based on the occupations selected in Step 1. TORQ provides a list of occupations to select from sorted by their Grand TORQ score meaning that the higher TORQ score should be an easier transition from the original occupation to the targeted occupation. Users can filter the list displayed by changing the wage, employment, or openings data and can also view the individual abilities, skills and knowledge TORQ score in order to deter-mine the inclusion of an occupation. Step 3 generates the downloadable report.
The “Economic Development Analysis” option is also a 3-step process that evalu-ates the current and future labor market in terms of workforce development and attracting employers to an area. This project involves first identifying targeted oc-cupations that will require more workers or occupations targeted for future growth such as “green” jobs. Next, occupations offering the most promising sources for the targeted occupations are then selected. TORQ provides a list of occupations ranked by their TORQ score which can be filtered by wage, employment size, number of openings, or preparation requirements. The last step contains the summary in the report binder.
Job counselors can utilize “Personal Employment Planner” to help job seekers considering reemployment options. This 7-step process begins by collecting basic information about the jobseeker such as name, zip code, education, and current job. TORQ then uses this information to generate a short list of occupations for which the jobseeker is qualified. After selecting occupations from the short list, the job-seeker can view job postings, the gap analysis (identifies concerns regarding a gap in knowledge, skill or abilities), and training programs associated with their list. All of this information is then posted into either a standard or referral report.
Application of tool
Information generated in this website provides a comprehensive report on career analysis. Analysts can view information on the various aspects of an occupation

Web
Usa
bilit
y As
sess
men
t of H
awai
i’s L
abor
Mar
ket I
nfor
mat
ion
Del
iver
y Sy
stem
39
such as work experience, education, wages, projections, and job postings. Some of this information can also be found elsewhere such as O*Net Online, job listings from HireNet, projections and wage data from the Research and Statistics Office, and education providers from Career Kokua. EMSI also includes a module that performs career information analysis. The value of TORQ stems from its ability to assess the skills gaps required to transition from one occupation to another as defined by the Grand TORQ score assigned to each transition. Although the reliability of the TORQ score is unknown, this website is another source for career related analysis.

Web
Usa
bilit
y As
sess
men
t of H
awai
i’s L
abor
Mar
ket I
nfor
mat
ion
Del
iver
y Sy
stem
40
Help Wanted OnlineHelp Wanted Online (HWOL) is a web-based tool introduced by WANTED Technolo-gies in 2005, as a way for users to view and analyze online job postings “in ways no one has been able to reproduce.” This is a subscription-based tool whose primary users include jobseekers, job counselors, and recruiters.
Using HWOL
Analytics consists of 5 tabs that run across the top of the page (Figure 17): Home; Employers; Jobs; Talent; and Counts.
The home page features news articles, saved data, and also older tools users can still access such as the Hiring Demand Dashboard, and the Supply/Demand Ratios Map.
Figure 17. HWOL tool

Web
Usa
bilit
y As
sess
men
t of H
awai
i’s L
abor
Mar
ket I
nfor
mat
ion
Del
iver
y Sy
stem
41
The user first needs to set job and employer criteria. Selections for Job Criteria, include: location, functional area of the organization, occupation according to the Standard Occupational Classification, education level, salary, source of the job post-ing, job type (fulltime, part time, contract, internship), and green level. Employer Criteria are as follows: employer name, industry, and ad volume published within a specified time period. Once the user defines the criteria or edits these selections, the same criteria apply to each of the tabs. This is located on the bar on the left side of the screen and appears in each module. Editing can be done at any time in any tab. A summation of the defined criteria appears at the top of the each page so the user doesn’t need to look back to see what was chosen.
Employers Tab
By selecting the Employers tab, the user can readily view a listing of employers and the number of jobs listed by the employer. This can be sorted either alphabetically or by ad volume within the last 7, 15, 30, 90, or 120 days. Job postings displayed on Analytics are based on options selected by the user and can be edited by review-ing the hidden result options to either exclude or include more job ads. In addition to the job listings for each employer, users can also view details regarding top jobs, job location, posting sites utilized by the employer, and contact information. Daily or weekly email updates are available by clicking on “Email updates.” Data can be downloaded and will look the same as the data on the screen.
Jobs Tab
Information contained in this option looks similar to the employers’ tab except this tab provides a listing of advertised jobs. Users have the same options to review hid-den results, email and download the data. The job title, employer, and the job post-ing site appear in this tab. Clicking on the job title provides a description of the job and presents occupational data on the top locations, industries, and job boards for this occupation, while clicking on the employer name shows top job locations, oc-cupations, and job boards for the employer.
Talent Tab
This tab was developed to provide recruiters with information on the “passive candi-date” supply. Analysts can examine data regarding the current supply of workers
Web
Usa
bilit
y As
sess
men
t of H
awai
i’s L
abor
Mar
ket I
nfor
mat
ion
Del
iver
y Sy
stem
42
that meet the specified requirements, assess the competition, and find out where they work. “Wanted” derives candidate supply statistics using the Bureau of Labor Statistics’ Occupational Employment Survey data together with the site’s job post-ings over the last four years.
The “Candidate Supply Chart” starts off with a baseline figure showing the total number of candidates within the United States. The employment counts are then ad-justed according to the Location, Function, Occupation, and Industry filters selected within the search criteria. After entering the keyword, a ratio is then applied to BLS’ supply data and Wanted’s hiring demand data, thus producing the estimated num-ber of “passive’ candidates that may fit the job requirements.
A “Hiring Map” displays the location of jobs that have been filled in the past. Users can see where there is a greater concentration of hiring occurring which could indi-cate areas in which a large supply of passive candidates may exist. Details of prior employers hiring can also be viewed.
The “Currently Hiring” tab lets the user view employers currently hiring for the position specified, while the “Prior Hiring Activity” tab lists the employers that have hired workers for the job within the last four years.
Counts Tab
Numerical data is available for location, source, occupation, industry, job type and ad age based on the specified criteria within the last 7, 15, 30, 90 or 120 days.
Trends Tab
Currently under development, “Trends” is a new tab that will allow the user to analyze current and past job postings over the last four years. Statistics will show trends in total job postings, occupations, job boards, and industries.
Application of tool
The information generated through this website focuses on job listings. Each tab presents a different aspect to view the data but the focus remains on job listings. Data compiled in two of the tabs (Counts and the Trends tab that is currently being

Web
Usa
bilit
y As
sess
men
t of H
awai
i’s L
abor
Mar
ket I
nfor
mat
ion
Del
iver
y Sy
stem
43
developed) may be useful to labor market analysts in providing data on hiring de-mand. This would show the trends in job listings over the past four years that may help to identify areas with shortages by occupation and industry. However, HIWI is able to query and display similar monthly trend analysis over the previous four years by area, occupation, and industry using HireNet’s database of advertised jobs.

Web
Usa
bilit
y As
sess
men
t of H
awai
i’s L
abor
Mar
ket I
nfor
mat
ion
Del
iver
y Sy
stem
44
RecommendationsHIWI
Improvements that can be done locally
• Update the welcome message on the home page and include a slogan or tagline for marketing purposes.
• Redesign website - Organize and design layout to make it easier for users to find what they’re looking for:
1. Quick Links – include only the most popular types of content or data.
2. Add a new featured content box to highlight something that is new to the website and LMI in general. This could be rotated monthly with newly released reports, tools, or other announcements.
3. Make the Labor Market Facts page more prominent on the home page since it is a popular option with customers.
4. Data and Publications page – make two column layout with most re-quested data near the top. For each page under Data Tables, include links to related reports.
5. Review site for LMI terminology and change it so the average per-son can understand it. For example, the section for ‘Press Releases’ should be renamed to reflect actual content, i.e. Unemployment Rate Press Release.
• Update site with new and more diverse content to keep it fresh: Pro-duce more content utilizing various types of labor market data and feature something new at least once a month so that the site doesn’t become stag-nant. Because of limited LMR staff resources, look into the possibility of BLS program staff contributing content that could be posted on HIWI.
• LMI Dashboard: Create a quick way for users to get the most popular data items in chart and table format. This should not duplicate what is already in the Data Tables section of the Data and Publications page, but a condensed summary of the data set. It could use thumbnail images of charts with the name of the data set and have them link to a page with a more detailed chart and data table. If it is determined to be an effective way to give users an

Web
Usa
bilit
y As
sess
men
t of H
awai
i’s L
abor
Mar
ket I
nfor
mat
ion
Del
iver
y Sy
stem
45
indication of how frequently the data is updated, the items in the dashboard could be organized by timeframe: monthly, quarterly, annual, and biennually.
Modifications for the near-term that need minimal Geosol redesign
• Search box: In general, it is a good idea for most websites to have a search box. Some users do not like to spend too much time trying to find what they are looking for and may get frustrated and leave the site. In reality, people do not spend a lot of time on a particular website and web tracking statistics re-veal that it is true for HIWI as well. The average time spent on a visit to HIWI is about 5 to 10 minutes, depending on which report is viewed.
• Reduce duplication of tools on left navigation bar: Area Specific Data, In-dustry Specific Data, Occupation Specific Data, Comparisons can be removed from the home page. They don’t offer any unique data.
• Redirect top tab links: Have the Job seekers and Employers links stay within the HIWI site, until a user clicks on job search or candidate search functions. Only then will HireNet be launched in a new browser window.
• Design content for Analysts and Researchers page: Design this page as an LMI Home Page with content (publications, data, and tools) suitable for that user group. Content can either be organized by type of data/reports or by user group interests. If the choice is to organize by type of content then moving the Data and Publications page is an option to avoid duplication of content. However, if the decision is to organize by user group, a careful list of content must be designed for job seekers and employers.
Enhancements for the longer-term that need major Geosol redesign
• Email Subscription: Regular users of HIWI should have the option to subscribe to email alerts so that they will be informed when something new is posted to the website, such as the monthly press release or a new report. Currently, LMR does this outside of the system, but it is not an effective way to continue indefinitely. Ideally, HIWI should allow users to sign up for emails by checking off a list of items they want to be notified of. This would help towards marketing HIWI by providing users an opportunity to proac-tively elect to receive email alerts especially when new content is posted on the site.

Web
Usa
bilit
y As
sess
men
t of H
awai
i’s L
abor
Mar
ket I
nfor
mat
ion
Del
iver
y Sy
stem
46
• Data Visualization: Improve the way data are displayed graphically by introducing different kinds of charts such as tree maps and bubble graphs.
• Dynamic Tables: Provide a way to display a graph or table that will auto-matically update when new data are loaded to the website database.
• Videos: Videos are becoming standard on websites. HIWI could use a video tour of the website and how the various user groups can benefit from the content and data tools.
• Social media: Consider whether incorporating Facebook and Twitter into a marketing plan for HIWI would be feasible. This is the way to reach the younger demographic and might be the way all communication will end up in the future.
Usability issues that require Geosol system modifications
• Minimize the drill down: Using the tools, the number of clicks needed to get to the data should be reduced as much as possible. Users get frustrated and impatient when they cannot get data they need quickly. Specific instanc-es that need simplification need to be reviewed and documented.
• Breadcrumbs: Currently, once the drill down to data is complete, the user may have gone through numerous clicks and has no indication of how they got there. Example: Home > Historic Data Analysis > Employment and Wage Data > Occupation Data > Occupation Wage Rates (OES) > Occupa-tional Wages. A user should know where they are in terms of the website’s hierarchy. There should be a path at the top of each page showing how to get from the home page to the current page. This will help users learn how to navigate around the website effectively. It becomes more essential as the layers of pages increase.
• Pages to bookmark: Ability to bookmark profiles as a “Favorites” without having to go through the selection process again.
• Printable web pages: Because of how the website is designed, pages are printed in a different format than what is displayed. Ideally, when users print from a website it should look the same as the web page itself.

Web
Usa
bilit
y As
sess
men
t of H
awai
i’s L
abor
Mar
ket I
nfor
mat
ion
Del
iver
y Sy
stem
47
HireNet
• Encourage a mutually beneficial relationship with WDD so that they will routinely clean up their advertised job database because HIWI analyzes their data and trends and in return we will make sure that the WID database is kept up-to-date so that HireNet users can get the most current LMI data pos-sible.
• Suggest a link from HireNet to both HIWI and the Green Portal. The trio of websites (HIWI, HireNet, and Green Portal) should all have links to each other.
• Geosol should work on synchronizing the WID database that HireNet is pull-ing LMI data from. Currently, it is a separate database that is not regularly updated. When the WID in HIWI is updated, it is dependent upon Geosol to update the WID in HireNet and this has not always been done in a timely manner. HireNet users should be able to access the most current LMI data available.
Green Portal
Overall, the green portal is off to a good start but is still a work in progress. Many improvements have been made to the intial website that was launched, but ways to make the website better and more worthwhile will continue to be explored. Hope-fully, there will be some early feedback from users to shape the evolving website. The portal will be a valuable addition to the trio of websites that Geosol created and should be a good supplement to HIWI which supplies traditional labor market information.
The filtering of green jobs is currently being monitored for quality and continous im-provements will hopefully be made to correct some anomalies. This effort requires cooperation on behalf of R&S staff, WDD staff, and Geosol.
As for the Data Dashboard, the original intent was to have a collection of thumbnail charts representing the various data sets available, with a focus on green informa-tion. Clicking on a chart image would bring up more detailed data. This may be pos-sible in the future, but may need Geosol programming to pull information from the advertised jobs database as well as the WID database. For now, it links to HireNet and uses it’s area profile, industry profile, and occupational profile by filtering green job openings and presenting traditional non-green LMI data.
Web
Usa
bilit
y As
sess
men
t of H
awai
i’s L
abor
Mar
ket I
nfor
mat
ion
Del
iver
y Sy
stem
48
Tools: LED, EMSI, TORQ, HWOL
The LED tools are an integral part of the the labor market information delivery system. To increase awareness of the LED data, it would help to make the data more visible. Right now it is merely an external link that stands alone. While the WID database has a data file to house QWI data, it is currently not being used in Geosol’s websites. If Geosol were to redesign the existing reports such as Area and Industry Profiles and have them pull in LED information from the WID that would be a step in the right direction. However, the WID doesn’t have the capacity to hold the data from OTM, just the QWI data. Another possibility to look into is to populate the QWI table in the WID and then customize a Data Cube to process the data into a useable format, using Washington State’s Excel-based model. This may not be able to go on the Internet at this time, but probably will be able to in the very near future.
The EMSI Analyst tool is a versatile instrument that offers a wide variety of data analysis options, one of which is employment projections. Because it generates projections at a more detailed level and for customizable time periods, it can supple-ment the 2- and 10-year projections that are done by the Labor Market Research section of the Research and Statistics Office.
TORQ is geared towards career analysis and most of the information is not unique in that it can be found in other websites such as HireNet, Career Kokua, and O*net. The value of TORQ is in its ability to assess the skills gap of transitioning from one occupation to another using Grand TORQ scores. Although the reliability of the information is unknown, this tool may be useful in projects where there is a need for career-related analysis.
The HWOL tool is limited in that it focuses heavily on job listings, but it may be use-ful to labor market analysts for data on hiring demand such as a historical trend, which can help identify areas with shortages by occupation or industry. This, how-ever, is similar to what HIWI can do in the historical data tool using HireNet’s adver-tised job data base.
Website Integration Issues
HIWI has a unique URL, as does HireNet Hawaii and the new Green Jobs Portal, but they are all integrated to a degree so that each website can share data from two common databases. Currently, the WID is being updated via HIWI, but HireNet and the Green Portal are drawing its LMI data from a separate WID that has to be manu-ally updated by Geosol. With this set up, HireNet and the Green Portal will not get
Web
Usa
bilit
y As
sess
men
t of H
awai
i’s L
abor
Mar
ket I
nfor
mat
ion
Del
iver
y Sy
stem
49
timely data updates that are done in HIWI. To eliminate this discrepancy, something needs to be done to change the way HireNet and the Green Portal receive updates to the WID. Once this is done, users from any of the three websites will get the latest and most current data available.
In HIWI, the top menu link to Jobseekers goes to HireNet’s Services for Individuals page. Likewise, the HIWI link for Employers goes to HireNet’s Services for Employ-ers page. At this time, the links open in a new browser window and the HireNet banner page is displayed. Ultimately, having the link to HireNet be transparent to the user would be ideal. These pages from HireNet display a list of the various tools available to the user group. The system was initially set up to work this way because of the short time frame to prepare and launch the site – there simply wasn’t enough time to develop content targeted for job seekers and employers and Geosol did not have sufficient time to design any custom modifications for the state. The direction now should be toward making the transition from HIWI to HireNet more seamless for jobseekers and employers wanting to take advantage of the recruitment services offered by HireNet.
HIWI has a hybrid integration with HireNet, in that both sites can share common databases but they both have unique identities with different URLs and header ban-ners. It’s been said that Hawaii’s Department of Labor and Industrial Relations has too many web sites (HireNet, HIWI, Career Kokua, and now the Green Portal), but it is because each meets a specific need for different audiences. Different agencies within the department were responsible for providing a website for their customers. The Research & Statistics Office’s LMR section is required to deliver LMI over the internet with HIWI, the Workforce Development Division uses HireNet for workforce development purposes, Career Kokua provides career information for their clients, and the Green Portal features information and data that is ‘green’. Each agency has to maintain their own website, market, and enhance it, based on their customers’ needs. Therefore, having a totally integrated website (merging all three into a single one) may mean that each agency would lose some control over their service and content delivery. It may be best for each agency to maintain a separate website, as long as integration of the databases makes the data delivery consistent across all three. To further improve the experience for all audiences, the agencies should work more closely together so that a common goal can be reached, which is providing the best service to all customers.
Duplication of Information
There is some duplication of content and data tools among the various websites (Figure 18). Because the data in HIWI relates to the needs of a wide range of user

Web
Usa
bilit
y As
sess
men
t of H
awai
i’s L
abor
Mar
ket I
nfor
mat
ion
Del
iver
y Sy
stem
50
Figure 18. Matrix of websites and available tools
groups, it is bound to be duplicated in the other websites. However, the data is pre-sented in different ways and can be found in different formats.
For example, HIWI has many data tools to query historical data series such as in-dustry employment. While HireNet may not have a data tool to do this, an industry profile will include industry employment for the specified industry. Therefore, the same data is available, but presented in a different way. And each will be suited for different users. While HIWI’s data tool may be useful to the researcher or analyst, HireNet’s presentation of the same data will be helpful to the jobseeker looking at a particular industry.
HIWI used to refer to the list of schools and program information from CK but in the past couple of years has relied on data from the National Center for Education Sta-tistics (NCES) via the national database, Integrated Postsecondary Education Data System (IPEDS). The data provided by NCES is not a comprehensive list of schools and programs, though it captures the larger universities and community colleges. Besides the provider and program information, HIWI also has the number of com-pleters by program. The University of Hawaii college system posts their completer data on a website and these reports are used together with the data from NCES. In the past, data from the smaller institutions were collected locally through an annual mail survey of schools. There is the option of restarting that survey if it is deter-mined that there is an urgent demand for a more comprehensive set of program

Web
Usa
bilit
y As
sess
men
t of H
awai
i’s L
abor
Mar
ket I
nfor
mat
ion
Del
iver
y Sy
stem
51
completer data, but information from CK is needed for a list of schools along with addresses and program offerings. Whether or not the completer data is expanded, it is unique to HIWI and, therefore, it is an important data set to maintain.
HIWI also has occupational and industry information, but the data is oriented more to the researcher or analyst doing statistical research. In HIWI, the data is extracted from the WID database and presented in tabular and graphical form, while the in-formation in CK is more narrative combined with bullet lists. Although there is some overlap in terms of the kind of information available, it is not a complete duplication and the presentations are altered to suit the target audiences’ needs.
The three tools – EMSI, TORQ, and HWOL – all have some overlap with the four web-sites, but if they offer different ways to present the data, they can supplement what already exists on the website.
Each site should focus on their niche and target audiences and should not try to be everything to everyone. The most effective use of this group of websites should be to complement the others and reduce duplication.
Web
Usa
bilit
y As
sess
men
t of H
awai
i’s L
abor
Mar
ket I
nfor
mat
ion
Del
iver
y Sy
stem
52
ConclusionHawaii’s labor market information delivery system consists of a trio of websites - HIWI, HireNet, and the Green Portal (four, if you include Career Kokua). Separately, they all exist for a specific purpose and each targets a slightly different audience. Together, they tailor and deliver information according to their target user groups’ needs and are integrated to some degree so that data are shared between the three.
Evaluating HIWI was a good exercise in that it brought to light many observations and opportunities for improvement, especially since the website in its present state is relatively new. To assess the usability of the system meant not just reviewing the site for functionality, but also trying to find out what users liked or did not need. An integral part of the assessment involved examining web tracking analytics that will help guide the redesign process and also aid in marketing the site. Based on results of the web statistics, HIWI will be redesigned to make it easier for users to find what they have historically looked for, both in terms of content and data tools. To keep the website fresh, new content should be added on a regular basis and some sort of data dashboard should be incorporated. Some usability issues, dealing with website navigation and ease-of-use, need to be addressed with Geosol. Then, there is the longer-term vision for enhancing the website as far as technological advances and social media are concerned.
When HIWI was looking to move away from the original Ciber-based Workforce In-former platform, it made sense to get a system developed by the same company that designed Hirenet. It would provide a more seamless, more integrated way to deliver information. The benefits are most evident when combining traditional labor mar-ket information from HIWI with real-time advertised job openings in HireNet. This sharing of data would not be possible without the system integration. The powerful spidering technology that Geosol uses to build its advertised job database is a big plus for both HIWI and HireNet. It adds value to HIWI and serves HireNet’s clients well.
A key element in obtaining the Green Portal was to satisfy the ARRA grant require-ment to distinguish between green jobs and other jobs. The website built by Geosol was designed to filter out green jobs and other information from HireNet. Green job search is a primary function of the Green Portal as is the presenting of green infor-mation and reports. Because the portal is brand new, it still needs to go through its growing pains and website design is still a work in progress.
The Career Kokua website will merge into a new student portal and become part of a joint effort to consolidate information from the Hawaii Department of Education and the University of Hawaii. This sounds like an exciting website for students tran-
Web
Usa
bilit
y As
sess
men
t of H
awai
i’s L
abor
Mar
ket I
nfor
mat
ion
Del
iver
y Sy
stem
53
sitioning from high school to college and careers - hopefully it can be funded beyond the initial two year investment.
LED tools (QWI Online, On-the-Map, and Industry Focus) should be utilized more because they add much value to the labor market information that is currently avail-able. They add a new dimension to the data with demographic breakouts and com-muting patterns. While On-the-Map offers unique residential and work place com-muting analyses, the QWI data can be meshed with the traditional labor market data.
Three tools were procured using funds from ARRA: EMSI, TORQ, and HWOL. These were found to be worthwhile tools to have and each serves a very different purpose. EMSI has a vast array of labor market information data sets that can be utilized by the Labor Market Research section in a multitude of ways, most notable being the flexibility of the employment projections data. TORQ has a more career-oriented focus and HWOL deals entirely with job listings. While there is some definite overlap with existing web sites and data, some value can be found in them and it can be used in conjunction with existing labor market information delivery.