Web Tables—Students Attending For-Profit Postsecondary
28
WEB Students Attending For- Profit Postsecondary Institutions: Demographics, Enrollment Characteristics, and 6-Year Outcome s TABLES U.S. DEPARTMENT OF EDUCATION NOVEMBER 2011 NCES 2012-173 WEB TABLES U.S. DEPARTMENT OF EDUCATION DECEMBER 2011 NCES 2012-173 Students Attending For- Profit Postsecondary Institutions: Demographics, Enrollment Characteristics, and 6-Year Outcome s This report was prepared for the National Center for Education Statistics under Contract No. ED-07-CO-0104 with MPR Associates, Inc. Mention of trade names, commercial products, or organizations does not imply endorsement by the U.S. Government. These Web Tables were authored by Sandra Staklis, Vera Bersudskaya, and Laura Horn of MPR Associates, Inc. The NCES Project Officer was Tom Weko. For questions about content or to view this report online, go to http://nces.ed.gov/pubsearch/pubsinfo.asp?pubid=2012173 . During the past decade, the for-profit sector in U.S. undergraduate education has experienced dramatic growth, of- ten outpacing that seen in the private nonprofit and public sectors. From 1998–99 to 2008–09, the number of associate’s degrees conferred by for- profit postsecondary institutions grew by 125 percent and the number of ba- chelor’s degrees by over 400 percent. In contrast, the number of associate’s and bachelor’s degrees conferred by public postsecondary institutions increased by 33 and 29 percent, re- spectively, over the same decade (Aud et al. 2011). Although for-profit postse- condary institutions enrolled about 10 percent of all undergraduates in 2007– 08 (Staklis 2010), over the last decade the proportion of students attending these institutions has increased more than the proportion attending institu- tions in other sectors (Horn and Li 2009; Wilson 2010). These Web Tables examine the demo- graphic and postsecondary enrollment characteristics of undergraduates who attended for-profit institutions in 2007–08 and present the 6-year out- comes of undergraduates who first enrolled in for-profit postsecondary in- stitutions in 2003–04. 1 Data are presented for all for-profit students and separately for students who at- tended less-than-2-year, 2-year, and 4- year institutions. To provide additional context, the tables also include compa- rable data for students in community colleges and public and private non- profit 4-year colleges and universities. The data come from two nationally representative studies: the National Postsecondary Student Aid Study (NPSAS:08), a survey of U.S. undergra- duates who were enrolled in 2007–08, and the Beginning Postsecondary Stu- dents Longitudinal Study (BPS:04/09), a survey that followed undergraduates who began postsecondary education in 2003–04 through June 2009. The first four tables present informa- tion from NPSAS:08 on the student and enrollment characteristics of under- graduates in each postsecondary institution sector in 2007–08: • Table 1 shows the estimated per- centage distribution of students enrolled in the three for-profit and other institution sectors, based on their age, sex, and race/ethnicity. • Table 2 shows the percentage distribution of undergraduates according to their demographic characteristics and the percentage who ever received a Pell Grant, by sector of first institution. • Table 3 provides information on the high school academic preparation of undergraduates who attended each postsecondary institution sector as measured by their high
Transcript of Web Tables—Students Attending For-Profit Postsecondary

WEB Students Attending For-Profit Postsecondary Institutions: Demographics, Enrollment
Characteristics, and 6-Year Outcomes
TABLES U.S. DEPARTMENT OF EDUCATION NOVEMBER 2011 NCES 2012-173
WEB TABLES U.S. DEPARTMENT OF EDUCATION DECEMBER 2011 NCES 2012-173
Students Attending For-Profit Postsecondary Institutions: Demographics, Enrollment
Characteristics, and 6-Year Outcomes
This report was prepared for the National Center for Education Statistics under Contract No. ED-07-CO-0104 with MPR Associates, Inc. Mention of trade names, commercial products, or organizations does not imply endorsement by the U.S. Government. These Web Tables were authored by Sandra Staklis, Vera Bersudskaya, and Laura Horn of MPR Associates, Inc. The NCES Project Officer was Tom Weko. For questions about content or to view this report online, go to http://nces.ed.gov/pubsearch/pubsinfo.asp?pubid=2012173.
During the past decade, the for-profit
sector in U.S. undergraduate education
has experienced dramatic growth, of-
ten outpacing that seen in the private
nonprofit and public sectors. From
1998–99 to 2008–09, the number of
associate’s degrees conferred by for-
profit postsecondary institutions grew
by 125 percent and the number of ba-
chelor’s degrees by over 400 percent.
In contrast, the number of associate’s
and bachelor’s degrees conferred by
public postsecondary institutions
increased by 33 and 29 percent, re-
spectively, over the same decade (Aud
et al. 2011). Although for-profit postse-
condary institutions enrolled about 10
percent of all undergraduates in 2007–
08 (Staklis 2010), over the last decade
the proportion of students attending
these institutions has increased more
than the proportion attending institu-
tions in other sectors (Horn and Li
2009; Wilson 2010).
These Web Tables examine the demo-
graphic and postsecondary enrollment
characteristics of undergraduates who
attended for-profit institutions in
2007–08 and present the 6-year out-
comes of undergraduates who first
enrolled in for-profit postsecondary in-
stitutions in 2003–04.1 Data are
presented for all for-profit students
and separately for students who at-
tended less-than-2-year, 2-year, and 4-
year institutions. To provide additional
context, the tables also include compa-
rable data for students in community
colleges and public and private non-
profit 4-year colleges and universities.
The data come from two nationally
representative studies: the National
Postsecondary Student Aid Study
(NPSAS:08), a survey of U.S. undergra-
duates who were enrolled in 2007–08,
and the Beginning Postsecondary Stu-
dents Longitudinal Study (BPS:04/09), a
survey that followed undergraduates
who began postsecondary education
in 2003–04 through June 2009.
The first four tables present informa-
tion from NPSAS:08 on the student and
enrollment characteristics of under-
graduates in each postsecondary
institution sector in 2007–08:
• Table 1 shows the estimated per-
centage distribution of students
enrolled in the three for-profit and
other institution sectors, based on
their age, sex, and race/ethnicity.
• Table 2 shows the percentage
distribution of undergraduates
according to their demographic
characteristics and the percentage
who ever received a Pell Grant, by
sector of first institution.
• Table 3 provides information on the
high school academic preparation
of undergraduates who attended
each postsecondary institution
sector as measured by their high
2
school completion status, high
school grade point average (GPA),
and the highest level of mathemat-
ics taken or planned in high school.
• Table 4 presents the postsecondary
enrollment characteristics of stu-
dents who attended each institution
sector, including students’ under-
graduate program, major field of
study, attendance intensity, enroll-
ment and employment status, and
participation in distance education.
The remaining tables present 6-year
outcomes (as of June 2009) for 2003–
04 beginning postsecondary students
using data from BPS: 04/09:
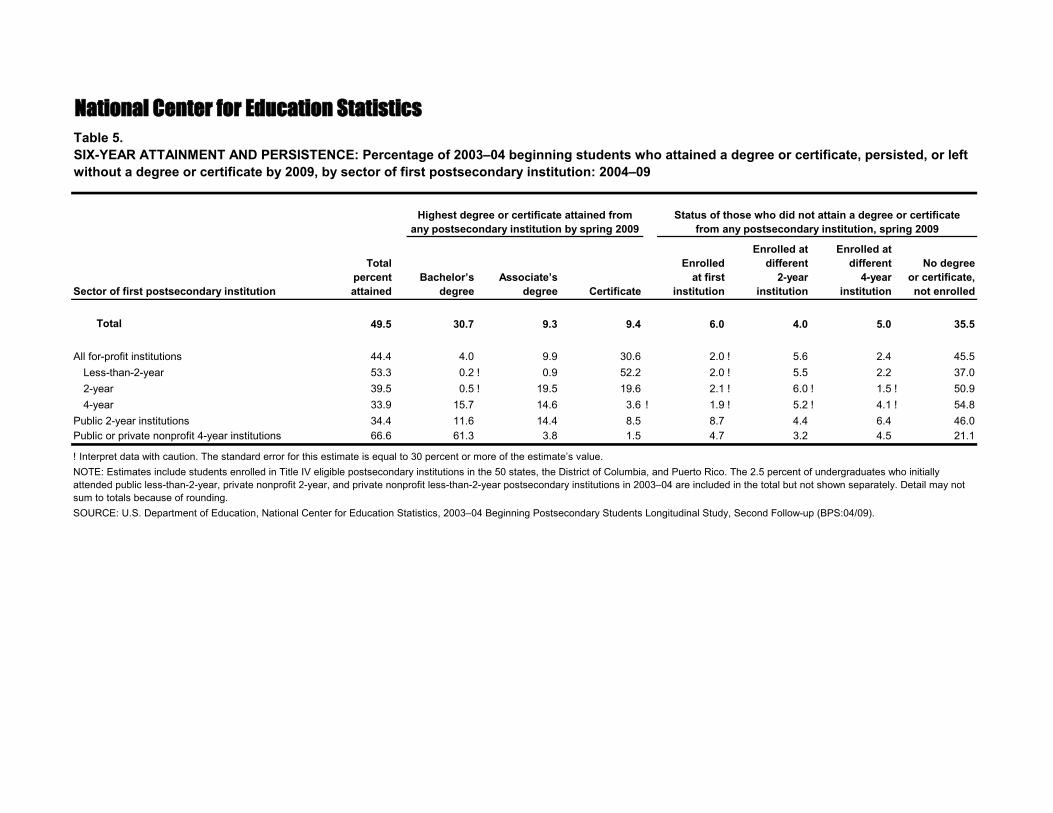
• Tables 5 and 6 summarize the 6-year
attainment and persistence status
and the 6-year transfer status,
respectively, of beginning postse-
condary students by sector of
institution first attended.
• Tables 7 and 8 report the percen-
tage of 2003–04 beginning students
who attained a degree or certificate
within 6 years by sector of postse-
condary institution first attended
and selected student and enroll-
ment characteristics.
RELATED NCES REPORTS Readers may also be interested in the
following NCES products related to the
topic of these Web Tables:
Web Tables—Profile of Undergraduate
Students: 2007–08 (NCES 2010-205).
http://nces.ed.gov/pubsearch/
pubsinfo.asp?pubid=2010205
Web Tables—Student Financing of
Undergraduate Education: 2007–08
(NCES 2010-162).
http://nces.ed.gov/pubsearch/
pubsinfo.asp?pubid=2010162
Changes in Postsecondary Awards Below
the Bachelor’s Degree: 1997 to 2007
(NCES 2010-167).
http://nces.ed.gov/pubsearch/
pubsinfo.asp?pubid=2010167
DATA The estimates presented in these
tables were generated from the 2007–
08 National Postsecondary Student Aid
Study (NPSAS:08) and the 2004/09 Be-
ginning Postsecondary Students
Longitudinal Study (BPS:04/09). NPSAS
is a comprehensive, nationally repre-
sentative survey of how students
finance their postsecondary education
conducted by the National Center for
Education Statistics (NCES). It is con-
ducted approximately every 4 years
and includes a broad array of demo-
graphic and enrollment characteristics.
NPSAS uses a two-stage sampling de-
sign. Postsecondary institutions are
selected for inclusion in the first stage,
and students are selected from these
institutions in the second stage. The
NPSAS:08 target population consisted
of all eligible undergraduate and gradu-
ate students enrolled any time between
July 1, 2007, and June 30, 2008 at Title
IV2 eligible postsecondary institutions in
the 50 states, the District of Columbia,
and Puerto Rico.3
BPS follows cohorts of students who
enroll in postsecondary education for
the first time and covers broad topics
concerning student persistence in and
completion of postsecondary educa-
tion and transitions to employment.
The sample of students studied in
BPS:04/09 is drawn from first-time be-
ginning students who were sampled
for the 2003–04 National Postsecon-
dary Student Aid Study (NPSAS:04),
whose target population included all
students enrolled in Title IV2 postse-
condary institutions in the United
States and Puerto Rico at any time be-
tween July 1, 2003 and June 30, 2004.3
This population included about 19 mil-
lion undergraduates and 3 million
graduate students enrolled in more
than 6,000 postsecondary institutions.
Approximately 19,000 respondents
were identified in NPSAS:04 as first-time
postsecondary students and sampled
for BPS:04/09. The BPS:04/09 sample
represents the approximately 4 million
undergraduates who were first-time
postsecondary beginners in 2003–04.
Approximately
114,000 undergraduates and 14,000
graduate students were study respon-
dents for NPSAS:08.
3
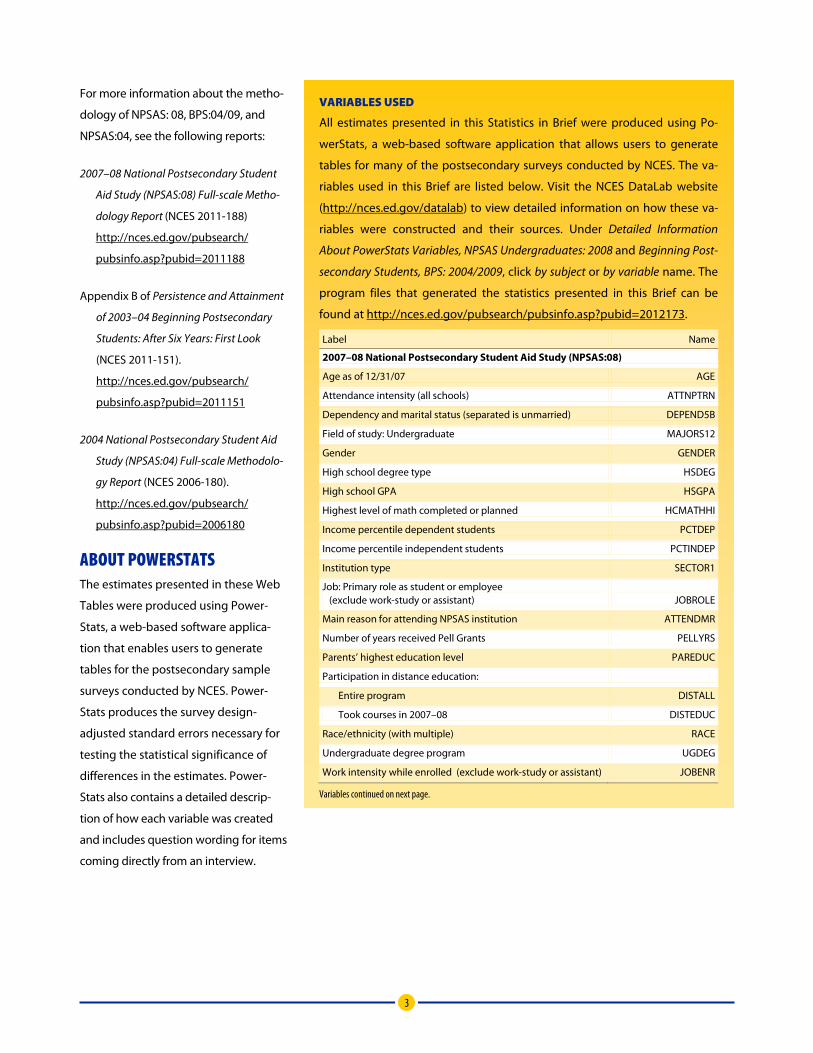
For more information about the metho-
dology of NPSAS: 08, BPS:04/09, and
NPSAS:04, see the following reports:
2007–08 National Postsecondary Student
Aid Study (NPSAS:08) Full-scale Metho-
dology Report (NCES 2011-188)
http://nces.ed.gov/pubsearch/
pubsinfo.asp?pubid=2011188
Appendix B of Persistence and Attainment
of 2003–04 Beginning Postsecondary
Students: After Six Years: First Look
(NCES 2011-151).
http://nces.ed.gov/pubsearch/
pubsinfo.asp?pubid=2011151
2004 National Postsecondary Student Aid
Study (NPSAS:04) Full-scale Methodolo-
gy Report (NCES 2006-180).
http://nces.ed.gov/pubsearch/
pubsinfo.asp?pubid=2006180
ABOUT POWERSTATS The estimates presented in these Web
Tables were produced using Power-
Stats, a web-based software applica-
tion that enables users to generate
tables for the postsecondary sample
surveys conducted by NCES. Power-
Stats produces the survey design-
adjusted standard errors necessary for
testing the statistical significance of
differences in the estimates. Power-
Stats also contains a detailed descrip-
tion of how each variable was created
and includes question wording for items
coming directly from an interview.
VARIABLES USED
All estimates presented in this Statistics in Brief were produced using Po-
werStats, a web-based software application that allows users to generate
tables for many of the postsecondary surveys conducted by NCES. The va-
riables used in this Brief are listed below. Visit the NCES DataLab website
(http://nces.ed.gov/datalab) to view detailed information on how these va-
riables were constructed and their sources. Under Detailed Information
About PowerStats Variables, NPSAS Undergraduates: 2008 and Beginning Post-
secondary Students, BPS: 2004/2009, click by subject or by variable name. The
program files that generated the statistics presented in this Brief can be
found at http://nces.ed.gov/pubsearch/pubsinfo.asp?pubid=2012173.
Label Name
2007–08 National Postsecondary Student Aid Study (NPSAS:08)
Age as of 12/31/07 AGE
Attendance intensity (all schools) ATTNPTRN
Dependency and marital status (separated is unmarried) DEPEND5B
Field of study: Undergraduate MAJORS12
Gender GENDER
High school degree type HSDEG
High school GPA HSGPA
Highest level of math completed or planned HCMATHHI
Income percentile dependent students PCTDEP
Income percentile independent students PCTINDEP
Institution type SECTOR1
Job: Primary role as student or employee (exclude work-study or assistant)
JOBROLE
Main reason for attending NPSAS institution ATTENDMR
Number of years received Pell Grants PELLYRS
Parents’ highest education level PAREDUC
Participation in distance education:
Entire program DISTALL
Took courses in 2007–08 DISTEDUC
Race/ethnicity (with multiple) RACE
Undergraduate degree program UGDEG
Work intensity while enrolled (exclude work-study or assistant) JOBENR
Variables continued on next page.

4
With PowerStats, users can replicate or
expand upon the tables presented in
this report. The output from Power-
Stats includes the estimates (e.g., per-
centages or means), the proper
standard errors,4
In addition to producing tables,
PowerStats users may conduct linear or
logistic regressions. Many options are
available for output of the regression
results. For a description of all the op-
tions available, users should access the
PowerStats website (
and weighted sample
sizes. If the number of valid cases is too
small to produce a reliable estimate
(fewer than 30 cases), PowerStats
prints the double dagger symbol (‡)
instead of the estimate.
http://nces.ed.gov/
datalab/index.aspx). For more informa-
tion, go to [email protected].
For more information, contact
Aurora D’Amico
Postsecondary Studies Division
National Center for Education Statistics
1990 K Street NW
Washington, DC 20006-5652
(202) 502-7334
For readers with disabilities, a Section
508-compliant version of these Web
Tables is available at
http://nces.ed.gov/pubsearch/pubsinfo
.asp?pubid=2012173.
VARIABLES USED—CONTINUED Label Name
2003–04 Beginning Postsecondary Students Longitudinal Study (BPS:04/09)
Attainment and persistence relative to first institution as of 2009
PROUT6Y
Degree program 2003–04 UGDEG
Dependency status 2003–04 DEPEND
First institution sector (level and control) 2003–04 FSECTOR
Gender GENDER
High school degree type HSDEG
Highest degree attained anywhere through 2009 ATHTY6Y
Income percentile dependent students 2003–04 PCTDEP
Income percentile independent students 2003–04 PCTINDEP
Job while enrolled 2004: Student or employee (exclude work-study)
JOBROLE
Job while enrolled 2004: Work intensity (exclude work-study) JOBENR
Major when last enrolled any year through 2009 (condensed) MAJ09C
NPSAS institution: Attendance pattern first year ATTNSTAT
Parents’ highest education level PAREDUC
Pell Grant: Number of years received as of 2009 PELYRS09
Race/ethnicity RACE
Reasons enrolled 2004:
Complete associate’s degree ATTENDA
Complete certificate ATTENDB
Job skills ATTENDC
Personal interest ATTENDD
Transfer to a 4-year college ATTENDF
Transfer (first): Type 2009 TFTYPE6Y

5
REFERENCES Aud, S., Hussar, W., Kena, G., Bianco, K.,
Frohlich, L., Kemp, J., and Tahan, K.
(2011). The Condition of Education
2011 (NCES 2011-033). National Cen-
ter for Education Statistics, Institute of
Education Sciences, U.S. Department
of Education. Washington, DC.
Horn, L., and Li, X. (2009). Changes in Post-
secondary Awards Below the Bachelor’s
Degree: 1997 to 2007 (NCES 2010-167).
National Center for Education Statis-
tics, Institute of Education Sciences,
U.S. Department of Education. Wash-
ington, DC.
Staklis, S. (2010). Web Tables—Profile of
Undergraduate Students: Trends From
Selected Years, 1995–96 to 2007–08
(NCES 2010-220). National Center for
Education Statistics, Institute of Edu-
cation Sciences, U.S. Department of
Education. Washington, DC.
Wilson, R. (2010, February 7). For-Profit
Colleges Change Higher Education’s
Landscape. Chronicle of Higher Educa-
tion. Retrieved February 16, 2010,
from http://chronicle.com/article/For-
Profit-Colleges-Change/64012/.
ENDNOTES 1 Undergraduates include postsecondary stu-dents who attended for-profit, public, and private nonprofit less-than-2-year, 2-year, and 4-year institutions, including both students who were and were not enrolled in a degree or certificate program. 2 Title IV postsecondary institutions are those eligible to participate in the federal financial aid programs included in Title IV of the Higher Education Act. These programs include Pell Grants, federal student loans, work-study, and other federal aid. 3 The target population of students was li-mited to those enrolled in an academic program, at least one course for credit that could be applied toward an academic degree, or an occupational or vocational program re-quiring at least 3 months or 300 clock hours of instruction to receive a degree, certificate, or other formal award. The target population ex-cluded students who were also enrolled in high school or a high school completion (e.g., GED preparation) program. 4 The NPSAS and BPS samples are not simple random samples; therefore, simple random sample techniques for estimating sampling error cannot be applied to these data. Power-Stats takes into account the complexity of the sampling procedures and calculates standard errors appropriate for such samples. The me-thod for computing sampling errors used by PowerStats involves approximating the esti-mator by replication of the sampled population. The procedure used is a bootstrap technique.

National Center for Education Statistics
Student characteristic
Allunder-
graduates Total
Less-than-
2-year 2-year 4-yearPublic2-year Other1
Total 100.0 9.5 2.1 2.6 4.8 43.5 46.1 0.9
Age as of 12/31/0718 or younger 100.0 5.0 1.9 1.4 1.6 40.3 54.4 0.419–23 100.0 6.2 1.8 1.9 2.5 36.7 56.6 0.624–29 100.0 15.6 3.0 4.4 8.2 47.2 36.1 1.230–39 100.0 16.8 2.7 3.7 10.3 53.2 28.6 1.440 or older 100.0 11.2 1.9 2.4 6.9 61.7 25.6 1.5
SexMale 100.0 6.9 1.2 1.9 3.9 43.9 48.5 0.8Female 100.0 11.5 2.9 3.1 5.6 43.3 44.2 1.0
Race/ethnicity2
White 100.0 7.2 1.3 1.9 4.0 42.3 49.9 0.6Black 100.0 16.9 3.1 5.2 8.5 44.4 37.9 0.8Hispanic 100.0 14.1 5.3 3.4 5.5 45.7 38.6 1.6Asian/Pacific Islander 100.0 5.7 1.0 1.5 ! 3.2 47.5 45.6 1.3 !Other or Two or more races 100.0 10.5 1.7 2.7 ! 6.1 45.5 42.3 1.7
! Interpret data with caution. The standard error for this estimate is equal to 30 percent or more of the estimate’s value.1 Includes public less-than-2-year, private nonprofit 2-year, and private nonprofit less-than-2-year.
SOURCE: U.S. Department of Education, National Center for Education Statistics, 2007–08 National Postsecondary Student Aid Study (NPSAS:08).
Table 1.UNDERGRADUATES’ POSTSECONDARY SECTOR: Percentage distribution of undergraduates’ postsecondary institution sector, by age group, sex, and race/ethnicity: Academic year 2007–08
2 Black includes African American, Hispanic includes Latino, Asian/Pacific Islander includes Native Hawaiian, and Other or Two or more races includes American Indian, Alaska Native, and respondents having origins in more than one race or in a race not listed. Race categories exclude Hispanic origin unless specified.NOTE: Estimates include students enrolled in Title IV eligible postsecondary institutions in the 50 states, the District of Columbia, and Puerto Rico. Detail may not sum to totals because of rounding.
For-profitPublic or
private nonprofit
4-year

National Center for Education Statistics
Student characteristic
Allunder-
graduates Total
Less-than-
2-year 2-year 4-yearPublic2-year Other
Total † # 0.00 0.28 0.28 # # #
Age as of 12/31/07
18 or younger † 0.30 0.11 0.20 0.22 1.24 1.17 0.0919–23 † 0.19 0.05 0.21 0.15 0.28 0.30 0.0524–29 † 0.41 0.11 0.60 0.74 0.51 0.58 0.0830–39 † 0.62 0.11 0.58 0.67 0.84 0.69 0.1440 or older † 0.76 0.19 0.34 0.92 0.95 0.76 0.15
SexMale † 0.36 0.14 0.33 0.18 0.28 0.35 0.07Female † 0.24 0.10 0.38 0.47 0.21 0.25 0.05
Race/ethnicityWhite † 0.22 0.09 0.25 0.31 0.39 0.36 0.08Black † 1.11 0.33 0.86 1.09 1.06 0.94 0.19Hispanic † 0.97 0.34 0.48 0.62 1.33 1.00 0.30Asian/Pacific Islander † 0.82 0.15 0.50 0.52 1.42 1.28 0.48Other or Two or more races † 1.14 0.17 0.82 0.86 1.54 1.38 0.32
† Not applicable.# Rounds to zero.SOURCE: U.S. Department of Education, National Center for Education Statistics, 2007–08 National Postsecondary Student Aid Study (NPSAS:08).
Table S1.Standard errors for table 1: UNDERGRADUATES’ POSTSECONDARY SECTOR: Percentage distribution of undergraduates’ postsecondary institution sector, by age group, sex, and race/ethnicity: Academic year 2007–08
For-profit Public or private
nonprofit4-year

National Center for Education Statistics
Student characteristic
Allunder-
graduates Total
Less-than-
2-year 2-year 4-yearPublic2-year
Total 100.0 100.0 100.0 100.0 100.0 100.0 100.0
SexMale 43.1 31.2 23.5 31.4 34.5 43.4 45.3Female 56.9 68.8 76.5 68.6 65.5 56.6 54.7
Race/ethnicity1
White 61.8 46.5 38.6 45.0 50.8 60.0 66.9Black 14.0 24.7 20.5 28.6 24.5 14.3 11.5Hispanic 14.1 21.0 35.1 18.7 16.0 14.8 11.8Asian 6.6 3.9 3.0 4.0 ! 4.3 7.2 6.6Other or Two or more races 3.5 3.9 2.8 3.7 ! 4.4 3.7 3.2
Age18 or younger 10.0 5.2 9.0 5.5 3.3 9.2 11.819–23 49.7 32.2 41.5 36.8 25.7 41.9 61.124–29 17.3 28.3 24.2 29.7 29.3 18.7 13.530–39 12.6 22.1 16.0 18.3 26.8 15.4 7.840 or older 10.5 12.3 9.3 9.7 14.9 14.8 5.8
Dependency and marital status2
Dependent 53.0 23.9 33.5 27.7 17.7 43.5 68.4Independent 47.0 76.1 66.5 72.3 82.3 56.5 31.6
Unmarried with no dependents 15.7 21.0 17.5 20.2 22.9 17.6 12.8Married with no dependents 5.9 6.0 4.1 4.6 7.6 7.4 4.6Unmarried with dependents 13.4 31.3 31.7 34.4 29.6 16.2 6.8Married with dependents 12.0 17.8 13.2 13.2 22.3 15.4 7.5
Highest education attained by either parent3
High school diploma or less 33.5 50.8 54.9 54.6 47.1 39.0 24.9Some postsecondary education4 27.0 28.2 26.7 25.5 30.3 29.3 24.6Bachelor’s degree or higher 39.5 21.0 18.4 19.9 22.6 31.7 50.5
See notes at end of table.
Table 2.STUDENT DEMOGRAPHIC CHARACTERISTICS: Percentage distribution of undergraduates’ demographic characteristics and percentage of undergraduates who ever received a Pell Grant, by postsecondary institution sector: Academic year 2007–08
For-profit Public orprivate
nonprofit4-year

National Center for Education Statistics
Student characteristic
Allunder-
graduates Total
Less-than-
2-year 2-year 4-yearPublic2-year
Dependent student income5
Lowest 25 percent 25.5 50.6 52.7 53.0 46.9 31.1 20.1Lower middle 25 percent 25.0 24.9 22.1 24.1 27.9 30.1 22.0Upper middle 25 percent 25.0 15.7 13.9 17.8 15.6 23.3 26.7Highest 25 percent 24.5 8.8 11.4 5.1 9.6 15.5 31.2
Independent student income6
Lowest 25 percent 25.5 32.5 45.0 38.4 25.3 21.6 28.4Lower middle 25 percent 25.0 29.7 29.7 31.6 28.8 24.1 24.2Upper middle 25 percent 25.0 24.9 17.6 22.2 28.7 26.1 23.1Highest 25 percent 24.5 13.0 7.8 7.8 17.3 28.2 24.2
Ever received a Pell Grant 40.1 74.5 74.6 79.9 71.7 36.4 36.2
! Interpret data with caution. The standard error for this estimate is equal to 30 percent or more of the estimate’s value.
2 Unmarried includes separated students.3 Estimates for parent education exclude the 3.7 percent of students who did not know the highest education attained by either parent.
5 Based on parents’ income in 2006.6 Based on student’s income plus any income from a spouse, if applicable, in 2006.
SOURCE: U.S. Department of Education, National Center for Education Statistics, 2007–08 National Postsecondary Student Aid Study (NPSAS:08).
1 Black includes African American, Hispanic includes Latino, Asian/Pacific Islander includes Native Hawaiian, and Other or Two or more races includes American Indian, Alaska Native, and respondents having origins in more than one race or in a race not listed. Race categories exclude Hispanic origin unless specified.
NOTE: Estimates include students enrolled in Title IV eligible postsecondary institutions in the 50 states, the District of Columbia, and Puerto Rico. The 0.9 percent of undergraduates who attended public less-than-2-year, private nonprofit 2-year, and private nonprofit less-than-2-year postsecondary institutions in 2007–08 are included in the total for all undergraduates but not shown separately. Detail may not sum to totals because of rounding.
Table 2.STUDENT DEMOGRAPHIC CHARACTERISTICS: Percentage distribution of undergraduates’ demographic characteristics and percentage of undergraduates who ever received a Pell Grant, by postsecondary institution sector: Academic year 2007–08—Continued
For-profit Public orprivate
nonprofit4-year
4 Some postsecondary education includes vocational or technical training, less than 2 years of college, associate’s degree, and 2 or more years of college but no degree.

National Center for Education Statistics
Student characteristic
Allunder-
graduates Total
Less-than-
2-year 2-year 4-yearPublic2-year
Total † † † † † † †
SexMale 0.60 1.83 2.70 4.45 2.47 0.64 0.60Female 0.60 1.83 2.70 4.45 2.47 0.64 0.60
Race/ethnicityWhite 0.52 1.49 2.84 3.59 1.92 0.93 0.51Black 0.28 1.70 2.22 3.14 2.21 0.53 0.27Hispanic 0.44 1.06 2.21 2.17 1.75 0.81 0.50Asian 0.19 0.60 0.43 1.20 0.80 0.32 0.21Other or Two or more races 0.15 0.45 0.32 1.27 0.63 0.24 0.12
Age18 or younger 0.19 0.36 0.51 0.76 0.54 0.27 0.3819–23 0.25 1.02 1.13 1.91 1.50 0.39 0.4224–29 0.18 0.81 0.82 1.93 1.43 0.25 0.2830–39 0.16 0.89 0.66 1.81 1.52 0.29 0.2240 or older 0.17 0.90 0.89 0.86 1.48 0.31 0.20
Dependency and marital statusDependent 0.31 1.13 1.20 2.40 1.68 0.49 0.55Independent 0.31 1.13 1.20 2.40 1.68 0.49 0.55
Unmarried with no dependents 0.20 1.01 0.71 1.24 1.88 0.33 0.23Married with no dependents 0.12 0.62 0.39 1.34 1.08 0.21 0.13Unmarried with dependents 0.21 1.58 1.58 2.83 2.49 0.44 0.18Married with dependents 0.23 0.90 0.84 1.48 1.52 0.40 0.29
Highest education attained by either parentHigh school diploma or less 0.23 0.99 1.11 2.22 1.71 0.40 0.30Some postsecondary education 0.21 0.91 0.82 1.57 1.37 0.44 0.27Bachelor’s degree or higher 0.22 0.83 0.72 1.35 1.47 0.45 0.34
See notes at end of table.
Table S2.Standard errors for table 2: STUDENT DEMOGRAPHIC CHARACTERISTICS: Percentage distribution of undergraduates’ demographic characteristics and percentage of undergraduates who ever received a Pell Grant, by postsecondary institution sector: Academic year 2007–08
For-profit Public orprivate
nonprofit4-year

National Center for Education Statistics
Student characteristic
Allunder-
graduates Total
Less-than-
2-year 2-year 4-yearPublic2-year
Dependent student incomeLowest 25 percent 0.29 1.77 3.08 3.92 2.92 0.58 0.24Lower middle 25 percent 0.24 1.45 1.05 3.60 2.67 0.49 0.32Upper middle 25 percent 0.26 1.47 1.32 3.96 2.20 0.48 0.32Highest 25 percent 0.31 0.77 1.38 1.43 1.29 0.45 0.42
Independent student incomeLowest 25 percent 0.32 1.03 1.56 3.01 1.73 0.48 0.59Lower middle 25 percent 0.34 1.02 1.12 1.42 1.68 0.39 0.49Upper middle 25 percent 0.39 1.11 1.01 2.17 1.73 0.54 0.48Highest 25 percent 0.37 0.69 0.68 1.48 1.23 0.52 0.65
Ever received a Pell Grant 0.75 0.78 1.35 2.19 1.48 1.14 0.56
† Not applicable.SOURCE: U.S. Department of Education, National Center for Education Statistics, 2007–08 National Postsecondary Student Aid Study (NPSAS:08).
Table S2.Standard errors for table 2: STUDENT DEMOGRAPHIC CHARACTERISTICS: Percentage distribution of undergraduates’ demographic characteristics and percentage of undergraduates who ever received a Pell Grant, by postsecondary institution sector: Academic year 2007–08—Continued
For-profit Public orprivate
nonprofit4-year

National Center for Education Statistics
High school completion status,grade point average,and highest math class
Allunder-
graduates Total
Less-than-
2-year 2-year 4-yearPublic2-year
Total 100.0 100.0 100.0 100.0 100.0 100.0 100.0
High school completion status1
High school diploma 92.4 82.9 80.1 79.2 86.2 89.9 96.9GED, certificate of completion, or equivalent 6.8 14.5 13.4 18.0 13.1 8.9 3.0Did not complete high school 0.8 2.6 6.6 2.7 0.8 1.1 0.1
High school grade point average2
3.50 or higher 33.4 17.6 19.6 15.5 17.8 22.8 44.33.00–3.49 37.3 36.9 38.6 33.7 38.1 38.5 36.32.50–2.99 14.0 19.6 20.3 20.2 18.9 17.0 10.72.00–2.49 12.9 21.3 17.9 25.4 20.6 18.0 7.6Less than 1.99 2.4 4.5 3.6 5.2 4.6 3.6 1.2
Highest math class3
None of these 9.4 16.4 18.3 17.0 14.8 14.5 4.4Algebra II 23.1 31.7 31.6 27.0 34.7 29.3 17.0Trigonometry 12.9 11.7 11.0 12.8 11.3 12.9 13.1Pre-calculus 25.1 21.3 22.0 23.1 19.7 23.3 27.2Calculus 29.4 19.0 17.1 20.0 19.5 20.1 38.4
2 Reported only for students under age 30.
SOURCE: U.S. Department of Education, National Center for Education Statistics, 2007–08 National Postsecondary Student Aid Study (NPSAS:08).
For-profit
Table 3.HIGH SCHOOL ACADEMIC PREPARATION: Percentage distribution of undergraduates’ high school completion status, grade point average, and highest math class, by postsecondary institution sector: Academic year 2007–08
Public or private
nonprofit4-year
NOTE: Estimates include students enrolled in Title IV eligible postsecondary institutions in the 50 states, the District of Columbia, and Puerto Rico. Detail may not sum to totals because of rounding. The 0.9 percent of undergraduates who attended public less-than-2-year, private nonprofit 2-year, and private nonprofit less-than-2-year postsecondary institutions in 2007–08 are included in the total for all undergraduates but not shown separately.
1 Estimates exclude the 3.4 percent of undergraduates who graduated from high school in a foreign country and the 0.4 percent who were home schooled.
3 Based on information self-reported on College Board and ACT test questionnaires and the student interview. Reported only for students under age 30.

National Center for Education Statistics
High school completion status,grade point average,and highest math class
Allunder-
graduates Total
Less-than-
2-year 2-year 4-yearPublic2-year
Total † † † † † † †
High school completion statusHigh school diploma 0.15 0.82 1.19 1.67 0.98 0.28 0.11GED, certificate of completion, or equivalent 0.16 0.76 0.83 1.70 0.95 0.28 0.11Did not complete high school 0.07 0.32 0.83 0.88 0.24 0.14 0.04
High school grade point average3.50 or higher 0.29 0.89 1.28 1.77 1.27 0.44 0.413.00–3.49 0.23 0.96 1.07 1.85 1.63 0.38 0.332.50–2.99 0.22 1.13 0.71 2.32 1.81 0.36 0.212.00–2.49 0.18 0.82 0.94 1.74 1.28 0.33 0.17Less than 1.99 0.08 0.43 0.52 1.02 0.71 0.14 0.07
Highest math classNone of these 0.16 0.65 0.81 1.34 1.17 0.31 0.17Algebra II 0.24 1.01 0.92 2.01 1.74 0.45 0.32Trigonometry 0.17 0.83 0.51 1.74 1.42 0.29 0.20Pre-calculus 0.19 0.88 0.95 1.87 1.35 0.34 0.27Calculus 0.33 0.82 0.96 1.74 1.26 0.38 0.54
† Not applicable.SOURCE: U.S. Department of Education, National Center for Education Statistics, 2007–08 National Postsecondary Student Aid Study (NPSAS:08).
Table S3.Standard errors for table 3: HIGH SCHOOL ACADEMIC PREPARATION: Percentage distribution of undergraduates’ high school completion status, grade point average, and highest math class, by postsecondary institution sector: Academic year 2007–08
For-profit Public or private
nonprofit4-year

National Center for Education Statistics
Enrollment characteristic
Allunder-
graduates Total
Less-than-
2-year 2-year 4-yearPublic2-year
Total 100.0 100.0 100.0 100.0 100.0 100.0 100.0
Degree or certificate programCertificate 7.1 34.4 98.4 35.7 5.6 ! 6.9 0.6Associate’s degree 40.2 38.2 † 61.8 42.6 78.9 4.2Bachelor’s degree 46.7 25.8 † † 50.4 3.0 93.1No certificate or degree 6.0 1.6 1.6 ! 1.9 ! 1.4 ! 11.2 2.1
Major field of study Health 15.3 32.0 44.9 44.2 19.9 18.3 8.7 Business/management 17.2 22.6 2.3 12.1 37.0 14.0 19.0 STEM1 16.1 12.9 4.7 11.8 17.1 11.4 20.8 Social sciences and humanities 23.0 4.8 0.5 ! 2.1 8.1 24.4 25.8 Education 6.2 0.9 0.2 ! 0.4 ! 1.5 ! 5.4 8.1 Vocational/technical and other technical/professional2 13.7 22.2 42.0 23.3 12.9 13.5 12.0 Undeclared 8.6 4.5 5.3 ! 6.0 3.3 13.0 5.6
Attendance intensityFull-time, full-year 39.3 37.0 28.4 26.2 46.4 19.1 59.1Full-time, part-year 14.0 32.8 46.8 43.1 21.2 11.4 12.3Part-time, full-year 22.1 13.6 11.8 12.5 15.0 31.6 14.9Part-time, part-year 24.6 16.6 13.0 18.3 17.4 37.9 13.7
Work intensity while enrolled3
Did not work 25.2 26.7 36.1 30.1 20.8 18.7 30.9Part-time 42.6 34.5 39.1 39.6 29.8 40.0 47.0Full-time 32.2 38.8 24.8 30.3 49.4 41.4 22.1
Primary role as student or employee4
Student working to meet expenses 67.8 57.6 70.9 63.2 50.2 59.9 78.9Employee enrolled in school 32.2 42.4 29.1 36.8 49.8 40.1 21.1
See notes at end of table.
For-profit Public orprivate
nonprofit4-year
Table 4.ENROLLMENT: Percentage distribution of undergraduates’ enrollment characteristics and percentage participating in distance education, by postsecondary institution sector: Academic year 2007–08

National Center for Education Statistics
Enrollment characteristic
Allunder-
graduates Total
Less-than-
2-year 2-year 4-yearPublic2-year
Primary reason for enrolling5
Gain job or occupational skills 37.0 49.6 50.1 49.3 † 35.4 †Prepare for job certification or license 14.4 21.9 25.5 19.0 † 13.4 †Complete associate’s degree 11.5 6.6 0.0 12.0 † 12.1 †Complete undergraduate certificate 2.3 4.4 5.9 3.2 † 2.1 †Take courses solely for recreation, self-improvement, or personal interest 7.4 10.2 12.7 8.2 † 7.0 †Prepare to transfer to another postsecondary institution6 22.6 6.1 4.7 7.2 † 24.7 †Earn course credits needed for a program at a different postsecondary institution 4.9 1.1 1.2 1.1 † 5.4 †
Participation in distance education7
Took distance education courses for credit during the current school year 20.4 21.3 6.2 18.0 29.7 24.2 16.8Entire program taught through distance education 3.7 12.3 1.6 8.3 19.0 3.2 2.4
† Not applicable.
! Interpret data with caution. The standard error for this estimate is equal to 30 percent or more of the estimate’s value.1 Includes life sciences, physical sciences, mathematics, computer and information sciences, and engineering and engineering technologies.
5 Students can select more than one reason. Only applies to students who attended less-than-4-year postsecondary institutions.6 Includes preparing to transfer to 2- and 4-year postsecondary institutions.7 Distance education categories are not mutally exclusive.
SOURCE: U.S. Department of Education, National Center for Education Statistics, 2007–08 National Postsecondary Student Aid Study (NPSAS:08).
3 Excludes work-study and assistantships. Students who worked part time worked less than 35 hours a week, and students who worked full time worked 35 hours or more a week.
NOTE: Estimates include students enrolled in Title IV eligible postsecondary institutions in the 50 states, the District of Columbia, and Puerto Rico. The 0.9 percent of undergraduates who attended public less-than-2-year, private nonprofit 2-year, and private nonprofit less-than-2-year postsecondary institutions in 2007–08 are included in the total for all undergraduates but not shown separately. Detail may not sum to totals because of rounding.
2 Includes construction trades; personal and culinary services; mechanic, repair technologies, and technicians; precision production; homeland security, law enforcement and protective services; architecture; public administration and social services; law and legal studies; and transportation and materials moving.
4 Undergraduates who were employed while enrolled were asked whether they considered their primary role to be as a student working to meet expenses or as an employee who decided to enroll in school.
Table 4.ENROLLMENT: Percentage distribution of undergraduates’ enrollment characteristics and percentage participating in distance education, by postsecondary institution sector: Academic year 2007–08—Continued
For-profit Public orprivate
nonprofit4-year

National Center for Education Statistics
Enrollment characteristic
Allunder-
graduates Total
Less-than-
2-year 2-year 4-yearPublic2-year
Total † † † † † † †
Degree or certificate programCertificate 0.32 1.82 0.59 4.87 1.96 0.52 0.07Associate’s degree 0.48 1.39 † 5.28 2.39 0.71 0.40Bachelor’s degree 0.22 1.42 † † 3.15 0.35 0.40No certificate or degree 0.28 0.33 0.59 0.76 0.53 0.56 0.15
Major field of study Health 0.37 2.09 5.55 4.70 3.09 0.48 0.24 Business/management 0.25 1.65 0.60 2.29 2.41 0.28 0.32 STEM 0.19 0.96 1.10 1.83 1.58 0.25 0.26 Social sciences and humanities 0.37 0.63 0.18 0.50 1.08 0.64 0.40 Education 0.19 0.24 0.07 0.19 0.47 0.21 0.29 Vocational/technical and other technical/professional 0.35 1.81 5.17 4.53 1.28 0.56 0.24 Undeclared 0.28 0.67 1.92 1.15 0.87 0.68 0.24
Attendance intensityFull-time, full-year 0.28 1.70 1.62 2.98 4.00 0.34 0.48Full-time, part-year 0.28 1.14 2.02 2.84 3.33 0.48 0.27Part-time, full-year 0.33 0.94 1.10 2.04 1.48 0.38 0.38Part-time, part-year 0.35 1.21 1.52 2.27 2.62 0.76 0.25
Work intensity while enrolledDid not work 0.24 0.73 1.22 1.46 0.95 0.30 0.42Part-time 0.25 1.00 1.22 1.66 1.48 0.40 0.40Full-time 0.30 1.20 0.84 1.45 1.69 0.43 0.41
Primary role as student or employeeStudent working to meet expenses 0.34 1.21 0.96 1.94 1.81 0.43 0.52Employee enrolled in school 0.34 1.21 0.96 1.94 1.81 0.43 0.52
See notes at end of table.
Table S4.Standard errors for table 4: ENROLLMENT: Percentage distribution of undergraduates’ enrollment characteristics and percentage participating in distance education, by postsecondary institution sector: Academic year 2007–08
For-profit Public orprivate
nonprofit4-year

National Center for Education Statistics
Enrollment characteristic
Allunder-
graduates Total
Less-than-
2-year 2-year 4-yearPublic2-year
Primary reason for enrollingGain job or occupational skills 0.42 1.19 0.83 2.18 † 0.42 †Prepare for job certification or license 0.25 0.73 0.82 1.09 † 0.26 †Complete associate’s degree 0.24 0.70 0.00 1.25 † 0.26 †Complete undergraduate certificate 0.11 0.38 0.47 0.55 † 0.11 †Take courses solely for recreation, self-improvement, or personal interest 0.21 0.68 0.59 1.09 † 0.24 †Prepare to transfer to another postsecondary institution 0.37 0.50 0.36 0.85 † 0.38 †Earn course credits needed for a program at a different postsecondary institution 0.18 0.19 0.23 0.33 † 0.20 †
Participation in distance educationTook distance education courses for credit during the current school year 0.33 1.21 0.33 1.30 2.09 0.33 0.51Entire program taught through distance education 0.18 1.39 0.23 1.33 2.19 0.14 0.18
† Not applicable.SOURCE: U.S. Department of Education, National Center for Education Statistics, 2007–08 National Postsecondary Student Aid Study (NPSAS:08).
Table S4.Standard errors for table 4: ENROLLMENT: Percentage distribution of undergraduates’ enrollment characteristics and percentage participating in distance education, by postsecondary institution sector: Academic year 2007–08—Continued
For-profit Public orprivate
nonprofit4-year
National Center for Education Statistics
Sector of first postsecondary institution
Total percent attained
Bachelor’s degree
Associate’s degree Certificate
Enrolledat first
institution
Enrolled atdifferent
2-yearinstitution
Enrolled atdifferent
4-yearinstitution
No degreeor certificate,not enrolled
Total 49.5 30.7 9.3 9.4 6.0 4.0 5.0 35.5
All for-profit institutions 44.4 4.0 9.9 30.6 2.0 ! 5.6 2.4 45.5Less-than-2-year 53.3 0.2 ! 0.9 52.2 2.0 ! 5.5 2.2 37.02-year 39.5 0.5 ! 19.5 19.6 2.1 ! 6.0 ! 1.5 ! 50.94-year 33.9 15.7 14.6 3.6 ! 1.9 ! 5.2 ! 4.1 ! 54.8
Public 2-year institutions 34.4 11.6 14.4 8.5 8.7 4.4 6.4 46.0Public or private nonprofit 4-year institutions 66.6 61.3 3.8 1.5 4.7 3.2 4.5 21.1
! Interpret data with caution. The standard error for this estimate is equal to 30 percent or more of the estimate’s value.
SOURCE: U.S. Department of Education, National Center for Education Statistics, 2003–04 Beginning Postsecondary Students Longitudinal Study, Second Follow-up (BPS:04/09).
Highest degree or certificate attained from any postsecondary institution by spring 2009
Status of those who did not attain a degree or certificatefrom any postsecondary institution, spring 2009
Table 5.SIX-YEAR ATTAINMENT AND PERSISTENCE: Percentage of 2003–04 beginning students who attained a degree or certificate, persisted, or left without a degree or certificate by 2009, by sector of first postsecondary institution: 2004–09
NOTE: Estimates include students enrolled in Title IV eligible postsecondary institutions in the 50 states, the District of Columbia, and Puerto Rico. The 2.5 percent of undergraduates who initially attended public less-than-2-year, private nonprofit 2-year, and private nonprofit less-than-2-year postsecondary institutions in 2003–04 are included in the total but not shown separately. Detail may not sum to totals because of rounding.

National Center for Education Statistics
Sector of first postsecondary institution
Total percent attained
Bachelor’s degree
Associate’s degree Certificate
Enrolledat first
institution
Enrolled atdifferent
2-yearinstitution
Enrolled atdifferent
4-yearinstitution
No degreeor certificate,not enrolled
Total 0.68 0.56 0.37 0.38 0.39 0.26 0.29 0.65
All for-profit institutions 2.08 0.94 1.34 2.21 0.63 0.93 0.59 1.95Less-than-2-year 2.51 0.10 0.23 2.55 0.73 1.04 0.53 2.342-year 3.70 0.33 3.51 4.78 1.72 2.16 0.75 4.644-year 4.37 3.78 3.45 1.88 1.06 1.92 1.93 3.82
Public 2-year institutions 0.95 0.68 0.61 0.68 0.76 0.39 0.52 1.00Public or private nonprofit 4-year institutions 1.01 1.13 0.42 0.20 0.41 0.35 0.34 0.81
SOURCE: U.S. Department of Education, National Center for Education Statistics, 2003–04 Beginning Postsecondary Students Longitudinal Study, Second Follow-up (BPS:04/09).
Table S5.Standard errors for table 5: SIX-YEAR ATTAINMENT AND PERSISTENCE: Percentage of 2003–04 beginning students who attained a degree or certificate, persisted, or left without a degree or certificate by 2009, by sector of first postsecondary institution: 2004–09
Highest degree or certificate attained from any postsecondary institution by spring 2009
Status of those who did not attain a degree or certificatefrom any postsecondary institution, spring 2009

National Center for Education Statistics
Sector of postsecondaryinstitution first attended
Never transferred Transferred
Upward transfer1
Lateraltransfer2
Downward transfer3
Total 68.3 31.7 39.9 42.6 17.6
All for-profit institutions 75.7 24.3 50.1 35.8 14.2Less-than-2-year 74.9 25.1 88.8 11.2 †2-year 78.6 21.4 31.1 63.0 5.9 !4-year 73.6 26.4 † 51.7 48.3
Public 2-year institutions 60.1 39.9 60.8 36.0 3.1Public or private nonprofit 4-year institutions 74.4 25.6 † 56.7 43.3
† Not applicable.! Interpret data with caution. The standard error for this estimate is equal to 30 percent or more of the estimate’s value.1 Transferred to a higher level postsecondary institution (e.g., from a 2-year to a 4-year institution; or from a less-than-2-year to a 2-year institution). 2 Transferred to a same-level postsecondary institution (e.g., from a 2-year to a 2-year institution). 3 Transferred to a lower level postsecondary institution (e.g., from a 4-year to a 2-year institution).
Table 6.TRANSFER STATUS AFTER 6 YEARS: Percentage of 2003–04 beginning students who transferred by 2009 and direction of transfer, by sector of first postsecondary institution: 2004–09
NOTE: Estimates include students enrolled in Title IV eligible postsecondary institutions in the 50 states, the District of Columbia, and Puerto Rico. The 2.5 percent of undergraduates who initially attended public less-than-2-year, private nonprofit 2-year, and private nonprofit less-than-2-year postsecondary institutions in 2003–04 are excluded. Detail may not sum to totals because of rounding.SOURCE: U.S. Department of Education, National Center for Education Statistics, 2003–04 Beginning Postsecondary Students Longitudinal Study, Second Follow-up (BPS:04/09).
Among transfersTransfer status by spring 2009

National Center for Education Statistics
Sector of postsecondaryinstitution first attended
Never transferred Transferred
Upward transfer
Lateraltransfer
Downward transfer
Total 0.66 0.66 1.10 1.20 0.79
All for-profit institutions 1.82 1.82 3.94 3.60 2.99Less-than-2-year 1.48 1.48 2.03 2.03 †2-year 4.12 4.12 8.21 10.32 3.934-year 5.16 5.16 † 7.75 7.75
Public 2-year institutions 1.26 1.26 1.88 1.95 0.52Public or private nonprofit 4-year institutions 0.75 0.75 † 1.57 1.57
† Not applicable.SOURCE: U.S. Department of Education, National Center for Education Statistics, 2003–04 Beginning Postsecondary Students Longitudinal Study, Second Follow-up (BPS:04/09).
Table S6.Standard errors for table 6: TRANSFER STATUS AFTER 6 YEARS: Percentage of 2003–04 beginning students who transferred by 2009 and direction of transfer, by sector of first postsecondary institution: 2004–09
Transfer status by spring 2009 Among transfers

National Center for Education Statistics
Enrollment characteristic
Allunder-
graduates Total
Less-than-
2-year 2-year 4-yearPublic2-year
Total 49.5 44.4 53.3 39.5 33.9 34.4 66.6
Initial degree or certificate programCertificate 55.1 52.9 53.5 51.5 ‡ 58.7 25.8 !Associate’s degree 35.1 35.1 ‡ 34.2 36.7 34.3 47.2Bachelor’s degree 67.3 32.1 ‡ ‡ 32.1 ‡ 68.6No certificate or degree 30.7 23.2 ! ‡ 27.6 ! ‡ 28.5 44.1
Major field of study Health 51.7 54.2 63.0 50.1 35.2 43.8 64.0 Business/management 52.4 33.6 49.8 18.0 ! 35.9 38.1 68.6 STEM1 58.8 34.7 29.4 26.7 51.3 38.2 75.2 Social sciences and humanities 59.0 37.0 37.5 36.4 ! 36.7 ! 42.7 72.8 Education 58.9 55.7 ‡ ‡ ‡ 41.9 72.9 Vocational/technical and other technical/professional2 57.7 58.7 67.3 62.5 33.3 ! 45.2 70.3
Attendance intensity, 2003–04Full-time, full-year 61.8 50.9 55.8 46.3 45.8 47.4 71.2Full-time, part-year 36.4 36.4 55.9 27.0 20.9 ! 26.9 51.7Part-time, full-year 35.1 29.6 38.6 ‡ 18.0 ! 32.7 42.6Part-time, part-year 21.9 25.3 30.9 ! 20.4 ! 23.8 ! 20.3 28.2
Work intensity while enrolled3
Did not work 57.9 52.6 56.8 49.7 42.4 33.4 71.9Part-time 50.9 41.0 49.2 38.0 30.3 ! 39.5 65.7Full-time (35 or more hours/week) 32.6 38.7 52.4 30.8 32.3 27.9 39.9
Primary role as an undergraduate4
Student working to meet expenses 50.7 43.0 52.2 36.2 38.0 39.8 64.9Employee enrolled in school 29.9 35.5 48.0 32.7 23.7 25.7 33.7
See notes at end of table.
For-profit Public orprivate
nonprofit4-year
Table 7.SIX-YEAR ATTAINMENT BY DEGREE PROGRAM AND OTHER ENROLLMENT CHARACTERISTICS: Percentage of 2003–04 beginning students who attained a degree or certificate by 2009, by sector of first postsecondary institution and selected enrollment characteristics: 2004–09

National Center for Education Statistics
Enrollment characteristic
Allunder-
graduates Total
Less-than-
2-year 2-year 4-yearPublic2-year
Reasons for enrolling5
Acquire job or occupational skills 37.4 49.7 54.9 40.5 † 30.4 †Complete associate’s degree 35.5 36.5 46.1 32.4 † 34.8 †Complete certificate 41.5 52.1 56.0 42.5 † 33.1 †Take courses solely for recreation, self-improvement, or personal interest 36.1 47.7 53.1 40.5 † 31.8 †Transfer to a 4-year postsecondary institution 39.6 46.4 51.2 42.2 ! † 39.2 †
† Not applicable.
! Interpret data with caution. The standard error for this estimate is equal to 30 percent or more of the estimate’s value.‡ Reporting standards not met.1 Includes life sciences, physical sciences, mathematics, computer and information sciences, and engineering and engineering technologies.
3 Excludes work-study, assistantships, and traineeships. 4 Only applies to students who had a job. 5 Students can select more than one reason. Only applies to students who attended less-than-4-year postsecondary institutions.NOTE: Estimates include students enrolled in Title IV eligible postsecondary institutions in the 50 states, the District of Columbia, and Puerto Rico. The 2.5 percent of undergraduates who initially attended public less-than-2-year, private nonprofit 2-year, and private nonprofit less-than-2-year postsecondary institutions in 2003–04 are included in the total for all undergraduates but not shown separately.SOURCE: U.S. Department of Education, National Center for Education Statistics, 2003–04 Beginning Postsecondary Students Longitudinal Study, Second Follow-up (BPS:04/09).
2 Includes construction trades; personal and culinary services; mechanic, repair technologies, and technicians; precision production; homeland security, law enforcement and protective services; architecture; public administration and social services; law and legal studies; and transportation and materials moving.
Table 7.SIX-YEAR ATTAINMENT BY DEGREE PROGRAM AND OTHER ENROLLMENT CHARACTERISTICS: Percentage of 2003–04 beginning students who attained a degree or certificate by 2009, by sector of first postsecondary institution and selected enrollment characteristics: 2004–09—Continued
For-profit Public orprivate
nonprofit4-year

National Center for Education Statistics
Enrollment characteristic
Allunder-
graduates Total
Less-than-
2-year 2-year 4-yearPublic2-year
Total 0.68 2.08 2.51 3.70 4.37 0.95 1.01
Initial degree or certificate programCertificate 1.68 2.41 2.50 8.10 † 5.92 8.91Associate’s degree 0.97 3.25 † 4.33 5.94 1.13 5.15Bachelor’s degree 1.02 6.77 † † 6.77 † 0.96No certificate or degree 2.32 10.57 † 14.35 † 2.47 7.04
Major field of study Health 1.79 4.78 4.38 12.45 10.21 2.36 3.20 Business/management 1.60 5.07 6.45 6.22 9.84 2.55 1.97 STEM 1.61 5.44 5.97 7.77 11.41 3.64 1.42 Social sciences and humanities 1.47 6.78 5.36 15.69 17.00 2.71 1.49 Education 2.44 11.97 † † † 4.28 2.42 Vocational/technical and other technical/professional 1.68 4.38 4.71 8.99 11.47 2.64 2.45
Attendance intensity, 2003–04Full-time, full-year 0.84 2.44 2.58 5.71 6.34 1.57 1.01Full-time, part-year 1.83 4.93 6.02 6.47 8.58 2.30 3.37Part-time, full-year 1.62 6.26 8.56 † 10.68 2.01 3.15Part-time, part-year 1.79 6.14 9.48 16.53 9.99 2.07 4.90
Work intensity while enrolledDid not work 1.01 2.19 2.75 5.23 7.71 1.87 1.14Part-time 1.21 4.12 4.57 7.69 11.21 2.28 1.37Full-time (35 or more hours/week) 1.58 3.57 4.20 5.73 7.45 2.07 3.26
Primary role as an undergraduateStudent working to meet expenses 1.01 2.91 3.37 5.54 6.71 1.71 1.24Employee enrolled in school 1.62 4.79 6.51 8.88 7.10 1.93 4.49
See notes at end of table.
Table S7.Standard errors for table 7: SIX-YEAR ATTAINMENT BY DEGREE PROGRAM AND OTHER ENROLLMENT CHARACTERISTICS: Percentage of 2003–04 beginning students who attained a degree or certificate by 2009, by sector of first postsecondary institution and selected enrollment characteristics: 2004–09
For-profit Public orprivate
nonprofit4-year

National Center for Education Statistics
Enrollment characteristic
Allunder-
graduates Total
Less-than-
2-year 2-year 4-yearPublic2-year
Reasons for enrollingAcquire job or occupational skills 1.28 2.44 2.58 4.57 † 1.55 †Complete associate’s degree 1.36 4.83 9.19 5.01 † 1.48 †Complete certificate 1.66 3.72 3.32 9.55 † 2.54 †Take courses solely for recreation, self-improvement, or personal interest 1.12 3.02 4.35 4.72 † 1.18 †Transfer to a 4-year postsecondary institution 1.83 8.24 9.75 13.47 † 1.97 †
† Not applicable.SOURCE: U.S. Department of Education, National Center for Education Statistics, 2003–04 Beginning Postsecondary Students Longitudinal Study, Second Follow-up (BPS:04/09).
Table S7.Standard errors for table 7: SIX-YEAR ATTAINMENT BY DEGREE PROGRAM AND OTHER ENROLLMENT CHARACTERISTICS: Percentage of 2003–04 beginning students who attained a degree or certificate by 2009, by sector of first postsecondary institution and selected enrollment characteristics: 2004–09—Continued
For-profit Public orprivate
nonprofit4-year

National Center for Education Statistics
Student characteristic
Allunder-
graduates Total
Less-than-
2-year 2-year 4-yearPublic2-year
Total 49.5 44.4 53.3 39.5 33.9 34.4 66.6
SexMale 47.0 42.8 45.4 42.9 39.8 32.0 62.9Female 51.4 45.3 55.7 36.8 29.9 36.3 69.5
Race/ethnicity1
White 54.2 44.4 49.6 40.5 43.5 38.7 70.1Black 36.8 37.6 43.6 39.6 19.3 ! 26.2 51.7Hispanic 41.2 52.7 67.5 38.1 25.4 ! 25.9 53.1Asian 57.2 53.9 ‡ ‡ ‡ 38.1 73.8Other or Two or more races 43.2 31.5 34.9 ‡ ‡ 29.2 62.8
Dependency statusDependent 56.1 49.3 60.8 44.5 38.8 38.8 69.6Independent 33.2 40.8 48.8 35.6 28.7 27.1 32.6
Highest education attained by either parent2
High school diploma or less 40.7 46.9 57.7 35.4 36.6 31.2 52.2Some postsecondary education3 47.5 40.4 46.1 44.2 29.7 37.6 62.3Bachelor’s degree or higher 60.4 44.5 51.8 43.9 36.3 ! 38.0 74.0
Dependent student income4
Lowest 25 percent 45.3 48.1 62.6 34.4 34.6 33.1 56.8Lower middle 25 percent 53.4 49.5 64.8 42.5 40.4 39.9 65.7Upper middle 25 percent 58.5 53.7 36.7 65.8 48.5 ! 41.2 70.8Highest 25 percent 68.2 52.7 ‡ ‡ ‡ 42.5 79.3
Independent student income5
Lowest 25 percent 31.0 39.1 40.6 41.5 ! ‡ 21.6 36.6Lower middle 25 percent 31.2 40.9 47.5 41.7 ‡ 21.3 24.1Upper middle 25 percent 35.4 43.9 60.2 26.6 35.3 30.0 29.1Highest 25 percent 34.5 38.4 69.1 21.7 ! 35.2 ! 31.1 37.5
See notes at end of table.
Table 8.SIX-YEAR ATTAINMENT BY DEMOGRAPHIC AND OTHER STUDENT CHARACTERISTICS: Percentage of 2003–04 beginning students who attained a degree or certificate by 2009, by sector of first postsecondary institution and selected student characteristics: 2004–09
For-profit Public orprivate
nonprofit4-year

National Center for Education Statistics
Student characteristic
Allunder-
graduates Total
Less-than-
2-year 2-year 4-yearPublic2-year
Ever received a Pell Grant 46.3 45.0 54.3 37.3 33.3 36.0 58.5
! Interpret data with caution. The standard error for this estimate is equal to 30 percent or more of the estimate’s value.‡ Reporting standards not met.1 Black includes African American, Hispanic includes Latino, Asian/Pacific Islander includes Native Hawaiian, and Other or Two or more races includes American Indian, Alaska Native, and respondents having origins in more than one race or in a race not listed. Race categories exclude Hispanic origin unless specified.2 Estimates for parent education exclude the 3.7 percent of students who did not know the highest education attained by either parent.
Table 8.SIX-YEAR ATTAINMENT BY DEMOGRAPHIC AND OTHER STUDENT CHARACTERISTICS: Percentage of 2003–04 beginning students who attained a degree or certificate by 2009, by sector of first postsecondary institution and selected student characteristics: 2004–09—Continued
For-profit Public orprivate
nonprofit4-year
NOTE: Estimates include students enrolled in Title IV eligible postsecondary institutions in the 50 states, the District of Columbia, and Puerto Rico. The 2.5 percent of undergraduates who initially attended public less-than-2-year, private nonprofit 2-year, and private nonprofit less-than-2-year postsecondary institutions in 2003–04 are included in the total for all undergraduates but not shown separately.SOURCE: U.S. Department of Education, National Center for Education Statistics, 2003–04 Beginning Postsecondary Students Longitudinal Study, Second Follow-up (BPS:04/09).
4 Based on parents’ income in 2003–04.5 Based on student’s income plus any income from a spouse, if applicable, in 2003–04.
3 Some postsecondary education includes vocational or technical training, less than 2 years of college, associate’s degree, and 2 or more years of college but no degree.

National Center for Education Statistics
Student characteristic
Allunder-
graduates Total
Less-than-
2-year 2-year 4-yearPublic2-year
Total 0.68 2.08 2.51 3.70 4.37 0.95 1.01
SexMale 0.91 4.02 6.60 6.80 6.39 1.72 1.37Female 0.94 2.44 2.08 5.54 5.86 1.24 1.04
Race/ethnicityWhite 0.68 2.64 3.30 4.53 6.19 1.25 1.00Black 1.83 3.88 3.20 10.09 8.85 2.51 3.07Hispanic 2.07 4.90 3.66 9.49 9.99 2.06 3.13Asian 2.82 10.70 † † † 4.62 3.10Other or Two or more races 2.48 7.34 7.18 † † 3.75 3.69
Dependency statusDependent 0.76 3.17 3.49 5.28 6.26 1.32 1.00Independent 1.13 2.46 3.13 5.08 6.01 1.67 3.58
Highest education attained by either parentHigh school diploma or less 1.11 2.82 3.29 6.38 5.05 1.60 2.05Some postsecondary education 1.41 3.98 3.50 8.92 7.09 2.35 1.86Bachelor’s degree or higher 0.94 6.28 5.95 11.51 12.82 1.69 1.02
Dependent student incomeLowest 25 percent 1.31 3.80 4.14 8.36 6.84 1.83 1.97Lower middle 25 percent 1.32 5.53 6.13 10.66 10.81 2.06 1.99Upper middle 25 percent 1.42 9.12 10.19 14.19 15.66 3.16 1.62Highest 25 percent 1.41 10.35 † † † 3.46 1.17
Independent student incomeLowest 25 percent 2.39 4.43 3.18 12.81 † 3.45 5.45Lower middle 25 percent 2.84 5.41 6.75 8.97 † 2.75 5.99Upper middle 25 percent 2.61 4.20 4.43 7.68 7.90 4.54 5.74Highest 25 percent 2.24 6.34 6.17 7.82 12.07 2.44 6.88
Ever received a Pell Grant 1.03 2.16 2.78 3.85 5.22 1.61 1.59
† Not applicable.SOURCE: U.S. Department of Education, National Center for Education Statistics, 2003–04 Beginning Postsecondary Students Longitudinal Study, Second Follow-up (BPS:04/09).
Table S8.Standard errors for table 8: SIX-YEAR ATTAINMENT BY DEMOGRAPHIC AND OTHER STUDENT CHARACTERISTICS: Percentage of 2003–04 beginning students who attained a degree or certificate by 2009, by sector of first postsecondary institution and selected student characteristics: 2004–09
For-profit Public orprivate
nonprofit4-year