
Web Surveys Versus Other Survey Modes
27
Web surveys versus other survey modes A meta-analysis comparing response rates Katja Lozar Manfreda University of Ljubljana Michael Bosnjak Free University of Bozen-Bolzano Jernej Berzelak University of Ljubljana Iris Haas University of Mannheim Vasja Vehovar University of Ljubljana One question that arises when discussing the usefulness of web-based surveys is whether they gain the same response rates compared to other modes of collecting survey data. A common perception exists that, in general, web survey response rates are considerably lower. However, such unsystematic anecdotal evidence could be misleading and does not provide any useful quantitative estimate. Meta- analytic procedures synthesising controlled experimental mode comparisons could give accurate answers but, to the best of the authors’ knowledge, such research syntheses have so far not been conducted. To overcome this gap, the authors have conducted a meta-analysis of 45 published and unpublished experimental comparisons between web and other survey modes. On average, web surveys yield an 11% lower response rate compared to other modes (the 95% confidence interval is confined by 15% and 6% to the disadvantage of the web mode). This response rate difference to the disadvantage of the web mode is systematically influenced by the sample recruitment base (a smaller difference for panel members as compared to one-time respondents), the solicitation mode chosen for web surveys (a greater difference for postal mail solicitation compared to email) and the number of contacts (the more contacts, the larger the difference in response rates between modes). No significant influence on response rate differences can be revealed for the type of mode web surveys are compared to, the type of target population, the type of sponsorship, whether or not incentives were offered, and the year the studies were conducted. Practical implications are discussed. International Journal of Market Research Vol. 50 Issue 1 © 2008 The Market Research Society 79 Received (in revised form): 21 December 2006
Transcript of Web Surveys Versus Other Survey Modes

7/30/2019 Web Surveys Versus Other Survey Modes
http://slidepdf.com/reader/full/web-surveys-versus-other-survey-modes 1/27
Web surveys versus other survey modes
A meta-analysis comparing response rates
Katja Lozar ManfredaUniversity of Ljubljana
Michael BosnjakFree University of Bozen-Bolzano
Jernej BerzelakUniversity of Ljubljana
Iris HaasUniversity of Mannheim
Vasja VehovarUniversity of Ljubljana
One question that arises when discussing the usefulness of web-based surveys is
whether they gain the same response rates compared to other modes of collecting
survey data. A common perception exists that, in general, web survey response
rates are considerably lower. However, such unsystematic anecdotal evidence
could be misleading and does not provide any useful quantitative estimate. Meta-analytic procedures synthesising controlled experimental mode comparisons
could give accurate answers but, to the best of the authors’ knowledge, such
research syntheses have so far not been conducted.
To overcome this gap, the authors have conducted a meta-analysis of 45
published and unpublished experimental comparisons between web and other
survey modes. On average, web surveys yield an 11% lower response rate
compared to other modes (the 95% confidence interval is confined by 15% and
6% to the disadvantage of the web mode).
This response rate difference to the disadvantage of the web mode is
systematically influenced by the sample recruitment base (a smaller difference forpanel members as compared to one-time respondents), the solicitation mode
chosen for web surveys (a greater difference for postal mail solicitation compared
to email) and the number of contacts (the more contacts, the larger the difference
in response rates between modes). No significant influence on response rate
differences can be revealed for the type of mode web surveys are compared to, the
type of target population, the type of sponsorship, whether or not incentives were
offered, and the year the studies were conducted. Practical implications are
discussed.
International Journal of Market Research Vol. 50 Issue 1
Received (in revised form): 21 December 2006
7/30/2019 Web Surveys Versus Other Survey Modes
http://slidepdf.com/reader/full/web-surveys-versus-other-survey-modes 2/27
Introduction
Web surveys are often discussed as a supplement, sometimes also as an
alternative to traditional survey modes where response rates are tending todecline (e.g. de Leeuw & de Heer 2002; Roster et al . 2004; Evans &Mathur 2005). However, also in web surveys there is the problem of non-response (Couper 2000; Vehovar et al . 2002). For example, over-surveyinginternet users may negatively impact on their willingness to participate.The activity of direct marketers with their unsolicited email practices(spam) may also have a negative influence on responses to web surveys. Inaddition, the methodology of web surveys is probably still not sufficientlydeveloped to take full advantage of the possibilities available, although
extensive research efforts are being made in this direction (e.g. Frick et al .1999; Tuten et al . 1999/2000; Dillman 2000).
In order for web surveys to become an established supplement, or evenan alternative to traditional survey modes, data collection methodologistsshould show that the data obtained by this mode have the same or evenhigher quality than data from already established modes. While there areseveral indicators of survey data quality, here we limit the discussion toresponse rates as an indicator of non-response error (e.g. Groves 1989). Inthe survey and marketing research industry, a common perception exists
that response rates for web surveys are lower than in traditional surveymodes. However, this perception is often speculative, theoretical or basedon limited evidence. Most anecdotal reviews provide ranges of responserates for some web surveys and other survey modes without pointing toexperimental studies allowing for stronger conclusions (e.g. MacElroy2000; Knapp & Heidingsfelder 2001; Schonlau et al . 2002, pp. 20, 95;Braithwaite et al . 2003; Pineau & Slotwiner 2004, p. 3). Some otherauthors have reviewed several experimental studies; however, their reviewwas limited to vote-counting methods only (e.g. McNeish 2001; Tutenet al
. 2002; Truell 2003), or they also included studies not usingcomparable samples (e.g. McNeish 2001).Several individual experimental studies comparing the response rates of
web with another (or several other) survey mode(s) have already beenreported in the literature. However, no studies are available thatsystematically synthesise these results. Individual experimental studiesoften appear limited by being specific to a certain target population, surveytopic or the implementation procedure applied. More seriously, someprimary studies suggest contradictory conclusions: while some authorsreport substantially higher response rates for web surveys compared toanother mode (e.g. Wygant & Lindorf 1999; Cobanoglu et al . 2001), other
Web surveys versus other survey modes

7/30/2019 Web Surveys Versus Other Survey Modes
http://slidepdf.com/reader/full/web-surveys-versus-other-survey-modes 3/27
authors report opposite findings (e.g. Vehovar et al . 2001; Fricker et al .2003). A need thus exists for a more powerful meta-analytical approach,
quantitatively synthesising the available studies. Such an approach wouldshow on an aggregate level whether response rates for web surveysactually differ compared to other survey modes. If so, a quantitativeestimate of the differences will be provided. In addition, it can helppractitioners decide in which situations a web survey mode is expected toyield lower, equivalent or even a better response rate than some othersurvey mode. Given such evidence, an informed decision about theappropriate survey mode, balancing out the response rates and costs, canbe chosen.
The goal of this study is thus to explore, with the aid of a systematicmeta-analytic approach, whether response rates in web surveys areactually lower than response rates for other survey modes. If systematicdifferences are revealed and quantified, then the moderators of themagnitude of these differences will be investigated.
Literature overview: response rate differences between websurveys and other survey modes
In the literature we can find theoretical discussions unanimously expectinglower response rates for web surveys compared to other survey modes.The reasons provided can essentially be grouped into two broadcategories. First, authors have come up with reasons supporting the notionof web surveys being inferior in terms of response rates in general,regardless of the mode to which they are compared. Second, web surveyresponse rates are discussed in the light of a specific comparable mode.Both avenues providing reasons for expected differences in response ratesto the disadvantage of the web relative to other survey modes will now
briefly be sketched.In the debate on why a web survey would be expected to give lowerresponse rates than alternative survey modes in general, security and privacy concerns associated with the internet are frequently stressed (e.g.Vehovar et al . 2001; Sax et al . 2003). Respondents tend to be anxiousabout their data being transferred via the internet and may consequentlybe reluctant to participate in web surveys.
Another reason found in the literature is the limited possibilities toemploy methods and procedures to increase response rates in web-basedsurveys, and the lack of new techniques taking advantage of the web mode(Kwak & Radler 1999; Bosnjak & Tuten 2003; Kaplowitz et al . 2004;
International Journal of Market Research Vol. 50 Issue 1

7/30/2019 Web Surveys Versus Other Survey Modes
http://slidepdf.com/reader/full/web-surveys-versus-other-survey-modes 4/27
Tuten et al . 2004). For instance, Bosnjak and Tuten (2003) show that pre-paid monetary incentives, a most effective technique in traditional contexts
that takes advantage of the reciprocity norm leading one to comply withsurvey participation requests (Groves et al . 1992; Dillman 2000),apparently does not work for web surveys if the incentive is transferredelectronically (e.g. via PayPal). Monetary tokens of appreciation must betangible to be effective in web survey contexts (Birnholtz et al . 2004), arestriction substantially pushing up the costs of conducting surveys via theinternet and thus preventing most marketing research firms employing thisstrategy. In essence, the measures undertaken to decrease non-responserates in web surveys are probably still not sufficiently developed despite a
decade of the intensive use of this mode in the survey and marketingresearch industry. Research efforts are being made in this direction,however they cannot easily improve on the state-of-the-art measures thathave proved effective for other survey modes in the last (at least) fivedecades.
Limited web literacy among certain segments of internet users,especially a lack of knowledge on how to access and adequately fill out aweb-based survey, is also mentioned in the literature (e.g. Dillman 2000;Fraze et al . 2002; Miller et al . 2002; Grigorian et al . 2004). Similarly, some
individuals may not use a computer very often and may therefore be lesslikely to respond to a web survey (Wygant & Lindorf 1999). Both thelimited web literacy and low-frequency use of the internet should beassociated with another reason mentioned in the literature, namely theincreased burden when responding through non-traditional methods(Bason 2000; Lozar Manfreda et al . 2001; Vehovar et al . 2001). Last, butnot least, technical limitations associated with the web mode are listed,such as software incompatibilities, misrepresentation of the visualmaterials used (e.g. scales and other visual design elements), and long or
irregular loading times (Miller et al . 2002; Knapp & Kirk 2003; Hayslett& Wildemuth 2004).By sketching the discussion on web survey response rates in light of a
specific comparable mode, we will limit our discussion to two other surveymodes with which web surveys are most often discussed in relation to eachother – that is, web vs mail surveys and web vs telephone surveys.
In comparison to mail surveys, web surveys may yield lower responserates due to the following basic reasons: while a paper-based questionnaireis likely to remain on a respondent’s desk and act as a continuousreminder, this is not the case with web questionnaires, especially thosewith an email invitation. The possibility of overlooking the invitation to
Web surveys versus other survey modes

7/30/2019 Web Surveys Versus Other Survey Modes
http://slidepdf.com/reader/full/web-surveys-versus-other-survey-modes 5/27
participate in a survey is more likely for web surveys with an emailinvitation than for traditional mail surveys (e.g. Crawford et al . 2001).
Further, email invitations are more likely to be perceived as spam and asless legitimate (e.g. due to the ease of falsifying the identity of researcherson the web), which ultimately translates into lower response rates (e.g.Tuten 1997; Jones & Pitt 1999). The researcher’s ‘investment’ in sendinga letter by post may heighten its perceived importance and legitimacy,resulting in higher response rates than with emailed invitations.
The reasons for lower responses to web in comparison to telephonesurveys may be attributed to the impersonal, self-administered nature of the web mode (Vehovar et al . 2001). Potential respondents may find it
much harder to decline participation when requested to do so bytelephone. Personal requests on the phone might be harder to ignore anddeflect than mail or electronic messages. Moreover, answering a websurvey needs much more action from the respondent than simplyimmediately answering questions from an interviewer over the telephone(Fricker et al . 2003).
The rest of this paper moves beyond these theoretical and speculativearguments and will synthesise the empirical evidence related to theexpected differences in response rates for web surveys in comparison to
other survey modes.
Research questions and hypotheses
Two main research questions are addressed. First, are response rates forweb surveys actually lower than for other survey modes? Second, what isthe impact of moderators influencing the magnitude of such potentialdifferences? Accordingly, the first research hypothesis is:
H1:Response rates for web surveys are lower than responserates for other survey modes.
To address H1, the focus will be on the average response rate differencebetween web and other survey modes.
The second research question refers to those moderators possiblyinfluencing the magnitude of response rate differences between web andcompared survey modes. Specifically, are there situations where a webmode would nevertheless perform better than other survey modes? Doesthe mode to which web surveys are compared, systematically influence theresponse rate differences? Are panel members inclined to respond
International Journal of Market Research Vol. 50 Issue 1

7/30/2019 Web Surveys Versus Other Survey Modes
http://slidepdf.com/reader/full/web-surveys-versus-other-survey-modes 6/27
regardless of the mode, compared to subjects who are requested toparticipate once? May we expect higher response rates for web surveys
from highly educated, computer-savvy respondents (e.g. students orprofessionals compared to the general population)? Or do certain imple-mentation procedures, such as the type of sponsorship, the solicitationmode, incentives and the number of contacts, have a differential impact onthe response rate differences of interest? Taken together, the second set of hypotheses is more general in nature due to the relatively unexploredeffects of different moderators on response rate differences.
H2: Moderators that vary the response rates differences between
compared modes are: (a) the type of mode to which web surveysare compared; (b) whether or not subjects are from a panel;(c) the type of target population; (d) the type of research sponsor;(e) the year of study; and (f–h) the implementation proceduresused (mode of survey invitation, incentives, number of contacts).
Method
Response rate differences between web and other survey modes are studied
through meta-analytic techniques. This section briefly sketches themethodology, the eligibility criteria and search strategy used, the coding of primary studies and the statistical procedures employed.
Background and overview of methods
The term ‘meta-analysis’ was coined by Gene Glass in the mid-1970s(Glass 1976; Smith & Glass 1977; Glass et al . 1981), and encompasses avariety of methods and techniques for quantitatively synthesising research
findings, namely effect size estimates (Cooper & Hedges 1994; Hunter &Schmidt 2004). It thus can be described as a set of quantitative methodsand procedures for synthesising research results to assess the ‘true’ valueof an experimental effect or of an association between variables. The brief overview of the meta-analytic procedure employed in the current researchis based on the Hedges and Olkin (1985) meta-analysis framework (seealso Cooper & Hedges 1994; Lipsey & Wilson 2001).
As in our case, meta-analytic techniques are used to study potentialdifferences in response rates between web and other modes of datacollection. The procedure starts with a comprehensive collection of eligiblepapers, reports and presentations using computer databases and
Web surveys versus other survey modes

7/30/2019 Web Surveys Versus Other Survey Modes
http://slidepdf.com/reader/full/web-surveys-versus-other-survey-modes 7/27
bibliographical references. These individual studies, or primary studies, arethen used to extract the information to derive the effect size of interest. For
instance, response and non-response counts for different survey modes areextracted to compute response rate differences (which is the effect sizemeasure in our case). Further, the primary studies’ characteristics assumedto influence the effect size measure of interest (i.e. moderators such as thetype of sample, or information as to whether or not incentives wereemployed) are also coded. Sometimes primary studies carry more than onecomparison of interest, resulting in a larger number of effect sizes thanstudies.
Effect size measures of primary studies are then aggregated to estimate
the ‘true’ effect in the population of studies under certain distributionalassumptions (see, for example, Hedges and Vevea (1998) for an overviewand discussion). In the simplest class of models – the so-called fixed-effectsmodels – it is assumed that the only variation in primary studies’ effectsizes is due to (subject-level) sampling error alone. Fixed-effects models areapplicable if one is interested in estimating the mean effect size for a givenset of available studies. Strictly speaking, fixed-effect models allowinferences only for the collection of studies included in the meta-analysisand say nothing about other studies that may be done later, could have
been done earlier, or may have already been done but are not includedamong the observed studies. However, in most research contexts adifferent inference goal is pursued, namely to make inferences that embodyan explicit generalisation beyond the observed studies (i.e. about theparameters of a population of studies that are larger than the set of observed studies). Random-effects analysis procedures, representing thesecond class of models, are designed to facilitate such inferences byassuming essential random differences between studies. These modelsaccount for the fact that, in addition to sampling error, there is a true
random variation in effect sizes between studies. In random-effects models,the random component of effect size variation is calculated andincorporated into the summary statistics. Because our inference goal is tomake inferences going beyond the studies included, our analysis will bebased on the random-effects model.
In all modern meta-analytic procedures, the estimated true effect size isa weighted central tendency function of the primary studies’ effect sizes toaccount for subject-level sampling error and the additional between-studies random variance component. Generally speaking, the larger thesample in primary studies, the more precise the effect size estimates. Andthe more precise these estimates are, the more they are weighted when
International Journal of Market Research Vol. 50 Issue 1

7/30/2019 Web Surveys Versus Other Survey Modes
http://slidepdf.com/reader/full/web-surveys-versus-other-survey-modes 8/27
aggregated to get an accurate estimate of the effect in the population of studies.
To determine whether the effect sizes in primary studies to be aggregatedare actually from the same population of studies, a homogeneity test – theso-called Q-Test (see, for example, Lipsey and Wilson 2001, pp. 115ff) –is performed. If the homogeneity assumption must be rejected, moderatoranalyses with coded study descriptors are conducted to estimate theinfluence of these factors on the effect size distribution (i.e. theheterogeneity of effect sizes). For instance, one might find out that themoderator variable ‘type of survey sponsor’ is systematically related to theresponse rate differences. In such a case, effect sizes will prove
heterogeneous between the moderator categories ‘academic sponsor’,‘commercial sponsor’ etc., as reflected in a significant Q
B-Test (Q forbetween categories), and ideally homogeneous within these categories.
Following this brief introduction, we now describe the methodsemployed in more detail, starting with the criteria followed to decidewhich studies to include in the meta-analysis. We then turn to a descriptionof the literature search strategy, the coding procedure and the statisticalmethods used under a random-effects distributional assumption.
Eligibility criteria and literature search
In general, we sought to maximise internal validity by isolating the impactof the survey mode from other causes on the response rate difference of interest. Accordingly, only those studies meeting the following criteriawere included.
1. One of the survey modes used should be a web-based survey (i.e. asurvey where a survey questionnaire on the web was used to gather
responses from respondents).2. The web-based survey should be compared to data from one or moreother survey modes (e.g. email survey, mail survey, telephone survey,face-to-face survey, fax survey).
3. Data on response rates from the web and the other survey mode(s)should be available.
4. A split-sample experimental design must have been employed withsubjects from the same population being randomly assigned todifferent modes.
5. Subjects should have remained in the mode they were randomly assignedto. In other words, studies where subjects were permitted to switch
Web surveys versus other survey modes
7/30/2019 Web Surveys Versus Other Survey Modes
http://slidepdf.com/reader/full/web-surveys-versus-other-survey-modes 9/27
modes were not eligible for inclusion; or, for those studies where sub-jects were assigned to another mode in the following phases of the
survey process, only the results up to this change are taken into account.6. The implementation of the compared modes should be as similar as
possible, with the only difference being in the mode used foranswering the survey questionnaire. For example, comparisons whereunequal incentives were used were excluded.
The last three criteria in particular – the random assignment of subjects tomodes, the retention within this mode, and comparable implementationprocedures – are crucial to isolate the impact of the survey mode from
other factors.Primary studies of interest were identified through a comprehensive
literature search. The sources for collecting cases were:
• a search through bibliography entries on the WebSM site athttp://www.websm.org (a website dedicated to the methodology of web surveys, whose bibliography database includes more than 2000entries – Lozar Manfreda & Vehovar 2006)
• a search using keywords1 in online literature databases (ScienceDirect
at http://www.sciencedirect.com, ISI Web of Knowledge at http:// isiwebofknowledge.com, Directory of Open Access Journals athttp://www.doaj.org/, EBSCOhost at http://search.ebscohost.com/,Emerald at http://www.emeraldinsight.com/, Ingenta select at http:// www.ingentaselect.com/, LookSmart’s FindArticles at http://articles.findarticles.com, The Internet Public Library at http://www.ipl.org/ div/serials/, Kluwer Online Journals at http://journals.kluweronline.com/, Proquest at http://www.umi.com/proquest)
• a review of papers in relevant journals in the survey methodology field
for the 1995–2005 period• a call for papers in online discussion lists relevant to survey methodo-logists (Elmar, German Online Research discussion list , SRMSNET list , Aoir)
• a call for papers on the WebSM site at http://www.websm.org• a search of the references of collected papers (references of each
bibliographical unit obtained using the above means were checked inorder to find additional relevant studies).
International Journal of Market Research Vol. 50 Issue 1
1 Very general keywords were used in order not to miss any study using a web survey. Thus ‘web survey’, ‘internet
survey’, ‘online survey’, ‘web-based survey’, ‘internet-based survey’, ‘electronic survey’ were all used. The authorsof this paper then selected the mode-comparison studies out of the listed hits by checking the papers’ abstracts.

7/30/2019 Web Surveys Versus Other Survey Modes
http://slidepdf.com/reader/full/web-surveys-versus-other-survey-modes 10/27
Coding
To calculate our effect size measure, namely response rate differences, raw
frequencies (i.e. the number of invited and eligible subjects and the numberof respondents per mode) were used. The effective initial frequencies weremost often calculated as the initial sample size minus undeliverables andnon-eligible units. In some cases, insufficient data were provided to use theabove definition of response rate. In these cases we simply used theauthors’ definition of response rates as defined in the paper. Since, for bothcompared modes, the definition of response rates was the same, such anapproach was nevertheless found to be adequate.
As possible moderator variables, i.e. those expected to influence the
magnitude of observed response rate differences, the following categoricalinformation was coded:
1. type of mode to which the respective web survey was compared :mail, email, telephone, fax, and other (e.g. IVR, touch-tone)
2. sample recruitment strategy: panel vs one-time recruitment for thestudy reported
3. type of the target population: students, employees/members of anorganisation, general population, and other (e.g. customers,
business respondents in an institutional survey)4. sponsorship: academic, government (local, state), commercial5–7. implementation procedures for the web mode: (5) contact mode for
the web survey main contact2 (mail, email, other); (6) incentives(used or not used); and (7) number of contacts (from 1 to 5,including pre-notification, main contact, follow-ups).
In addition to these seven categorical variables, the (8) year study wasconducted was coded as a continuous variable.
It should be stressed that, except for the fifth moderator mentionedabove (contact mode for the web survey main contact), all othermoderators were applicable both to the web and the correspondingcomparison mode. While the respective moderator parameter value isidentical within one comparison (i.e. in one specific case; does not applyto the fifth moderator as detailed above), the variability on the moderatorvariable(s) between the comparisons included may affect response ratedifferences. For instance, the use vs non-use of incentives might portray a
Web surveys versus other survey modes
2 If different modes were used for different contacts (e.g. email for pre-notification, mail for the main contact withan invitation to the survey, email for follow-ups), the mode for the main contact was coded.

7/30/2019 Web Surveys Versus Other Survey Modes
http://slidepdf.com/reader/full/web-surveys-versus-other-survey-modes 11/27
different picture of whether (and how large) the differences in responserates are between web-based and other surveys.
The coding of the papers was carried out twice, by two authors of thispaper, based on an initial coding scheme that was formatively improvedduring the coding process. In cases where the authors undertaking thecoding initially did not agree regarding the assigned code(s), an agreementwas achieved during their discussion. No measures of coding reliabilitywere thus assessed since only relatively straight factual informationregarding primary studies had been coded and disagreements wereimmediately corrected. When needed, the authors of the primary paperswere contacted to obtain additional information.
Statistical analysis procedure
Because the statistical methods used are extensively documented in meta-analysis textbooks (e.g. Lipsey & Wilson 2001) and in the technical partsof the meta-analytical software package used (MetaWin Version 2;Rosenberg et al . 2000), we will outline only briefly the four steps followed.
First, the mean response difference across all studies was computed byaveraging all individual effect sizes weighted by an inverse variance
component encompassing: (1) subject-level sampling error variance; and(2) an estimate of between-study variance as recommended by Hedges andOlkin (1985).
In the second step, it was determined whether the estimated populationeffect size is statistically different from zero by computing the 95%confidence interval around it. Then, a homogeneity analysis wasperformed to assess whether the effect sizes are from the same populationof studies. All these analyses were conducted under the random-effectsdistributional assumption. In view of our inference goal aimed at
generalising beyond the studies included, and since the random-effectsmodel is less prone to Type I errors compared to the fixed-effect approach(Hedges & Vevea 1998), the random-effects distributional assumption wasdeemed appropriate. In the final step, separate moderator analyses wereperformed for seven categorical variables and one continuous variable.
International Journal of Market Research Vol. 50 Issue 1

7/30/2019 Web Surveys Versus Other Survey Modes
http://slidepdf.com/reader/full/web-surveys-versus-other-survey-modes 12/27
Results
Primary studies identified
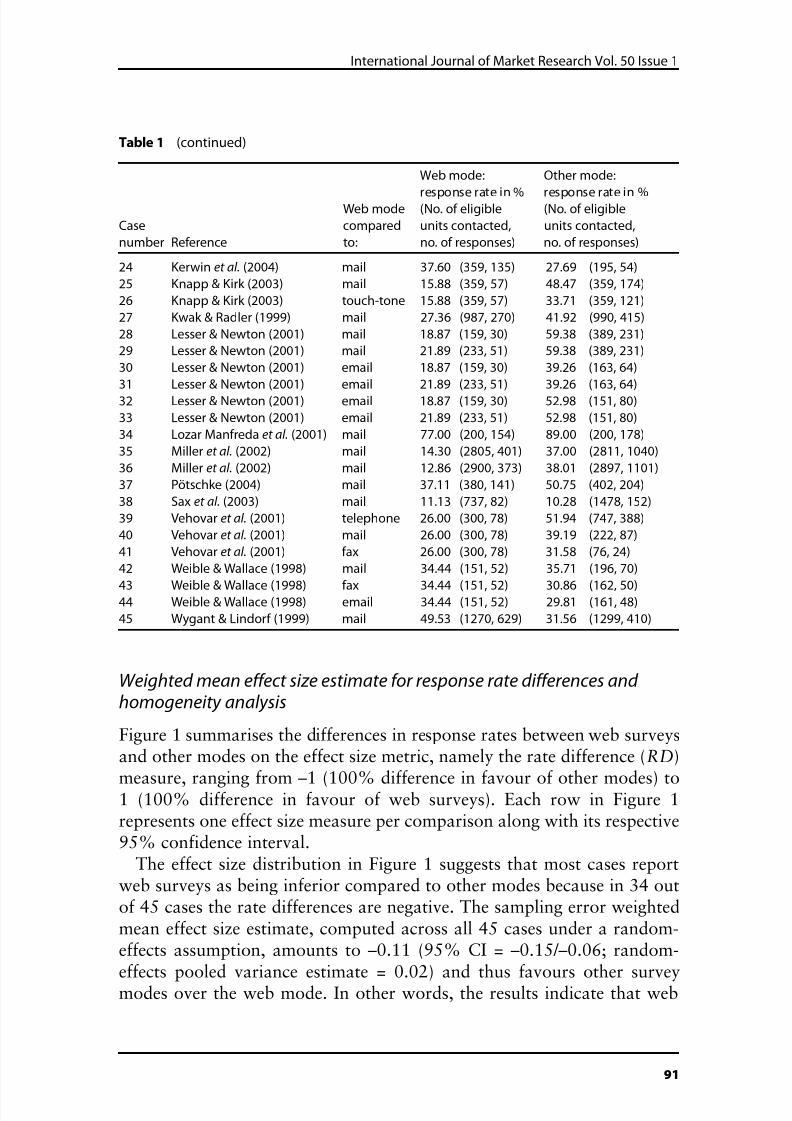
Following our search strategy and eligibility criteria described above, weidentified 24 papers reporting comparisons of response rates of web andalternative survey modes using split-sample experimental designs. Somepapers contained more than one comparison of interest, resulting in45 pairs of survey mode comparisons (cases). In these cases, the web modewas compared to the following survey modes: mail (27 cases), email(8 cases), fax (3 cases), telephone (5 cases) and IVR and touch-tone dataentry (1 case each).
Table 1 contains a summary of the experimental comparisons includedin the meta-analysis, with the corresponding counts and response rates forthe different modes.
Web surveys versus other survey modes
Table 1 Summary of the 24 papers and 45 cases included in the meta-analysis
Web mode: Other mode:
response rate in % response rate in %
Web mode (No. of eligible (No. of eligible
Case compared units contacted, units contacted,
number Reference to: no. of responses) no. of responses)
1 Bason (2000) telephone 15.50 (742, 115) 23.98 (674, 161)
2 Bason (2000) mail 15.50 (742, 115) 27.76 (735 204)
3 Bason (2000) IVR 15.50 (742, 115) 17.39 (736, 128)
4 Bates (2001) mail 55.70 (1571, 875) 44.23 (1569, 694)
5 Chatt & Dennis (2003) telephone 82.13 (3627, 2979) 62.89 (477, 300)
6 Chisholm (1998) email 24.00 (300, 72) 30.00 (300, 90)
7 Cobanoglu et al. (2001) mail 44.21 (95, 42) 26.26 (99, 26)
8 Cobanoglu et al. (2001) fax 44.21 (95, 42) 17.00 (100, 17)
9 Crawford et al. (2001) mail 63.00 (3500, 2205) 52.00 (3500, 1820)
10 Elder & Incalcatera (2000) mail 37.39 (690, 258) 54.26 (693, 376)
11 Fraze et al. (2002) mail 43.16 (95, 41) 60.00 95, 57
12 Fraze et al. (2002) email 43.16 (95, 41) 27.37 (95, 26)13 Fricker et al. (2003) telephone 51.61 (1058, 546) 97.43 (544, 530)
14 Grigorian et al. (2004) telephone 61.88 (1941, 1201) 66.82 1941, 1297
15 Grigorian et al. (2004) mail 61.88 (1941, 1201) 78.00 (27,982, 21,826)
16 Hayslett & Wildemuth (2004) mail 28.00 (100, 28) 51.00 (100, 51)
17 Hayslett & Wildemuth (2004) mail 39.00 (100, 39) 51.00 (100, 51)
18 Jones & Pitt (1999) mail 18.50 (200, 37) 72.00 (100, 72)
19 Jones & Pitt (1999) email 18.50 (200, 37) 34.00 (200, 68)
20 Kaplowitz et al. (2004) mail 20.70 (4440, 919) 31.50 (2594, 817)
21 Kaplowitz et al. (2004) mail 25.40 (4351, 1105) 31.50 (2594, 817)
22 Kaplowitz et al. (2004) mail 29.70 (4327, 1285) 31.50 (2594, 817)
23 Kaplowitz et al. (2004) mail 28.60 (4178, 1195) 31.50 (2594, 817)
(continued)
7/30/2019 Web Surveys Versus Other Survey Modes
http://slidepdf.com/reader/full/web-surveys-versus-other-survey-modes 13/27
Weighted mean effect size estimate for response rate differences and homogeneity analysis
Figure 1 summarises the differences in response rates between web surveysand other modes on the effect size metric, namely the rate difference (RD)
measure, ranging from –1 (100% difference in favour of other modes) to1 (100% difference in favour of web surveys). Each row in Figure 1represents one effect size measure per comparison along with its respective95% confidence interval.
The effect size distribution in Figure 1 suggests that most cases reportweb surveys as being inferior compared to other modes because in 34 outof 45 cases the rate differences are negative. The sampling error weightedmean effect size estimate, computed across all 45 cases under a random-effects assumption, amounts to –0.11 (95% CI = –0.15/–0.06; random-effects pooled variance estimate = 0.02) and thus favours other surveymodes over the web mode. In other words, the results indicate that web
International Journal of Market Research Vol. 50 Issue 1
Table 1 (continued)
Web mode: Other mode:
response rate in % response rate in %Web mode (No. of eligible (No. of eligible
Case compared units contacted, units contacted,
number Reference to: no. of responses) no. of responses)
24 Kerwin et al. (2004) mail 37.60 (359, 135) 27.69 (195, 54)
25 Knapp & Kirk (2003) mail 15.88 (359, 57) 48.47 (359, 174)
26 Knapp & Kirk (2003) touch-tone 15.88 (359, 57) 33.71 (359, 121)
27 Kwak & Radler (1999) mail 27.36 (987, 270) 41.92 (990, 415)
28 Lesser & Newton (2001) mail 18.87 (159, 30) 59.38 (389, 231)
29 Lesser & Newton (2001) mail 21.89 (233, 51) 59.38 (389, 231)
30 Lesser & Newton (2001) email 18.87 (159, 30) 39.26 (163, 64)
31 Lesser & Newton (2001) email 21.89 (233, 51) 39.26 (163, 64)
32 Lesser & Newton (2001) email 18.87 (159, 30) 52.98 (151, 80)
33 Lesser & Newton (2001) email 21.89 (233, 51) 52.98 (151, 80)
34 Lozar Manfreda et al. (2001) mail 77.00 (200, 154) 89.00 (200, 178)
35 Miller et al. (2002) mail 14.30 (2805, 401) 37.00 (2811, 1040)
36 Miller et al. (2002) mail 12.86 (2900, 373) 38.01 (2897, 1101)
37 Pötschke (2004) mail 37.11 (380, 141) 50.75 (402, 204)
38 Sax et al. (2003) mail 11.13 (737, 82) 10.28 (1478, 152)
39 Vehovar et al. (2001) telephone 26.00 (300, 78) 51.94 (747, 388)
40 Vehovar et al. (2001) mail 26.00 (300, 78) 39.19 (222, 87)
41 Vehovar et al. (2001) fax 26.00 (300, 78) 31.58 (76, 24)
42 Weible & Wallace (1998) mail 34.44 (151, 52) 35.71 (196, 70)
43 Weible & Wallace (1998) fax 34.44 (151, 52) 30.86 (162, 50)44 Weible & Wallace (1998) email 34.44 (151, 52) 29.81 (161, 48)
45 Wygant & Lindorf (1999) mail 49.53 (1270, 629) 31.56 (1299, 410)

7/30/2019 Web Surveys Versus Other Survey Modes
http://slidepdf.com/reader/full/web-surveys-versus-other-survey-modes 14/27
Web surveys versus other survey modes
F i g
u r e
1
D i s t r i b u t i o n o f e f f e c t s i z e s
( r e s p o n s e r a t e d i f f e r e n c e s ,
R D ) a n d t h e i r 9 5 % c
o n f i d e n c e i n t e r v a l s
( b a s e d o n 4 5 c o m p a r i s o n s b e t w e e n w e b
s u r v e y a n d o t h e r s u r v e y m o d e s ; s t u
d y n u m b e r s c o r r e s p o n d t o t h o s e
r e p o r t e d i n T a b l e 1 )
– 0 . 3
8
– 0 . 1
2
0 . 1
4
0 . 4
0
R D
– 0 . 6
4
1 8 1 3
2 8
2 9
3 2
2 5
3 3
3 9
3 6
1 6
3 5
3 0
2 6
3 1
1 0
1 1
1 5
1 9
2 7
3 7
4 0
2
3 4
1 7
2 0
G r a n d
m e a n
1 2 1
6
4 1
1 4
2 3
3
2 2
4 2
3 8
4 3
4 4
2 4
9
4
1 2
7
4 5
5
8

7/30/2019 Web Surveys Versus Other Survey Modes
http://slidepdf.com/reader/full/web-surveys-versus-other-survey-modes 15/27
surveys yield a lower response rate of about 11% on average compared toother modes, with a 95% confidence interval confined by the 15%
response rate difference as the upper limit, and 6% as the lower limit. Thisfinding corroborates H1, stating that web surveys are associated withlower response rates compared to other survey modes.
A homogeneity analysis revealed a non-significant Q-score of 59.89 (df = 44, p = 0.06), suggesting the homogeneity of the effect size distributionunder the random-effects assumption. However, because of the Q-testbeing marginally non-significant and the fact that the power of the Q-testtends to be low in the circumstances of our study, namely a relatively lownumber of cases synthesised, we will nevertheless investigate whether mod-
erators influence response rate differences. Before doing so, two questionsregarding the validity of the findings will be addressed. First, is the meanresponse rate difference estimate substantially influenced by publicationbias? Second, how robust is the result if dependencies among a subset of the 45 cases, i.e. those reported within the same paper, are removed?
Publication bias and sensitivity analysis
To determine the degree of bias possibly introduced by the selective
publication of studies, the computational approach proposed by Rosenthal(1979), and the graphical method proposed by Wang and Bushman (1998)were employed.
The method proposed by Rosenthal (1979) computes the number of non-significant, unpublished or missing studies that would need to beadded to a meta-analysis in order to change the results of the meta-analysisfrom significance to non-significance. This ‘fail-safe-N ’ number, computedaccording to Rosenthal (1979), amounts to 321.4 in our case, meaningthat at least 321 non-significant experiments are needed to invalidate our
findings. Because this number is deemed large compared to the number of studies included (45), it is felt that the observed result can be regardedfairly confidently as a reliable estimate of the true effect.
In addition, plotting the quantiles of the effect size distribution againstthe quantiles of the normal distribution as suggested by Wang andBushman (1998) does not give rise to concerns regarding a possiblepublication bias (see Figure 2).
The cases do not deviate substantially from linearity, nor are anysuspicious gaps in the plot visible. As outlined and discussed by Wang andBushman (1998), these two characteristics, which appear absent in ourcase, would suggest the presence of publication bias in the data.
International Journal of Market Research Vol. 50 Issue 1

7/30/2019 Web Surveys Versus Other Survey Modes
http://slidepdf.com/reader/full/web-surveys-versus-other-survey-modes 16/27
Web surveys versus other survey modes
F i g u r e
2
N o r m a l q u a n t i l e p l o t t o d e t e c t a n y p u b l i c a t i o n b i a s ( b a s e d o
n 4 5 c o m p a r i s o n s b e t w e e n w e b s u r v e y a n d o t h e r s u r v e y m o d e s ; s
t u d y
n u m
b e r s c o r r e s
o n d t o t h o s e r e
o r t
e d i n T a b l e 1
N o r m a l q u a n t i l e
0 . 0
0
– 1 . 1
4
1 . 1
4
2 . 2
9
– 2 . 2
9
9 . 4
3
0 . 2
5
– 8 . 9
3
– 1 8 . 1
0
– 2 7 . 2
8
S t a n d a r i s e d e f f e c t s i z e
1
2
3
4
5
6
7
8
9
1 0
1 1
1 2
1 3
1 4
1 5
1 6
1 7
1 8
1 9
2 0
2 1
2 2
2 3
2 4
2 5
2 6
2 7
2 8
2 9
3 0
3 1
3 2
3 3
3 4
3 5
3 6
3 7
3 8
3 9
4 0
4 1
4 2
4 3
4 4
4 5

7/30/2019 Web Surveys Versus Other Survey Modes
http://slidepdf.com/reader/full/web-surveys-versus-other-survey-modes 17/27
All previous analyses were based on 45 effect sizes; some of them werereported in the same paper and may therefore share unique characteristics
(see also Table 1), biasing the overall results. To explore the robustness of results for independent effect sizes compared to the previously reporteddependent ones, we averaged dependent cases into one single response rateestimate per paper and calculated the mean response rate difference for theremaining 24 paper-level comparisons. The resulting average response ratedifference amounts to –0.09 and is therefore slightly lower compared tothe estimate based on 45 cases (amounting to –0.11). As can be expectedin view of the smaller number of effect sizes included, the confidenceinterval around the mean response rate difference estimate gets larger
(95% CI = –0.16/–0.02; random-effects pooled variance estimate = 0.03).However, the overall result is still in favour of other survey modescompared to the web mode and can therefore be regarded as fairly robust.
Moderator analyses
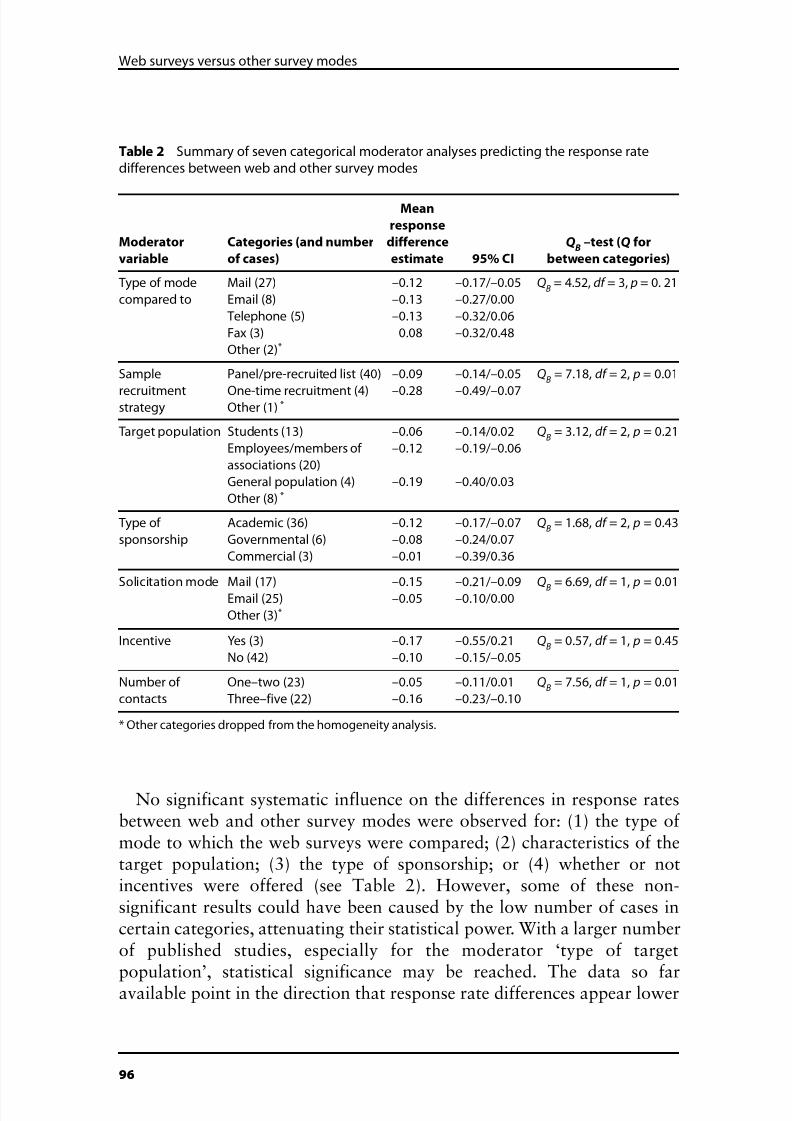
In Table 2 the results of seven separate analyses are presented,investigating the influence of categorical moderators on the response ratedifferences between the web survey and other modes.
As indicated in Table 2, for three out of seven categorical moderators,significant differences could be ascertained. Specifically, whether thesample consisted of panel members or respondents recruited just for onesingle study led to significant response rate differences (see the row‘Sample recruitment strategy’ in Table 2). For panel members, the averageresponse difference amounted to 9% to the disadvantage of the web mode.For one-time recruited subjects, this difference grew to 28%.
A second influential moderator is the mode of solicitation: if initiallyrequested by postal mail to participate, web surveys lead to a 15% lower
response rate. If requested by email, this figure shrinks to an average 5%difference.The third moderator significantly influencing response rate differences is
the number of contacts used. Because of the low number of cases, wecollapsed this moderator to two categories (category 1: one or twocontacts; category 2: three, four or five contacts; see Table 2). The resultssuggest that, by increasing the number of contacts, the difference betweenweb and other survey modes gets larger, namely from about 5% to thedisadvantage for the web mode (for one to two contacts) to 16% onaverage (for three to five contacts).
International Journal of Market Research Vol. 50 Issue 1
7/30/2019 Web Surveys Versus Other Survey Modes
http://slidepdf.com/reader/full/web-surveys-versus-other-survey-modes 18/27
No significant systematic influence on the differences in response ratesbetween web and other survey modes were observed for: (1) the type of mode to which the web surveys were compared; (2) characteristics of thetarget population; (3) the type of sponsorship; or (4) whether or notincentives were offered (see Table 2). However, some of these non-significant results could have been caused by the low number of cases incertain categories, attenuating their statistical power. With a larger numberof published studies, especially for the moderator ‘type of targetpopulation’, statistical significance may be reached. The data so faravailable point in the direction that response rate differences appear lower
Web surveys versus other survey modes
Table 2 Summary of seven categorical moderator analyses predicting the response ratedifferences between web and other survey modes
Moderator
variable
Categories (and number
of cases)
Mean
response
difference
estimate 95% CI
QB
–test (Q for
between categories)
Type of mode
compared to
Mail (27)
Email (8)
Telephone (5)
Fax (3)
Other (2)*
–0.12
–0.13
–0.13
0.08
–0.17/–0.05
–0.27/0.00
–0.32/0.06
–0.32/0.48
QB
= 4.52, df = 3, p = 0. 21
Sample
recruitmentstrategy
Panel/pre-recruited list (40)
One-time recruitment (4)Other (1) *
–0.09
–0.28
–0.14/–0.05
–0.49/–0.07
QB
= 7.18, df = 2, p = 0.01
Target population Students (13)
Employees/members of
associations (20)
General population (4)
Other (8) *
–0.06
–0.12
–0.19
–0.14/0.02
–0.19/–0.06
–0.40/0.03
QB
= 3.12, df = 2, p = 0.21
Type of
sponsorship
Academic (36)
Governmental (6)
Commercial (3)
–0.12
–0.08
–0.01
–0.17/–0.07
–0.24/0.07
–0.39/0.36
QB
= 1.68, df = 2, p = 0.43
Solicitation mode Mail (17)
Email (25)
Other (3)*
–0.15
–0.05
–0.21/–0.09
–0.10/0.00
QB
= 6.69, df = 1, p = 0.01
Incentive Yes (3)
No (42)
–0.17
–0.10
–0.55/0.21
–0.15/–0.05
QB
= 0.57, df = 1, p = 0.45
Number of
contacts
One–two (23)
Three–five (22)
–0.05
–0.16
–0.11/0.01
–0.23/–0.10
QB
= 7.56, df = 1, p = 0.01
* Other categories dropped from the homogeneity analysis.

7/30/2019 Web Surveys Versus Other Survey Modes
http://slidepdf.com/reader/full/web-surveys-versus-other-survey-modes 19/27
for student samples and larger for employees, members of professionalassociations, and the general public.
Last but not least, we performed a meta-regression for the onlycontinuous moderator in our study (the year the study was conducted) andfound no significant influence on response rate differences between theweb and other survey modes (B = 0.01, SE(B) = 0.01, p = 0.41; Qregression
= 0.67, df = 1, p = 0.42).
Summary and conclusions
This research synthesis – based on 45 comparisons between web survey
response rates with other modes – showed that on average web surveysyield an 11% lower response rate compared to other modes. Despite themoderate number of available experimental mode comparisons to date,this result does not appear to be due to publication bias or systematicdependencies among sets of cases reported within the same paper.
The estimated response rate difference could aid methodologists andpractitioners in a number of ways. First, because non-response isdemonstrably higher for web surveys in most cases, compared to othermodes non-response bias appears to be an even larger concern for web
surveys. If there are reasons to believe that this non-response ratedifference could substantially bias the conclusions to be made, aninformed decision about the appropriate mode can be made. However,when discussing this a researcher should also take into account not just thedifference in the response rate but also the absolute response rate. Forexample, a 60% response rate achieved with a web survey may be very‘acceptable’ (although this is often a judgement based on a particularindividual case) even if it is lower than a 75% response rate using anothermode. Second, besides non-response error, the precision of estimated
parameters will be lower in most cases for web surveys compared to othermodes (keeping everything else – including the initial sample size – otherthan the mode constant). Therefore, the initial number of subjects needs tobe higher to achieve the same precision. However, this may not necessarilybe a problem since in web surveys larger samples can be used for the samecost. Last but not least, the results point in the direction that incomparable conditions (e.g. when comparing web to other survey modesgiven the same incentives, the same number of contacts) the web yieldslower response rates than most other modes. However, one might arguethat the web requires different methods and procedures to reduce non-response levels and could therewith generate data of the same or even
International Journal of Market Research Vol. 50 Issue 1
7/30/2019 Web Surveys Versus Other Survey Modes
http://slidepdf.com/reader/full/web-surveys-versus-other-survey-modes 20/27
better quality. Exploring such mode-congruent methods and proceduresresulting in high-quality survey data should be an issue for further
research. In addition, since it is usually cheaper to conduct a web survey,several additional measures for reducing non-response can be used in theweb mode but not for some other mode within the same available budget.In this paper we did not actually take into account the costs of thecompared modes and these comparisons are somehow not fair to the webmode. In web surveys which are usually cheaper we could invest morefunds into procedures for increasing response rates – and this would be afair basis for comparison – what might significantly change the differencein response rates.
Besides the mean average response rate difference, this researchsynthesis revealed the influence of moderators. The difference is lower forpanel members compared to one-time respondents, most probably becausepre-recruited subjects have the technical resources, skills and experience toparticipate in web surveys and regard this mode as less burdensome. Froman applied perspective, mode differences in terms of response rates shouldbe a concern for those doing one-time surveys, but much less compared tothose conducting online access panel-based research. Further, thesolicitation mode appears to play some role in the sense that the
differences get larger for postal mail solicitation compared to emailcontacts. One reason might be that it is much easier to complete a websurvey when requested by email compared to the burdensome process of switching from a mailed request to the internet. Given that mostcomparisons were web vs mail surveys, respondents seem to prefer thesame mode for conducting a survey in which they were also contacted. Athird, and in our view surprising, moderator was the number of contacts:the more contacts, the larger the difference in response rates between weband other modes. In other words, the effectiveness of the number of
contacts is curbed for web surveys, an alarming result not only forpractitioners. There might be various reasons for this effect that could beexplored in further detail by survey methodologists, such as the wayrepeated requests are perceived for different modes, the way researchsubjects feel obliged to comply with requests conditional upon the mode,and others. It may be possible that respondents in web surveys actuallyclassify non-response reminders (especially if they are sent by email) asintrusive, and perceive the survey request as something similar to spam.Multiple email reminders may reach an early saturation point, resulting inresistant, non-compliant behaviour (Kittleson 1997). And this may bedifferent in conventional survey modes, where multiple contacts are
Web surveys versus other survey modes

7/30/2019 Web Surveys Versus Other Survey Modes
http://slidepdf.com/reader/full/web-surveys-versus-other-survey-modes 21/27
actually the general rule for improving response rates (Dillman 2000). Inthese traditional modes, the researcher’s ‘investment’ in multiple contacts
stresses the importance and legitimacy of the study and therefore positivelyinfluences survey participation.
Besides the three influential moderators, other characteristics obviouslydo not affect response rate differences. The type of mode to which websurveys are compared, the type of target population, the type of sponsorship, whether or not incentives were offered, and the year of studyare among these variables. These non-significant findings are, in theauthors’ view, at least evenly valuable compared to the significant onessummarised above because they guide researchers and practitioners alike
as to which aspects are not expected to give rise to concern in multi-modesurvey contexts. However, due to the very low number of cases for severalmoderators, these results may change in the future when more primarystudies on the same issue become available. For instance, future studiesmay show that response rate differences are lower for student samples andlarger for employees, members of professional associations and the generalpublic. Such questions may be addressed in cumulative meta-analyses,defined as the procedure of performing new meta-analyses at one or morefuture time points (see, for example, Mullen et al . 2001). In view of the
fact that web surveys have undergone various changes in the last decade,primarily influenced by changes in technology (e.g. more sophisticateddesign options for conducting surveys on the web) and change at thesocietal level (e.g. broader segments of society have adopted the internet),it is to be expected that a cumulative meta-analysis approach will yieldimportant information on the sufficiency and stability of results obtainedover time.
At this point it should again be stressed that the discussion in this paperis limited to non-response rates as an indicator of non-response error. The
authors are aware that a non-response does not necessarily lead to a non-response error, which is a function of the percentage of the sample notresponding to the survey and the differences in the statistics betweenrespondents and non-respondents (Groves 1989, p. 134). The non-response error occurs only if non-respondents, had they responded, wouldhave provided different answers to the survey questions than those whoresponded to the survey. Since this is usually unknown, the response rateis taken as an indicator of survey quality, assuming that a high responseminimises the probability of non-respondents affecting survey results. Thiswas also done in the current paper. However, several studies have shownthat lower response rates do not necessarily increase non-response error
International Journal of Market Research Vol. 50 Issue 1

7/30/2019 Web Surveys Versus Other Survey Modes
http://slidepdf.com/reader/full/web-surveys-versus-other-survey-modes 22/27
(e.g. Groves 2006; Keeter et al . 2000). Therefore, further research on theissue should examine not just the quantitative differences in response rates
of web and other survey modes (as in this paper), but also the qualitativeones (i.e. how similar or different respondents from the compared surveymodes are in terms of key variables and in other aspects of data quality –for example, item non-response, consistency of answers, richness of responses to open-ended questions, speed of answering). If in practice itcan be shown that, on a particular issue, responses from the comparedmodes are similar, the problem of lower response rates in web surveyswould not be as critical. This is particularly true if we take into accountthe smaller amount of resources usually needed to carry out web surveys.
References
Bason, J.J. (2000) Comparing results from telephone mail internet and interactivevoice recognition surveys of drug and alcohol use among University of Georgiastudents. Paper presented at the American Association for Public OpinionResearch 55th Annual Conference, Portland, USA, 17–20 May 2000.
Bates, N. (2001) Internet versus mail as data collection methodology from a highcoverage population. Proceedings of the Annual Meeting of the AmericanStatistical Association, 5–9 August 2001.
Birnholtz, J.P., Horn, D.B., Finholt, T.A. & Bae, S.J. (2004) The effects of cash,electronic, and paper gift certificates as respondent incentives for a web-basedsurvey of a technologically sophisticated sample. Social Science Computer Review,22, 3, pp. 377–384.
Bosnjak, M. & Tuten, T.L. (2003) Prepaid and promised incentives in web surveys –an experiment. Social Science Computer Review, 21, 2, pp. 208–217.
Braithwaite, D., Emery, J., de Lusignan, S. & Sutton, S. (2003) Using the internet toconduct surveys of health professionals: a valid alternative? Family Practice, 20, 5,pp. 545–551.
Chatt, C. & Dennis, J.M. (2003) Data collection mode effects controlling for sampleorigins in a panel survey: telephone versus internet. Paper presented at the 2003
Annual Meeting of the Midwest Chapter of the American Association for PublicOpinion Research, Chicago, USA.
Chisholm, J. (1998) Using the internet to measure and increase customer satisfactionand loyalty. White paper by CustomerSat.com.
Cobanoglu, C., Warde, B. & Moreo, P.J. (2001) A comparison of mail, fax, andweb-based survey methods. International Journal of Market Research, 43, 4,pp. 441–452.
Cooper, H. & Hedges, L.V. (1994) The Handbook of Research Synthesis. NewYork: Russel Sage Foundation.
Couper, M.P. (2000) Web surveys: a review of issues and approaches. PublicOpinion Quarterly, 64, 4, pp. 464–494.
Web surveys versus other survey modes

7/30/2019 Web Surveys Versus Other Survey Modes
http://slidepdf.com/reader/full/web-surveys-versus-other-survey-modes 23/27
Crawford, S., McCabe, S., Couper, M. & Boyd, C. (2001) From mail to web:improving response rates and data collection efficiencies. Paper presented at theInternational Conference on Improving Surveys, Copenhagen, Denmark.
de Leeuw, E. & de Heer, W. (2002) Trends in household survey nonresponse: alongitudinal and international comparison. In: R.M. Groves, D.A. Dillman, J.L.Eltinge & R.J.A Little (eds) Survey Nonresponse. New York: Wiley, pp. 41–54.
Dillman, D.A. (2000) Mail and Internet Surveys. The Tailored Design Method . NewYork: Wiley.
Elder, A. & Incalcatera, T. (2000) Pushing the envelope: moving a major syndicatedstudy to the web. Paper presented at the Net Effects 3 Conference, Dublin,Ireland.
Evans, J.R. & Mathur, A. (2005) The value of online surveys. Internet Research, 15,2, pp. 195–219.
Fraze, S., Hardin, K., Brashears, T., Smith, J.H. & Lockaby, J. (2002) The effects of delivery mode upon survey response rate and perceived attitudes of Texas agri-science teachers. Paper presented at the National Agricultural Education ResearchConference, Las Vegas, USA.
Frick, A., Bächtiger, M.T. & Reips, U.-D. (1999) Financial incentives, personalinformation and drop-out rate in online studies. In: U.-D. Reips, B. Batinic, W.Bandilla, M. Bosnjak, L. Gräf, K. Moser & A.A. Werner (eds) Current internetscience – trends, techniques, results. Aktuelle Online Forschung – Trends,Techniken, Ergebnisse. Zurich: Online Press. Retrieved fromhttp://dgof.de/tband99/.
Fricker, S., Galešič, M., Tourangeau, R. & Yan, T. (2003) An experimental
comparison of web and telephone surveys. Working paper.Glass, G.V. (1976) Primary, secondary, and meta-analysis of research. Educational Researcher, 5, 10, pp. 3–8.
Glass, G.V., McGaw, B. & Smith, M.L. (1981) Meta-Analysis in Social Research.London: Sage.
Grigorian, K.H., Sederstrom, S. & Hoffer, T.B. (2004) Web of intrigue? Evaluatingeffects on response rates of between web SAQ, CATI, and mail SAQ options in anational panel survey. Paper presented at the American Association for PublicOpinion Research 59th Annual Conference, Phoenix, USA.
Groves, R.M. (1989) Survey Errors and Survey Costs. New York: Wiley.Groves, R.M. (2006) Nonresponse rates and nonresponse bias in household surveys.
Public Opinion Quarterly, 70, 5, pp. 646–675.Groves, R.M., Cialdini, R.B. & Couper, M.P. (1992) Understanding the decision to
participate in a survey. Public Opinion Quarterly, 56, 4, pp. 475–495.Hayslett, M.M. & Wildemuth, B.M. (2004) Pixels or pencils? The relative
effectiveness of web-based versus paper surveys. Library & Information ScienceResearch, 26, 1, pp. 73–93.
Hedges, L.V. & Olkin, I. (1985) Statistical Methods for Meta-Analysis. San Diego:Academic Press.
Hedges, L.V. & Vevea, J.L. (1998) Fixed- and random-effects models in meta-analysis. Psychological Methods, 3, 4, pp. 486–504.
Hunter, J.E. & Schmidt, F.L. (2004) Methods of Meta-Analysis: Correcting Error
and Bias in Research Findings. Newbury Park: Sage Publications.
International Journal of Market Research Vol. 50 Issue 1

7/30/2019 Web Surveys Versus Other Survey Modes
http://slidepdf.com/reader/full/web-surveys-versus-other-survey-modes 24/27
Jones, R. & Pitt, N. (1999) Health surveys in the workplace: comparison of postal,email and world wide web methods. Occupational Medicine, 49, 8, pp. 556–558.
Kaplowitz, M.D., Hadlock, T.D. & Levine, R. (2004) A comparison of web and
mail survey response rates. Public Opinion Quarterly, 68, 1, pp. 94–101.Keeter, S., Miller, K., Kohut, A., Groves, R.M. & Presser, S. (2000) Consequences of
reducing nonresponse in a national telephone survey. Public Opinion Quarterly,64, 2, pp. 125–148.
Kerwin, J., Brick, P.D., Levin, K., O’Brien, J., Cantor, D., Wang, A., Campbell, S. &Shipp, S. (2004) Web, mail, and mixed-mode data collection in a survey of advanced technology program applicants. Paper presented at the 2004 JointStatistics Meetings, Toronto, Canada.
Kittleson, M.J. (1997) Determining effective follow-up of email surveys. American Journal of Health Behavior, 21, 3, pp. 193–196.
Knapp, F. & Heidingsfelder, M. (2001) Drop-out analysis: effects of the surveydesign. In: U.-D. Reips & M. Bosnjak (eds) Dimensions of Internet Science.Lengerich: Pabst Science Publishers, pp. 221–230.
Knapp, H. & Kirk, S.A. (2003) Using pencil and paper, internet and touch-tonephones for self-administered surveys: does methodology matter? Computers inHuman Behaviour, 19, 1, pp. 117–134.
Kwak, N. & Radler, B.T. (1999) A comparison between mail and web surveys:response pattern, respondent profile, data quality, and construct association. Paperpresented at the annual meeting of Midwest Association of Public OpinionResearch, Chicago, USA.
Lesser, V.M. & Newton, L. (2001) Mail, email and web surveys: a cost and response
rate comparison in a study of undergraduate research activity. Paper presented atthe American Association for Public Opinion Research 56th Annual Conference,Montreal, Canada.
Lipsey, M.W. & Wilson, D.B. (2001) Practical Meta-Analysis. Thousand Oaks: SagePublications.
Lozar Manfreda, K. & Vehovar, V. (2006) Internet surveys. In: J. Hox, E. de Leeuw& D.A. Dillman (eds) The International Handbook of Survey Methodology.Lawrence Erlbaum Associates, New Jersey, USA.
Lozar Manfreda, K., Vehovar, V. & Batagelj, Z. (2001) Web versus mailquestionnaire for an institutional survey. Paper presented at the 2nd ASCInternational Conference on Survey Research Methods: The Challenge of the
Internet, UK.MacElroy, B. (2000) Variables influencing dropout rates in web-based surveys.
Quirk’s Marketing Research Review, July.McNeish, J. (2001) Using the internet for data collection – just because we can,
should we? Paper presented at 2001 AAPOR Annual Conference, Montreal,Canada, 17–20 May.
Miller, T.I., Miller Kobayashi, M., Caldwell, E., Thurston, S. & Collett, B. (2002)Citizen surveys on the web: general population surveys of community opinion.Social Science Computer Review, 20, 2, pp. 124–136.
Mullen, B., Muellerleile, P. & Bryant, B. (2001) Cumulative meta-analysis: aconsideration of indicators of sufficiency and stability. Personality and Social
Psychology Bulletin, 27, 11, pp. 1450–1462.
Web surveys versus other survey modes

7/30/2019 Web Surveys Versus Other Survey Modes
http://slidepdf.com/reader/full/web-surveys-versus-other-survey-modes 25/27
Pineau, V. & Slotwiner, D. (2004) Probability samples vs volunteer respondents ininternet research: defining potential effects on data and decision-making inmarketing applications. Retrieved from Knowledge Networks
(www.knowledgenetworks.com).Pötschke, M. (2004) Paper and pencil or online? Methodological experiences from
an employee survey. Paper presented at the German Online Research Conference(GOR) 2004, Duisburg, Germany.
Rosenberg, M.S., Adams, D.C. & Gurevitch, J. (2000) MetaWin: Statistical Softwarefor Meta-Analysis, Version 2.0. Sunderland: Sinauer Associates.
Rosenthal, R. (1979) The ‘file drawer problem’ and tolerance for null results.Psychological Bulletin, 86, 3, pp. 638–641.
Roster, C.A., Rogers, R.D., Albaurn, G. & Klein, J.D. (2004) A comparison of response characteristics from web and telephone surveys. International Journal of Market Research, 46, 3, pp. 359–373.
Sax, L.J., Gilmartin, S.K. & Bryant, A.N. (2003) Assessing response rates andnonresponse bias in web and paper surveys. Research in Higher Education, 44, 4,pp. 409–432.
Schonlau, M., Elliot, M.N. & Fricker, R.D. (2002) Conducting Research Surveys viaE-mail and the Web. Rand: Santa Monica.
Smith, M.L. & Glass, G.V. (1977) Meta-analysis of psychotherapy outcome studies.American Psychologist , 32, 9, pp. 752–760.
Truell, A.D. (2003) Use of internet tools for survey research. InformationTechnology, Learning and Performance Journal , 21, 1, pp. 31–37.
Tuten, T.L. (1997) Getting a Foot in the Electronic Door: Understanding Why
People Read or Delete Electronic Mail (Rep. No. 97/08). Mannheim: Zentrum fürUmfragen, Methoden und Analysen.Tuten, T.L., Bosnjak, M. & Bandilla, W. (1999/2000) Banner-advertised web
surveys. Marketing Research, 11, 4, pp. 16–21.Tuten, T.L., Galešič, M. & Bosnjak, M. (2004) Effects of immediate versus delayed
notification of prize draw results on response behavior in web surveys: anexperiment. Social Science Computer Review, 22, 3, pp. 377–384.
Tuten, T.L., Urban, D.J. & Bosnjak, M. (2002) Internet surveys and data quality – areview. In: B. Batinic, U.-D. Reips & M. Bosnjak (eds) Online Social Sciences.Seattle, WA: Hogrefe & Huber Publishers, pp. 7–26.
Vehovar, V., Batagelj, Z., Lozar Manfreda, K. & Zaletel, M. (2002) Nonresponse in
web surveys. In: R.M. Groves, D.A. Dillman, J.L. Eltinge & R.J.A. Little (eds)Survey Nonresponse. New York: Wiley, pp. 229–242.
Vehovar, V., Lozar Manfreda, K. & Batagelj, Z. (2001) Sensitivity of e-commercemeasurement to the survey instrument. International Journal of ElectronicCommerce, 6, 1, pp. 31–52.
Wang, M.C. & Bushman, B.J. (1998) Using the normal quantile plot to exploremeta-analytic data sets. Psychological Methods, 3, 1, pp. 46–54.
Weible, R. & Wallace, J. (1998) Cyber research: the impact of the internet on datacollection. Marketing Research, 10, 3, pp. 19–24.
Wygant, S. & Lindorf, R. (1999) Surveying collegiate net surfers. Quirk’s Marketing Research Review, July.
International Journal of Market Research Vol. 50 Issue 1

7/30/2019 Web Surveys Versus Other Survey Modes
http://slidepdf.com/reader/full/web-surveys-versus-other-survey-modes 26/27
Web surveys versus other survey modes
About the authors
Katja Lozar Manfreda, Ph.D., is an Assistant Professor of Statistics and
Social Informatics at the Faculty of Social Sciences, University of Ljubljana(Slovenia). Her current research interests include survey methodology, newtechnologies in social science data collection and web survey methodology.
Michael Bosnjak, Ph.D., is an Associate Professor in the School of Economics and Management at the Free University of Bozen-Bolzano(South Tyrol, Italy). His research interests include: Research synthesismethods, marketing research methods, Internet-based data collectionmethodology, and consumer psychology with a special emphasis onindividual differences and self-concept-related/symbolic consumption.
Jernej Berzelak is a researcher at the Faculty of Social Sciences,University of Ljubljana. His research activities are primarily focused onmethodological issues of Internet-based surveys and on other newtechnologies in social science data collection.
Iris Haas, Dipl.-Psych., is a postgraduate research assistant at theUniversity of Mannheim, Department of Psychology II. Of special interestto her are research methods in Psychology and Marketing Research.
Vasja Vehovar, Ph.D., is a Professor of Statistics at the Faculty of SocialSciences, University of Ljubljana. The main areas of his research interest
include the problem of survey non-response, web survey methodology andsocial aspects of the Internet and other ICTs. He is the principalinvestigator of the internationally recognized project WebSM – WebSurvey Methodology portal.
Address correspondence to: Katja Lozar Manfreda, Faculty of SocialSciences, Kardeljeva ploscad 5, 1000 Ljubljana, Slovenia,
Email: [email protected]

7/30/2019 Web Surveys Versus Other Survey Modes
http://slidepdf.com/reader/full/web-surveys-versus-other-survey-modes 27/27


