Web Site: Email: [email protected] … · Slip at the interface between steel beam and concrete...
9
International Journal of Application or Innovation in Engineering & Management (IJAIEM) Web Site: www.ijaiem.org Email: [email protected] Volume 3, Issue 6, June 2014 ISSN 2319 - 4847 Volume 3, Issue 6, June 2014 Page 237 Abstract The static strength of shear stud connectors in composite beams has been derived from push – out tests and empirical equation is suggested to predict shear strength of the connector. Suggested model is compared with previous models and codes in order to validate of the presented model. Load – slip curves are plotted for different values of compressive strengths of concrete. Experimental model was developed to predict the shear strength of the connectors as a function of compressive strength of concrete, shank stud diameters and slip. This comparison shows close agreement with other models. Keywords: Structural Engineering, Composite Structure, Stud Connectors, Shear Strength, Slip, Push–out test. Notations: Scrips Description d fcu P S Diameter of shear stud connector (mm) Cube compressive strength of concrete (MPa). Shear force on shear stud connector (KN). Slip at the interface between steel beam and concrete slab. 1. INTRODUCTION In steel–concrete composite beams, the longitudinal shear force is transferred across the steel flange and concrete slab interface by mechanical action of the shear connectors. The ability of the shear connectors to transfer these longitudinal shear forces depends on their strength, and also on the resistance of the concrete slab against longitudinal cracking induced by high concentration of shear force. Research work presented in this paper is based on the assumption that the headed shear stud connectors have welded collars and are embedded in concrete slabs such that the stud will not fail by splitting or shearing. It is also assumed that the latter modes of failure will be prevented by good detailing. The primary source of data used in the statistical analysis is the experimental data Mohammad (2011). The data referred has been obtained using different size of shear stud connectors and strength of concrete. In the following analysis, a functional relationship is derived which reflects the behavior of shear stud connectors. Standards push – out test model Johnson (1984), consist of a short length of steel beam, connected to small concrete specimen slabs. A standard compression – testing machine is used to apply the load to the upper end of the steel beam, which enables the load – slip curves to be plotted. This test is recommended by the British Standard BS CP117 (1967). Model scale push – out tests have been carried out previously by researcher Gogoi (1964), Davies (1966), Davies (1967), Davies (1969), Adekola (1959), and Balakrishnan (1963), to provide convenient and reliable means of determining and comparing the load – slip characteristics of connectors and their ultimate shear capacity. Madheswaran, and Natarajan (2007), investigated the behavior of shear connector in steel-concrete experimentally. Push out tests were carried out using shear stud connectors, (20 mm) in diameter and (100 mm) in length, in normal M35 grade concrete and with transverse reinforcement. The experimental study was also carried out with different connector heights and with two rows to find out their influence on shear resistance. The paper presents the details of experimental testing, instrumentation and analysis of data obtained on composite beams. Huu Thanh and Seung Eock (2009), investigated the capacity of large stud shear connectors embedded in solid slab. The material nonlinearities of concrete, headed stud, steel beam and rebar were included in the finite element model. The damage and failure were included in the material model for the headed stud to accurately obtain the ultimate shear strength of the stud connector. The capacity and ductility of the connection, the load slips behavior and failure mode of the headed stud was predicted. Stefan Ernst et.al (2009), investigated trapezoidal types of steel decking in the vicinity of a shear connection they concluded that not every shear connection incorporating profiled steel decking which is within the limits of the associated standards, can be classified as sufficiently ductile. A new and more reliable design approach is proposed which also allows for the inclusion of special reinforcing devices to overcome these brittle behaviors. The key element of this design approach is to classify the anticipated connection behavior, with respect to its deformation capacity, into either ductile or brittle, hence ensuring satisfactory shear connection behavior where these types of trapezoidal steel decking are used. Also, they noticed that the combined application of waveform reinforcement elements and spiral stud performance-enhancing devices surrounding the individual studs was found to delay the onset and reduce the effects of the concrete-related failure modes; hence they increased the ultimate strength and ductility of the shear connection. J.da.C. Vianna et.al (2009), investigated the Strength Model for Shear Stud Mohammad Makki Abbass 1 ,Ayad S. Adi 2 , B. S. Karkare 3 1 Lecturer, College of Engineering , Al-Mustansiriya University, Baghdad, Iraq 2 Ph.D. student of Sinhgad Collage of Engineering, Pune, Mh, India. 3 Principal, Vishwakarma Institute of Information Technology, Pune, Mh, India.
Transcript of Web Site: Email: [email protected] … · Slip at the interface between steel beam and concrete...

International Journal of Application or Innovation in Engineering & Management (IJAIEM) Web Site: www.ijaiem.org Email: [email protected]
Volume 3, Issue 6, June 2014 ISSN 2319 - 4847
Volume 3, Issue 6, June 2014 Page 237
Abstract
The static strength of shear stud connectors in composite beams has been derived from push – out tests and empirical equation is suggested to predict shear strength of the connector. Suggested model is compared with previous models and codes in order to validate of the presented model. Load – slip curves are plotted for different values of compressive strengths of concrete. Experimental model was developed to predict the shear strength of the connectors as a function of compressive strength of concrete, shank stud diameters and slip. This comparison shows close agreement with other models. Keywords: Structural Engineering, Composite Structure, Stud Connectors, Shear Strength, Slip, Push–out test. Notations:
Scrips Description d fcu P S
Diameter of shear stud connector (mm) Cube compressive strength of concrete (MPa). Shear force on shear stud connector (KN). Slip at the interface between steel beam and concrete slab.
1. INTRODUCTION In steel–concrete composite beams, the longitudinal shear force is transferred across the steel flange and concrete slab interface by mechanical action of the shear connectors. The ability of the shear connectors to transfer these longitudinal shear forces depends on their strength, and also on the resistance of the concrete slab against longitudinal cracking induced by high concentration of shear force. Research work presented in this paper is based on the assumption that the headed shear stud connectors have welded collars and are embedded in concrete slabs such that the stud will not fail by splitting or shearing. It is also assumed that the latter modes of failure will be prevented by good detailing. The primary source of data used in the statistical analysis is the experimental data Mohammad (2011). The data referred has been obtained using different size of shear stud connectors and strength of concrete. In the following analysis, a functional relationship is derived which reflects the behavior of shear stud connectors. Standards push – out test model Johnson (1984), consist of a short length of steel beam, connected to small concrete specimen slabs. A standard compression – testing machine is used to apply the load to the upper end of the steel beam, which enables the load – slip curves to be plotted. This test is recommended by the British Standard BS CP117 (1967). Model scale push – out tests have been carried out previously by researcher Gogoi (1964), Davies (1966), Davies (1967), Davies (1969), Adekola (1959), and Balakrishnan (1963), to provide convenient and reliable means of determining and comparing the load – slip characteristics of connectors and their ultimate shear capacity. Madheswaran, and Natarajan (2007), investigated the behavior of shear connector in steel-concrete experimentally. Push out tests were carried out using shear stud connectors, (20 mm) in diameter and (100 mm) in length, in normal M35 grade concrete and with transverse reinforcement. The experimental study was also carried out with different connector heights and with two rows to find out their influence on shear resistance. The paper presents the details of experimental testing, instrumentation and analysis of data obtained on composite beams. Huu Thanh and Seung Eock (2009), investigated the capacity of large stud shear connectors embedded in solid slab. The material nonlinearities of concrete, headed stud, steel beam and rebar were included in the finite element model. The damage and failure were included in the material model for the headed stud to accurately obtain the ultimate shear strength of the stud connector. The capacity and ductility of the connection, the load slips behavior and failure mode of the headed stud was predicted. Stefan Ernst et.al (2009), investigated trapezoidal types of steel decking in the vicinity of a shear connection they concluded that not every shear connection incorporating profiled steel decking which is within the limits of the associated standards, can be classified as sufficiently ductile. A new and more reliable design approach is proposed which also allows for the inclusion of special reinforcing devices to overcome these brittle behaviors. The key element of this design approach is to classify the anticipated connection behavior, with respect to its deformation capacity, into either ductile or brittle, hence ensuring satisfactory shear connection behavior where these types of trapezoidal steel decking are used. Also, they noticed that the combined application of waveform reinforcement elements and spiral stud performance-enhancing devices surrounding the individual studs was found to delay the onset and reduce the effects of the concrete-related failure modes; hence they increased the ultimate strength and ductility of the shear connection. J.da.C. Vianna et.al (2009), investigated the
Strength Model for Shear Stud
Mohammad Makki Abbass1,Ayad S. Adi2 , B. S. Karkare3
1Lecturer, College of Engineering , Al-Mustansiriya University, Baghdad, Iraq 2Ph.D. student of Sinhgad Collage of Engineering, Pune, Mh, India.
3Principal, Vishwakarma Institute of Information Technology, Pune, Mh, India.

International Journal of Application or Innovation in Engineering & Management (IJAIEM) Web Site: www.ijaiem.org Email: [email protected]
Volume 3, Issue 6, June 2014 ISSN 2319 - 4847
Volume 3, Issue 6, June 2014 Page 238
structural behavior of Perfobond and T-Perfobond connectors, suitable to transfer shear in composite structures. The experimental program consisted of twelve push-out tests configured according to the Euro code 4. The authors analyzed the test results and seen that the failure is connected to a slip at the interface, followed by the formation of cracks that open and propagate as the load increases, followed by disintegration of the concrete at the connector’s front face. This concrete failure was accompanied by a yielding of the connector, which, in some cases and at advanced load stages, was also followed by a failure of the connector welds. T-Perfobond connectors have a larger resistance and a higher stiffness than Perfobond connectors for similar longitudinal plate geometries. Shen, and Chung (2011), investigated the structural behavior of the interfacial shear connections and tested twelve push-out tests were carried out to obtain the shear resistances of the shear studs in i) standard push-out tests where the shear studs are under direct shear force, and ii) modified push-out tests where the shear studs are under combined shear and tension. They used the model proposed by Ollgaard et. al. Eq. (6), in order to standardize the load-slippage curves. They see that both the load-slippage curves for the shear connections under i) simple shear forces, and ii) combined shear and tension forces were readily represented by the same expression. Hence, their structural behavior was very similar to each other. Jawed Qureshi et.al (2011), investigated the both material and geometric nonlinearities. The model was used to carry to investigate the effect of transverse spacing in push tests with double studs placed in favorable and staggered positions with various concrete strengths. They concluded that shear connector resistance of pairs of shear connectors placed in favorable position was 94% of the strength of a single shear stud on average, when the transverse spacing between studs was 200 mm or more. For the same spacing, the resistance of staggered pairs of studs was only 86% of the strength of a single stud. The strength of double shear studs in favorable position was higher than that of the staggered pairs of shear connectors. Chen Xu et.al (2012), analyzed shear capacity and evaluated the codes and concluded that stud shear capacity was increased slightly in light of biaxial action when shank diameter was not large while this shear capacity increment was reduced when shank diameter turned larger. But it is worth mentioning that ductility reflected by interlayer slip should be carefully considered in virtue of biaxial action. Also notice that the influence of initial bending-induced concrete cracks, it got a tendency to slightly reduce shear capacity especially to the stud with large shank diameter. Moreover, initial bending-induced concrete cracks seemed favorable to interlayer ductility. In general, compared to the effects on stud shear stiffness, both of these two actions appeared limited influences on stud shear capacity. Huiyong Ban and Mark A. Bradford (2013), investigated the bending behavior of simply supported HS steel–concrete composite beams. Both geometric and material non-linear behaviors are taken into account. Forty beams with various steel grades and degrees of shear connection are modeled, and the results are compared with those obtained utilizing current design standards. The bending strength, stiffness and slip at the interface are investigated, and the effects of the steel grade and degree of shear connection are elucidated. The load-slip relationship suggested by Ollgaard et al. Jawed Qureshi et.al (2011), for mild steel composite beams was used to simulate the shear connection in the present study. He concluded that the non-linear deformation behavior of composite beams lessened with an increase of either the steel grade applied or of the degree of shear connection and the slip at the interface of composite beams grew significantly with an increase of the steel grade. L.F. Costa-Neves et al. (2013) investigated and focus on the shear connectors’ structural responses in terms of their shear transfer capacity, ductility, stress distribution and collapse modes. A comparison of the experimental results with existing analytical models of the Perfobond and T shear connectors is also presented to establish their accuracy and applicability. They concluded that changing the Perfobond shear connector geometry by adding flanges led to greater resistance enhancement when no reinforcement bars were provided. In this case, adding a flange increased the resistance by approximately 200% and adding two flanges increased it by approximately 300%, while in the reinforced connection his resistance enhancement was approximately 150% and 200%, respectively. The performance of shear connectors, in a beam and in a push – out test specimen, will have a basic difference and it affects the test results and reliability of the test data. For instance it has been noted by Davies(1969), and Slutter et al. (1965), that the direct stress present in the concrete slab of a beam, caused by bending, is absent in a push – out specimen and that the eccentricity of loading that can occur in push – out specimens, either because of slight errors in the fabrication of the specimen or non – uniformity of the concrete, often results in low values of average ultimate strength per connector. Load – slip relationship is influenced by many variables, which include the following Johnson (1984): 1. Number of connectors in the test specimen. 2. Mean longitudinal stress in the concrete slab surrounding the connectors. 3. Size, arrangement, and strength of slab reinforcement around of the connectors. 4. Thickness of concrete surrounding the connectors. 5. Restriction on the freedom of the base of each slab to move laterally, and corresponding uplift forces on the connectors. 6. Bond at the steel - concrete interface. 7. Strength of the concrete slab. 8. Degree of concrete compaction surrounding the base of each connector. The actual reinforcement in the experimental work is less than that which would normally be used in a beam, so that the

International Journal of Application or Innovation in Engineering & Management (IJAIEM) Web Site: www.ijaiem.org Email: [email protected]
Volume 3, Issue 6, June 2014 ISSN 2319 - 4847
Volume 3, Issue 6, June 2014 Page 239
strength obtained from the tests are likely to be on the safer (low) side. The strength of concrete can influence the mode of failure, as well as the failure load. During the experimentation it was observed that, the slab surrounding the stud failed when large diameter studs were used whereas the small diameter studs failed by shearing off. The change of mode occurs at a range of diameter of (16 to 19 mm), depending on the concrete strength. 2. SUGGESTED MODEL The basic assumptions of push – out tests in present study are as follows: 1. Pure shear loading was applied in the test. 2. The shear load per stud was the total load applied to the specimen divided by the total number of studs (this assumption was found to be reasonable during testing as the difference between the readings of two slips gauges was very small). 3. In plotting the results, the mean of the two slip gauge readings was used. 4. Stud welding was strong enough, so that the welds would not fail before the connector. 5. Each specimen was bedded down on the lower platen using plywood to avoid any compressive force, so that no uplift force was exerted on shear stud connectors. From the previous experimental push – out tests Mohammad (2011), and using the data results gate it from tests a modified equation for limit state design of composite beam is suggested. The shear strength of the shear stud connectors is influenced by shank diameter, compressive strength of concrete, and slip. Comparison is made with some published models and codes in order to validate the empirical equation suggested. 2.1Yam and Chapman model An exponential model for the load – slip relationship of shear connectors was used by Yam and Chapman for the first time. Yam et al.(1972),The relation was expressed by following function:
(1)
(2)
(3)
Where (a, and b) are constants chosen to give the best fit with experimental load – slip curves, (Q) is the shear forces. Alternatively, by choosing two points from the experimental curve, so that (2ucs1=ucs), and substituting for the shear capacity in these points, the final form of the load – slip relation can be obtained. 2.2 AL-Amery and Robert model AL-Amery and Roberts (1989), carried out a parametric study and arrived at exponential form. It requires one value of slip and corresponding load to model the curve. The expression is as follows:
(4)
(5) In which (φ) is a constant and (Q) is the mid – range load and (ucs) is the corresponding slip. 2.3 Ollgaard et.al model From an analysis of experimental load – slip relations determined by push – out tests for shear stud connectors embedded in concrete with different strengths, Ollgaard et.al.(1971), presented the following equation:
(6)
Where (ucs) is the slip in (mm). 2.4 Fisher et.al model From an analysis of experimental load – slip relations determined from push – out tests, Fisher et.al. (1971), presented the following equation:
(7)

International Journal of Application or Innovation in Engineering & Management (IJAIEM) Web Site: www.ijaiem.org Email: [email protected]
Volume 3, Issue 6, June 2014 ISSN 2319 - 4847
Volume 3, Issue 6, June 2014 Page 240
2.5 Gattesco et.al model Gattesco N. and Giuriani E. (1996), suggest the following empirical equation to fit the results of static test:
(8) Where
3. STATISTICAL MODELING In statistical modeling, the overall objective is to develop a predictive equation relating a criterion variable to one or more predictor variables. In present paper, the criterion variables include the shear force, compressive strength of concrete, stud connector diameter and slip. The terms shown in these tables are defined as follows: From the correlation matrices, it is evident that some variables have high inter - correlation and low correlation with the criterion variables. As the correlation coefficient provides only a single-valued index of the degree of near association between pairs of variables, it is used primarily as a data screening technique. Stepwise regression technique used for model development provides coefficients for a prediction equation and can also be used to assess the relative importance of the predictor variables. The measures of goodness of fit are aimed to quantify how well the proposed regression model obtained fits the date. The two measures usually presented are coefficients of multiple determinations (R2) and standard error of regression SER. The (R2) is the percent variation of the criterion variable explained by the suggested model and is calculated according to following equation
SSTSSER 12 (a)
Where, SSE is the measure of how much variation in (y) is left unexplained by the proposed model, and it is equal to the error sum of squares = ∑ (yi-y'i)2
yi is the actual value of criterion variable for the (ith) case. y'i the regression prediction for the (ith) case.
SST is the measure of the total amount of variation in the observed ( ), and it is equal to the total sum of squares ∑ (yi-y'i)2
y = the mean observed (y). (R2) is bounded between (0) and (1); the higher the value of (R2), the more successful is the regression model in explaining (y) variation. If (R2) is small, the analyst will usually want to search for an alternative models (i.e., non-linear) that can more effectively explain (y) variation. Because (R2) always increases when a new variable is added to the set of the predictor variables and in order to balance the cost of using more parameters against the gain in R2, many statisticians use the adjusted coefficient of multiple determinations adjust (R2), which is calculated as follows:
adj R2=
Kn
KRn1)1( 2
(b)
Where: n = the sample size. k = the total number of the predictor variables. The second measure, standard error of regression (SER), is calculated according to the following equation:
SER=)1( kn
SSE (c)
In general, the smaller the (SER) value, the better the proposed regression model.
1mm0.00045γ,1mm1.3β0.97,α

International Journal of Application or Innovation in Engineering & Management (IJAIEM) Web Site: www.ijaiem.org Email: [email protected]
Volume 3, Issue 6, June 2014 ISSN 2319 - 4847
Volume 3, Issue 6, June 2014 Page 241
4. PRESENT MODEL F From the analysis of experimental load – slip relations determined by push – out tests for shear stud connectors embedded in concrete with different strengths, and different shank diameter of shear stud connectors, the fitting curves presented the following equation: P = 0.054 (fcu) 0.5 (d1.893) (s) 0.175 (9) In which (fcu) in (MPa), (S, d) in (mm), and (P) in (kN). The present model is compared with the all the models mentioned above. Load versus Slip obtained using these models are plotted in Fig. 1 which shows close comparison of the present model with earlier models. Also, the results of ultimate static strength from Eq. (9) are plotted against characteristic static strength obtained by Johnson (1984), in Fig. 2 All the results lie above the line (45o) indicating that it is generally conservative and therefore provides a satisfactory basis for static assessment.
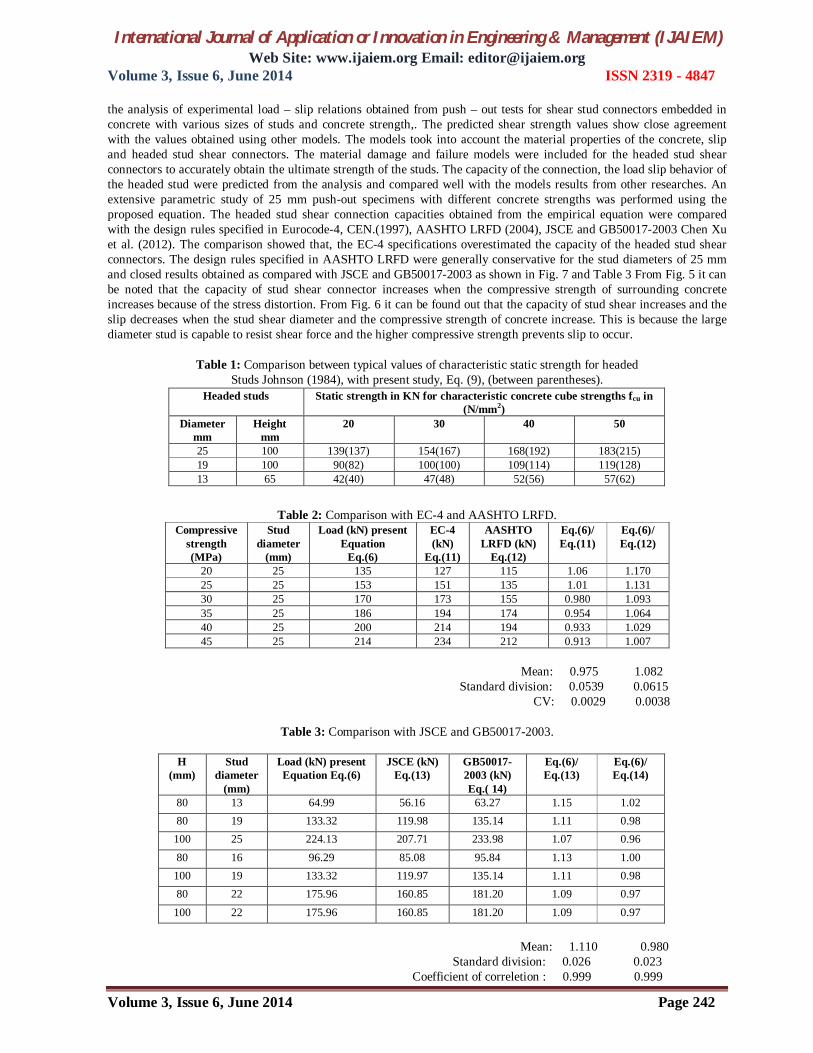
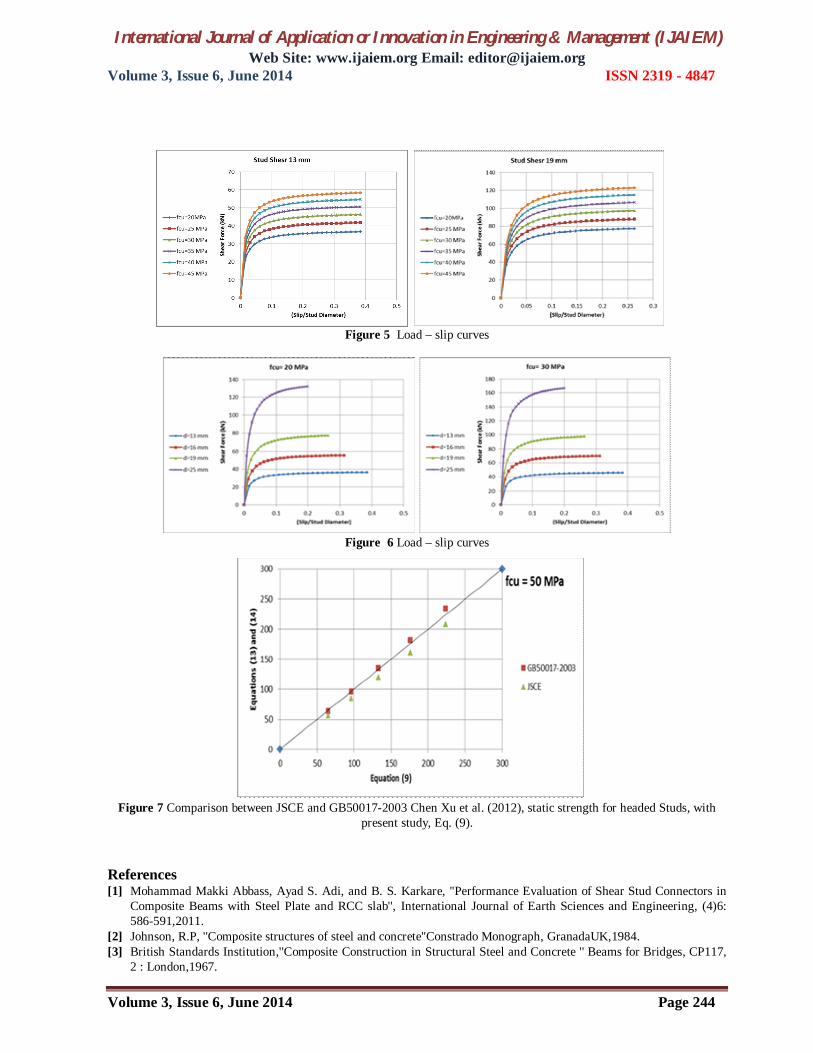
Table 1 shows the comparison between typical values of characteristic static strength for headed Studs Johnson (1984), with present study i.e. Eq. (9). It can be concluded that the results are very close. Fig. 4 shows the radar curve for slip-load and diameter relationship. Fig. 5 represents the relation between load (shear) with slip for shank diameters (13 and 19 mm). Fig. 6 for load-slip for compressive strength (20 and 30 MPa). 4.1Comparison with design codes The shear capacity of stud shear connectors obtained from the parametric study was compared with nominal un-factored design strength of shear connectors calculated using Eurocode-4, CEN. (1997), and AASHTO LRFD (2004). Eurocode-4 specifies the design strength of headed stud shear connector in composite beam as the lesser value obtained from Eqs. (10) - (11). PEC4 = 0.8fu (π d2/4) (10)
PEC4 = 0.29α (fckEcm) (0.5) (11) α = 0.2(h/d+1) ≤1
Where fu is the ultimate strength of steel, fck and Ecm are the cylindrical compressive strength and mean secant (elastic) modulus of concrete, respectively, h and d are the overall height and diameter of the stud. In AASHTO LRFD, the nominal shear resistance of one stud shear connector embedded in concrete deck is taken as Eq. (12).
PAASHTO LRFD = 0.5ASC (fckEcm) (0.5) ≤ ASC fu (12)
Where, Asc is the cross-sectional area of a stud shear connector. The mean values are 0.975 with EC-4 and 1.082 with AASHTO LRFD with corresponding coefficient of variation (CV) of 0.0029 and 0.0038 respectively. The present model is compared with the above codes and result is plotted in Fig. 3 The results show close comparison. Table 2 shows the comparison between typical values of characteristic static strength for headed Studs Eurocode-4, CEN.(1997) and AASHTO LRFD (2004).with present study, Eq. (9). It can be concluded that the results are very close. In JSCE Chen Xu et al. (2012), the allowable shear capacity (Qa) of one stud is expressed as Eq. (13), where (d) is the shank diameter, H is stud height and (fcu) is the design strength of concrete.
Qa = 9.4 d2 (fcu)0.5 for H/d ≥ 5.5 and Qa = 1.72 dH (fcu)0.5 H/d < 5.5 (13)
In GB50017-2003, Chen Xu et al. (2012), the design stud shear capacity NV S is expressed as Eq. (14), where (Aa) is the
cross sectional area of one stud, Ec is the elastic modulus of concrete, f is the design tensilestrength of stud, γ is the ratio of minimum ultimate tensile strength to yield strength( γ) are equal to (1.7).
(14)
The comparisons for compressive strength (50 MPa), as shown in Fig. 7. 5. STATISTICAL MODELING An empirical equation from data of push-out test has been developed to investigate the capacity of stud shear connectors embedded in a solid slab. Experimental model was developed to predict the shear strength of shear stud connector from
International Journal of Application or Innovation in Engineering & Management (IJAIEM) Web Site: www.ijaiem.org Email: [email protected]
Volume 3, Issue 6, June 2014 ISSN 2319 - 4847
Volume 3, Issue 6, June 2014 Page 242
the analysis of experimental load – slip relations obtained from push – out tests for shear stud connectors embedded in concrete with various sizes of studs and concrete strength,. The predicted shear strength values show close agreement with the values obtained using other models. The models took into account the material properties of the concrete, slip and headed stud shear connectors. The material damage and failure models were included for the headed stud shear connectors to accurately obtain the ultimate strength of the studs. The capacity of the connection, the load slip behavior of the headed stud were predicted from the analysis and compared well with the models results from other researches. An extensive parametric study of 25 mm push-out specimens with different concrete strengths was performed using the proposed equation. The headed stud shear connection capacities obtained from the empirical equation were compared with the design rules specified in Eurocode-4, CEN.(1997), AASHTO LRFD (2004), JSCE and GB50017-2003 Chen Xu et al. (2012). The comparison showed that, the EC-4 specifications overestimated the capacity of the headed stud shear connectors. The design rules specified in AASHTO LRFD were generally conservative for the stud diameters of 25 mm and closed results obtained as compared with JSCE and GB50017-2003 as shown in Fig. 7 and Table 3 From Fig. 5 it can be noted that the capacity of stud shear connector increases when the compressive strength of surrounding concrete increases because of the stress distortion. From Fig. 6 it can be found out that the capacity of stud shear increases and the slip decreases when the stud shear diameter and the compressive strength of concrete increase. This is because the large diameter stud is capable to resist shear force and the higher compressive strength prevents slip to occur.
Table 1: Comparison between typical values of characteristic static strength for headed Studs Johnson (1984), with present study, Eq. (9), (between parentheses).
Table 2: Comparison with EC-4 and AASHTO LRFD. Compressive
strength (MPa)
Stud diameter
(mm)
Load (kN) present Equation
Eq.(6)
EC-4 (kN)
Eq.(11)
AASHTO LRFD (kN)
Eq.(12)
Eq.(6)/ Eq.(11)
Eq.(6)/ Eq.(12)
20 25 135 127 115 1.06 1.170 25 25 153 151 135 1.01 1.131 30 25 170 173 155 0.980 1.093 35 25 186 194 174 0.954 1.064 40 25 200 214 194 0.933 1.029 45 25 214 234 212 0.913 1.007
Mean: 0.975 1.082
Standard division: 0.0539 0.0615 CV: 0.0029 0.0038
Table 3: Comparison with JSCE and GB50017-2003.
H
(mm) Stud
diameter (mm)
Load (kN) present Equation Eq.(6)
JSCE (kN) Eq.(13)
GB50017-2003 (kN) Eq.( 14)
Eq.(6)/ Eq.(13)
Eq.(6)/ Eq.(14)
80 13 64.99 56.16 63.27 1.15 1.02 80 19 133.32 119.98 135.14 1.11 0.98
100 25 224.13 207.71 233.98 1.07 0.96 80 16 96.29 85.08 95.84 1.13 1.00
100 19 133.32 119.97 135.14 1.11 0.98 80 22 175.96 160.85 181.20 1.09 0.97
100 22 175.96 160.85 181.20 1.09 0.97
Mean: 1.110 0.980
Standard division: 0.026 0.023 Coefficient of correletion : 0.999 0.999
Headed studs Static strength in KN for characteristic concrete cube strengths fcu in (N/mm2)
Diameter mm
Height mm
20 30 40 50
25 100 139(137) 154(167) 168(192) 183(215) 19 100 90(82) 100(100) 109(114) 119(128) 13 65 42(40) 47(48) 52(56) 57(62)

International Journal of Application or Innovation in Engineering & Management (IJAIEM) Web Site: www.ijaiem.org Email: [email protected]
Volume 3, Issue 6, June 2014 ISSN 2319 - 4847
Volume 3, Issue 6, June 2014 Page 243
Figure 1 Comparison between present study and some published models.
Figure 2 Comparison between EC-4 and AASHTO LRFD static strength for headed Studs Johnson, R.P.(1984),with
present study, Eq. (9)
Figure 3 Comparison between EC-4 and AASHTO LRFD static strength for headed Studs Johnson, R.P. (1984), with
present study, Eq. (9).
Figure 4 Load – slip – diameter curve.
International Journal of Application or Innovation in Engineering & Management (IJAIEM) Web Site: www.ijaiem.org Email: [email protected]
Volume 3, Issue 6, June 2014 ISSN 2319 - 4847
Volume 3, Issue 6, June 2014 Page 244
Figure 5 Load – slip curves
Figure 6 Load – slip curves
Figure 7 Comparison between JSCE and GB50017-2003 Chen Xu et al. (2012), static strength for headed Studs, with present study, Eq. (9).
References [1] Mohammad Makki Abbass, Ayad S. Adi, and B. S. Karkare, ''Performance Evaluation of Shear Stud Connectors in
Composite Beams with Steel Plate and RCC slab'', International Journal of Earth Sciences and Engineering, (4)6: 586-591,2011.
[2] Johnson, R.P, ''Composite structures of steel and concrete''Constrado Monograph, GranadaUK,1984. [3] British Standards Institution,''Composite Construction in Structural Steel and Concrete '' Beams for Bridges, CP117,
2 : London,1967.

International Journal of Application or Innovation in Engineering & Management (IJAIEM) Web Site: www.ijaiem.org Email: [email protected]
Volume 3, Issue 6, June 2014 ISSN 2319 - 4847
Volume 3, Issue 6, June 2014 Page 245
[4] Gogoi. S, ''Interaction Phenomena in Composite Beams and Plates'', doctoral diss., University of London, UK,1964. [5] Davies, C.,''Steel – Concrete Composite Beams with Flexible Connectors '', Concrete1:425-430, 1967. [6] Davies, C., ''Test on half-scale Steel – Concrete Composite Beams with Welded Stud Connectors'', Journal of
Institution of Structural Engineering 47,1: 29-40,1969. [7] Davies, C., ''Steel – Concrete Composite T – Beams with Welded Stud Connectors'', Msc. Thesis ,University of
London, UK,1966. [8] Adekola, A. O.''Interaction between steel beams and concrete floor slab'', Ph.D. Thesis , University of London,
UK,1959. [9] Balakrishnan, S., ''The Behavior of Composite Steel and Concrete Beams with Welded shear Stud connectors'', Ph.D.
Thesis , University of London, UK,1963. [10] Dr. C K Madheswaran and Dr. K Natarajan, ''Strength of Shear Connectors in Steel-concrete Composite Beams", IE
Journa (I), 14-20,2007. [11] Huu Thanh Nguyen, Seung Eock Kim, ''Finite Element Modeling of push-out Tests for large Stud Shear Connectors'',
Journal of Constructional Steel Research (65), 1909-1920,2009. [12] Stefan Ernst et al., ''Push-out tests and a new approach for the design of secondary composite beam shear
connections'', Journal of Constructional Steel Research (65), 44-53, 2009. [13] J.da.C. Viannaa et al.,'' Experimental assessment of Perfobond and T-Perfobond shear connectors structural
response'', Journal of Constructional Steel Research (65) 408–421,2009. [14] M. H. Shen, K. F. Chung, ''An Investigation into Shear Resistances of Headed Shear Studs in Solid Concrete Slabs
With Local Aggregates in Hong Kong'', Procedia Engineering (14) 1098–1105,2011. [15] Jawed Qureshi et al., ''Effect of shear connector spacing and layout on the shear connector capacity in composite
beams'', Journal of Constructional Steel Research (67) 706-719, 2011. [16] Chen Xu et al., ''Parametrical static analysis on group studs with typical push-out tests'', Journal of Constructional
Steel Research (72), 84-96, 2012. [17] Huiyong Ban, Mark A. Bradford,'' Flexural behaviour of composite beams with high strength steel'', Engineering
Structures (56), 1130-1141, 2013. [18] L.F. Costa-Neves et al, ''Perforated shear connectors on composite girders under monotonic loading: An experimental
approach'', Engineering Structures (56)721-737,2013. [19] Slutter, R. B., and Driscoll, G. C. ''Flexural Strength of Steel – Concrete Composite Beams'', Journal of the Structural
Division, ASCE (91) 2: 71-99,1965. [20] Yam, L. C. P. and Chapman J. C., ''The Inelastic Behavior of Continuous Composite Beams of Steel and Concrete'',
Proc. Inst. Civil Engineering (53), 847-501,1972. [21] AL – Amery, R.I.M. and Roberts, T.M, ''Nonlinear Finite difference Analysis of Composite Beams with Partial
Interaction'', International Journal of Computer and Structures ( 35) 1: 81 – 87,1989. [22] Ollgraad J. G., and Fisher J. W., ''Shear Strength of Stud Connectors in lightweight and normal weight Concrete'',
AISC, Engineering Journal, 101-110,1971. [23] Gattesco N. and Giuriani E., ''Experimental study on shear Stud Connectors subjected to Cyclic loading,,
Constructional Steel Research (38) 1: 1-21,1996. [24] ENV. ''Design of Composite Steel and Concrete Structures Part 2'', Composite Bridges. Eurocode (4)
CEN:1997,1994. [25] AASHTO LRFD , "Bridge Design Specifications 3rd'', American Association of State Highway and Transportation
Officials, USA,2004. AUTHOR
Ayad S. Adi received the B.S. and M.S. degrees in Civil Engineering from Technology University in 1987 and 2005, respectively. During this working in the sites of the Ministry of Works and then teaching in the Department of Civil Engineering at the University of Anbar –Iraq.