Web Accessibility National Transition Strategy€¦ · Web viewThe Australian Government Web...
33
Web Accessibility National Transition Strategy 2012 Progress DECEMBER 2013
-
Upload
nguyenkiet -
Category
Documents
-
view
220 -
download
0
Transcript of Web Accessibility National Transition Strategy€¦ · Web viewThe Australian Government Web...
Web Accessibility National Transition Strategy 2012 Progress
DECEMBER 2013
ISBN 978-1-922096-29-6
The Australian Government Web Accessibility National Transition Strategy 2012 Progress (Online)
Creative Commons
With the exception of the Commonwealth Coat of Arms and where otherwise noted, this report is licensed under a Creative Commons Attribution 3.0 Australia licence http://creativecommons.org/licenses/by/3.0/au/
The report must be attributed as the Australian Government Web Accessibility National Transition Strategy 2012 Progress
Use of the Coat of Arms
The terms under which the Coat of Arms can be used are detailed on the It’s an Honour website http://www.itsanhonour.gov.au/coat-arms/index.cfm.
Inquiries regarding the licence and any use of the report are welcome at:
Assistant SecretaryGovernance and Policy BranchAustralian Government Information Management OfficeDepartment of Finance and DeregulationJohn Gorton Building, King Edward Terrace Parkes ACT 2600
Email: [email protected]
DisclaimerThe scope of this survey did not include auditing or validating agency reported data. The Department of Finance is unable to give any undertaking regarding the accuracy of this data.
NTS 2012 Progress | 2
Contents
1. Context 42. Agency Progress 53. Key findings 94. Priorities for action 135. Agency report card 146. Appendix 23
NTS 2012 Progress | 3
1. Context
In 2010 the Australian Government developed a strategy for improved web services, with the aim of ensuring government provided a more accessible and usable web environment that would better engage with, provide services to, and allow participation from, all people within our society. The strategy mandated the adoption of the World Wide Web Consortium’s Web Content Accessibility Guidelines Version 2.0 (WCAG 2.0) for all government online services and information.
The Web Accessibility National Transition Strategy1 (NTS) set out the work plan for transition to, and implementation of, WCAG 2.0 over a four year period. The strategy established mid-point and end-point milestones for progressive accessibility enhancement of the Australian Government web environment. It also established a reporting regime to monitor agency progress in implementing the strategy.
This report provides a snapshot of agency progress in their transition to more accessible government services and information for everyone. The report is based on agency reported data from the mid 2013 survey of NTS progress as at December 2012. It builds upon the NTS 2010 Baseline Report2.
1 http://www.finance.gov.au/publications/wcag-2-implementation/index.html 2 http://www.finance.gov.au/publications/nts-2010-baseline-report/index.html
NTS 2012 Progress | 4
2. Agency Progress
In 2010 the Australian Government set an ambitious target for the adoption of WCAG 2.0 over a relatively short time period. This approach was designed to focus agencies’ attention on the application of the standards to improve the overall accessibility of the government web environment. Many agencies have committed considerable time and effort into achieving this target and as a result are able to demonstrate significant progress in many of the areas considered the foundations of web accessibility.
Through the transition phase, it has become clear that conformance with the WCAG 2.0 standard is particularly demanding and that we cannot expect all government websites, information and applications to conform to WCAG 2.0 at all times. Further, it is clear that binary measures of conformance, (does a website or web application meet technical compliance with WCAG 2.0 or not?), do not automatically equate to better functional outcomes for all users. However, WCAG 2.0 does provide the foundation for more accessible websites and web applications to meet the needs of most users.
Under the NTS, the Australian Government asked agencies to develop implementation plans that prioritised accessibility, through the application of WCAG 2.0, in the management of their websites, information and applications. Agencies were encouraged to create these to be as accessible as possible and, importantly, to release enhancements to these progressively so as to deliver accessibility improvements to the greatest number of users as early as possible.
Through a recent progress survey, agencies reported publishing more than 1.7million web pages over 1300 websites and managing more than 1100 web applications that are supporting and servicing Australians online. There was a small net increase in the overall number of websites (60) and web applications (89) comprising the government web environment since 2010. Many new websites and web applications were reported to be accessible from launch.
Agencies also reported significant progress in the areas considered to be the foundations for best practice accessibility:
nearly three quarters of agencies evaluated their web publishing practices to ensure these would help them achieve better accessibility;
over half the agencies reported upgrading their content management systems to better address accessible production of web content;
the majority of agencies conducted an ICT procurement review to ensure their web-related ICT procurements specified accessibility as a core component; and
more than 80% of agencies reported the regular use of accessibility conformance testing tools across their web environments.
NTS 2012 Progress | 5
These combined efforts signify a shift in the way agencies are approaching accessibility and the shift further enables the delivery of more digitally accessible information and services.
However, agencies did report a number of remaining issues. The size of the Australian Government’s web environment places heavy resource demands on agencies who must balance the need to deliver new information and services while addressing the challenges in making their legacy content (documents and data) and applications accessible. Many agencies report they are progressing directly to WCAG 2.0 Level AA, a higher level of conformance, rather than firstly aiming for WCAG 2.0 Level A, in order to reduce rework and minimise the costs of implementation.
Overall, the government capability in the area of web accessibility has improved significantly. While some agencies reported the number of staff involved in their web environment has declined since 2010, they also report that those involved are now better educated about accessibility because of the significant efforts expended in training exercises. More than 4000 public servants have been specifically trained in web accessibility and nearly 10,000 more have accessed online accessibility training materials. More than a third of agencies report having a dedicated resource whose primary role is accessibility; in 2010 there were none.
These strong improvements across government place Australia at the forefront globally in addressing this important issue. However, the positive progress needs to be tempered with the recognition that full WCAG 2.0 Level AA compliance by December 2014 across all government websites, information and applications is not likely to be achieved despite agency efforts. When agencies do not expect to be fully compliant by December 2014, they should prioritise WCAG Level AA conformance on the minimum ‘online content requirements’ as outlined in the NTS. Despite the challenging target, the government remains committed to achieving WCAG 2.0 compliance.
AGIMO is working to articulate a framework for continuous improvement to support agencies and embed WCAG 2.0 into design guides and services standards to ensure that there is an ongoing focus on web accessibility across government. Importantly, the framework will ensure that agencies’ efforts are focussed on delivering the level of accessibility the users of their digital information and services require now. The framework will also deliver high overall accessibility standards into the future across the Australian Government web environment.
NTS 2012 Progress | 6
NTS 2012 Progress | 7
NTS 2012 Progress | 8
3. Key findings
The NTS survey sought information on agency progress in three areas:
1. Stock take and conformance assessment, to monitor the size, complexity and changes in an agencies web environment and assess the extent of progress implementing WCAG 2.0 to agency websites and web applications;
2. Infrastructure assessment, to review progress and improvements in the technical infrastructure and publishing processes in use within agencies; and
3. Capability assessment, to monitor agency training, education and capability improvements that underpin their progress towards WCAG 2.0 conformance under the NTS.
Participation 114 agencies invited to participate
o 9 agencies did not report o 1 did not finalise their responseo 13 agencies reported under another agency
91 agency responses form the basis of analysis
3.1 Stock take & Conformance assessment
Websites
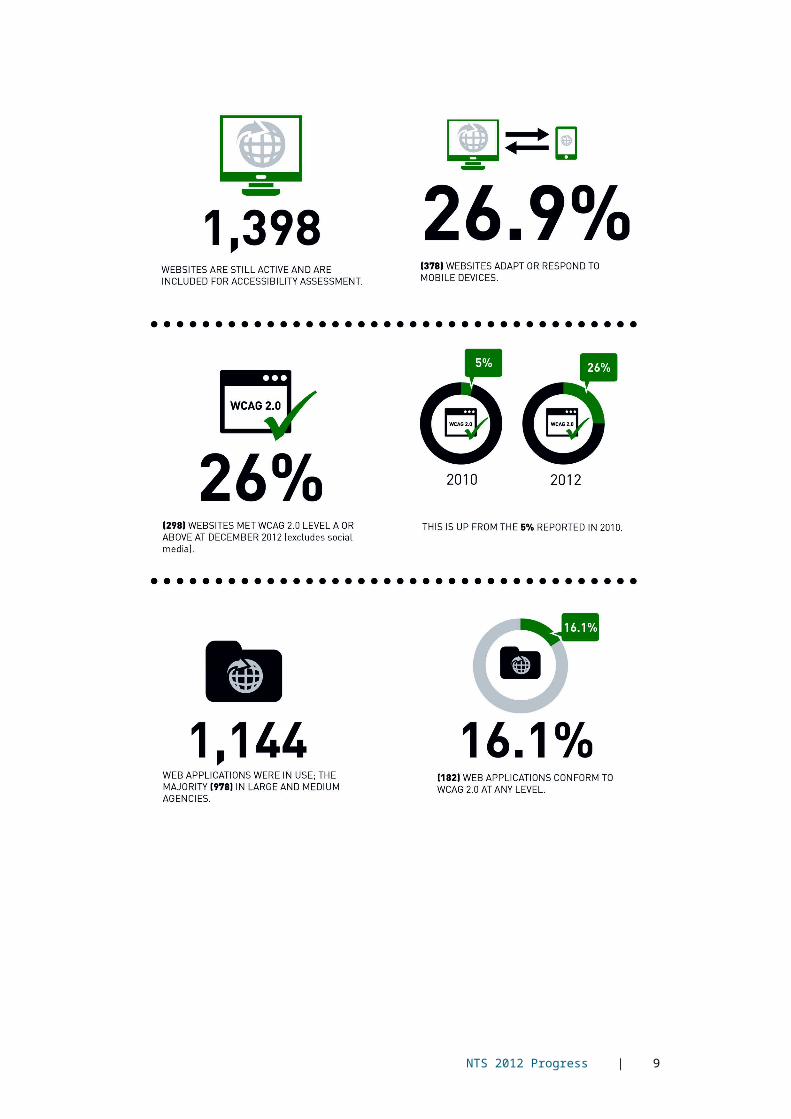
Agencies reported on 1892 websites; 494 of these were reported to have been archived, decommissioned, consolidated or reallocated since 2010. The remainder, 1398 websites, are still active and are included for accessibility assessment
o The 1398 active websites are reported to be comprised of 934 (66.8%) internet sites; 235 (16.8%) intranets; 37 (2.6%) extranets and 179 (12.8%) social media sites
1082 (77.4%) are classified as small: o 411 were reported to have less than 500 pages o 671 were reported to have less than 50 pages.
201 websites were reported as large:o 151 large websites reported to have between 1000 – 10,000 pageso 50 were reported to contain over 10,000 pages
An estimated 1.7million pages comprise the Government web environment
Agencies have placed a high priority in achieving WCAG 2.0 to 154 (11.0%) websites, a medium priority on 205 (14.5%) and a low priority on 242 (17.3%); 797 (57%) have not been prioritised.
NTS 2012 Progress | 9
Changes since 2010 A net increase of 60 websites were reported since 2010. Accounting for
archived, decommissioned and consolidated, there were 210 new websites released since 2010.
Mobile compatibility of websites 378 (27.0%%) of website were reported to be suitable for mobile devices;
o 36 (2.6%) swapped to mobile versions o 9 (0.6%) websites were reported to have created an equivalent iOS
and/or Android application, i.e. public toilet map.
Website conformance assessment (excluding Social Media) 302 (26.0%) of websites were reported to meet WCAG 2.0 Level A or
above at December 2012; 481 (41.4%) websites were reported as not assessed, of which
o 103 (14.5%) were reported to be either High (63) or Medium (40) priority for upgrade by agencies.
o 11% are reported to be being archived or decommissioned by 2014 378 (32.6%) websites were reported as non-conforming;
o 172 (45.6%) of the non-conforming websites were expected to conform at Level AA by 2014
169 (44.8%) of the non-conforming sites reported that the minimum online content requirements for the NTS do conform.
39% of new websites were reported to conform to WCAG 2.0 at launch; 25% did not conform and 35% were launched without a conformance assessment.
21% of websites reported as either non conforming or not assessed were reported to be progressing directly to WCAG 2.0 Level AA.
Legacy content and documents were reported to be the issues impacting most on achieving conformance with WCAG 2.0.
Progress since 2010 26% of websites were reported to meet WCAG 2.0 in 2012 up from the
5% reported in 2010; In 2010, 517 websites reported as conforming to WCAG 1.0;
approximately two thirds of these (350) have been consolidated, decommissioned or archived in the two years to 2012.
Web applications
Agencies reported 1144 web applications were in use; the majority (978) are reported from large and medium agencies.
o 660 (58.2%) web applications are internal facingo 302 (26.6%) are external o 172 (15.1%) are reported as being botho 259 (22.8%) are reported as being vendor owned applications
NTS 2012 Progress | 10
Web application conformanceo 182 (16.1%) of web applications were reported to conform to
WCAG 2.0 at any levelo 171 (15.1%) were reported as non-conforming o 781 (68.2%) had not been assessed o 337 (29.7%) web applications not currently conforming, will be
upgraded to WCAG 2.0 by end of 2014 o 177 (15.6%) web applications that had not been assessed were
reported to be progressing directly to WCAG 2.0 Agencies reported that resources and timeframes were the largest barrier to
upgrading web applications
Progress since 2010 In 2010 agencies reported 1055 web applications; a net increase of 89
since 2010. In 2010, 24 (2.27%) applications were reported to conform to WCAG 2.0;
in 2012 16.1% conformed. There was a shift in the number of internal facing applications reported
since 2010, from 443 (41.9%) to 660 (57.7%).
Mobile view of applications Agencies reported 10 mobile apps; the australia.gov.au website listed 45
mobile apps - a significant under reporting. o No agency reported assessing their mobile apps against WCAG
2.0. Agencies reported 138 (12.1%) of web applications were mobile enabled.
3.2 Infrastructure assessment
Accessibility conformance testing
The majority of agencies use a range of conformance checking tools to assess their websites and web applications.
o 38 agencies report using a site-wide automated testing tool, 15 indicate a plan to use a site-wide automated tool in the
futureo 65 agencies reported using document testing tools.
73 agencies reported performing manual checks of their websites 40 reported using assistive technologies in their test processes. 54 agencies reported the use of an outsourced service provider to assist
with WCAG 2.0 conformance.
Web publishing & procurement processes
66 (73%) agencies reported re-evaluating their web publishing processes, aligning their web publishing process to promote accessibility conformance with the NTS
NTS 2012 Progress | 11
o 19 (20.9%) agencies reported that they intend to upgrade their web publishing processes in the future.
53 (58%) reported they had changed their Content Management System (CMS)
o 5% reported their CMS was suitable and made no change. o 27% reported they would change their CMS in the future
64% of agencies reported conducting an ICT Procurement policy review to ensure procurement processes specified web accessibility
o 33% reported they intended to do this in the future.
3.3 Capability Assessment
Staff numbers
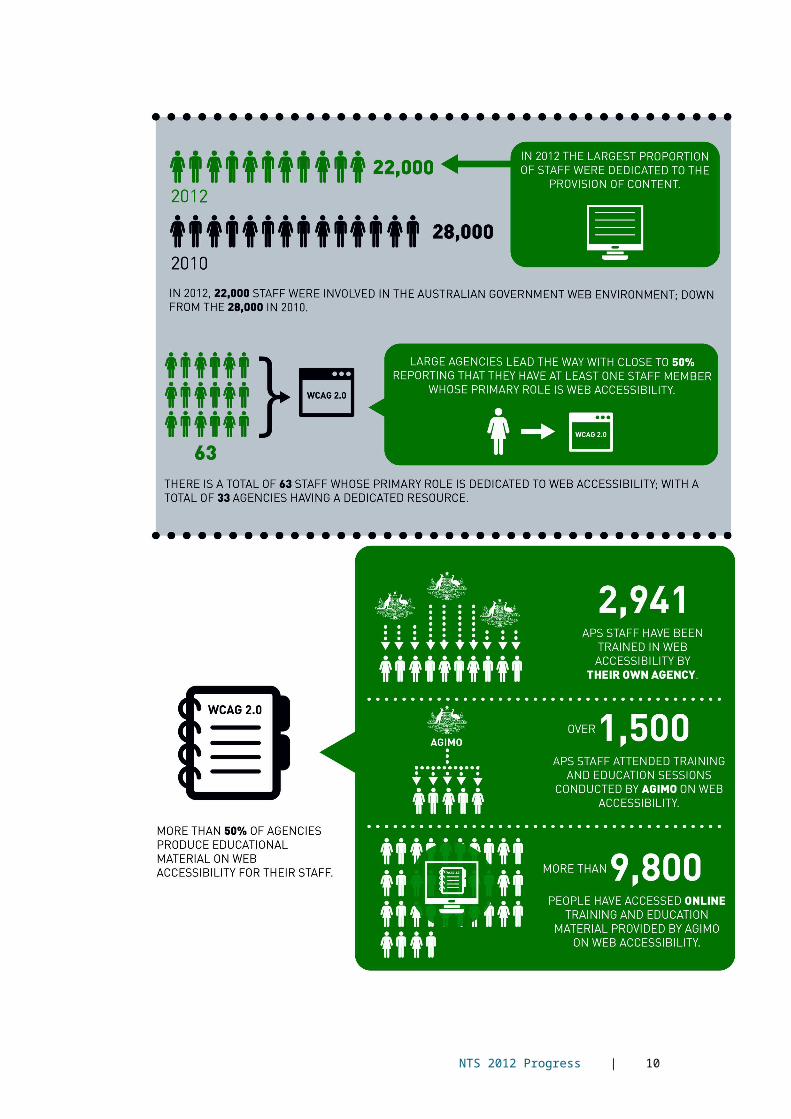
In 2012, there were 22,000 staff reported to be involved in the Australian Government web environment down from the 28,000 staff reported in 2010.
o The largest proportion were dedicated to the provision of content. Agencies report a significant increase in the technical capability of their
staff with respect to website accessibility. Agencies reported a total of 63 staff whose primary role is dedicated to
web accessibility with a total of 33 agencies having a dedicated resource. o Large agencies lead the way with close to 50% reporting that they
have least one staff whose primary role is web accessibility.
Staff skills
More than 50% of agencies reported producing educational material on web accessibility for their staff.
2941 APS staff are reported to have been trained in web accessibility by their own agency.
Over 1500 APS staff attended training and education sessions conducted by AGIMO on web accessibility.
More than 9,800 people have accessed online training and education material provided by AGIMO on web accessibility
NTS planning
36 agencies reported they have a Web Accessibility Implementation plan outlining their approach to implementing WCAG 2.0 across their agency as recommended in the NTS work plan.
28 agencies reported they have an action plan providing a detailed approach to the priorities and actions required at individual website level.
Risks
Funding and resources was reported to be the most significant risk to achieving accessible websites
NTS 2012 Progress | 12
4. Priorities for action
The progress report raises the need for:
Agencies to: Complete any remaining audits of the number of websites and web
applications, including those provided by a third party
Complete conformance assessment of all websites and web applications currently unassessed
Assign a WCAG 2.0 upgrade priority to all websites and web applications , with priority on the minimum online content requirements
Deploy accessibility conformance testing tools and, where required, external testing services to compliment agency capability
Review accessibility action plans addressing upgrade priorities, alternate access methods, maintenance and monitoring practices
Update agency web policies to provide for WCAG 2.0 conformance for all websites and web applications
Release progressive accessibility enhancements to their web environments as they are developed
Maintain a program of education and training for agency staff on accessible authoring practices, accessible procurement requirements and conformance testing methods.
AGIMO and/or lead agency(s) to: Share methodologies for WCAG 2.0 conformance testing ensuring repeatable,
comparable, standardised tests for agencies
Continue to promote better web accessibility skills and capabilities by supporting web accessibility training and education programs for all levels of staff contributing to the Australian Government’s web environment
Assist agencies in developing accessibility action plans
Conduct final NTS survey in early 2015 to measure progress at the end of 2014 (target date).
Articulate a framework for continuous improvement beyond 2014 and embed WCAG 2.0 into all appropriate aspects of government web guides and standards.
NTS 2012 Progress | 13
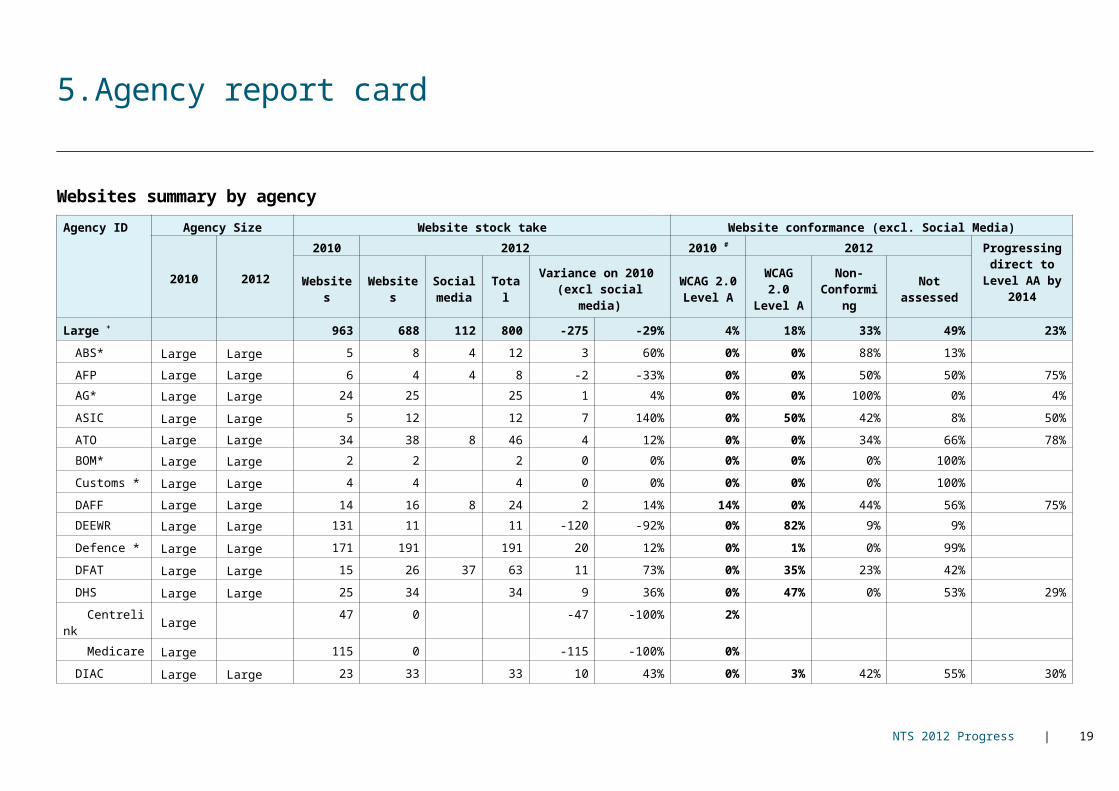
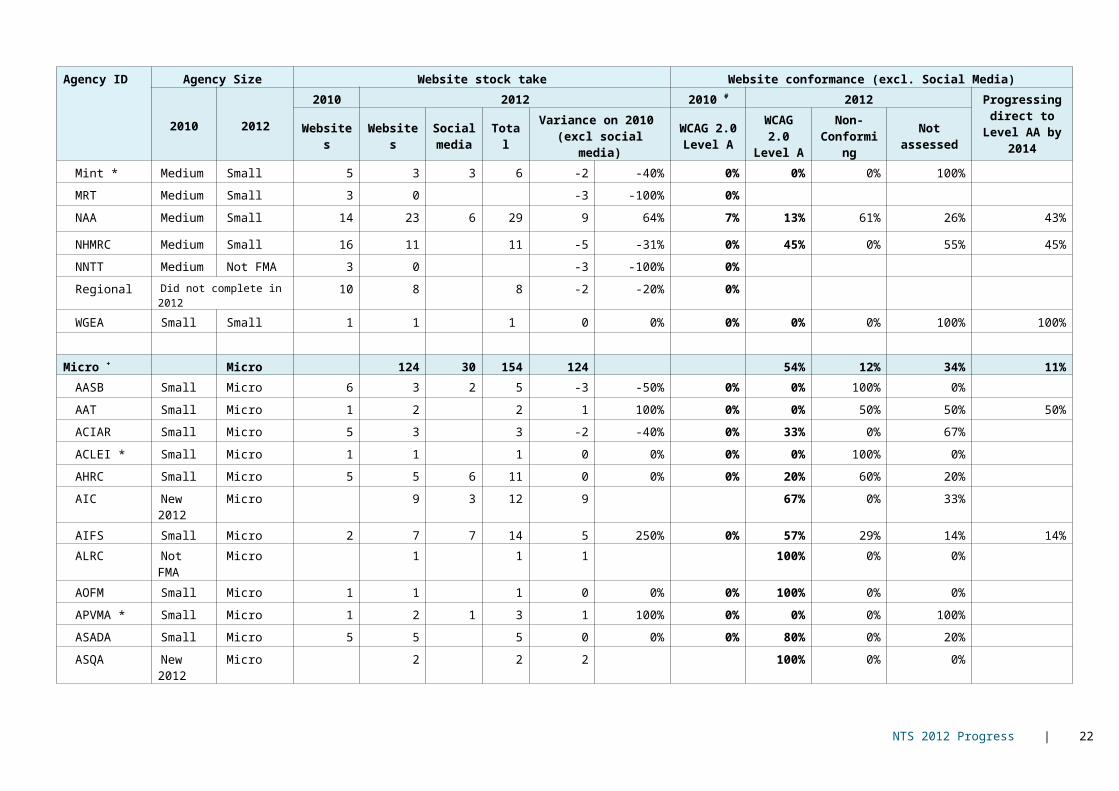
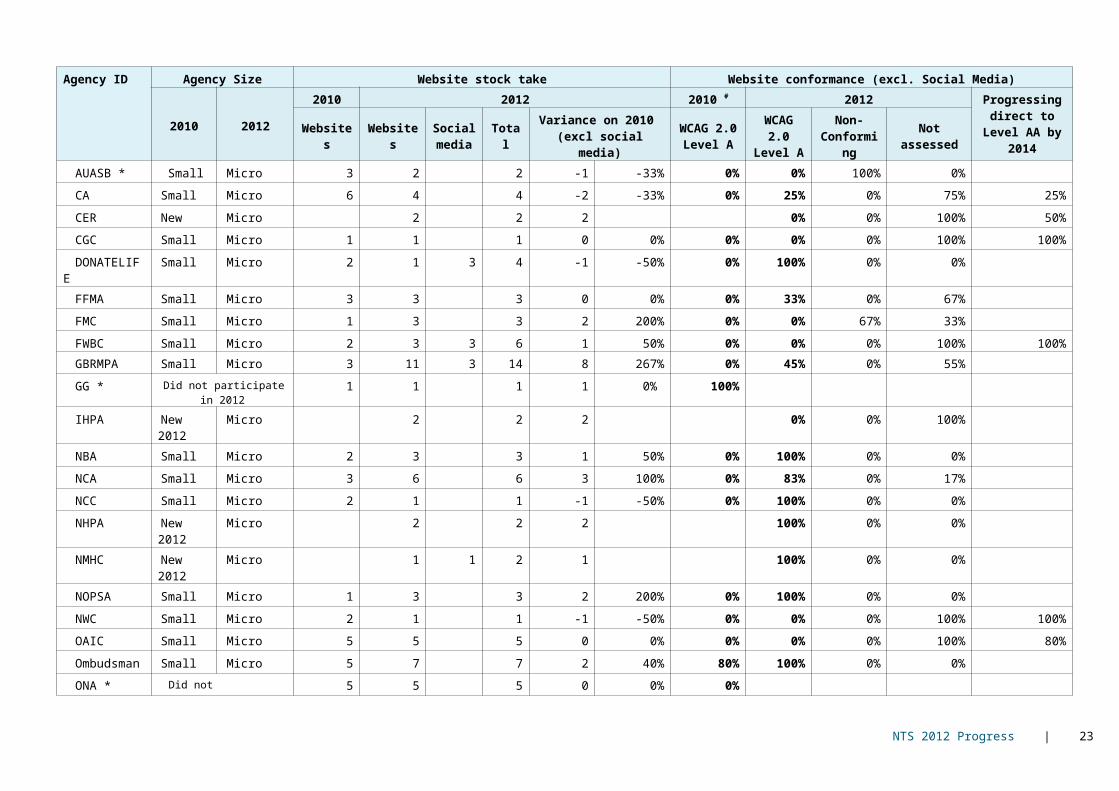
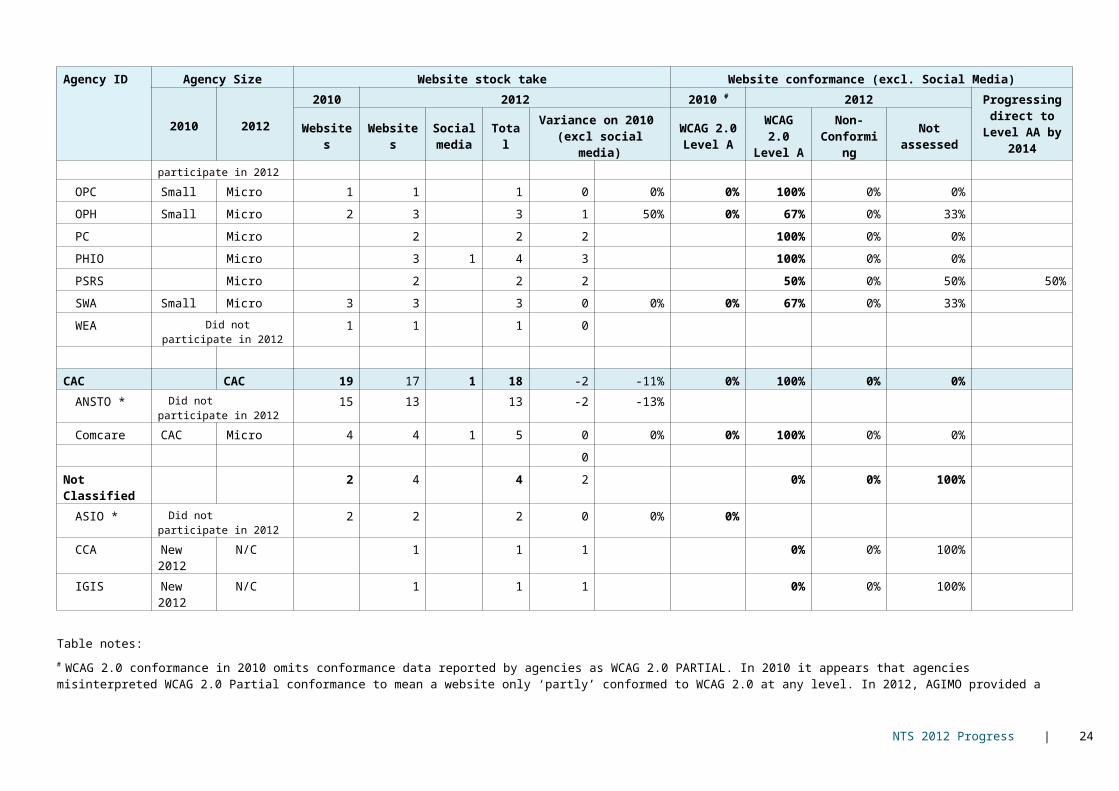
5. Agency report card
Websites summary by agencyAgency ID Agency Size Website stock take Website conformance (excl. Social Media)
2010 2012
2010 2012 2010 # 2012 Progressing direct to Level AA
by 2014Websites Websites Social media Total Variance on 2010
(excl social media)WCAG 2.0
Level AWCAG 2.0
Level ANon-
Conforming Not assessed
Large + 963 688 112 800 -275 -29% 4% 18% 33% 49% 23%
ABS* Large Large 5 8 4 12 3 60% 0% 0% 88% 13%
AFP Large Large 6 4 4 8 -2 -33% 0% 0% 50% 50% 75%
AG* Large Large 24 25 25 1 4% 0% 0% 100% 0% 4%
ASIC Large Large 5 12 12 7 140% 0% 50% 42% 8% 50%
ATO Large Large 34 38 8 46 4 12% 0% 0% 34% 66% 78%
BOM* Large Large 2 2 2 0 0% 0% 0% 0% 100%
Customs * Large Large 4 4 4 0 0% 0% 0% 0% 100%
DAFF Large Large 14 16 8 24 2 14% 14% 0% 44% 56% 75%
DEEWR Large Large 131 11 11 -120 -92% 0% 82% 9% 9%
Defence * Large Large 171 191 191 20 12% 0% 1% 0% 99%
DFAT Large Large 15 26 37 63 11 73% 0% 35% 23% 42%
DHS Large Large 25 34 34 9 36% 0% 47% 0% 53% 29%
Centrelink Large 47 0 -47 -100% 2%
Medicare Large 115 0 -115 -100% 0%
DIAC Large Large 23 33 33 10 43% 0% 3% 42% 55% 30%
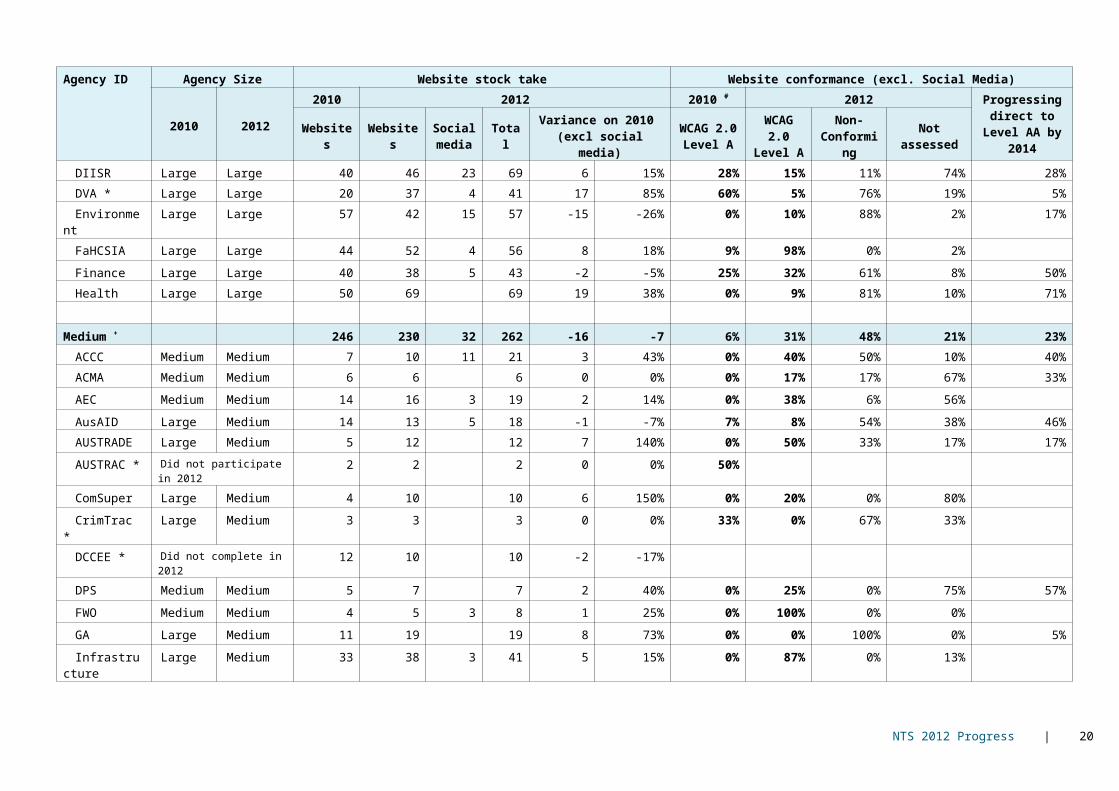
DIISR Large Large 40 46 23 69 6 15% 28% 15% 11% 74% 28%
DVA * Large Large 20 37 4 41 17 85% 60% 5% 76% 19% 5%
Environment Large Large 57 42 15 57 -15 -26% 0% 10% 88% 2% 17%
FaHCSIA Large Large 44 52 4 56 8 18% 9% 98% 0% 2%
NTS 2012 Progress | 14
Agency ID Agency Size Website stock take Website conformance (excl. Social Media)
2010 20122010 2012 2010 # 2012 Progressing
direct to Level AA by 2014Websites Websites Social
media Total Variance on 2010 (excl social media)
WCAG 2.0 Level A
WCAG 2.0 Level A
Non-Conforming Not assessed
Finance Large Large 40 38 5 43 -2 -5% 25% 32% 61% 8% 50%
Health Large Large 50 69 69 19 38% 0% 9% 81% 10% 71%
Medium + 246 230 32 262 -16 -7 6% 31% 48% 21% 23%
ACCC Medium Medium 7 10 11 21 3 43% 0% 40% 50% 10% 40%
ACMA Medium Medium 6 6 6 0 0% 0% 17% 17% 67% 33%
AEC Medium Medium 14 16 3 19 2 14% 0% 38% 6% 56%
AusAID Large Medium 14 13 5 18 -1 -7% 7% 8% 54% 38% 46%
AUSTRADE Large Medium 5 12 12 7 140% 0% 50% 33% 17% 17%
AUSTRAC * Did not participate in 2012 2 2 2 0 0% 50%
ComSuper Large Medium 4 10 10 6 150% 0% 20% 0% 80%
CrimTrac * Large Medium 3 3 3 0 0% 33% 0% 67% 33%
DCCEE * Did not complete in 2012 12 10 10 -2 -17%
DPS Medium Medium 5 7 7 2 40% 0% 25% 0% 75% 57%
FWO Medium Medium 4 5 3 8 1 25% 0% 100% 0% 0%
GA Large Medium 11 19 19 8 73% 0% 0% 100% 0% 5%
Infrastructure Large Medium 33 38 3 41 5 15% 0% 87% 0% 13%
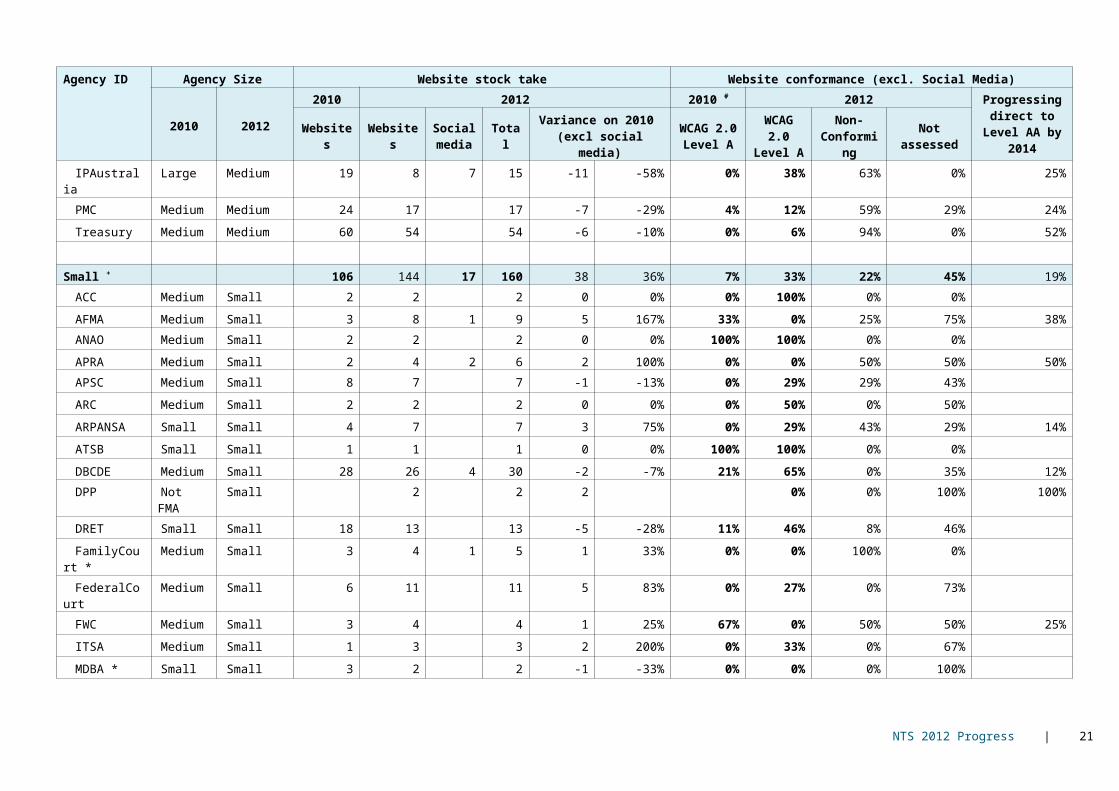
IPAustralia Large Medium 19 8 7 15 -11 -58% 0% 38% 63% 0% 25%
PMC Medium Medium 24 17 17 -7 -29% 4% 12% 59% 29% 24%
Treasury Medium Medium 60 54 54 -6 -10% 0% 6% 94% 0% 52%
Small + 106 144 17 160 38 36% 7% 33% 22% 45% 19%
ACC Medium Small 2 2 2 0 0% 0% 100% 0% 0%
AFMA Medium Small 3 8 1 9 5 167% 33% 0% 25% 75% 38%
ANAO Medium Small 2 2 2 0 0% 100% 100% 0% 0%
APRA Medium Small 2 4 2 6 2 100% 0% 0% 50% 50% 50%
APSC Medium Small 8 7 7 -1 -13% 0% 29% 29% 43%
ARC Medium Small 2 2 2 0 0% 0% 50% 0% 50%
NTS 2012 Progress | 15
Agency ID Agency Size Website stock take Website conformance (excl. Social Media)
2010 20122010 2012 2010 # 2012 Progressing
direct to Level AA by 2014Websites Websites Social
media Total Variance on 2010 (excl social media)
WCAG 2.0 Level A
WCAG 2.0 Level A
Non-Conforming Not assessed
ARPANSA Small Small 4 7 7 3 75% 0% 29% 43% 29% 14%
ATSB Small Small 1 1 1 0 0% 100% 100% 0% 0%
DBCDE Medium Small 28 26 4 30 -2 -7% 21% 65% 0% 35% 12%
DPP Not FMA Small 2 2 2 0% 0% 100% 100%
DRET Small Small 18 13 13 -5 -28% 11% 46% 8% 46%
FamilyCourt * Medium Small 3 4 1 5 1 33% 0% 0% 100% 0%
FederalCourt Medium Small 6 11 11 5 83% 0% 27% 0% 73%
FWC Medium Small 3 4 4 1 25% 67% 0% 50% 50% 25%
ITSA Medium Small 1 3 3 2 200% 0% 33% 0% 67%
MDBA * Small Small 3 2 2 -1 -33% 0% 0% 0% 100%
Mint * Medium Small 5 3 3 6 -2 -40% 0% 0% 0% 100%
MRT Medium Small 3 0 -3 -100% 0%
NAA Medium Small 14 23 6 29 9 64% 7% 13% 61% 26% 43%
NHMRC Medium Small 16 11 11 -5 -31% 0% 45% 0% 55% 45%
NNTT Medium Not FMA 3 0 -3 -100% 0%
Regional Did not complete in 2012 10 8 8 -2 -20% 0%
WGEA Small Small 1 1 1 0 0% 0% 0% 0% 100% 100%
Micro + Micro 124 30 154 124 54% 12% 34% 11%
AASB Small Micro 6 3 2 5 -3 -50% 0% 0% 100% 0%
AAT Small Micro 1 2 2 1 100% 0% 0% 50% 50% 50%
ACIAR Small Micro 5 3 3 -2 -40% 0% 33% 0% 67%
ACLEI * Small Micro 1 1 1 0 0% 0% 0% 100% 0%
AHRC Small Micro 5 5 6 11 0 0% 0% 20% 60% 20%
AIC New 2012 Micro 9 3 12 9 67% 0% 33%
AIFS Small Micro 2 7 7 14 5 250% 0% 57% 29% 14% 14%
ALRC Not FMA Micro 1 1 1 100% 0% 0%
NTS 2012 Progress | 16
Agency ID Agency Size Website stock take Website conformance (excl. Social Media)
2010 20122010 2012 2010 # 2012 Progressing
direct to Level AA by 2014Websites Websites Social
media Total Variance on 2010 (excl social media)
WCAG 2.0 Level A
WCAG 2.0 Level A
Non-Conforming Not assessed
AOFM Small Micro 1 1 1 0 0% 0% 100% 0% 0%
APVMA * Small Micro 1 2 1 3 1 100% 0% 0% 0% 100%
ASADA Small Micro 5 5 5 0 0% 0% 80% 0% 20%
ASQA New 2012 Micro 2 2 2 100% 0% 0%
AUASB * Small Micro 3 2 2 -1 -33% 0% 0% 100% 0%
CA Small Micro 6 4 4 -2 -33% 0% 25% 0% 75% 25%
CER New Micro 2 2 2 0% 0% 100% 50%
CGC Small Micro 1 1 1 0 0% 0% 0% 0% 100% 100%
DONATELIFE Small Micro 2 1 3 4 -1 -50% 0% 100% 0% 0%
FFMA Small Micro 3 3 3 0 0% 0% 33% 0% 67%
FMC Small Micro 1 3 3 2 200% 0% 0% 67% 33%
FWBC Small Micro 2 3 3 6 1 50% 0% 0% 0% 100% 100%
GBRMPA Small Micro 3 11 3 14 8 267% 0% 45% 0% 55%
GG * Did not participate in 2012 1 1 1 1 0% 100%
IHPA New 2012 Micro 2 2 2 0% 0% 100%
NBA Small Micro 2 3 3 1 50% 0% 100% 0% 0%
NCA Small Micro 3 6 6 3 100% 0% 83% 0% 17%
NCC Small Micro 2 1 1 -1 -50% 0% 100% 0% 0%
NHPA New 2012 Micro 2 2 2 100% 0% 0%
NMHC New 2012 Micro 1 1 2 1 100% 0% 0%
NOPSA Small Micro 1 3 3 2 200% 0% 100% 0% 0%
NWC Small Micro 2 1 1 -1 -50% 0% 0% 0% 100% 100%
OAIC Small Micro 5 5 5 0 0% 0% 0% 0% 100% 80%
Ombudsman Small Micro 5 7 7 2 40% 80% 100% 0% 0%
ONA * Did not participate in 2012 5 5 5 0 0% 0%
OPC Small Micro 1 1 1 0 0% 0% 100% 0% 0%
OPH Small Micro 2 3 3 1 50% 0% 67% 0% 33%
NTS 2012 Progress | 17
Agency ID Agency Size Website stock take Website conformance (excl. Social Media)
2010 20122010 2012 2010 # 2012 Progressing
direct to Level AA by 2014Websites Websites Social
media Total Variance on 2010 (excl social media)
WCAG 2.0 Level A
WCAG 2.0 Level A
Non-Conforming Not assessed
PC Micro 2 2 2 100% 0% 0%
PHIO Micro 3 1 4 3 100% 0% 0%
PSRS Micro 2 2 2 50% 0% 50% 50%
SWA Small Micro 3 3 3 0 0% 0% 67% 0% 33%
WEA Did not participate in 2012 1 1 1 0
CAC CAC 19 17 1 18 -2 -11% 0% 100% 0% 0%
ANSTO * Did not participate in 2012 15 13 13 -2 -13%
Comcare CAC Micro 4 4 1 5 0 0% 0% 100% 0% 0%
0 Not Classified 2 4 4 2 0% 0% 100%
ASIO * Did not participate in 2012 2 2 2 0 0% 0%
CCA New 2012 N/C 1 1 1 0% 0% 100%
IGIS New 2012 N/C 1 1 1 0% 0% 100%
Table notes: # WCAG 2.0 conformance in 2010 omits conformance data reported by agencies as WCAG 2.0 PARTIAL. In 2010 it appears that agencies misinterpreted WCAG 2.0 Partial conformance to mean a website only ‘partly’ conformed to WCAG 2.0 at any level. In 2012, AGIMO provided a clear definition of WCAG 2.0 Partial conformance. Consequently the 2010 reports of ‘partial’ conformance have been downgraded for comparison purposes.
* Indicates agencies whose WCAG 2.0 conformance level has either decreased or remained static overall since 2010. It should be noted that some agencies report a portion of their websites, either those non-conforming or those not assessed, do not meet WCAG 2.0 Level A conformance because they are progressing directly to WCAG 2.0 Level AA by 2014. An adjacent column indicates this percentage. + Agencies are reported in their benchmarking cohorts based on their ICT expenditure in the 2010-11 financial year.
NTS 2012 Progress | 18
Websites 2012 summary by agency size/group
Summary Website stocktake Website conformance (excl social media)
2010 2012 2010 2012Progressing direct to
WCAG 2.0 by 2014Size Websites Websites Social
media TotalVariance
on 2010 (excl social media)
WCAG 2.0 Level A
(ex. Partial)
WCAG 2.0 Level A (ex.
SocMed)
Non-Conforming
Not assessed
Large 963 688 112 800 -276 -29% 4% 18% 33% 49% 161 23%
Medium 246 230 32 262 -16 -7% 6% 31% 48% 21% 53 23%
Small 106 144 17 161 38 36% 7% 33% 22% 45% 28 19%
Micro 123 30 153 54% 12% 34% 14 11%
CAC 19 17 1 18 -2 -11% 0% 100% 0% 0%
Not Classified
2 4 4 2 100% 0% 0% 100%
Total 1336 1206 192 1398 -130 -10% 5% 26% 33% 41% 255 21%
NTS 2012 Progress | 19
Web Applications summary by agencyThe ‘total applications reported’ represents the number of web applications that were been reported by each of the agencies. The total amount has been represented across Audience, Ownership and Accessibility status
Agency ID Agency size
Total Applications
Reported
Audience Ownership Mobile ready apps
Accessibility status Upgrade to WCAG 2.0 by 2014
Internal External Both I&E
Agency Other Agency
Vendor non conforming
not assessed
WCAG 2.0
LARGE 674 182 393 99 577 3 94 108 77 471 126 261ABS Large 11 4 7 5 6 1 10 1 1AFP Large 12 12 9 3 12 0AG Large 24 2 15 7 23 1 24 0AHRC Large 1 1 1 1 0ASIC Large 6 2 4 6 1 3 3 0 6ATO Large 13 1 12 10 1 2 12 1 12 0 4BoM Large 9 9 9 1 9 0Customs Large 7 6 1 7 7 0DAFF Large 87 32 51 4 70 17 83 4 83DEEWR Large 27 14 13 27 27 0Defence Large 32 32 31 1 1 32 0 2DFAT Large 40 3 27 10 40 2 38 0 1DHS Large 117 78 37 2 115 1 1 3 75 42 74DIAC Large 34 3 25 6 27 7 3 15 19 0 28DIISRTE Large 7 1 6 4 3 6 1 1DVA Large 25 3 19 3 17 8 1 19 6 6Environment Large 58 17 16 25 49 9 12 12 46 0 8FAHCSIA Large 78 9 49 20 62 16 72 7 71 2Finance Large 41 40 1 22 19 1 1 39 1 1Health Large 45 4 21 20 44 1 45 0 44
NTS 2012 Progress | 20
Agency ID Agency size
Total Applications
Reported
Audience Ownership Mobile ready apps
Accessibility status Upgrade to WCAG 2.0 by 2014
Internal External Both I&E
Agency Other Agency
Vendor non conforming
not assessed
WCAG 2.0
MEDIUM 295 97 159 39 204 11 80 17 79 188 28 16ACCC Medium 9 7 2 1 8 1 9 0AEC Medium 25 10 13 2 21 4 6 2 18 5AusAID Medium 15 2 7 6 11 1 3 3 3 9 1Austrade Medium 6 5 1 6 2 3 1 2ComSuper Medium 9 9 1 8 9 0CrimTrac Medium 26 8 17 1 7 19 4 1 25 0 4DPS Medium 8 7 1 7 1 1 7 1 2FWO Medium 30 2 24 4 20 5 5 23 7 5GA Medium 78 63 13 2 71 3 4 61 17 0Infrastructure Medium 27 4 19 4 17 10 1 23 4 1IPAustralia Medium 42 6 24 12 28 14 4 9 32 1PMC Medium 6 5 1 2 4 6 0 1PSRS Medium 1 1 1 1 0Treasury Medium 13 2 8 3 13 13 0
SMALL 98 14 65 19 41 2 55 5 8 67 23 30ACC Small 9 8 1 2 1 6 9 0 8AFMA Small 10 9 1 10 10 0ANAO Small 4 3 1 1 3 4 4APSC Small 12 3 6 3 6 6 6 4 2 10ARC Small 3 1 2 2 1 3ARPANSA Small 1 1 1 1DBCDE Small 15 12 3 6 9 14 1 1DPP Small 6 1 5 5 1 3 3 3
NTS 2012 Progress | 21
Agency ID Agency size
Total Applications
Reported
Audience Ownership Mobile ready apps
Accessibility status Upgrade to WCAG 2.0 by 2014
Internal External Both I&E
Agency Other Agency
Vendor non conforming
not assessed
WCAG 2.0
FamilyCourt Small 4 4 4 4 0FederalCourt Small 9 6 3 6 3 6 3 5ITSA Small 2 2 2 1 1Mint Small 1 1 1 1NAA Small 14 1 9 4 3 1 10 1 2 11 1 2NHMRC Small 8 7 1 8 5 3 1
MICRO 63 9 39 15 34 3 26 8 5 53 5 30AASB Micro 9 9 5 4 9 0 9AAT Micro 3 1 2 1 2 3 0 3AIFS Micro 12 8 4 1 2 9 11 1APVMA Micro 7 1 3 3 3 4 5 2 4ASQA Micro 1 1 1 1AUASB Micro 3 3 2 1 3 0 3CER Micro 8 3 4 1 8 3 5 0 1GBRMPA Micro 15 1 8 6 10 5 7 15 0 6NBA Micro 2 2 2 2 0 2NCC Micro 1 1 1 1 1 0 1NOPSEMA Micro 1 1 1 1NWC Micro 1 1 1 1 0 1
CAC 4 4 0 0 0 0 4 0 2 2 0 0Comcare 4 4 4 2 2 0 0
NTS 2012 Progress | 22
Appendix Agency acronym keyABS Australian Bureau of StatisticsAASB Office of the Australian Accounting Standards BoardAAT Administrative Appeals TribunalACC Australian Crime Commission
ACCC Australian Competition and Consumer CommissionACIAR Australian Centre for International Agricultural ResearchACLEI Australian Commission for Law Enforcement IntegrityACMA Australian Communications and Media AuthorityAEC Australian Electoral CommissionAFMA Australian Fisheries Management AuthorityAFP Australian Federal PoliceAG Attorney-General’s DepartmentAHRC Australian Human Rights CommissionAIC Australian Institute of CriminologyAIFS Australian Institute of Family StudiesALRC Australian Law Reform CommissionANAO Australian National Audit Office ANPHA (Health) Australian National Preventive Health AgencyAOFM Australian Office of Financial ManagementAPRA Australian Prudential Regulation Authority (APRA)APSC Australian Public Service Commission (APS Commission)APVMA Australian Pesticides and Veterinary Medicines AuthorityARC Australian Research CouncilARPANSA Australian Radiation Protection and Nuclear Safety AgencyASADA Australian Sports Anti-Doping AuthorityASIC Australian Securities and Investments Commission
ASQA Australian Skills Quality Authority (National Vocational Education and Training Regulator)
ATO Australian Taxation Office
ATSB Australian Transport Safety BureauAUASB Office of the Auditing and Assurance Standards Board (ex OAASB)AusAID Australian Agency for International DevelopmentAUSTRAC Australian Transaction Reports and Analysis CentreAustrade Australian Trade Commission (Austrade)BoM Bureau of MeteorologyCA Cancer AustraliaCAMAC (ASIC) Corporations and Markets Advisory CommitteeCCA Climate Change AuthorityCER Clean Energy RegulatorCGC Commonwealth Grants CommissionComSuper ComSuperCrimTrac CrimTrac AgencyCustoms Australian Customs and Border Protection ServiceDAFF Department of Agriculture, Fisheries and Forestry DBCDE Department of Broadband, Communications & the Digital EconomyDCCEE Department of Climate Change and Energy EfficiencyDEEWR Department of Education, Employment and Workplace RelationsDefence Department of DefenceDFAT Department of Foreign Affairs and TradeDHR (DPS) Dept. House of RepresentativesDHS Department of Human ServicesDIAC Department of Immigration and Citizenship
DIISRTE Dept of Industry, Innovation, Science, Research & Tertiary Education
DonateLife Organ and Tissue Authority (Australian Organ and Tissue Donation and Transplantation Authority)
DMO (Defence) Defence Materiel OrganisationDPP Office of the Director of Public ProsecutionsDPS Department of Parliamentary Services
NTS 2012 Progress | 23
DRET Department of Resources, Energy and TourismDVA Department of Veterans’ Affairs
Environment Dept of Sustainability, Environment, Water, Population & Communities
EOWA Equal Opportunity for Women in the Workplace Agency
FAHCSIA Department of Families, Housing, Community Services and Indigenous Affairs
FamilyCourt Family Court of Australia
FederalCourt Federal Court of Australia
FFMA Future Fund Management AgencyFinance Department of Finance and DeregulationFMC Federal Magistrates Court of AustraliaFWBC Office of the Australian Building and Construction CommissionerFWC Fair Work CommissionFWO Office of the Fair Work OmbudsmanGA Geoscience AustraliaGBRMPA Great Barrier Reef Marine Park AuthorityGG Office of the Official Secretary to the Governor-GeneralHealth Department of Health and AgeingIGIS (PMC) Office of the Inspector-General of Intelligence and SecurityIGT (Treasury) Inspector-General of TaxationIHPA Independent Hospital Pricing AuthorityInfrastructure Department of Infrastructure and TransportIPAustralia IP AustraliaITSA Insolvency and Trustee Service AustraliaMDBA Murray-Darling Basin AuthorityMint Royal Australian MintMRT Migration Review Tribunal and Refugee Review Tribunal NAA National Archives of AustraliaNBA National Blood AuthorityNCA National Capital Authority
NCC National Competition Council NHFB (Health) National Health Funding BodyNHMRC National Health and Medical Research Council NHPA National Health Performance Authority NMHC National Mental Health CommissionNNTT National Native Title Tribunal
NOPSEMA National Offshore Petroleum Safety and Environmental Management Authority
NWC National Water Commission OAIC Office of the Australian Information Commissioner OFWBI (FWBC) Office of the Fair Work Building InspectorateOmbudsman Office of the Commonwealth OmbudsmanONA Office of National AssessmentsOPC Office of Parliamentary CounselOPH Old Parliament HousePBO (DPS) Parliamentary Budget OfficePC Productivity CommissionPHIO Private Health Insurance OmbudsmanPMC Department of the Prime Minister and CabinetPSRS Professional Services Review SchemeRegional Dept of Regional Australia, Local Government, Arts and SportSeacare (Comcare)
Seafarers Safety, Rehabilitation and Compensation Authority (including Sea Care Authority)
Senate (DPS) Department of the SenateSWA Safe Work AustraliaTEQSA (DIISRTE) Tertiary Education Quality and Standards AgencyTGA (Health) Therapeutic Goods AdministrationTreasury Department of the TreasuryTUSMA (DBCDE) Telecommunications Universal Service Management Agency
Note: Agencies with another agency acronym in brackets reported under the agency in brackets.
NTS 2012 Progress | 24