Weatherization Assistance Program - nascsp.org · 2 Weatherization Assistance Program Funding...
13
Transcript of Weatherization Assistance Program - nascsp.org · 2 Weatherization Assistance Program Funding...

Summary . . . . . . . . . . . . . . . . . . . . . . . . . . . . . . . . . . . . . . . . . . . . . . . . . . . . . . . . . . . . . . . . . . 1Background . . . . . . . . . . . . . . . . . . . . . . . . . . . . . . . . . . . . . . . . . . . . . . . . . . . . . . . . . . . . . . . . 1Funding Sources . . . . . . . . . . . . . . . . . . . . . . . . . . . . . . . . . . . . . . . . . . . . . . . . . . . . . . . . . . . 2Funding Trends . . . . . . . . . . . . . . . . . . . . . . . . . . . . . . . . . . . . . . . . . . . . . . . . . . . . . . . . . . . . 3Production Summary . . . . . . . . . . . . . . . . . . . . . . . . . . . . . . . . . . . . . . . . . . . . . . . . . . . . . . 4Funding Future . . . . . . . . . . . . . . . . . . . . . . . . . . . . . . . . . . . . . . . . . . . . . . . . . . . . . . . . . . . . 4Weatherization Leveraged Partnerships Project . . . . . . . . . . . . . . . . . . . . . . . . . . . . . 5All Non-Federal Funds Leveraged in the WAP . . . . . . . . . . . . . . . . . . . . . . . . . . . . . . 20
Tables and Figures
Table 1: Total All Funds 2006–2016 . . . . . . . . . . . . . . . . . . . . . . . . . . . . . . . . . . . . . . . . . . . 5Table 2: Total 2006–2016 . . . . . . . . . . . . . . . . . . . . . . . . . . . . . . . . . . . . . . . . . . . . . . . . . . . . . 6Table 3: Total by Funding Source 2016 . . . . . . . . . . . . . . . . . . . . . . . . . . . . . . . . . . . . . . . 8Table 4: DOE Funding Levels 2006–2016 . . . . . . . . . . . . . . . . . . . . . . . . . . . . . . . . . 10Table 5: LIHEAP Funding Levels 2006–2016 . . . . . . . . . . . . . . . . . . . . . . . . . . . . . . . . . 12Table 6: Other Funding Levels 2006–2016 . . . . . . . . . . . . . . . . . . . . . . . . . . . . . . . . . . . 14Table 7: Source of Other Funds . . . . . . . . . . . . . . . . . . . . . . . . . . . . . . . . . . . . . . . . . . . . . . 16Table 8: All Non-Federal Funds 2016 . . . . . . . . . . . . . . . . . . . . . . . . . . . . . . . . . . . . . . . . 21Figure 1: DOE WAP Funding vs . Total WAP Funding 2006–2016 . . . . . . . . . . . . . . 17Figure 2: LIHEAP WAP Funding vs . Total WAP Funding 2006–2016 . . . . . . . . . . . 17Figure 3: Other Funding vs . Total WAP Funding 2006–2016 . . . . . . . . . . . . . . . . . . 18Figure 4: Total All Funding Sources 2006–2016 . . . . . . . . . . . . . . . . . . . . . . . . . . . . . . 18Figure 5: WAP Funding Over Time 2006–2016 . . . . . . . . . . . . . . . . . . . . . . . . . . . . . . . 19Figure 6: WAP Funding by Source 2016 . . . . . . . . . . . . . . . . . . . . . . . . . . . . . . . . . . . . . . 19
1National Association for State Community Services Programs
Weatherization Assistance ProgramPY 2016 Funding ReportSummary
The National Association for State Community Services Programs’ (NASCSP) 2016 funding report included all 50 states; the District of Columbia; five U .S . Territories (Guam, U .S . Virgin Islands, American Samoa, Commonwealth of Puerto Rico, Commonwealth of the Northern Mariana Islands (CNMI)); and three Native American Tribes (Inter-Tribal Council of Arizona (ITCA), Navajo Nation, Northern Arapaho Tribe) . The report finds that an estimated $866,132,877 was available to Grantees of the U .S . Department of Energy’s (DOE) Weatherization Assistance Program (WAP) for Program Year (PY) 2016 (April 1, 2016 to March 31, 2017 for some Grantees, July 1, 2016 to June 30, 2017 for most others, and October 1, 2016 to September 30, 2017 for others) in regular DOE, Low Income Home Energy Assistance Program (LIHEAP), and Other funds . This figure represents an increase of $4,961,666 in overall funds (1%) from the 2015 funding level of $861,171,211 . A national network of Grantees, sub-grantees, and private contractors will use these annual grant funds to weatherize an estimated 123,050 low-income homes . This reflects a decrease of 6,744 units from the reported 2015 total (129,794) .
New to the PY 2016 report is additional data from the Weatherization Leveraged Partnerships Project, a joint initiative of Economic Opportunity Studies and the Community Action Partnership . This project aims to identify additional leveraged funds not captured by State WAP Offices' reporting . This initiative identified an additional $122,284,787 of non-federal funds available to the network . For more information, see Page 20 and Table 8 .
Background
The WAP was created in 1976 in order to lower the utility expenses of low-income families who lack the resources to invest in energy efficiency improvements for their homes . The mission of the WAP is “to reduce energy costs for low-income families, particularly for the elderly, people with disabilities, and children, by improving the energy efficiency of their homes while ensuring their health and safety .” All 50 states, the District of Columbia, three Native American tribes, and five U .S . Territories operate the WAP and use funds to improve the energy efficiency of low-income homes with the most advanced technologies and diagnostic testing protocols available in the energy efficiency retrofit industry . The energy savings resulting from the efforts of the WAP helps the United States reduce its dependence on foreign oil and decrease the cost of energy for families in need while improving the durability, comfort, and safety of their homes .
Annual DOE appropriations from Congress provide the core funding for the WAP, which is governed by various federal regulations designed to manage and account for the resources provided and to ensure proper expenditure of taxpayer dollars . The NASCSP WAP Funding Report provides a comprehensive aggregation of information on all funding sources contributing to the WAP . Each year, the report catalogues the funding and production levels for each Grantee of the WAP as well as the source of that funding . The WAP Funding Report also serves as the historical reference for all Program funding from various sources, maintaining data for more than 20 years and publishing the previous 10 years in each report .
Program Year 2016 was marked by an increase in total reported available funding over PY 2015 . Funding has stabilized following the ramp-down after higher funding levels during the Recovery Act, which infused $5 billion into the Program and allowed unprecedented expansion in infrastructure, workforce, and training . Recovery Act funds and production were included in the 2010 – 2012 Funding Reports .

Weatherization Assistance Program2
Funding SourcesAs in past program years, weatherization funds come from three major sources: the DOE’s WAP, the U .S . Department of Health and Human Services’ (HHS) LIHEAP, and Other funds . The term “Other” is used to categorize all sources of funding other than DOE and LIHEAP, most often from utility partnerships and State sources .
DOEDOE Grantees estimate $221,488,248 in DOE regular funds were available in PY 2016 to weatherize 42,989 homes . This figure represents an increase of 10 .4 percent compared to the funds reported for 2015 ($200,552,009) . DOE funds were used to weatherize 6,237 fewer units than the 2015 reported total of 49,226 units . In 2016, DOE funding represents 25 .6 percent of the total funds available for the WAP, an increase of 2 .3 percent from 2015 (23 .3%) .
LIHEAPState LIHEAP offices may utilize up to 15 percent of the LIHEAP block grant to fund WAP related activities, or up to 25 percent with an approved waiver . This can include emergency energy efficiency related repairs as well as traditional weatherization, among other items . In 2016, WAP Grantees estimate $408,328,683 in LIHEAP funds are available for these energy efficiency activities . This is an increase of 0 .7 percent or $2,649,402 from the funds reported for 2015 ($405,679,281) .
Funds provided through LIHEAP comprise 47 .1% percent of the total funds available in 2016 . This was level with the percentage in 2015 . Forty-eight (48) grantees will transfer LIHEAP funds into the WAP in 2016, the same number of grantees that did so in 2015 . Of those Grantees transferring LIHEAP funds into the WAP in 2016, 23 increased and 19 decreased LIHEAP transfers . Six Grantees transferred the same amount as last year . At the time of the report, Puerto Rico had not received a LIHEAP transfer, although they did receive a LIHEAP transfer in program year 2015 . A total of 11 Grantees did not transfer LIHEAP funds in 2016, including Connecticut, Hawaii, South Dakota, Vermont, Inter-Tribal Council of Arizona (ITCA), Navajo, Northern Arapaho, Puerto Rico, Guam, Northern Mariana Islands, and the Virgin Islands . LIHEAP transfers range from a low of $111,731 in Delaware to a high of $44,131,278 in California .
OtherWAP operators will use $236,315,946 in other funds to expand WAP services in 2016 . This represents a decrease of 7 .3% percent, or $18,623,975, compared to last year’s reported funding level of $254,939,921 . The Funding Report reflects Other funds that are administered by the Grantees or are reported to the Grantees . Other funds awarded directly to sub-grantee agencies may not be reflected in this report (See Page 20 for information about additional non-federal funds collected by the Weatherization Leveraged Partnerships Project) .
Other funds can be broken into two major categories: Utility funds and State Funds . Utility Funds are any funds that utilities collect from ratepayers and either transfer to a public benefit fund, to a WAP state agency, or to programs run directly by contracting with WAP local agencies . Utility funds make up the majority of Other funding . State funds refer to funds that come from state-collected revenues such as fees or tax revenues . For example, funds from energy production royalties paid to the state or from similar revenues are considered State funds . Additionally, State funding includes funding from state general revenues or appropriated to WAP in the state budget . Only 11 states reported State Funds in 2016 .
A total of 27 Grantees reported utilizing Other funds in 2016, reduced from 29 in 2015 . The District of Columbia, Georgia, and Wyoming reported Other funds last year, but reported no Other funding in 2016 . West Virginia did not report Other funds last year, but did report other funds in 2016 . Delaware, Indiana, Minnesota, and New Mexico each reported greater than 50 percent increases in Other funds compared to 2015 . The Other funds category represents 27 .3% percent of the total funds available for the WAP in 2016, a decrease of approximately 2 .3 percentage points compared to last year’s representation (29 .6%) . When looking at the data from the Weatherization Leveraged Partnerships Project, an additional
3National Association for State Community Services Programs
12 states had access to additional non-federal funds from utilities and other sources . For more information, see Page 20 and Table 8 .
Funding TrendsThe FY 2016 appropriations level of $215 million to the DOE WAP enacted by Congress demonstrates the ongoing support of the program by its funders and a continued upward trend in DOE WAP funding . This represents a $22 million increase over the FY 2015 appropriation of $193 million . Below are some of the other funding trends reflected in the FY 2016 Report:
•During the past 10 years, available DOE funding has fluctuated from a high of $413,276,722 in 2009 at the beginning of the Recovery Act period to a low of $146,920,676 in 2013 . With $221,488,248 available in 2016, the DOE program is approaching funding levels pre-Recovery Act . For reference, in 2008, prior to Recovery Act, a total of $237,506,900 was reported by Grantees as available DOE funds .
•The regulations governing LIHEAP allow for up to 15 percent of a Grantee’s allocation to be used for the WAP . Up to 25 percent is allowable with a waiver from HHS . The amount of LIHEAP funds dedicated to the WAP is usually in direct proportion to the national appropriation of these funds by Congress and the distribution of emergency LIHEAP funds by the President . In 2016, Congress appropriated $3 .39 billion to LIHEAP . Forty-eight (48) WAP grantees reported receiving LIHEAP transfers for a total of $ $408,328,683 in 2016 or approximately 12 percent of the 2016 national LIHEAP allocation . This reflects $2,649,402 more in LIHEAP transfers than 2015 . It is reasonable to assume that as LIHEAP appropriations fluctuate, so will the amounts transferred to the WAP .
• Leveraging additional resources is necessary to offset fluctuations in federal funding, better meet the backlog of qualified households needing services, and to provide more comprehensive services on homes and prevent deferral . Grantees and local WAP sub-grantees continue to seek leveraging opportunities with companion programs and other publicly and privately funded initiatives to increase funding and improve the selection of services available to low-income families . Slightly fewer Grantees in 2016 reported receiving Other funds and Grantees reported leveraging about $18 million less in Other funds this year compared to 2015 . Examining the sources of Other funds reveals that this decrease is largely attributable to a drop in State funds . Many states reported increased utility funding, while many states reported significant cuts to State funding . For example, Wyoming lost all State funding and Alaska saw a 75% decrease, representing a loss of just over $20 million . This is likely symptomatic of a larger trend of shrinking state budgets and slow revenue growth (National Conference of State Legislatures, State Budget Update, 2017) . Overall only 11 states reported State Funding for WAP . Additionally, many WAP subgrantee agencies leverage funds directly from utilities and these funds are not captured by the State office . In 2016 the Weatherization Leveraged Partnerships Project identified an additional $122,284,787 in non-federal funds leveraged by the network . Please see Page 20 and Table 8 for more information about additional non-federal funds leveraged by WAP .
•WAP activities continue to depend on a variety of funding sources . The WAP relies heavily on leveraging activity . In 2016, the WAP will utilize approximately $644,644,629 of non-DOE funds (LIHEAP and Other funds), or approximately $2 .91 in other federal and non-federal resources for every dollar invested by DOE . When looking exclusively at non-federal funds reported by States and subgrantees, WAP leveraged $1 .62 in non-federal funds for every DOE dollar reported (See Page 20) . Grantees may budget a portion of DOE funds as “leveraging funds” to be used in initiatives to garner additional funding from sources outside the traditional network . DOE funds, as well as the reputation and standards of DOE, are critical to the success of WAP network leveraging activities .

Weatherization Assistance Program4
Production Summary
The WAP Funding Report provides an opportunity for Grantees to estimate the number of homes to be weatherized using various funding sources . The average maximum allowable cost per unit has steadily increased from $2,966 in 2008 to $7,105 in 2015, making it possible to more comprehensively address energy efficiency measures in homes . The 2016 adjusted maximum allowable average cost per unit did not increase and remained at $7,105 . The 2016 WAP Funding Report results indicate that the network will weatherize approximately 123,050 homes using all funds . Some Grantees report production as “unduplicated” – meaning that a single specific funding source (DOE, LIHEAP) is used for those jobs . Other Grantees report production as “blended” – meaning that other funds (LIHEAP, Other) are added to DOE or other funds to enhance the energy efficiency services to program recipients . The following are some highlights and conclusions related to the production reports:
•Grantees will weatherize approximately 42,989 units using primarily DOE funds including those units using DOE funds blended with LIHEAP and/or Other funds . This represents a decrease of 6,237 units than the 2015 reported total of in 49,226 units . 27 Grantees (or 45 percent) reported their DOE production as unduplicated, while 32 Grantees (or 54 percent) reported their DOE production is blended with LIHEAP and/or Other funds .
•Grantees will weatherize approximately 47,200 homes using LIHEAP as the primary funding source, either with just LIHEAP funds or combined with Other funds . This reflects a decrease of 2,931 units from the reported total of 50,131 units in 2015 . These units will likely not be reported to DOE as completions because there is no requirement to report units to DOE that do not include a DOE investment .
•Grantees will use Other funds as the sole funding source to work on 32,861 units in 2016 . This reflects an increase of 2,424 from the 2015 reported total of 30,437 units . It is important to note that Other funds are often used to supplement DOE and LIHEAP funds in a home and are frequently reported as completed homes for DOE or LIHEAP; however homes weatherized using Other funds may or may not be reported to DOE based on the source of the leveraging activity and DOE’s investment in the units .
Funding FutureWide program funding fluctuations that occurred after FY 2009 have stabilized . In recent years the DOE-WAP has fully implemented the DOE Quality Work Plan, which requires credentialing for Quality Control Inspectors (QCI) and implements the national Standard Work Specifications (SWS) for the installation of home energy efficiency measures . 100% of WAP units receive an inspection by a certified QCI . These initiatives have shown a strong commitment by the DOE, Grantees, and sub-grantees to increase the professionalism and quality of the program . Funding stabilization can be at least partly attributed to the success of these initiatives and the commitment at all levels of the WAP to increase energy savings, provide quality services, and protect the health and safety of eligible households . DOE has continued to enhance WAP operations by administering the American Customer Satisfaction Index (ACSI) survey to all grantees and sub-grantees of the program in early 2017 . Feedback received is being used to improve processes, procedures, and cost effectiveness at all levels of the program .
The Department of Energy proposed eliminating WAP funding in FY 2018, therefore the long term funding future of the program is uncertain . In the FY 2017 Omnibus appropriations bill, Congress signaled continued support for the program, appropriating $228 million to WAP . This represents a $13 million increase over the FY 2016 level of $215 million . The Department of Health and Human Services also recommended the elimination of funding for LIHEAP in FY2018 . As a result, the amount of LIHEAP funds to be transferred to WAP in future years is uncertain .
The WAP network will rely on continued Congressional support and securing additional alternative revenue sources for the WAP . The WAP network is dependent on DOE funding to support administration at the Grantee and sub-grantee
5National Association for State Community Services Programs
levels, the auditing of homes, training and technical assistance, related health and safety measures, quality control, and the evaluation of program effectiveness . DOE funding has typically defined the WAP network and infrastructure; and DOE rules, guidance, and standards are the foundation for the entire WAP network and other funding sources . For approximately the past 40 years, professionals working within the WAP have developed exacting standards for effectiveness, quality, and energy efficiency . By achieving these high standards, the WAP is the leader of the energy efficiency retrofit industry in best practices, diagnostic testing protocols, and installation techniques creating an environment in which other public and private organizations are willing to invest .
DOE funds remain critical to continued program success . The continued operation of the WAP as a national program serving all local jurisdictions is threatened without adequate DOE funding levels . It is unlikely that States and private sources can make up the gap in funding should DOE WAP appropriations be eliminated . Leveraging additional resources will be increasingly critical to sustaining the WAP at its current nationwide scale and sustaining the WAP’s current impact . The WAP network is engaged in developing new partnerships to expand the role of the WAP in local communities with the intent to provide a more comprehensive set of services to low-income WAP clients through initiatives such as Weatherization Plus Health and Healthy Homes . WAP operators are keenly aware that more diverse funding streams will lessen the impact of major reductions to any single funding source .
Collaboration with Weatherization Leveraged Partnerships Project
New for the PY 2016 report, NASCSP has partnered with the Weatherization Leveraged Partnerships Project (WLPP), a joint initiative of Economic Opportunity Studies and the Community Action Partnership . The WLPP interviewed WAP subgrantees, utilities, Community Action Associations, and other sources to identify additional non-federal funding used by WAP subgrantees that have not historically been captured by State WAP offices in NASCSP's report . This information is presented in detai in Table 8 on pages 20 and 21 of this report .
Weatherization Assistance Program Funding Survey
Table 1: Total All Funds 2006–2016
2006 $238,291,851 32 .7% $312,664,523 43 .0% $3,761,577 0 .5% $173,109,924 23 .8% $727,827,875 100 .0%
2007 $206,424,695 30 .4% $260,115,214 38 .3% $4,287,384 0 .6% $207,581,430 30 .6% $678,408,724 100 .0%
2008 $237,506,900 24 .2% $332,778,124 34 .0% $9,379,580 1 .0% $400,299,377 40 .8% $979,963,981 100 .0%
2009 $413,276,722 39 .7% $456,021,761 43 .8% $852,159 0 .1% $170,238,501 16 .4% $1,040,389,143 100 .0%
2010 $204,686,484 24 .5% $422,535,800 50 .7% * $206,629,086 24 .8% $833,851,370 100 .0%
2011 $243,291,578 26 .3% $452,100,169 48 .9% * $228,536,931 24 .7% $923,928,679 100 .0%
2012 $205,249,424 22 .3% $445,136,955 48 .3% * $270,691,758 29 .4% $921,078,137 100 .0%
2013 $146,920,676 16 .1% $408,876,287 44 .7% * $358,612,896 39 .2% $914,409,859 100 .0%
2014 $197,823,696 22 .8% $397,307,126 45 .8% * $272,349,403 31 .4% $867,480,225 100 .0%
2015 $200,552,009 23 .3% $405,679,281 47 .1% * $254,939,921 29 .6% $861,171,211 100 .0%
2016 $221,488,248 25 .6% $408,328,683 47 .1% * $236,315,946 27 .3% $866,132,877 100 .0%
Funding Source
DOE LIHEAP PVE Other Total
*PVE figure included in Other fundsNote: 2015 totals have changed due to amended figures submitted by states

Weatherization Assistance Program6
Grantee 2006 2007 2008 2009 2010 2011 Alabama $3,829,626 $3,214,809 $3,451,916 $9,000,537 $2,232,352 $2,018,560Alaska $5,341,472 $6,131,367 $202,040,077 $3,052,478 $37,729,537 $31,987,597Arizona $4,972,511 $6,797,021 $9,225,865 $7,710,488 $8,339,816 $10,800,444Arkansas $4,109,158 $4,663,316 $5,369,603 $7,979,054 $6,996,720 $6,800,715California $44,623,968 $29,027,786 $30,040,723 $63,716,032 $61,693,230 $61,758,548Colorado $14,066,141 $12,270,886 $12,051,593 $11,416,305 $11,634,451 $20,918,861Connecticut $7,543,439 $6,942,994 $9,005,304 $12,815,348 $3,722,276 $1,909,269Delaware $1,112,727 $1,385,509 $1,598,420 $3,962,172 $1,460,428 $2,256,401Dist . Columbia $4,654,614 $5,220,735 $9,736,259 $7,142,279 $6,563,019 $2,948,766Florida $7,957,713 $9,105,628 $19,669,400 $17,686,988 $1,484,081 $15,081,202Georgia $10,332,669 $7,426,583 $7,959,157 $13,233,067 $6,951,778 $11,151,393Hawaii $217,160 $282,379 $282,379 $393,559 $669,266 $170,561Idaho $7,846,308 $9,782,584 $8,311,847 $10,257,617 $7,839,911 $8,954,781Illinois $44,457,622 $37,797,411 $52,300,069 $60,443,286 $38,732,251 $45,214,734Indiana $14,503,063 $14,983,057 $15,607,244 $18,636,696 $12,648,950 $15,913,160Iowa $15,427,498 $14,739,152 $15,313,555 $23,722,850 $19,070,816 $27,870,844Kansas $5,331,304 $6,765,489 $5,016,807 $11,550,282 $4,563,931 $8,334,670Kentucky $10,284,771 $9,328,490 $11,957,645 $7,640,899 $5,070,670 $4,477,261Louisiana $4,697,518 $4,250,967 $10,050,690 $11,773,632 $4,183,867 $5,961,901Maine $8,913,916 $6,667,043 $7,906,946 $12,103,990 $7,626,351 $3,136,132Maryland $6,019,356 $3,556,774 $5,554,363 $7,648,390 $7,265,448 $6,149,017Massachusetts $36,392,057 $34,750,524 $36,115,129 $52,794,866 $47,137,610 $54,970,851Michigan $22,946,624 $23,989,024 $29,043,849 $43,449,859 $36,249,465 $41,922,668Minnesota $23,267,635 $16,579,465 $20,772,492 $27,901,628 $26,013,496 $21,578,021Mississippi $1,850,660 $1,476,791 $1,640,948 $8,744,293 $7,527,055 $7,114,683Missouri $10,999,886 $8,272,886 $9,356,596 $14,523,993 $7,656,676 $16,755,858Montana $8,147,477 $8,147,477 $10,122,015 $12,450,858 $8,161,843 $10,685,643Nebraska $7,149,459 $4,546,040 $5,441,725 $9,660,622 $6,862,341 $6,595,510Nevada* $4,457,994 $4,909,884 $5,170,074 $5,627,218 $4,127,811 $3,652,980New Hampshire $4,222,520 $4,292,709 $5,205,906 $3,033,628 $1,693,071 $1,887,808New Jersey $10,973,959 $10,167,095 $11,358,338 $28,044,562 $24,744,240 $29,869,812New Mexico $3,580,690 $4,079,992 $3,939,992 $8,215,856 $6,597,429 $5,334,796New York $65,305,457 $63,009,524 $77,800,000 $114,500,000 $70,614,147 $73,911,550North Carolina $14,591,405 $9,821,669 $12,319,935 $16,322,200 $12,435,097 $14,556,773North Dakota $4,589,151 $4,354,121 $5,500,000 $1,664,727 $3,569,451 $6,065,145Ohio $56,636,231 $61,220,651 $61,601,632 $53,633,503 $49,313,107 $26,698,721Oklahoma $5,092,386 $3,964,430 $4,594,573 $7,750,319 $3,162,040 $2,884,504Oregon $13,815,641 $17,866,503 $14,017,108 $18,514,098 $17,334,456 $17,845,248Pennsylvania $43,093,384 $41,728,518 $49,233,884 $41,100,552 $30,177,169 $36,144,041Rhode Island $4,713,599 $5,428,205 $4,768,801 $7,682,479 $5,502,223 $10,988,873South Carolina $3,980,397 $3,587,936 $3,869,409 $11,722,199 $11,452,883 $12,608,421South Dakota $3,580,351 $3,516,592 $5,057,661 $3,513,071 $2,013,071 $1,513,071Tennessee $7,237,435 $5,987,655 $17,052,105 $10,425,559 $1,834,789 $11,444,417Texas $20,689,503 $13,918,324 $13,881,694 $44,814,627 $37,015,179 $38,260,450Utah $5,983,065 $5,377,415 $10,289,015 $7,022,718 $4,588,680 $2,898,129Vermont $7,337,289 $8,633,731 $9,215,727 $6,615,014 $6,014,491 $7,980,912Virginia $15,594,662 $10,381,007 $10,552,753 $27,176,199 $19,722,335 $19,213,899Washington $18,588,110 $19,630,502 $19,067,884 $32,380,236 $27,948,910 $24,139,883West Virginia $7,393,377 $7,269,890 $8,317,959 $12,007,938 $9,183,581 $8,123,427Wisconsin $64,938,612 $69,672,345 $68,199,241 $82,802,765 $82,696,472 $107,873,157Wyoming $4,073,872 $1,198,193 $3,597,197 $2,311,280 $4,025,231 $4,075,173ITCA* * n/a n/a n/a n/a $79,614 $67,245Navajo $362,433 $289,645 $321,735 $703,848 $242,391 $234,760N . Arapaho n/a n/a n/a $144,840 $69,412 $77,145American Samoa n/a n/a n/a $196,784 $283,860 $215,257Guam n/a n/a n/a $198,908 $357,856 $513,233Puerto Rico n/a n/a n/a $452,558 $647,129 $627,557N . Mariana Isles n/a n/a n/a $198,908 $155,635 $352,821Virgin Islands n/a n/a n/a $200,481 $161,976 $431,420
Totals $727,827,875 $678,408,724 $979,875,240 $1,040,389,143 $833,851,370 $923,928,679% of Prog . Funding 100% 100% 100% 100% 100% 100%Number of Grantees receiving funds 52 52 52 58 59 59
Weatherization Assistance Program Funding Report
Table 2: Total Funding byState 2006–2016
Note: n/a indicates that the entity was not a Grantee at the time .
* * Inter-Tribal Council of Arizona
2012 2013 2014 2015 2016% change
2015 to 2016 2016 Total Unit
Production$3,354,516 $6,230,495 $5,345,193 $5,011,950 $5,159,411 3% 543
$58,660,480 $60,472,690 $38,679,000 $25,698,387 $8,092,460 -69% 415$10,617,349 $8,722,041 $8,652,990 $4,585,187 $4,672,906 2% 309
$8,897,874 $5,569,793 $5,569,793 $4,432,812 $5,624,005 27% 686$47,952,744 $38,558,815 $56,449,422 $70,948,731 $64,827,155 -9% 14,543$17,738,473 $19,669,969 $19,169,732 $19,502,370 $19,305,848 -1% 2,974
$1,319,737 $1,000,092 $2,463,560 $3,058,027 $4,122,381 35% 691$2,952,395 $2,898,641 $2,519,916 $1,136,261 $1,602,475 41% 252
$688,950 $2,978,601 $2,259,637 $2,056,793 $1,808,852 -12% 426$16,494,878 $10,825,416 $11,538,547 $12,074,687 $12,408,517 3% 754$13,726,553 $6,799,639 $6,450,127 $6,323,810 $5,329,878 -16% 929
$216,041 $76,406 $171,836 $283,438 $273,774 -3% 33$8,877,298 $9,558,391 $10,514,415 $10,738,332 $9,942,459 -7% 571
$60,639,222 $66,136,695 $21,322,503 $30,584,630 $31,666,143 4% 10,426$22,051,087 $20,286,955 $17,243,942 $15,809,345 $17,996,002 14% 1,207$21,625,772 $16,552,052 $18,161,773 $18,532,746 $19,019,085 3% 1,340
$6,620,508 $6,660,517 $6,835,602 $7,826,999 $8,318,180 6% 959$11,688,423 $9,479,846 $8,910,979 $9,879,890 $12,178,917 23% 652
$8,387,869 $7,296,092 $7,218,726 $6,039,579 $6,133,859 2% 624$5,131,008 $3,856,591 $7,193,693 $13,329,713 $13,360,862 0% 513
$22,363,895 $25,296,493 $35,750,550 $16,262,333 $19,217,521 18% 1,399$51,794,887 $52,614,575 $52,082,211 $50,078,167 $55,362,091 11% 27,896$12,147,503 $20,565,468 $20,951,829 $20,540,461 $20,397,981 -1% 2,358$24,107,718 $18,423,694 $21,144,255 $15,869,815 $22,639,261 43% 1,139
$5,313,171 $4,638,586 $6,041,524 $5,351,642 $6,217,006 16% 616$15,709,017 $7,684,942 $14,591,621 $14,952,471 $15,892,121 6% 1,369$10,207,356 $8,351,264 $9,806,212 $10,978,779 $11,181,455 2% 1,199
$5,247,883 $3,831,397 $5,259,438 $4,495,692 $3,746,230 -17% 351$4,696,152 $4,637,405 $5,177,218 $5,389,215 $5,165,913 -4% -$1,777,000 $7,428,271 $6,767,735 $7,042,667 $7,615,664 8% 967
$24,196,759 $17,787,690 $11,589,596 $17,534,873 $17,815,346 2% 1,844$5,282,375 $2,760,967 $4,223,857 $4,461,426 $6,146,013 38% 1,243
$69,362,251 $53,190,469 $50,274,524 $57,784,513 $57,928,696 0% 7,658$24,006,330 $25,812,396 $25,581,690 $21,109,878 $19,786,756 -6% 2,428
$6,031,880 $6,731,763 $11,272,895 $11,403,958 $15,011,513 32% 567$38,089,246 $85,585,795 $65,393,206 $68,077,908 $72,767,702 7% 13,241
$5,264,375 $3,530,725 $3,943,140 $3,666,950 $4,426,960 21% 462$17,269,757 $20,012,254 $18,194,200 $18,651,264 $18,630,710 0% 1,402$44,578,644 $32,689,516 $42,777,445 $42,843,467 $41,582,786 -3% 1,649
$8,798,600 $9,166,244 $10,505,421 $9,164,095 $8,139,596 -11% 1,365$11,983,009 $7,132,336 $7,029,740 $6,811,295 $6,741,888 -1% 385
$1,465,115 $505,656 $1,506,381 $1,591,553 $1,776,878 12% 199$4,512,390 $4,512,390 $3,903,512 $6,119,816 $6,937,945 13% 638
$31,506,604 $30,089,267 $29,555,444 $22,660,153 $23,272,825 3% 2,960$5,865,720 $5,551,253 $7,645,582 $6,732,879 $7,221,573 7% 530$7,447,003 $15,750,889 $11,176,620 $8,184,670 $9,596,968 17% 906
$12,065,449 $14,029,790 $17,359,930 $15,578,155 $16,302,233 5% 437$19,278,301 $30,514,025 $23,287,434 $33,331,408 $25,989,111 -22% 1,995
$8,909,854 $8,308,670 $7,793,401 $7,123,395 $8,729,671 23% 493$87,938,723 $76,830,768 $73,083,405 $70,161,015 $71,683,420 2% 5,608
$4,551,102 $4,504,388 $3,895,931 $3,897,015 $3,280,868 -16% 459$61,729 $73,729 $150,736 $78,448 $87,250 11% 11
$245,277 $340,632 $447,855 $268,138 $300,659 12% 50$94,450 $105,798 $89,077 $83,546 $93,053 11% 13
$151,424 $132,094 $317,172 $442,774 $454,452 3% 70$422,425 $453,500 $584,602 $349,207 $370,948 6% 20
$0 $405,670 $1,014,413 $3,842,626 $1,282,095 -67% 152$280,000 $354,105 $39,858 $231,169 $252,174 9% 24$413,587 $445,248 $599,179 $170,688 $244,376 43% 100
$921,078,137 $914,409,859 $867,480,225 $861,171,211 $866,132,877 1% 123,050100% 100% 100% 100% 100%
59 59 59 59 59
Note: Figures in red in the 2015 column represent amended figures .
*Nevada production data unavailable. Funding data was compiled from publicly available sources
7National Association for State Community Services Programs
Grantee 2006 2007 2008 2009 2010 2011 Alabama $3,829,626 $3,214,809 $3,451,916 $9,000,537 $2,232,352 $2,018,560Alaska $5,341,472 $6,131,367 $202,040,077 $3,052,478 $37,729,537 $31,987,597Arizona $4,972,511 $6,797,021 $9,225,865 $7,710,488 $8,339,816 $10,800,444Arkansas $4,109,158 $4,663,316 $5,369,603 $7,979,054 $6,996,720 $6,800,715California $44,623,968 $29,027,786 $30,040,723 $63,716,032 $61,693,230 $61,758,548Colorado $14,066,141 $12,270,886 $12,051,593 $11,416,305 $11,634,451 $20,918,861Connecticut $7,543,439 $6,942,994 $9,005,304 $12,815,348 $3,722,276 $1,909,269Delaware $1,112,727 $1,385,509 $1,598,420 $3,962,172 $1,460,428 $2,256,401Dist . Columbia $4,654,614 $5,220,735 $9,736,259 $7,142,279 $6,563,019 $2,948,766Florida $7,957,713 $9,105,628 $19,669,400 $17,686,988 $1,484,081 $15,081,202Georgia $10,332,669 $7,426,583 $7,959,157 $13,233,067 $6,951,778 $11,151,393Hawaii $217,160 $282,379 $282,379 $393,559 $669,266 $170,561Idaho $7,846,308 $9,782,584 $8,311,847 $10,257,617 $7,839,911 $8,954,781Illinois $44,457,622 $37,797,411 $52,300,069 $60,443,286 $38,732,251 $45,214,734Indiana $14,503,063 $14,983,057 $15,607,244 $18,636,696 $12,648,950 $15,913,160Iowa $15,427,498 $14,739,152 $15,313,555 $23,722,850 $19,070,816 $27,870,844Kansas $5,331,304 $6,765,489 $5,016,807 $11,550,282 $4,563,931 $8,334,670Kentucky $10,284,771 $9,328,490 $11,957,645 $7,640,899 $5,070,670 $4,477,261Louisiana $4,697,518 $4,250,967 $10,050,690 $11,773,632 $4,183,867 $5,961,901Maine $8,913,916 $6,667,043 $7,906,946 $12,103,990 $7,626,351 $3,136,132Maryland $6,019,356 $3,556,774 $5,554,363 $7,648,390 $7,265,448 $6,149,017Massachusetts $36,392,057 $34,750,524 $36,115,129 $52,794,866 $47,137,610 $54,970,851Michigan $22,946,624 $23,989,024 $29,043,849 $43,449,859 $36,249,465 $41,922,668Minnesota $23,267,635 $16,579,465 $20,772,492 $27,901,628 $26,013,496 $21,578,021Mississippi $1,850,660 $1,476,791 $1,640,948 $8,744,293 $7,527,055 $7,114,683Missouri $10,999,886 $8,272,886 $9,356,596 $14,523,993 $7,656,676 $16,755,858Montana $8,147,477 $8,147,477 $10,122,015 $12,450,858 $8,161,843 $10,685,643Nebraska $7,149,459 $4,546,040 $5,441,725 $9,660,622 $6,862,341 $6,595,510Nevada* $4,457,994 $4,909,884 $5,170,074 $5,627,218 $4,127,811 $3,652,980New Hampshire $4,222,520 $4,292,709 $5,205,906 $3,033,628 $1,693,071 $1,887,808New Jersey $10,973,959 $10,167,095 $11,358,338 $28,044,562 $24,744,240 $29,869,812New Mexico $3,580,690 $4,079,992 $3,939,992 $8,215,856 $6,597,429 $5,334,796New York $65,305,457 $63,009,524 $77,800,000 $114,500,000 $70,614,147 $73,911,550North Carolina $14,591,405 $9,821,669 $12,319,935 $16,322,200 $12,435,097 $14,556,773North Dakota $4,589,151 $4,354,121 $5,500,000 $1,664,727 $3,569,451 $6,065,145Ohio $56,636,231 $61,220,651 $61,601,632 $53,633,503 $49,313,107 $26,698,721Oklahoma $5,092,386 $3,964,430 $4,594,573 $7,750,319 $3,162,040 $2,884,504Oregon $13,815,641 $17,866,503 $14,017,108 $18,514,098 $17,334,456 $17,845,248Pennsylvania $43,093,384 $41,728,518 $49,233,884 $41,100,552 $30,177,169 $36,144,041Rhode Island $4,713,599 $5,428,205 $4,768,801 $7,682,479 $5,502,223 $10,988,873South Carolina $3,980,397 $3,587,936 $3,869,409 $11,722,199 $11,452,883 $12,608,421South Dakota $3,580,351 $3,516,592 $5,057,661 $3,513,071 $2,013,071 $1,513,071Tennessee $7,237,435 $5,987,655 $17,052,105 $10,425,559 $1,834,789 $11,444,417Texas $20,689,503 $13,918,324 $13,881,694 $44,814,627 $37,015,179 $38,260,450Utah $5,983,065 $5,377,415 $10,289,015 $7,022,718 $4,588,680 $2,898,129Vermont $7,337,289 $8,633,731 $9,215,727 $6,615,014 $6,014,491 $7,980,912Virginia $15,594,662 $10,381,007 $10,552,753 $27,176,199 $19,722,335 $19,213,899Washington $18,588,110 $19,630,502 $19,067,884 $32,380,236 $27,948,910 $24,139,883West Virginia $7,393,377 $7,269,890 $8,317,959 $12,007,938 $9,183,581 $8,123,427Wisconsin $64,938,612 $69,672,345 $68,199,241 $82,802,765 $82,696,472 $107,873,157Wyoming $4,073,872 $1,198,193 $3,597,197 $2,311,280 $4,025,231 $4,075,173ITCA* * n/a n/a n/a n/a $79,614 $67,245Navajo $362,433 $289,645 $321,735 $703,848 $242,391 $234,760N . Arapaho n/a n/a n/a $144,840 $69,412 $77,145American Samoa n/a n/a n/a $196,784 $283,860 $215,257Guam n/a n/a n/a $198,908 $357,856 $513,233Puerto Rico n/a n/a n/a $452,558 $647,129 $627,557N . Mariana Isles n/a n/a n/a $198,908 $155,635 $352,821Virgin Islands n/a n/a n/a $200,481 $161,976 $431,420
Totals $727,827,875 $678,408,724 $979,875,240 $1,040,389,143 $833,851,370 $923,928,679% of Prog . Funding 100% 100% 100% 100% 100% 100%Number of Grantees receiving funds 52 52 52 58 59 59
2012 2013 2014 2015 2016% change
2015 to 2016 2016 Total Unit
Production$3,354,516 $6,230,495 $5,345,193 $5,011,950 $5,159,411 3% 543
$58,660,480 $60,472,690 $38,679,000 $25,698,387 $8,092,460 -69% 415$10,617,349 $8,722,041 $8,652,990 $4,585,187 $4,672,906 2% 309
$8,897,874 $5,569,793 $5,569,793 $4,432,812 $5,624,005 27% 686$47,952,744 $38,558,815 $56,449,422 $70,948,731 $64,827,155 -9% 14,543$17,738,473 $19,669,969 $19,169,732 $19,502,370 $19,305,848 -1% 2,974
$1,319,737 $1,000,092 $2,463,560 $3,058,027 $4,122,381 35% 691$2,952,395 $2,898,641 $2,519,916 $1,136,261 $1,602,475 41% 252
$688,950 $2,978,601 $2,259,637 $2,056,793 $1,808,852 -12% 426$16,494,878 $10,825,416 $11,538,547 $12,074,687 $12,408,517 3% 754$13,726,553 $6,799,639 $6,450,127 $6,323,810 $5,329,878 -16% 929
$216,041 $76,406 $171,836 $283,438 $273,774 -3% 33$8,877,298 $9,558,391 $10,514,415 $10,738,332 $9,942,459 -7% 571
$60,639,222 $66,136,695 $21,322,503 $30,584,630 $31,666,143 4% 10,426$22,051,087 $20,286,955 $17,243,942 $15,809,345 $17,996,002 14% 1,207$21,625,772 $16,552,052 $18,161,773 $18,532,746 $19,019,085 3% 1,340
$6,620,508 $6,660,517 $6,835,602 $7,826,999 $8,318,180 6% 959$11,688,423 $9,479,846 $8,910,979 $9,879,890 $12,178,917 23% 652
$8,387,869 $7,296,092 $7,218,726 $6,039,579 $6,133,859 2% 624$5,131,008 $3,856,591 $7,193,693 $13,329,713 $13,360,862 0% 513
$22,363,895 $25,296,493 $35,750,550 $16,262,333 $19,217,521 18% 1,399$51,794,887 $52,614,575 $52,082,211 $50,078,167 $55,362,091 11% 27,896$12,147,503 $20,565,468 $20,951,829 $20,540,461 $20,397,981 -1% 2,358$24,107,718 $18,423,694 $21,144,255 $15,869,815 $22,639,261 43% 1,139
$5,313,171 $4,638,586 $6,041,524 $5,351,642 $6,217,006 16% 616$15,709,017 $7,684,942 $14,591,621 $14,952,471 $15,892,121 6% 1,369$10,207,356 $8,351,264 $9,806,212 $10,978,779 $11,181,455 2% 1,199
$5,247,883 $3,831,397 $5,259,438 $4,495,692 $3,746,230 -17% 351$4,696,152 $4,637,405 $5,177,218 $5,389,215 $5,165,913 -4% -$1,777,000 $7,428,271 $6,767,735 $7,042,667 $7,615,664 8% 967
$24,196,759 $17,787,690 $11,589,596 $17,534,873 $17,815,346 2% 1,844$5,282,375 $2,760,967 $4,223,857 $4,461,426 $6,146,013 38% 1,243
$69,362,251 $53,190,469 $50,274,524 $57,784,513 $57,928,696 0% 7,658$24,006,330 $25,812,396 $25,581,690 $21,109,878 $19,786,756 -6% 2,428
$6,031,880 $6,731,763 $11,272,895 $11,403,958 $15,011,513 32% 567$38,089,246 $85,585,795 $65,393,206 $68,077,908 $72,767,702 7% 13,241
$5,264,375 $3,530,725 $3,943,140 $3,666,950 $4,426,960 21% 462$17,269,757 $20,012,254 $18,194,200 $18,651,264 $18,630,710 0% 1,402$44,578,644 $32,689,516 $42,777,445 $42,843,467 $41,582,786 -3% 1,649
$8,798,600 $9,166,244 $10,505,421 $9,164,095 $8,139,596 -11% 1,365$11,983,009 $7,132,336 $7,029,740 $6,811,295 $6,741,888 -1% 385
$1,465,115 $505,656 $1,506,381 $1,591,553 $1,776,878 12% 199$4,512,390 $4,512,390 $3,903,512 $6,119,816 $6,937,945 13% 638
$31,506,604 $30,089,267 $29,555,444 $22,660,153 $23,272,825 3% 2,960$5,865,720 $5,551,253 $7,645,582 $6,732,879 $7,221,573 7% 530$7,447,003 $15,750,889 $11,176,620 $8,184,670 $9,596,968 17% 906
$12,065,449 $14,029,790 $17,359,930 $15,578,155 $16,302,233 5% 437$19,278,301 $30,514,025 $23,287,434 $33,331,408 $25,989,111 -22% 1,995
$8,909,854 $8,308,670 $7,793,401 $7,123,395 $8,729,671 23% 493$87,938,723 $76,830,768 $73,083,405 $70,161,015 $71,683,420 2% 5,608
$4,551,102 $4,504,388 $3,895,931 $3,897,015 $3,280,868 -16% 459$61,729 $73,729 $150,736 $78,448 $87,250 11% 11
$245,277 $340,632 $447,855 $268,138 $300,659 12% 50$94,450 $105,798 $89,077 $83,546 $93,053 11% 13
$151,424 $132,094 $317,172 $442,774 $454,452 3% 70$422,425 $453,500 $584,602 $349,207 $370,948 6% 20
$0 $405,670 $1,014,413 $3,842,626 $1,282,095 -67% 152$280,000 $354,105 $39,858 $231,169 $252,174 9% 24$413,587 $445,248 $599,179 $170,688 $244,376 43% 100
$921,078,137 $914,409,859 $867,480,225 $861,171,211 $866,132,877 1% 123,050100% 100% 100% 100% 100%
59 59 59 59 59
Weatherization Assistance Program8
Weatherization Assistance Program Funding Report
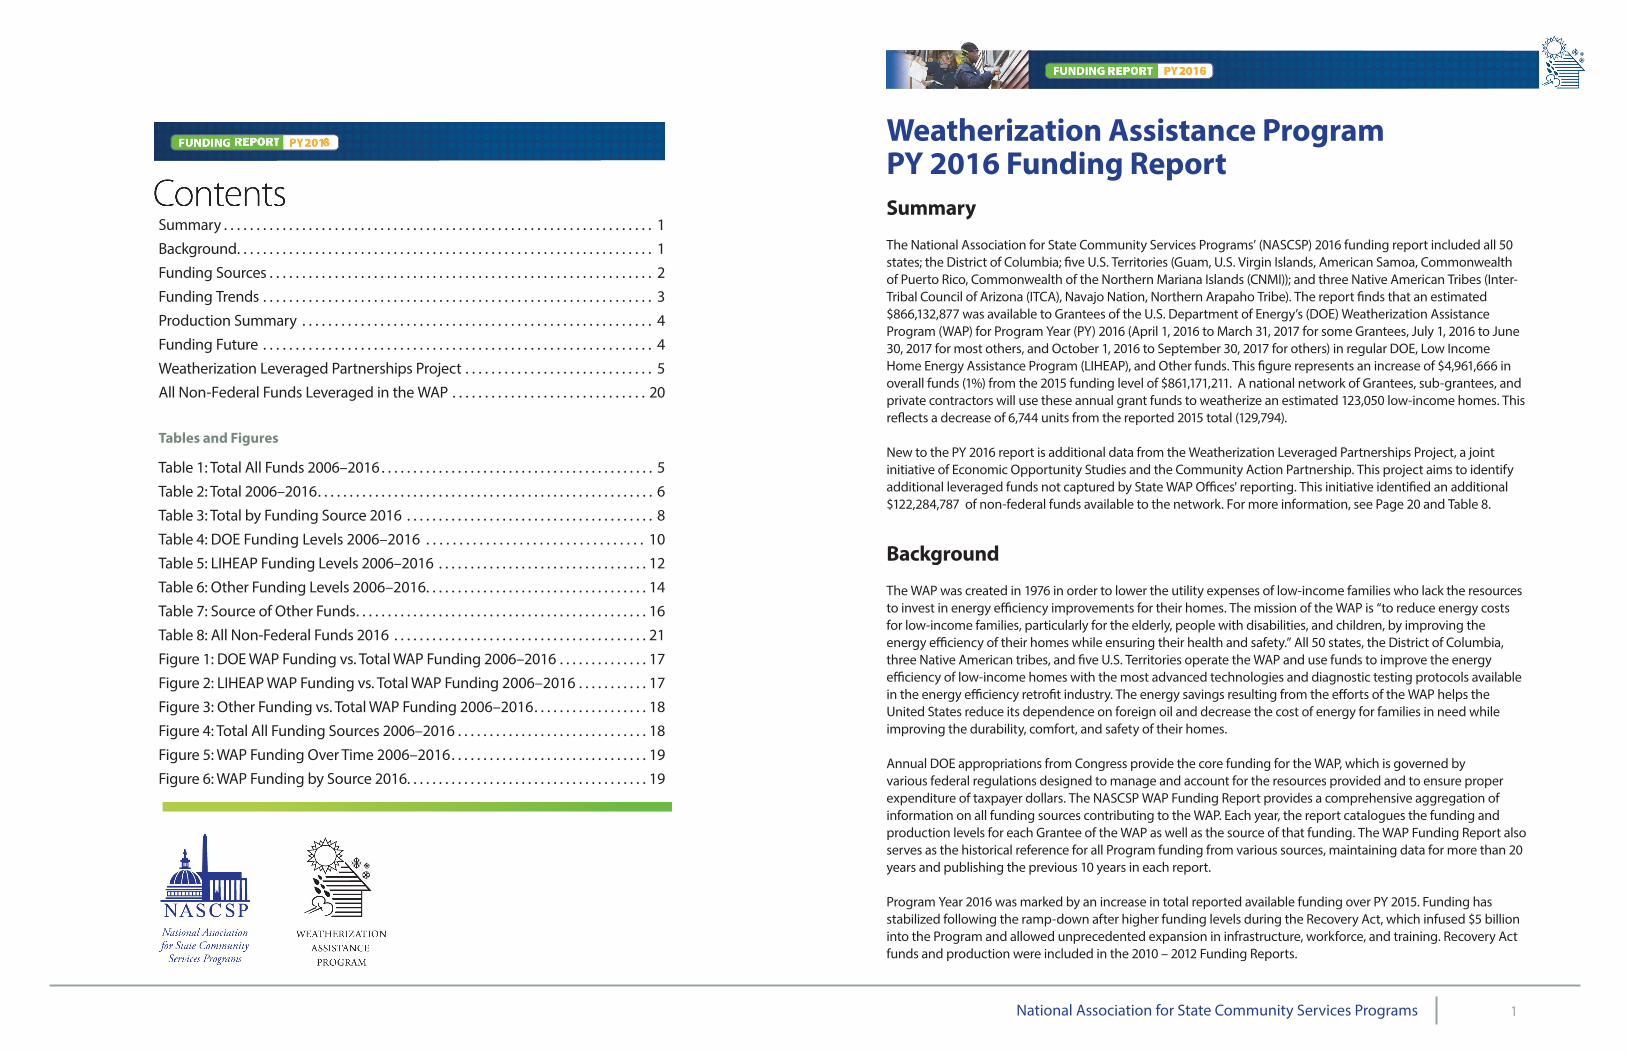
Table 3: State Totals by FundingSource 2016
Grantee 2016 DOE % of Total 2016 LIHEAP % of TotalAlabama $4,159,411 81% $1,000,000 19%Alaska $1,775,295 22% $300,000 4%Arizona $1,109,782 24% $2,936,124 63%Arkansas $2,025,363 36% $3,598,642 64%California $6,695,877 10% $44,131,278 68%Colorado $3,998,283 21% $6,767,565 35%Connecticut $4,122,381 100% $0 0%Delaware $572,294 36% $111,731 7%Dist . Columbia $560,689 31% $1,248,163 69%Florida $2,127,156 17% $10,281,361 83%Georgia $2,829,878 53% $2,500,000 47%Hawaii $273,774 100% $0 0%Idaho $1,862,705 19% $5,162,977 52%Illinois $10,929,610 35% $17,168,574 54%Indiana $6,193,959 34% $10,310,621 57%Iowa $4,591,815 24% $8,003,057 42%Kansas $2,394,371 29% $4,781,333 57%Kentucky $4,260,696 35% $7,918,221 65%Louisiana $1,302,205 21% $4,831,654 79%Maine $3,666,983 27% $9,693,879 73%Maryland $7,692,521 40% $1,500,000 8%Massachusetts $6,431,878 12% $9,500,000 17%Michigan $14,397,981 71% $6,000,000 29%Minnesota $9,517,385 42% $11,201,914 49%Mississippi $1,885,405 30% $4,331,601 70%Missouri $5,860,606 37% $7,000,000 44%Montana $2,346,361 21% $4,120,343 37%Nebraska $2,614,380 70% $1,131,850 30%Nevada* $871,308 17% $494,605 10%New Hampshire $1,472,101 19% $1,300,000 17%New Jersey $5,161,163 29% $12,654,183 71%New Mexico $1,646,802 27% $2,500,000 41%New York $18,794,102 32% $39,134,594 68%North Carolina $3,916,121 20% $15,870,635 80%North Dakota $2,328,127 16% $12,670,186 84%Ohio $12,980,506 18% $21,960,698 30%Oklahoma $2,426,960 55% $2,000,000 45%Oregon $2,696,844 14% $5,123,227 27%Pennsylvania $13,754,306 33% $27,828,480 67%Rhode Island $1,094,465 13% $3,120,000 38%South Carolina $1,666,574 25% $5,075,314 75%South Dakota $1,776,878 100% $0 0%Tennessee $4,074,456 59% $2,863,489 41%Texas $5,165,132 22% $18,107,693 78%Utah $1,970,108 27% $4,247,132 59%Vermont $1,228,156 13% $0 0%Virginia $3,761,099 23% $12,541,134 77%Washington $3,885,453 15% $11,015,576 42%West Virginia $2,668,468 31% $4,454,924 51%Wisconsin $8,147,306 11% $17,272,819 24%Wyoming $996,423 30% $2,284,445 70%ITCA* * $87,250 100% $0 0%Navajo $300,659 100% $0 0%N . Arapaho $93,053 100% $0 0%Amer . Samoa $175,791 39% $278,661 61%Guam $370,948 100% $0 0%Puerto Rico $1,282,095 100% $0 0%N . Mariana Isles $252,174 100% $0 0%Virgin Islands $244,376 100% $0 0%
Totals $221,488,248 $408,328,683% of Prog . Funding 26% 47%Number of Grantees receiving funds 59 48
Note: 2016 Total includes DOE, LIHEAP, and Other
* *Inter-Tribal Council of Arizona funding
*Nevada production data unavailable. Funding data was compiled from publicly available sources
9National Association for State Community Services Programs
2016 OTHER % of Total 2016 TOTAL2016 Total Unit Production
$0 0% $5,159,411 543$6,017,165 74% $8,092,460 415$627,000 13% $4,672,906 309$0 0% $5,624,005 686$14,000,000 22% $64,827,155 14,543$8,540,000 44% $19,305,848 2,974$0 0% $4,122,381 691$918,450 57% $1,602,475 252$0 0% $1,808,852 426$0 0% $12,408,517 754$0 0% $5,329,878 929$0 0% $273,774 33$2,916,777 29% $9,942,459 571$3,567,959 11% $31,666,143 10,426$1,491,422 8% $17,996,002 1,207$6,424,213 34% $19,019,085 1,340$1,142,476 14% $8,318,180 959$0 0% $12,178,917 652$0 0% $6,133,859 624$0 0% $13,360,862 513$10,025,000 52% $19,217,521 1,399$39,430,213 71% $55,362,091 27,896$0 0% $20,397,981 2,358$1,919,962 8% $22,639,261 1,139$0 0% $6,217,006 616$3,031,515 19% $15,892,121 1,369$4,714,751 42% $11,181,455 1,199$0 0% $3,746,230 351$3,800,000 74% $5,165,913 n/a$4,843,563 64% $7,615,664 967$0 0% $17,815,346 1,844$1,999,211 33% $6,146,013 1,243$0 0% $57,928,696 7,658$0 0% $19,786,756 2,428$13,200 0% $15,011,513 567$37,826,498 52% $72,767,702 13,241$0 0% $4,426,960 462$10,810,639 58% $18,630,710 1,402$0 0% $41,582,786 1,649$3,925,131 48% $8,139,596 1,365$0 0% $6,741,888 385$0 0% $1,776,878 199$0 0% $6,937,945 638$0 0% $23,272,825 2,960$1,004,333 14% $7,221,573 530$8,368,812 87% $9,596,968 906$0 0% $16,302,233 437$11,088,082 43% $25,989,111 1,995$1,606,279 18% $8,729,671 493$46,263,295 65% $71,683,420 5,608$0 0% $3,280,868 459$0 0% $87,250 11$0 0% $300,659 50$0 0% $93,053 13$0 0% $454,452 70$0 0% $370,948 20$0 0% $1,282,095 152$0 0% $252,174 24$0 0% $244,376 100
$236,315,946 $866,132,877 123,05027% 100%
27 59

Weatherization Assistance Program10
Weatherization Assistance Program Funding Report
Table 4: DOE Funding Levels 2006–2016
Grantee DOE 2006 DOE 2007 DOE 2008 DOE 2009 DOE 2010 DOE 2011 Alabama $2,724,123 $2,154,306 $2,396,413 $5,458,962 $1,882,352 $2,018,560Alaska $1,741,472 $1,631,367 $1,540,077 $2,553,915 $1,329,537 $1,287,597Arizona $1,337,983 $1,016,592 $1,128,755 $3,670,756 $952,279 $2,660,385Arkansas $2,202,800 $1,853,518 $2,061,017 $3,556,554 $1,622,103 $1,570,573California $7,057,123 $5,243,615 $5,870,561 $14,563,348 $4,918,739 $4,758,371Colorado $6,520,510 $5,022,676 $5,454,329 $4,086,626 $4,307,729 $7,964,794Connecticut $2,759,107 $2,242,994 $2,495,304 $5,315,348 $1,972,276 $1,909,269Delaware $612,727 $518,509 $731,420 $1,183,372 $460,428 $631,401Dist . Columbia $712,764 $735,358 $836,659 $998,679 $519,060 $404,664Florida $1,752,523 $1,948,403 $4,669,400 $9,885,233 $1,484,081 $6,081,202Georgia $3,339,105 $2,982,035 $2,914,609 $8,294,558 $2,282,504 $3,882,806Hawaii $217,160 $282,379 $282,379 $393,559 $169,266 $170,561Idaho $1,961,577 $2,445,646 $1,964,431 $3,366,002 $1,558,041 $1,508,611Illinois $14,057,622 $12,384,751 $13,784,473 $24,070,095 $10,844,851 $10,844,851Indiana $6,762,132 $6,520,687 $6,710,872 $7,092,942 $5,137,920 $4,971,150Iowa $5,153,879 $4,458,829 $4,966,077 $8,578,634 $3,918,674 $8,729,840Kansas $2,706,214 $2,264,099 $2,518,837 $5,001,886 $1,988,469 $1,924,929Kentucky $4,761,929 $4,039,827 $4,550,294 $7,640,899 $5,070,670 $4,477,261Louisiana $1,997,309 $1,550,758 $2,735,655 $3,623,154 $1,340,633 $1,708,765Maine $3,240,063 $2,744,008 $3,235,743 $4,924,673 $2,415,842 $1,775,676Maryland $2,194,851 $2,331,533 $2,904,363 $5,280,336 $2,083,502 $4,649,017Massachusetts $6,944,036 $5,850,524 $6,615,129 $11,794,866 $5,137,610 $4,970,851Michigan $15,446,624 $13,564,024 $15,118,849 $25,949,859 $11,249,465 $16,922,668Minnesota $10,104,169 $8,159,658 $9,989,081 $15,972,943 $9,865,770 $11,341,776Mississippi $1,850,660 $1,476,791 $1,640,948 $3,744,293 $1,290,592 $1,249,929Missouri $6,368,172 $5,364,017 $5,975,410 $11,566,101 $4,703,704 $12,686,850Montana $2,254,188 $2,254,188 $2,507,786 $3,760,263 $1,987,207 $1,923,710Nebraska $2,611,397 $2,272,477 $2,482,462 $4,372,276 $1,964,240 $1,901,497Nevada* $1,063,580 $862,389 $831,718 $2,547,725 $662,859 $684,414New Hampshire $1,605,171 $1,351,697 $1,501,762 $2,533,628 $1,193,071 $1,387,808New Jersey $5,366,959 $4,560,095 $5,078,993 $10,124,722 $5,644,240 $3,869,812New Mexico $1,857,690 $1,714,483 $1,714,483 $2,927,997 $1,506,127 $1,326,143New York $21,818,047 $18,009,524 $20,100,000 $42,500,000 $15,786,616 $15,270,806North Carolina $4,645,490 $3,717,293 $4,139,225 $8,057,022 $3,249,190 $6,423,435North Dakota $2,589,151 $2,234,117 $4,500,000 $1,664,727 $1,969,451 $1,906,536Ohio $15,501,009 $13,201,253 $14,626,946 $25,174,465 $30,295,459 $26,465,436Oklahoma $2,831,669 $2,318,528 $3,399,575 $5,150,319 $2,029,472 $1,705,606Oregon $2,824,212 $4,406,949 $2,808,354 $4,563,299 $2,222,843 $2,800,081Pennsylvania $15,101,584 $13,132,955 $14,638,184 $25,400,552 $12,013,482 $11,144,041Rhode Island $1,253,702 $1,037,381 $1,150,982 $2,022,878 $916,134 $887,744South Carolina $1,982,643 $1,590,182 $1,780,924 $4,466,899 $1,393,416 $1,612,777South Dakota $1,991,514 $2,046,721 $3,020,139 $1,513,071 $2,013,071 $1,513,071Tennessee $4,534,180 $3,737,777 $8,868,482 $3,864,806 $1,834,789 $11,444,417Texas $6,607,385 $4,981,976 $5,549,413 $19,793,889 $8,025,453 $9,070,724Utah $2,161,298 $1,859,403 $2,067,579 $3,818,075 $1,638,680 $158,667Vermont $1,353,926 $1,272,118 $1,272,118 $2,021,240 $1,012,458 $980,912Virginia $4,703,940 $4,344,862 $3,997,999 $8,025,937 $3,148,212 $3,046,661Washington $4,688,820 $4,406,949 $5,033,942 $7,243,701 $3,570,881 $3,455,476West Virginia $3,320,985 $2,872,199 $3,196,901 $4,817,624 $2,525,991 $2,444,834Wisconsin $9,431,346 $8,170,794 $8,608,452 $14,966,407 $6,726,647 $7,419,096Wyoming $1,302,898 $991,836 $1,128,920 $1,281,280 $852,525 $826,080ITCA* * n/a n/a $88,741 $0 $69,412 $67,245Navajo $362,433 $289,645 $321,735 $703,848 $242,391 $234,760N . Arapaho n/a n/a n/a $144,840 $79,614 $77,145American Samoa n/a n/a n/a $196,784 $283,860 $215,257Guam n/a n/a n/a $198,908 $357,856 $513,233Puerto Rico n/a n/a n/a $452,558 $647,129 $627,557N . Mariana Isles n/a n/a n/a $198,908 $155,635 $352,821Virgin Islands n/a n/a n/a $200,481 $161,976 $431,420
Totals $238,291,851 $206,424,695 $237,506,900 $413,276,722 $204,686,484 $243,291,578% of Prog . Funding 32 .6% 30 .2% 24 .2% 34 .7% 24 .5% 26 .33%Number of Grantees receiving funds 52 52 53 58 59 59
Note: n/a indicates that the entity was not a Grantee at the time .
Note: Figures in red in the 2015 column represent amended figures .
* *Inter-Tribal Council of Arizona
*Nevada production data unavailable. Funding data was compiled from publicly available sources
11National Association for State Community Services Programs
DOE 2012 DOE 2013 DOE 2014 DOE 2015 DOE 2016% Change
2015 to2016DOE 2016
Production Production Type$3,354,516 $5,230,495 $4,345,193 $4,011,950 $4,159,411 3 .7% 430 Unduplicated = DOE Funds only$360,480 $1,322,690 $1,321,000 $1,563,587 $1,775,295 13 .5% 170 Blended w/ Other Funds
$1,925,272 $487,020 $875,839 $1,004,822 $1,109,782 10 .4% 108 Blended w/ LIHEAP & Other Funds$2,013,498 $1,613,442 $1,613,442 $2,362,126 $2,025,363 -14 .3% 256 Unduplicated = DOE Funds only$8,072,792 $0 $6,431,506 $5,878,725 $6,695,877 13 .9% 956 Blended w/ LIHEAP & Other Funds$8,130,764 $4,519,633 $5,743,725 $4,590,704 $3,998,283 -12 .9% 580 Unduplicated = DOE Funds only$1,319,737 $500,092 $2,463,560 $3,058,027 $4,122,381 34 .8% 691 Unduplicated = DOE Funds only$2,268,203 $452,837 $524,921 $517,552 $572,294 10 .6% 56 Unduplicated = DOE Funds only$488,759 $511,519 $512,510 $510,866 $560,689 9 .8% 322 Unduplicated = DOE Funds only
$6,081,202 $709,416 $1,475,478 $1,698,578 $2,127,156 25 .2% 149 Unduplicated = DOE Funds only$3,642,329 $2,276,474 $2,273,566 $2,533,810 $2,829,878 11 .7% 478 Unduplicated = DOE Funds only$216,041 $76,406 $171,836 $283,438 $273,774 -3 .4% 33 Unduplicated = DOE Funds only
$1,388,688 $1,551,391 $1,549,408 $1,673,179 $1,862,705 11 .3% 146 Blended w/ LIHEAP & Other Funds$6,581,258 $9,787,755 $8,444,870 $13,533,094 $10,929,610 -19 .2% 7634 Blended w/ LIHEAP & Other Funds$5,467,613 $5,104,457 $5,801,549 $5,183,585 $6,193,959 19 .5% 604 Blended w/ LIHEAP & Other Funds$8,594,994 $3,797,481 $3,909,045 $4,105,176 $4,591,815 11 .9% 502 Blended w/ LIHEAP & Other Funds$1,774,148 $1,863,608 $1,987,909 $2,079,047 $2,394,371 15 .2% 221 Blended w / Other Funds$5,430,388 $3,177,017 $3,538,337 $3,432,719 $4,260,696 24 .1% 652 Blended w/ LIHEAP Funds$1,230,585 $529,968 $1,332,091 $1,214,148 $1,302,205 7 .3% 136 Blended w/ LIHEAP Funds$2,069,591 $651,694 $2,634,967 $3,528,654 $3,666,983 3 .9% 204 Blended w/ LIHEAP Funds$6,363,895 $6,767,265 $6,751,757 $4,737,333 $7,692,521 62 .4% 64 Blended w/ LIHEAP & Other Funds$5,194,887 $5,064,575 $5,127,467 $5,426,786 $6,431,878 18 .5% 894 Unduplicated = DOE Funds only
$12,147,503 $11,913,125 $13,551,829 $13,862,926 $14,397,981 3 .9% 1570 Blended w/ LIHEAP Funds$3,220,557 $3,792,870 $10,009,811 $8,663,266 $9,517,385 9 .9% 633 Blended w/ LIHEAP & Other Funds$574,589 $249,986 $1,532,058 $1,348,340 $1,885,405 39 .8% 170 Unduplicated = DOE Funds only
$10,368,001 $3,440,907 $4,693,744 $4,977,015 $5,860,606 17 .8% 1368 Blended w/ LIHEAP & Other Funds$2,654,881 $676,220 $1,978,401 $2,101,326 $2,346,361 11 .7% 228 Blended w/ LIHEAP & Other Funds$1,018,709 $380,299 $1,955,435 $1,827,086 $2,614,380 43 .1% 232 Unduplicated = DOE Funds only$604,317 $655,441 $654,604 $797,304 $871,308 9 .3% n/a Unduplicated = DOE Funds only
$1,277,000 $1,113,988 $1,256,712 $1,391,999 $1,472,101 5 .8% 212 Blended w/ LIHEAP & Other Funds$6,287,572 $773,962 $3,989,596 $4,531,660 $5,161,163 13 .9% 486 Unduplicated = DOE Funds only$1,688,642 $889,637 $1,352,532 $1,475,444 $1,646,802 11 .6% 135 Blended w / Other Funds
$14,130,828 $15,792,155 $15,771,972 $16,761,187 $18,794,102 12 .1% 7658 Blended w/ LIHEAP Funds$2,276,750 $2,065,144 $4,461,614 $2,895,263 $3,916,121 35 .3% 318 Unduplicated = DOE Funds only$2,948,642 $1,963,153 $3,775,862 $2,587,315 $2,328,127 -10 .0% 240 Blended w / Other Funds
$14,089,246 $10,763,252 $10,749,501 $11,525,532 $12,980,506 12 .6% 1760 Blended w/ LIHEAP & Other Funds$1,564,375 $2,023,225 $2,200,640 $2,166,950 $2,426,960 12 .0% 262 Unduplicated = DOE Funds only$2,214,107 $2,796,762 $2,601,638 $2,493,943 $2,696,844 8 .1% 370 Blended w/ LIHEAP & Other Funds
$16,882,381 $2,228,808 $11,824,096 $12,320,702 $13,754,306 11 .6% 1528 Unduplicated = DOE Funds only$813,840 $232,526 $1,000,930 $986,095 $1,094,465 11 .0% 172 Blended w/LIHEAP Funds$927,855 $1,382,018 $1,206,018 $1,495,042 $1,666,574 11 .5% 326 Blended w/LIHEAP Funds
$1,465,115 $505,656 $1,506,381 $1,591,553 $1,776,878 11 .6% 199 Unduplicated = DOE Funds only$4,512,390 $4,512,390 $3,903,512 $3,619,816 $4,074,456 12 .6% 638 Blended w/LIHEAP Funds$4,155,146 $4,289,956 $4,284,475 $4,657,454 $5,165,132 10 .9% 794 Unduplicated = DOE Funds only$730,045 $415,578 $1,630,013 $1,763,864 $1,970,108 11 .7% 530 Blended w/ LIHEAP & Other Funds$447,003 $1,005,339 $1,142,072 $1,066,668 $1,228,156 15 .1% 117 Blended w/ LIHEAP & Other Funds
$0 $2,814,009 $5,078,330 $3,363,309 $3,761,099 11 .8% 389 Blended w/ LIHEAP Funds$3,445,476 $2,109,133 $3,561,399 $3,561,399 $3,885,453 9 .1% 888 Blended w/ LIHEAP & Other Funds$4,454,927 $2,520,169 $2,516,949 $2,668,468 $2,668,468 0 .0% 337 Blended w/ LIHEAP & Other Funds$6,017,339 $6,564,418 $6,715,834 $7,283,668 $8,147,306 11 .9% 5608 Blended w/ LIHEAP & Other Funds$693,657 $744,539 $844,870 $894,620 $996,423 11 .4% 105 Blended w/ LIHEAP & Other Funds$61,729 $73,729 $150,736 $78,448 $87,250 11 .2% 11 Unduplicated = DOE Funds only
$245,277 $340,632 $447,855 $268,138 $300,659 12 .1% 50 Unduplicated = DOE Funds only$94,450 $105,798 $89,077 $83,546 $93,053 11 .4% 13 Unduplicated = DOE Funds only
$151,424 $132,094 $317,172 $162,599 $175,791 8 .1% 60 Unduplicated = DOE Funds only$422,425 $453,500 $584,602 $349,207 $370,948 6 .2% 20 Unduplicated = DOE Funds only
$0 $405,670 $1,014,413 $1,601,094 $1,282,095 -19 .9% 152 Unduplicated = DOE Funds only$280,000 $354,105 $39,858 $231,169 $252,174 9 .1% 24 Unduplicated = DOE Funds only$413,587 $445,248 $599,179 $170,688 $244,376 43 .2% 100 Unduplicated = DOE Funds only
$205,249,424 $146,920,676 $197,823,696 $200,552,009 $221,488,248 10.4% 42,98922 .28% 16 .07% 22 .80% 23 .29% 25 .57%
57 58 59 59 59

Weatherization Assistance Program12
Weatherization Assistance Program Funding Report
Table 5: LIHEAP Funding Levels 2006–2016
Grantee LIHEAP 2006 LIHEAP 2007 LIHEAP 2008 LIHEAP 2009 LIHEAP 2010 LIHEAP 2011 Alabama $830,503 $830,503 $830,503 $3,191,575 $0 $0
Alaska $600,000 $500,000 $500,000 $498,563 $400,000 $700,000Arizona $2,134,528 $1,580,429 $3,897,110 $1,439,732 $4,787,537 $5,540,059
Arkansas $1,906,358 $2,402,361 $1,678,862 $4,422,500 $5,374,617 $5,230,142California $37,566,845 $23,784,171 $24,170,162 $49,152,684 $56,774,491 $57,000,177Colorado $5,163,631 $4,958,210 $4,206,264 $4,870,019 $4,767,062 $9,754,067
Connecticut $0 $0 $0 $0 $1,000,000 $0Delaware $500,000 $500,000 $500,000 $1,000,000 $500,000 $500,000
Dist . Columbia $396,850 $940,377 $2,154,000 $1,500,000 $1,500,000 $1,563,106Florida $5,205,190 $4,157,225 $15,000,000 $7,801,755 $0 $9,000,000
Georgia $4,550,279 $2,544,548 $2,544,548 $2,538,509 $2,411,584 $5,518,587Hawaii $0 $0 $0 $0 $0 $0Idaho $1,961,577 $2,445,646 $2,008,734 $4,476,820 $4,476,820 $5,566,970
Illinois $22,900,000 $17,912,660 $27,633,080 $28,873,191 $20,387,400 $20,669,883Indiana $4,740,931 $5,496,370 $5,496,372 $10,768,481 $7,511,030 $10,942,010
Iowa $5,185,517 $5,451,471 $5,514,361 $10,170,381 $10,089,642 $10,579,178Kansas $2,625,090 $2,501,390 $2,497,970 $6,548,396 $2,575,462 $6,349,021
Kentucky $5,522,842 $5,288,663 $7,407,351 $0 $0 $0Louisiana $2,700,209 $2,700,209 $2,315,035 $8,150,478 $663,000 $4,253,136
Maine $5,673,853 $3,923,035 $4,671,203 $7,179,317 $5,210,509 $1,360,456Maryland $2,274,758 $1,225,241 $750,000 $750,000 $1,500,000 $1,500,000
Massachusetts $8,448,021 $8,500,000 $8,500,000 $12,000,000 $12,000,000 $12,000,000
Michigan $3,000,000 $0 $3,500,000 $9,000,000 $15,000,000 $15,000,000Minnesota $10,873,466 $6,204,936 $7,948,075 $9,928,685 $13,227,724 $7,515,690Mississippi $0 $0 $0 $5,000,000 $6,236,463 $5,864,754
Missouri $2,000,000 $0 $1,200,000 $0 $0 $0Montana $2,835,653 $2,835,653 $3,434,701 $6,248,342 $3,932,455 $6,475,594Nebraska $4,538,062 $2,273,563 $2,709,263 $5,288,346 $4,898,101 $4,694,013Nevada* $0 $190,495 $689,541 $594,049 $382,411 $0
New Hampshire $500,000 $500,000 $750,000 $500,000 $500,000 $500,000New Jersey $5,607,000 $5,607,000 $6,279,345 $17,919,840 $19,100,000 $26,000,000
New Mexico $900,000 $1,402,056 $1,402,056 $3,437,826 $3,043,124 $1,800,000New York $33,487,410 $35,000,000 $47,700,000 $62,000,000 $54,827,531 $58,640,744
North Carolina $9,945,915 $6,104,376 $8,180,710 $8,265,178 $9,185,907 $8,133,338
North Dakota $2,000,000 $2,120,004 $1,000,000 $0 $1,600,000 $4,158,609Ohio $21,243,239 $21,243,202 $26,974,686 $28,459,038 $19,017,648 $233,285
Oklahoma $1,260,717 $1,145,902 $944,998 $2,200,000 $1,000,000 $928,898Oregon $3,529,277 $6,223,554 $4,318,254 $6,850,799 $6,750,300 $6,642,914
Pennsylvania $27,991,800 $28,595,563 $34,595,700 $15,700,000 $16,663,687 $24,000,000
Rhode Island $2,502,594 $2,537,594 $2,366,503 $2,900,000 $2,900,000 $4,500,000South Carolina $1,997,754 $1,997,754 $2,038,485 $7,155,300 $10,059,467 $10,995,644
South Dakota $1,588,837 $1,469,871 $2,037,522 $2,000,000 $0 $0Tennessee $2,703,255 $2,249,878 $8,183,623 $6,560,753 $0 $0
Texas $12,032,253 $6,753,806 $7,430,750 $23,937,865 $28,989,726 $29,189,726Utah $3,355,050 $2,580,000 $7,032,600 $2,200,000 $2,200,000 $1,673,587
Vermont $0 $0 $0 $0 $400,000 $0Virginia $10,890,722 $6,036,145 $6,554,754 $19,150,262 $16,489,123 $16,082,238
Washington $6,699,290 $6,223,553 $5,033,942 $16,136,535 $16,272,816 $15,558,157West Virginia $3,572,742 $2,649,041 $4,516,308 $6,752,814 $5,832,590 $4,078,593
Wisconsin $14,475,619 $10,528,759 $13,280,752 $21,653,728 $20,007,573 $28,158,500Wyoming $2,246,886 $0 $400,000 $850,000 $2,090,000 $3,249,093
ITCA* * n/a n/a $0 $0 $0 $0Navajo $0 $0 $0 $0 $0 $0
N . Arapaho n/a n/a n/a $0 $0 $0Amer . Samoa n/a n/a n/a $0 $0 $0
Guam n/a n/a n/a $0 $0 $0Puerto Rico n/a n/a n/a $0 $0 $0
N . Mariana Isles n/a n/a n/a $0 $0 $0Virgin Islands n/a n/a n/a $0 $0 $0
Totals $312,664,523 $260,115,214 $332,778,124 $456,021,761 $422,535,800 $452,100,169 % of Prog . Funding 43 .0% 38 .3% 34 .0% 43 .8% 50 .7% 48 .93%Number of Grantees receiving funds
46 44 47 45 44 42
* *Inter-Tribal Council of Arizona
Note: n/a indicates that the entity was not a Grantee at the time
Note: Figures in red in the 2014 column represent amended figures in 2015 Survey
*Nevada production data unavailable. Funding data was compiled from publicly available sources
13National Association for State Community Services Programs
LIHEAP 2012 LIHEAP 2013 LIHEAP 2014 LIHEAP 2015 LIHEAP 2016% Change 2015
to 2016LIHEAP 2016 Production Production Type
$0 $1,000,000 $1,000,000 $1,000,000 $1,000,000 0 .0% 113 Unduplicated$300,000 $1,000,000 $0 $0 $300,000 n/a 11 Unduplicated
$5,192,077 $3,735,021 $3,277,151 $2,953,365 $2,936,124 -0 .6% 196 Blended w / Other Funds$6,884,376 $3,956,351 $3,956,351 $2,070,686 $3,598,642 73 .8% 430 Unduplicated
$39,879,952 $38,558,815 $50,017,916 $51,070,006 $44,131,278 -13 .6% 13587 Blended w / Other Funds$4,185,515 $5,090,800 $4,132,281 $6,611,666 $6,767,565 2 .4% 1143 Unduplicated
$0 $0 $0 $0 $0 n/a 0 n/a$684,192 $1,145,804 $694,995 $79,830 $111,731 40 .0% 31 Unduplicated$200,191 $1,603,511 $1,504,613 $1,365,516 $1,248,163 -8 .6% 104 Unduplicated
$10,413,676 $10,116,000 $10,063,069 $10,376,109 $10,281,361 -0 .9% 605 Unduplicated$8,334,224 $2,773,165 $2,426,561 $2,500,000 $2,500,000 0 .0% 451 Unduplicated
$0 $0 $0 $0 $0 n/a 0 n/a$5,539,610 $5,058,000 $6,018,851 $6,160,553 $5,162,977 -16 .2% 418 Blended w / Other Funds
$27,852,885 $22,407,435 $8,491,803 $11,284,595 $17,168,574 52 .1% 2532 Blended w / Other Funds$16,583,474 $14,257,573 $11,059,599 $9,826,195 $10,310,621 4 .9% 579 Unduplicated
$7,727,328 $7,452,661 $7,960,215 $8,069,257 $8,003,057 -0 .8% 838 Blended w / Other Funds$4,817,750 $4,760,912 $4,649,942 $4,600,761 $4,781,333 3 .9% 687 Blended w / Other Funds
$6,258,035 $6,302,829 $5,372,642 $6,447,171 $7,918,221 22 .8% 0 Supplemented DOE units$6,513,284 $6,440,289 $5,835,849 $4,825,431 $4,831,654 0 .1% 488 Unduplicated$1,900,527 $2,091,682 $3,383,916 $9,801,059 $9,693,879 -1 .1% 309 Unduplicated$1,000,000 $1,000,000 $1,500,000 $1,500,000 $1,500,000 0 .0% 241 Blended w / Other Funds
$10,000,000 $8,500,000 $8,500,000 $8,500,000 $9,500,000 11 .8% 10151 Unduplicated
$0 $8,652,343 $7,400,000 $6,677,535 $6,000,000 -10 .1% 788 Blended w / Other Funds$8,833,302 $10,785,390 $9,437,406 $6,148,800 $11,201,914 82 .2% 461 Blended w / Other Funds$4,738,582 $4,388,600 $4,509,466 $4,003,302 $4,331,601 8 .2% 446 Unduplicated$1,000,000 $1,000,000 $7,000,000 $7,000,000 $7,000,000 0 .0% 0 Supplemented DOE units$4,822,875 $4,647,676 $4,816,346 $4,101,223 $4,120,343 0 .5% 749 Blended w / Other Funds$4,229,174 $3,281,397 $3,304,003 $2,668,606 $1,131,850 -57 .6% 119 Unduplicated
$508,822 $555,184 $506,807 $443,553 $494,605 11 .5% 0 n/a$500,000 $500,000 $500,000 $800,000 $1,300,000 62 .5% 0 Supplemented DOE units
$17,909,187 $17,013,728 $7,600,000 $13,003,213 $12,654,183 -2 .7% 1358 Unduplicated$1,800,000 $1,368,000 $2,000,000 $2,100,000 $2,500,000 19 .0% 290 Blended w / Other Funds
$55,231,423 $37,398,314 $34,502,552 $41,023,326 $39,134,594 -4 .6% 0 Supplemented DOE units$21,729,580 $23,747,252 $21,120,076 $18,214,615 $15,870,635 -12 .9% 2110 Unduplicated
$3,083,238 $4,748,410 $7,483,833 $8,803,443 $12,670,186 43 .9% 327 Blended w / Other Funds$24,000,000 $21,719,122 $25,147,062 $21,960,698 $21,960,698 0 .0% 1558 Blended w / Other Funds
$3,450,000 $1,500,000 $1,500,000 $1,500,000 $2,000,000 33 .3% 200 Unduplicated$4,896,790 $4,796,990 $5,175,960 $5,336,128 $5,123,227 -4 .0% 1006 Blended w / Other Funds
$27,696,263 $30,460,708 $30,953,349 $30,522,765 $27,828,480 -8 .8% 121 Unduplicated
$3,476,315 $3,450,000 $2,420,000 $3,750,000 $3,120,000 -16 .8% 1123 Blended w / Other Funds$11,029,588 $5,750,318 $5,823,722 $5,316,253 $5,075,314 -4 .5% 59 Unduplicated
$0 $0 $0 $0 $0 n/a 0 n/a$0 $0 $0 $2,500,000 $2,863,489 14 .5% 0 Supplemented DOE units
$27,351,458 $25,799,311 $25,270,969 $18,002,699 $18,107,693 0 .6% 2166 Unduplicated$4,160,675 $4,160,675 $4,868,547 $4,016,000 $4,247,132 5 .8% 0 Supplemented DOE units
$0 $0 $0 $0 $0 n/a 0 n/a$12,065,449 $11,215,781 $12,281,600 $12,214,846 $12,541,134 2 .7% 48 Unduplicated$10,706,575 $10,301,827 $10,325,690 $10,281,130 $11,015,576 7 .1% 837 Blended w / Other Funds
$4,454,927 $3,938,506 $3,791,188 $4,454,927 $4,454,924 0 .0% 156 Unduplicated$20,820,191 $18,236,058 $18,314,095 $18,223,461 $17,272,819 -5 .2% 0 Supplemented DOE units$2,375,445 $2,209,849 $1,408,701 $1,048,851 $2,284,445 117 .8% 354 Blended w / Other Funds
$0 $0 $0 $0 $0 n/a 0 n/a$0 $0 $0 $0 $0 n/a 0 n/a$0 $0 $0 $0 $0 n/a 0 n/a$0 $0 $0 $280,175 $278,661 -0 .5% 10 Unduplicated$0 $0 $0 $0 $0 n/a 0 n/a$0 $0 $0 $2,241,532 $0 -100 .0% 0 n/a$0 $0 $0 $0 $0 n/a 0 n/a$0 $0 $0 $0 $0 n/a 0 n/a
$445,136,955 $408,876,287 $397,307,126 $405,679,281 $408,328,683 0.7% 47,200 48 .33% 44 .71% 45 .80% 47 .11% 47 .14%
44 46 45 48 48

Weatherization Assistance Program14
Weatherization Assistance Program Funding Report
Table 6: Other FundingLevels 2006 –2016
Note: n/a indicates that the entity was not a Grantee at the time .
Note: Figures in red in the 2014 column represent amended figures in 2015 Survey .
Grantee OTHER 2006 OTHER 2007 OTHER 2008 OTHER 2009 OTHER 2010 OTHER 2011 Alabama $275,000 $230,000 $225,000 $350,000 $350,000 $0Alaska $3,000,000 $4,000,000 $200,000,000 $0 $36,000,000 $30,000,000Arizona $1,500,000 $4,200,000 $4,200,000 $2,600,000 $2,600,000 $2,600,000Arkansas $0 $407,437 $1,629,724 $0 $0 $0California $0 $0 $0 $0 $0 $0Colorado $2,382,000 $2,290,000 $2,391,000 $2,459,660 $2,559,660 $3,200,000Connecticut $4,784,332 $4,700,000 $6,510,000 $7,500,000 $750,000 $0Delaware $0 $367,000 $367,000 $1,778,800 $500,000 $1,125,000Dist . Columbia $3,545,000 $3,545,000 $6,745,600 $4,643,600 $4,543,959 $980,996Florida $1,000,000 $3,000,000 $0 $0 $0 $0Georgia $2,443,285 $1,900,000 $2,500,000 $2,400,000 $2,257,690 $1,750,000Hawaii $0 $0 $0 $0 $500,000 $0Idaho $1,961,577 $2,445,646 $2,328,948 $2,414,795 $1,805,050 $1,879,200Illinois $7,500,000 $7,500,000 $10,882,516 $7,500,000 $7,500,000 $13,700,000Indiana $2,000,000 $1,966,000 $2,400,000 $0 $0 $0
Iowa $5,088,102 $4,823,114 $4,833,117 $4,973,835 $5,062,500 $8,561,826
Kansas $0 $2,000,000 $0 $0 $0 $60,720
Kentucky $0 $0 $0 $0 $0 $0
Louisiana $0 $0 $0 $0 $2,180,234 $0Maine $0 $0 $0 $0 $0 $0Maryland $1,549,747 $0 $1,900,000 $1,618,054 $3,681,946 $0Massachusetts $21,000,000 $20,400,000 $21,000,000 $29,000,000 $30,000,000 $38,000,000Michigan $4,500,000 $10,425,000 $10,425,000 $8,500,000 $10,000,000 $10,000,000
Minnesota $2,290,000 $2,214,871 $2,835,336 $2,000,000 $2,920,002 $2,720,555
Mississippi $0 $0 $0 $0 $0 $0Missouri $2,631,714 $2,908,869 $2,181,186 $2,957,892 $2,952,972 $4,069,008Montana $2,257,636 $2,257,636 $3,359,682 $2,442,253 $2,242,181 $2,286,339Nebraska $0 $0 $0 $0 $0 $0Nevada $3,394,414 $3,857,000 $3,648,815 $2,485,444 $3,082,541 $2,968,566New Hampshire $2,117,349 $2,441,012 $2,954,144 $0 $0 $0New Jersey $0 $0 $0 $0 $0 $0New Mexico $823,000 $963,453 $823,453 $1,850,033 $2,048,178 $2,208,653New York $10,000,000 $10,000,000 $10,000,000 $10,000,000 $0 $0North Carolina $0 $0 $0 $0 $0 $0North Dakota $0 $0 $0 $0 $0 $0Ohio $19,891,983 $26,776,196 $20,000,000 $0 $0 $0Oklahoma $1,000,000 $500,000 $250,000 $400,000 $132,568 $250,000Oregon $7,462,152 $7,200,000 $6,890,500 $7,100,000 $8,361,313 $8,402,253Pennsylvania $0 $0 $0 $0 $1,500,000 $1,000,000Rhode Island $957,303 $1,853,230 $1,251,316 $2,759,601 $1,686,089 $5,601,129South Carolina $0 $0 $50,000 $100,000 $0 $0South Dakota $0 $0 $0 $0 $0 $0Tennessee $0 $0 $0 $0 $0 $0Texas $2,049,865 $2,182,542 $901,531 $1,082,873 $0 $0Utah $466,717 $938,012 $1,188,836 $1,004,643 $750,000 $1,065,876Vermont $5,983,363 $7,361,613 $7,943,609 $4,593,774 $4,602,033 $7,000,000Virginia $0 $0 $0 $0 $85,000 $85,000Washington $7,200,000 $9,000,000 $9,000,000 $9,000,000 $8,105,213 $5,126,250West Virginia $499,650 $1,748,650 $604,750 $437,500 $825,000 $1,600,000Wisconsin $41,031,647 $50,972,792 $46,310,037 $46,135,744 $55,962,252 $72,295,561Wyoming $524,088 $206,358 $1,768,277 $150,000 $1,082,706 $0ITCA* n/a n/a n/a $0 $0 $0Navajo $0 $0 $0 $0 $0 $0N . Arapaho n/a n/a n/a $0 $0 $0Amer . Samoa n/a n/a n/a $0 $0 $0Guam n/a n/a n/a $0 $0 $0Puerto Rico n/a n/a n/a $0 $0 $0N . Mariana Isles n/a n/a n/a $0 $0 $0Virgin Islands n/a n/a n/a $0 $0 $0
Totals $173,109,924 $207,581,430 $400,299,377 $170,238,501 $206,629,086 $228,536,931 % of Prog . Funding 23 .8% 30 .6% 40 .9% 16 .4% 24 .8% 24 .74%Number of Grantees receiving funds 33 35 35 30 32 27
*Nevada production data unavailable. Funding data was compiled from publicly available sources
* *Inter-Tribal Council of Arizona
15National Association for State Community Services Programs
Grantee OTHER 2006 OTHER 2007 OTHER 2008 OTHER 2009 OTHER 2010 OTHER 2011 Alabama $275,000 $230,000 $225,000 $350,000 $350,000 $0Alaska $3,000,000 $4,000,000 $200,000,000 $0 $36,000,000 $30,000,000Arizona $1,500,000 $4,200,000 $4,200,000 $2,600,000 $2,600,000 $2,600,000Arkansas $0 $407,437 $1,629,724 $0 $0 $0California $0 $0 $0 $0 $0 $0Colorado $2,382,000 $2,290,000 $2,391,000 $2,459,660 $2,559,660 $3,200,000Connecticut $4,784,332 $4,700,000 $6,510,000 $7,500,000 $750,000 $0Delaware $0 $367,000 $367,000 $1,778,800 $500,000 $1,125,000Dist . Columbia $3,545,000 $3,545,000 $6,745,600 $4,643,600 $4,543,959 $980,996Florida $1,000,000 $3,000,000 $0 $0 $0 $0Georgia $2,443,285 $1,900,000 $2,500,000 $2,400,000 $2,257,690 $1,750,000Hawaii $0 $0 $0 $0 $500,000 $0Idaho $1,961,577 $2,445,646 $2,328,948 $2,414,795 $1,805,050 $1,879,200Illinois $7,500,000 $7,500,000 $10,882,516 $7,500,000 $7,500,000 $13,700,000Indiana $2,000,000 $1,966,000 $2,400,000 $0 $0 $0
Iowa $5,088,102 $4,823,114 $4,833,117 $4,973,835 $5,062,500 $8,561,826
Kansas $0 $2,000,000 $0 $0 $0 $60,720
Kentucky $0 $0 $0 $0 $0 $0
Louisiana $0 $0 $0 $0 $2,180,234 $0Maine $0 $0 $0 $0 $0 $0Maryland $1,549,747 $0 $1,900,000 $1,618,054 $3,681,946 $0Massachusetts $21,000,000 $20,400,000 $21,000,000 $29,000,000 $30,000,000 $38,000,000Michigan $4,500,000 $10,425,000 $10,425,000 $8,500,000 $10,000,000 $10,000,000
Minnesota $2,290,000 $2,214,871 $2,835,336 $2,000,000 $2,920,002 $2,720,555
Mississippi $0 $0 $0 $0 $0 $0Missouri $2,631,714 $2,908,869 $2,181,186 $2,957,892 $2,952,972 $4,069,008Montana $2,257,636 $2,257,636 $3,359,682 $2,442,253 $2,242,181 $2,286,339Nebraska $0 $0 $0 $0 $0 $0Nevada $3,394,414 $3,857,000 $3,648,815 $2,485,444 $3,082,541 $2,968,566New Hampshire $2,117,349 $2,441,012 $2,954,144 $0 $0 $0New Jersey $0 $0 $0 $0 $0 $0New Mexico $823,000 $963,453 $823,453 $1,850,033 $2,048,178 $2,208,653New York $10,000,000 $10,000,000 $10,000,000 $10,000,000 $0 $0North Carolina $0 $0 $0 $0 $0 $0North Dakota $0 $0 $0 $0 $0 $0Ohio $19,891,983 $26,776,196 $20,000,000 $0 $0 $0Oklahoma $1,000,000 $500,000 $250,000 $400,000 $132,568 $250,000Oregon $7,462,152 $7,200,000 $6,890,500 $7,100,000 $8,361,313 $8,402,253Pennsylvania $0 $0 $0 $0 $1,500,000 $1,000,000Rhode Island $957,303 $1,853,230 $1,251,316 $2,759,601 $1,686,089 $5,601,129South Carolina $0 $0 $50,000 $100,000 $0 $0South Dakota $0 $0 $0 $0 $0 $0Tennessee $0 $0 $0 $0 $0 $0Texas $2,049,865 $2,182,542 $901,531 $1,082,873 $0 $0Utah $466,717 $938,012 $1,188,836 $1,004,643 $750,000 $1,065,876Vermont $5,983,363 $7,361,613 $7,943,609 $4,593,774 $4,602,033 $7,000,000Virginia $0 $0 $0 $0 $85,000 $85,000Washington $7,200,000 $9,000,000 $9,000,000 $9,000,000 $8,105,213 $5,126,250West Virginia $499,650 $1,748,650 $604,750 $437,500 $825,000 $1,600,000Wisconsin $41,031,647 $50,972,792 $46,310,037 $46,135,744 $55,962,252 $72,295,561Wyoming $524,088 $206,358 $1,768,277 $150,000 $1,082,706 $0ITCA* n/a n/a n/a $0 $0 $0Navajo $0 $0 $0 $0 $0 $0N . Arapaho n/a n/a n/a $0 $0 $0Amer . Samoa n/a n/a n/a $0 $0 $0Guam n/a n/a n/a $0 $0 $0Puerto Rico n/a n/a n/a $0 $0 $0N . Mariana Isles n/a n/a n/a $0 $0 $0Virgin Islands n/a n/a n/a $0 $0 $0
Totals $173,109,924 $207,581,430 $400,299,377 $170,238,501 $206,629,086 $228,536,931 % of Prog . Funding 23 .8% 30 .6% 40 .9% 16 .4% 24 .8% 24 .74%Number of Grantees receiving funds 33 35 35 30 32 27
OTHER 2012 OTHER 2013 OTHER 2014 OTHER 2015 OTHER 2016% Change 2015
to 2016OTHER 2016 Production Production Type
$0 $0 $0 $0 $0 n/a 0 n/a$58,000,000 $58,150,000 $37,358,000 $24,134,800 $6,017,165 -75 .07% 234 Unduplicated
$3,500,000 $4,500,000 $4,500,000 $627,000 $627,000 0 .00% 5 1 Unduplicated + Supplemented DOE and LIHEAP$0 $0 $0 $0 $0 n/a 0 n/a$0 $0 $0 $14,000,000 $14,000,000 0 .00% 0 Supplemented DOE and LIHEAP .
$5,422,194 $10,059,536 $9,293,726 $8,300,000 $8,540,000 2 .89% 1251 Unduplicated$0 $500,000 $0 $0 $0 n/a 0 Unduplicated$0 $1,300,000 $1,300,000 $538,879 $918,450 70 .44% 165 Unduplicated$0 $863,571 $242,514 $180,411 $0 -100 .00% 0 n/a$0 $0 $0 $0 $0 n/a 0 n/a
$1,750,000 $1,750,000 $1,750,000 $1,290,000 $0 -100 .00% 0 n/a$0 $0 $0 $0 $0 n/a 0 n/a
$1,949,000 $2,949,000 $2,946,156 $2,904,600 $2,916,777 0 .42% 7 7 Unduplicated + Supplemented DOE and LIHEAP$26,205,079 $33,941,505 $4,385,830 $5,766,941 $3,567,959 -38 .13% 260 260 Unduplicated + Supplemented DOE and LIHEAP
$0 $924,925 $382,794 $799,565 $1,491,422 86 .53% 24 Unduplicated
$5,303,450 $5,301,910 $6,292,513 $6,358,313 $6,424,213 1 .04% 0 Supplemented DOE and LIHEAP units$28,610 $35,997 $197,751 $1,147,191 $1,142,476 -0 .41% 51 51 Unduplicated +Supplemented DOE and LIHEAP
$0 $0 $0 $0 $0 n/a 0 n/a$644,000 $325,835 $50,786 $0 $0 n/a 0 n/a
$1,160,890 $1,113,215 $1,174,810 $0 $0 n/a 0 n/a$15,000,000 $17,529,228 $27,498,793 $10,025,000 $10,025,000 0 .00% 1,094 1094 Unduplicated + Supplemented DOE and LIHEAP$36,600,000 $39,050,000 $38,454,744 $36,151,381 $39,430,213 9 .07% 16851 Unduplicated
$0 $0 $0 $0 $0 n/a 0 n/a
$12,053,859 $3,845,434 $1,697,038 $1,057,749 $1,919,962 81 .51% 45 45 Unduplicated + Supplemented DOE and LIHEAP $0 $0 $0 $0 $0 n/a 0 n/a
$4,341,016 $3,244,035 $2,897,877 $2,975,456 $3,031,515 1 .88% 1 1 Unduplicated + Supplemented DOE and LIHEAP$2,729,600 $3,027,368 $3,011,465 $4,776,230 $4,714,751 -1 .29% 222 222 Unduplicated + Supplemented DOE and LIHEAP
$0 $169,701 $0 $0 $0 n/a 0 n/a$3,583,013 $3,426,780 $4,015,807 $4,148,358 $3,800,000 -8 .40% 0 Unduplicated
$0 $5,814,283 $5,011,023 $4,850,668 $4,843,563 -0 .15% 755 755 Unduplicated + Supplemented DOE and LIHEAP$0 $0 $0 $0 $0 n/a n/a
$1,793,733 $503,330 $871,325 $885,982 $1,999,211 125 .65% 818 818 Unduplicated + Supplemented DOE and LIHEAP$0 $0 $0 $0 $0 n/a 0 n/a$0 $0 $0 $0 $0 n/a 0 Note: Some LIHEAP funds reported as Other in 2015$0 $20,200 $13,200 $13,200 $13,200 0 .00% 0 Supplemented DOE and LIHEAP$0 $53,103,421 $29,496,643 $34,591,678 $37,826,498 9 .35% 9,923 9923 unduplicated + supplemented DOE and LIHEAP
$250,000 $7,500 $242,500 $0 $0 n/a 0 n/a$10,158,860 $12,418,502 $10,416,602 $10,821,193 $10,810,639 -0 .10% 26 26 Unduplicated + supplemented DOE and LIHEAP
$0 $0 $0 $0 $0 n/a 0 n/a$4,508,445 $5,483,718 $7,084,491 $4,428,000 $3,925,131 -11 .36% 70 60 unduplicated + supplemented DOE and LIHEAP
$25,566 $0 $0 $0 $0 n/a 0 n/a$0 $0 $0 $0 $0 n/a 0 n/a$0 $0 $0 $0 $0 n/a 0 n/a$0 $0 $0 $0 $0 n/a 0 n/a
$975,000 $975,000 $1,147,022 $953,015 $1,004,333 5 .38% 0 Supplemented DOE units$7,000,000 $14,745,550 $10,034,548 $7,118,002 $8,368,812 17 .57% 789 Unduplicated
$0 $0 $0 $0 $0 n/a 0 n/a$5,126,250 $18,103,065 $9,400,345 $19,488,879 $11,088,082 -43 .11% 270 270 Unduplicated + supplemented DOE and LIHEAP
$0 $1,849,995 $1,485,264 $0 $1,606,279 n/a 0 Supplemented DOE and LIHEAP$61,101,193 $52,030,292 $48,053,476 $44,653,886 $46,263,295 3 .60% 0 Supplemented DOE units$1,482,000 $1,550,000 $1,642,360 $1,953,544 $0 -100 .00% 0 All state funds cut by State legislature
$0 $0 $0 $0 $0 n/a 0 n/a$0 $0 $0 $0 $0 n/a 0 n/a$0 $0 $0 $0 $0 n/a 0 n/a$0 $0 $0 $0 $0 n/a 0 n/a$0 $0 $0 $0 $0 n/a 0 n/a$0 $0 $0 $0 $0 n/a 0 n/a$0 $0 $0 $0 $0 n/a 0 n/a$0 $0 $0 $0 $0 n/a 0 n/a
$270,691,758 $358,612,896 $272,349,403 $254,939,921 $236,315,946 -7.3% 32,861
26 34 32 29 27

Weatherization Assistance Program16
Grantee Total 2016 Sources of Funding and Amount Breakdown
Alabama $0Alaska $6,017,165 State Funds- Extraction feesArizona $627,000 Utility fundsArkansas $0California $14,000,000 Cap and Trade ProgramColorado $8,540,000 $6,650,000 - State Funds: Severance tax on extraction activities, $1,890,000- Utility funds: Received through installed measure rebatesConnecticut $0Delaware $918,450 $547,444 - State Funds: Regional Greenhouse Gas Initiative, $371,006 - Utility funds D .C . $0Florida $0Georgia $0Hawaii $0
Idaho $2,916,777 $700,000 - Utility Funds: Avista , $591,707 - Utility Funds: BPA, $1,325,070 - Utility Funds: Idaho Power , $300,000 - Utility Funds: Rocky Mountain Power
Illinois $3,567,959 Utility FundsIndiana $1,491,422 $1,389,000- State Funds: Mortgage Settlement, $102,422- Utility Funds: Vectren Iowa $6,424,213 Utility funds: Low-income programsKansas $1,142,476 $375,521 - Utility Funds, $103,525 - Misc . Funds: Donations, Partnerships , $663,430- Local FundsKentucky $0Louisiana $0Maine $0Maryland $10,025,000 $26,161,793 - Utility Funds: EmPOWER, $1,000,000 - State Funds: Strategic Energy Investment Fund, Regional Greenhouse Gas Initiative Massachusetts $39,430,213 Utility Funds: Mass-Save Investor Owned UtilitiesMichigan $0Minnesota $1,919,962 $426,943 - State Funds: Propane Fund, $1,493,019- Utility fundsMississippi $0
Missouri $3,031,515 $978,221- Utility Funds: Laclede Gas, $1,287,533 - Utility Funds: Ameren Electric, $272,772- Utility Funds: Ameren Gas, $104,989- Utility Funds: Liberty Gas , $388,000-State Funds: Utilicare
Montana $4,714,751 $4,393,182- Utility Funds: NWE, $321,569- Utility Funds: BPA, $435,000 - Utility Funds:MDU, Unknown- Utility Funds: (Received directly by local agencies) Nebraska $0Nevada $3,800,000 $3,200,000- Utility Funds: Fund for Energy Assistance and Conservation (FEAC) , $600,000 - State Funds: Home Energy Retrofit Opportunities for Seniors New Hampshire $4,843,563 Utility fundsNew Jersey $0New Mexico $1,999,211 $110,812-Utility Funds: PNM, $279,480-Utility Funds: Xcel Energy, $35,000-Utility Funds: CVEC, $7,500-Utility Funds: Columbus, $1,566,419-Utility Funds: NM New York $0North Carolina $0North Dakota $13,200 Utility Funds: Excel Energy
Ohio $37,826,498 $8,055,035-Utility Funds: AEP, $11,603,220-Utility Funds: Columbia Gas, $1,170,616-Utility Funds: Dayton Power and Light, $6,500,000-Utility Funds: Domin-ion East Ohio, $2,306,003-Utility Funds: Duke $6,000,000-Utility Funds: First Energy, $2,191,624-Utility Funds: Vectren
Oklahoma $0Oregon $10,810,639 $7,795,152- Utility Funds: Public Purpose Charge, Portland General Electric & PacifiCorp, $1,541,041-Utility Funds: Bonneville Power Administration Pennsylvania $0Rhode Island $3,925,131 Utility funds-National GridSouth Carolina $0South Dakota $0Tennessee $0Texas $0Utah $1,004,333 $750,000 - Utility Contracts, $254,333 - Utility Funds: Rebates Vermont $8,368,812 State funds: HWAPVrigina $0Washington $11,088,082 $7,500,000 - State Matchmaker Funds, $1,318,948- Utility Funds, $2,269,134 - Utility Funds: Bonneville Power AdministrationWest Virginia $1,606,279 $100,000-Utility Funds: Dominion Hope Gas, $1,091,279-Utility Funds: FirstEnergy, $415,000-Utility Funds: Appalachian Power Co ./Wheeling Power Co .Wisconsin $46,263,295 Utility FundsWyoming $0 All State funds cut by state legislatureTOTAL $236,315,946
Weatherization Assistance Program Funding Report
Table 7: Source of Other Funds 2016
Note: 27 States reported "Other Funding" in 2016 Tribes and territories all reported $0 of "Other Funding" (ITCA, Navajo, N . Arapaho, Amer . Samoa, Guam, Puerto Rico, N . Mariana Islands, Virgin Islands)
17National Association for State Community Services Programs
Figure 2: LIHEAP WAP Funding vs . Total WAP Funding2006–2016
Weatherization Assistance Program Funding Report
Figure 1: DOE WAP Funding vs . Total WAP Funding 2006–2016

Weatherization Assistance Program18
Weatherization Assistance Program Funding Report
Figure 3: Other Funding vs . Total WAP Funding2006–2016
Figure 4: Total All Funding Sources2006-2016
19National Association for State Community Services Programs
Figure 6: WAP Funding by Source 2016
Weatherization Assistance Program Funding Report
Figure 5: WAP FundingOver Time 2006–2016

Weatherization Assistance Program20
All Non-federal Funds Leveraged in the Weatherization Assistance Program
As noted on Page 2, States include reports on “Other Funding” in the annual NASCSP funding report . Those figures represent state, local, and private resources (including utility ratepayer programs) that WAP subgrantees combine with their federally- funded efficiency services and report to the state WAP office . The figure also includes non-federal funds allocated to the state WAP office and distributed to local WAP subgrantees . While these state reports capture most of the non-federal funds leveraged with WAP, they do not include all contracts or grants made directly between
subgrantees and non-governmental partners . 1
Table 8 is the result of collaboration between NASCSP and the Weatherization Leveraged Partnerships Project, a joint initiative of Economic Opportunity Studies and the Community Action Partnership . The table aims to include all non-federal funding that subgrantees use with WAP from any source . To collect the information, the Weatherization Leveraged Partnerships Project interviewed WAP subgrantees, utilities, Community Action Associations, and other sources . The combined studies show that Weatherization delivery organizations collectively leveraged a total of $358,600,733 in “other” , i .e . non-federal funds, to use with federal funding from WAP and HHS when upgrading eligible homes . This is $122,284,787 more than the state reported total in Table 6 . Using this data, the WAP leverages $1 .62 in non-federal funds for every $1 of DOE funds spent .
The table also shows there is wide variation among state WAP networks’ ability to attract such funding . While many states leverage several million dollars each year, there are some states in which there are no non-federal funds
available .2 In total, there were non-federal funds available in 39 states .
In future years, NASCSP and the WAP Leveraged Partnerships Project intend to present this consolidated data in the Funding Report . For more information about this section of the funding report, contact Meg Power of Economic Opportunity Studies (megpower@opportunitystudies .org) .
1 See Oak Ridge National Laboratory report ORNL TM-2013/188 which characterizes the WAP organizations’ multiple funding flows (p .17)
2 In some States, it is known that there is substantial local leveraged funding , however exact amounts cannot be determined . In these cases, very conservative estimates have been included based on prior year reports compiled by Economic Opportunity Studies . Estimated figures are denoted with an asterisk (*) . The national total is almost certainly somewhat less than all funding spent .
21National Association for State Community Services Programs
Weatherization Assistance Program Funding Report- Table 8: All Non-Federal Funds 2016
Note: Estimated figures are denoted with an asterisk (*)
Grantee All Non-Federal Funds
State Reported Total from Table 6
Funds Not Reported in Table 7 Notes & Source of Information
Alabama $0 $0Alaska $6,017,165 $6,017,165
Arizona $3,000,000 $627,000 Utility Funds- $2,373,000 Arizona Community Action Association
Arkansas $0 $0
California* $48,000,000 $14,000,000 Utility Funds- $34,000,000 in utility Energy Efficiency Assistance local contracts
Estimate of utility contracts direct to agencies . Association of California Community and Energy Services .
Colorado $8,540,000 $8,540,000Connecticut $14,000,000 $0 Utility Funds- $14,000,000Delaware $918,450 $918,450Dist . Columbia $0 $0Florida $250,000 $0 Utility Funds- $250,000 Progress Energy Progress EnergyGeorgia $0 $0Hawaii $0 $0Idaho $2,916,777 $2,916,777Illinois $3,567,959 $3,567,959Indiana $1,791,422 $1,491,422 Utility Funds- $300,000
Iowa $6,424,213 $6,424,213
Kansas $1,142,476 $1,142,476
Kentucky $0 $0
Louisiana $0 $0Maine $137,000 $0 Utility Funds- $137,000 Efficiency Maine
Maryland $10,525,000 $10,025,000 Utility Funds- $500,000 Columbia Gas, AEP
Massachusetts $50,000,000 $39,430,213 Utility Funds: $10,569,787
Michigan* $8,000,000 $0 Utility Funds: $8,000,000 Estimate of utility contracts direct to agencies . Michigan Community Action Association .
Minnesota $1,919,962 $1,919,962
Mississippi $0 $0Missouri $3,031,515 $3,031,515Montana $4,714,751 $4,714,751Nebraska $0 $0Nevada $3,800,000 $3,800,000New Hampshire $4,843,563 $4,843,563New Jersey $250,000 $0 Utility Funds: $250,000 Contracts to two New Jersey local agencies .New Mexico $1,999,211 $1,999,211
New York* $14,500,000 $0 Utility Funds: $14,500,000 Estimate . New York Weatherization Directors As-sociation, Association for Affordable Energy .
North Carolina $15,805,000 $0 Utility Funds: $2,000,000 Progress Energy, $2,000,000 Piedmont Bank, $11,805,000 Duke Energy North Carolina Community Action Association .
North Dakota $13,200 $13,200Ohio $37,826,498 $37,826,498Oklahoma $0 $0Oregon $10,810,639 $10,810,639
Pennsylvania* $2,900,000 $0 Utility Funds: $2,900,000 Estimate . $2 .4 Million reported by local agency Energy Coordinating Agency of Philadelphia .
Rhode Island $3,925,131 $3,925,131South Carolina $300,000 $0South Dakota $0 $0
Tennessee* $8,000,000 $0 Utility Funds: $8,000,000 Tennessee Valley Authority Estimate . Tennessee Valley Authority contracted directly with two agencies .
Texas* $6,000,000 $0 Utility Funds: $6,000,000 Estimate . Texas Association of Community Action Agencies .
Utah $1,004,333 $1,004,333
Vermont $9,368,812 $8,368,812 Utility Funds: $1,000,000 Efficiency Vermont
Virginia $3,400,000 $0 Utility Funds: $3,400,000 Community Housing Partners, TAP Into Hope
Washington $11,088,082 $11,088,082West Virginia $1,606,279 $1,606,279Wisconsin $46,263,295 $46,263,295Wyoming $0 $0
Totals $358,600,733 $236,315,946
Number of Grantees 39 27
National Association for State Community Services Programs111 K Street, NE, Suite 300
Washington, DC 20002www.nascsp.org
202-370-3657
Our Mission: Building capacity in states to respond to poverty issues
The National Association for State Community Services Programs (NASCSP) represents
the states in their work to improve the lives of low-income families and strengthen
local economies. NASCSP members administer the federally-funded Community
Services Block Grant (CSBG) and the Weatherization Assistance Program that serve
millions of American families in communities across the country.