Weather Module SE - COMAP
39
PS-Future Mathematical and Computational Methods for Planning a Sustainable Future Weather Generators A Module in Planning for Sustainability STUDENT EDITION Lisa Rodgers, Grandview High School Steve Sain, Jupiter Intelligence
Transcript of Weather Module SE - COMAP
PS-FutureMathematical and Computational Methods for
Planning a Sustainable Future
Weather GeneratorsA Module in Planning for Sustainability
STUDENT EDITION
Lisa Rodgers, Grandview High SchoolSteve Sain, Jupiter Intelligence

Funded by the National Science Foundation,Proposal No. 1503414
This material was prepared with the support of the National Science Foundation. However, any opinions, findings, conclusions, and/or recommendations herein are those of the authors and do not necessarily reflect the views of the NSF.
At the time of publishing, all included URLs were checked and active.We make every effort to make sure all links stay active, but we cannot make any guaranties that they will remain so. If you find a URL that is inactive,
please inform us at [email protected].
Published by COMAP, Inc. in conjunction with DIMACS, Rutgers University.©2019 COMAP, Inc. Printed in the U.S.A.
COMAP, Inc.175 Middlesex Turnpike, Suite 3B
Bedford, MA 01730www.comap.com
ISBN: 978-0-9971490-5-0 Product Code: 5652
Front Cover Photographs: Zonsopkomst Weegje2.jpg (Sunset) By Dick Mudde [Public domain], from Wikimedia CommonsTall Tree Corridor: Public Domain Picture by Chelsea Bock chelseabock (https://unsplash.com/photos/S-U6ipzt4Lw) [CC0], via Wikimedia Commons
Solar Panels and sky by Smaack [CC BY-SA 4.0 (https://creativecommons.org/licenses/by-sa/4.0)], from Wikimedia Commons Recharging Unit: By Jebulon [GFDL (http://www.gnu.org/copyleft/fdl.html) or CC BY-SA 3.0 (https://creativecommons.org/licenses/by-sa/3.0)], from Wikimedia Commons
Pala eolica Mele 10.jpg (Windmill)by Alessio Sbarbaro User_talk:Yoggysot [GFDL (http://www.gnu.org/copyleft/fdl.html) or CC BY-SA 3.0 (https://creativecommons.org/licenses/by-sa/3.0)], from Wikimedia Commons
DIMACS
Weather GeneratorsA Module in Planning for Sustainability

1
WeatherGeneratorsA Module in Planning for Sustainability
What is sustainability? The most frequently quoted definition related to sustainability is from the World Commission on Environment and Development’s 1987 report Our Common Future. It says, “…sustainable development is development that meets the needs of the present without compromising the ability of future generations to meet their own needs.” At the heart of sustainability is the need to assure the long-term persistence and vitality of both humans and the natural environment. Sustainability focuses on interactions between nature and society. These interactions are complex and do not abide disciplinary boundaries. They require understanding of physical and biological processes that are overlaid by human social, political, and economic concerns.
A popular view is that sustainability balances on three pillars—environmental, social, and economic—and that failure or weakness of any one compromises future sustainability. To be sustainable, a practice must be environmentally, economically, and socially sustainable. Sustainable behaviors and practices are those that can be continued (or sustained) indefinitely. To do this they must balance limits imposed by human systems with those imposed by environmental ones.
What is planning for sustainability? Sustainability is forward-looking, and natural resources are finite. Planning for sustainability therefore involves making decisions about how we use limited resources in light of the continuing future needs for those resources. Planning for sustainability seeks to identify practices that can continue indefinitely without critically damaging natural resources, people, or economies, especially those that are at risk.
While it is tempting (and simpler) to base decisions purely on their immediate economic impacts, doing so can easily overlook the long-term environmental (and social) consequences that can undermine sustainability. In planning for sustainability, it is important to consider that human economic and social systems exist within and are dependent on the environment. Decision makers need to identify how their choices impact both human and environmental systems, as well as, whether such choices could persist indefinitely into the future.
Who is involved in planning for sustainability? Planning for sustainability involves everyone. It is reflected not only in decisions made by world leaders, but also in choices made by individual consumers. It is important to note that planning for sustainability can be done at any level—global, national, municipal, or individual.
The men and women who contribute to planning for sustainability as a part of their job have diverse positions in government and industry. These jobs may include various types of Environmental Scientists, various types of Engineers, Architects, Surveyors, Planners, Lawyers, Communication Specialists, Construction Workers, and Government Officials. Their decisions

2
impact our daily lives through choices about how we get our water, where bridges are built, when and where to harvest trees for timber, and what materials to use in designing energy-efficient buildings. These jobs often require mathematical and critical thinking skills to measure and model real-world systems and to simulate the impact of a wide range of future scenarios.
Contents
Lesson1:TheWaterCycle....................................................................................................................3 Lesson1:Homework..........................................................................................................................9Lesson2:Statistics...............................................................................................................................11 Lesson2:Homework........................................................................................................................15Lesson3:WeatherandStatisticalPersistence....................................................................................17 Lesson3:Homework........................................................................................................................21Lesson4:IntroductiontoWeatherGenerators..................................................................................23 Lesson4:Homework........................................................................................................................27Lesson5:NaturalVariabilityinData...................................................................................................29 Lesson5:Homework........................................................................................................................31Lesson6:PredictingtheFuture...........................................................................................................33Glossary...............................................................................................................................................37
3
Lesson1:TheWaterCycle
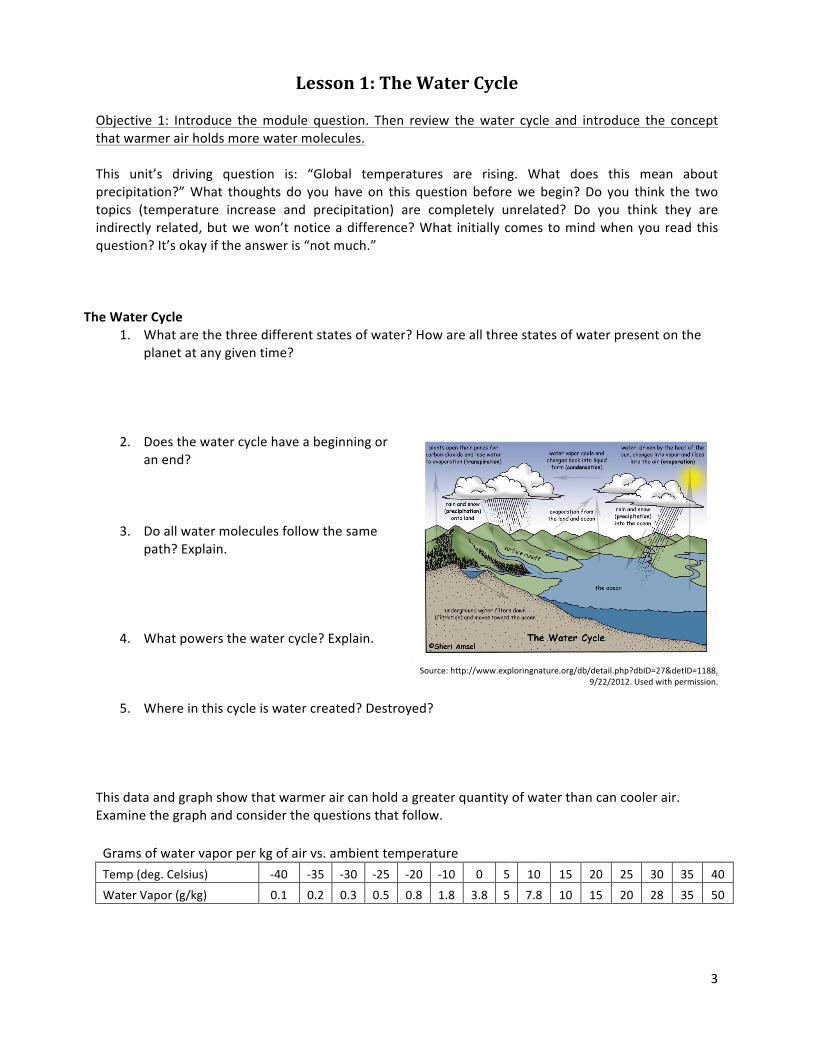
Objective 1: Introduce themodule question. Then review thewater cycle and introduce the conceptthatwarmerairholdsmorewatermolecules.This unit’s driving question is: “Global temperatures are rising. What does this mean aboutprecipitation?”What thoughts do you have on this question beforewe begin?Do you think the twotopics (temperature increase and precipitation) are completely unrelated? Do you think they areindirectly related,butwewon’tnoticeadifference?What initiallycomestomindwhenyoureadthisquestion?It’sokayiftheansweris“notmuch.”
TheWaterCycle1. Whatarethethreedifferentstatesofwater?Howareallthreestatesofwaterpresentonthe
planetatanygiventime?
2. Doesthewatercyclehaveabeginningoranend?
3. Doallwatermoleculesfollowthesamepath?Explain.
4. Whatpowersthewatercycle?Explain.
Source:http://www.exploringnature.org/db/detail.php?dbID=27&detID=1188,9/22/2012.Usedwithpermission.
5. Whereinthiscycleiswatercreated?Destroyed?
Thisdataandgraphshowthatwarmeraircanholdagreaterquantityofwaterthancancoolerair.Examinethegraphandconsiderthequestionsthatfollow.Gramsofwatervaporperkgofairvs.ambienttemperature
Temp(deg.Celsius) -40 -35 -30 -25 -20 -10 0 5 10 15 20 25 30 35 40
WaterVapor(g/kg) 0.1 0.2 0.3 0.5 0.8 1.8 3.8 5 7.8 10 15 20 28 35 50

4
Datafrom:http://web.gccaz.edu/~lnewman/gph111/topic_units/Labs_all/Water%20Vapor%20Capacity%20of%20Air.pdf,9/21/13.
1. Whatdoesthisgraphshowus?2. Basedonwhatthisgraphisshowingus,wherearewatermoleculesgetting“stuck”inthewater
cycleastemperaturesincrease?
3. Whatformofwaterisusablebyorganismslikeplantsandanimals(solid,liquid,orgas)?
4. Ifmorewatermoleculesaregetting“stuck”intheatmosphere,whatimpactcouldthathaveonorganismsandecosystems?
0
10
20
30
40
50
60
70
-40 -30 -20 -10 0 10 20 30 40 50
Gram
sofw
atervaporperkgofair(g/kg)
Temperature(OC)
Gramsofwatervaporperkgofair(g/kg)vs.temperature

5
Objective2:Developaconceptofsustainabilityasrelatedtowateruse.Asweworkthroughtoday’slesson,wewillbeworkingonthequestion,“Whatissustainability?”Startbyprovidingananswerforyourself,butfeelfreetoaddtoyourresponseaswediscussthisasaclass.Nowconsiderthisdefinition:
Source:http://www.epa.gov/sustainability/basicinfo.htm,9/22/2012.
1. Whatdoweneedforoursurvivalandwell-being?
2. Whatresourcesdependdirectlyonournaturalenvironment?
3. Whatresourcesdependindirectlyonournaturalenvironment?
4. Whatis“productiveharmony?”
5. Ifwaterexistsinacyclethathasnobeginningandnoend,whydoestheconceptofsustainabilityincludelimitationsofwateravailability?”
6.
Source:http://www.nsf.gov/pubs/2010/nsf10524/nsf10524.htm,9/22/2012.

6
Think-Pair-ShareIfwaterexistsinacyclethathasnobeginningandnoend,whydoestheconceptofsustainabilityincludelimitsofwateravailability?Think:Pair:Share:

7
Objective3:Identifythatthewatercycleisn’tchanging,butwhenandhowwaterisfallingischangingAsyourteachergoesthroughtheanimations,considerthefollowingquestions:
• Whatdothechangesincolormean?
• Doesthewholeglobegetdrieratthesametime?
• Whydosomeareasactuallygetwetter(moreblue)whilesomeareasgetdrier(morered)?Canweexplainthisintermsofthewatercycle?
Homework:ReadtheNewYorkTimesarticle“StudyIndicatesaGreaterThreatofExtremeWeather,”andwritearesponse.

8
Thispageintentionallyleftblank.

9
Name_______________________________________________Date________Period________WeatherGenerators
Lesson1:HomeworkDirections:Readthearticle.Onyourownpaper,respondtothepromptfoundattheend.April 26, 2012
Study Indicates a Greater Threat of Extreme Weather By JUSTIN GILLIS New research suggests that global warming is causing the cycle of evaporation and rainfall over theoceans to intensifymore thanscientistshadexpected,anominous finding thatmay indicateahigherpotentialforextremeweatherincomingdecades.Bymeasuringchanges insalinity(amountofsalt inthewater)ontheocean’ssurface,theresearchersinferredthatthewatercyclehadacceleratedbyabout4percentoverthe lasthalfcentury.Thatdoesnot sound particularly large, but it is twice the figure generated from computerized analyses of theclimate.Iftheestimateholdsup,itimpliesthatthewatercyclecouldquickenbyasmuchas20percentlaterinthis century as the planet warms, potentially leading to more droughts and floods. “This providesanother piece of independent evidence that we need to start taking the problem of global warmingseriously,”saidPaulJ.Durack,aresearcherattheLawrenceLivermoreNationalLaboratoryinCaliforniaandtheleadauthorofapaperbeingpublishedFridayinthejournalScience.Theresearchers’analysisfoundthatoverthehalfcenturythatbeganin1950,saltyareasoftheoceanbecamesaltier,while freshareasbecame fresher.That changewasattributed to strongerpatternsofevaporationandprecipitationovertheocean.Thenewpaperisnotthefirsttofindanintensificationofthewatercycle,noreventhefirsttocalculatethatitmightbefairlylarge.Butthepaperappearstomarshalmorescientificevidencethananypapertodateinsupportofahighestimate.“Iamexcitedaboutthispaper,”saidRaymondW.Schmitt,aseniorscientistattheWoodsHoleOceanographic Institution inMassachusetts,whoofferedacritiqueoftheworkbeforepublicationbutwasotherwisenotinvolved.“Theamplificationpatternthatheseesisreallyquitedramatic.”Thepaperisthelatestinstallmentinalong-runningeffortbyscientiststosolveoneofthemostvexingpuzzlesaboutglobalwarming.Whilebasicphysicssuggeststhatwarmingmustacceleratethecycleofevaporationandrainfall, ithasbeendifficulttogetahandleonhowmuchaccelerationhasalreadyoccurred,andthustoprojectthechangesthatarelikelytoresultfromcontinuedplanetarywarming.The fundamental problem is thatmeasurements of evaporation and precipitation over the ocean—which covers 71 percent of the earth’s surface, holds 97 percent of its water and is where most

10
evaporationandprecipitationoccurs—arespottyatbest.Toovercomethat,scientistsaretryingtousethechangingsaltinessoftheocean’ssurfaceasakindofraingauge.Thatworksbecause,asrainfallsonapatchoftheocean,itfreshensthesurfacewater.Conversely,inaregionwhereevaporationexceedsrainfall,thesurfacebecomessaltier.Thevariationsinsalinityarelargeenoughthattheycanbedetectedfromspace,andNASArecentlysentupanewsatellite,Aquarius,forthatpurpose.Butitwilltakeyearstoobtainresults,andscientistslikeDr. Durack are trying to get a jump on the problem by using older observations, including salinitymeasurementstakenbyshipsaswellasrecentmeasurementsfromanarmyofroboticfloatslaunchedinaninternationalprogramcalledArgo.Dr.SchmittcautionedthattheworkbyDr.Durackandhisco-authors,theAustralianresearchersSusanE.WijffelsandRichardJ.Matear,wouldneedtobescrutinizedandreproducedbyotherscientists.Anotherexpertnotinvolvedinthework,KevinE.TrenberthoftheNationalCenterforAtmospheric Research in Boulder, Colo., said that Dr. Durack had produced intriguing evidence thatglobalwarmingwasalreadycreatingchanges in thewatercycleata regional scale.ButDr.TrenberthaddedthathedoubtedthattheglobalintensificationcouldbeaslargeasDr.Durack’sgrouphadfound.“Ithinkhemighthavegoneabittoofar,”hesaid.Assuming that the paper withstands scrutiny, it suggests that a global warming of about 1 degreeFahrenheitoverthepasthalfcenturyhasbeenenoughtointensifythewatercyclebyabout4percent.That ledDr. Durack to project a possible intensification of about 20 percent as the planetwarms byseveraldegreesinthecomingcentury.Thatwouldbeapproximatelytwicetheamplificationshownbythecomputerprogramsusedtoprojectthe climate, according to Dr. Durack’s calculations. Those programs are often criticized by climate-changeskepticswhocontendthattheyoverestimatefuturechanges,butDr.Durack’spaperisthelatestofseveralindicationsthattheestimatesmayactuallybeconservative.Thenewpaperconfirmsalong-expectedpatternfortheoceanthatalsoseemstoapplyoverland:areaswithalotofrainfallintoday’sclimateareexpectedtobecomewetter,whereasdryareasareexpectedtobecomedrier.In theclimateof the future, scientists fear, a largeaccelerationof thewater cycle could feedgreaterweather extremes. Perhaps the greatest risk from global warming, they say, is that importantagriculturalareascoulddryout,hurtingthefoodsupply,asotherregionsgetmoretorrentialrainsandfloods.Writing prompt: On your own paper, write a paragraph explaining how measurements of salinity(saltiness) are used to infer the rate of thewater cycle.What impacts are suggested thatmay resultfromthechangeintherateofthewatercycle?
11
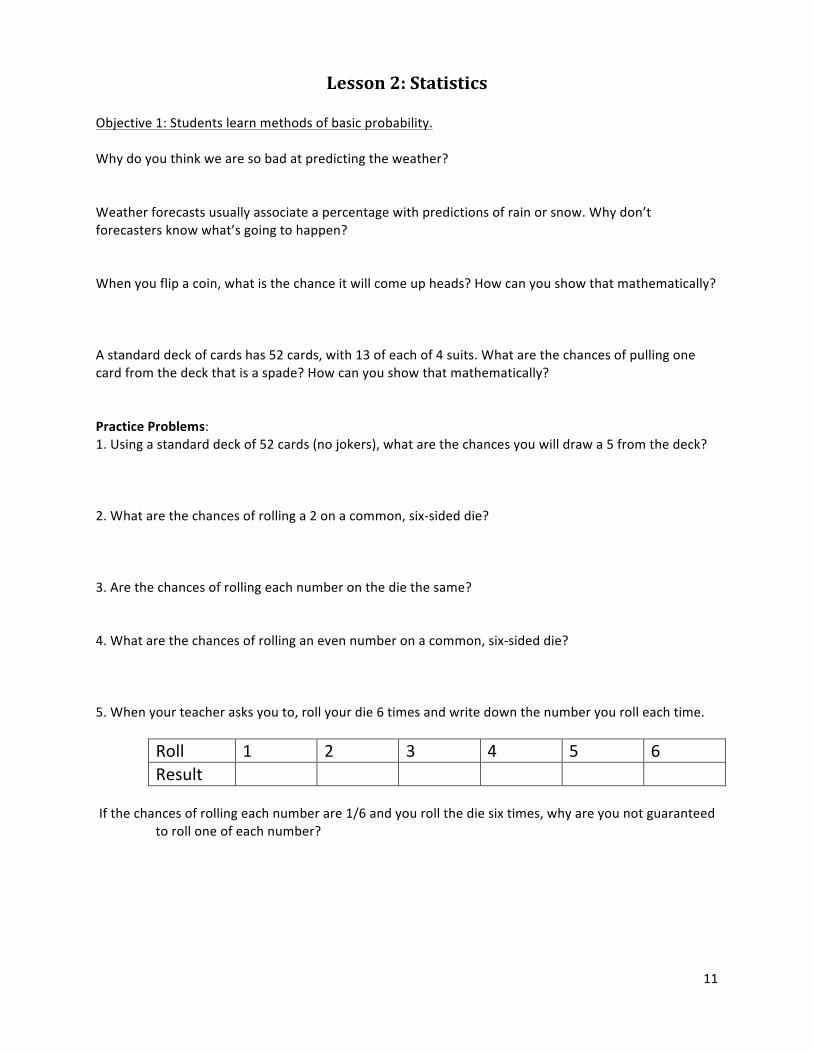
Lesson2:Statistics
Objective1:Studentslearnmethodsofbasicprobability.Whydoyouthinkwearesobadatpredictingtheweather?Weatherforecastsusuallyassociateapercentagewithpredictionsofrainorsnow.Whydon’tforecastersknowwhat’sgoingtohappen?Whenyouflipacoin,whatisthechanceitwillcomeupheads?Howcanyoushowthatmathematically?Astandarddeckofcardshas52cards,with13ofeachof4suits.Whatarethechancesofpullingonecardfromthedeckthatisaspade?Howcanyoushowthatmathematically?PracticeProblems:1.Usingastandarddeckof52cards(nojokers),whatarethechancesyouwilldrawa5fromthedeck?2.Whatarethechancesofrollinga2onacommon,six-sideddie?3.Arethechancesofrollingeachnumberonthediethesame?4.Whatarethechancesofrollinganevennumberonacommon,six-sideddie?5.Whenyourteacherasksyouto,rollyourdie6timesandwritedownthenumberyourolleachtime.
Roll 1 2 3 4 5 6Result
Ifthechancesofrollingeachnumberare1/6andyourollthediesixtimes,whyareyounotguaranteed
torolloneofeachnumber?

12
7. Whyisitsoimportantforstatisticianstouselargesamplesizes?
8. IfIamflippingacoinandhappentoflip10headsinarow,whatarethechancesthatmynextflipwillresultinheads,forthe11thtimeinarow?Howisthispossible?Usetheterm“independent”inyouranswer.
Objective2:Studentslearnmethodsofconditionalprobability.Let’sstartsimple:Yourmompurchasedabagof24Starburstcandies.Thebagcontains6ofeachcolor:red,orange,pink,andyellow.Let’ssupposeyourfavoriteflavoristhepink,soyoureallywantapinkone.Ifyoureachinandgraboneofthepiecesatrandom,whatarethechancesyouwilldrawapinkone?
• Well,let’sfurthersupposeyourtwooldersistersalsowantpinkStarburstandtheygettodrawtheirsrandomlyfromthebagbeforeyoudo.Doesthisaffectyourchancesofgettingwhatyouwant?How?
• Whatisconditionalprobability?
• “WhathappensifyoursistersbothdrawpinkStarburstbeforeyou?Now,whatarethechancesyouwilldrawapinkone?
• Whathappensifneitheroneofthemdrewapinkcandybeforeyou?Whatarethechancesyouwilldrawapinkone?
• Whatisa“string?”

13
Objective3:Studentslearnwhatitmeansfordatapointstobeindependent.Ingeneralterms,whatisthedifferencebetweendependentandindependentdatapoints?Giveanexampleofeach.Whatisthedifferencebetweenindependentandconditionalprobability?Isrollingadiemultipletimesorrollingmanydicesimultaneouslyanexampleofindependentorconditionalprobability?Explain.Thereare52playingcardsinastandarddeck.Astheyarebeingdealtout,youcan’treceivethecardsthathavealreadybeendealt.Thatchangestheprobabilityofwhatcardyouwillreceivewhileplayingthegame.Isthisanexampleofanindependentoraconditionalsituation?Explain.Thisunitinvolvesperformingstatisticalanalysesontheweather.Doyouthinkdeterminingtheweatherfromonedaytothenextisindependentofordependentonwhathashappenedinthepast?Why?Isweatherpredictionbasedonindependentordependentstatisticalprocedures?Explainyourchoice.

14
Thispageintentionallyleftblank.

15
Name_______________________________________________Date________Period________WeatherGenerators
Lesson2:Homework
1. Calculatethechancesofrollinga1or2onastandard,six-sideddie.Showyourwork.
2. Calculatethechancesofpullingaredcardfromastandarddeckof52cards.Showyourwork.
3. Supposeyouareplayingacardgamewiththreeotherpeopleandastandarddeckof52cards.Inthisgame,theaceisthehighcard.Eachpersonisdealt13cardssothatallcardsaredistributedamongtheplayers.Therearefouracesinthedeckandfourplayers.Whyisn’titguaranteedthateachoftheplayerswillreceiveoneoftheaces?
4. Inyourownwords,describethedifferencebetweenpredictedprobabilitiesandresults.
5. Foreachscenario,statewhetherthesituationdescribedwouldgeneratedatathatisindependentorconditional.Thenexplainyourchoice.
a. Flippingacoin100times
b. Drawingacardfromadeck,checkingthesuit,placingitbackinthedeck,andthendrawinganother
c. Drawingacardfromadeck,checkingthesuit,settingitaside,anddrawinganother
d. Rollingtwodicesimultaneously

16
Thispageintentionallyleftblank.

17
Lesson3:WeatherandStatisticalPersistence
Objective1:Watchavideoonhowfrontsmove,toexplaintheconceptofstatisticalpersistence.Asyouwatchthevideo,considerthequestion:Doyouthinktheweathertodayisrelatedtotheweatherwe’llhavetomorrow?Isweathercompletelyindependentdaytoday?Whatdoesitmeantobe“persistent?”Objective2:Createaflowchartthatdescribesstatisticalpersistencewithrelationtodice,includinga
definitionofwetanddrydays.Forourpurposes,whatarewetdays?Drydays?Whatisaflowchart?Developasimpleflowchartthatguidesyouthroughthedecisionofwhenyouwilldoyourhomeworktonight.
18
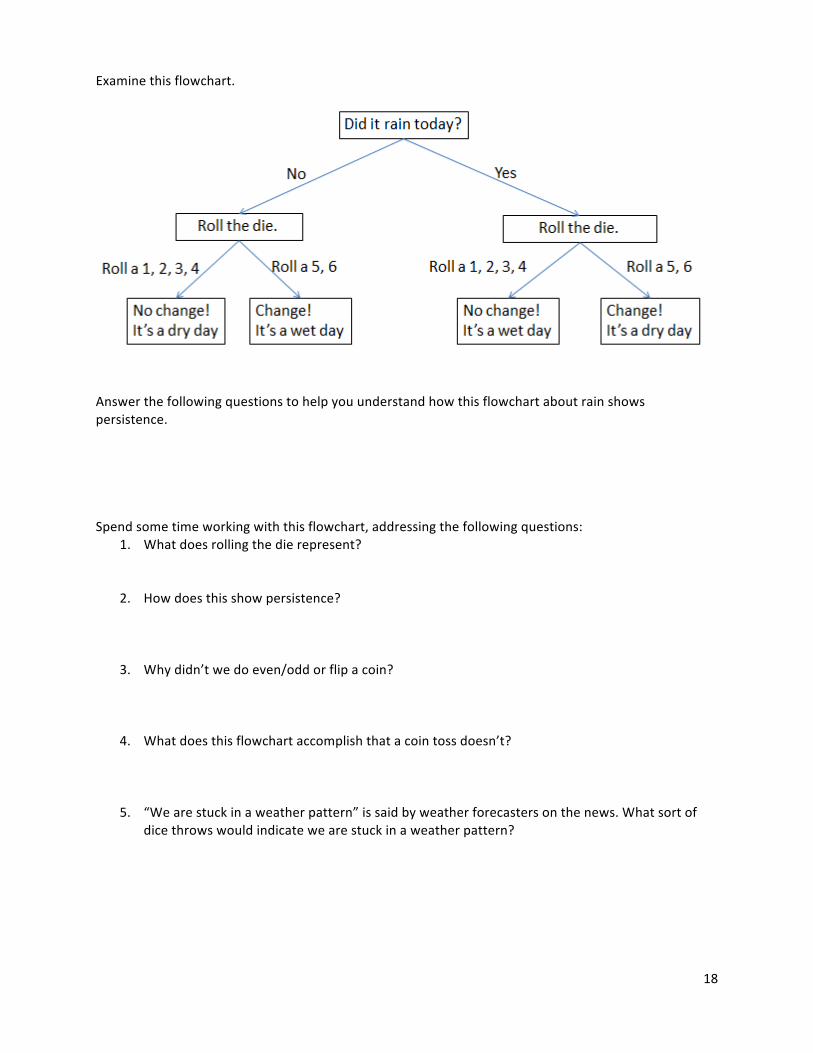
Examinethisflowchart.
Answerthefollowingquestionstohelpyouunderstandhowthisflowchartaboutrainshowspersistence.
Spendsometimeworkingwiththisflowchart,addressingthefollowingquestions:
1. Whatdoesrollingthedierepresent?
2. Howdoesthisshowpersistence?
3. Whydidn’twedoeven/oddorflipacoin?
4. Whatdoesthisflowchartaccomplishthatacointossdoesn’t?
5. “Wearestuckinaweatherpattern”issaidbyweatherforecastersonthenews.Whatsortofdicethrowswouldindicatewearestuckinaweatherpattern?

19
Objective3:Collectdatawithpersistence;summarizeitina2x2grid.Rollyourdie30times.Keepitsimple:ifyourolla1,2,3,or4,theweatheristhesameasthepreviousday.Ifyourolla5or6,theweatherswitchestothealternate,eitherwetordry.Remember:Rollingthediedoesn’tindicatewhetheritwillrain,itindicateswhethertheweatherwillchange.
Data:StartingweatherisDry
Roll Today'sWeather
2x2DataSummaryGrid1
16
Today
2
17
Yesterda
y Wet Dry3
18 Wet
4
19 Dry 5
20
6
21 7
22
8
23 9
24
10
25 11
26
12
27 13
28
14
29 15
30
Now,summarizeyourdatabytallyinghowmanytimestheweatherchangedfromwettodryorviceversainthe2x2grid.

20
1. Bylookingatyour2x2grid,howcanyoutellthatthereispersistenceintheweather?
2. Whatwouldthesummarygridlooklikeifthereweren’tpersistenceintheweather?
3. Eventhoughthewholeclassstartedwiththesamematerialsandinformation(startingweatherisdry)yourdataisdifferent.Whyisthat?
Homework:Collectdatawithoutpersistence;summarizeitina2x2grid.(Thiswillbeusedtoseeifourpersistencemodelisworking.)Note:Youdonotneedtotakethediehome.Nopersistenceisachievedbyflippingacoin.

21
Name_______________________________________________Date________Period________WeatherGenerators
Lesson3:HomeworkFlowchartfordeterminingprecipitationwithoutpersistence,byflippingacoin.
Data:StartingweatherisDry
Roll Today'sWeather
2x2DataSummaryGrid1
16
Today
2
17
Yesterda
y
Wet Dry3
18 Wet
4
19 Dry 5
20
6
21 7
22
8
23 9
24
10
25 11
26
12
27 13
28
14
29 15
30
Explainwhythisdatadoesn’tshowpersistence,eventhoughyoumaynothaveexactly½thedaysaswetand½thedaysasdry.

22

23
Lesson4:IntroductiontoWeatherGenerators
Objective1:Introducetheweathergeneratorandtransitionprobabilityfiles.Explainwhatthegeneratoris doing and connect it to thedice lesson.Generateone setof data for a location inNorthAmerica.
Openthe“WeatherGenerator”Excelfilesonyourcomputer.Noticethefollowingcomponentsonthe“WeatherGenerator”tab:
• Transition Probabilities: These are the probabilities that reflect the chance of a change inweather.wet|drymeans “The probability of tomorrow beingwet given that todaywas dry.”wet|wetmeans“Theprobabilityoftomorrowbeingwetgiventhattodaywaswet.”
• Yearsarelistedacrossthetop;studentsmayhavethegeneratorprepareasmanyyearsatonceastheywouldlikebychangingthenumberontheleft.
• Youmayalsochange thenumberofdaysgeneratedperyear.Sinceeachmonthhasdifferenttransition probability it makes sense to have a number ~30, but it can be manipulated forshorterorlongermonths.
• Scrollingdownwillrevealthetotalnumberofwetdaysanddrydayseachmonth.Scrollbackuptorecalculateorchangetransitionprobabilities.
Nownotice theother twotabsonthebottomof thespreadsheet, titled,“Current”and“Future.”Thetwotabslookquitesimilarbutcontaindifferentinformation.
• The Current tab gives transition probabilities thatwere actually experienced over the last 30yearsorso.
• TheFuturetabgivestransitionprobabilitiesthatscientistsbelievemayhappenbasedonclimatemodels.
• Noticethatonbothtabsyouwillseetwodifferenttransitionprobabilities:oneforwet|wetandoneforwet|dry.Whenstudentsworkwiththedata, it is importantthattheyunderstandthattheymustusethevalues forthesamemonthandthesame location inordertoobtainusefuldata.
Put some fake numbers in for transition probabilities and see what happens.What patterns do youobserve?Obtain a location and month assignment from your teacher. Then, go to the “Current” transitionprobabilitytabandfindthetwotransitionprobabilitiesforthatassignment.Recordthemhere:wet|dry___________wet|wet___________Enterthosevaluesintheweathergeneratorandclick“Calculate.”1.Youhavejustusedtheweathergeneratorforthefirsttime,creating5yearsofdataforonemonthinonelocation.Describetheresults:
24
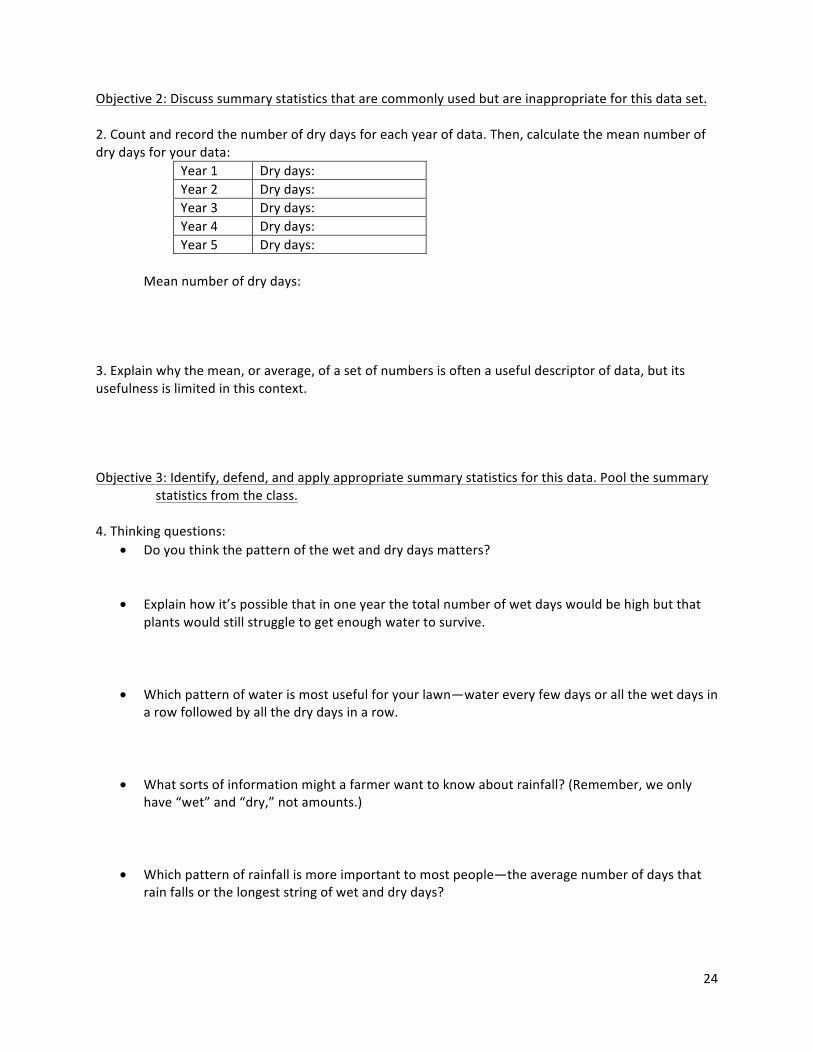
Objective2:Discusssummarystatisticsthatarecommonlyusedbutareinappropriateforthisdataset.2.Countandrecordthenumberofdrydaysforeachyearofdata.Then,calculatethemeannumberofdrydaysforyourdata:
Year1 Drydays:Year2 Drydays:Year3 Drydays:Year4 Drydays:Year5 Drydays:
Meannumberofdrydays:
3.Explainwhythemean,oraverage,ofasetofnumbersisoftenausefuldescriptorofdata,butitsusefulnessislimitedinthiscontext.Objective3:Identify,defend,andapplyappropriatesummarystatisticsforthisdata.Poolthesummary
statisticsfromtheclass.4.Thinkingquestions:
• Doyouthinkthepatternofthewetanddrydaysmatters?
• Explainhowit’spossiblethatinoneyearthetotalnumberofwetdayswouldbehighbutthatplantswouldstillstruggletogetenoughwatertosurvive.
• Whichpatternofwaterismostusefulforyourlawn—watereveryfewdaysorallthewetdaysinarowfollowedbyallthedrydaysinarow.
• Whatsortsofinformationmightafarmerwanttoknowaboutrainfall?(Remember,weonlyhave“wet”and“dry,”notamounts.)
• Whichpatternofrainfallismoreimportanttomostpeople—theaveragenumberofdaysthatrainfallsorthelongeststringofwetanddrydays?

25
Objective4:Assignonemonthoftheyeartoeachstudent.StudentsuseseeddatafromNCARandrun
theweather generator. They then use the summary statistics fromObjective 3 to describetheirfindingsofwetanddrydaysforeachmonthoftheyear.
5.Asaclass,chooseonelocationfromthe“Current”tabthatyouwishtoinvestigatetogether.
• Recordwhichmonthyou’vebeenassignedtoinvestigate:____________________________• Runthesimulationfor5yearswiththeappropriatetransitionprobabilitiesforyourmonth.For
eachyear,collectdata:totalnumberofwetdays,totalnumberofdrydays, longestwetspell,andlongestdryspellforyourmonth.Recordthesevaluesinthedatatablebelow.Last,computethemeanforeachsummarystatistic.
• Compare the summary statisticswith thoseofother studentswhohave the samemonthandreportyouroverallmeantotheclassdatatable.
Year1 Year2 Year3 Year4 Year5 Mean
Total#ofwetdays
Total#ofdrydays
Longestwetspell
Longestdryspell

26
Thispageintentionallyleftblank.

27
Name_______________________________________________Date________Period________WeatherGenerators
Lesson4:Homework
Directions: Using the wet/dry data generated by hand with persistence vs. without persistence,computethesamesummarystatisticswediscussedinclass:totalnumberofwetdays,totalnumberofdrydays, longestwet spell, and longestdry spell. (Thesearehandouts titled Lesson3:ClassworkandLesson3:Homework.)Forthedatasetwithpersistence(Lesson3:Classwork):
1. Whatisthetotalnumberofwetdays?_______
2. Whatisthetotalnumberofdrydays?_______
3. Whatisthelongestwetspell?_______
4. Whatisthelongestdryspell?______Forthedatasetwithoutpersistence(Lesson3:Homework):
5. Whatisthetotalnumberofwetdays?_______
6. Whatisthetotalnumberofdrydays?_______
7. Whatisthelongestwetspell?_______
8. Whatisthelongestdryspell?______Compareandcontrastthestatistics.Whatissimilaraboutthestatisticsforthetwodifferentdatasets?Whatisdifferent?All studentsusedthesamematerials togeneratedata (identical flowcharts,die,pennies,andstartingdata). Ifwewereall tocomparedatasheets,what shouldweexpect toseeas similarordifferentondifferentstudents’data?Shouldweallexpecttohavethesamedata?Shouldweallexpecttohavethesamesummarystatistics?Whichismorelikelytobethesameamongdifferentstudents?

28
Thispageintentionallyleftblank.
29
Lesson5:NaturalVariabilityinDataSummary:Studentsworktounderstandthedifferencebetweennaturalvariabilityandvariabilitythatis
theresultofhidden,andpossiblyproblematic,variables.Studentsusetheweathergeneratoragaintoexamineandsummarizevariabilitythatisnatural.
Objective1:Examinethehomeworkfromthenightbefore.Howwerethesummarystatisticsdifferent
forthedatawithvs.withoutpersistence?Lookagainatyourhomework.Howcouldwerepresentthisdatagraphicallysothatitiseasiertounderstand?Whatisahistogram?Whatisitusedfor?Aftertheclasshasbuiltahistogramoftheirdata,considerthefollowingquestions:
• Inwhichhistogramistheshortestwetordryspell?
• Dothereappeartobeanytrendsinthelengthofthewetanddryspells?(Thedatawithpersistenceshouldshowlongerwetanddryspells.)
• Whydoesthisdatareflectourdata-collectiontechnique(independentvs.withpersistence)?
30
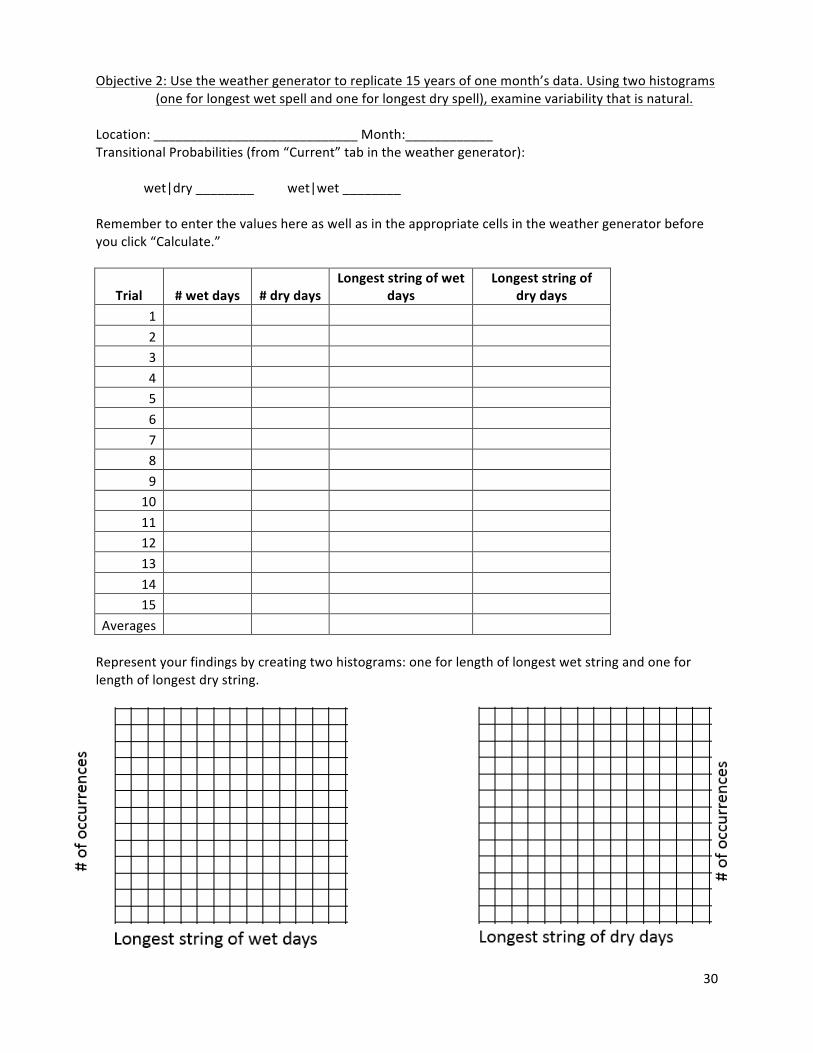
Objective2:Usetheweathergeneratortoreplicate15yearsofonemonth’sdata.Usingtwohistograms(oneforlongestwetspellandoneforlongestdryspell),examinevariabilitythatisnatural.
Location:____________________________Month:____________TransitionalProbabilities(from“Current”tabintheweathergenerator):
wet|dry________ wet|wet________
Remembertoenterthevalueshereaswellasintheappropriatecellsintheweathergeneratorbeforeyouclick“Calculate.”
Trial #wetdays #drydaysLongeststringofwet
daysLongeststringof
drydays1 2 3 4 5 6 7 8 9
10 11 12 13 14 15
Averages Representyourfindingsbycreatingtwohistograms:oneforlengthoflongestwetstringandoneforlengthoflongestdrystring.

31
Name_______________________________________________Date________Period________WeatherGenerators
Lesson5:Homework
Consideringthefuture:Howcouldachangeinthewatercyclechangetheday-to-dayexistenceoftheorganismslistedbelow?Imagineyouareeachoftheorganisms.Basedonyourcurrentknowledgeleveloftheseorganisms,predicthowachangeinthewatercyclemightaffecteach.Startbyidentifyingthechiefmannerinwhichyoubelievetheorganismuseswaterandthenidentifywhatmighthappentotheorganismifthequantityofwatereitherincreasedordecreased.Remember:thereislessavailablewaterandsomeareaswillgetwetterwhilesomewillgetdrier.Itispossiblethatsomeorganismswillbenefitfromthis!
1. Arivertrout.
2. Acoralreeffish.
3. Atreeintherainforest.
4. Acactusinthedesert.
5. Acottonfarmer.
6. Acattlerancher.
7. Amigratorybird.
8. Amosquito.
9. Apersonlivinginyourhometownwhoworksindoors.

32
Thispageintentionallyleftblank.

33
Lesson6:PredictingtheFuture
Summary: Students use theweather generator again to predictwhat the future holds. Using outputfromNCARmodelstoseedtheirownweathergeneratormodels,studentsexaminedataandwork to determine how future weather patternsmight be different from current patterns.Finally, themodule endswith students acknowledging themerits and limitations ofmodel-building.
Objective1:RuntheweathergeneratorwithfuturetransitionprobabilitiesfromNCAR.SummarizethedatausingtechniquesdevelopedinLesson5.Untilnow,wehaveonlyexploredtheimplicationsoftransitionprobabilitiesfromthepast.Inessence,scientistshavetakentheactualstringsofdryandwetdaysfromthepastandproducedthetransitionprobabilities based on the actualweather.Wewill now use theweather generator forwhat climatescientistsmoreoftenareinterestedin:predictingthefuture.In the Excel file, the “Future” tab on the weather generator provides another set of transitionprobabilities. This time, though, rather thanusinghistorical dataofwet anddrydays, scientists haveusedapredictiveclimatemodeltodeterminewhatthefuturetransitionprobabilitieswillbebasedoncurrent trends. Scientists continue to collect data every day, and asmore data is collected, updatedinformation becomes available. What we are interested in is using these transition probabilities topredicthowtheoverallweatherpatternswillshiftinthefuture.Today’swork issimilar toyesterday’swork,exceptnowweareusingthetransitionprobabilities fromthe“Future”tabratherthanthe“Current”tab.Thereisobviouslyuncertaintywithpredictingthefuture.JustasinLesson2,welearnedhowrealityisdifferentfrompredictedprobability.(Remember,ifIrolladiesixtimes,I’mnotguaranteedtogeteachnumberonetime.)Whiletheweathergeneratorispredictiveoftheclimatewemayexperienceinthefuture,wedon’texpectthatanymonthwillactuallyhaveaseriesofwet/drydaysexactlylikewhatwearepredicting.The whole class will work on one location, with each student being assigned onemonth—the samemonththeyworkedontheperiodbefore.Thistime,collectdatafor30years.Wewanttocollectmoredata to predict the future thanwhenwewere looking at the past becausemore data leads tomoreaccuratepredictions.

34
Location:____________________________Month____________TransitionalProbabilities(from“Future”tabintheweathergenerator):
wet|dry________ wet|wet________
Remembertoenterthevalueshereaswellasintheappropriatecellsintheweathergeneratorbeforeyouclick“Calculate.”
Trial#wetdays
#drydays
Longeststringofwetdays
Longeststringofdrydays
1 2 3 4 5 6 7 8 9 10 11 12 13 14 15 16 17 18 19 20 21 22 23 24 25 26 27 28 29 30
Averages

35
Representyourfindingsbycreatingtwohistograms:oneforlengthoflongestwetstringandoneforlengthoflongestdrystring.
Objective2:Compareandcontrastthefuturedatawithpastdata.Nowcomparethehistogramsfromthe“current”data(fromLesson5:Classwork)withthosefromthe“future”datayoujustcreated.Whatarethedifferencesandsimilarities?Arethehistogramscenteredonthesameplace?Whatdoesthisindicateaboutthefuture?Thismodule’sdrivingquestionis:“Globaltemperaturesarerising.Whatdoesthismeanaboutprecipitation?”Whatthoughtsdoyouhaveonthisquestionnowthatyouhavecompletedthemodule?Ifyourteacherhadyourecordaresponsetothisquestionatthebeginningofthemodule,gobackandreadyouroriginalresponse.Howhasyourunderstandingofthisquestionchanged?

36
Objective3:Connectthisdatatoourdailylives.Iftheweatherpatternschangeforthelocationtheclassinvestigated,whatarethepossiblerepercussions?Lookatthedata:Iseachmonthgoingtobewetter,bedrier,orhavenochange?Thinkseasonally:Willeachseasonbewetterordrier?Whataretheimplicationsofthis?Example:InDenver,weexperiencethemajorityofourmoistureintheformofsnowthatfallsinthelatewinterandspring.Thissnowpackthenmeltsthroughthelatespring,summer,andfallmonthsandprovidesthesurroundingareaswithwater.Iftheweatherpatternschangedsuchthatwinterandspringbecamedrier,wewouldbefacedwithalackofwatertofillourreservoirs.Thiswouldresultinareductioninavailablewaterfordrinkingandirrigation,andalossofrecreationalareas,sinceweusethereservoirsforboating,fishing,andaquaticrecreation.Whataretheimplicationsofthechangeinweatherpatternsforthelocationyouinvestigated?Objective4:Discusstheusefulnessandlimitationsofmodel-building.Whatarethebenefitsofusingmodel-buildingtoanswerdifficultquestions?Whatarethelimitationsofusingmodel-buildingtoanswerdifficultquestions?

37
GlossaryCondensation—Theconversionofgastoliquid;inthecaseofwater,thegasiswatervapor.Conditionalprobability—Theprobabilityofaneventgiventhatanothereventhasalreadyoccurred.Evaporation—Theconversionofliquidtogas.Histogram—Agraphicaldisplayofdata.Dataistypicallygroupedinto“bins,”orranges,andthenplotted
asverticalbars.Mean—syn.Average.Thesumofthevaluesofasetdividedbythenumber.Median—Themiddlevalueinaseriesofvalues.Mode—Thevaluethatoccursmostfrequentlyinaparticulardataset.Molecule—Agroupofatomsbondedtogether.NCAR—NationalCenterforAtmosphericResearch.Persistence—Whendataoccursinawaysuchthateachdatapointisnotindependentoftheprevious
one.Rather,eachdatapointissomewhat,thoughnotentirely,dependentonthepreviousdatapoint.
Precipitation—Rain,snow,sleet,orhailthatfallsfromthesky.Salinity—Thedissolvedsaltcontentofwater.Simpleprobability—Thechance,orlikelihood,ofaparticulareventoccurring.Sustainability—Theenduranceofsystemsorprocesses.Transitionprobability—Theprobabilityofgoingfromagivenstatetothenext,oralternate,state.Transpiration—Theprocessofwaterbeingabsorbedbyaplant’sroots,movingupwardthroughthe
shoots,andevaporatingaswatervaporfromtheleaves.Weathergenerator—Statisticalmodelthataimstopredictparticularaspectsoffutureweather
conditions.