Wealth-Lab Pro™ WealthScript Function Reference · Wealth-Lab Pro™ WealthScript Function...
323
© 2003-2006 FMR Corp. All rights reserved. WealthScript Function Reference Wealth-Lab Pro™
Transcript of Wealth-Lab Pro™ WealthScript Function Reference · Wealth-Lab Pro™ WealthScript Function...

© 2003-2006 FMR Corp. All rights reserved.
WealthScript Function Reference
Wealth-Lab Pro™

Wealth-Lab Pro™ WealthScript Function Reference
by FMR Corp.
Revised: Tuesday, May 30, 2006
No parts of this work may be reproduced in any form or by any means - graphic, electronic, or mechanical, includingphotocopying, recording, taping, or information storage and retrieval systems - without the written permission of thepublisher.
Third party trademarks and service marks are the property of their respective owners.
While every precaution has been taken in the preparation of this document, the publisher and the author assume noresponsibility for errors or omissions, or for damages resulting from the use or misuse of information contained in thisdocument or from the use or misuse of programs and source code that may accompany it. In no event shall thepublisher and the author be liable for any loss of profit or any other commercial damage caused or alleged to havebeen caused directly or indirectly by this document.
Printed: Tuesday, May 30, 2006
Wealth-Lab Pro™ WealthScript Function Reference
© 2003-2006 FMR Corp. All rights reserved.
Special thanks to:
Wealth-Lab's great on-line community whose comments havehelped make this manual more useful for veteran and new usersalike.
EC Software, whose product HELP & MANUAL printed thisdocument.

Table of Contents
Foreword 0
Part I Introduction 14
Part II Alert Functions 16
................................................................................................................................... 161 Overview
................................................................................................................................... 172 AlertCount
................................................................................................................................... 173 AlertOrderType
................................................................................................................................... 184 AlertPositionType
................................................................................................................................... 185 AlertPrice
................................................................................................................................... 196 AlertShares
................................................................................................................................... 197 AlertSymbol
Part III Cosmetic Chart Functions 20
................................................................................................................................... 201 Overview
................................................................................................................................... 202 AnnotateBar
................................................................................................................................... 213 AnnotateChart
................................................................................................................................... 214 CreatePane
................................................................................................................................... 215 DrawCircle
................................................................................................................................... 226 DrawCircle2
................................................................................................................................... 227 DrawDiamond
................................................................................................................................... 238 DrawEllipse
................................................................................................................................... 249 DrawHorzLine
................................................................................................................................... 2410 DrawImage
................................................................................................................................... 2511 DrawLabel
................................................................................................................................... 2512 DrawLine
................................................................................................................................... 2513 DrawRectangle
................................................................................................................................... 2614 DrawRoundRect
................................................................................................................................... 2715 DrawText
................................................................................................................................... 2716 DrawTriangle
................................................................................................................................... 2817 EnableNotes
................................................................................................................................... 2818 EnableTradeNotes
................................................................................................................................... 2919 HidePaneLines
................................................................................................................................... 2920 HideVolume
................................................................................................................................... 2921 PlotSeries
................................................................................................................................... 3022 PlotSeriesLabel
................................................................................................................................... 3123 PlotStops
WealthScript Function Reference, Wealth-Lab Pro™I
© 2003-2006 FMR Corp. All rights reserved.

................................................................................................................................... 3124 PlotSymbol
................................................................................................................................... 3225 PlotSyntheticSymbol
................................................................................................................................... 3326 SetBackgroundColor
................................................................................................................................... 3427 SetBarColor
................................................................................................................................... 3428 SetBarColors
................................................................................................................................... 3529 SetColorScheme
................................................................................................................................... 3530 SetLogScale
................................................................................................................................... 3531 SetPaneBackgroundColor
................................................................................................................................... 3632 SetPaneMinMax
................................................................................................................................... 3633 SetSeriesBarColor
Part IV CommissionScript Functions 38
................................................................................................................................... 381 Overview
................................................................................................................................... 382 CMShares
................................................................................................................................... 383 CMPrice
................................................................................................................................... 394 CMEntry
................................................................................................................................... 395 CMOrderType
................................................................................................................................... 406 CMSymbol
................................................................................................................................... 407 CMDataSource
................................................................................................................................... 408 CMResult
Part V Data Access Functions 42
................................................................................................................................... 421 Overview
................................................................................................................................... 422 BarCount
................................................................................................................................... 423 GetDate
................................................................................................................................... 434 GetMargin
................................................................................................................................... 435 GetPointValue
................................................................................................................................... 436 GetSecurityName
................................................................................................................................... 447 GetSymbol
................................................................................................................................... 448 GetTick
................................................................................................................................... 459 GetTime
................................................................................................................................... 4610 OpenInterest
................................................................................................................................... 4611 PriceAverage
................................................................................................................................... 4612 PriceAverageC
................................................................................................................................... 4713 PriceClose
................................................................................................................................... 4714 PriceHigh
................................................................................................................................... 4815 PriceLow
................................................................................................................................... 4816 PriceOpen
................................................................................................................................... 4917 Volume
IIContents
II
© 2003-2006 FMR Corp. All rights reserved.

Part VI Date/Time Functions 50
................................................................................................................................... 501 Overview
................................................................................................................................... 502 BarInterval
................................................................................................................................... 503 BarNum
................................................................................................................................... 514 CurrentDate
................................................................................................................................... 515 CurrentTime
................................................................................................................................... 516 DateTimeToBar
................................................................................................................................... 527 DateToBar
................................................................................................................................... 538 DateToStr
................................................................................................................................... 539 DayOfWeek
................................................................................................................................... 5310 DaysBetween
................................................................................................................................... 5411 DaysBetweenDates
................................................................................................................................... 5512 GetDay
................................................................................................................................... 5513 GetHour
................................................................................................................................... 5614 GetMinute
................................................................................................................................... 5615 GetMonth
................................................................................................................................... 5616 GetYear
................................................................................................................................... 5717 IsLeapYear
................................................................................................................................... 5718 LastBar
................................................................................................................................... 5819 OptionExpiryDate
................................................................................................................................... 5920 StrToDate
................................................................................................................................... 5921 StrToTime
................................................................................................................................... 6022 TimeToStr
Part VII File Access Functions 61
................................................................................................................................... 611 Overview
................................................................................................................................... 612 FileClear
................................................................................................................................... 613 FileClose
................................................................................................................................... 614 FileCreate
................................................................................................................................... 625 FileEOF
................................................................................................................................... 626 FileFlush
................................................................................................................................... 627 FileOpen
................................................................................................................................... 638 FileRead
................................................................................................................................... 639 FileWrite
Part VIII Fundamental Data Access Functions 65
................................................................................................................................... 651 Overview
................................................................................................................................... 672 FundamentalItemCount
................................................................................................................................... 683 FundamentalItemData
WealthScript Function Reference, Wealth-Lab Pro™III
© 2003-2006 FMR Corp. All rights reserved.

................................................................................................................................... 694 FundamentalPriceSeries
................................................................................................................................... 705 FundamentalPriceSeriesAggregate
................................................................................................................................... 706 FundamentalPriceSeriesAnnual
................................................................................................................................... 717 FundamentalPriceSeriesAnnualOffset
................................................................................................................................... 728 FundamentalPriceSeriesAverage
................................................................................................................................... 729 FundamentalPriceSeriesOffset
................................................................................................................................... 7310 GetFundamentalBar
................................................................................................................................... 7411 GetFundamentalIndex
................................................................................................................................... 7512 GetFundamentalNextBar
................................................................................................................................... 7613 GetFundamentalValue
................................................................................................................................... 7714 GetGicsSector
................................................................................................................................... 7715 GetGicsIndustryGroup
................................................................................................................................... 7816 GetGicsIndustry
................................................................................................................................... 7917 GetGicsSubIndustry
................................................................................................................................... 7918 GetGicsDesc
Part IX Math Functions 81
................................................................................................................................... 811 Overview
................................................................................................................................... 812 Abs
................................................................................................................................... 813 ArcCos
................................................................................................................................... 824 ArcSin
................................................................................................................................... 825 ArcSinh
................................................................................................................................... 826 ArcTan
................................................................................................................................... 827 ArcTanh
................................................................................................................................... 828 Correlation
................................................................................................................................... 839 Cos
................................................................................................................................... 8310 Cosh
................................................................................................................................... 8311 Cotan
................................................................................................................................... 8312 Dec
................................................................................................................................... 8413 DegToRad
................................................................................................................................... 8414 Exp
................................................................................................................................... 8415 Frac
................................................................................................................................... 8516 Hypot
................................................................................................................................... 8517 Inc
................................................................................................................................... 8518 Int
................................................................................................................................... 8619 LinearRegLine
................................................................................................................................... 8620 LineExtendX
................................................................................................................................... 8721 LineExtendY
................................................................................................................................... 8722 LN
................................................................................................................................... 8823 Log10
IVContents
IV
© 2003-2006 FMR Corp. All rights reserved.

................................................................................................................................... 8824 Log2
................................................................................................................................... 8825 Max
................................................................................................................................... 8926 Min
................................................................................................................................... 9027 Pi
................................................................................................................................... 9028 Power
................................................................................................................................... 9029 RadToDeg
................................................................................................................................... 9130 RandG
................................................................................................................................... 9131 Random
................................................................................................................................... 9232 RandomInt
................................................................................................................................... 9233 Randomize
................................................................................................................................... 9234 RandSeed
................................................................................................................................... 9235 Round
................................................................................................................................... 9336 SetRandSeed
................................................................................................................................... 9337 Sin
................................................................................................................................... 9338 Sinh
................................................................................................................................... 9439 Sqr
................................................................................................................................... 9440 Sqrt
................................................................................................................................... 9441 Tan
................................................................................................................................... 9442 Tanh
................................................................................................................................... 9443 TrendLineValue
................................................................................................................................... 9544 Trunc
Part X PerfScript Functions 96
................................................................................................................................... 961 Overview
................................................................................................................................... 962 AccountExposure
................................................................................................................................... 973 CashInterest
................................................................................................................................... 974 DividendsPaid
................................................................................................................................... 975 MarginLoan
................................................................................................................................... 986 PerfAddCurrency
................................................................................................................................... 987 PerfAddNumber
................................................................................................................................... 998 PerfAddPct
................................................................................................................................... 999 PerfAddString
................................................................................................................................... 10010 PerfAddBreak
................................................................................................................................... 10011 StartingCapital
................................................................................................................................... 10012 TotalCommission
Part XI Position Management Functions 102
................................................................................................................................... 1021 Overview
................................................................................................................................... 1022 ActivePositionCount
................................................................................................................................... 1033 ClearPositions
WealthScript Function Reference, Wealth-Lab Pro™V
© 2003-2006 FMR Corp. All rights reserved.

................................................................................................................................... 1044 GetPositionData
................................................................................................................................... 1055 GetPositionPriority
................................................................................................................................... 1066 GetPositionRiskStop
................................................................................................................................... 1077 LastActivePosition
................................................................................................................................... 1078 LastLongPositionActive
................................................................................................................................... 1089 LastPosition
................................................................................................................................... 10810 LastPositionActive
................................................................................................................................... 10911 LastShortPositionActive
................................................................................................................................... 11012 MarketPosition
................................................................................................................................... 11113 PositionActive
................................................................................................................................... 11214 PositionBasisPrice
................................................................................................................................... 11315 PositionBarsHeld
................................................................................................................................... 11316 PositionCount
................................................................................................................................... 11417 PositionEntryBar
................................................................................................................................... 11518 PositionEntryPrice
................................................................................................................................... 11619 PositionExitBar
................................................................................................................................... 11720 PositionExitPrice
................................................................................................................................... 11721 PositionExitSignalName
................................................................................................................................... 11822 PositionLong
................................................................................................................................... 11923 PositionMAE
................................................................................................................................... 11924 PositionMAEPct
................................................................................................................................... 12025 PositionMFE
................................................................................................................................... 12126 PositionMFEPct
................................................................................................................................... 12227 PositionOpenMAE
................................................................................................................................... 12328 PositionOpenMAEPct
................................................................................................................................... 12429 PositionOpenMFE
................................................................................................................................... 12430 PositionOpenMFEPct
................................................................................................................................... 12431 PositionOpenProfit
................................................................................................................................... 12532 PositionOpenProfitPct
................................................................................................................................... 12633 PositionOrderType
................................................................................................................................... 12734 PositionProfit
................................................................................................................................... 12835 PositionProfitPct
................................................................................................................................... 12936 PositionShares
................................................................................................................................... 12937 PositionShort
................................................................................................................................... 13038 PositionSignalName
................................................................................................................................... 13139 PositionSymbol
................................................................................................................................... 13140 SetPositionData
................................................................................................................................... 13241 SetPositionPriority
................................................................................................................................... 13342 SetPositionRiskStop
VIContents
VI
© 2003-2006 FMR Corp. All rights reserved.
................................................................................................................................... 13443 SetRiskStopLevel
Part XII Price Series Functions 135
................................................................................................................................... 1351 Overview
................................................................................................................................... 1352 AbsSeries
................................................................................................................................... 1353 AddCalendarDays
................................................................................................................................... 1364 AddFutureBars
................................................................................................................................... 1375 AddSeries
................................................................................................................................... 1376 AddSeriesValue
................................................................................................................................... 1387 AnalyzeSeries
................................................................................................................................... 1398 ChangeBar
................................................................................................................................... 1399 ClearExternalSeries
................................................................................................................................... 14010 ClearIndicators
................................................................................................................................... 14011 CreateNamedSeries
................................................................................................................................... 14112 CreateSeries
................................................................................................................................... 14113 CreateSeriesLength
................................................................................................................................... 14214 CrossOver
................................................................................................................................... 14215 CrossOverValue
................................................................................................................................... 14316 CrossUnder
................................................................................................................................... 14317 CrossUnderValue
................................................................................................................................... 14418 DivideSeries
................................................................................................................................... 14419 DivideSeriesValue
................................................................................................................................... 14520 DivideValueSeries
................................................................................................................................... 14521 EnableSynch
................................................................................................................................... 14622 FindNamedSeries
................................................................................................................................... 14623 FirstActualBar
................................................................................................................................... 14724 GetDescription
................................................................................................................................... 14725 GetExternalSeries
................................................................................................................................... 14826 GetSeriesValue
................................................................................................................................... 14927 MultiplySeries
................................................................................................................................... 14928 MultiplySeriesValue
................................................................................................................................... 15029 OffsetSeries
................................................................................................................................... 15030 RestorePrimarySeries
................................................................................................................................... 15031 SetDescription
................................................................................................................................... 15132 SetPrimarySeries
................................................................................................................................... 15233 SetSeriesValue
................................................................................................................................... 15234 SingleCalcMode
................................................................................................................................... 15335 SubtractSeries
................................................................................................................................... 15436 SubtractSeriesValue
................................................................................................................................... 15437 SubtractValueSeries
WealthScript Function Reference, Wealth-Lab Pro™VII
© 2003-2006 FMR Corp. All rights reserved.

................................................................................................................................... 15538 SynchAll
................................................................................................................................... 15639 SynchSeries
................................................................................................................................... 15640 SyntheticBar
................................................................................................................................... 15741 TurnDown
................................................................................................................................... 15742 TurnUp
Part XIII SimuScript Functions 159
................................................................................................................................... 1591 Overview
................................................................................................................................... 1592 BarCount
................................................................................................................................... 1593 BuyAndHold
................................................................................................................................... 1604 CandidateCount
................................................................................................................................... 1615 Cash
................................................................................................................................... 1616 DrawDown
................................................................................................................................... 1627 DrawDownPct
................................................................................................................................... 1638 Equity
................................................................................................................................... 1639 SetPositionSizeFixed
................................................................................................................................... 16310 SetPositionSizePct
................................................................................................................................... 16411 SetPositionSizeShares
................................................................................................................................... 16412 SortByEntryDate
................................................................................................................................... 16513 SortByExitDate
Part XIV String Functions 166
................................................................................................................................... 1661 Overview
................................................................................................................................... 1662 CharAt
................................................................................................................................... 1673 Chr
................................................................................................................................... 1674 CompareStr
................................................................................................................................... 1675 CompareText
................................................................................................................................... 1686 Copy
................................................................................................................................... 1687 Delete
................................................................................................................................... 1698 FloatToStr
................................................................................................................................... 1699 FormatFloat
................................................................................................................................... 17010 GetToken
................................................................................................................................... 17011 Insert
................................................................................................................................... 17012 IntToStr
................................................................................................................................... 17113 Length
................................................................................................................................... 17114 LowerCase
................................................................................................................................... 17115 Ord
................................................................................................................................... 17216 Pos
................................................................................................................................... 17217 StrToFloat
................................................................................................................................... 17218 StrToFloatDef
VIIIContents
VIII
© 2003-2006 FMR Corp. All rights reserved.

................................................................................................................................... 17319 StrToInt
................................................................................................................................... 17320 StrToIntDef
................................................................................................................................... 17421 Trim
................................................................................................................................... 17422 TrimLeft
................................................................................................................................... 17523 TrimRight
................................................................................................................................... 17524 UpperCase
Part XV System Functions 176
................................................................................................................................... 1761 Overview
................................................................................................................................... 1762 Abort
................................................................................................................................... 1763 AddCommentary
................................................................................................................................... 1774 AddScanColumn
................................................................................................................................... 1785 AddScanColumnStr
................................................................................................................................... 1786 AllowSymbolSearch
................................................................................................................................... 1797 CreateOleObject
................................................................................................................................... 1798 GetGlobal
................................................................................................................................... 1809 GetScriptName
................................................................................................................................... 18010 GetTickCount
................................................................................................................................... 18111 Input
................................................................................................................................... 18112 IWealthLabAddOn3
................................................................................................................................... 18213 IWealthLabAuto
................................................................................................................................... 18214 IsRealTime
................................................................................................................................... 18315 Null
................................................................................................................................... 18316 PlaySound
................................................................................................................................... 18417 Print
................................................................................................................................... 18418 PrintFlush
................................................................................................................................... 18419 PrintStatus
................................................................................................................................... 18520 RunProgram
................................................................................................................................... 18521 SaveChartImage
................................................................................................................................... 18622 SetGlobal
................................................................................................................................... 18723 SetOptimizeValue
................................................................................................................................... 18824 SetPeakTroughMode
................................................................................................................................... 18925 ShowMessage
................................................................................................................................... 18926 Sleep
................................................................................................................................... 19027 UseUpdatedEMA
................................................................................................................................... 19028 WatchListAddSymbol
................................................................................................................................... 19129 WatchListClear
................................................................................................................................... 19230 WatchListCount
................................................................................................................................... 19331 WatchListDelete
................................................................................................................................... 19332 WatchListName
WealthScript Function Reference, Wealth-Lab Pro™IX
© 2003-2006 FMR Corp. All rights reserved.
................................................................................................................................... 19333 WatchListRemoveSymbol
................................................................................................................................... 19434 WatchListSelect
................................................................................................................................... 19435 WatchListSymbol
Part XVI Technical Indicator Functions 196
................................................................................................................................... 1961 Overview
................................................................................................................................... 1962 AccumDist
................................................................................................................................... 1973 ADX
................................................................................................................................... 1984 ADXR
................................................................................................................................... 1995 AroonDown
................................................................................................................................... 2006 AroonUp
................................................................................................................................... 2017 ATR
................................................................................................................................... 2028 ATRP
................................................................................................................................... 2039 BBandLower
................................................................................................................................... 20410 BBandUpper
................................................................................................................................... 20411 BOP
................................................................................................................................... 20512 CADO
................................................................................................................................... 20613 CCI
................................................................................................................................... 20714 CMF
................................................................................................................................... 20915 CMO
................................................................................................................................... 21016 CumDown
................................................................................................................................... 21117 CumUp
................................................................................................................................... 21218 DIMinus
................................................................................................................................... 21319 DIPlus
................................................................................................................................... 21420 DSS
................................................................................................................................... 21521 DX
................................................................................................................................... 21622 EMA
................................................................................................................................... 21823 EMMinus
................................................................................................................................... 21924 EMPlus
................................................................................................................................... 22025 FAMA
................................................................................................................................... 22126 FIR
................................................................................................................................... 22127 Highest
................................................................................................................................... 22328 HighestBar
................................................................................................................................... 22329 HTDCPhase
................................................................................................................................... 22430 HTInPhase
................................................................................................................................... 22531 HTLeadSin
................................................................................................................................... 22732 HTPeriod
................................................................................................................................... 22833 HTQuadrature
................................................................................................................................... 22934 HTSin
................................................................................................................................... 23135 HTTrendLine
XContents
X
© 2003-2006 FMR Corp. All rights reserved.

................................................................................................................................... 23236 HV
................................................................................................................................... 23337 Kalman
................................................................................................................................... 23438 KAMA
................................................................................................................................... 23539 KeltnerLower
................................................................................................................................... 23640 KeltnerUpper
................................................................................................................................... 23741 LinearReg
................................................................................................................................... 23842 LinearRegPredict
................................................................................................................................... 23843 LinearRegSlope
................................................................................................................................... 23944 Lowest
................................................................................................................................... 24045 LowestBar
................................................................................................................................... 24046 MACD
................................................................................................................................... 24247 MAMA
................................................................................................................................... 24348 Median
................................................................................................................................... 24349 MFI
................................................................................................................................... 24550 Momentum
................................................................................................................................... 24651 MomentumPct
................................................................................................................................... 24752 MoneyFlow
................................................................................................................................... 24853 NVI
................................................................................................................................... 24854 OBV
................................................................................................................................... 25055 Parabolic
................................................................................................................................... 25156 Peak
................................................................................................................................... 25257 PeakBar
................................................................................................................................... 25358 PeakNum
................................................................................................................................... 25559 PVI
................................................................................................................................... 25660 QStick
................................................................................................................................... 25661 RelSlope
................................................................................................................................... 25762 ROC
................................................................................................................................... 25863 RSI
................................................................................................................................... 26064 RSquared
................................................................................................................................... 26165 RVI
................................................................................................................................... 26266 SMA
................................................................................................................................... 26367 StdDev
................................................................................................................................... 26468 StdError
................................................................................................................................... 26569 StochD
................................................................................................................................... 26770 StochK
................................................................................................................................... 26871 StochRSI
................................................................................................................................... 26972 Sum
................................................................................................................................... 27073 TII
................................................................................................................................... 27174 TRIX
WealthScript Function Reference, Wealth-Lab Pro™XI
© 2003-2006 FMR Corp. All rights reserved.
................................................................................................................................... 27175 Trough
................................................................................................................................... 27276 TroughBar
................................................................................................................................... 27377 TroughNum
................................................................................................................................... 27578 TrueRange
................................................................................................................................... 27679 UltimateOsc
................................................................................................................................... 27680 VHF
................................................................................................................................... 27781 Vidya
................................................................................................................................... 27882 VMA
................................................................................................................................... 27983 Volatility
................................................................................................................................... 28084 WilderMA
................................................................................................................................... 28185 WilliamsR
................................................................................................................................... 28286 WMA
Part XVII Time Frame Functions 284
................................................................................................................................... 2841 Overview
................................................................................................................................... 2842 ChangeScale
................................................................................................................................... 2853 DailyFromMonthly
................................................................................................................................... 2864 DailyFromWeekly
................................................................................................................................... 2865 GetDailyBar
................................................................................................................................... 2876 GetIntraDayBar
................................................................................................................................... 2877 GetMonthlyBar
................................................................................................................................... 2888 GetWeeklyBar
................................................................................................................................... 2889 IntraDayFromCompressed
................................................................................................................................... 28910 IntraDayFromDaily
................................................................................................................................... 28911 IsDaily
................................................................................................................................... 29012 IsIntraday
................................................................................................................................... 29013 IsMonthly
................................................................................................................................... 29014 IsWeekly
................................................................................................................................... 29115 SetScaleCompressed
................................................................................................................................... 29216 SetScaleDaily
................................................................................................................................... 29317 SetScaleMonthly
................................................................................................................................... 29318 SetScaleWeekly
Part XVIII Trading System Control Functions 294
................................................................................................................................... 2941 Overview
................................................................................................................................... 2942 ApplyAutoStops
................................................................................................................................... 2963 BuyAtClose
................................................................................................................................... 2964 BuyAtLimit
................................................................................................................................... 2975 BuyAtMarket
................................................................................................................................... 2986 BuyAtStop
XIIContents
XII
© 2003-2006 FMR Corp. All rights reserved.

................................................................................................................................... 2987 CoverAtClose
................................................................................................................................... 2998 CoverAtLimit
................................................................................................................................... 3009 CoverAtMarket
................................................................................................................................... 30110 CoverAtStop
................................................................................................................................... 30111 CoverAtTrailingStop
................................................................................................................................... 30212 InstallBreakEvenStop
................................................................................................................................... 30313 InstallProfitTarget
................................................................................................................................... 30414 InstallReverseBreakEvenStop
................................................................................................................................... 30415 InstallStopLoss
................................................................................................................................... 30516 InstallTimeBasedExit
................................................................................................................................... 30617 InstallTrailingStop
................................................................................................................................... 30718 PortfolioSynch
................................................................................................................................... 30819 SellAtClose
................................................................................................................................... 30820 SellAtLimit
................................................................................................................................... 30921 SellAtMarket
................................................................................................................................... 31022 SellAtStop
................................................................................................................................... 31123 SellAtTrailingStop
................................................................................................................................... 31224 SetAutoStopMode
................................................................................................................................... 31225 SetCommission
................................................................................................................................... 31326 SetPositionSize
................................................................................................................................... 31427 SetShareCap
................................................................................................................................... 31428 SetShareFloor
................................................................................................................................... 31429 SetShareSize
................................................................................................................................... 31530 SetSlippage
................................................................................................................................... 31631 ShortAtClose
................................................................................................................................... 31632 ShortAtLimit
................................................................................................................................... 31733 ShortAtMarket
................................................................................................................................... 31834 ShortAtStop
................................................................................................................................... 31935 SplitPosition
Index 0
WealthScript Function Reference, Wealth-Lab Pro™XIII
© 2003-2006 FMR Corp. All rights reserved.

Introduction 14
© 2003-2006 FMR Corp. All rights reserved.
1 Introduction
The Function Reference defines, describes, and demonstrates the WealthScript functionsby example. However, if you need more examples of a particular function, you can use
the function search feature of the ChartScript Explorer to find scripts that contain aspecific WealthScript function.
Each function contains a header in its description that indicates if its use is valid for aparticular type of script. For example, the following header indicates that the function isvalid for use in ChartScripts and SimuScripts, but not in PerfScripts or CMScripts.
RChartScripts RSimuScripts XPerfScripts XCMScripts
The legend below provides definitions for additional indicative symbology:
R Valid for useX Invalid usageù Usage difference between ChartScripts and SimuScriptsx Valid in specific cases
Useful tips:
1. Use the QuickRef, which is found in the main icon bar on the left. Place the cursoron a WealthScript function, which is syntax highlighted in blue by default, in theEditor view and press F1 to call up the QuickRef for the function.
2. When coding manually, use the Smart Code Editor features. Before typing aWealthScript function name, strike Ctrl+Space bar to bring up a list of WealthScriptfunctions. As you continue to type characters, you can filter the list to quickly locatethe function you're looking for. Also, for functions with parameter lists, after typingthe opening parenthesis "(" a list of parameters will be displayed with a cue for thecurrent parameter in bold type.
WealthScript functions are found in at least one of 14 categories. Click below to be takento an overview.
Alert Functions
Cosmetic Chart Functions
CommissionScript Functions
Data Access Functions
Date/Time Functions
Fundamental Data Access Functions New!
File Access Functions
Math Functions
PerfScript Functions
Position Management Functions
Price Series Functions
SimuScript Functions
16
20
38
42
50
65
61
81
96
102
135
159

WealthScript Function Reference, Wealth-Lab Pro™15
© 2003-2006 FMR Corp. All rights reserved.
String Functions
System Functions
Technical Indicator Functions
Time Frame Functions
Trading System Control Functions
166
176
196
284
294

Alert Functions 16
© 2003-2006 FMR Corp. All rights reserved.
2 Alert Functions
2.1 Overview
An Alert is an order that needs to be placed for the next bar. Using the Alert Functions,you can access the number of alerts that a script has generated, as well as the symbol,order type, position type, price, and number of shares (contracts) of a specific Alert.
Note: The Alert category of WealthScript functions are not available for SimuScripts.
The following example shows how you can create a text file of Alert informationautomatically from within any script.
Example
{ These declarations may appear at the beginning of the script }const delim = '|';const fle = 'C:\Alerts.txt';var MyAlert: string;var a, FleHdl: integer;
{ A function to round Price to precisely 2 digits after the decimal }function StockFix( Price: float ): float;begin const factor = 100; // 1000 for 3 digits, etc. Result := Round( Price * factor ) / factorend;
{ (* Your script's main body goes here *) }
if AlertCount > 0 thenbegin FleHdl := FileOpen( fle ); for a := 0 to AlertCount - 1 do begin MyAlert := GetSymbol + delim + IntToStr( AlertPositionType( a ) ) + delim + IntToStr( AlertShares( a ) ) + delim + IntToStr( AlertOrderType( a ) ) + delim + FloatToStr( StockFix( AlertPrice( a ) ) );
FileWrite( FleHdl, MyAlert ); end;end;

WealthScript Function Reference, Wealth-Lab Pro™17
© 2003-2006 FMR Corp. All rights reserved.
2.2 AlertCount
AlertCount: integer;
RChartScripts XSimuScripts XPerfScripts XCMScripts
Description
Returns the number of Alerts that have been generated. An Alert is an order that needsto be placed for the next bar. Use AlertShares, AlertPositionType, AlertOrderType,AlertSymbol and AlertPrice to gain more information on a specific Alert.
Example
{ Place at the end of your script }if AlertCount > 0 then ShowMessage( IntToStr( AlertCount ) + ' Alert(s) for the next Bar!' );
2.3 AlertOrderType
AlertOrderType( Alert: integer ): integer;
RChartScripts XSimuScripts XPerfScripts XCMScripts
Description
Returns the order type of the specified Alert. The Alert parameter is an integer value thatcontain an Alert Index number. The index number should be between zero (first Alert)and AlertCount - 1.
The return value will be one of the following:
0 = Market Order1 = Stop Order2 = Limit Order3 = AtClose Order
Example
{ Place at the end of your script }var a: integer;var s: string;for a := 0 to AlertCount - 1 dobegin s := 'Alert ' + IntToStr( a + 1 ) + ' is a'; case AlertOrderType( a ) of 0: s := s + ' Market'; 1: s := s + ' Stop'; 2: s := s + ' Limit'; 3: s := s + 'n At Close'; end; s := s + ' Order'; DrawLabel( s, 0 );end;
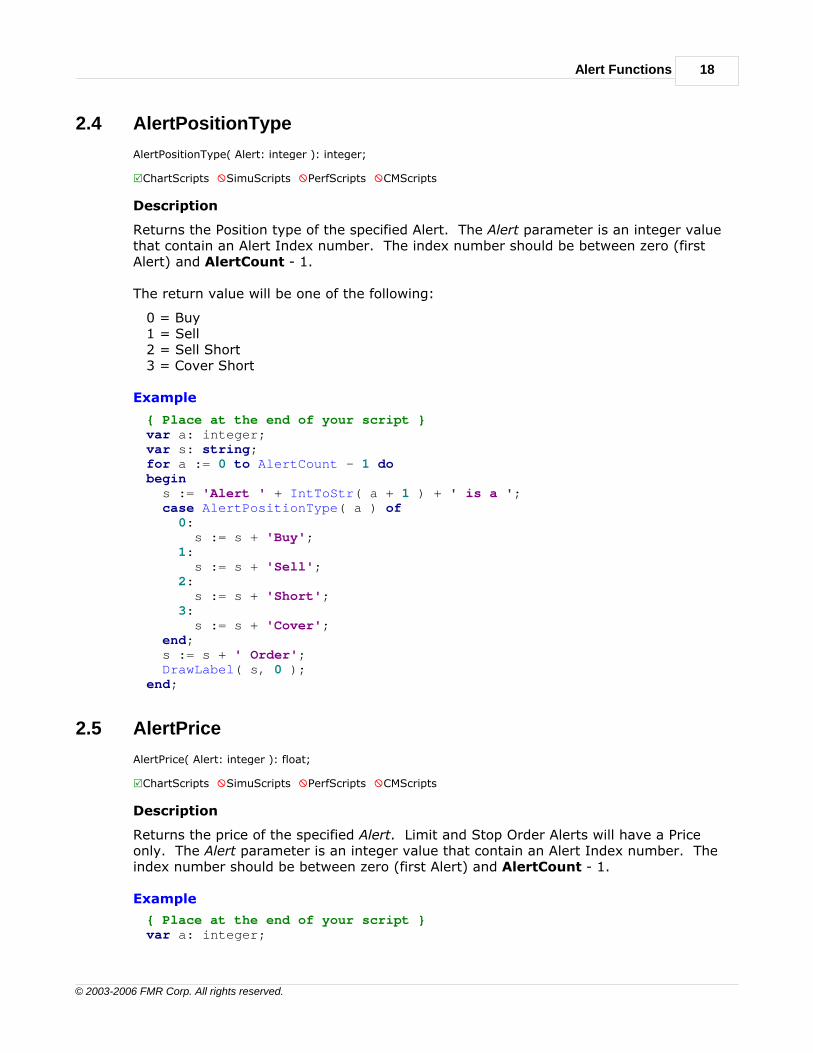
Alert Functions 18
© 2003-2006 FMR Corp. All rights reserved.
2.4 AlertPositionType
AlertPositionType( Alert: integer ): integer;
RChartScripts XSimuScripts XPerfScripts XCMScripts
Description
Returns the Position type of the specified Alert. The Alert parameter is an integer valuethat contain an Alert Index number. The index number should be between zero (firstAlert) and AlertCount - 1.
The return value will be one of the following:
0 = Buy1 = Sell2 = Sell Short3 = Cover Short
Example
{ Place at the end of your script }var a: integer;var s: string;for a := 0 to AlertCount - 1 dobegin s := 'Alert ' + IntToStr( a + 1 ) + ' is a '; case AlertPositionType( a ) of 0: s := s + 'Buy'; 1: s := s + 'Sell'; 2: s := s + 'Short'; 3: s := s + 'Cover'; end; s := s + ' Order'; DrawLabel( s, 0 );end;
2.5 AlertPrice
AlertPrice( Alert: integer ): float;
RChartScripts XSimuScripts XPerfScripts XCMScripts
Description
Returns the price of the specified Alert. Limit and Stop Order Alerts will have a Priceonly. The Alert parameter is an integer value that contain an Alert Index number. Theindex number should be between zero (first Alert) and AlertCount - 1.
Example
{ Place at the end of your script }var a: integer;
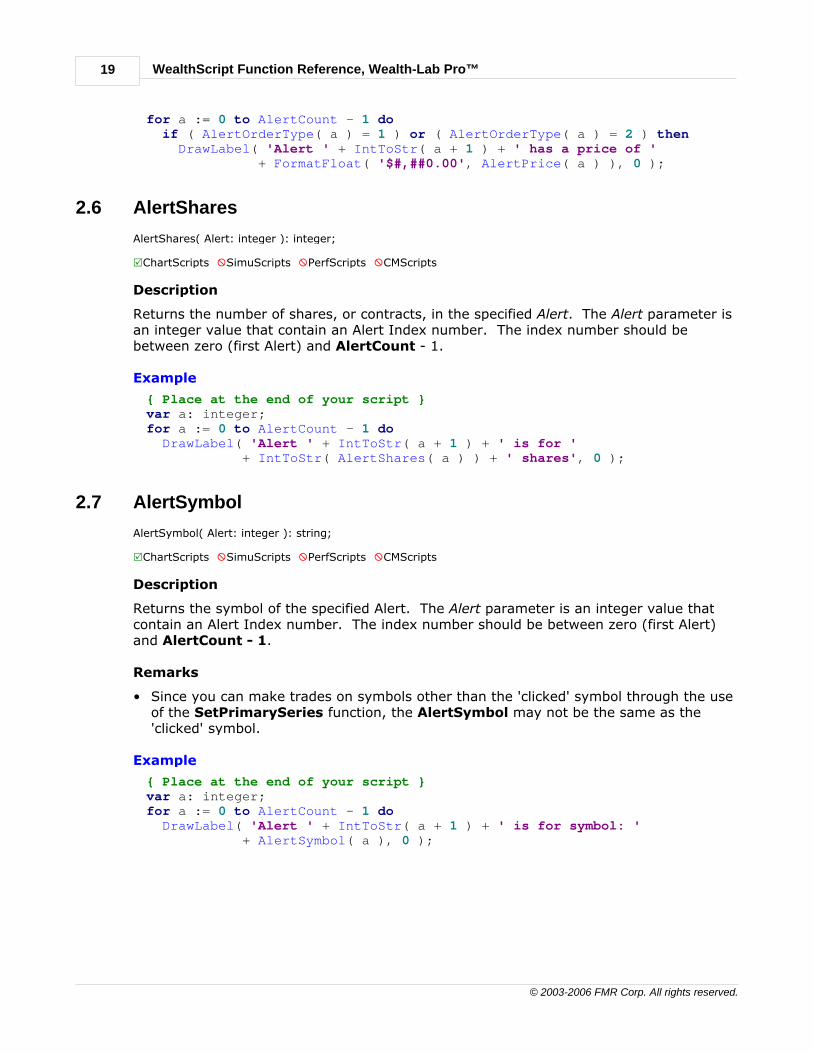
WealthScript Function Reference, Wealth-Lab Pro™19
© 2003-2006 FMR Corp. All rights reserved.
for a := 0 to AlertCount - 1 do if ( AlertOrderType( a ) = 1 ) or ( AlertOrderType( a ) = 2 ) then DrawLabel( 'Alert ' + IntToStr( a + 1 ) + ' has a price of ' + FormatFloat( '$#,##0.00', AlertPrice( a ) ), 0 );
2.6 AlertShares
AlertShares( Alert: integer ): integer;
RChartScripts XSimuScripts XPerfScripts XCMScripts
Description
Returns the number of shares, or contracts, in the specified Alert. The Alert parameter isan integer value that contain an Alert Index number. The index number should bebetween zero (first Alert) and AlertCount - 1.
Example
{ Place at the end of your script }var a: integer;for a := 0 to AlertCount - 1 do DrawLabel( 'Alert ' + IntToStr( a + 1 ) + ' is for ' + IntToStr( AlertShares( a ) ) + ' shares', 0 );
2.7 AlertSymbol
AlertSymbol( Alert: integer ): string;
RChartScripts XSimuScripts XPerfScripts XCMScripts
Description
Returns the symbol of the specified Alert. The Alert parameter is an integer value thatcontain an Alert Index number. The index number should be between zero (first Alert)and AlertCount - 1.
Remarks
• Since you can make trades on symbols other than the 'clicked' symbol through the useof the SetPrimarySeries function, the AlertSymbol may not be the same as the'clicked' symbol.
Example
{ Place at the end of your script }var a: integer;for a := 0 to AlertCount - 1 do DrawLabel( 'Alert ' + IntToStr( a + 1 ) + ' is for symbol: ' + AlertSymbol( a ), 0 );
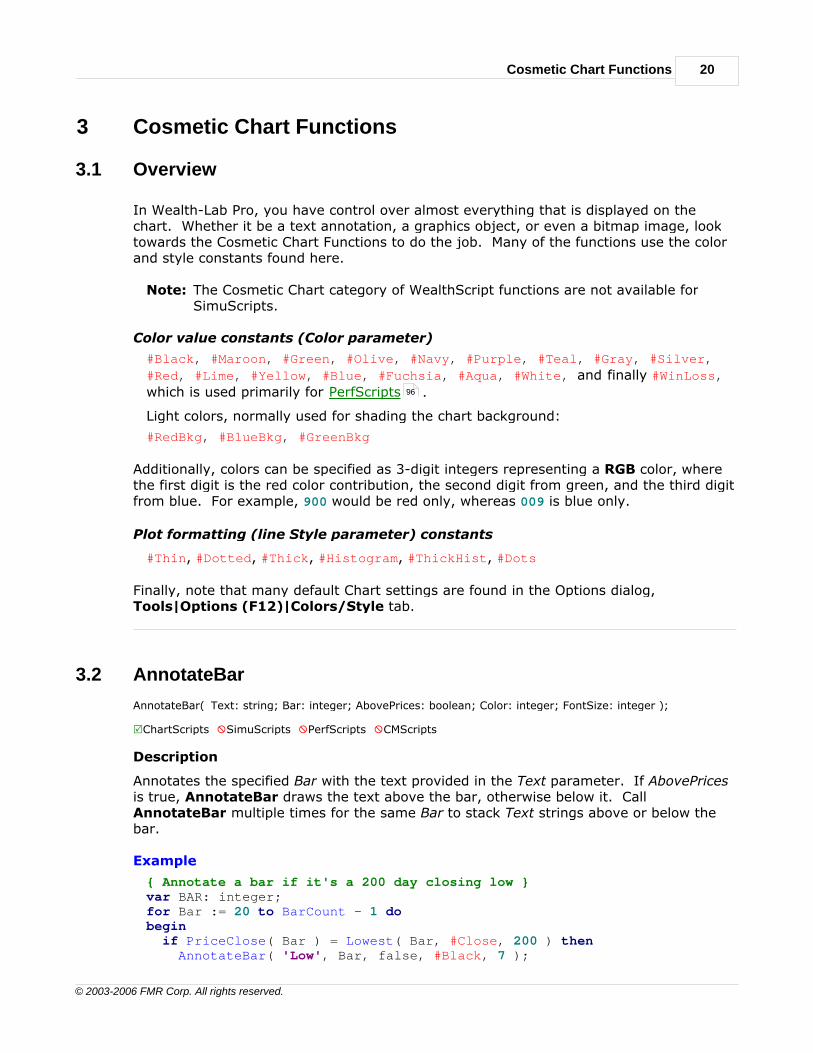
Cosmetic Chart Functions 20
© 2003-2006 FMR Corp. All rights reserved.
3 Cosmetic Chart Functions
3.1 Overview
In Wealth-Lab Pro, you have control over almost everything that is displayed on thechart. Whether it be a text annotation, a graphics object, or even a bitmap image, looktowards the Cosmetic Chart Functions to do the job. Many of the functions use the colorand style constants found here.
Note: The Cosmetic Chart category of WealthScript functions are not available forSimuScripts.
Color value constants (Color parameter)
#Black, #Maroon, #Green, #Olive, #Navy, #Purple, #Teal, #Gray, #Silver,
#Red, #Lime, #Yellow, #Blue, #Fuchsia, #Aqua, #White, and finally #WinLoss,
which is used primarily for PerfScripts .
Light colors, normally used for shading the chart background:
#RedBkg, #BlueBkg, #GreenBkg
Additionally, colors can be specified as 3-digit integers representing a RGB color, wherethe first digit is the red color contribution, the second digit from green, and the third digitfrom blue. For example, 900 would be red only, whereas 009 is blue only.
Plot formatting (line Style parameter) constants
#Thin, #Dotted, #Thick, #Histogram, #ThickHist, #Dots
Finally, note that many default Chart settings are found in the Options dialog,Tools|Options (F12)|Colors/Style tab.
3.2 AnnotateBar
AnnotateBar( Text: string; Bar: integer; AbovePrices: boolean; Color: integer; FontSize: integer );
RChartScripts XSimuScripts XPerfScripts XCMScripts
Description
Annotates the specified Bar with the text provided in the Text parameter. If AbovePricesis true, AnnotateBar draws the text above the bar, otherwise below it. CallAnnotateBar multiple times for the same Bar to stack Text strings above or below thebar.
Example
{ Annotate a bar if it's a 200 day closing low }var BAR: integer;for Bar := 20 to BarCount - 1 dobegin if PriceClose( Bar ) = Lowest( Bar, #Close, 200 ) then AnnotateBar( 'Low', Bar, false, #Black, 7 );
96

WealthScript Function Reference, Wealth-Lab Pro™21
© 2003-2006 FMR Corp. All rights reserved.
end;
3.3 AnnotateChart
AnnotateChart( Text: string; Pane, Bar: integer; Price: float; Color: integer; FontSize: integer );
RChartScripts XSimuScripts XPerfScripts XCMScripts
Description
Annotates the chart with the specified Text at the position determined by the Bar andPrice parameters. Use this function to draw ad-hoc annotations anywhere on the chart.
Example
{ Annotate the last bar if we have a support level below it }var LP, P: float;lp := Peak( BarCount - 1, #High, 6 );p := PriceClose( BarCount - 1 );if p > lp then AnnotateChart( 'Support', 0, PeakBar( BarCount - 1, #High, 6 ), lp,#Green, 8 );
3.4 CreatePane
CreatePane( Height: integer; AbovePrices: boolean; ShowGrid: boolean ): integer;
RChartScripts XSimuScripts XPerfScripts XCMScripts
Description
Creates a new blank chart pane. You can plot indicators in the pane using the PlotSeriesfunction. The Height parameter specifies the height of the new pane in pixels. Anaverage height of 75 pixels is common for new panes. The AbovePrices parameterspecifies whether to draw the new pane above or below the main price/volume panes.The Grid parameter controls whether default horizontal grid lines are drawn on the pane.
Example
{ Create a new Pane and plot an RSI in it }var MyPane: integer;MyPane := CreatePane( 100, true, true );PlotSeries( RSISeries( #Close, 30 ), MyPane, #Navy, #Thin );
3.5 DrawCircle
DrawCircle( Radius: integer; Pane: integer; Bar: integer; Price: float; Color: integer; Style: integer );
RChartScripts XSimuScripts XPerfScripts XCMScripts
Description
Draws a circle with the specified Radius at a location determined by the values of the Barand Price parameters.
Example

Cosmetic Chart Functions 22
© 2003-2006 FMR Corp. All rights reserved.
{ Circle any 200 day High }var BAR: integer;for Bar := 200 to BarCount - 1 dobegin if PriceHigh( Bar ) = Highest( Bar, #High, 200 ) then DrawCircle( 4, 0, Bar, PriceHigh( Bar ), #Red, #Thick );end;
3.6 DrawCircle2
DrawCircle2( BarCenter: integer; PriceCenter: float; BarRadius: integer; PriceRadius: float; Pane: integer;Color:integer; Style: integer );
RChartScripts XSimuScripts XPerfScripts XCMScripts
Description
Draws a circle centered on BarCenter/PriceCenter, and intersecting at pointBarRadius/PriceRadius. The radius of the circle becomes the distance between these twopoints.
Example
var Bar1, Bar2, Radius: integer;var x1, x2, y1, y2: float;
Bar1 := BarCount - 150;Bar2 := BarCount - 100;SetBarColor( Bar1, #Blue );SetBarColor( Bar2, #Blue );
y1 := PriceClose( Bar1 );y2 := PriceClose( Bar2 );
DrawCircle2( Bar1, y1, Bar2, y2, 0, #Red, #Thin );
3.7 DrawDiamond
DrawDiamond( Bar1: integer; Price1: float; Bar2: integer; Price2: float; Bar3: integer; Price3: float; Bar4:integer; Price4: float; Pane: integer; Color: integer; Style: integer; FillColor: integer;BehindPrices: boolean );
RChartScripts XSimuScripts XPerfScripts XCMScripts
Description
Draws a diamond (or any 4 sided polygon), the four corners of which are specified by theparameters Bar1/Price1, Bar2/Price2, Bar3/Price3 and Bar4/Price4.
Pane Specifies which on which pane to draw the diamond. Pass 0 for the PricePane, 1 for the Volume Pane, or use the return value of a CreatePanecall for a custom pane.
Color Controls the color used to draw the diamond.
Style Controls the type of line used. You can use the constants #Thin, #Thickor #Dotted for Style.

WealthScript Function Reference, Wealth-Lab Pro™23
© 2003-2006 FMR Corp. All rights reserved.
FillColor Specifies the color with which to fill the diamond. Pass -1 to draw anunfilled diamond.
BehindPrices Controls whether the diamond is drawn behind or in front of the pricebars.
Example
var P1, P2, P3, P4: float;var B, B3, B2, B1, B4: integer;b := BarCount - 1;b3 := TroughBar( b, #Close, 13 );b2 := PeakBar( b3, #Close, 13 );b1 := TroughBar( b2, #Close, 13 );b4 := b2;p1 := PriceClose( b1 );p2 := PriceClose( b2 );p3 := PriceClose( b3 );p4 := p1 - ( p2 - p1 );DrawDiamond( b1, p1, b2, p2, b3, p3, b4, p4, 0, #Gray, #Thick, #Silver,true );
3.8 DrawEllipse
DrawEllipse( Bar1: integer; Price1: float; Bar2: integer; Price2: float; Pane: integer; Color: integer; Style:integer; FillColor: integer; BehindPrices: boolean );
RChartScripts XSimuScripts XPerfScripts XCMScripts
Description
Draws an ellipse, the corners of which are specified by the parameters Bar1/Price1 andBar2/Price2.
Pane Specifies which on which pane to draw the ellipse. Pass 0 for the PricePane, 1 for the Volume Pane, or use the return value of a CreatePanecall for a custom pane.
Color Controls the color used to draw the ellipse.
Style Controls the type of line used. You can use the constants #Thin, #Thickor #Dotted for Style.
FillColor Specifies the color with which to fill the ellipse. Pass -1 to draw anunfilled ellipse.
BehindPrices Controls whether the ellipse is drawn behind or in front of the price bars.
Example
var BAR, PRICE: integer;Bar := TroughBar( BarCount - 1, #Low, 13 );Price := PriceLow( Bar );DrawEllipse( Bar - 4, Price * 1.02, Bar + 4, Price * 0.98, 0, #RedBkg,#Thin, #RedBkg, true );Bar := PeakBar( BarCount - 1, #High, 13 );Price := PriceHigh( Bar );DrawEllipse( Bar - 4, Price * 1.02, Bar + 4, Price * 0.98, 0, #GreenBkg,#Thin, #GreenBkg, true );

Cosmetic Chart Functions 24
© 2003-2006 FMR Corp. All rights reserved.
3.9 DrawHorzLine
DrawHorzLine( Value: float; Pane: integer; Color: integer; Style: integer );
RChartScripts XSimuScripts XPerfScripts XCMScripts
Description
Draws a horizontal line on a Pane, at the value specified in the Value parameter.
Example
{ Draw a line at the psychologically important 1000 level }DrawHorzLine( 1000, 0, #Green, #Dotted );
3.10 DrawImage
DrawImage( Bitmap: string; Pane: integer; Bar: integer; Price: float; TopDown: boolean );
RChartScripts XSimuScripts XPerfScripts XCMScripts
Description
Draws a bitmap image on the chart in the specified Pane. The image is drawn with atransparent area. The transparent color is determined by the color of the bitmap's lowerleft pixel.
Bitmap The Bitmap parameter must contain the name of a bitmap file (bmp) thatresides in the "Bitmaps" folder directly under the main Wealth-Lab Profolder. Provide the file name only, no path or file extension.
Pane Specifies which on which pane to draw the ellipse. Pass 0 for the PricePane, 1 for the Volume Pane, or use the return value of a CreatePanecall for a custom pane.
Bar Specifies the bar at which the image should be drawn. The image will becentered around the middle of the specified Bar.
Price Indicates which price level (or indicator value, for non-price panes) atwhich to draw the image. (See TopDown next.)
TopDown If the TopDown parameter is true, the top of the image will be placed atthe specified Price level, otherwise the bottom of the image is placed atthis level.
Example
var BAR: integer;Bar := BarCount - 40;DrawImage( 'UpArrow', 0, Bar, PriceLow( Bar ) * 0.995, true );Bar := BarCount - 30;DrawImage( 'DownArrow', 0, Bar, PriceHigh( Bar ) * 1.005, false );

WealthScript Function Reference, Wealth-Lab Pro™25
© 2003-2006 FMR Corp. All rights reserved.
3.11 DrawLabel
DrawLabel( Text: string; Pane: integer );
RChartScripts XSimuScripts XPerfScripts XCMScripts
Description
Draws a Text label in the upper left corner of the specified Pane. You can call thisfunction multiple times and the labels will be drawn one below the other. For morecontrol over drawing text, use the DrawText function.
Example
{ Plot a 200 day moving average, and add a label to the chart }PlotSeries( SMASeries( #Close, 200 ), 0, #Green, #Thin );DrawLabel( '200 day SMA', 0 );
3.12 DrawLine
DrawLine( Bar1: integer; Price1: float; Bar2: integer; Price2: float; Pane: integer; Color: integer; Style:integer );
RChartScripts XSimuScripts XPerfScripts XCMScripts
Description
Draws a line between the two specified points. You specify a point as a bar/price pair.The Bar1/Bar2 parameters correspond to the x-axis values, and Price1/Price2 parametersto the y-axis values. The function automatically converts the bar/price pairs into drawingcoordinates on the chart so you can more easily establish points for your lines.
Example
{ Draw a line between the last 2 peaks }var P1, P2: float;var BAR, PB1, PB2: integer;Bar := BarCount - 1;p1 := Peak( Bar, #High, 4 );pb1 := PeakBar( Bar, #High, 4 );p2 := Peak( pb1, #High, 4 );pb2 := PeakBar( pb1, #High, 4 );DrawLine( pb1, p1, pb2, p2, 0, #Red, #Dotted );
3.13 DrawRectangle
DrawRectangle( Bar1: integer; Price1: float; Bar2: integer; Price2: float; Pane: integer; Color: integer; Style:integer; FillColor: integer; BehindPrices: boolean );
RChartScripts XSimuScripts XPerfScripts XCMScripts
Description
Draws a rectangle, the corners of which are specified by the parameters Bar1/Price1 andBar2/Price2.

Cosmetic Chart Functions 26
© 2003-2006 FMR Corp. All rights reserved.
Pane Specifies which on which pane to draw the rectangle. Pass 0 for the PricePane, 1 for the Volume Pane, or use the return value of a CreatePanecall for a custom pane.
Color Controls the color used to draw the rectangle.
Style Controls the type of line used. You can use the constants #Thin, #Thickor #Dotted for Style.
FillColor Specifies the color to fill the rectangle with. Pass -1 to draw an unfilledrectangle.
BehindPrices Controls whether the rectangle is drawn behind the price bars or in frontof them.
Example
var P1, P2: float;var BAR, B1, B2, P2: integer;Bar := BarCount - 1;b1 := PeakBar( Bar, #Close, 10 );b2 := TroughBar( Bar, #Close, 10 );p1 := PriceClose( b1 );p2 := PriceClose( b2 );DrawRectangle( b1, p1, b2, p2, 0, #Blue, #Thick, #BlueBkg, true );
3.14 DrawRoundRect
DrawRoundRect( Bar1: integer; Price1: float; Bar2: integer; Price2: float; Pane:integer; Color: integer; Style:integer; FillColor: integer; BehindPrices: boolean );
RChartScripts XSimuScripts XPerfScripts XCMScripts
Description
Draws a rectangle with rounded corners, which are specified by the parametersBar1/Price1 and Bar2/Price2.
Pane Specifies which on which pane to draw the rectangle. Pass 0 for the PricePane, 1 for the Volume Pane, or use the return value of a CreatePanecall for a custom pane.
Color Controls the color used to draw the rectangle.
Style Controls the type of line used. You can use the constants #Thin, #Thickor #Dotted for Style.
FillColor Specifies the color to fill the rectangle with. Pass -1 to draw an unfilledrectangle.
BehindPrices Controls whether the rectangle is drawn behind the price bars or in frontof them.
Example
var P1, P2: float;var B1, B2: integer;b1 := BarCount - 50;b2 := BarCount - 10;p1 := Highest( b2, #High, 40 );
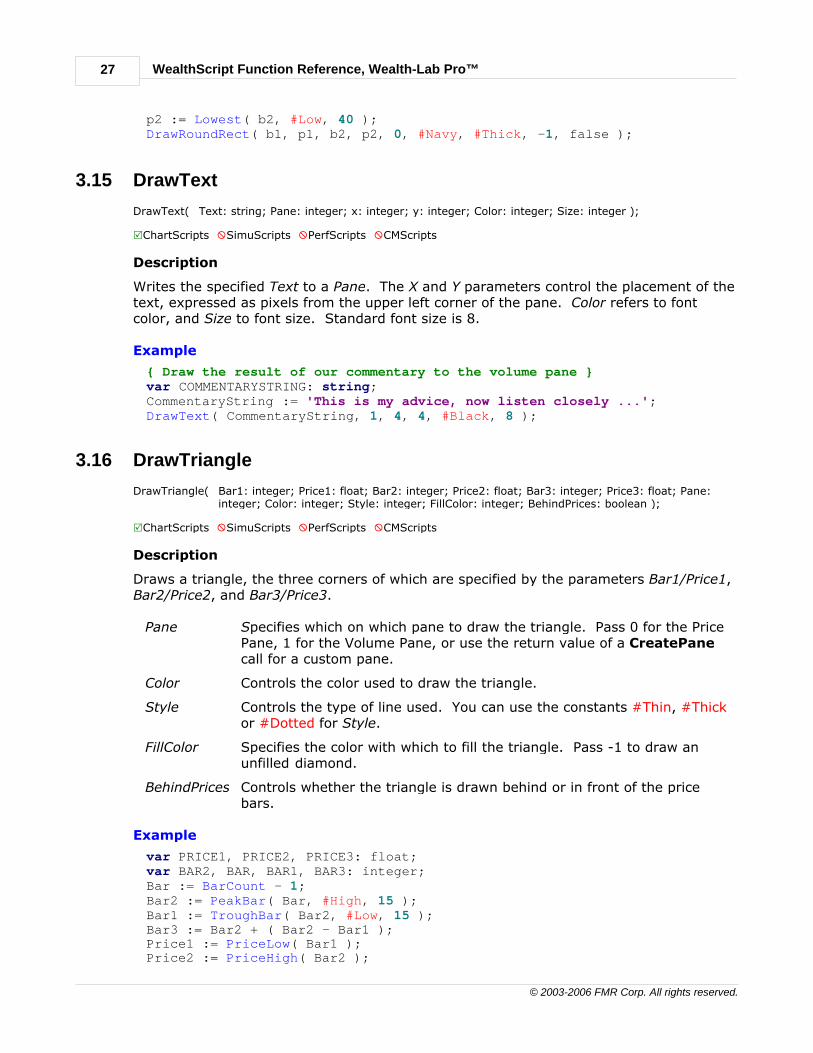
WealthScript Function Reference, Wealth-Lab Pro™27
© 2003-2006 FMR Corp. All rights reserved.
p2 := Lowest( b2, #Low, 40 );DrawRoundRect( b1, p1, b2, p2, 0, #Navy, #Thick, -1, false );
3.15 DrawText
DrawText( Text: string; Pane: integer; x: integer; y: integer; Color: integer; Size: integer );
RChartScripts XSimuScripts XPerfScripts XCMScripts
Description
Writes the specified Text to a Pane. The X and Y parameters control the placement of thetext, expressed as pixels from the upper left corner of the pane. Color refers to fontcolor, and Size to font size. Standard font size is 8.
Example
{ Draw the result of our commentary to the volume pane }var COMMENTARYSTRING: string;CommentaryString := 'This is my advice, now listen closely ...';DrawText( CommentaryString, 1, 4, 4, #Black, 8 );
3.16 DrawTriangle
DrawTriangle( Bar1: integer; Price1: float; Bar2: integer; Price2: float; Bar3: integer; Price3: float; Pane:integer; Color: integer; Style: integer; FillColor: integer; BehindPrices: boolean );
RChartScripts XSimuScripts XPerfScripts XCMScripts
Description
Draws a triangle, the three corners of which are specified by the parameters Bar1/Price1,Bar2/Price2, and Bar3/Price3.
Pane Specifies which on which pane to draw the triangle. Pass 0 for the PricePane, 1 for the Volume Pane, or use the return value of a CreatePanecall for a custom pane.
Color Controls the color used to draw the triangle.
Style Controls the type of line used. You can use the constants #Thin, #Thickor #Dotted for Style.
FillColor Specifies the color with which to fill the triangle. Pass -1 to draw anunfilled diamond.
BehindPrices Controls whether the triangle is drawn behind or in front of the pricebars.
Example
var PRICE1, PRICE2, PRICE3: float;var BAR2, BAR, BAR1, BAR3: integer;Bar := BarCount - 1;Bar2 := PeakBar( Bar, #High, 15 );Bar1 := TroughBar( Bar2, #Low, 15 );Bar3 := Bar2 + ( Bar2 - Bar1 );Price1 := PriceLow( Bar1 );Price2 := PriceHigh( Bar2 );

Cosmetic Chart Functions 28
© 2003-2006 FMR Corp. All rights reserved.
Price3 := Price1;DrawTriangle( Bar1, Price1, Bar2, Price2, Bar3, Price3, 0, #Olive,#Thick, -1, false );
3.17 EnableNotes
EnableNotes( Enable: boolean );
RChartScripts XSimuScripts XPerfScripts XCMScripts
Description
Turns on (Enable = true) or off the display of notes above and below trades in the chart,such as "Buy 500 @10.00". If a trading system generates a multitude of trades, turningthis option off will result in a much less cluttered chart.
Remarks
• See also: EnableTradeNotes
Example
{ Turn off those pesky notes if there are too many trades }if PositionCount > 20 then EnableNotes( false );
3.18 EnableTradeNotes
EnableTradeNotes( Text: boolean; Arrow: boolean; Circle: boolean );
RChartScripts XSimuScripts XPerfScripts XCMScripts
Description
Turns on or off the display of textual and graphical notes above and below trades in thechart. If a Trading System generates a multitude of trades, passing false for the Text,Arrow, and/or Circle parameters will result in a much less cluttered chart.
Text Controls whether or not textual notes are drawn on the chart, such as"Buy 200 @5.00".
Arrow Controls whether or not buy and sell arrows appear above/below the barwhere trades are opened and closed.
Circle Controls whether the circles are drawn at the exact spot where tradesoccur on the bar. Additionally, if Circle is false, the horizontal dotted linethat is normally drawn for open trades is not drawn.
Remarks
• This function supersedes the original EnableNotes function, which allowed the textnotes only to be turned off.
Example
{ Turn off those pesky notes if there are many trades, show arrows only }if PositionCount > 20 then EnableTradeNotes( false, true, false );
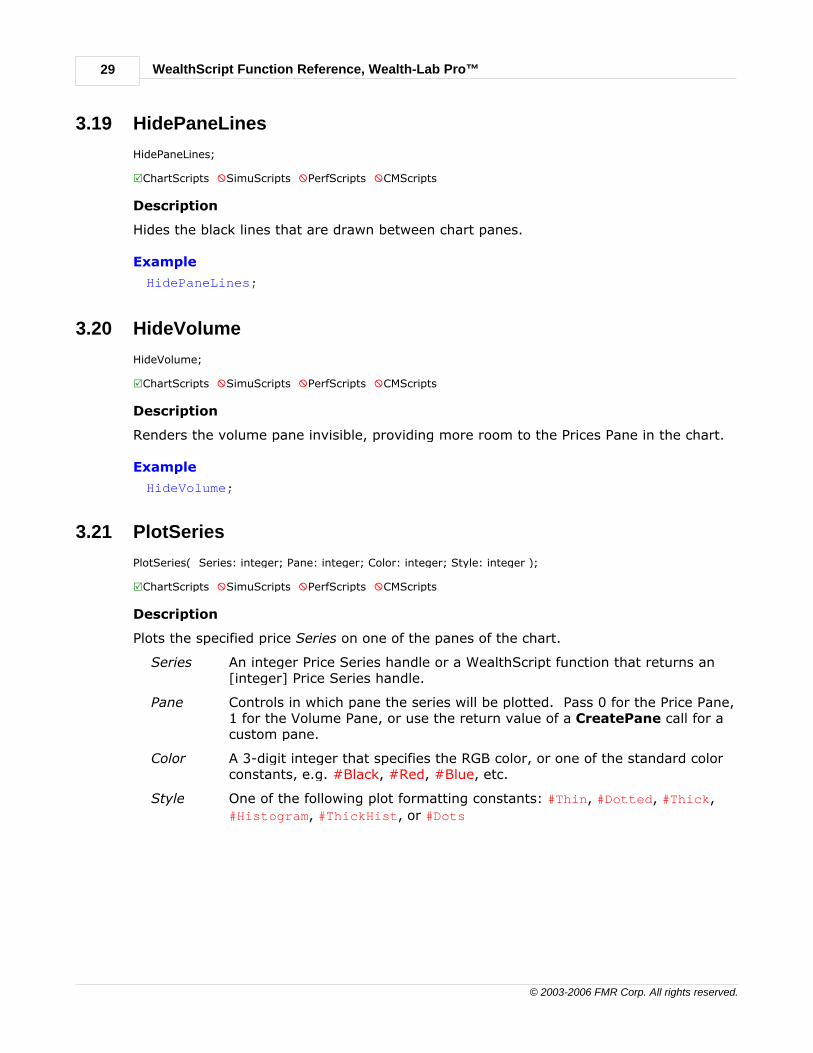
WealthScript Function Reference, Wealth-Lab Pro™29
© 2003-2006 FMR Corp. All rights reserved.
3.19 HidePaneLines
HidePaneLines;
RChartScripts XSimuScripts XPerfScripts XCMScripts
Description
Hides the black lines that are drawn between chart panes.
Example
HidePaneLines;
3.20 HideVolume
HideVolume;
RChartScripts XSimuScripts XPerfScripts XCMScripts
Description
Renders the volume pane invisible, providing more room to the Prices Pane in the chart.
Example
HideVolume;
3.21 PlotSeries
PlotSeries( Series: integer; Pane: integer; Color: integer; Style: integer );
RChartScripts XSimuScripts XPerfScripts XCMScripts
Description
Plots the specified price Series on one of the panes of the chart.
Series An integer Price Series handle or a WealthScript function that returns an[integer] Price Series handle.
Pane Controls in which pane the series will be plotted. Pass 0 for the Price Pane,1 for the Volume Pane, or use the return value of a CreatePane call for acustom pane.
Color A 3-digit integer that specifies the RGB color, or one of the standard colorconstants, e.g. #Black, #Red, #Blue, etc.
Style One of the following plot formatting constants: #Thin, #Dotted, #Thick,
#Histogram, #ThickHist, or #Dots
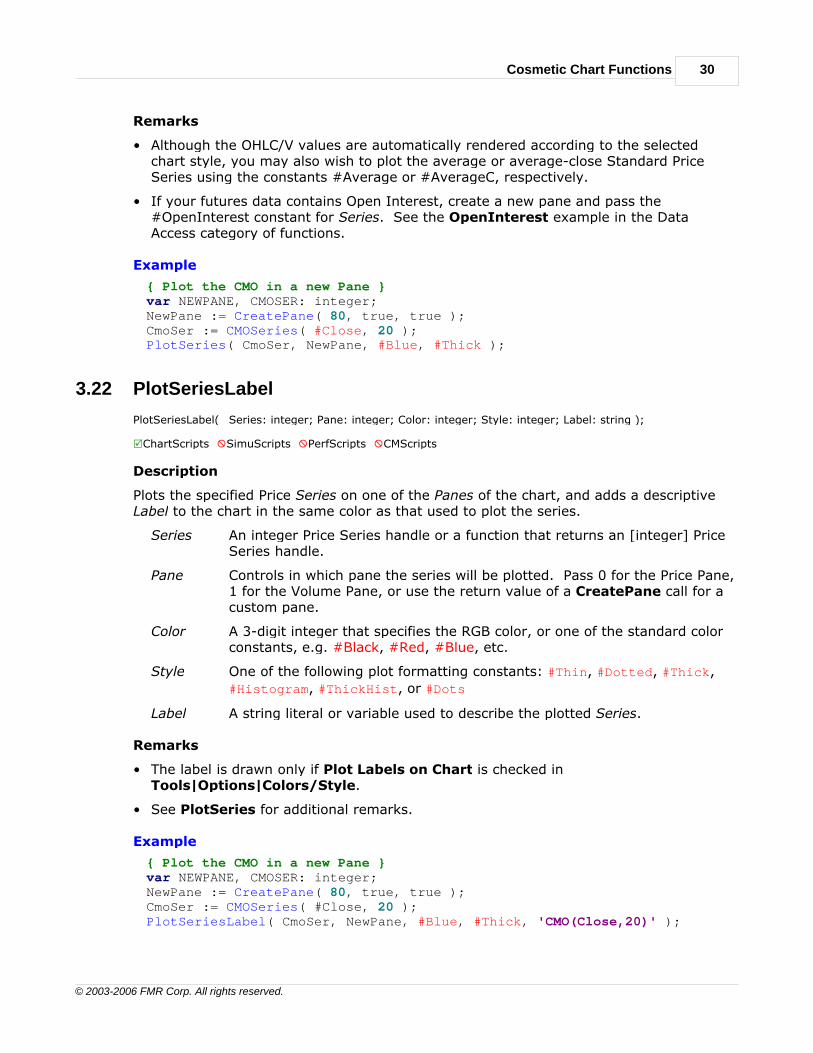
Cosmetic Chart Functions 30
© 2003-2006 FMR Corp. All rights reserved.
Remarks
• Although the OHLC/V values are automatically rendered according to the selectedchart style, you may also wish to plot the average or average-close Standard PriceSeries using the constants #Average or #AverageC, respectively.
• If your futures data contains Open Interest, create a new pane and pass the#OpenInterest constant for Series. See the OpenInterest example in the DataAccess category of functions.
Example
{ Plot the CMO in a new Pane }var NEWPANE, CMOSER: integer;NewPane := CreatePane( 80, true, true );CmoSer := CMOSeries( #Close, 20 );PlotSeries( CmoSer, NewPane, #Blue, #Thick );
3.22 PlotSeriesLabel
PlotSeriesLabel( Series: integer; Pane: integer; Color: integer; Style: integer; Label: string );
RChartScripts XSimuScripts XPerfScripts XCMScripts
Description
Plots the specified Price Series on one of the Panes of the chart, and adds a descriptiveLabel to the chart in the same color as that used to plot the series.
Series An integer Price Series handle or a function that returns an [integer] PriceSeries handle.
Pane Controls in which pane the series will be plotted. Pass 0 for the Price Pane,1 for the Volume Pane, or use the return value of a CreatePane call for acustom pane.
Color A 3-digit integer that specifies the RGB color, or one of the standard colorconstants, e.g. #Black, #Red, #Blue, etc.
Style One of the following plot formatting constants: #Thin, #Dotted, #Thick,
#Histogram, #ThickHist, or #Dots
Label A string literal or variable used to describe the plotted Series.
Remarks
• The label is drawn only if Plot Labels on Chart is checked inTools|Options|Colors/Style.
• See PlotSeries for additional remarks.
Example
{ Plot the CMO in a new Pane }var NEWPANE, CMOSER: integer;NewPane := CreatePane( 80, true, true );CmoSer := CMOSeries( #Close, 20 );PlotSeriesLabel( CmoSer, NewPane, #Blue, #Thick, 'CMO(Close,20)' );

WealthScript Function Reference, Wealth-Lab Pro™31
© 2003-2006 FMR Corp. All rights reserved.
3.23 PlotStops
PlotStops;
RChartScripts XSimuScripts XPerfScripts XCMScripts
Description
Causes the various stop levels and profit targets to be visually depicted as small dots onthe chart. The various levels are drawn using the following colors:
Profit Target GreenStop Loss RedBreakeven BlueTrailing PinkManual Stop Brown
Remarks
• Stops are plotted for exit signals only on the bar for which they are active.
• Manual stops are plotted at the stop or limit price passed to the exit signal. Forexample, a stop is plotted at Bar by the SellAtStop StopPrice parameter, whereas aprofit target is plotted by the LimitPrice parameter in SellAtLimit.
• Other signals that fall into the manual-stop/limit category include SellAtTrailingStop,CoverAtLimit, CoverAtStop, and CoverAtTrailingStop
• PlotStops enables the display of stops and should be called prior to the main tradingloop. "Installed" AutoStops are actually processed by the ApplyAutoStops function.
See Also: The QuickRef entry for the Min function provides a more dynamic examplewith manual stops.
Example
var Bar: integer;InstallProfitTarget( 10 );InstallStopLoss( 5 );InstallTrailingStop( 1, 50 );PlotStops;for Bar := 20 to BarCount - 1 dobegin ApplyAutoStops( Bar );
{ Arbitrarily short every 100 bars } if Bar Mod 100 = 0 then ShortAtMarket( Bar + 1, '' );end;
3.24 PlotSymbol
PlotSymbol( Symbol: string; Pane: integer; Color: integer; Style: integer );
RChartScripts XSimuScripts XPerfScripts XCMScripts

Cosmetic Chart Functions 32
© 2003-2006 FMR Corp. All rights reserved.
Description
Plots the symbol specified in the Symbol parameter to the chart pane specified in thePane parameter. If Symbol does not exist in one of your DataSources, or it does notcontain data within the range of the Primary Series specified in the Data Loading control,a run-time error will be generated.
Symbol A string literal or variable containing the desired symbol. You should use asymbol other than the one for the Primary Series (the current chartsymbol).
Pane Controls in which pane the series will be plotted. Pass 0 for the Price Pane,1 for the Volume Pane, or use the return value of a CreatePane call for acustom pane.
Color A 3-digit integer that specifies the RGB color, or one of the standard colorconstants, e.g. #Black, #Red, #Blue, etc.
Style Controls how the symbol appears, and can be one of the followingconstants: #OHLC, #Candle, or #Line
Example
var nP: integer;PlotSymbol( 'MSFT', 0, #Silver, #Candle );nP := CreatePane( 100, true, true );PlotSymbol( 'BORL', nP, #Blue, #OHLC );
3.25 PlotSyntheticSymbol
PlotSyntheticSymbol( Symbol: string; Open: integer; High: integer; Low: integer; Close: integer; Pane:integer; Color: integer; Style: integer );
RChartScripts XSimuScripts XPerfScripts XCMScripts
Description
Creates a synthetic "symbol" that contains open, high, low and closing prices. TheSymbol parameter specifies the identity of the synthetic symbol. The next fourparameters should contain Price Series handles that contain the Open, High, Low, andClose Price Series, respectively.
Symbol A string literal or variable expression containing the synthetic symbol'sname.
Open An integer Price Series handle or a WealthScript function that returns an[integer] Price Series handle to be used for the opening Price Series of thesynthetic symbol.
High, Low, and Close - same as Open for the respective Price Series.
Pane Controls in which pane the series will be plotted. Pass 0 for the Price Pane,1 for the Volume Pane, or use the return value of a CreatePane call for acustom pane.
Color A 3-digit integer that specifies the RGB color, or one of the standard colorconstants, e.g. #Black, #Red, #Blue, etc. Synthetic symbols are plottedas a single color and do not follow up/down bar coloring.

WealthScript Function Reference, Wealth-Lab Pro™33
© 2003-2006 FMR Corp. All rights reserved.
Style Controls how the symbol appears, and can be one of the followingconstants: #OHLC, #Candle, or #Line, the latter of which plots only theClose series.
Note: It's possible (and quite likely) for candles/bars to sometimes appear "incorrect"for a synthetic symbol. This is due, for example, to the low prices not alwaysbeing less than the open, high and close for certain bars. Consequently, thesecandle values do not always form into traditionally correct candles.
Example
var SMAPANE, O, H, L, C: integer;SMAPane := CreatePane( 100, true, true );O := SMASeries( #Open, 20 );H := SMASeries( #High, 20 );L := SMASeries( #Low, 20 );C := SMASeries( #Close, 20 );PlotSyntheticSymbol( 'SMACandle', O, H, L, C, SMAPane, #Blue, #Candle );DrawLabel( 'SMA Candle', SMAPane );
3.26 SetBackgroundColor
SetBackgroundColor( Bar: integer; Color: integer );
RChartScripts XSimuScripts XPerfScripts XCMScripts
Description
Lets you color the background area of all chart panes with a specified Color, on a bar-by-bar basis. You can use this feature to highlight bull and bear trends in the chart. Whencoloring the chart background, be sure to use light, pastel colors for the Color parameter.Good colors to use for backgrounds include 988 (#RedBkg), 898 (#GreenBkg), and 889(#BlueBkg).
Remarks
• To individually set the background color of any pane, use SetPaneBackgroundColor.
Example
{ Identify bull and bear trends using the 52 week moving average }var SMAWEEKLY, SMAWEEKLYDAILY, BAR: integer;SetScaleWeekly;SmaWeekly := SMASeries( #Close, 52 );RestorePrimarySeries;SmaWeeklyDaily := DailyFromWeekly( SmaWeekly );for Bar := 52 to BarCount - 1 dobegin if PriceClose( Bar ) > GetSeriesValue( Bar, SmaWeeklyDaily ) then SetBackgroundColor( Bar, #GreenBkg ) else SetBackgroundColor( Bar, #RedBkg );end;

Cosmetic Chart Functions 34
© 2003-2006 FMR Corp. All rights reserved.
3.27 SetBarColor
SetBarColor( Bar: integer; Color: integer );
RChartScripts XSimuScripts XPerfScripts XCMScripts
Description
Lets you color a specific Bar of the chart's primary Price Series. Generally, you'll useTools|Options|Colors/Style to set your default choices for Up/Down bar coloring,however, you may want to color bars based on an indicator value, for example.
Remarks
• SetBarColor has priority over the SetBarColors function.
• See SetSeriesBarColor to set the color of individual bars in a Price Series other thanthe primary Price Series.
Example
{ Color bars green when RSI < 20, otherwise color up days blue and down days red }var Bar, hRSI, RSIPane: integer;
hRSI := RSISeries( #Close, 14 );for Bar := 20 to BarCount - 1 dobegin if @hRSI[ Bar ] < 60 then SetBarColor( Bar, #Green ) else if PriceClose( Bar ) > PriceClose( Bar - 1 ) then SetBarColor( Bar, #Blue ) else SetBarColor( Bar, #Red );
end;RSIPane := CreatePane( 75, true, true );PlotSeries( hRSI, RSIPane, #Blue, #Thick );
3.28 SetBarColors
SetBarColors( UpBars: integer; DownBars: integer );
RChartScripts XSimuScripts XPerfScripts XCMScripts
Description
Specifies the bar colors for all bars on the chart. Specify the color for up bars (close >open) using the UpBars parameter, and down bars (close < open) with the DownBarsparameter. This function is useful when sharing ChartScripts and you need to show aspecific color scheme for your methodology.
Note: Use Tools|Options|Colors/Style to set your default choices for Up/Down barcoloring. See Also: SetColorScheme.
Example
SetBarColors( #Navy, #Maroon );

WealthScript Function Reference, Wealth-Lab Pro™35
© 2003-2006 FMR Corp. All rights reserved.
3.29 SetColorScheme
SetColorScheme( UpBars: integer; DownBars: integer; Volume: integer; Background: integer; GridLines:integer; MarginArea: integer );
RChartScripts XSimuScripts XPerfScripts XCMScripts
Description
Lets you control the color complete scheme of the chart in a single statement. Specifythe color of up bars, down bars, volume bars, background, gridlines and bottom marginarea. This function is especially useful when sharing ChartScripts and you need to showa specific color scheme for your methodology.
Example
{ A slick black chart style }SetColorScheme( #Lime, 922, #Olive, 001, 021, #Silver );
3.30 SetLogScale
SetLogScale( Pane: integer; UseLogScale: boolean );
RChartScripts XSimuScripts XPerfScripts XCMScripts
Description
Controls whether or not the specified Pane will use a semi-log scale as controlled by theUseLogScale parameter. A semi-log scale gives equal weight to percentage changes,rather then absolute value changes. For example, the distance from 1 to 10 will be thesame size on the chart as the distance from 10 to 100. It's called "semi-log" becauseonly the y-axis uses the log scale, whereas the x-axis [typically] remains evenly-spaced.
Example
SetLogScale( 0, true );
3.31 SetPaneBackgroundColor
SetPaneBackgroundColor( Bar: integer; Pane: integer; Color: integer );
RChartScripts XSimuScripts XPerfScripts XCMScripts
Description
Sets the background color of the specified Pane to the color provided in the Colorparameter, at the specified Bar. Specify a Pane parameter of zero for the price pane, onefor the volume pane, or use custom pane created by the CreatePane function.
Remarks
• SetPaneBackgroundColor overrides SetBackgroundColor for the specified Pane.
Example
{ Plot RSI and CMO, color backgrounds to show overbought/oversold levels}var Bar: integer;
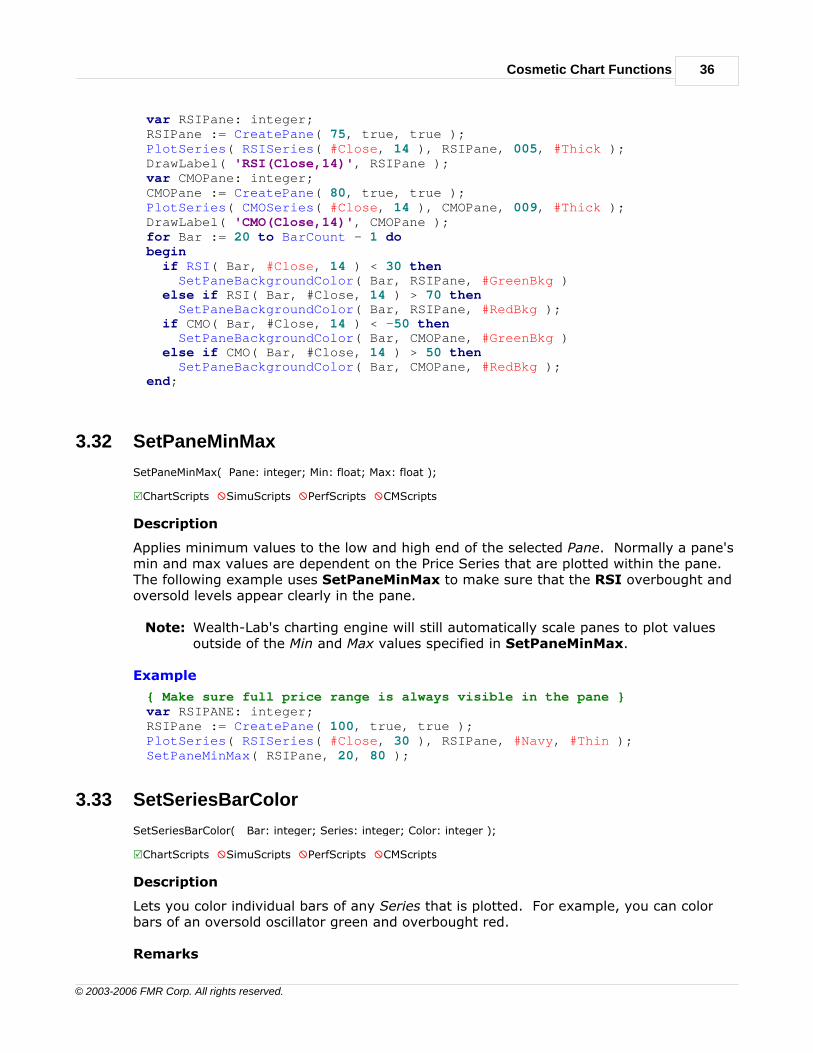
Cosmetic Chart Functions 36
© 2003-2006 FMR Corp. All rights reserved.
var RSIPane: integer;RSIPane := CreatePane( 75, true, true );PlotSeries( RSISeries( #Close, 14 ), RSIPane, 005, #Thick );DrawLabel( 'RSI(Close,14)', RSIPane );var CMOPane: integer;CMOPane := CreatePane( 80, true, true );PlotSeries( CMOSeries( #Close, 14 ), CMOPane, 009, #Thick );DrawLabel( 'CMO(Close,14)', CMOPane );for Bar := 20 to BarCount - 1 dobegin if RSI( Bar, #Close, 14 ) < 30 then SetPaneBackgroundColor( Bar, RSIPane, #GreenBkg ) else if RSI( Bar, #Close, 14 ) > 70 then SetPaneBackgroundColor( Bar, RSIPane, #RedBkg ); if CMO( Bar, #Close, 14 ) < -50 then SetPaneBackgroundColor( Bar, CMOPane, #GreenBkg ) else if CMO( Bar, #Close, 14 ) > 50 then SetPaneBackgroundColor( Bar, CMOPane, #RedBkg );end;
3.32 SetPaneMinMax
SetPaneMinMax( Pane: integer; Min: float; Max: float );
RChartScripts XSimuScripts XPerfScripts XCMScripts
Description
Applies minimum values to the low and high end of the selected Pane. Normally a pane'smin and max values are dependent on the Price Series that are plotted within the pane.The following example uses SetPaneMinMax to make sure that the RSI overbought andoversold levels appear clearly in the pane.
Note: Wealth-Lab's charting engine will still automatically scale panes to plot valuesoutside of the Min and Max values specified in SetPaneMinMax.
Example
{ Make sure full price range is always visible in the pane }var RSIPANE: integer;RSIPane := CreatePane( 100, true, true );PlotSeries( RSISeries( #Close, 30 ), RSIPane, #Navy, #Thin );SetPaneMinMax( RSIPane, 20, 80 );
3.33 SetSeriesBarColor
SetSeriesBarColor( Bar: integer; Series: integer; Color: integer );
RChartScripts XSimuScripts XPerfScripts XCMScripts
Description
Lets you color individual bars of any Series that is plotted. For example, you can colorbars of an oversold oscillator green and overbought red.
Remarks

WealthScript Function Reference, Wealth-Lab Pro™37
© 2003-2006 FMR Corp. All rights reserved.
• To prevent drawing specific Bars of an indicator, pass -1 as the Color parameter.
Example
{ Color Bars of the indicator based on oversold/overbought levels }var RSISER, BAR, RSIPANE: integer;RSISer := RSISeries( #Close, 30 );for Bar := 0 to BarCount - 1 do if RSI( Bar, #Close, 30 ) > 60 then SetSeriesBarColor( Bar, RSISer, #Red ) else if RSI( Bar, #Close, 30 ) < 40 then SetSeriesBarColor( Bar, RSISer, #Blue );RSIPane := CreatePane( 100, true, true );PlotSeries( RSISer, RSIPane, #Navy, #Thick );

CommissionScript Functions 38
© 2003-2006 FMR Corp. All rights reserved.
4 CommissionScript Functions
4.1 Overview
You should always include real-world trading costs to add fidelity to your backtesting.The Option Dialog (F12) includes a "Trading Costs/Control" tab that provides selectionsfor commissions and slippage that you will experience in real-world trading.
If your broker uses a flat-fee commission for each trade, then you may select the "perTrade" One Way Commission option, which simply deducts a fixed amount from eachtrade in a simulation. Likewise, the "per Share" option reduces a trade's gross profit orloss by the number of shares multiplied by the value entered. Still, these simplecommission options do not include other small adjustments that your broker can make ona per trade basis, such as the SEC fee for sale transactions in the U.S., which at the timeof this writing is $0.0468 per $1,000.
Some brokers use graduated commission schedules or base their fees on a percentage oftrade volume. CommissionScripts give you complete control over calculating simple tothe most complex commission schedules used by brokers worldwide. Using the special"CM" variables provided, you can emulate the your broker's calculation and assign the
result to the CMResult variable. Once complete, save the script to the CommissionScripts ChartScript folder. At this point, the script will be available as aselection in the CommissionScript drop down control in the Options Dialog.
For each trade processed during a simulation - both entries and exits - Wealth-Lab willexecute the selected CommissionScript. The value calculated and applied to theCMResult variable will then be used as the trade's commission cost.
Note: If you find that no commissions are ever deducted when using yourcommission script, check the script for errors.
4.2 CMShares
CMShares(): integer;
XChartScripts XSimuScripts XPerfScripts RCMScripts
Description
Returns the number of shares (or contracts) for the commission calculation.
4.3 CMPrice
CMPrice(): float;
XChartScripts XSimuScripts XPerfScripts RCMScripts

WealthScript Function Reference, Wealth-Lab Pro™39
© 2003-2006 FMR Corp. All rights reserved.
Description
Returns either the entry or exit price, as required, of the position for the commissioncalculation.
4.4 CMEntry
CMEntry(): boolean;
XChartScripts XSimuScripts XPerfScripts RCMScripts
Description
Returns boolean true if the trade being processed is an entry signal. Consequently,CMEntry will be false when exiting a position. You can use this function to add the SECfee for sales transactions in the U.S., for example.
Example:
{ My broker charges 10.99 per trade, but also adds the SEC sales fee }var SECFee: float;const SECRate = 0.0234; // per $1,000
CMResult := 10.99;if not CMEntry thenbegin SECFee := SECRate * CMShares * CMPrice / 1000; SECFee := Round( SECFee * 100 ) / 100; CMResult := CMResult + SECFee;end;
4.5 CMOrderType
CMOrderType(): integer;
XChartScripts XSimuScripts XPerfScripts RCMScripts
Description
Returns an integer indicating the type of order used.
0 = Market1 = Stop2 = Limit3 = Close
Example:
{ My broker charges $9.99 for market orders, $11.00 for limit or stoporders, and $12.50 to work an order at the close }var Comish: float;
case CMOrderType of 0: Comish := 9.99; 1, 2: Comish := 11.00;
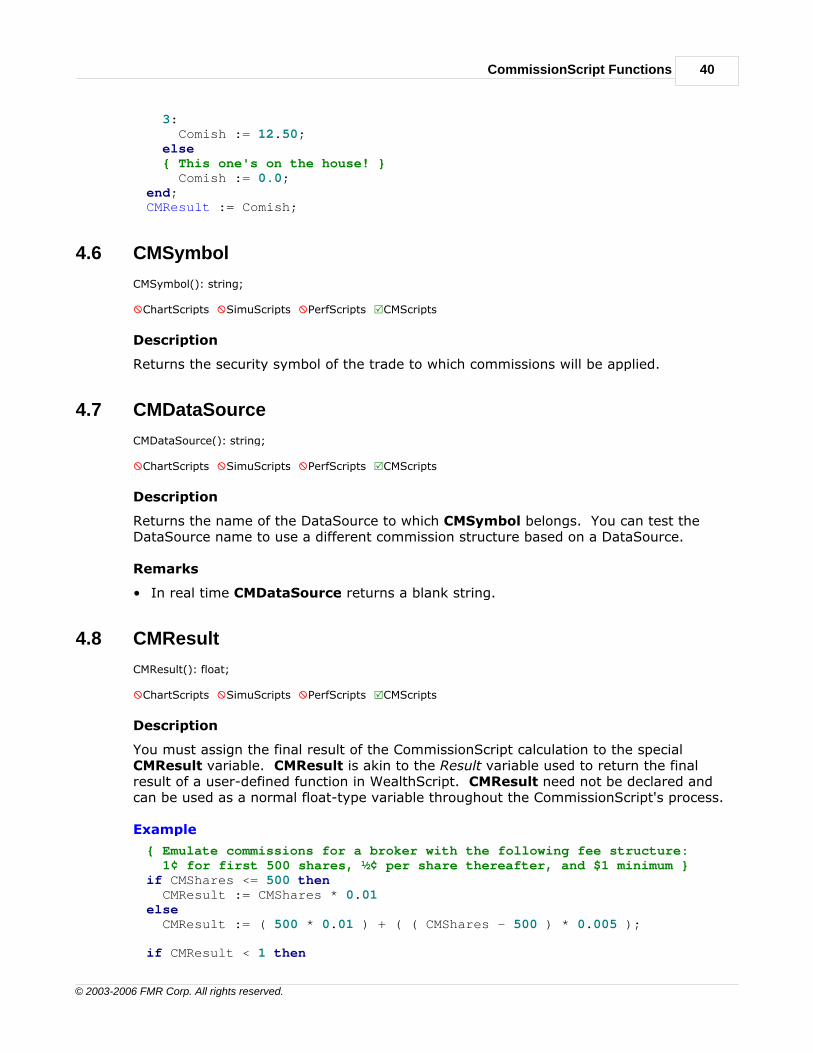
CommissionScript Functions 40
© 2003-2006 FMR Corp. All rights reserved.
3: Comish := 12.50; else { This one's on the house! } Comish := 0.0;end;CMResult := Comish;
4.6 CMSymbol
CMSymbol(): string;
XChartScripts XSimuScripts XPerfScripts RCMScripts
Description
Returns the security symbol of the trade to which commissions will be applied.
4.7 CMDataSource
CMDataSource(): string;
XChartScripts XSimuScripts XPerfScripts RCMScripts
Description
Returns the name of the DataSource to which CMSymbol belongs. You can test theDataSource name to use a different commission structure based on a DataSource.
Remarks
• In real time CMDataSource returns a blank string.
4.8 CMResult
CMResult(): float;
XChartScripts XSimuScripts XPerfScripts RCMScripts
Description
You must assign the final result of the CommissionScript calculation to the specialCMResult variable. CMResult is akin to the Result variable used to return the finalresult of a user-defined function in WealthScript. CMResult need not be declared andcan be used as a normal float-type variable throughout the CommissionScript's process.
Example
{ Emulate commissions for a broker with the following fee structure: 1¢ for first 500 shares, ½¢ per share thereafter, and $1 minimum }if CMShares <= 500 then CMResult := CMShares * 0.01else CMResult := ( 500 * 0.01 ) + ( ( CMShares - 500 ) * 0.005 );
if CMResult < 1 then

WealthScript Function Reference, Wealth-Lab Pro™41
© 2003-2006 FMR Corp. All rights reserved.
CMResult := 1;

Data Access Functions 42
© 2003-2006 FMR Corp. All rights reserved.
5 Data Access Functions
5.1 Overview
The Data Access functions provide the methods to access the data from all the raw PriceSeries in the Primary Data Series (the symbol selected for the script) as well as otherStandard Price Series information. Additionally, futures symbols' point, margin, and tickentries in the Future Symbol Manager can be easily accessed from within your script.
5.2 BarCount
BarCount: integer;
RChartScripts RùSimuScripts RPerfScripts XCMScripts
Description
Returns the total number of bars available in the current chart.
Remarks
The first bar of any chart is Bar Number 0, and the last bar can be found by theexpression BarCount - 1.
Example
{ A typical trading system main loop }var Bar: integer;for Bar := 30 to BarCount - 1 dobegin { ... Trading Rules ... }end;
5.3 GetDate
GetDate( Bar: integer ): integer;
RChartScripts RSimuScripts RPerfScripts XCMScripts
Description
Returns the date of the specified Bar number. WealthScript represents date values aslarge integers - the year followed by month followed by day. For example, 1/23/2001would be represented as 20010123. You can thus compare dates by simply using thestandard arithmetic operators.
Example
{ Print the most recent date on the chart to the debug window }var S: string;s := IntToStr( GetDate( BarCount - 1 ) );Print( s );

WealthScript Function Reference, Wealth-Lab Pro™43
© 2003-2006 FMR Corp. All rights reserved.
5.4 GetMargin
GetMargin: float;
RChartScripts RSimuScripts XPerfScripts XCMScripts
Description
Returns the Margin for the current symbol being charted. Margin is the amount of fundsrequired to maintain a single futures contract position. If the current symbol is not afutures symbol, the function returns zero. You define Margin in the Futures SymbolsManager, Tools|Futures Symbols Manager (Ctrl+Alt+F).
Example
var Bar: integer;
{ Take on $20,000 margin per position }if GetMargin > 0 then SetShareSize( Round( 20000 / GetMargin ) );
for Bar := 4 to BarCount() - 1 dobegin if LastPositionActive then SellAtStop( Bar + 1, Lowest( Bar, #Low, 3 ), LastPosition, '' ) else BuyAtStop( Bar + 1, Highest( Bar, #High, 3 ), '' );end;
5.5 GetPointValue
GetPointValue: float;
RChartScripts RSimuScripts XPerfScripts XCMScripts
Description
Returns the Point Value for the current futures symbol being charted. The Point Value isthe amount of profit made when prices increase a single point. If the current symbol isnot a futures symbol, the function returns 1. You define Point Value in the FuturesSymbols Manager, Tools|Futures Symbols Manager (Ctrl+Alt+F).
Example
var PtValue: float;var s: string;PtValue := GetPointValue;s := FormatFloat( '0.00', PtValue );ShowMessage( 'The Point Value is ' + s );
5.6 GetSecurityName
GetSecurityName: string;
RChartScripts RSimuScripts XPerfScripts XCMScripts

Data Access Functions 44
© 2003-2006 FMR Corp. All rights reserved.
Description
Returns the security name (company name) of the symbol currently being operated on.Not all DataSources provide the security name in which case a blank string is returned.
Example
ShowMessage( 'We''re now running ' + GetSecurityName );
5.7 GetSymbol
GetSymbol: string;
RChartScripts RSimuScripts XPerfScripts XCMScripts
Description
Returns the symbol of the current chart.
Example
{ Show the closing price with the symbol in a chart label }var X: float;x := PriceClose( BarCount - 1 );DrawLabel( 'Closing price for ' + GetSymbol + ' was ' + FormatFloat( '##,##0.00', x ), 0 );
5.8 GetTick
GetTick: float;
RChartScripts RSimuScripts XPerfScripts XCMScripts
Description
Returns the Tick value for the current primary symbol. The Tick value is the smallestincremental price move that a futures contract can make. You define Tick values in theFutures Symbols Manager, Tools|Futures Symbols Manager (Ctrl+Alt+F).
Remarks
• In a SimuScript, GetTick returns the Tick value for the current futures symbol beingposition-sized.
• GetTick returns 0 for any symbol that does not have an entry in the Futures SymbolsManager, i.e., a stock. With Stock Mode selected in the DataSources main menu,GetTick always returns 0.
Example
{ The 89/13 Futures Breakout System }var Tick, XLOW, XHIGH: float;var BAR: integer;
Tick := GetTick;
for Bar := 90 to BarCount - 1 dobegin
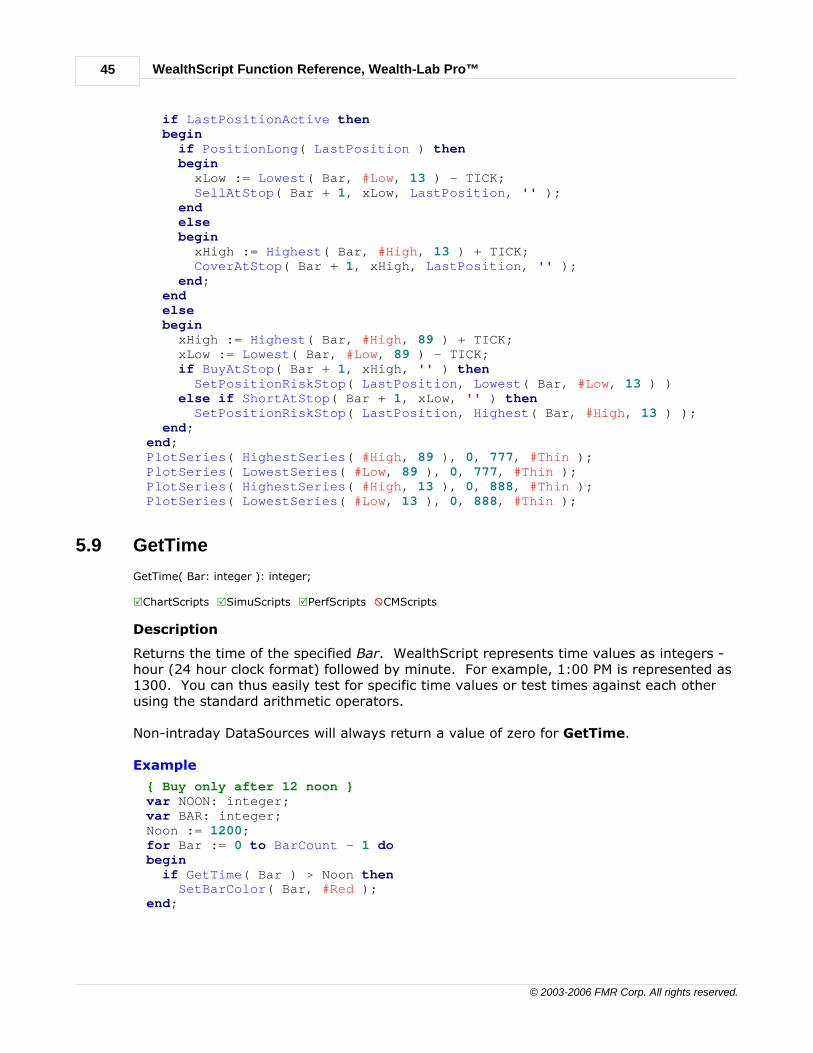
WealthScript Function Reference, Wealth-Lab Pro™45
© 2003-2006 FMR Corp. All rights reserved.
if LastPositionActive then begin if PositionLong( LastPosition ) then begin xLow := Lowest( Bar, #Low, 13 ) - TICK; SellAtStop( Bar + 1, xLow, LastPosition, '' ); end else begin xHigh := Highest( Bar, #High, 13 ) + TICK; CoverAtStop( Bar + 1, xHigh, LastPosition, '' ); end; end else begin xHigh := Highest( Bar, #High, 89 ) + TICK; xLow := Lowest( Bar, #Low, 89 ) - TICK; if BuyAtStop( Bar + 1, xHigh, '' ) then SetPositionRiskStop( LastPosition, Lowest( Bar, #Low, 13 ) ) else if ShortAtStop( Bar + 1, xLow, '' ) then SetPositionRiskStop( LastPosition, Highest( Bar, #High, 13 ) ); end;end;PlotSeries( HighestSeries( #High, 89 ), 0, 777, #Thin );PlotSeries( LowestSeries( #Low, 89 ), 0, 777, #Thin );PlotSeries( HighestSeries( #High, 13 ), 0, 888, #Thin );PlotSeries( LowestSeries( #Low, 13 ), 0, 888, #Thin );
5.9 GetTime
GetTime( Bar: integer ): integer;
RChartScripts RSimuScripts RPerfScripts XCMScripts
Description
Returns the time of the specified Bar. WealthScript represents time values as integers -hour (24 hour clock format) followed by minute. For example, 1:00 PM is represented as1300. You can thus easily test for specific time values or test times against each otherusing the standard arithmetic operators.
Non-intraday DataSources will always return a value of zero for GetTime.
Example
{ Buy only after 12 noon }var NOON: integer;var BAR: integer;Noon := 1200;for Bar := 0 to BarCount - 1 dobegin if GetTime( Bar ) > Noon then SetBarColor( Bar, #Red );end;

Data Access Functions 46
© 2003-2006 FMR Corp. All rights reserved.
5.10 OpenInterest
OpenInterest( Bar: integer ): float;
RChartScripts RSimuScripts XPerfScripts XCMScripts
Description
Returns the open interest for the specified Bar. Open Interest is the number of contractscurrently open for a given futures contract. OpenInterest is available only for FuturesDataSources. Non-Futures DataSources will always contain zero values forOpenInterest.
Use the OpenInterest function to return the open interest value as of a specified Bar. Ifyou need to access the complete Open Interest Price Series handle, use the#OpenInterest built-in constant.
Interpretation
Open Interest can be used to gauge market liquidity, similar to Volume.
Example
var OEPANE: integer;OEPane := CreatePane( 50, false, true );SetPaneMinMax( OEPane, 0, 100 );PlotSeries( #OpenInterest, OEPane, #Green, #Histogram );DrawLabel( 'Open Interest', OEPane );
5.11 PriceAverage
PriceAverage( Bar: integer ): float;
RChartScripts RSimuScripts XPerfScripts XCMScripts
Description
Returns the average price for the specified Bar. Use PriceAverage to return the value ofindividual average prices at specific bars. The Average Price is defined as ( High + Low )/ 2. If you need to access the complete average price Price Series, use the #Averageconstant instead.
Example
{ Plot a moving average of daily average prices }var X: float;var BAR: integer;x := PriceAverage( Bar );PlotSeries( SMASeries( #Average, 30 ), 0, #Blue, #Thick );
5.12 PriceAverageC
PriceAverageC( Bar: integer ): float;
RChartScripts RSimuScripts XPerfScripts XCMScripts

WealthScript Function Reference, Wealth-Lab Pro™47
© 2003-2006 FMR Corp. All rights reserved.
Description
Returns the average price for the specified Bar. Use PriceAverage to return the value ofindividual average prices at specific bars. The Average Price is defined as ( High + Low +Close ) / 3. If you need to access the complete average price Price Series, use the#AverageC constant instead.
Example
{ Plot a moving average of close-weighted daily average prices }var X: float;var BAR: integer;x := PriceAverageC( Bar );PlotSeries( SMASeries( #AverageC, 30 ), 0, #Blue, #Thick );
5.13 PriceClose
PriceClose( Bar: integer ): float;
RChartScripts RSimuScripts XPerfScripts XCMScripts
Description
Returns the closing price for the specified Bar. Use PriceClose to return the value ofindividual closing prices at specific bars. If you need to access the complete closing pricePrice Series, use the #Close constant instead.
Example
{ Have we had an up day? }var BAR: integer;for Bar := 1 to BarCount - 1 do if PriceClose( Bar ) > PriceClose( Bar - 1 ) then SetBarColor( Bar, 853 );
5.14 PriceHigh
PriceHigh( Bar: integer ): float;
RChartScripts RSimuScripts XPerfScripts XCMScripts
Description
Returns the high price for the specified Bar. Use PriceHigh to return the value ofintraday highs at specific bars. If you need to access the complete high price PriceSeries, use the #High constant instead.
Example
{ Have we achieved a new 200 bar high in the last 20 bars? }var X, X2: float;var BAR: integer;for Bar := 200 to BarCount - 1 dobegin x := Highest( Bar, #High, 20 ); x2 := Highest( Bar, #High, 200 ); if x = x2 then

Data Access Functions 48
© 2003-2006 FMR Corp. All rights reserved.
SetBarColor( Bar, 083 );end;
5.15 PriceLow
PriceLow( Bar: integer ): float;
RChartScripts RSimuScripts XPerfScripts XCMScripts
Description
Returns the low price for the specified Bar. Use PriceLow to return the value of intradaylows at specific bars. If you need to access the complete low price Price Series, use the#Low constant instead.
Example
{ Set a stop at the low of the entry bar }var BAR: integer;for Bar := 80 to BarCount - 1 dobegin if LastPositionActive then SellAtStop( Bar + 1, Lowest( Bar, #Low, 20 ), LastPosition, 'Stop' ) else begin if BuyAtStop( Bar + 1, Highest( Bar, #High, 80 ), 'Stop' ) then SetPositionRiskStop( LastPosition, Lowest( Bar, #Low, 20 ) ); end;end;
5.16 PriceOpen
PriceOpen( Bar: integer ): float;
RChartScripts RSimuScripts XPerfScripts XCMScripts
Description
Returns the opening price for the specified Bar. Use PriceOpen to return the value ofopening prices at specific bars. If you need to access the complete open pricePriceSeries, use the #Open constant instead.
Example
{ If we have a gap up open, buy it }var BAR: integer;for Bar := 1 to BarCount - 1 dobegin if LastPositionActive then SellAtMarket( Bar + 1, LastPosition, '1 Day' ) else begin if PriceOpen( Bar ) > PriceHigh( Bar - 1 ) * 1.05 then BuyAtMarket( Bar, 'Gap' ); end;end;
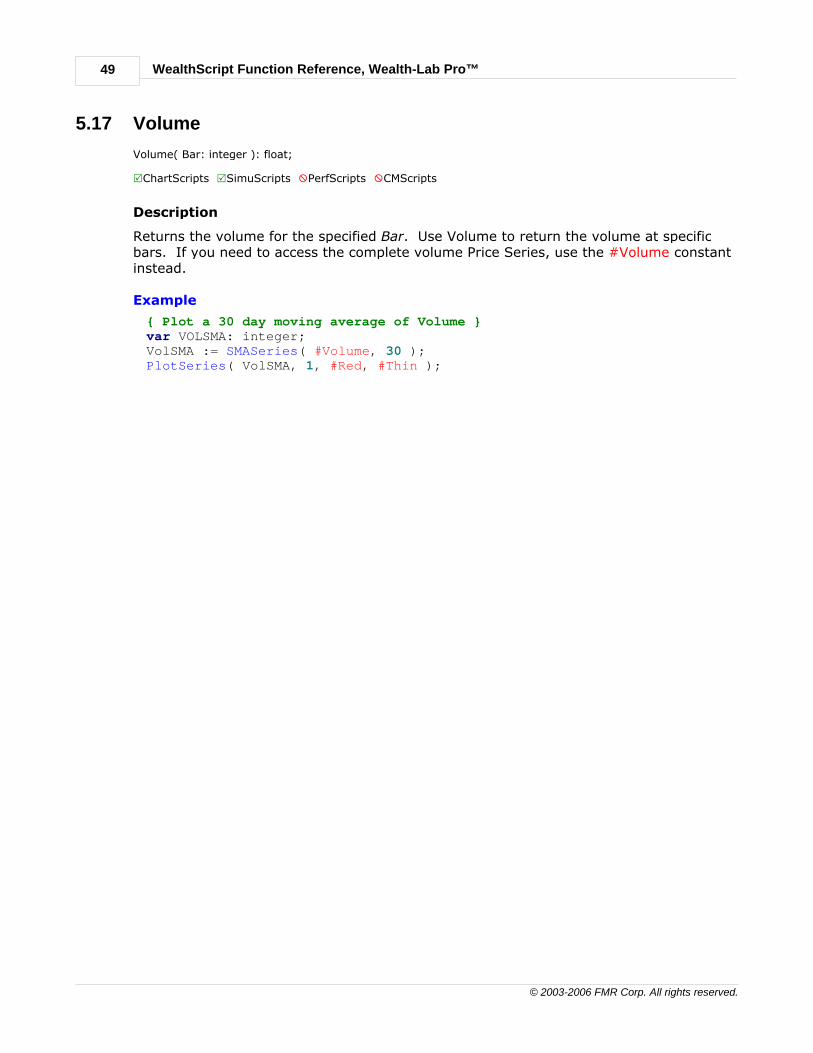
WealthScript Function Reference, Wealth-Lab Pro™49
© 2003-2006 FMR Corp. All rights reserved.
5.17 Volume
Volume( Bar: integer ): float;
RChartScripts RSimuScripts XPerfScripts XCMScripts
Description
Returns the volume for the specified Bar. Use Volume to return the volume at specificbars. If you need to access the complete volume Price Series, use the #Volume constantinstead.
Example
{ Plot a 30 day moving average of Volume }var VOLSMA: integer;VolSMA := SMASeries( #Volume, 30 );PlotSeries( VolSMA, 1, #Red, #Thin );

Date/Time Functions 50
© 2003-2006 FMR Corp. All rights reserved.
6 Date/Time Functions
6.1 Overview
Generally speaking, the Date and Time category of WealthScript functions give youaccess to date/time-related information of an underlying Price Series at specific BarNumbers. More general date/time information is available, such as the current date/timeof your computer and important market events, like option expiry dates.
6.2 BarInterval
BarInterval: integer;
RChartScripts RSimuScripts RPerfScripts XCMScripts
Description
Returns the bar interval in minutes, seconds, or ticks (as required) for intraday charts.Returns zero in non-intraday charts.
Example
var bi: integer;bi := BarInterval;if bi < 1 then ShowMessage('Not an intraday chart')else ShowMessage('The intraday bar interval is ' + IntToStr( bi ) );
6.3 BarNum
BarNum( Bar: integer ): integer;
RChartScripts RSimuScripts XPerfScripts XCMScripts
Description
Returns the Bar Number of the specified Bar within the trading day for intraday charts.Intraday charts can be minute, second, or tick-based. The first bar of the day has aBarNum of zero. Non-intraday charts always return zero for BarNum.
Example
{ Color the middle of the trading day }var MAXBARS, BAR, PCT: integer;{ First determine how many bars there are in one day }MaxBars := 0;for Bar := BarCount - 1 downto 1 do if BarNum( Bar ) = 0 then begin MaxBars := BarNum( Bar - 1 ); Break;

WealthScript Function Reference, Wealth-Lab Pro™51
© 2003-2006 FMR Corp. All rights reserved.
end;if MaxBars = 0 then Exit;{ Now color the bars 40 - 60% within the day's range }for Bar := 0 to BarCount - 1 dobegin pct := BarNum( Bar ) / MaxBars; if ( pct >= 0.4 ) and ( pct <= 0.6 ) then SetBarColor( Bar, #Olive );end;
6.4 CurrentDate
CurrentDate: integer;
RChartScripts RSimuScripts RPerfScripts XCMScripts
Description
Returns the current system date in yyyyMMdd format.
Example
{ Draw the current date in yyyyMMdd integer format }DrawLabel( IntToStr( CurrentDate ), 0 );
{ Use DateToStr to draw the current date using your Window's settings inthe volume pane }DrawLabel( DateToStr( CurrentDate ), 1 );
6.5 CurrentTime
CurrentTime: integer;
RChartScripts RSimuScripts RPerfScripts XCMScripts
Description
Returns the current system time in hhmm format.
Example
{ Draw the current time in hhmm integer format }DrawLabel( IntToStr( CurrentTime ), 0 );
{ Use TimeToStr to draw the current time using your Window's settings inthe volume pane }DrawLabel( TimeToStr( CurrentTime ), 1 );
6.6 DateTimeToBar
DateTimeToBar( Date: integer; Time: integer): integer;
RChartScripts RSimuScripts RPerfScripts XCMScripts

Date/Time Functions 52
© 2003-2006 FMR Corp. All rights reserved.
Description
Returns the Bar Number on an intraday chart that corresponds to the specified Date andTime values. If there is no bar that corresponds to the specified date, the functionreturns -1.
Remarks
• Date is an integer value with the format yyyyMMdd, where yyyy is the year, MM is thetwo-digit month (01 through 12), and dd is the two-digit day (01 through 31,depending on the month).
• Time is an integer value with the format hhnn, where hh is the hour (0 through 23),and nn is the two-digit minute (00 through 59).
• If either Date or Time is not a valid, "in range" value, a run-time error will result.
• DateTimeToBar can be used to return a Bar Number on a non-intraday chart bypassing zero as Time, though DateToBar is preferred.
Example
{$I 'EnterAtPrice'}{ "Load" a specific trade at 1050 on 20040123, try with AAPL }var Bar: integer;
Bar := DateTimeToBar( 20040123, 1050 );if Bar = -1 then Print( 'This bar does not exist in the chart' )else if not EnterAtPrice( Bar, 22.65, 'Long', 'Buy' ) then Print('Buy failed on bar ' + IntToStr( Bar ) );
6.7 DateToBar
DateToBar( Date: integer ): integer;
RChartScripts RSimuScripts RPerfScripts XCMScripts
Description
Returns the Bar Number on the chart that corresponds to the specified Date value. Ifthere is no bar that corresponds to the specified date, the function returns -1.
Remarks
• Date is an integer value with the format yyyyMMdd, where yyyy is the year, MM is thetwo-digit month (01 through 12), and dd is the two-digit day (01 through 31,depending on the month).
• If Date is not a valid, "in range" value, a run-time error will result.
• DateToBar returns the Bar Number of the first bar of the specified Date in theintraday data.
Example
{ Highlight my birthday bars }var Y, DT, B: integer;for y := 1980 to 2020 do
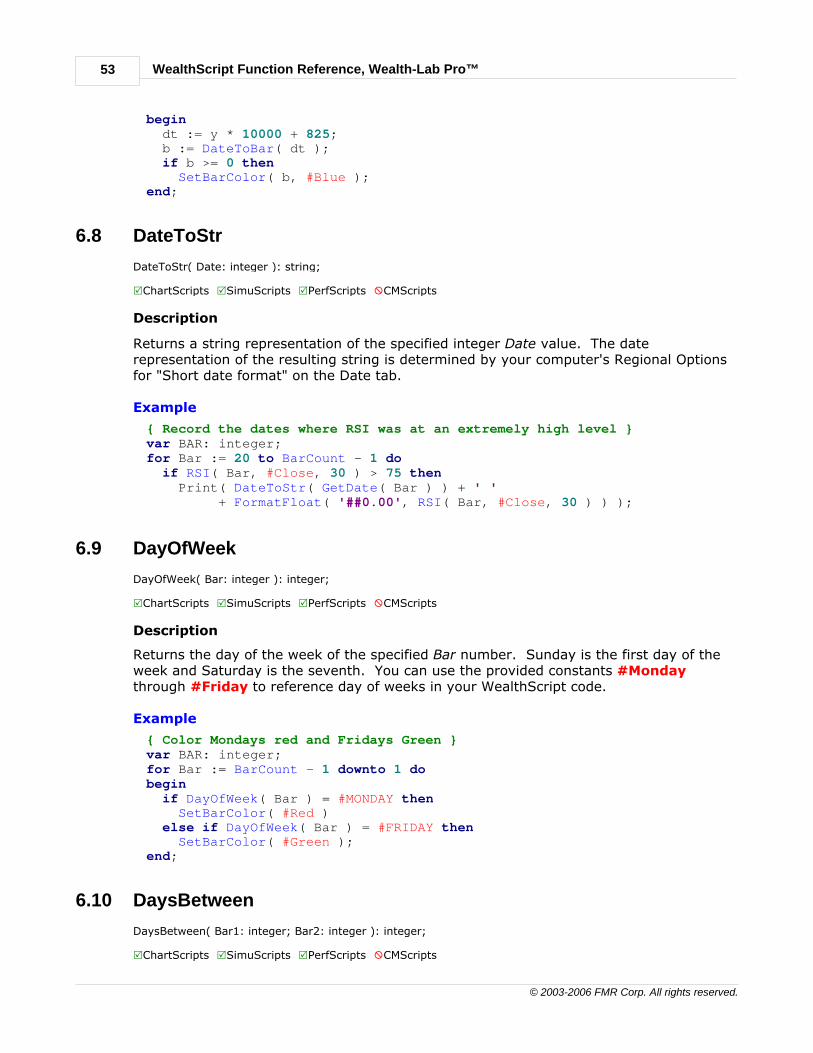
WealthScript Function Reference, Wealth-Lab Pro™53
© 2003-2006 FMR Corp. All rights reserved.
begin dt := y * 10000 + 825; b := DateToBar( dt ); if b >= 0 then SetBarColor( b, #Blue );end;
6.8 DateToStr
DateToStr( Date: integer ): string;
RChartScripts RSimuScripts RPerfScripts XCMScripts
Description
Returns a string representation of the specified integer Date value. The daterepresentation of the resulting string is determined by your computer's Regional Optionsfor "Short date format" on the Date tab.
Example
{ Record the dates where RSI was at an extremely high level }var BAR: integer;for Bar := 20 to BarCount - 1 do if RSI( Bar, #Close, 30 ) > 75 then Print( DateToStr( GetDate( Bar ) ) + ' ' + FormatFloat( '##0.00', RSI( Bar, #Close, 30 ) ) );
6.9 DayOfWeek
DayOfWeek( Bar: integer ): integer;
RChartScripts RSimuScripts RPerfScripts XCMScripts
Description
Returns the day of the week of the specified Bar number. Sunday is the first day of theweek and Saturday is the seventh. You can use the provided constants #Mondaythrough #Friday to reference day of weeks in your WealthScript code.
Example
{ Color Mondays red and Fridays Green }var BAR: integer;for Bar := BarCount - 1 downto 1 dobegin if DayOfWeek( Bar ) = #MONDAY then SetBarColor( #Red ) else if DayOfWeek( Bar ) = #FRIDAY then SetBarColor( #Green );end;
6.10 DaysBetween
DaysBetween( Bar1: integer; Bar2: integer ): integer;
RChartScripts RSimuScripts RPerfScripts XCMScripts

Date/Time Functions 54
© 2003-2006 FMR Corp. All rights reserved.
Description
Determines the number of Calendar Days (including weekends) between the twospecified bars numbers, Bar1 and Bar2.
Remarks
• DaysBetween returns a negative number of days if the date specified by Bar2 occursprior to the date of Bar1.
• See also: DaysBetweenDates
Example
var BAR, P, INBAR, OUTBAR, BARSINTRADE, DAYSINTRADE: integer;InstallProfitTarget( 6 );InstallStopLoss( 6 );for Bar := 20 to BarCount - 1 dobegin ApplyAutoStops( Bar ); if TurnUp( Bar, WMASeries( #Close, 20 ) ) then BuyAtMarket( Bar + 1, '' );end;if PositionCount > 0 thenbegin p := LastPosition; InBar := PositionEntryBar( p ); if PositionActive( p ) then OutBar := BarCount - 1 else OutBar := PositionExitBar( p );
BarsInTrade := OutBar - InBar + 1; DaysInTrade := DaysBetween( InBar, OutBar ) + 1; DrawLabel( 'The last trade was for ' + IntToStr( BarsInTrade ) + 'Bars', 0 ); DrawLabel( 'and ' + IntToStr( DaysInTrade ) + ' days', 0 );end;
6.11 DaysBetweenDates
DaysBetweenDates( Date1: integer; Date2: integer ): integer;
RChartScripts RSimuScripts RPerfScripts XCMScripts
Description
Determines the number of calendar days including weekends between the two specifieddates, Date1 and Date2, in yyyyMMdd (standard) format.
Remarks
• DaysBetweenDates returns a negative number of days if Date2 is chronologicallyprior to Date1.
• See also: DaysBetween
Example
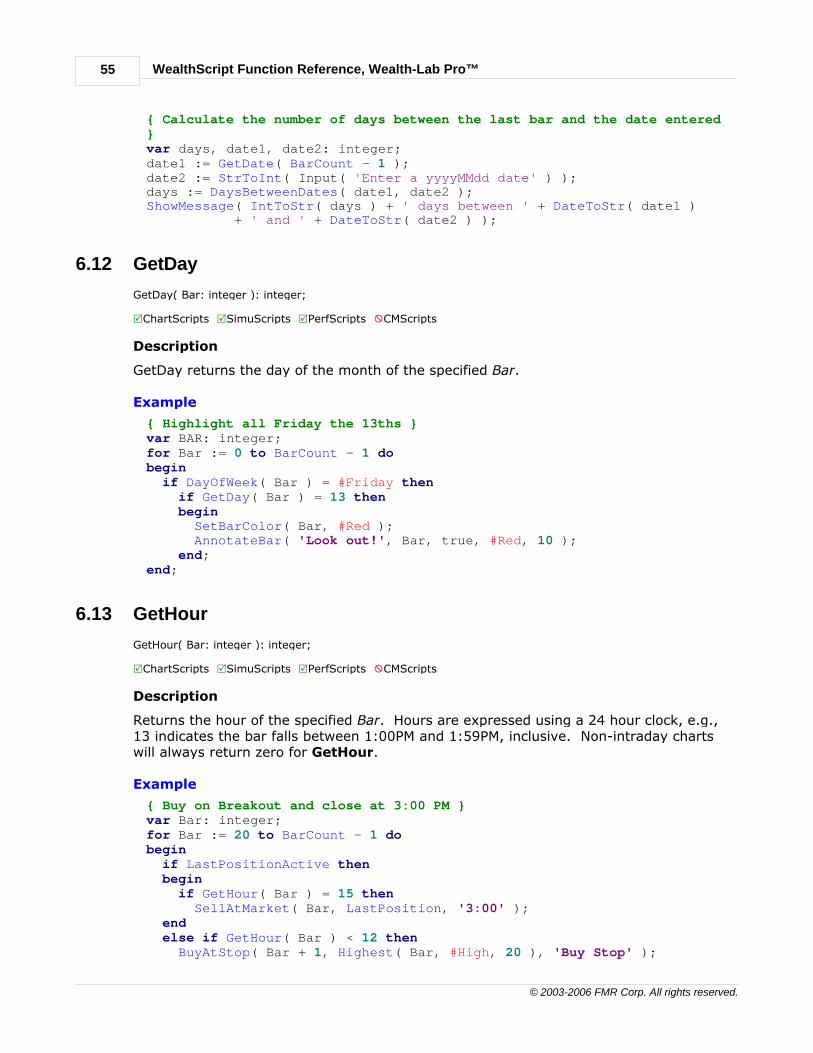
WealthScript Function Reference, Wealth-Lab Pro™55
© 2003-2006 FMR Corp. All rights reserved.
{ Calculate the number of days between the last bar and the date entered}var days, date1, date2: integer;date1 := GetDate( BarCount - 1 );date2 := StrToInt( Input( 'Enter a yyyyMMdd date' ) );days := DaysBetweenDates( date1, date2 );ShowMessage( IntToStr( days ) + ' days between ' + DateToStr( date1 ) + ' and ' + DateToStr( date2 ) );
6.12 GetDay
GetDay( Bar: integer ): integer;
RChartScripts RSimuScripts RPerfScripts XCMScripts
Description
GetDay returns the day of the month of the specified Bar.
Example
{ Highlight all Friday the 13ths }var BAR: integer;for Bar := 0 to BarCount - 1 dobegin if DayOfWeek( Bar ) = #Friday then if GetDay( Bar ) = 13 then begin SetBarColor( Bar, #Red ); AnnotateBar( 'Look out!', Bar, true, #Red, 10 ); end;end;
6.13 GetHour
GetHour( Bar: integer ): integer;
RChartScripts RSimuScripts RPerfScripts XCMScripts
Description
Returns the hour of the specified Bar. Hours are expressed using a 24 hour clock, e.g.,13 indicates the bar falls between 1:00PM and 1:59PM, inclusive. Non-intraday chartswill always return zero for GetHour.
Example
{ Buy on Breakout and close at 3:00 PM }var Bar: integer;for Bar := 20 to BarCount - 1 dobegin if LastPositionActive then begin if GetHour( Bar ) = 15 then SellAtMarket( Bar, LastPosition, '3:00' ); end else if GetHour( Bar ) < 12 then BuyAtStop( Bar + 1, Highest( Bar, #High, 20 ), 'Buy Stop' );

Date/Time Functions 56
© 2003-2006 FMR Corp. All rights reserved.
end;
6.14 GetMinute
GetMinute( Bar: integer ): integer;
RChartScripts RSimuScripts RPerfScripts XCMScripts
Description
Returns the minute of the specified Bar (0 to 59). Non-intraday bars will always returnzero for GetMinute.
Example
{ Color Intraday bars by minute }var Bar, n: integer;for Bar := 0 to BarCount - 1 dobegin n := ( GetMinute( Bar ) * 100 ) div 60; SetBarColor( Bar, n );end;
6.15 GetMonth
GetMonth( Bar: integer ): integer;
RChartScripts RSimuScripts RPerfScripts XCMScripts
Description
GetMonth returns the month at the specified Bar. Month values range from 1 to 12(January to December).
Example
{ We think February is an awful month for stocks }var Bar: integer;for Bar := 0 to BarCount - 1 dobegin if not LastPositionActive then if GetMonth( Bar ) = 2 then ShortAtMarket( Bar, 'Feb Blues' ); if LastPositionActive then if GetMonth( Bar ) = 3 then CoverAtMarket( Bar, LastPosition, 'Exit Short' );end;
6.16 GetYear
GetYear( Bar: integer ): integer;
RChartScripts RSimuScripts RPerfScripts XCMScripts
Description
GetYear returns the year at the specified Bar.

WealthScript Function Reference, Wealth-Lab Pro™57
© 2003-2006 FMR Corp. All rights reserved.
Example
{ Change our tactics for the new millenium }var Bar: integer;for Bar := 0 to BarCount - 1 dobegin if GetYear( Bar ) < 2000 then begin { .. old tactics .. } end else begin { .. new millenium tactics .. } end;end;
6.17 IsLeapYear
IsLeapYear( Year: integer ): boolean;
RChartScripts RSimuScripts RPerfScripts RCMScripts
Description
Returns boolean true if the specified calendar Year is a leap year. Returns false in allother cases.
Remarks
• IsLeapYear( Year ) simply returns the same result as ( Year Mod 4 = 0 ).
Example
var Bar: integer;
for Bar := 100 to BarCount - 1 dobegin if LastPositionActive then begin if CrossUnder( Bar, #Close, SMASeries( #Close, 100 ) ) then SellAtMarket( Bar + 1, LastPosition, '' ); end else begin if not IsLeapYear( GetYear( Bar ) ) then // Take leap years off if CrossOver( Bar, #Close, SMASeries( #Close, 100 ) ) then BuyAtMarket( Bar + 1, '' ); end;end;
6.18 LastBar
LastBar( Bar: integer ): boolean;
RChartScripts RSimuScripts XPerfScripts XCMScripts
Description
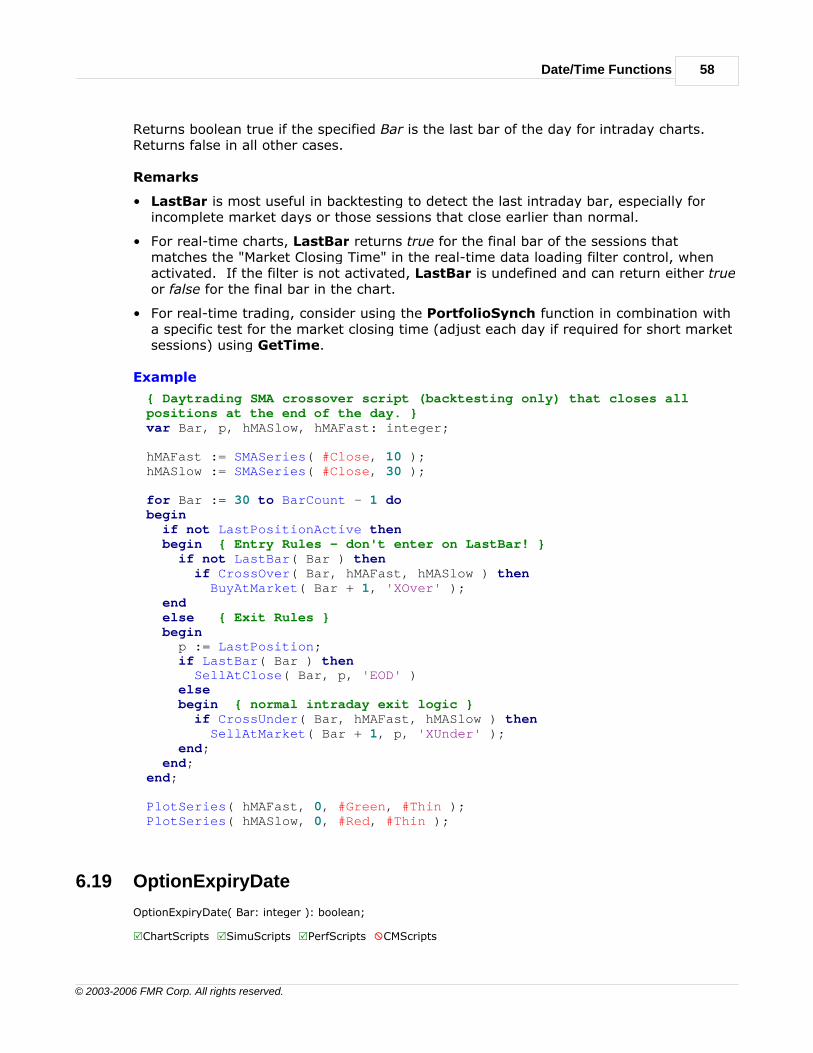
Date/Time Functions 58
© 2003-2006 FMR Corp. All rights reserved.
Returns boolean true if the specified Bar is the last bar of the day for intraday charts.Returns false in all other cases.
Remarks
• LastBar is most useful in backtesting to detect the last intraday bar, especially forincomplete market days or those sessions that close earlier than normal.
• For real-time charts, LastBar returns true for the final bar of the sessions thatmatches the "Market Closing Time" in the real-time data loading filter control, whenactivated. If the filter is not activated, LastBar is undefined and can return either trueor false for the final bar in the chart.
• For real-time trading, consider using the PortfolioSynch function in combination witha specific test for the market closing time (adjust each day if required for short marketsessions) using GetTime.
Example
{ Daytrading SMA crossover script (backtesting only) that closes allpositions at the end of the day. }var Bar, p, hMASlow, hMAFast: integer;
hMAFast := SMASeries( #Close, 10 );hMASlow := SMASeries( #Close, 30 );
for Bar := 30 to BarCount - 1 dobegin if not LastPositionActive then begin { Entry Rules - don't enter on LastBar! } if not LastBar( Bar ) then if CrossOver( Bar, hMAFast, hMASlow ) then BuyAtMarket( Bar + 1, 'XOver' ); end else { Exit Rules } begin p := LastPosition; if LastBar( Bar ) then SellAtClose( Bar, p, 'EOD' ) else begin { normal intraday exit logic } if CrossUnder( Bar, hMAFast, hMASlow ) then SellAtMarket( Bar + 1, p, 'XUnder' ); end; end;end;
PlotSeries( hMAFast, 0, #Green, #Thin );PlotSeries( hMASlow, 0, #Red, #Thin );
6.19 OptionExpiryDate
OptionExpiryDate( Bar: integer ): boolean;
RChartScripts RSimuScripts RPerfScripts XCMScripts

WealthScript Function Reference, Wealth-Lab Pro™59
© 2003-2006 FMR Corp. All rights reserved.
Description
Returns boolean true if the specified Bar falls on an option expiration date. Theexpiration date for all listed stock options in the U.S. is the third Friday of the expirationmonth.
Note: If the normal Friday expiration date falls on a holiday, the OptionExpiryDate isthe preceding Thursday.
Example
{ Annotate Option Expiry Dates on the Chart }var Bar: integer;for Bar := 0 to BarCount - 1 do if OptionExpiryDate( Bar ) then begin DrawCircle( 4, 0, Bar, PriceOpen( Bar ), #Navy, #Thick ); DrawCircle( 4, 0, Bar, PriceClose( Bar ), #Blue, #Thick ); end;
6.20 StrToDate
StrToDate( Value: string ): integer;
RChartScripts RSimuScripts RPerfScripts XCMScripts
Description
Converts the string parameter Value into an integer representing a WealthScript datevalue, which has a format of YYYYMMDD. The Value string must be in your computer'sshort date format, otherwise a run-time error will result.
Example
{ This was a bad day }var dt, Bar: integer;dt := StrToDate( '10/19/1987' );Bar := DateToBar( dt );if Bar > -1 then SetBarColor( Bar, #Red );
6.21 StrToTime
StrToTime( Value: string ): integer;
RChartScripts RSimuScripts RPerfScripts XCMScripts
Description
Converts the string parameter Value into an integer representing a WealthScript timevalue, which is an integer having the format hhmm. The Value string must be a validtime format, e.g., '14:30', '2:30 PM', etc., otherwise a run-time error will result.
Example
{ Only take action after 2:00 PM }var Bar: integer;for Bar := 0 to BarCount - 1 do

Date/Time Functions 60
© 2003-2006 FMR Corp. All rights reserved.
begin { ... } if GetTime( Bar ) > StrToTime( '2:00 PM' ) then begin end;end;
6.22 TimeToStr
TimeToStr( Time: integer ): string;
RChartScripts RSimuScripts RPerfScripts XCMScripts
Description
Converts the specified integer Time value into a string for display purposes. The timerepresentation of the resulting string is determined by your computer's Regional Optionsfor "Time format" on the Time tab.
Example
{ Draw the time of the last bar on the chart }DrawLabel( TimeToStr( GetTime( BarCount - 1 ) ), 0 );

WealthScript Function Reference, Wealth-Lab Pro™61
© 2003-2006 FMR Corp. All rights reserved.
7 File Access Functions
7.1 Overview
The File Access category of functions give you the ability to easily work with data fromexternal ASCII text files or generate data from within your ChartScripts to export data forlater review.
7.2 FileClear
FileClear( File: integer );
RChartScripts RSimuScripts RPerfScripts XCMScripts
Description
Clears the contents of the file handle specified in the File parameter. Use this function ifyou've written lines to file and want to clear the existing contents and start fresh.
Note: File handles are returned by either the FileOpen or FileCreate functions.
7.3 FileClose
FileClose( File: integer );
RChartScripts RSimuScripts RPerfScripts XCMScripts
Description
Explicitly closes the selected File and removes the resources allocated by the file. TheFile Handle represented by the File parameter is no longer valid following this call, andshould not be used in subsequent File Access functions.
Note: File handles are returned by either the FileOpen or FileCreate functions.
Files are automatically closed after the script completes processing. During WatchListScans or $imulations, files are automatically closed after the complete Scan or$imulation. Consequently, when opening a file using FileCreate, each symbol run duringa Scan or $imulation can append lines of data to a single output file without deleting thefile that was created at the beginning of the Scan or $imulation.
7.4 FileCreate
FileCreate( FileName: string ): integer;
RChartScripts RSimuScripts RPerfScripts XCMScripts

File Access Functions 62
© 2003-2006 FMR Corp. All rights reserved.
Description
Creates a new operating system file with the specified FileName. A file handle is returnedby the function call. Use this file handle in subsequent calls to FileWrite. If a file withthe specified file name already exists, the file is deleted and a new one created in itsplace.
FileName A string representing the full path location and name for the new file. If apath is not specified, as in the example below, the file will be created in themain Wealth-Lab Pro directory.
Example
{ Create a file to store analysis results }var f: integer;f := FileCreate( GetSymbol + '.txt' );
7.5 FileEOF
FileEOF( File: integer ): boolean;
RChartScripts RSimuScripts RPerfScripts XCMScripts
Description
Returns true if the specified File is currently at "end of file".
Example
{ Dump contents of Win.ini }var F: integer;f := FileOpen( 'c:\Windows\win.ini' );while not FileEOF( f ) do Print( FileRead( f ) );
7.6 FileFlush
FileFlush( File: integer );
RChartScripts RSimuScripts RPerfScripts XCMScripts
Description
Normally, data written to a file using FileWrite isn't physically written to the underlyingoperating system file until after the script completes. You can use FileFlush to cause thecontents of File, the file handle, to be written to the operating system file immediately.
7.7 FileOpen
FileOpen( FileName: string ): integer;
RChartScripts RSimuScripts RPerfScripts XCMScripts
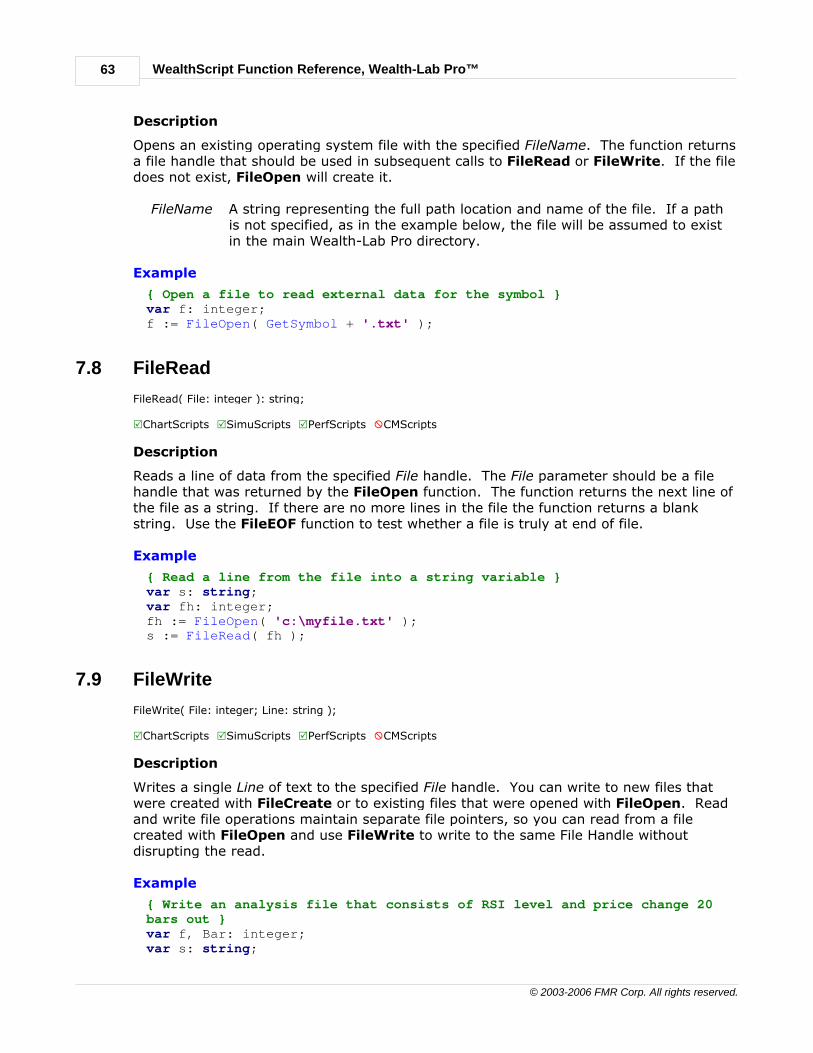
WealthScript Function Reference, Wealth-Lab Pro™63
© 2003-2006 FMR Corp. All rights reserved.
Description
Opens an existing operating system file with the specified FileName. The function returnsa file handle that should be used in subsequent calls to FileRead or FileWrite. If the filedoes not exist, FileOpen will create it.
FileName A string representing the full path location and name of the file. If a pathis not specified, as in the example below, the file will be assumed to existin the main Wealth-Lab Pro directory.
Example
{ Open a file to read external data for the symbol }var f: integer;f := FileOpen( GetSymbol + '.txt' );
7.8 FileRead
FileRead( File: integer ): string;
RChartScripts RSimuScripts RPerfScripts XCMScripts
Description
Reads a line of data from the specified File handle. The File parameter should be a filehandle that was returned by the FileOpen function. The function returns the next line ofthe file as a string. If there are no more lines in the file the function returns a blankstring. Use the FileEOF function to test whether a file is truly at end of file.
Example
{ Read a line from the file into a string variable }var s: string;var fh: integer;fh := FileOpen( 'c:\myfile.txt' );s := FileRead( fh );
7.9 FileWrite
FileWrite( File: integer; Line: string );
RChartScripts RSimuScripts RPerfScripts XCMScripts
Description
Writes a single Line of text to the specified File handle. You can write to new files thatwere created with FileCreate or to existing files that were opened with FileOpen. Readand write file operations maintain separate file pointers, so you can read from a filecreated with FileOpen and use FileWrite to write to the same File Handle withoutdisrupting the read.
Example
{ Write an analysis file that consists of RSI level and price change 20bars out }var f, Bar: integer;var s: string;
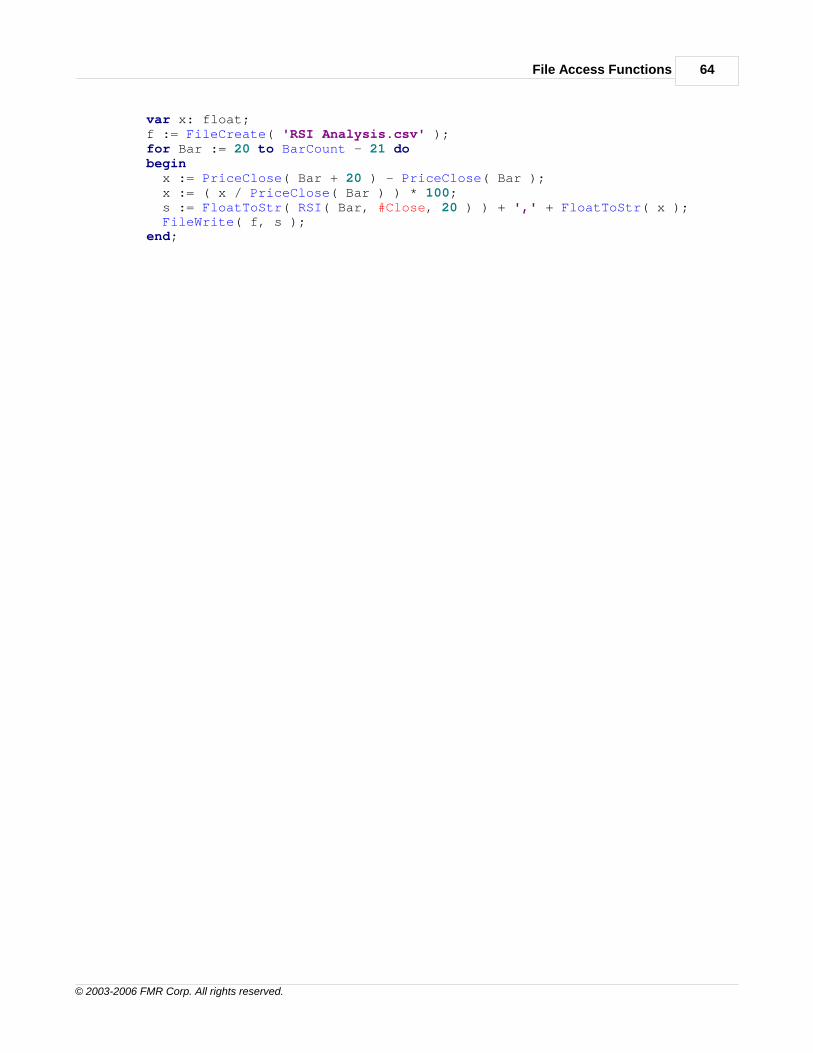
File Access Functions 64
© 2003-2006 FMR Corp. All rights reserved.
var x: float;f := FileCreate( 'RSI Analysis.csv' );for Bar := 20 to BarCount - 21 dobegin x := PriceClose( Bar + 20 ) - PriceClose( Bar ); x := ( x / PriceClose( Bar ) ) * 100; s := FloatToStr( RSI( Bar, #Close, 20 ) ) + ',' + FloatToStr( x ); FileWrite( f, s );end;

WealthScript Function Reference, Wealth-Lab Pro™65
© 2003-2006 FMR Corp. All rights reserved.
8 Fundamental Data Access Functions
8.1 Overview
The Fundamental Data Access functions allow you to access Global Industry ClassificationStandard (GICS) database information as well as other time series fundamental datafrom a ChartScript. The GICS database provides an 8-digit code that classifies everysecurity traded, and the code is divided into four sections (2 digits each):
· Sector· Industry Group· Industry· Sub-Industry
This structure provides a hierarchy which can be used as a basis for analyzing securitiesin various industries. Wealth-Lab Pro accesses GICS data via AT Pro and creates localtables for quick look up. See the User Guide, Data Access chapter for details onaccessing and updating local GICS data. For a complete map of the GICS structure, referto the Standard & Poor's website.
Other numeric corporate fundamental elements can be accessed in the context of a PriceSeries. Consequently, you can use the WealthScript technical analysis techniques withwhich you are already familiar to analyze fundamental data. The following item itemsare currently available to you after having completed a regular data update of yourFidelity static DataSources.
Item (string) Short Description
'accounts_payable' Accounts Payable'adjustment_factor' Adjust Factor, cumulative by ex-
date'assets' Assets - Total'cash' Cash and Cash Equivalents -
increase (decrease)'cash_dividends' Cash Dividends'common_shares_outstanding' Common Shares Outstanding -
Company'common_shares_used_to_calculate_eps_diluted' Common Shares Used to Calculate
Earning per Share Diluted'dividend' w Per share cash dividend value

Fundamental Data Access Functions 66
© 2003-2006 FMR Corp. All rights reserved.
'ebit' Earnings before Interest and Taxes(EBIT) annual
'employee' Employees'fiscal_quarter' Fiscal Quarter'fiscal_year' Fiscal Year'goodwill' Goodwill'interest_expense' Interest Expense'liabilities' Liabilities - Total'long_term_debt' Debt (Long-Term) - Total'net_income' Net Income (Loss)'operating_activities' Operating Activities - Net Cash
Flow'operating_income_before_depreciation' Operating Income Before
Depreciation (EBITDA)'pretax_income' Pretax Income'property_plant_and_equipment' Property Plant and Equipment'research_and_development_expense' Research and Development Expense'sales_turnover' Sales (Net)'split' w Split value (ratio)'stock_compensation_expense' Stock Compensation Expense'stockholder_equity' Stockholders' Equity - Total'total_inventories' Total Inventories'total_receivables' Total Receivables
'option_expiry' Final trading day before optionexpiry
'triple_witching' Final trading day before triplewitching
w These items are reported by ex-date and do not normally coincide with aquarterly report.
Notes:
1. Initially, fundamental data includes approximately 6 years of annual data and 24quarters of quarterly data.
2. The Item parameter is a case sensitive string and must be specified exactly asdescribed in the Fundamental Data Definitions and Ratio Calculations Guide.
3. 'option_expiry' and 'triple_witching' are items associated with the options calendar,which provides the ability to lookup the date of the final trading day prior to optionexpiry from 1980 to 2020, inclusive.
Each company-related item returns values as reported in the quarterly/annual report andare updated on the Report Date of Quarterly Earnings. Fundamental values are not back-adjusted for revisions. The functions GetFundamentalBar andGetFundamentalNextBar allow you to determine the report dates as explained in theirdefinitions.
The following economic data items are also available. Any of the items can be accessedregardless of the current primary data series:
73
75
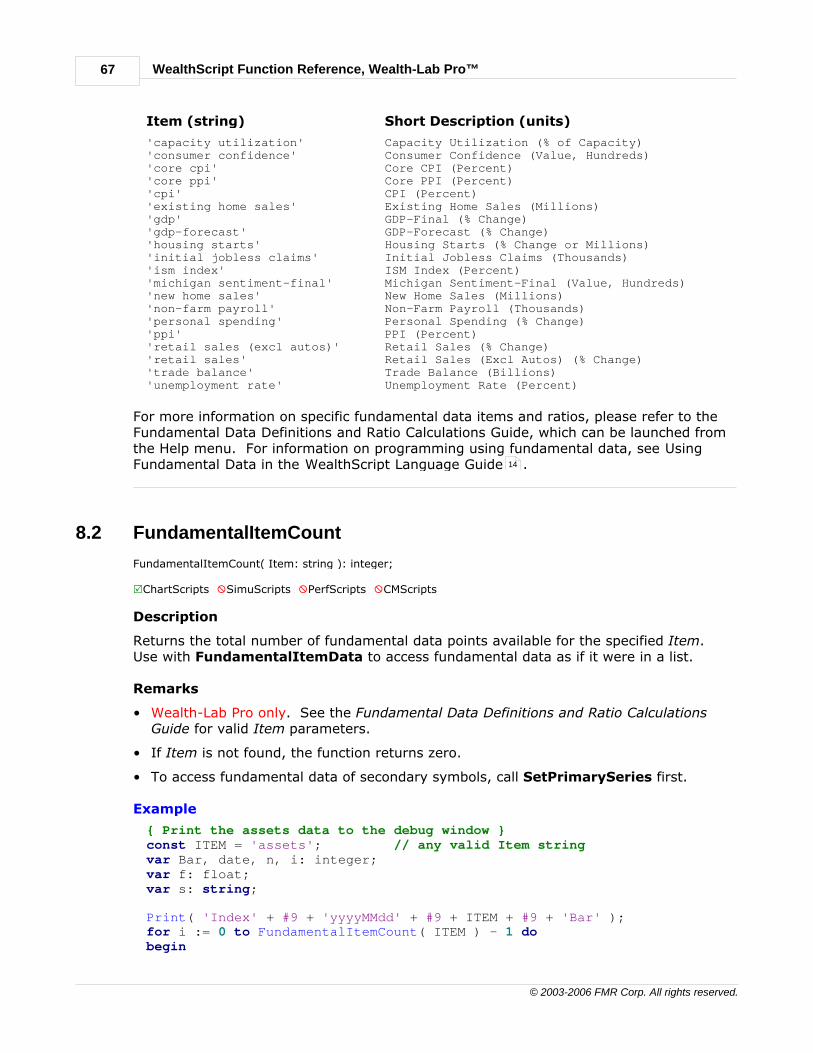
WealthScript Function Reference, Wealth-Lab Pro™67
© 2003-2006 FMR Corp. All rights reserved.
Item (string) Short Description (units)
'capacity utilization' Capacity Utilization (% of Capacity)'consumer confidence' Consumer Confidence (Value, Hundreds)'core cpi' Core CPI (Percent)'core ppi' Core PPI (Percent)'cpi' CPI (Percent)'existing home sales' Existing Home Sales (Millions)'gdp' GDP-Final (% Change)'gdp-forecast' GDP-Forecast (% Change)'housing starts' Housing Starts (% Change or Millions)'initial jobless claims' Initial Jobless Claims (Thousands)'ism index' ISM Index (Percent)'michigan sentiment-final' Michigan Sentiment-Final (Value, Hundreds)'new home sales' New Home Sales (Millions)'non-farm payroll' Non-Farm Payroll (Thousands)'personal spending' Personal Spending (% Change)'ppi' PPI (Percent)'retail sales (excl autos)' Retail Sales (% Change)'retail sales' Retail Sales (Excl Autos) (% Change)'trade balance' Trade Balance (Billions)'unemployment rate' Unemployment Rate (Percent)
For more information on specific fundamental data items and ratios, please refer to theFundamental Data Definitions and Ratio Calculations Guide, which can be launched fromthe Help menu. For information on programming using fundamental data, see UsingFundamental Data in the WealthScript Language Guide .
8.2 FundamentalItemCount
FundamentalItemCount( Item: string ): integer;
RChartScripts XSimuScripts XPerfScripts XCMScripts
Description
Returns the total number of fundamental data points available for the specified Item.Use with FundamentalItemData to access fundamental data as if it were in a list.
Remarks
• Wealth-Lab Pro only. See the Fundamental Data Definitions and Ratio CalculationsGuide for valid Item parameters.
• If Item is not found, the function returns zero.
• To access fundamental data of secondary symbols, call SetPrimarySeries first.
Example
{ Print the assets data to the debug window }const ITEM = 'assets'; // any valid Item stringvar Bar, date, n, i: integer;var f: float;var s: string;
Print( 'Index' + #9 + 'yyyyMMdd' + #9 + ITEM + #9 + 'Bar' );for i := 0 to FundamentalItemCount( ITEM ) - 1 dobegin
14

Fundamental Data Access Functions 68
© 2003-2006 FMR Corp. All rights reserved.
FundamentalItemData( ITEM, i, date, f, Bar, s ); Print( IntToStr( i ) + #9 + IntToStr( date ) + #9 + FloatToStr( f ) +#9 + IntToStr( Bar ) );end;
8.3 FundamentalItemData
FundamentalItemData( Item: string; Index: integer; var Date: integer; var Value: float; var Bar: integer; varData: string );
RChartScripts XSimuScripts XPerfScripts XCMScripts
Description
Returns the specific Date, Value, Bar number (or -1 if off the chart) and Data string (ifapplicable) for the specified fundamental data Item and Index. FundamentalItemDatais a versatile function that allows you to access any type of fundamental data withoutrequiring that data to be in the range of the current chart. After accessing theFundamentalItemCount for an item, you can enumerate through the fundamentalItem's data.
Item A valid fundamental item string expression (e.g., 'assets', 'option_expiry',etc.)
Index Index of the data item. The range of the index is from 0 toFundamentalItemCount( Item: string ) - 1.
Note! Data are passed by reference using the following parameters. You must declareproperly-typed variables to pass to this function as shown in the example.Following a call to FundamentalItemData, your variables will contain datacorresponding to the Item and Index specified for the current primary symbol.
Date A date integer in standard yyyyMMdd format; 0 if not used.
Value A floating point data value associated with the fundamental item/index; 0if not used.
Bar Returns the Bar number in the current chart associated with thefundamental item/index; -1 if "off the chart".
Data String data associated with the fundamental item/index; an empty stringif not used.
Remarks
• Wealth-Lab Pro only. See the Fundamental Data Definitions and Ratio CalculationsGuide for valid Item parameters.
• If Item is not found, the Date and Value fields return 0, Bar returns -1, and Data is anempty string for all values of Index.
• For an Item that returns a Date only (such as 'option_expiry' and 'triple_witching'),Value will be 1.0.
• To access fundamental data of secondary symbols, call SetPrimarySeries first.
• The Data string parameter is not currently used for any fundamental Item andtherefore always returns an empty string. Regardless, you must declare a string

WealthScript Function Reference, Wealth-Lab Pro™69
© 2003-2006 FMR Corp. All rights reserved.
variable and pass it to FundamentalItemData.
Example
{ Annotate triple witching fundamental data item bars }var Bar, dt, i: integer;var s: string;var f: float;
for i := 0 to FundamentalItemCount( 'triple_witching' ) - 1 dobegin FundamentalItemData( 'triple_witching', i, dt, f, Bar, s ); if Bar >= 0 then begin SetBarColor( Bar, #Purple ); AnnotateBar( 'TW', Bar, true, #Purple, 8 ); end;end;
8.4 FundamentalPriceSeries
FundamentalPriceSeries( Item: string ): integer;
RChartScripts XSimuScripts XPerfScripts XCMScripts
Description
Returns a Price Series populated from the specified fundamental data Item. Theresultant fundamental Price Series can be plotted and manipulated like any other.
Remarks
• Wealth-Lab Pro only. See the Fundamental Data Definitions and Ratio CalculationsGuide for valid Item parameters.
• If Item is not found, the function returns a Price Series of all-zero values without error.(This is the same result as calling CreateSeries.)
• If a [quarterly] report for Item exists prior to the date of the first bar in the chart,FundamentalPriceSeries will begin loading the value from the most-recent report onor before the date of the first bar. Otherwise, the series will contain zeroes up to thebar that synchronizes with the first report date.
• To access fundamental data of secondary symbols, call SetPrimarySeries first.
Example
var hA, hL, fp: integer;fp := CreatePane( 100, true, true );hA := FundamentalPriceSeries( 'assets' );PlotSeriesLabel( hA, fp, #Green, #ThickHist, 'Assets' );hL := FundamentalPriceSeries( 'liabilities' );PlotSeriesLabel( hL, fp, #Red, #ThickHist, 'Liabilities' );

Fundamental Data Access Functions 70
© 2003-2006 FMR Corp. All rights reserved.
8.5 FundamentalPriceSeriesAggregate
FundamentalPriceSeriesAggregate( Item: string; Quarters: integer ): integer;
RChartScripts XSimuScripts XPerfScripts XCMScripts
Description
Returns a Price Series of fundamental data containing the sum of values for the specifiednumber of Quarters. This function is used to return a series containing an aggregate ofthe rolling 4 quarters of earnings for the calculation of the P/E ratio, for example.
Remarks
• Wealth-Lab Pro only. See the Fundamental Data Definitions and Ratio CalculationsGuide for valid Item parameters.
• If Item is not found, the function returns a Price Series of all-zero values without error.This is the same result as calling CreateSeries.
• FundamentalPriceSeriesAggregate returns 0 value for all bars if the full number ofspecified Quarters are not available, which is typical behavior at the beginning of thefundamental series.
• To access fundamental data of secondary symbols, call SetPrimarySeries first.
• Economic items can be aggregated by their respective period, which is generallyMonthly (not Quarters as indicated by the parameter name).
Example
{ Calculate and plot the P/E ratio }var Income, Shares, PE, PEPane: integer;Income := FundamentalPriceSeriesAggregate( 'net_income', 4 );Shares := FundamentalPriceSeries( 'common_shares_outstanding' );PE := DivideSeries( #Close, DivideSeries( Income, Shares ) );PEPane := CreatePane( 50, true, true );PlotSeriesLabel( PE, PEPane, #Navy, #Thick, 'P/E Ratio' );
8.6 FundamentalPriceSeriesAnnual
FundamentalPriceSeriesAnnual( Item: string ): integer;
RChartScripts XSimuScripts XPerfScripts XCMScripts
Description
Returns a Fundamental Data Price Series that sums the 4 quarters of the Fiscal Year.This function is used in the ratio rules that are based on annual growth rates.
Remarks
• Wealth-Lab Pro only. See the Fundamental Data Definitions and Ratio CalculationsGuide for valid Item parameters.
• If Item is not found, the function returns a Price Series of all-zero values without error.This is the same result as calling CreateSeries.
• To access fundamental data of secondary symbols, call SetPrimarySeries first.

WealthScript Function Reference, Wealth-Lab Pro™71
© 2003-2006 FMR Corp. All rights reserved.
• Not valid for use with economic data items.
Example
{ Calculate and plot the percentage annual earnings growth }var Income, Income2, Price, EG, EGPane: integer;Income := FundamentalPriceSeriesAnnual( 'net_income' );Income2 := FundamentalPriceSeriesAnnualOffset( 'net_income', 1 );EG := MultiplySeriesValue( SubtractSeriesValue( DivideSeries( Income, Income2 ), 1 ), 100 );EGPane := CreatePane( 50, true, true );PlotSeriesLabel( EG, EGPane, #Green, #ThickHist, 'Annual Earnings Growth%' );
8.7 FundamentalPriceSeriesAnnualOffset
FundamentalPriceSeriesAnnualOffset( Item: string; Years: integer ): integer;
RChartScripts XSimuScripts XPerfScripts XCMScripts
Description
Returns a Fundamental Data Price Series that sums the 4 quarters of a previous FiscalYear. The number of years to look back is specified in the Years parameter, which isalways a positive integer. This function is used in the ratio rules that are based onannual growth rates.
Remarks
• Wealth-Lab Pro only. See the Fundamental Data Definitions and Ratio CalculationsGuide for valid Item parameters.
• If Item is not found, the function returns a Price Series of all-zero values without error.This is the same result as calling CreateSeries.
• To access fundamental data of secondary symbols, call SetPrimarySeries first.
• Not valid for use with economic data items.
Example
{ Calculate and plot the percentage annual earning growth }var Income, Income2, Price, EG, EGPane: integer;Income := FundamentalPriceSeriesAnnual( 'net_income' );Income2 := FundamentalPriceSeriesAnnualOffset( 'net_income', 1 );EG := MultiplySeriesValue( SubtractSeriesValue( DivideSeries( Income, Income2 ), 1 ), 100 );EGPane := CreatePane( 50, true, true );PlotSeriesLabel( EG, EGPane, #Green, #ThickHist, 'Annual Earnings Growth%' );
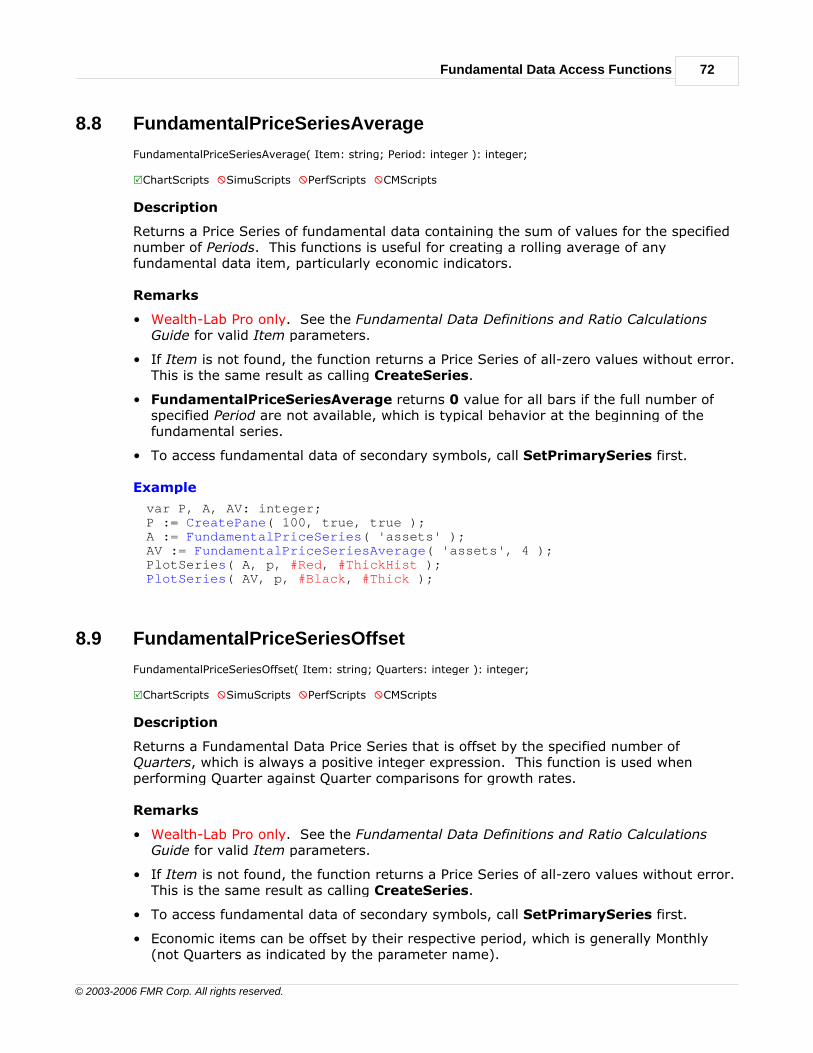
Fundamental Data Access Functions 72
© 2003-2006 FMR Corp. All rights reserved.
8.8 FundamentalPriceSeriesAverage
FundamentalPriceSeriesAverage( Item: string; Period: integer ): integer;
RChartScripts XSimuScripts XPerfScripts XCMScripts
Description
Returns a Price Series of fundamental data containing the sum of values for the specifiednumber of Periods. This functions is useful for creating a rolling average of anyfundamental data item, particularly economic indicators.
Remarks
• Wealth-Lab Pro only. See the Fundamental Data Definitions and Ratio CalculationsGuide for valid Item parameters.
• If Item is not found, the function returns a Price Series of all-zero values without error.This is the same result as calling CreateSeries.
• FundamentalPriceSeriesAverage returns 0 value for all bars if the full number ofspecified Period are not available, which is typical behavior at the beginning of thefundamental series.
• To access fundamental data of secondary symbols, call SetPrimarySeries first.
Example
var P, A, AV: integer;P := CreatePane( 100, true, true );A := FundamentalPriceSeries( 'assets' );AV := FundamentalPriceSeriesAverage( 'assets', 4 );PlotSeries( A, p, #Red, #ThickHist );PlotSeries( AV, p, #Black, #Thick );
8.9 FundamentalPriceSeriesOffset
FundamentalPriceSeriesOffset( Item: string; Quarters: integer ): integer;
RChartScripts XSimuScripts XPerfScripts XCMScripts
Description
Returns a Fundamental Data Price Series that is offset by the specified number ofQuarters, which is always a positive integer expression. This function is used whenperforming Quarter against Quarter comparisons for growth rates.
Remarks
• Wealth-Lab Pro only. See the Fundamental Data Definitions and Ratio CalculationsGuide for valid Item parameters.
• If Item is not found, the function returns a Price Series of all-zero values without error.This is the same result as calling CreateSeries.
• To access fundamental data of secondary symbols, call SetPrimarySeries first.
• Economic items can be offset by their respective period, which is generally Monthly(not Quarters as indicated by the parameter name).

WealthScript Function Reference, Wealth-Lab Pro™73
© 2003-2006 FMR Corp. All rights reserved.
Example
{ Calculate and plot the annual quarter over quarter percentage earningsgrowth }var Income, Income2, EG, EGPane: integer;Income := FundamentalPriceSeries( 'net_income' );Income2 := FundamentalPriceSeriesOffset( 'net_income', 4 );EG := MultiplySeriesValue( SubtractSeriesValue( DivideSeries( Income, Income2 ), 1 ), 100 );EGPane := CreatePane( 50, true, true );PlotSeriesLabel( EG, EGPane, #Green, #ThickHist, 'Earnings Growth % Over4 Quarters' );
8.10 GetFundamentalBar
GetFundamentalBar( Bar: integer; Item: string ): integer;
RChartScripts XSimuScripts XPerfScripts XCMScripts
Description
Returns the bar number on which the most current fundamental data Item was reportedat the specified Bar. The return value can then be passed as the next Bar argument toobtain the most recent "nth" fundamental data reported as shown in the example belowor passed into GetFundamentalValue to return the value being reported.
Note! The functions GetFundamentalBar/Detail/NextBar/Value are slow to executeand their use should be avoided in BarCount loops without use of optimizationcode, like that which follows. Here, we only access the 'assets' value when a newquarterly report is detected.
var Bar, FQ: integer;FQ := FundamentalPriceSeries( 'fiscal_quarter' );
for Bar := 1 to BarCount - 1 do if @FQ[Bar] <> @FQ[Bar - 1] then begin SetBarColor( Bar, #Fuchsia ); AnnotateBar( FormatFloat( '0', GetFundamentalValue( Bar, 'assets' )
), Bar, true, #Black, 8 ); end;
Remarks
• Wealth-Lab Pro only. See the Fundamental Data Definitions and Ratio CalculationsGuide for valid Item parameters.
• GetFundamentalBar returns the -1 for the following conditions:
1. Item is not found (may be misspelled or have incorrect case), or,2. a fundamental report does not exist for Item on or before Bar, or,3. a fundamental report exists, but the bar for its date is missing or not loaded in the
chart.

Fundamental Data Access Functions 74
© 2003-2006 FMR Corp. All rights reserved.
• To access fundamental data of secondary symbols, call SetPrimarySeries first.
Example
var Bar, fb, fb2, fd: integer;
Bar := BarCount - 1;fb := GetFundamentalBar( Bar, 'assets' );if fb >= 0 thenbegin fd := GetDate( fb ); DrawLabel( 'Last Report Date is: ' + DateToStr( fd ), 0 );end;
fb2 := GetFundamentalBar( fb - 1, 'assets' );if fb2 >= 0 thenbegin fd := GetDate( fb2 ); DrawLabel( 'Previous Report Date is: ' + DateToStr( fd ), 0 );end;
8.11 GetFundamentalIndex
GetFundamentalIndex( Bar: integer; Item: string ): integer;
RChartScripts XSimuScripts XPerfScripts XCMScripts
Description
Returns the index number of the fundamental Item that relates to the value at thespecified Bar. You can then use this index number to easily get the next futurefundamental item, for example to find the next Options Expiry date or split that occursafter the last bar of the chart using FundamentalItemData.
Remarks
• Wealth-Lab Pro only. See the Fundamental Data Definitions and Ratio CalculationsGuide for valid Item parameters.
• If Item is not found, the function returns zero.
• To access fundamental data of secondary symbols, call SetPrimarySeries first.
Example
{ Identifies next option expiry date }function NextOptionExpiry( Bar: integer ): integer;var n, dt: integer; value: float; s: string;begin const OE = 'option_expiry'; n := GetFundamentalIndex( Bar, OE ); if ( n >= 0 ) and ( n <= FundamentalItemCount( OE ) - 1 ) then begin FundamentalItemData( OE, n + 1, dt, value, Bar, s ); Result := dt;

WealthScript Function Reference, Wealth-Lab Pro™75
© 2003-2006 FMR Corp. All rights reserved.
end;end;
// Show the date of the last trading day before the next option expiry.var NOE: integer = NextOptionExpiry( BarCount - 1 );DrawLabel( 'Last trading day before next option expiry: ' + DateToStr(NOE ), 0 );DrawLabel( 'Calendar days to go: ' + IntToStr( DaysBetweenDates(GetDate( BarCount - 1 ), NOE ) ), 0 );
8.12 GetFundamentalNextBar
GetFundamentalNextBar( Bar: integer; Item: string ): integer;
RChartScripts XSimuScripts XPerfScripts XCMScripts
Description
Returns the bar number of the next, future fundamental data item reported relative tothe specified Bar. The resulting bar number can then be passed intoGetFundamentalValue to return the value being reported. Use this function toanticipate future events that have been announced as of the Bar specified. For example,stock splits are often announced several weeks before the ex-date, and this informationcan be used for future action.
Note! The functions GetFundamentalBar/Detail/NextBar/Value are slow to executeand their use should be avoided in BarCount loops without use of optimizationcode, like that which follows. Here, we only access the 'assets' value when a newquarterly report is detected.
var Bar, FQ: integer;FQ := FundamentalPriceSeries( 'fiscal_quarter' );
for Bar := 1 to BarCount - 1 do if @FQ[Bar] <> @FQ[Bar - 1] then begin SetBarColor( Bar, #Fuchsia ); AnnotateBar( FormatFloat( '0', GetFundamentalValue( Bar, 'assets' )
), Bar, true, #Black, 8 ); end;
Remarks
• Wealth-Lab Pro only. See the Fundamental Data Definitions and Ratio CalculationsGuide for valid Item parameters.
• GetFundamentalNextBar returns the -1 for the following conditions:
1. Item is not found (may be misspelled or have incorrect case), or,2. a fundamental report does not exist for Item on or after Bar, or,3. a fundamental report exists, but the bar for its date is missing or not loaded in the
chart.
• To access fundamental data of secondary symbols, call SetPrimarySeries first.

Fundamental Data Access Functions 76
© 2003-2006 FMR Corp. All rights reserved.
Example
var Bar, fb, fd: integer;var fv: float;
DrawLabel( 'From Bar 0', 0 );Bar := 0;fb := GetFundamentalNextBar( Bar, 'assets' );if fb >= 0 thenbegin fd := GetDate( fb ); DrawLabel( 'First Report Date is: ' + DateToStr( fd ), 0 ); fv := GetFundamentalValue( fb, 'assets' ); DrawLabel( 'First Assets Reported: ' + FormatFloat( '$#,##0.00', fv ),0 );end;
8.13 GetFundamentalValue
GetFundamentalValue( Bar: integer; Item: string; ): float;
RChartScripts XSimuScripts XPerfScripts XCMScripts
Description
Returns the value of the specified fundamental data Item at the specified Bar.
Note! The functions GetFundamentalBar/Detail/NextBar/Value are slow to executeand their use should be avoided in BarCount loops without use of optimizationcode, like that which follows. Here, we only access the 'assets' value when a newquarterly report is detected.
var Bar, FQ: integer;FQ := FundamentalPriceSeries( 'fiscal_quarter' );
for Bar := 1 to BarCount - 1 do if @FQ[Bar] <> @FQ[Bar - 1] then begin SetBarColor( Bar, #Fuchsia ); AnnotateBar( FormatFloat( '0', GetFundamentalValue( Bar, 'assets' )
), Bar, true, #Black, 8 ); end;
Remarks
• Wealth-Lab Pro only. See the Fundamental Data Definitions and Ratio CalculationsGuide for valid Item parameters.
• GetFundamentalValue returns the 0 for the following conditions:
1. Item is not found (may be misspelled or has incorrect case), or,2. a fundamental report does not exist for Item on or before Bar
• GetFundamentalValue will return the value from the most-recent report on or beforethe date of the specified Bar. It's possible that the function will return a value from areport date that exists prior to the first bar in the chart.
• To access fundamental data of secondary symbols, call SetPrimarySeries first.

WealthScript Function Reference, Wealth-Lab Pro™77
© 2003-2006 FMR Corp. All rights reserved.
Example
var Bar, fb, fd: integer;var fv: float;
Bar := BarCount - 1;fb := GetFundamentalBar( Bar, 'assets' );if fb >= 0 thenbegin fd := GetDate( fb ); DrawLabel( 'Last Report Date is: ' + DateToStr( fd ), 0 ); fv := GetFundamentalValue( fb, 'assets' ); DrawLabel( 'Assets Reported: ' + FormatFloat( '$#,##0.00', fv ), 0 );end;
8.14 GetGicsSector
GetGicsSector( Symbol: string ): string;
RChartScripts XSimuScripts XPerfScripts XCMScripts
Description
Returns the 2-digit GICS (Global Industry Classification Standard) sector code of thespecified Symbol as a string.
Remarks
• Wealth-Lab Pro only. You must perform the "Import Industry Data" action to accessand/or update GICS data on your computer. See the User Guide, Data Access chapterfor details.
• Use GetGicsDesc to return a textual description of a GICS Sector.
Example
{ Display the GICS sector description for AAPL }ShowMessage( GetGicsDesc( GetGicsSector( 'AAPL' ) ) );
8.15 GetGicsIndustryGroup
GetGicsIndustryGroup( Symbol: string ): string;
RChartScripts XSimuScripts XPerfScripts XCMScripts
Description
Returns the 4-digit GICS (Global Industry Classification Standard) industry group code ofthe specified Symbol as a string.
Remarks
• Wealth-Lab Pro only. You must perform the "Import Industry Data" action to accessand/or update GICS data on your computer. See the User Guide, Data Access chapterfor details.

Fundamental Data Access Functions 78
© 2003-2006 FMR Corp. All rights reserved.
• Use GetGicsDesc to return a textual description of a GICS Industry Group.
Example
{ Create a WatchList of the symbols in the same Industry Group as theclicked symbol. Right click and Refresh the DataSource tree after executing in theChartScript Window. }var w: integer;var sym, wsym, grp, WLName: string;
sym := GetSymbol;WLName := sym + '_IndustryGroup';WatchListClear( WLName );grp := GetGicsIndustryGroup( sym );
for w := 0 to WatchListCount - 1 dobegin wsym := WatchListSymbol( w ); if GetGicsIndustryGroup( wsym ) = grp then WatchListAddSymbol( WLName, '', wsym );end;
8.16 GetGicsIndustry
GetGicsIndustry( Symbol: string ): string;
RChartScripts XSimuScripts XPerfScripts XCMScripts
Description
Returns the 6-digit GICS (Global Industry Classification Standard) industry code of thespecified Symbol as a string.
Remarks
• Wealth-Lab Pro only. You must perform the "Import Industry Data" action to accessand/or update GICS data on your computer. See the User Guide, Data Access chapterfor details.
• Use GetGicsDesc to return a textual description of a GICS Industry.
Example
{ Print the GICS industry group description for the current symbol to thedebug window }Print( GetGicsDesc( GetGicsIndustry( GetSymbol ) ) );

WealthScript Function Reference, Wealth-Lab Pro™79
© 2003-2006 FMR Corp. All rights reserved.
8.17 GetGicsSubIndustry
GetGicsSubIndustry( Symbol: string ): string;
RChartScripts XSimuScripts XPerfScripts XCMScripts
Description
Returns the 8-digit GICS (Global Industry Classification Standard) sub-industry code ofthe specified Symbol as a string.
Remarks
• Wealth-Lab Pro only. You must perform the "Import Industry Data" action to accessand/or update GICS data on your computer. See the User Guide, Data Access chapterfor details.
• Use GetGicsDesc to return a textual description of a GICS Sub-Industry.
Example
{ Print the GICS industry group description for the current symbol to thedebug window }Print( GetGicsDesc( GetGicsSubIndustry( GetSymbol ) ) );
8.18 GetGicsDesc
GetGicsDesc( GicsCode: string ): string;
RChartScripts XSimuScripts XPerfScripts XCMScripts
Description
Returns a textual description of the specified GicsCode. Use the result of any of thefollowing functions as the GicsCode parameter: GetGicsSector,GetGicsIndustryGroup, GetGicsIndustry, or GetGicsSubIndustry.
Remarks
• Wealth-Lab Pro only. You must perform the "Import Industry Data" action to accessand/or update GICS data on your computer. See the User Guide, Data Access chapterfor details.
• If the GicsCode does not correspond to a valid description, then the function returns anempty string.
Example
{ Print the GICS code descriptions for all WatchList symbols to the debugwindow }var w: integer;Print( 'Tab delimited. Highlight, copy, and paste into an Excelsheet...' + #13#10 );Print( 'Symb' + #9 + 'Sector' + #9 + 'IndGrp' + #9 + 'Industry' + #9 +'SubIndust' + ': ' + 'Desc' );for w := 0 to WatchListCount - 1 dobegin var sym: string = WatchListSymbol( w );

Fundamental Data Access Functions 80
© 2003-2006 FMR Corp. All rights reserved.
Print( sym + #9 + GetGicsDesc( GetGicsSector( sym ) ) + #9 + GetGicsDesc( GetGicsIndustryGroup( sym ) ) + #9 + GetGicsDesc( GetGicsIndustry( sym ) ) + #9 + GetGicsDesc( GetGicsSubIndustry( sym ) ) + #9 );end;

WealthScript Function Reference, Wealth-Lab Pro™81
© 2003-2006 FMR Corp. All rights reserved.
9 Math Functions
9.1 Overview
Most scientific Math function that you would expect from a scripting language areavailable in WealthScript. If you cannot find the function that you're looking for, trybrowsing the Studies folder or Wealth-Lab Code Library found on the Wealth-Lab site.
Three of the math functions are specific to WealthScript and allow you to determinevalues or the location of a line drawn on the chart: LineExtendX , LineExtendY , andTrendLineValue . Note that these functions are applicable in a linear sense, andtherefore should not be used for semi-logarithmic charting. See, for example,LineExtendYLog in the Code Library.
9.2 Abs
Abs( Value: float ): float;
RChartScripts RSimuScripts RPerfScripts RCMScripts
Description
Returns the absolute value of the specified Value.
Example
{ Report on the change in price after 200 days }var S: string;var DIFF: float;var BAR: integer;Bar := BarCount - 1;Diff := PriceClose( Bar ) - PriceClose( Bar - 200 );Diff := Diff / PriceClose( Bar - 200 ) * 100;s := 'After 200 days, prices ';if Diff > 0 then s := s + 'advanced'else s := s + 'declined';Diff := Abs( Diff );s := s + ' by ' + FormatFloat( '#0.0%', Diff );DrawLabel( s, 0 );
9.3 ArcCos
ArcCos( Value: float ): float;
RChartScripts RSimuScripts RPerfScripts RCMScripts
Description
ArcCos returns the inverse cosine of the specified number, Value. The number must bebetween -1 and 1. The return value is the angle, in degrees.
86 87
94

Math Functions 82
© 2003-2006 FMR Corp. All rights reserved.
9.4 ArcSin
ArcSin( Value: float ): float;
RChartScripts RSimuScripts RPerfScripts RCMScripts
Description
ArcSin returns the inverse sine of the specified number. The number must be between -1and 1. The return value is the angle in degrees.
9.5 ArcSinh
ArcSinh( Value: float ): float;
RChartScripts RSimuScripts RPerfScripts RCMScripts
Description
ArcSinh returns the inverse hyperbolic sine of the specified number, Value.
9.6 ArcTan
ArcTan( Value: float ): float;
RChartScripts RSimuScripts RPerfScripts RCMScripts
Description
Calculates the arctangent of a specified number, Value, in degrees.
9.7 ArcTanh
ArcTanh( Value: float ): float;
RChartScripts RSimuScripts RPerfScripts RCMScripts
Description
Returns the inverse hyperbolic tangent of the specified number, Value. The number mustbe between -1 and 1.
9.8 Correlation
Correlation( Series1: integer; Series2: integer; StartBar: integer; EndBar: integer ): float;
RChartScripts RSimuScripts RPerfScripts XCMScripts
Description
Returns Pearson's Correlation Coefficient between the two specified Price Series, Series1and Series2. Specify the quantity of data to analyze in the StartBar and EndBarparameters.

WealthScript Function Reference, Wealth-Lab Pro™83
© 2003-2006 FMR Corp. All rights reserved.
Example
{ How well correlated were CMO and RSI? }var corr: float;var RSISer, CMOSer: integer;RSISer := RSISeries( #Close, 20 );CMOSer := CMOSeries( #Close, 20 );corr := Correlation( RSISer, CMOSer, 0, BarCount - 1 );DrawLabel( 'Correlation: ' + FloatToStr( corr ), 0 );
9.9 Cos
Cos( Value: float ): float;
RChartScripts RSimuScripts RPerfScripts RCMScripts
Description
Returns the cosine of the specified angle, Value. The angle should be specified indegrees.
9.10 Cosh
Cosh( Value: float ): float;
RChartScripts RSimuScripts RPerfScripts RCMScripts
Description
Returns the hyperbolic cosine of the specified angle, Value.
9.11 Cotan
Cotan( Value: float ): float;
RChartScripts RSimuScripts RPerfScripts RCMScripts
Description
Returns the cotangent of the specified angle. Specify the angle in degrees. Only usewith angles that are non-zero.
9.12 Dec
Dec( Value: integer );
RChartScripts RSimuScripts RPerfScripts RCMScripts
Description
Decrements the variable passed in the Value parameter by 1.
Note: Dec operates on regular integer variables only, not object field variables.
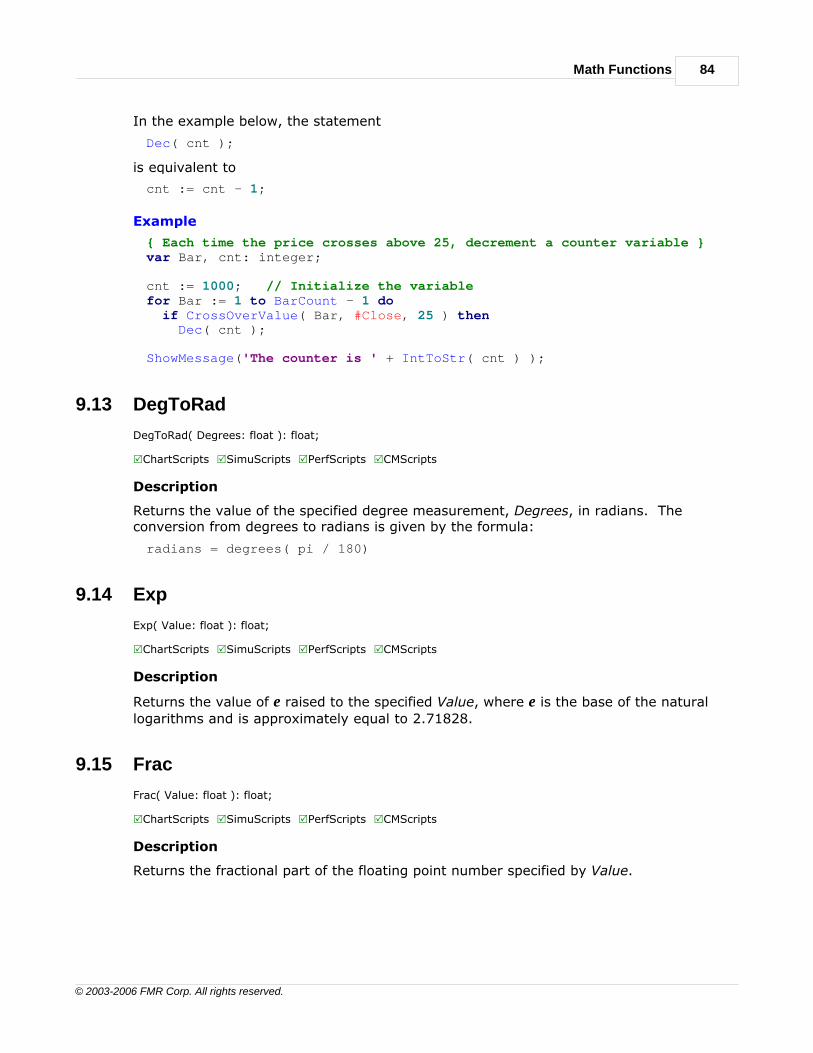
Math Functions 84
© 2003-2006 FMR Corp. All rights reserved.
In the example below, the statement
Dec( cnt );
is equivalent to
cnt := cnt - 1;
Example
{ Each time the price crosses above 25, decrement a counter variable }var Bar, cnt: integer;
cnt := 1000; // Initialize the variablefor Bar := 1 to BarCount - 1 do if CrossOverValue( Bar, #Close, 25 ) then Dec( cnt );
ShowMessage('The counter is ' + IntToStr( cnt ) );
9.13 DegToRad
DegToRad( Degrees: float ): float;
RChartScripts RSimuScripts RPerfScripts RCMScripts
Description
Returns the value of the specified degree measurement, Degrees, in radians. Theconversion from degrees to radians is given by the formula:
radians = degrees( pi / 180)
9.14 Exp
Exp( Value: float ): float;
RChartScripts RSimuScripts RPerfScripts RCMScripts
Description
Returns the value of e raised to the specified Value, where e is the base of the natural
logarithms and is approximately equal to 2.71828.
9.15 Frac
Frac( Value: float ): float;
RChartScripts RSimuScripts RPerfScripts RCMScripts
Description
Returns the fractional part of the floating point number specified by Value.

WealthScript Function Reference, Wealth-Lab Pro™85
© 2003-2006 FMR Corp. All rights reserved.
9.16 Hypot
Hypot( x: float; y: float ): float;
RChartScripts RSimuScripts RPerfScripts RCMScripts
Description
Returns the length of the hypotenuse of a triangle. Specify the lengths of the sidesadjacent to the right angle in X and Y parameters.
9.17 Inc
Inc( Value: integer );
RChartScripts RSimuScripts RPerfScripts RCMScripts
Description
Increments the variable passed in the Value parameter by 1.
Note: Inc operates on regular integer variables only, not object field variables.
In the example below, the statement
Inc( cnt );
is equivalent to
cnt := cnt + 1;
Example
{ Each time the price crosses below 25, increment a counter variable }var Bar, cnt: integer;
cnt := 0; // Initialize the variablefor Bar := 1 to BarCount - 1 do if CrossUnderValue( Bar, #Close, 25 ) then Inc( cnt );
ShowMessage('The counter is ' + IntToStr( cnt ) );
9.18 Int
Int( Value: float ): float;
RChartScripts RSimuScripts RPerfScripts RCMScripts
Description
Returns the integer part of a floating point number as a floating point number afterrounding towards zero. Assign the result of Int to a variable of type float.
Compare to: Trunc, Round
Example
{ f equals -5.0 following the conversion }

Math Functions 86
© 2003-2006 FMR Corp. All rights reserved.
var x, f: float;x := -5.678;f := Int( x );ShowMessage(FormatFloat( '0.0', f ));
9.19 LinearRegLine
LinearRegLine( Series: integer; Start: integer; End: integer; Predict: integer ): float;
RChartScripts RSimuScripts RPerfScripts XCMScripts
Description
Allows you to perform ad-hoc linear regression analysis on the specified Price Series.Specify the Start and End bars for which to calculate the regression line. Then, specifythe bar, Predict, for which you want to predict a value. This could be a bar that extendsinto the future.
Example
{ Draw a bullseye around the predicted closing price of the last bar ofthe chart based on a linear regression that completed 1 - bars earlier }var X: float;var ENDBAR, BAR1, BAR2: integer;EndBar := BarCount - 1;Bar1 := EndBar - 30;Bar2 := EndBar - 10;x := LinearRegLine( #Close, Bar1, Bar2, EndBar );DrawCircle( 8, 0, EndBar, x, #Red, #Thick );DrawCircle( 4, 0, EndBar, x, #Black, #Thick );
9.20 LineExtendX
LineExtendX( x1: float; y1: float; x2: float; y2: float; y: float ): float;
RChartScripts RSimuScripts RPerfScripts XCMScripts
Description
Extends the line specified by the x1, y1, x2, and y2 parameters, solving for x using thespecified y parameter.
Remarks
• The equation used in the solution assumes a linear (not logarithmic) y-scale axis.
Example
{ Determine middle bar between last 2 peaks }var PRICE1, PRICE2, PRICE3: float;var BAR, BAR1, BAR2, BAR3: integer;Bar := BarCount - 1;Bar1 := PeakBar( Bar, #High, 13 );Price1 := Peak( Bar, #High, 13 );Bar2 := PeakBar( Bar1, #High, 13 );Price2 := Peak( Bar1, #High, 13 );Price3 := ( Price1 + Price2 ) / 2;

WealthScript Function Reference, Wealth-Lab Pro™87
© 2003-2006 FMR Corp. All rights reserved.
Bar3 := Trunc( LineExtendX( Bar1, Price1, Bar2, Price2, Price3 ) );
SetBarColor( Bar3, #Red );DrawLine( Bar1, Price1, Bar2, Price2, 0, #Blue, #Thin );
9.21 LineExtendY
LineExtendY( x1: float; y1: float; x2: float; y2: float; x: float ): float;
RChartScripts RSimuScripts RPerfScripts XCMScripts
Description
Extends the line specified by the x1, y1, x2, and y2 parameters and solves for y using thespecified x parameter.
Remarks
• The equation used in the solution assumes a linear (not logarithmic) y-scale axis. SeeLineExtendYLog in the Wealth-Lab Code Library for the semi-log complementaryfunction.
• See Also: TrendLineValue
Example
{ Extend recent resistance line to most current bar }var PRICE1, PRICE2, Price3, Rev: float;var BAR1, BAR, BAR2: integer;Rev := 5;Bar := BarCount - 1;Bar1 := PeakBar( Bar, #High, Rev );Price1 := Peak( Bar, #High, Rev );Bar2 := PeakBar( Bar1, #High, Rev );Price2 := Peak( Bar1, #High, Rev );Price3 := LineExtendY( Bar1, Price1, Bar2, Price2, BarCount - 1 );
DrawLine( Bar1, Price1, Bar2, Price2, 0, #Blue, #Thick );DrawLine( Bar2, Price2, BarCount - 1, Price3, 0, #Red, #Thin );
9.22 LN
LN( Value: float ): float;
RChartScripts RSimuScripts RPerfScripts RCMScripts
Description
Returns the natural log of the specified Value.
Example
{ This function returns the log BaseN of a Number }function Log( Number, BaseN: float ): float;begin Result := LN( Number ) / LN( BaseN );end;
var f: float;

Math Functions 88
© 2003-2006 FMR Corp. All rights reserved.
f := Log( 81, 3 );ShowMessage( 'The log base 3 of 81 is ' + FormatFloat( '0.0', f ) );
9.23 Log10
Log10( Value: float ): float;
RChartScripts RSimuScripts RPerfScripts RCMScripts
Description
Returns the base 10 logarithm for the specified Value.
9.24 Log2
Log2( Value: float ): float;
RChartScripts RSimuScripts RPerfScripts RCMScripts
Description
Returns the base 2 logarithm for the specified Value.
9.25 Max
Max( n1: float; n2: float ): float;
RChartScripts RSimuScripts RPerfScripts RCMScripts
Description
Returns the greater of the two specified values, n1 and n2. The result is returned as afloat type.
The ChartScript below is set up for optimization on two variables, which are used for themoving average periods. To ensure that both MA Price Series are valid for allpermutations of the #OptVars, we use Max to determine which one is greater and usethe result as the first bar in the main loop.
Example
{ Long-only moving avg crossover trading script set up for Optimization }
{#OptVar1 8;6;14;2}{#OptVar2 14;8;20;2}var Bar, StartBar, p1, p2, hMA1, hMA2: integer;
p1 := #OptVar1;p2 := #OptVar2;hMA1 := SMASeries( #Close, p1 );hMA2 := SMASeries( #Close, p2 );
{ Trunc converts the float type to an integer type }StartBar := Trunc( Max( p1, p2 ) );for Bar := StartBar to BarCount - 1 dobegin if not LastPositionActive then

WealthScript Function Reference, Wealth-Lab Pro™89
© 2003-2006 FMR Corp. All rights reserved.
begin if CrossOver( Bar, hMA1, hMA2 ) then BuyAtMarket( Bar + 1, 'XOver' ); end else if CrossUnder( Bar, hMA1, hMA2 ) then SellAtMarket( Bar + 1, LastPosition, 'XUnder' );end;PlotSeries( hMA1, 0, #Green, #Thin );PlotSeries( hMA2, 0, #Red, #Thin );
9.26 Min
Min( n1: float; n2: float ): float;
RChartScripts RSimuScripts RPerfScripts RCMScripts
Description
Returns the lower of the two specified values, n1 and n2. The result is returned as afloat type.
In the example, the short-only trading system sets a stop based on the value of two PriceSeries. We use Min to determine the lesser value of the two series for the trailing stop.
Example
{ Each time the price crosses below 25, increment a counter variable }var Bar, p1, p2, hMA1, hMA2: integer;var Stp: float;
p1 := 10;p2 := 20;hMA1 := SMASeries( #Close, p1 );hMA2 := SMASeries( #Close, p2 );PlotStops;
for Bar := p2 to BarCount - 1 dobegin if not LastPositionActive then begin if CrossUnder( Bar, hMA1, hMA2 ) then begin ShortAtMarket( Bar + 1, 'XUnder' ); { Initialize a stop 3% higher than entry } Stp := PositionEntryPrice( LastPosition ) * 1.03; CoverAtTrailingStop( Bar + 1, Stp, LastPosition, 'Cvr' ); end; end else if CrossOver( Bar, hMA1, hMA2 ) then CoverAtMarket( Bar + 1, LastPosition, 'XOver' ) else begin Stp := Min( @hMA1[Bar] * 1.02, @hMA2[Bar] * 1.01 ); CoverAtTrailingStop( Bar + 1, Stp, LastPosition, 'TStop' ); end;
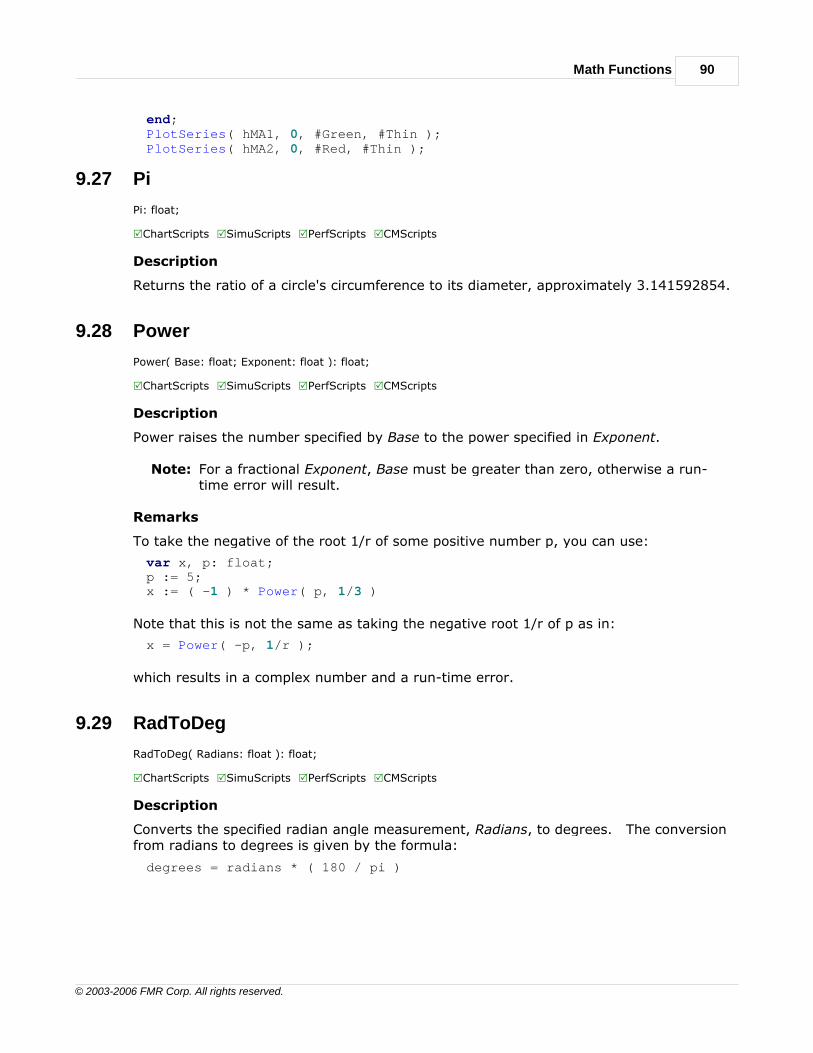
Math Functions 90
© 2003-2006 FMR Corp. All rights reserved.
end;PlotSeries( hMA1, 0, #Green, #Thin );PlotSeries( hMA2, 0, #Red, #Thin );
9.27 Pi
Pi: float;
RChartScripts RSimuScripts RPerfScripts RCMScripts
Description
Returns the ratio of a circle's circumference to its diameter, approximately 3.141592854.
9.28 Power
Power( Base: float; Exponent: float ): float;
RChartScripts RSimuScripts RPerfScripts RCMScripts
Description
Power raises the number specified by Base to the power specified in Exponent.
Note: For a fractional Exponent, Base must be greater than zero, otherwise a run-time error will result.
Remarks
To take the negative of the root 1/r of some positive number p, you can use:
var x, p: float;p := 5;x := ( -1 ) * Power( p, 1/3 )
Note that this is not the same as taking the negative root 1/r of p as in:
x = Power( -p, 1/r );
which results in a complex number and a run-time error.
9.29 RadToDeg
RadToDeg( Radians: float ): float;
RChartScripts RSimuScripts RPerfScripts RCMScripts
Description
Converts the specified radian angle measurement, Radians, to degrees. The conversionfrom radians to degrees is given by the formula:
degrees = radians * ( 180 / pi )

WealthScript Function Reference, Wealth-Lab Pro™91
© 2003-2006 FMR Corp. All rights reserved.
9.30 RandG
RandG( Mean, StdDev: float ): float;
RChartScripts RSimuScripts RPerfScripts RCMScripts
Description
Generates random numbers with a Gaussian distribution about the Mean. RandG isuseful for simulating data with sampling errors and expected deviations from the Mean.
Remarks
• Call SetRandSeed before RandG to generate a repetitive random sequence.
• See also Random, RandomInt.
Example
{ Set 200 or 300 Fixed Bars and execute }var n, m, BarCnt: integer;var lst: TList = TList.Create;var h: integer = CreateSeries;var Pane: integer = CreatePane( 150, true, true );
BarCnt := BarCount - 1;for n := 0 to BarCnt do lst.Add( RandG( 100, 5.0 ) );
{ Re-order and plot to show the Gaussian distribution }lst.SortNumeric;n := 0;m := 0;repeat @h[m] := lst.Item( n ); Inc( n ); @h[BarCnt - m] := lst.Item( n ); Inc( m ); Inc( n );until n >= BarCnt;PlotSeries( h, Pane, 0, #Histogram );
9.31 Random
Random: float;
RChartScripts RSimuScripts RPerfScripts RCMScripts
Description
Returns a random number between zero and one.
Remarks
• Call SetRandSeed before Random to generate a repetitive random sequence.
Example
{ Get a random value between 100 and 200 }var x: float;x := Random * 100 + 100;

Math Functions 92
© 2003-2006 FMR Corp. All rights reserved.
9.32 RandomInt
RandomInt( Limit: integer ): integer;
RChartScripts RSimuScripts RPerfScripts RCMScripts
Description
Returns a random integer between zero and Limit - 1.
Remarks
• Call SetRandSeed before RandomInt to generate a repetitive random sequence.
Example
{ Get a random integer between 0 and 99 }var ri: integer;ri := RandomInt( 100 );ShowMessage( IntToStr( ri ) );
9.33 Randomize
Randomize;
RChartScripts RSimuScripts RPerfScripts RCMScripts
Description
Initializes the random number generator with a random value. You can call this functionat the start of a script to ensure that you get a different sequence of random numberseach time the script is executed.
9.34 RandSeed
RandSeed;
RChartScripts RSimuScripts RPerfScripts RCMScripts
Description
Returns the random number generator's current "seed" value. You can use theSetRandSeed function to change the seed value, and start a repetitive sequence ofrandom numbers.
9.35 Round
Round( Value: float ): integer;
RChartScripts RSimuScripts RPerfScripts RCMScripts
Description
Rounds the specified floating point number, Value, to the nearest whole number, which isreturned as an integer type.

WealthScript Function Reference, Wealth-Lab Pro™93
© 2003-2006 FMR Corp. All rights reserved.
Remarks
• Round uses "Bankers Rounding", which means that if Value is exactly between twowhole numbers, the result is always an even number.
• Compare to: Int, Trunc
Example
{ n equals 2 and p equals -3 at the end of the example }var x: float;var n, p: integer;x := 2.5;n := Round( x );x := -3.49;p := Round( x );ShowMessage( IntToStr(n) + #9 + IntToStr(p) );
9.36 SetRandSeed
SetRandSeed( Value: integer );
RChartScripts RSimuScripts RPerfScripts RCMScripts
Description
Changes the seed Value of the random number generator. You can generate repetitivesequences of random numbers by resetting the seed to a set value.
9.37 Sin
Sin( Value: float ): float;
RChartScripts RSimuScripts RPerfScripts RCMScripts
Description
Returns the sine of the specified angle, Value. The angle should be specified in degrees.
9.38 Sinh
Sinh( Value: float ): float;
RChartScripts RSimuScripts RPerfScripts RCMScripts
Description
Returns the hyperbolic sine of the specified angle, Value.

Math Functions 94
© 2003-2006 FMR Corp. All rights reserved.
9.39 Sqr
Sqr( Value: float ): float;
RChartScripts RSimuScripts RPerfScripts RCMScripts
Description
Returns the square of the specified Value. The return value is Value * Value.
9.40 Sqrt
Sqrt( Value: float ): float;
RChartScripts RSimuScripts RPerfScripts RCMScripts
Description
Returns the square root of the specified Value.
9.41 Tan
Tan( Value: float ): float;
RChartScripts RSimuScripts RPerfScripts RCMScripts
Description
Returns the tangent of the specified angle, Value. The angle should be in degrees.
9.42 Tanh
Tan( Value: float ): float;
RChartScripts RSimuScripts RPerfScripts RCMScripts
Description
Returns the hyperbolic tangent of the specified Value.
9.43 TrendLineValue
TrendLineValue( Bar: integer; TrendLine: string ): float;
RChartScripts RSimuScripts XPerfScripts XCMScripts
Description
Allows you to obtain the value at Bar of a named Trendline that you drew with Wealth-Lab Pro's TrendLine tool. If the named Trendline could not be found for the currentsymbol and time frame, the function returns 0.
Remarks
• The equation used in the solution assumes a linear (not logarithmic) y-scale axis.
• See also: LineExtendY

WealthScript Function Reference, Wealth-Lab Pro™95
© 2003-2006 FMR Corp. All rights reserved.
Example
{ Have we crossed the resistance TrendLine? }var RES: float;var BAR: integer;for Bar := 1 to BarCount - 1 dobegin res := TrendLineValue( Bar - 1, 'Resistance' ); if PriceClose( Bar - 1 ) < res then begin res := TrendLineValue( Bar, 'Resistance' ); if PriceClose( Bar ) >= res then begin SetBarColor( Bar, #Red ); DrawCircle( 5, 0, Bar, res, #Red, #Thin ); end; end;end;
9.44 Trunc
Trunc( Value: float ): integer;
RChartScripts RSimuScripts RPerfScripts RCMScripts
Description
Truncates the decimal portion of the specified floating point number and returns theinteger portion. Trunc returns an integer type.
Compare to: Int, Round
Example
{ n equals 1 at the end of the example }var x: float;var n: integer;x := 1.234;n := Trunc( x );

PerfScript Functions 96
© 2003-2006 FMR Corp. All rights reserved.
10 PerfScript Functions
10.1 Overview
PerfScripts, or Performance Scripts, are Scriptable Performance Reports. You cancustomize Wealth-Lab Performance Reports to display whatever performance metrics thatyou can imagine using the PerfScript feature. Performance Scripts must be saved to the
special PerfScripts folder, where a sample is included with your Wealth-Lab Proinstallation that duplicates the standard Wealth-Lab Performance Report.
When enabled in the ChartScript Window or $imulator tools, Wealth-Lab will execute aPerfScript four times to process All Trades (Long+Short), Long Only, Short Only, and Buy& Hold positions. Since Wealth-Lab automatically makes the appropriate group ofpositions available to the PerfScript during each of the four runs, it's not necessary towrite special code to test position types.
Of the seven PerfScript functions, four are used to add data to a performance record,which is simply a single row of text in the Performance Report. Each row must have aunique Label. Depending on the type of data to be displayed, you'll reference this Labelusing either PerfAddCurrency , PerfAddNumber , PerfAddPct , or PerfAddString .Consequently, the same performance record can display different types of data asrequired for All Trades, Long Only, etc.
For example, for any performance metric that involves a division, you should include logicto detect if the divisor is zero prior to the division operation. If it is, then you can usePerfAddString to show 'INF'. Otherwise, use one the other functions to display anumber with the appropriate format.
10.2 AccountExposure
AccountExposure: float;
XChartScripts XSimuScripts RPerfScripts XCMScripts
Description
Returns the total market exposure in percent for the trading system. Wealth-Labcalculates exposure on a bar-by-bar basis and measures the area of the portfolio equitycurve that was exposed to the market.
Remarks
• AccountExposure is available only for PerfScripts.
Example
PerfAddPct( 'Exposure', AccountExposure, 2, #Black, 0, 8 );
98 98 99 99
99
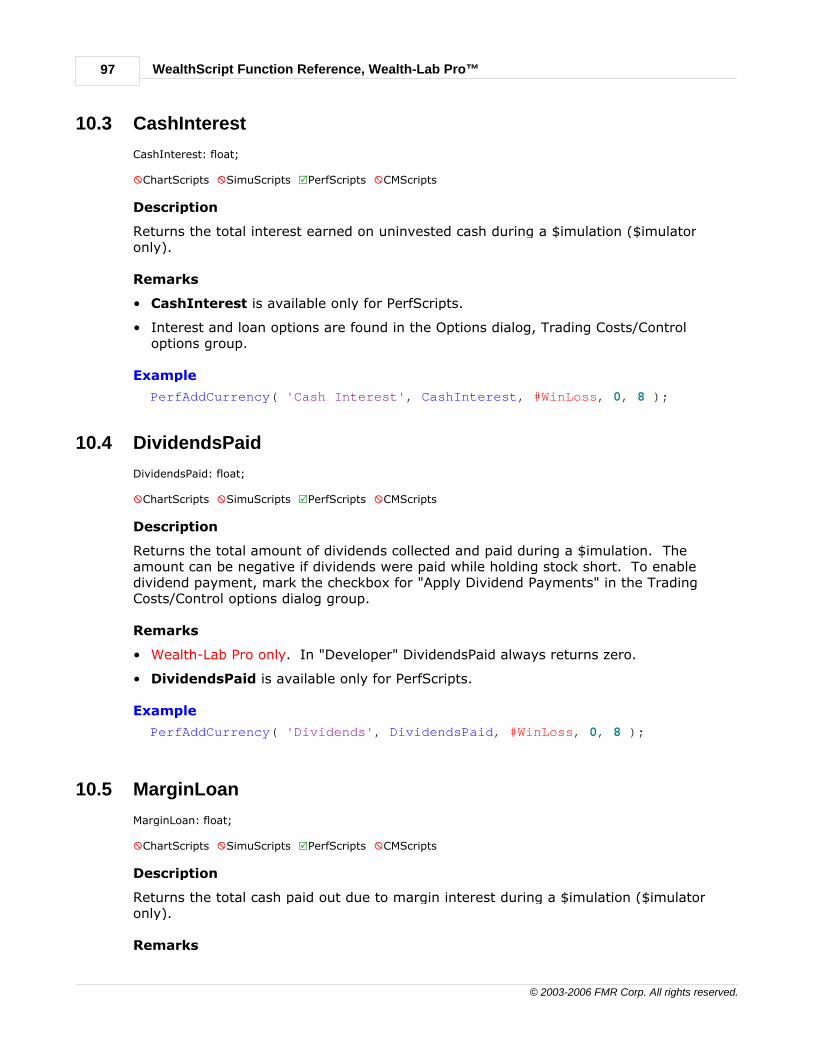
WealthScript Function Reference, Wealth-Lab Pro™97
© 2003-2006 FMR Corp. All rights reserved.
10.3 CashInterest
CashInterest: float;
XChartScripts XSimuScripts RPerfScripts XCMScripts
Description
Returns the total interest earned on uninvested cash during a $imulation ($imulatoronly).
Remarks
• CashInterest is available only for PerfScripts.
• Interest and loan options are found in the Options dialog, Trading Costs/Controloptions group.
Example
PerfAddCurrency( 'Cash Interest', CashInterest, #WinLoss, 0, 8 );
10.4 DividendsPaid
DividendsPaid: float;
XChartScripts XSimuScripts RPerfScripts XCMScripts
Description
Returns the total amount of dividends collected and paid during a $imulation. Theamount can be negative if dividends were paid while holding stock short. To enabledividend payment, mark the checkbox for "Apply Dividend Payments" in the TradingCosts/Control options dialog group.
Remarks
• Wealth-Lab Pro only. In "Developer" DividendsPaid always returns zero.
• DividendsPaid is available only for PerfScripts.
Example
PerfAddCurrency( 'Dividends', DividendsPaid, #WinLoss, 0, 8 );
10.5 MarginLoan
MarginLoan: float;
XChartScripts XSimuScripts RPerfScripts XCMScripts
Description
Returns the total cash paid out due to margin interest during a $imulation ($imulatoronly).
Remarks

PerfScript Functions 98
© 2003-2006 FMR Corp. All rights reserved.
• MarginLoan is available only for PerfScripts.
• Interest and loan options are found in the Options dialog, Trading Costs/Controloptions group.
Example
PerfAddCurrency( 'Margin Loan Interest', MarginLoan, #WinLoss, 0, 8 );
10.6 PerfAddCurrency
PerfAddCurrency( Label: string; Value: float; Color: integer; Style: integer; Size: integer );
XChartScripts XSimuScripts RPerfScripts XCMScripts
Description
Adds a floating point value formatted using the Decimal and Currency configuration in theOptions Dialog|System Settings.
Label Text label identifying the performance record, displayed in the left-mostcolumn of the Performance report.
Value Floating point expression of the performance metric to be displayed.
Color Controls the Value's text color using one of the standard color constants,e.g., #Black, #Red, #Green, etc. For in-the-black/in-the-red coloring
(positive/negative values, respectively), use #WinLoss.
Style Controls the style of the Label and can be either #Bold, #Italic, or 0 for
normal type.
Size Point size of font, 8 is standard.
Example
PerfAddCurrency( 'Net Profit', NetProfit, #WinLoss, 0, 8 );
10.7 PerfAddNumber
PerfAddNumber( Label: string; Value: float; Decimals: integer; Color: integer; Style: integer; Size: integer );
XChartScripts XSimuScripts RPerfScripts XCMScripts
Description
Adds a floating point value, which is displayed with the specified number of Decimals.Value is rounded to correspond to the specified Decimals precision.
Label Text label identifying the performance record, displayed in the left-mostcolumn of the Performance report.
Value Floating point expression of the performance metric to be displayed.
Decimals Number of digits to be displayed right of the decimal point. Rationalnumbers are zero-filled. Enter 0 for integer expressions.
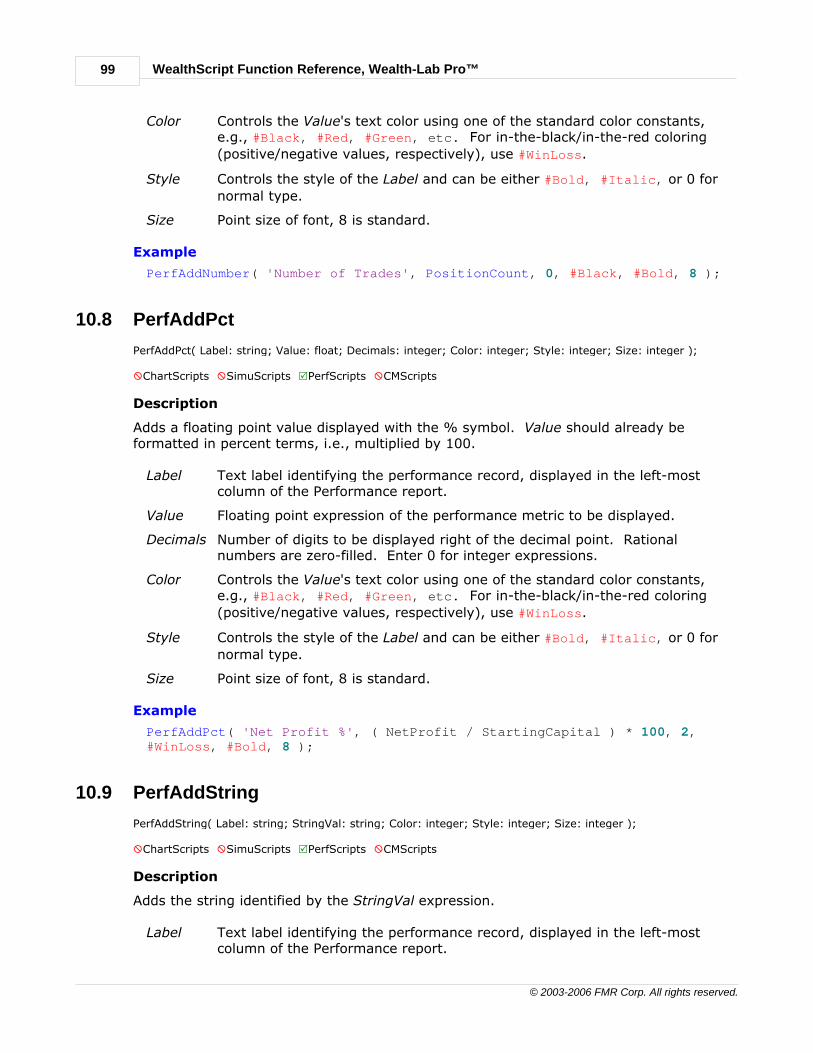
WealthScript Function Reference, Wealth-Lab Pro™99
© 2003-2006 FMR Corp. All rights reserved.
Color Controls the Value's text color using one of the standard color constants,e.g., #Black, #Red, #Green, etc. For in-the-black/in-the-red coloring
(positive/negative values, respectively), use #WinLoss.
Style Controls the style of the Label and can be either #Bold, #Italic, or 0 for
normal type.
Size Point size of font, 8 is standard.
Example
PerfAddNumber( 'Number of Trades', PositionCount, 0, #Black, #Bold, 8 );
10.8 PerfAddPct
PerfAddPct( Label: string; Value: float; Decimals: integer; Color: integer; Style: integer; Size: integer );
XChartScripts XSimuScripts RPerfScripts XCMScripts
Description
Adds a floating point value displayed with the % symbol. Value should already beformatted in percent terms, i.e., multiplied by 100.
Label Text label identifying the performance record, displayed in the left-mostcolumn of the Performance report.
Value Floating point expression of the performance metric to be displayed.
Decimals Number of digits to be displayed right of the decimal point. Rationalnumbers are zero-filled. Enter 0 for integer expressions.
Color Controls the Value's text color using one of the standard color constants,e.g., #Black, #Red, #Green, etc. For in-the-black/in-the-red coloring
(positive/negative values, respectively), use #WinLoss.
Style Controls the style of the Label and can be either #Bold, #Italic, or 0 for
normal type.
Size Point size of font, 8 is standard.
Example
PerfAddPct( 'Net Profit %', ( NetProfit / StartingCapital ) * 100, 2,#WinLoss, #Bold, 8 );
10.9 PerfAddString
PerfAddString( Label: string; StringVal: string; Color: integer; Style: integer; Size: integer );
XChartScripts XSimuScripts RPerfScripts XCMScripts
Description
Adds the string identified by the StringVal expression.
Label Text label identifying the performance record, displayed in the left-mostcolumn of the Performance report.

PerfScript Functions 100
© 2003-2006 FMR Corp. All rights reserved.
StringVal String expression or literal to be displayed.
Color Controls StringVal's text color using one of the standard color constants,e.g., #Black, #Red, #Green, etc.
Style Controls the style of the Label and can be either #Bold, #Italic, or 0 for
normal type.
Size Point size of font, 8 is standard.
Example
PerfAddString( 'Annualized Gain $', 'N/A', #Black, 0, 8 );
10.10 PerfAddBreak
PerfAddBreak;
XChartScripts XSimuScripts RPerfScripts XCMScripts
Description
Adds a blank line after the last PerfAdd function call that creates a unique label.
Example
PerfAddBreak;
10.11 StartingCapital
StartingCapital: float;
XChartScripts XSimuScripts RPerfScripts XCMScripts
Description
Returns the Starting Capital for Portfolio Simulations, or zero for Raw Profit Mode.
Remarks
• StartingCapital is available only for PerfScripts.
Example
PerfAddCurrency( 'Starting Capital', StartingCapital, #Black, #Bold, 8 );
10.12 TotalCommission
TotalCommission: float;
XChartScripts XSimuScripts RPerfScripts XCMScripts
Description
Returns the total commission generated during a simulation.
Remarks

WealthScript Function Reference, Wealth-Lab Pro™101
© 2003-2006 FMR Corp. All rights reserved.
• TotalCommission is available only for PerfScripts.
• The function is equally applicable to both the $imulator and ChartScript Window toolsin either Portfolio Simulation or Raw Profit mode.
Example
PerfAddCurrency( 'Total Commission', TotalCommission, #WinLoss, 0, 8 );

Position Management Functions 102
© 2003-2006 FMR Corp. All rights reserved.
11 Position Management Functions
11.1 Overview
When you need to know about the performance or "properties" of an open or closedPosition so to make a future trading decision, look to the Position Management categoryof functions. Each Position that you open will have a set of constant properties, such asthe Bar Number on which the position was opened or the number of shares/contracts. Allof these data are assigned to a Position Number that you later use to reference aparticular Position. Position Numbers start at zero with the first Position opened by theChartScript and increments by one for each newly opened (or split) Position.
While the Position is still open, you can also access up-to-the bar performance data, likeMax Adverse/Favorable Excursions (MAE/MFE). Additionally, your Positions have extrastorage for items such as a risk stop price (SetPositionRiskStop ) for position sizing, apriority number to influence the decisions at the Portfolio Simulation level(SetPositionPriority ), and an arbitrary data value (SetPositionData ) that you canuse for any purpose you choose!
11.2 ActivePositionCount
ActivePositionCount: integer;
RChartScripts RSimuScripts RPerfScripts XCMScripts
Description
Returns the number of active Positions currently being held by the trading system.
Example
{ Here we limit the system to 3 active Positions max }var BAR, N: integer;
for Bar := 21 to BarCount - 1 dobegin n := 30; while n > 0 do begin if CrossUnderValue( Bar, RSISeries( #Close, 20 ), n ) then if ActivePositionCount < 3 then BuyAtMarket( Bar + 1, IntToStr( n ) ); n := n - 5; end; if CrossOverValue( Bar, RSISeries( #Close, 20 ), 55 ) then for n := 0 to PositionCount - 1 do if PositionActive( n ) then SellAtMarket( Bar + 1, n, '' );end;var RSIPane: integer;RSIPane := CreatePane( 75, true, true );PlotSeries( RSISeries( #Close, 20 ), RSIPane, 205, #Thick );DrawLabel( 'RSI( Close, 20 )', RSIPane );
133
132 131
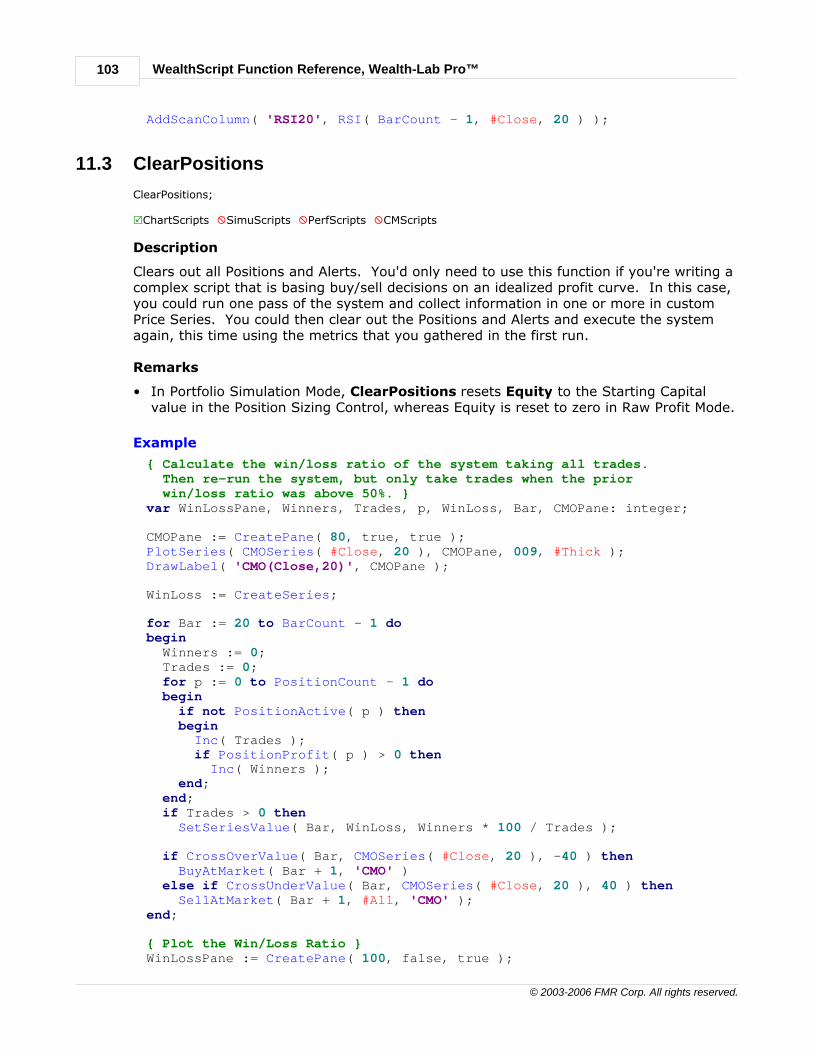
WealthScript Function Reference, Wealth-Lab Pro™103
© 2003-2006 FMR Corp. All rights reserved.
AddScanColumn( 'RSI20', RSI( BarCount - 1, #Close, 20 ) );
11.3 ClearPositions
ClearPositions;
RChartScripts XSimuScripts XPerfScripts XCMScripts
Description
Clears out all Positions and Alerts. You'd only need to use this function if you're writing acomplex script that is basing buy/sell decisions on an idealized profit curve. In this case,you could run one pass of the system and collect information in one or more in customPrice Series. You could then clear out the Positions and Alerts and execute the systemagain, this time using the metrics that you gathered in the first run.
Remarks
• In Portfolio Simulation Mode, ClearPositions resets Equity to the Starting Capitalvalue in the Position Sizing Control, whereas Equity is reset to zero in Raw Profit Mode.
Example
{ Calculate the win/loss ratio of the system taking all trades. Then re-run the system, but only take trades when the prior win/loss ratio was above 50%. }var WinLossPane, Winners, Trades, p, WinLoss, Bar, CMOPane: integer;
CMOPane := CreatePane( 80, true, true );PlotSeries( CMOSeries( #Close, 20 ), CMOPane, 009, #Thick );DrawLabel( 'CMO(Close,20)', CMOPane );
WinLoss := CreateSeries;
for Bar := 20 to BarCount - 1 dobegin Winners := 0; Trades := 0; for p := 0 to PositionCount - 1 do begin if not PositionActive( p ) then begin Inc( Trades ); if PositionProfit( p ) > 0 then Inc( Winners ); end; end; if Trades > 0 then SetSeriesValue( Bar, WinLoss, Winners * 100 / Trades );
if CrossOverValue( Bar, CMOSeries( #Close, 20 ), -40 ) then BuyAtMarket( Bar + 1, 'CMO' ) else if CrossUnderValue( Bar, CMOSeries( #Close, 20 ), 40 ) then SellAtMarket( Bar + 1, #All, 'CMO' );end;
{ Plot the Win/Loss Ratio }WinLossPane := CreatePane( 100, false, true );

Position Management Functions 104
© 2003-2006 FMR Corp. All rights reserved.
SetPaneMinMax( WinLossPane, 0, 100 );PlotSeries( WinLoss, WinLossPane, #Green, #ThickHist );DrawLabel( 'Win/Loss Ratio', WinLossPane );
{ Clear the trades }ClearPositions;
{ Execute the system again, but only take the trade if the win/loss ratio was above 50 }for Bar := 20 to BarCount - 1 dobegin if CrossOverValue( Bar, CMOSeries( #Close, 20 ), -40 ) then begin if GetSeriesValue( Bar, WinLoss ) > 50 then BuyAtMarket( Bar + 1, 'CMO' ); end else if CrossUnderValue( Bar, CMOSeries( #Close, 20 ), 40 ) then SellAtMarket( Bar + 1, #All, 'CMO' );end;
11.4 GetPositionData
GetPositionData( Position: integer ): float;
RChartScripts RSimuScripts RPerfScripts XCMScripts
Description
Returns the value of any user-specific data for this Position [Number]. You can store asingle floating point value for each Position with the SetPositionData function in aChartScript (only). If no user-specific data is stored, the function returns 0.
Note: Position data does not influence $imulator decisions during periods ofinsufficient capital. This task is accomplished using SetPositionPriority.
Remarks
• Although you may assign data to a Position at any time after it has been created, theChartScript must use SetPositionData on the signal bar if you plan to retrieve thedata using GetPositionData in a SimuScript. Otherwise, using SetPositionDataafter the signal bar can result in a look-ahead (peeking) error during $imulatorprocessing.
• GetPositionData is available for use in a SimuScript referenced from the $imulatoronly.
• In a SimuScript, pass the special constant #Current to access the Position that the$imulator (or Portfolio Simulation) is currently sizing.
Example (SimuScript)
{ A ChartScript stores the current CMO level in the Position data. Use this value in a SimuScript to help establish Position size }var x: float;x := GetPositionData( #Current );x := ( x + 100 ) / 2;x := 100 - x;SetPositionSizePct( x );

WealthScript Function Reference, Wealth-Lab Pro™105
© 2003-2006 FMR Corp. All rights reserved.
Example
{ This script uses Position Data to store whether the signal was generated from an RSI or an SMA Crossover. It uses the Position data to execute the corresponding exit. }var P, BAR, CROSS: integer;for Bar := 50 to BarCount - 1 dobegin if CrossOverValue( Bar, RSISeries( #Close, 20 ), 30 ) then begin BuyAtMarket( Bar + 1, 'RSI Cross 30' ); SetPositionData( LastPosition, 1 ); end; if CrossOver( Bar, SMASeries( #Close, 20 ), SMASeries( #Close, 50 ) )then begin BuyAtMarket( Bar + 1, 'SMA CrossOver' ); SetPositionData( LastPosition, 2 ); end; if CrossUnderValue( Bar, RSISeries( #Close, 20 ), 70 ) then for P := 0 to PositionCount - 1 do if PositionActive( P ) then if GetPositionData( P ) = 1 then SellAtMarket( Bar + 1, P, 'RSI Cross 70' ); if CrossUnder( Bar, SMASeries( #Close, 20 ), SMASeries( #Close, 50 ) )then for P := 0 to PositionCount - 1 do if PositionActive( P ) then if GetPositionData( P ) = 2 then SellAtMarket( Bar + 1, P, 'SMA CrossOver' );end;
11.5 GetPositionPriority
GetPositionPriority( Position: integer ): float;
RChartScripts RSimuScripts RPerfScripts XCMScripts
Description
Returns the Priority value that was assigned to the Position via a call toSetPositionPriority. A Position's priority determines whether or not it will be includedby the portfolio $imulator tool if there are more trades available than capital. Positionswith a higher priority values take precedence. For example, a priority 5 Position will beincluded over a priority 1 Position if sufficient cash is not available for both Positions.
Remarks
• Priority values need not be simple integers, and, they can also be negative values.
• If Positions are not assigned priority by SetPositionPriority, Positions are chosenrandomly when sufficient cash is not available for all trading signals during$imulations. Note, however, that the random "seed" is always the same so that$imulation results will be reproducible.
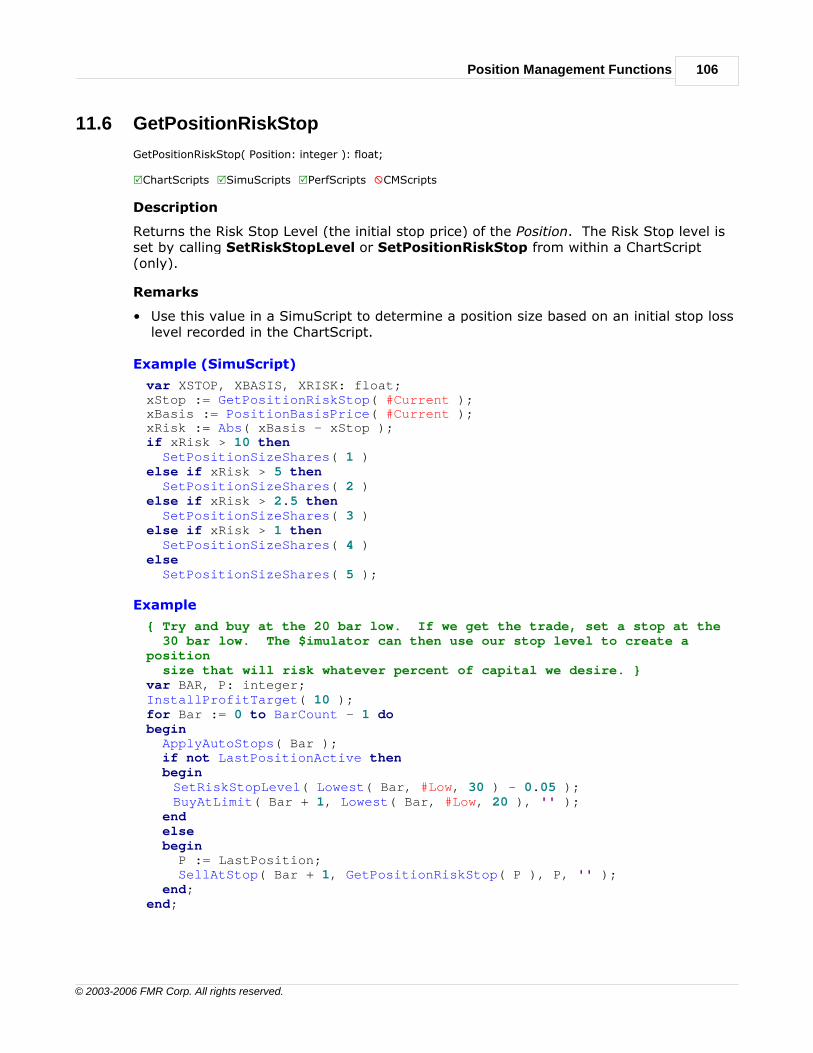
Position Management Functions 106
© 2003-2006 FMR Corp. All rights reserved.
11.6 GetPositionRiskStop
GetPositionRiskStop( Position: integer ): float;
RChartScripts RSimuScripts RPerfScripts XCMScripts
Description
Returns the Risk Stop Level (the initial stop price) of the Position. The Risk Stop level isset by calling SetRiskStopLevel or SetPositionRiskStop from within a ChartScript(only).
Remarks
• Use this value in a SimuScript to determine a position size based on an initial stop losslevel recorded in the ChartScript.
Example (SimuScript)
var XSTOP, XBASIS, XRISK: float;xStop := GetPositionRiskStop( #Current );xBasis := PositionBasisPrice( #Current );xRisk := Abs( xBasis - xStop );if xRisk > 10 then SetPositionSizeShares( 1 )else if xRisk > 5 then SetPositionSizeShares( 2 )else if xRisk > 2.5 then SetPositionSizeShares( 3 )else if xRisk > 1 then SetPositionSizeShares( 4 )else SetPositionSizeShares( 5 );
Example
{ Try and buy at the 20 bar low. If we get the trade, set a stop at the 30 bar low. The $imulator can then use our stop level to create aposition size that will risk whatever percent of capital we desire. }var BAR, P: integer;InstallProfitTarget( 10 );for Bar := 0 to BarCount - 1 dobegin ApplyAutoStops( Bar ); if not LastPositionActive then begin
SetRiskStopLevel( Lowest( Bar, #Low, 30 ) - 0.05 );BuyAtLimit( Bar + 1, Lowest( Bar, #Low, 20 ), '' );
end else begin P := LastPosition; SellAtStop( Bar + 1, GetPositionRiskStop( P ), P, '' ); end;end;

WealthScript Function Reference, Wealth-Lab Pro™107
© 2003-2006 FMR Corp. All rights reserved.
11.7 LastActivePosition
LastActivePosition: integer;
RChartScripts xSimuScripts RPerfScripts XCMScripts
Description
Returns the Position Number index of the most current active Position. If there are noactive Positions, the function returns -1.
Remarks
• The list of positions contains all trades that have been created since the script firststarted executing. Each trade can be either open or closed. Closed means that theshares have been sold (or covered, for short positions). LastActivePosition returnsthe last open trade in the list.
• Avoid using Last* functions in SimuScripts since they will not produce the desiredresult when used in the $imulator.
Example
{ This simple average down system can be effective if you have unlimitedcapital }var BAR, P: integer;for Bar := 20 to BarCount - 1 dobegin BuyAtLimit( Bar + 1, Lowest( Bar, #Close, 20 ), '' ); if LastActivePosition >= 0 then for P := 0 to PositionCount - 1 do SellAtLimit( Bar + 1, Highest( Bar, #High, 13 ), P, '' );end;
11.8 LastLongPositionActive
LastLongPositionActive: boolean;
RChartScripts xSimuScripts RPerfScripts XCMScripts
Description
Returns true if the last long Position is currently active.
Remarks
• The list of positions contains all trades that have been created since the script firststarted executing. Each trade can be either open or closed. If the last long position inthe list is open, then LastLongPositionActive returns boolean true.
• Avoid using Last* functions in SimuScripts since they will not produce the desiredresult when used in the $imulator.
Caution! If your script uses a WatchList loop, it's possible that the LastPosition isfrom a symbol different to the one currently being processed. You can usethe following function instead of LastLongPositionActive to ensure thatyou do not trade the last Position from the wrong symbol.

Position Management Functions 108
© 2003-2006 FMR Corp. All rights reserved.
function LastLongPositionActiveSym( sym: string ): boolean;begin Result := LastLongPositionActive; if Result then begin if PositionSymbol( LastPosition ) <> sym then Result := false; end;end;
11.9 LastPosition
LastPosition: integer;
RChartScripts xSimuScripts RPerfScripts XCMScripts
Description
Returns the Position Number of the most-recently created Position. This function ishandy in Trading Systems that work with only one open Position at a time.
Remarks
• The list of positions contains all trades that have been created since the script firststarted executing. Each trade can be either open or closed. Closed means that theshares have been sold (or covered, for short positions). LastPosition returns theposition number of the last trade in the list.
• LastPosition returns -1 if a position has not yet been created. Note that the numberof the first position is 0.
• LastPosition is equivalent to (PositionCount - 1).
• Avoid using Last* functions in SimuScripts since they will not produce the desiredresult when used in the $imulator.
Example
var Bar: integer;PlotSeries( SMASeries( #Close, 20 ), 0, #Red, #Thin );PlotSeries( SMASeries( #Close, 10 ), 0, #Blue, #Thin );for Bar := 40 to BarCount - 1 dobegin if CrossOver( Bar, SMASeries( #Close, 10 ), SMASeries( #Close, 20 ) )then BuyAtMarket( Bar + 1, '' ) else if CrossOver( Bar, SMASeries( #Close, 20 ), SMASeries( #Close, 10) ) then SellAtMarket( Bar + 1, LastPosition, '' );end;
11.10 LastPositionActive
LastPositionActive: boolean;
RChartScripts xSimuScripts RPerfScripts XCMScripts

WealthScript Function Reference, Wealth-Lab Pro™109
© 2003-2006 FMR Corp. All rights reserved.
Description
Returns true if the last Position is currently active. This is typically used in single Positiontrading systems to determine whether to execute the entry rules or the exit rules.
Remarks
• The list of positions contains all trades that have been created since the script firststarted executing. Each trade can be either open or closed. If the last position in thelist (returned by LastPosition) is open, then LastPositionActive returns booleantrue.
• Avoid using Last* functions in SimuScripts since they will not produce the desiredresult when used in the $imulator.
Caution! If your script uses a WatchList loop, it's possible that the LastPosition isfrom a symbol different to the one currently being processed. You can usethe following function instead of LastPositionActive to ensure that you donot trade the last Position from the wrong symbol.
function LastPositionActiveSym( sym: string ): boolean;begin Result := LastPositionActive; if Result then begin if PositionSymbol( LastPosition ) <> sym then Result := false; end;end;
Example
var BAR: integer;InstallStopLoss( 20 );InstallProfitTarget( 7 );for Bar := 40 to BarCount - 1 dobegin ApplyAutoStops( Bar ); if not LastPositionActive then if CrossOverValue( Bar, RSISeries( #Average, 40 ), 25 ) then BuyAtLimit( Bar + 1, PriceHigh( Bar ), '' );end;
11.11 LastShortPositionActive
LastShortPositionActive: boolean;
RChartScripts xSimuScripts RPerfScripts XCMScripts
Description
Returns true if the last short Position is currently active.
Remarks
• The list of positions contains all trades that have been created since the script firststarted executing. Each trade can be either open or closed. If the last short positionin the list is open, then LastShortPositionActive returns boolean true.

Position Management Functions 110
© 2003-2006 FMR Corp. All rights reserved.
• Avoid using Last* functions in SimuScripts since they will not produce the desiredresult when used in the $imulator.
Caution! If your script uses a WatchList loop, it's possible that the LastPosition isfrom a symbol different to the one currently being processed. You can usethe following function instead of LastShortPositionActive to ensure thatyou do not trade the last Position from the wrong symbol.
function LastShortPositionActiveSym( sym: string ): boolean;begin Result := LastShortPositionActive; if Result then begin if PositionSymbol( LastPosition ) <> sym then Result := false; end;end;
11.12 MarketPosition
MarketPosition: integer;
RChartScripts xSimuScripts RPerfScripts XCMScripts
Description
Returns 0 if the last position is closed, or a position has not yet been created. Returns 1if the last position is active and long, and -1 if the last position is active and short. Thisfunction is useful for single-position systems that take long and short positions (seeexample).
Remarks
• Avoid using MarketPosition in SimuScripts since it will not produce the desired resultwhen used in the $imulator.
Example
{ Channel Breakout System for Futures }var HH, LL, HL, LH, BAR: integer;HH := HighestSeries( #High, 20 );LL := LowestSeries( #Low, 20 );HL := HighestSeries( #Low, 20 );LH := LowestSeries( #High, 20 );for Bar := 21 to BarCount - 1 dobegin case MarketPosition of 0: begin if not BuyAtStop( Bar + 1, @HH[Bar], '' ) then ShortAtStop( Bar + 1, @LL[Bar], '' ); end; 1: begin if SellAtStop( Bar + 1, @LH[Bar], LastPosition, '' ) then ShortAtStop( Bar + 1, @LL[Bar], '' );
WealthScript Function Reference, Wealth-Lab Pro™111
© 2003-2006 FMR Corp. All rights reserved.
end; -1: begin if CoverAtStop( Bar + 1, @HL[Bar], LastPosition, '' ) then BuyAtStop( Bar + 1, @HH[Bar], '' ); end; end;end;
11.13 PositionActive
PositionActive( Position: integer ): boolean;
RChartScripts RSimuScripts RPerfScripts XCMScripts
Description
Returns true if the specified Position is open, and false if it has been closed. Use thisfunction in trading systems that manage multiple Positions.
Remarks
• For SimuScripts, PositionActive returns true if the specified Position is active at thetime of the SimuScript call, otherwise false. You can use this function in PositionSizing scripts that are based on streaks, like the one that follows.
Example (SimuScript)
{ Use winning streaks of closed positions to establish a position size }var STREAK, P: integer;streak := 0;for p := PositionCount - 1 downto 0 dobegin if not PositionActive( p ) then begin if PositionProfit( p ) <= 0 then Break else streak := streak + 1; end;end;if streak = 0 then streak := 1;if streak > 10 then streak := 10;SetPositionSizePct( streak * 10 );
Example
var BAR, P: integer;for Bar := 40 to BarCount - 1 dobegin if CrossOverValue( Bar, RSISeries( #Average, 40 ), 35 ) then BuyAtLimit( Bar + 1, PriceHigh( Bar ), '' ); if CrossUnderValue( Bar, RSISeries( #Average, 40 ), 70 ) then for P := 0 to PositionCount - 1 do if PositionActive( P ) then SellAtMarket( Bar + 1, P, '' );
Position Management Functions 112
© 2003-2006 FMR Corp. All rights reserved.
end;
11.14 PositionBasisPrice
PositionBasisPrice( Position: integer ): float;
RChartScripts RSimuScripts RPerfScripts XCMScripts
Description
Returns the Basis Price of the specified Position. The Basis Price is the price used toestablish the size of the Position.
Remarks
• For next-bar market orders, the Basis Price is the close of the bar on which the trade issignaled. The actual entry price is the open of the following bar.
• For AtClose orders, the Basis Price is equal to the closing price of the signal bar.
• For stop and limit orders, the Basis Price is equal to the Stop/Limit price. The trademay be filled at a different price if there is a gap against the Stop/Limit price.
Example (SimuScript)
var XSTOP, XBASIS, XRISK: float;xStop := GetPositionRiskStop( #Current );xBasis := PositionBasisPrice( #Current );xRisk := Abs( xBasis - xStop );if xRisk > 10 then SetPositionSizeShares( 1 )else if xRisk > 5 then SetPositionSizeShares( 2 )else if xRisk > 2.5 then SetPositionSizeShares( 3 )else if xRisk > 1 then SetPositionSizeShares( 4 )else SetPositionSizeShares( 5 );
Example
{ Display differences between Basis Price and Entry Price }var Bar: integer;PlotStops;for Bar := 4 to BarCount - 1 dobegin if LastPositionActive then SellAtStop( Bar + 1, Lowest( Bar, #Low, 3 ), LastPosition, '' ) else begin if BuyAtStop( Bar + 1, Highest( Bar, #High, 3 ), '' ) then Print( FloatToStr( PositionEntryPrice( LastPosition ) - PositionBasisPrice( LastPosition ) ) ); end;end;
WealthScript Function Reference, Wealth-Lab Pro™113
© 2003-2006 FMR Corp. All rights reserved.
11.15 PositionBarsHeld
PositionBarsHeld( Position: integer ): integer;
RChartScripts RSimuScripts RPerfScripts XCMScripts
Description
Returns the number of bars the specified Position was active. This method is useful whencalculating statistics at the end of the script and should not be used within the tradingloop since it does not provide the number of bars currently held.
Remarks
• If the position was closed, PositionBarsHeld returns the same result obtained bysubtracting PositionEntryBar from PositionExitBar.
• If the position is open after the trading loop ends, PositionBarsHeld returns theresult obtained by subtracting PositionEntryBar from BarCount - 1.
11.16 PositionCount
PositionCount: integer;
RChartScripts RùSimuScripts RPerfScripts XCMScripts
Description
Returns the total number of trading system Positions, both open and closed.
Remarks
• In SimuScripts, PositionCount returns the number of Positions at the time theSimuScript was called. This count does not include the Position that is currently beingprocessed by the SimuScript.
• Since a Portfolio Simulation can reject trades for insufficient cash, PositionCount candiffer from a Raw Profit PositionCount. Therefore in a SimuScript, PositionCountreturns the number of positions that have been accepted by the current $imulation runat the time the SimuScript is called.
Example (SimuScript)
{ Scale down Position size the more active Positions that we have }var PS, P: integer;ps := 40;for p := 0 to PositionCount - 1 dobegin if PositionActive( p ) then begin ps := ps - 10; if ps = 10 then Break; end;end;SetPositionSizePct( ps );
The following ChartScript uses an advanced technique for quickly looping through all

Position Management Functions 114
© 2003-2006 FMR Corp. All rights reserved.
active Positions. Knowing that the most-recently created Positions have the greatestPosition Numbers, we can "count backwards" and exit the PositionCount loop afterdetermining that all active Positions have been processed. The result is a significantsavings in processing time for ChartScripts that create many Positions since older, closedPositions are not processed needlessly.
Example
{ The script adds a long position whenever CumDown is 9 or greater. When CumUp = 9, all active positions are sold. }var Bar, p, Processed, APCount: integer;for Bar := 9 to BarCount - 1 dobegin if CumDown( Bar, #Close, 4 ) >= 9 then BuyAtMarket( Bar + 1, '' ); if ( CumUp( Bar, #Close, 4 ) = 9 ) then begin APCount := ActivePositionCount; Processed := 0; for p := PositionCount - 1 downto 0 do begin if PositionActive( p ) then begin SellAtMarket( Bar + 1, p, '' ); Inc( Processed ); end;
if Processed = APCount then break; end; end;end;
11.17 PositionEntryBar
PositionEntryBar( Position: integer ): integer;
RChartScripts RSimuScripts RPerfScripts XCMScripts
Description
Returns the bar number on which the Position was established.
Example
var Bar: integer;for Bar := 20 to BarCount - 1 dobegin if not LastPositionActive then begin if StochK( Bar, 20 ) > 70 then BuyAtMarket( Bar + 1, 'Stoch' ); end else begin { Sell after 10 days } if Bar - PositionEntryBar( LastPosition ) = 10 then SellAtMarket( Bar + 1, LastPosition, '10 day' ); end;
WealthScript Function Reference, Wealth-Lab Pro™115
© 2003-2006 FMR Corp. All rights reserved.
end;
11.18 PositionEntryPrice
PositionEntryPrice( Position: integer ): float;
RChartScripts RSimuScripts RPerfScripts XCMScripts
Description
Returns the entry price of the specified Position.
Remarks
• When backtesting, PositionEntryPrice returns the actual entry price for signals onBar + 1 even though the order is executed on Bar. Do not use the entry price for aPosition created on Bar for other trading rules on the same Bar.
• In general, SimuScripts should use PositionBasisPrice, not PositionEntryPrice, forthe #Current Position. This is because at the time the SimuScript is called, only thebasis price is known for next-bar orders. See the SimuScript example below.
• PositionEntryPrice always returns zero for entry signal Alerts.
Example (SimuScript)
{ Use a larger size if the Basis Price of the current Position is less than the average entry price of all Positions thus far. }var p: integer;var sumPr, avgPr: float;
if PositionCount = 0 then SetPositionSizeShares( 200 )elsebegin for p := 0 to PositionCount - 1 do sumPr := sumPr + PositionEntryPrice( p ); avgPr := sumPr / PositionCount;
if PositionBasisPrice( #Current ) < avgPr then SetPositionSizeShares( 300 ) else SetPositionSizeShares( 200 );end;
Example
{ CMO Signals with Profit Target will open multiple Positions, but will wait until the price is lower than the previously established Position.}var LOWESTPOSITION: float;var NPANE, LASTBARBOUGHT, BAR, I: integer;
{ Plot 14 day CMO in new chart pane }nPane := CreatePane( 60, TRUE, FALSE );PlotSeries( CMOSeries( #Close, 20 ), nPane, 009, 0 );DrawText( 'CMO 20', nPane, 4, 4, 006, 8 );SetPaneMinMax( nPane, -60, 60 );DrawHorzLine( 0, nPane, 666, 0 );

Position Management Functions 116
© 2003-2006 FMR Corp. All rights reserved.
DrawHorzLine( 50, nPane, 666, 1 );DrawHorzLine( -50, nPane, 666, 1 );
SetBarColors( #Black, #Black );InstallProfitTarget( 10 );LastBarBought := 0;for Bar := 15 to BarCount - 1 dobegin if CMO( Bar, #Close, 20 ) <= -50 then SetBarColor( Bar, #Blue ) else if CMO( Bar, #Close, 20 ) >= 50 then SetBarColor( Bar, #Red ); ApplyAutoStops( Bar ); if CMO( Bar, #Close, 20 ) > -50 then if CMO( Bar - 1, #Close, 20 ) <= -50 then begin LowestPosition := 9999.9; for i := 0 to PositionCount - 1 do if PositionActive( i ) then if PositionEntryPrice( i ) < LowestPosition then LowestPosition := PositionEntryPrice( i ); if ( LowestPosition = 9999.9 ) or ( PriceClose( Bar ) <LowestPosition ) then if Bar >= ( LastBarBought + 9 ) then begin BuyAtMarket( Bar + 1, '' ); LastBarBought := Bar + 1; end; end; if CMO( Bar, #Close, 20 ) < 50 then if CMO( Bar - 1, #Close, 20 ) >= 50 then for i := 0 to PositionCount - 1 do if PositionActive( i ) then SellAtMarket( Bar + 1, i, '' );end;
11.19 PositionExitBar
PositionExitBar( Position: integer ): integer;
RChartScripts RSimuScripts RPerfScripts XCMScripts
Description
Returns the bar number on which the specified Position was closed. If Position is stillactive on the last bar of the chart, then PositionExitBar returns 0.
Example
{ Display the shortest and the longest holding time }var BAR, LOWBAR, HIGHBAR, P, BARSHELD: integer;for Bar := 20 to BarCount - 1 dobegin if not LastPositionActive then begin if CrossUnderValue( Bar, RSISeries( #Close, 10 ), 20 ) then BuyAtMarket( Bar + 1, '' ); end

WealthScript Function Reference, Wealth-Lab Pro™117
© 2003-2006 FMR Corp. All rights reserved.
else begin if CrossOverValue( Bar, RSISeries( #Close, 10 ), 60 ) then SellAtMarket( Bar + 1, LastPosition, '' ); end;end;
LowBar := 0;HighBar := 0;for P := 0 to PositionCount - 1 dobegin BarsHeld := PositionExitBar( P ) - PositionEntryBar( P ); if BarsHeld > HighBar then HighBar := BarsHeld; if ( BarsHeld < LowBar ) or ( LowBar = 0 ) then LowBar := BarsHeld;end;DrawLabel( 'Longest Holding Time: ' + IntToStr( HighBar ), 0 );DrawLabel( 'Shortest Holding Time: ' + IntToStr( LowBar ), 0 );
11.20 PositionExitPrice
PositionExitPrice( Position: integer ): float;
RChartScripts RSimuScripts RPerfScripts XCMScripts
Description
Returns the exit price of the specified Position.
Example
{ This procedure reports on entry and exit levels of all trades Note: #9 inserts a tab character and is equivalent to chr(9) }procedure TradeReport;begin var f, p: integer; var s: string; f := FileCreate( 'c:\trade report.txt' ); for p := 0 to PositionCount - 1 do begin s := 'Entry:' + #9 + DateToStr( GetDate( PositionEntryBar( p ) ) ) + #9 + FloatToStr( PositionEntryPrice( p ) ) + #9; s := s + 'Exit: ' + #9 + DateToStr( GetDate( PositionExitBar( p ) ) ) + #9 + FloatToStr( PositionExitPrice( p ) ); FileWrite( f, s ); end;end;
11.21 PositionExitSignalName
PositionExitSignalName( Position: integer ): string;
RChartScripts RSimuScripts RPerfScripts XCMScripts

Position Management Functions 118
© 2003-2006 FMR Corp. All rights reserved.
Description
Returns the "Signal Name" of the exit signal for the specified Position. The Signal Nameis always the last parameter (SignalName) of the SellAt or CoverAt function that closedthe Position.
Tip: If your strategy has many different entries and exits, you use a Position's entryor exit signal name as a condition for future trading decisions, if desired.
Example
var BAR: integer;InstallStopLoss( 20 );InstallProfitTarget( 100 );InstallTrailingStop( 10, 50 );for Bar := 30 to BarCount - 1 dobegin ApplyAutoStops( Bar ); if CrossOverValue( Bar, RSISeries( #Close, 20 ), 28 ) then BuyAtMarket( Bar + 1, '' );end;if PositionCount > 0 then DrawLabel( 'Last Position was Closed by ' + PositionExitSignalName( LastPosition ), 0 );
11.22 PositionLong
PositionLong( Position: integer ): boolean;
RChartScripts RSimuScripts RPerfScripts XCMScripts
Description
Returns true if the specified Position is long, and false if it is short.
Remarks
• To access the Position that the $imulator (or Portfolio Simulation) is currently workingwith, use the special constant #Current.
• See also: PositionShort
Example
var BAR: integer;for Bar := 5 to BarCount - 1 dobegin if LastPositionActive then if PositionLong( LastPosition ) then SellAtStop( Bar + 1, Lowest( Bar - 1, #Low, 4 ), LastPosition, ''); if not LastPositionActive then ShortAtStop( Bar + 1, Lowest( Bar - 1, #Low, 4 ), '' ) else if LastPositionActive and not PositionLong( LastPosition ) then CoverAtStop( Bar + 1, Highest( Bar - 1, #High, 4 ), LastPosition, ''); if not LastPositionActive then BuyAtStop( Bar + 1, Highest( Bar - 1, #High, 4 ), '' );

WealthScript Function Reference, Wealth-Lab Pro™119
© 2003-2006 FMR Corp. All rights reserved.
end;
11.23 PositionMAE
PositionMAE( Position: integer ): float;
RChartScripts RSimuScripts RPerfScripts XCMScripts
Description
Returns the Max Adverse Excursion of a closed Position. Max Adverse Excursion is theworst loss that the Position experienced during its lifetime on an intraday basis. Theresult is reported in dollars, but you can use PositionMAEPct to return the MAE inpercentage terms.
Remarks
• The MAE calculation uses the low of the entry bar for market or stop orders only. Forlimit and at close orders, MAE cannot be determined for the entry bar.
• Do not use PositionMAE for Positions that are still active. To obtain the MAE for anactive Position, or the MAE for a particular bar, use the PositionOpenMAE function.
• Use PositionMAE, for example, at the end of a script in a PositionCount loop to collecttrading statistics.
• Commissions are not considered in the MAE calculation.
Warning! Because it is a cash-based function, PositionMAE cannot be employed in aChartScript's trading rules if destined for the $imulator.
Example
var Bar, p: integer;var ftmp: float;
for Bar := 20 to BarCount - 1 dobegin{ Trading system rules }end;
{ Find the average PositionMAE }for p := 0 to PositionCount - 1 do ftmp := ftmp + PositionMAE( p );
ftmp := ftmp / PositionCount;ShowMessage('Avg MAE = ' + FormatFloat( '0.00', ftmp ) );
11.24 PositionMAEPct
PositionMAEPct( Position: integer ): float;
RChartScripts RSimuScripts RPerfScripts XCMScripts

Position Management Functions 120
© 2003-2006 FMR Corp. All rights reserved.
Description
Returns the Max Adverse Excursion of a closed Position in percent. Max AdverseExcursion is the worst loss that the Position experienced during its lifetime on an intradaybasis. Use PositionMAE to return the MAE in dollar terms.
Remarks
• The MAE calculation uses the low of the entry bar for market or stop orders only. Forlimit and at close orders, MAE cannot be determined for the entry bar.
• Do not use PositionMAEPct for Positions that are still active. To obtain thepercentage MAE for an active Position, or the percentage MAE for a particular bar, usethe PositionOpenMAEPct function.
• Use PositionMAEPct, for example, at the end of a script in a PositionCount loop tocollect trading statistics.
• Commissions are not considered in the MAEPct calculation.
Example
var Bar, p: integer;var ftmp: float;
for Bar := 20 to BarCount - 1 dobegin{ Trading system rules }end;
{ Find the average PositionMAEPct }for p := 0 to PositionCount - 1 do ftmp := ftmp + PositionMAEPct( p );
ftmp := ftmp / PositionCount;ShowMessage('Avg MAE (%) = ' + FormatFloat( '0.00%', ftmp ) );
11.25 PositionMFE
PositionMFE( Position: integer ): float;
RChartScripts RSimuScripts RPerfScripts XCMScripts
Description
Returns the Max Favorable Excursion of a closed Position. Max Favorable Excursion is thelargest gain that the Position experienced during its lifetime on an intraday basis. Theresult is reported in dollars, but you can use PositionMFEPct to return the MFE inpercentage terms.
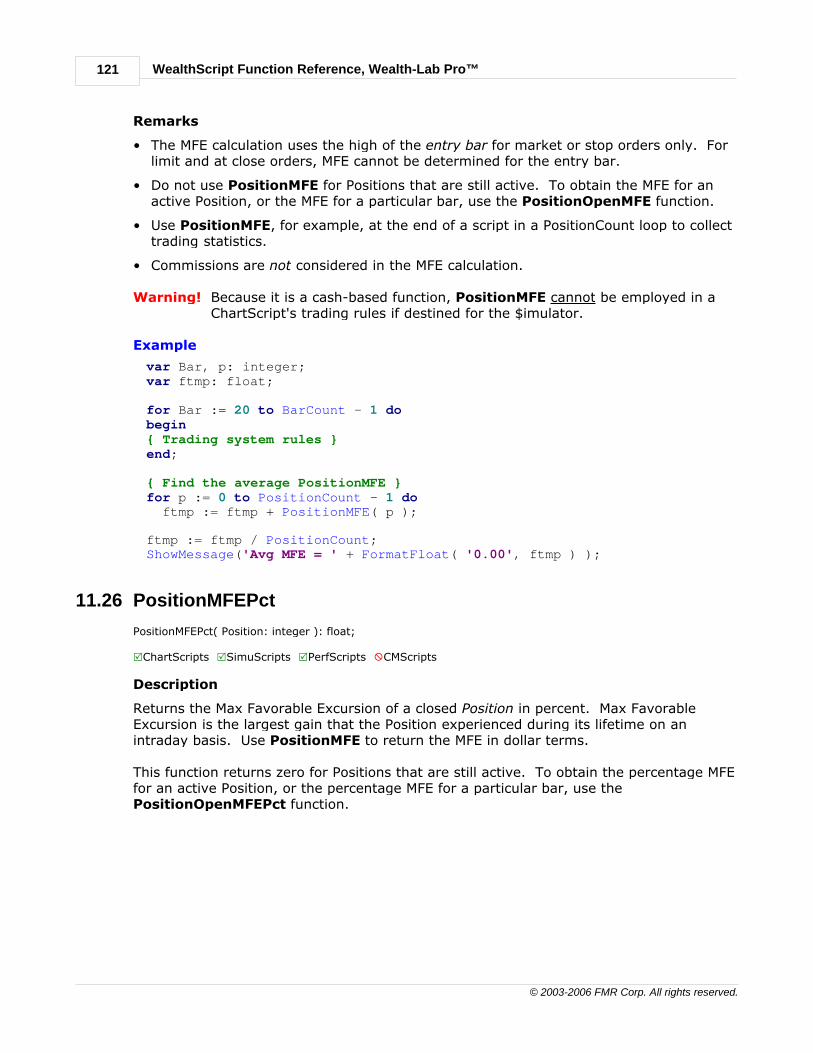
WealthScript Function Reference, Wealth-Lab Pro™121
© 2003-2006 FMR Corp. All rights reserved.
Remarks
• The MFE calculation uses the high of the entry bar for market or stop orders only. Forlimit and at close orders, MFE cannot be determined for the entry bar.
• Do not use PositionMFE for Positions that are still active. To obtain the MFE for anactive Position, or the MFE for a particular bar, use the PositionOpenMFE function.
• Use PositionMFE, for example, at the end of a script in a PositionCount loop to collecttrading statistics.
• Commissions are not considered in the MFE calculation.
Warning! Because it is a cash-based function, PositionMFE cannot be employed in aChartScript's trading rules if destined for the $imulator.
Example
var Bar, p: integer;var ftmp: float;
for Bar := 20 to BarCount - 1 dobegin{ Trading system rules }end;
{ Find the average PositionMFE }for p := 0 to PositionCount - 1 do ftmp := ftmp + PositionMFE( p );
ftmp := ftmp / PositionCount;ShowMessage('Avg MFE = ' + FormatFloat( '0.00', ftmp ) );
11.26 PositionMFEPct
PositionMFEPct( Position: integer ): float;
RChartScripts RSimuScripts RPerfScripts XCMScripts
Description
Returns the Max Favorable Excursion of a closed Position in percent. Max FavorableExcursion is the largest gain that the Position experienced during its lifetime on anintraday basis. Use PositionMFE to return the MFE in dollar terms.
This function returns zero for Positions that are still active. To obtain the percentage MFEfor an active Position, or the percentage MFE for a particular bar, use thePositionOpenMFEPct function.

Position Management Functions 122
© 2003-2006 FMR Corp. All rights reserved.
Remarks
• The MFE calculation uses the high of the entry bar for market or stop orders only. Forlimit and at close orders, MFE cannot be determined for the entry bar.
• Do not use PositionMFEPct for Positions that are still active. To obtain thepercentage MFE for an active Position, or the percentage MFE for a particular bar, usethe PositionOpenMFEPct function.
• Use PositionMFEPct, for example, at the end of a script in a PositionCount loop tocollect trading statistics.
• Commissions are not considered in the MFEPct calculation.
Example
var Bar, p: integer;var ftmp: float;
for Bar := 20 to BarCount - 1 dobegin{ Trading system rules }end;
{ Find the average PositionMFEPct }for p := 0 to PositionCount - 1 do ftmp := ftmp + PositionMFEPct( p );
ftmp := ftmp / PositionCount;ShowMessage('Avg MFE (%) = ' + FormatFloat( '0.00%', ftmp ) );
11.27 PositionOpenMAE
PositionOpenMAE( Position: integer; Bar: integer ): float;
RChartScripts RSimuScripts RPerfScripts XCMScripts
Description
Returns the Max Adverse Excursion of an open Position, or the MAE for a Position as ofthe specified Bar. Max Adverse Excursion is the worst loss that the Position experiencedduring its lifetime on an intraday basis. The result is reported in dollars (negative), usePositionOpenMAEPct to return the MAE of an open Position in percentage terms.
Remarks
• The MAE calculation uses the low of the entry bar for market or stop orders only. Forlimit and at close orders, MAE cannot be determined for the entry bar.
• Commissions are not considered in the MAE calculation.
Warning! Because it is a cash-based function, PositionOpenMAE cannot be employedin a ChartScript's trading rules if destined for the $imulator.
Example
var Bar, p: integer;var ePrice: float;

WealthScript Function Reference, Wealth-Lab Pro™123
© 2003-2006 FMR Corp. All rights reserved.
PlotStops;for Bar := 50 to BarCount - 1 dobegin if LastPositionActive then begin { Exit rules } p := LastPosition; ePrice := PositionEntryPrice( p );
{ Forget about profit and initiate a break-even stop when MAE exceeds -$750 } if PositionOpenMAE( p, Bar ) < -750 then SellAtLimit( Bar + 1, ePrice, p, 'beStop' ) else SellAtLimit( Bar + 1, ePrice * 1.25, p, 'Pft Tgt' ); end else { Entry rule } if CrossOver( Bar, #Close, SMASeries( #Close, 50 ) ) then BuyAtMarket( Bar + 1, '' );end;
11.28 PositionOpenMAEPct
PositionOpenMAEPct( Position: integer; Bar: integer ): float;
RChartScripts RSimuScripts RPerfScripts XCMScripts
Description
Returns the Max Adverse Excursion of an open Position, or the MAE for a Position as of aspecified Bar, in percent. Max Adverse Excursion is the worst loss that the Positionexperienced during its lifetime on an intraday basis. Use PositionOpenMAE to returnthe MAE of an open Position in dollar terms.
Remarks
• The MAE calculation uses the low of the entry bar for market or stop orders only. Forlimit and at close orders, MAE cannot be determined for the entry bar.
• Commissions are not considered in the MAEPct calculation.
Example
var Bar, p: integer;var ePrice: float;
PlotStops;for Bar := 50 to BarCount - 1 dobegin if LastPositionActive then begin { Exit rules } p := LastPosition; ePrice := PositionEntryPrice( p );
{ Forget about the 25% profit and initiate a break-even stop whenMAEPct drops -15% } if PositionOpenMAEPct( p, Bar ) <= -15 then SellAtLimit( Bar + 1, ePrice, p, 'beStop' ) else SellAtLimit( Bar + 1, ePrice * 1.25, p, 'Pft Tgt' );

Position Management Functions 124
© 2003-2006 FMR Corp. All rights reserved.
end else { Entry rule } if CrossOver( Bar, #Close, SMASeries( #Close, 50 ) ) then BuyAtMarket( Bar + 1, '' );end;
11.29 PositionOpenMFE
PositionOpenMFE( Position: integer; Bar: integer ): float;
RChartScripts RSimuScripts RPerfScripts XCMScripts
Description
Returns the Max Favorable Excursion of an open Position, or the MFE for a Position as of aspecified Bar. Max Favorable Excursion is the largest gain that the Position experiencedduring its lifetime on an intraday basis. The result is reported in dollars, usePositionOpenMFEPct to return the MFE of an open Position in percentage terms.
Remarks
• The MFE calculation uses the high of the entry bar for market or stop orders only. Forlimit and at close orders, MFE cannot be determined for the entry bar.
• Commissions are not considered in the MFE calculation.
Warning! Because it is a cash-based function, PositionOpenMFE cannot be employedin a ChartScript's trading rules if destined for the $imulator.
11.30 PositionOpenMFEPct
PositionOpenMFEPct( Position: integer; Bar: integer ): float;
RChartScripts RSimuScripts RPerfScripts XCMScripts
Description
Returns the Max Favorable Excursion of an open Position, or the MFE for a Position as of aspecified Bar, in percent. Max Favorable Excursion is the largest gain that the Positionexperienced during its lifetime on an intraday basis. Use PositionOpenMFE to returnthe MFE of an open Position in dollar terms.
Remarks
• The MFE calculation uses the high of the entry bar for market or stop orders only. Forlimit and at close orders, MFE cannot be determined for the entry bar.
• Commissions are not considered in the MFEPct calculation.
11.31 PositionOpenProfit
PositionOpenProfit( Bar: integer; Position: integer ): float;
RChartScripts RSimuScripts RPerfScripts XCMScripts

WealthScript Function Reference, Wealth-Lab Pro™125
© 2003-2006 FMR Corp. All rights reserved.
Description
Returns the current profit level of the Position (in dollars) as of the specified Bar. If thePosition is closed, and the Bar number is on or before the Bar on which that the Positionwas closed, this function returns the same value as PositionProfit.
Remarks
• The value reported for PositionOpenProfit reflects trading costs as of the specifiedBar, i.e, one-sided commissions and slippage are deducted from profit (or loss) whilethe position is open.
Warning! Because it is a cash-based function, PositionOpenProfit cannot be employedin a ChartScript's trading rules if destined for the $imulator.
Example
{ Record a position's open profit as a Price Series. This system buys on a crossover of a 30-period weighted moving average and sells after 20 bars. }var Bar, ProfitPane, hMA, hPftSer: integer;var fPft: float;
hMA := WMASeries( #Close, 30 );hPftSer := CreateSeries;
InstallTimeBasedExit( 20 );for Bar := 30 to BarCount - 1 dobegin ApplyAutoStops( Bar ); if not LastPositionActive then begin if CrossOverValue( Bar, #Close, @hMA[Bar-1] ) then BuyAtMarket( Bar + 1, 'Xover' ); end else @hPftSer[Bar] := PositionOpenProfit( Bar, LastPosition );
end;
ProfitPane := CreatePane( 75, true, true );PlotSeriesLabel( hPftSer, ProfitPane, 009, #Histogram, 'Open Profit' );PlotSeries( hMA, 0, 909, #Thin );
11.32 PositionOpenProfitPct
PositionOpenProfitPct( Bar: integer; Position: integer ): float;
RChartScripts RSimuScripts RPerfScripts XCMScripts
Description
Returns the current percentage profit level of the Position as of the specified Bar. If thePosition is closed, and the Bar number is on or before the Bar on which that the Positionwas closed, this function returns the same value as PositionProfitPct.
Remarks

Position Management Functions 126
© 2003-2006 FMR Corp. All rights reserved.
• The value reported for PositionOpenProfitPct reflects trading costs as of thespecified Bar, i.e, one-sided commissions and slippage are deducted from profit (orloss) while the position is open.
Warning! For non-zero commissions, PositionProfitPct is not compatible with the$imulator.
Example
{ Record a position's open profit percentage as a Price Series. This system buys on a crossover of a 30-period weighted moving average and sells after 20 bars. }var Bar, ProfitPane, hMA, hPftSer: integer;var fPft: float;
hMA := WMASeries( #Close, 30 );hPftSer := CreateSeries;
InstallTimeBasedExit( 20 );for Bar := 30 to BarCount - 1 dobegin ApplyAutoStops( Bar ); if not LastPositionActive then begin if CrossOverValue( Bar, #Close, @hMA[Bar-1] ) then BuyAtMarket( Bar + 1, 'Xover' ); end else @hPftSer[Bar] := PositionOpenProfitPct( Bar, LastPosition );
end;
ProfitPane := CreatePane( 75, true, true );PlotSeriesLabel( hPftSer, ProfitPane, 009, #Histogram, 'Open Profit Pct');PlotSeries( hMA, 0, 909, #Thin );
11.33 PositionOrderType
PositionOrderType( Position: integer ): integer;
RChartScripts RSimuScripts RPerfScripts XCMScripts
Description
Returns an integer indicating the type of order used for the specified Position.
0 = Market1 = Stop2 = Limit3 = Close
Remarks
• See CMOrderType for CommissionScripts.
Example

WealthScript Function Reference, Wealth-Lab Pro™127
© 2003-2006 FMR Corp. All rights reserved.
{ SimuScript: Vary the number of shares purchased based on the PositionOrderType }case PositionOrderType( #Current ) of 0, 1: // AtMarket, AtStop SetPositionSizeShares( 500 ); 2: // AtLimit SetPositionSizeShares( 300 ); else SetPositionSizeShares( 100 );end;
11.34 PositionProfit
PositionProfit( Position: integer ): float;
RChartScripts RSimuScripts RPerfScripts XCMScripts
Description
Returns the net profit in dollars of the specified closed Position. Use PositionProfitPctto return the profit in percentage terms.
Remarks
• The value reported for PositionProfit is reduced by the trading costs, i.e,commissions and slippage.
• Use PositionOpenProfit to return the current profit of an open Position at a specificbar. The value reported by PositionProfit for an open Position is invalid.
Warning! Because it is a cash-based function, PositionProfit cannot be employed in aChartScript's trading rules if destined for the $imulator.
Example (SimuScript)
{ Use 20% sizing, but scale back to 10% if the last closed Position was aloss }var p: integer;var x: float = 20;for p := PositionCount - 1 downto 0 do if not PositionActive( p ) then begin if PositionProfit( p ) < 0 then x := 10; break; end;
SetPositionSizePct( x );
Example
{ This function returns the average profit of the last "Num" Positions }function AvgProfit( Bar, Num: integer ): float;begin var p: integer; var sump: float; sump := 0; for p := PositionCount - 1 downto PositionCount - Num do
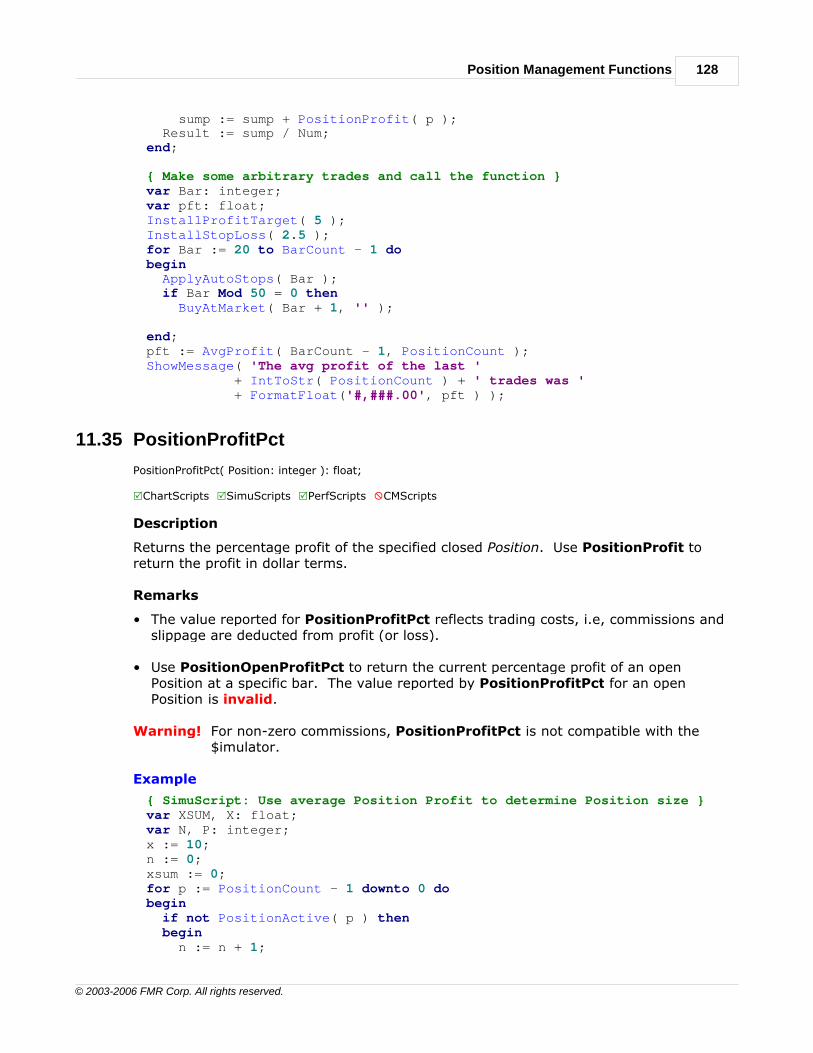
Position Management Functions 128
© 2003-2006 FMR Corp. All rights reserved.
sump := sump + PositionProfit( p ); Result := sump / Num;end;
{ Make some arbitrary trades and call the function }var Bar: integer;var pft: float;InstallProfitTarget( 5 );InstallStopLoss( 2.5 );for Bar := 20 to BarCount - 1 dobegin ApplyAutoStops( Bar ); if Bar Mod 50 = 0 then BuyAtMarket( Bar + 1, '' );
end;pft := AvgProfit( BarCount - 1, PositionCount );ShowMessage( 'The avg profit of the last ' + IntToStr( PositionCount ) + ' trades was ' + FormatFloat('#,###.00', pft ) );
11.35 PositionProfitPct
PositionProfitPct( Position: integer ): float;
RChartScripts RSimuScripts RPerfScripts XCMScripts
Description
Returns the percentage profit of the specified closed Position. Use PositionProfit toreturn the profit in dollar terms.
Remarks
• The value reported for PositionProfitPct reflects trading costs, i.e, commissions andslippage are deducted from profit (or loss).
• Use PositionOpenProfitPct to return the current percentage profit of an openPosition at a specific bar. The value reported by PositionProfitPct for an openPosition is invalid.
Warning! For non-zero commissions, PositionProfitPct is not compatible with the$imulator.
Example
{ SimuScript: Use average Position Profit to determine Position size }var XSUM, X: float;var N, P: integer;x := 10;n := 0;xsum := 0;for p := PositionCount - 1 downto 0 dobegin if not PositionActive( p ) then begin n := n + 1;

WealthScript Function Reference, Wealth-Lab Pro™129
© 2003-2006 FMR Corp. All rights reserved.
xsum := xsum + PositionProfitPct( p ); if n = 10 then Break; end;end;if xsum > 0 thenbegin x := xsum / n; if x < 10 then x := 10;end;SetPositionSizePct( x );
11.36 PositionShares
PositionShares( Position: integer ): integer;
RChartScripts RSimuScripts RPerfScripts XCMScripts
Description
Returns the number of shares (or contracts) in the specified Position.
Example
{ Write number of shares of open Positions to debug window }procedure WriteOpenTrades;begin var i: integer; for i := 0 to PositionCount - 1 do if PositionActive( i ) then Print( IntToStr( PositionShares( i ) ) + ' Shares ' + GetSymbol );end;
11.37 PositionShort
PositionShort( Position: integer ): boolean;
RChartScripts RSimuScripts RPerfScripts XCMScripts
Description
Returns true if the specified Position is a short Position.
Remarks
• To access the Position that the $imulator (or Portfolio Simulation) is currently workingwith, use the special constant #Current.
• See also: PositionLong
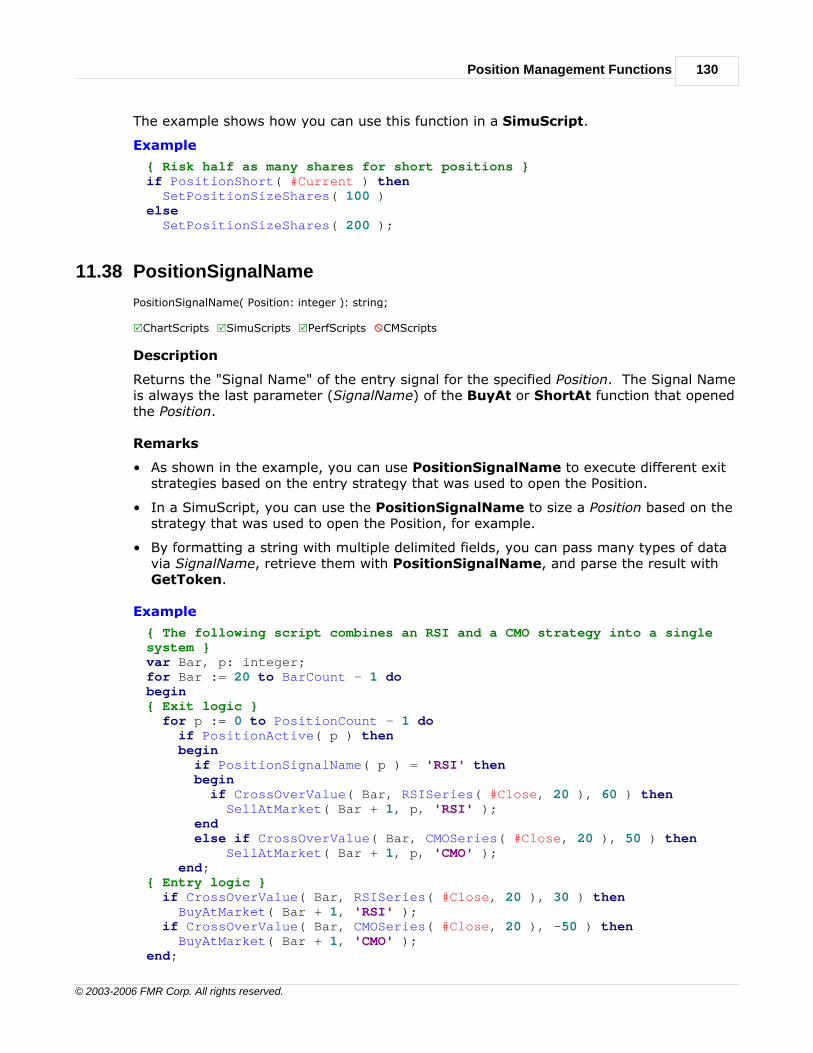
Position Management Functions 130
© 2003-2006 FMR Corp. All rights reserved.
The example shows how you can use this function in a SimuScript.
Example
{ Risk half as many shares for short positions }if PositionShort( #Current ) then SetPositionSizeShares( 100 )else SetPositionSizeShares( 200 );
11.38 PositionSignalName
PositionSignalName( Position: integer ): string;
RChartScripts RSimuScripts RPerfScripts XCMScripts
Description
Returns the "Signal Name" of the entry signal for the specified Position. The Signal Nameis always the last parameter (SignalName) of the BuyAt or ShortAt function that openedthe Position.
Remarks
• As shown in the example, you can use PositionSignalName to execute different exitstrategies based on the entry strategy that was used to open the Position.
• In a SimuScript, you can use the PositionSignalName to size a Position based on thestrategy that was used to open the Position, for example.
• By formatting a string with multiple delimited fields, you can pass many types of datavia SignalName, retrieve them with PositionSignalName, and parse the result withGetToken.
Example
{ The following script combines an RSI and a CMO strategy into a singlesystem }var Bar, p: integer;for Bar := 20 to BarCount - 1 dobegin{ Exit logic } for p := 0 to PositionCount - 1 do if PositionActive( p ) then begin if PositionSignalName( p ) = 'RSI' then begin if CrossOverValue( Bar, RSISeries( #Close, 20 ), 60 ) then SellAtMarket( Bar + 1, p, 'RSI' ); end else if CrossOverValue( Bar, CMOSeries( #Close, 20 ), 50 ) then SellAtMarket( Bar + 1, p, 'CMO' ); end;{ Entry logic } if CrossOverValue( Bar, RSISeries( #Close, 20 ), 30 ) then BuyAtMarket( Bar + 1, 'RSI' ); if CrossOverValue( Bar, CMOSeries( #Close, 20 ), -50 ) then BuyAtMarket( Bar + 1, 'CMO' );end;

WealthScript Function Reference, Wealth-Lab Pro™131
© 2003-2006 FMR Corp. All rights reserved.
11.39 PositionSymbol
PositionSymbol( Position ): string;
RChartScripts RSimuScripts RPerfScripts XCMScripts
Description
Returns the symbol of the selected Position.
Example
{ SimuScript: Ensure only 1 trade per symbol }var p: integer;var s: string;s := PositionSymbol( #Current );SetPositionSizePct( 10 );for p := 0 to PositionCount - 1 do if PositionSymbol( p ) = s then if PositionActive( p ) then SetPositionSizeFixed( 0 );
11.40 SetPositionData
SetPositionData( Position: integer; Value: float );
RChartScripts XSimuScripts XPerfScripts XCMScripts
Description
Lets you store user-specific data (a single floating point number), Value, for the specifiedPosition. You can obtain the Position data value using GetPositionData. Use thesefunctions if you need to track any additional information on Positions that you need to acton in your script.
For instance, your trading system might take an initial trend-following position, and thensubsequent scalping positions to try and nab quick profits. You can use SetPositionDatato record which type of Positions were taken so that you could apply the appropriate exitlogic.
Remarks
• Although you may assign data to a Position at any time after it has been created, theChartScript must use SetPositionData on the signal bar if you plan to retrieve thedata using GetPositionData in a SimuScript. Otherwise, using SetPositionDataafter the signal bar can result in a look-ahead (peeking) error during $imulatorprocessing.
• Wealth-Lab processes sizing before actually creating Positions in the ChartScriptWindow and Scans, therefore Value (the data) from SetPositionData is not availableto SimuScripts in these tools. Instead, you can pass data using SignalName andretrieve it with PositionSignalName in the SimuScript. SignalName is the last stringparameter in the BuyAt and ShortAt signals, and it may contain all kinds ofinformation, which you can parse using GetToken, if required.

Position Management Functions 132
© 2003-2006 FMR Corp. All rights reserved.
Example
{ This seasonal system stores the month of entry for use later in aSimuScript }var BAR: integer;for Bar := 40 to BarCount - 1 dobegin if LastPositionActive then SellAtLimit( Bar + 1, Highest( Bar, #High, 20 ), LastPosition, '') else if BuyAtLimit( Bar + 1, Lowest( Bar, #Low, 20 ), '' ) then SetPositionData( LastPosition, GetMonth( Bar ) );end;
11.41 SetPositionPriority
SetPositionPriority( Position: integer; Priority: float );
RChartScripts XSimuScripts XPerfScripts XCMScripts
Description
Sets the Priority value of a Position. A Position's priority determines whether or not it willbe included by the portfolio $imulator tool if there are more trades available than capitalfor a specific bar. Positions with a higher value for Priority take precedence, i.e., they areprocessed first. For example, a Position with Priority 10.5 will be processed before anyPosition having Priority less than 10.5.
In most cases, it's not required to set priority, and in this case the priority is random.However, specifying priority is useful, for example, to force the $imulator to choose a"most/least condition", where condition may be oversold, lowest-priced, etc.Additionally, if your system enters trades with both AtMarket and AtLimit/AtStop signals,you should ensure that your script logic assigns higher Priority to AtMarket orders thanfor the other types since market orders are executed first in real trading.
Warning! You must employ SetPositionPriority in ChartScripts that use multipleorder-entry types, such as AtMarket and AtLimit orders. Since the$imulator does not distinguish between the types, set a higher priority forAtMarket entries so that they are processed before AtLimit/AtStop orderson the same bar.
Remarks
• Use SetPositionPriority on the signal bar. Once you have assigned priority, it shouldnot be changed on subsequent bars.
• Especially for multi-position systems, use the boolean return value of AtLimit/AtStoporders as a condition to calling SetPositionPriority, e.g.,
{ After a limit buy, give priority to the position having the lowest RSI}
if BuyAtLimit( Bar + 1, LimitPrice, '' ) then SetPositionPriority( LastPosition, -1 * RSI(Bar, #Close, 14 ) );
• Use GetPositionPriority to obtain the priority of a Position.
• Position priority is used only in the $imulator and Portfolio $imulation Mode in theOptimizer Control.

WealthScript Function Reference, Wealth-Lab Pro™133
© 2003-2006 FMR Corp. All rights reserved.
Example
{ Buy when CMO is oversold and assign the highest priority to the most oversold by multiplying the CMO value by -1 }var BAR, hRSI, hCMO, CP: integer;hCMO := CMOSeries( #Close, 20 );CP := CreatePane( 75, true, true );PlotSeriesLabel( hCMO, CP, #Blue, #Thin, 'CMO(20)' );
for Bar := 20 to BarCount - 1 dobegin if not LastPositionActive then begin if @hCMO[ Bar ] < -55 then begin BuyAtMarket( Bar + 1, 'CMO' ); SetPositionPriority( LastPosition, -1 * @hCMO[ Bar ] ); end; end else if @hCMO[ Bar ] > 45 then SellAtMarket( Bar + 1, LastPosition, 'CMO' );end;
11.42 SetPositionRiskStop
SetPositionRiskStop( Position: integer; StopLevel: float );
RChartScripts XSimuScripts XPerfScripts XCMScripts
Note: SetRiskStopLevel supersedes the SetPositionRiskStop function. SeeSetRiskStopLevel for information.
Description
Specifies the initial stop level, StopLevel, for the Position. This stop level is used in the$imulator and other tools in Portfolio Simulation mode when you select the MaximumRisk Pct Position Sizing option. When this option is selected, you tell the PortfolioSimulation the percentage of capital you are willing to risk on the trade. The PortfolioSimulation then uses the Position's RiskStop value to determine how many shares toassign to the Position.
Important: When you use Maximum Risk Pct sizing, you're responsible for actuallyexiting the Position at the stop level in your ChartScript code.
Example
{ Set our risk stop at 50 cents below the signal day's low }var BAR: integer;InstallProfitTarget( 50 );for Bar := 40 to BarCount - 1 dobegin ApplyAutoStops( Bar ); if LastPositionActive then SellAtStop( Bar + 1, GetPositionRiskStop( LastPosition ),LastPosition, '') else if BuyAtLimit( Bar + 1, Lowest( Bar, #Low, 20 ), '' ) then

Position Management Functions 134
© 2003-2006 FMR Corp. All rights reserved.
SetPositionRiskStop( LastPosition, PriceLow( Bar ) - 0.50 );end;
11.43 SetRiskStopLevel
SetRiskStopLevel( StopLevel: float );
RChartScripts XSimuScripts XPerfScripts XCMScripts
Description
Specifies the initial StopLevel (price) for the next Position to be created. This stop levelis used in the $imulator and other tools in Portfolio Simulation mode when you select theMaximum Risk Pct Position Sizing option. When this option is selected, you tell thePortfolio Simulation the percentage of capital you are willing to risk on the trade. ThePortfolio Simulation then uses the Position's RiskStop value to determine how manyshares to assign to the Position.
Remarks
• When you use Maximum Risk Pct sizing, you're responsible for actually exiting thePosition at the stop level in your ChartScript code.
• For automated trading, you can use SetRiskStopLevel to automatically activate astop loss order on the same bar on which a position is entered. See "AutomatedTrading Options" in the User Guide for more information.
Note: SetRiskStopLevel supersedes the original SetPositionRiskStop function.
Example
{ Set our risk stop at 50 cents below the signal day's low }var BAR: integer;InstallProfitTarget( 50 );for Bar := 40 to BarCount - 1 dobegin ApplyAutoStops( Bar ); if LastPositionActive then SellAtStop( Bar + 1, GetPositionRiskStop( LastPosition ),LastPosition, '') else begin SetRiskStopLevel( PriceLow( Bar ) - 0.5 ); BuyAtLimit( Bar + 1, Lowest( Bar, #Low, 20 ), '' ); end;end;

WealthScript Function Reference, Wealth-Lab Pro™135
© 2003-2006 FMR Corp. All rights reserved.
12 Price Series Functions
12.1 Overview
There's no use in avoiding it. If you're going to deal with a technical application formarket analysis, you're going to be working with Price Series. Generally speaking a PriceSeries refers to an array of values that has the same number of elements as bars loadedin a chart. The Price Series category of functions allow you to create, analyze,synchronize, change time frames, and otherwise manipulate an entire series of data witha minimal amount of effort. Most of these functions automatically create a new (result)Price Series and return a handle that you use to refer to the new series.
A subset of these functions (CrossOver/Under and TurnUp/Down) provide relativeinformation between two prices, or possibly between a Price Series and a fixed value. Inthis sense, they act in an "indicative" fashion, though they are not what we consider atrue indicator.
12.2 AbsSeries
AbsSeries( Series: integer ): integer;
RChartScripts RSimuScripts RPerfScripts XCMScripts
Description
Returns a new Price Series that contains the absolute values of the Price Specified in theSeries parameter.
Example
var DIFF, ABSDIFF, P: integer;Diff := SubtractSeries( #Open, #Close );AbsDiff := AbsSeries( Diff );p := CreatePane( 100, true, true );PlotSeries( Diff, p, #Black, #Thin );PlotSeries( AbsDiff, p, #Red, #Thin );
12.3 AddCalendarDays
AddCalendarDays( Interpolate: boolean );
RChartScripts XSimuScripts XPerfScripts XCMScripts
Description
Adds all missing calendar days to the chart data, including weekends, holidays, and anyother non-trading day. Newly added bars are considered "synthetic", and these barnumbers return true when SyntheticBar is called.
The value of the inserted bars depends on the Interpolate parameter. If Interpolate isfalse, the new bars assume the OHLC values of the previous bar. If Interpolate is true,the OHLC values of the new bars are calculated using linear interpolation between the
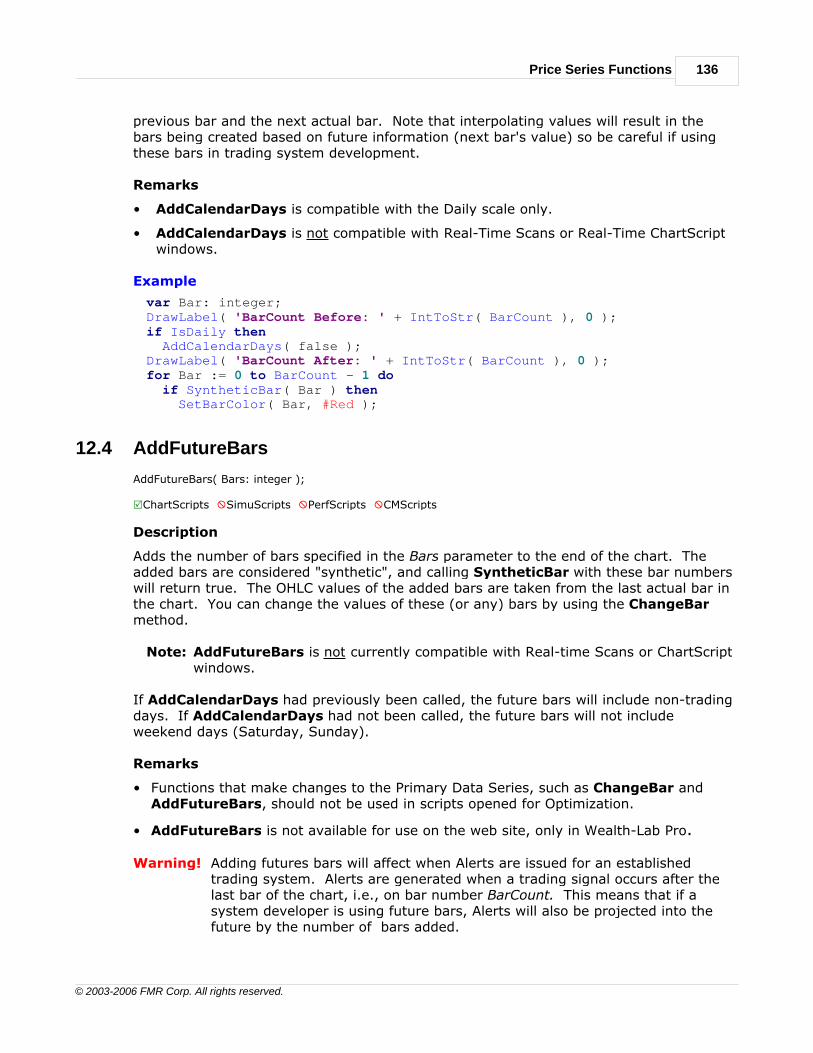
Price Series Functions 136
© 2003-2006 FMR Corp. All rights reserved.
previous bar and the next actual bar. Note that interpolating values will result in thebars being created based on future information (next bar's value) so be careful if usingthese bars in trading system development.
Remarks
• AddCalendarDays is compatible with the Daily scale only.
• AddCalendarDays is not compatible with Real-Time Scans or Real-Time ChartScriptwindows.
Example
var Bar: integer;DrawLabel( 'BarCount Before: ' + IntToStr( BarCount ), 0 );if IsDaily then AddCalendarDays( false );DrawLabel( 'BarCount After: ' + IntToStr( BarCount ), 0 );for Bar := 0 to BarCount - 1 do if SyntheticBar( Bar ) then SetBarColor( Bar, #Red );
12.4 AddFutureBars
AddFutureBars( Bars: integer );
RChartScripts XSimuScripts XPerfScripts XCMScripts
Description
Adds the number of bars specified in the Bars parameter to the end of the chart. Theadded bars are considered "synthetic", and calling SyntheticBar with these bar numberswill return true. The OHLC values of the added bars are taken from the last actual bar inthe chart. You can change the values of these (or any) bars by using the ChangeBarmethod.
Note: AddFutureBars is not currently compatible with Real-time Scans or ChartScriptwindows.
If AddCalendarDays had previously been called, the future bars will include non-tradingdays. If AddCalendarDays had not been called, the future bars will not includeweekend days (Saturday, Sunday).
Remarks
• Functions that make changes to the Primary Data Series, such as ChangeBar andAddFutureBars, should not be used in scripts opened for Optimization.
• AddFutureBars is not available for use on the web site, only in Wealth-Lab Pro.
Warning! Adding futures bars will affect when Alerts are issued for an establishedtrading system. Alerts are generated when a trading signal occurs after thelast bar of the chart, i.e., on bar number BarCount. This means that if asystem developer is using future bars, Alerts will also be projected into thefuture by the number of bars added.
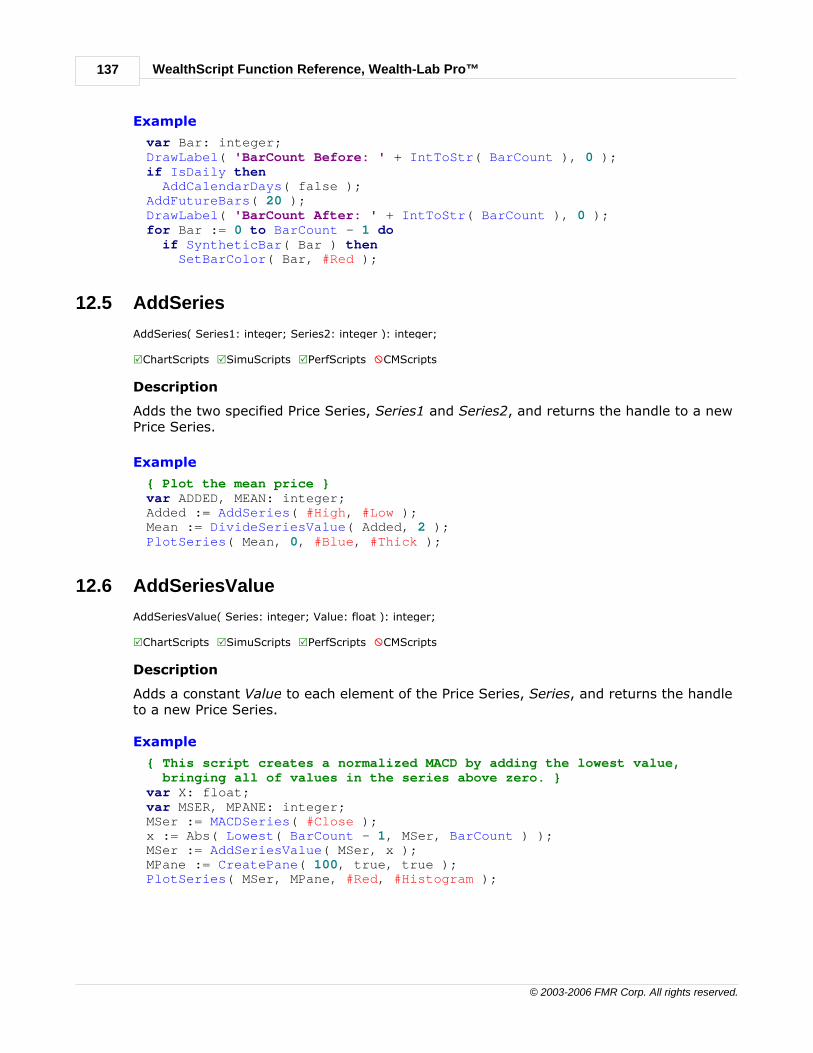
WealthScript Function Reference, Wealth-Lab Pro™137
© 2003-2006 FMR Corp. All rights reserved.
Example
var Bar: integer;DrawLabel( 'BarCount Before: ' + IntToStr( BarCount ), 0 );if IsDaily then AddCalendarDays( false );AddFutureBars( 20 );DrawLabel( 'BarCount After: ' + IntToStr( BarCount ), 0 );for Bar := 0 to BarCount - 1 do if SyntheticBar( Bar ) then SetBarColor( Bar, #Red );
12.5 AddSeries
AddSeries( Series1: integer; Series2: integer ): integer;
RChartScripts RSimuScripts RPerfScripts XCMScripts
Description
Adds the two specified Price Series, Series1 and Series2, and returns the handle to a newPrice Series.
Example
{ Plot the mean price }var ADDED, MEAN: integer;Added := AddSeries( #High, #Low );Mean := DivideSeriesValue( Added, 2 );PlotSeries( Mean, 0, #Blue, #Thick );
12.6 AddSeriesValue
AddSeriesValue( Series: integer; Value: float ): integer;
RChartScripts RSimuScripts RPerfScripts XCMScripts
Description
Adds a constant Value to each element of the Price Series, Series, and returns the handleto a new Price Series.
Example
{ This script creates a normalized MACD by adding the lowest value, bringing all of values in the series above zero. }var X: float;var MSER, MPANE: integer;MSer := MACDSeries( #Close );x := Abs( Lowest( BarCount - 1, MSer, BarCount ) );MSer := AddSeriesValue( MSer, x );MPane := CreatePane( 100, true, true );PlotSeries( MSer, MPane, #Red, #Histogram );

Price Series Functions 138
© 2003-2006 FMR Corp. All rights reserved.
12.7 AnalyzeSeries
AnalyzeSeries( PriceSeries: integer; Description: string );
RChartScripts XSimuScripts XPerfScripts XCMScripts
Description
Outputs the value of the Price Series defined by its handle, PriceSeries, to the Trade Logat the time the trade was signaled. The PriceSeries is also available on the "Analysis" tabof the ChartScript and $imulator windows for more detailed analysis.
Note: AnalyzeSeries is not compatible in the with ChartScripts that execute tradeson symbols other than the primary symbol, i.e., following a call toSetPrimarySeries. Additionally and generally speaking, scripts with WatchListloops should not be used in the $imulator.
You can use AnalyzeSeries to determine how an indicator might be applied to anexisting trading system to filter losing trades without having to actually incorporate theindicator into the system. In the example below, trading signals are based solely on theStochRSISeries indicator. At the end of the script, a CMOSeries indicator is created foranalysis.
Example
{ Buy when StochRSI turns up from 0 and sell when turns down from 100 }var Bar, StochRSIPane, hStRSI: integer;var cmoSer, cmoPane: integer;
hStRSI := StochRSISeries( #Close, 14 );InstallBreakEvenStop( 5 );PlotStops;for Bar := 30 to BarCount - 1 dobegin ApplyAutoStops( Bar ); if LastPositionActive then begin if @hStRSI[ Bar - 1 ] >= 99.9 Then if TurnDown( Bar, hStRSI ) then SellAtMarket( Bar + 1, LastPosition, '' ); end else if @hStRSI[ Bar - 1 ] <= 0.1 Then if TurnUp( Bar, hStRSI ) then BuyAtMarket( Bar + 1, '' );end;StochRSIPane := CreatePane( 75, true, true );PlotSeriesLabel( StochRSISeries( #Close, 14 ), StochRSIPane, 411, 2,'StochRSI(14)' );
cmoPane := CreatePane( 75, true, true);cmoSer := CMOSeries( #Close, 14 );PlotSeriesLabel( cmoSer, cmoPane, #Green, #Thin, 'CMO 14' );AnalyzeSeries( cmoSer, 'CMO 14' );
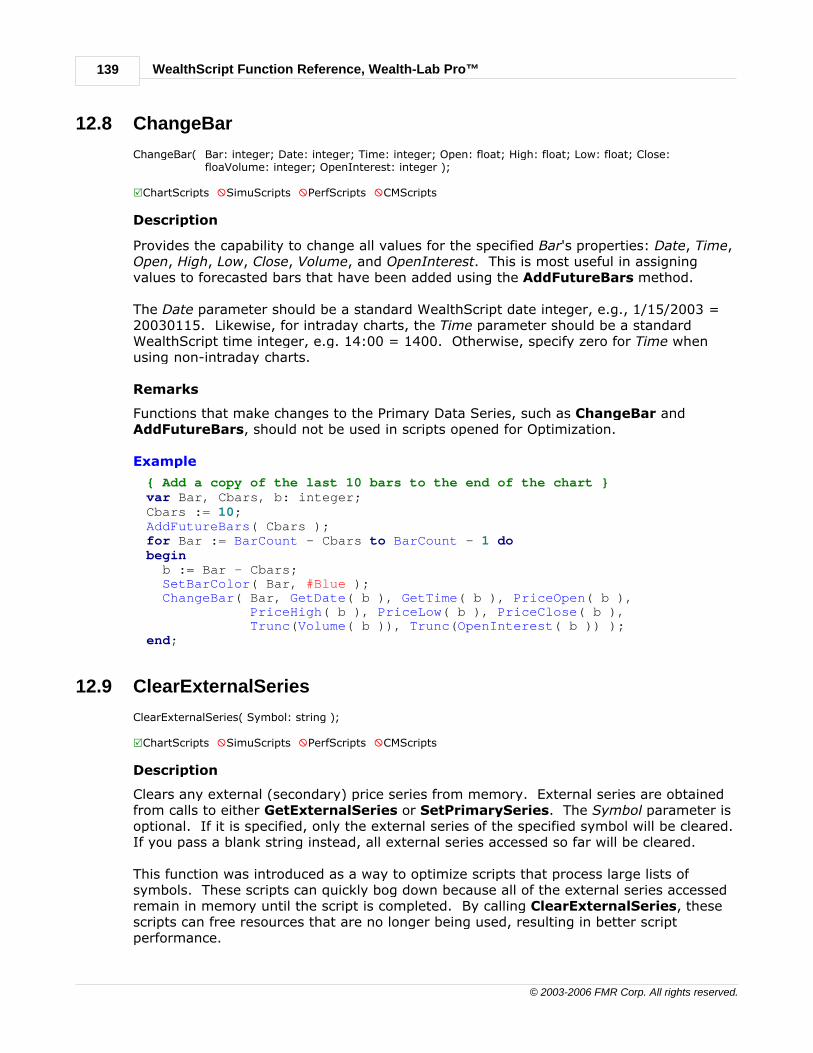
WealthScript Function Reference, Wealth-Lab Pro™139
© 2003-2006 FMR Corp. All rights reserved.
12.8 ChangeBar
ChangeBar( Bar: integer; Date: integer; Time: integer; Open: float; High: float; Low: float; Close:floaVolume: integer; OpenInterest: integer );
RChartScripts XSimuScripts XPerfScripts XCMScripts
Description
Provides the capability to change all values for the specified Bar's properties: Date, Time,Open, High, Low, Close, Volume, and OpenInterest. This is most useful in assigningvalues to forecasted bars that have been added using the AddFutureBars method.
The Date parameter should be a standard WealthScript date integer, e.g., 1/15/2003 =20030115. Likewise, for intraday charts, the Time parameter should be a standardWealthScript time integer, e.g. 14:00 = 1400. Otherwise, specify zero for Time whenusing non-intraday charts.
Remarks
Functions that make changes to the Primary Data Series, such as ChangeBar andAddFutureBars, should not be used in scripts opened for Optimization.
Example
{ Add a copy of the last 10 bars to the end of the chart }var Bar, Cbars, b: integer;Cbars := 10;AddFutureBars( Cbars );for Bar := BarCount - Cbars to BarCount - 1 dobegin b := Bar - Cbars; SetBarColor( Bar, #Blue ); ChangeBar( Bar, GetDate( b ), GetTime( b ), PriceOpen( b ), PriceHigh( b ), PriceLow( b ), PriceClose( b ), Trunc(Volume( b )), Trunc(OpenInterest( b )) );end;
12.9 ClearExternalSeries
ClearExternalSeries( Symbol: string );
RChartScripts XSimuScripts XPerfScripts XCMScripts
Description
Clears any external (secondary) price series from memory. External series are obtainedfrom calls to either GetExternalSeries or SetPrimarySeries. The Symbol parameter isoptional. If it is specified, only the external series of the specified symbol will be cleared.If you pass a blank string instead, all external series accessed so far will be cleared.
This function was introduced as a way to optimize scripts that process large lists ofsymbols. These scripts can quickly bog down because all of the external series accessedremain in memory until the script is completed. By calling ClearExternalSeries, thesescripts can free resources that are no longer being used, resulting in better scriptperformance.

Price Series Functions 140
© 2003-2006 FMR Corp. All rights reserved.
Remarks
• Do not use ClearExternalSeries for a Symbol on which you've created trades.
Example
ClearExternalSeries( '' );
12.10 ClearIndicators
ClearIndicators;
RChartScripts XSimuScripts XPerfScripts XCMScripts
Description
Clears any indicators that have been created from memory. This function is useful forscripts that cycle through all of the symbols in a WatchList and process each symbol inturn, creating indicators for each symbol. Scripts like this can easily run out of resourcesbecause the indicator series are being re-created, and the old series remain in memory.
Example
var RSISer, w, Bar: integer;for w := 0 to WatchListCount - 1 dobegin PrintStatus( WatchListSymbol( w ) ); ClearIndicators; for Bar := 0 to BarCount - 1 do begin SetPrimarySeries( WatchListSymbol( w ) ); RSISer := RSISeries( #Close, 20 ); { ... do more processing here ... } end;end;
12.11 CreateNamedSeries
CreateNamedSeries( SeriesName: string ): integer;
RChartScripts RSimuScripts RPerfScripts XCMScripts
Description
Creates a new blank price series and returns the new series as a PriceSeries variable, likeCreateSeries. You can use the FindNamedSeries function to locate a named seriesthat you previously created. This pair of functions is used internally by the New IndicatorWizard.
Example
var n: integer;n := CreateNamedSeries( 'MySeries' );
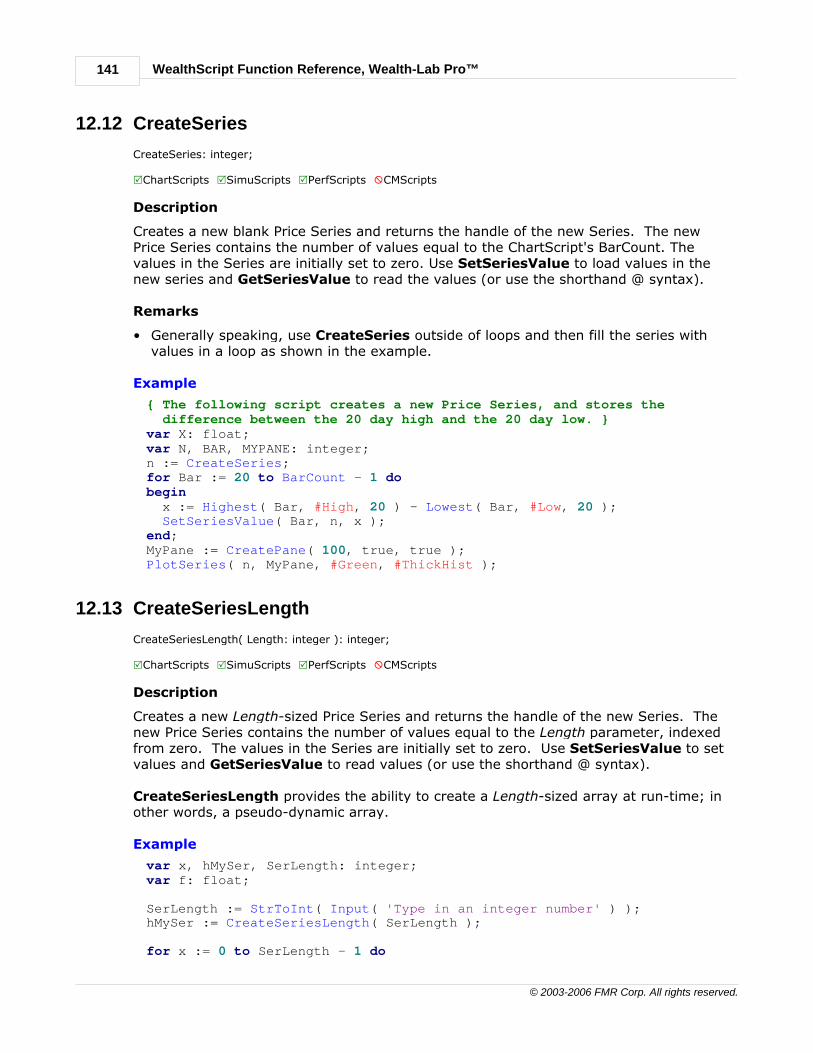
WealthScript Function Reference, Wealth-Lab Pro™141
© 2003-2006 FMR Corp. All rights reserved.
12.12 CreateSeries
CreateSeries: integer;
RChartScripts RSimuScripts RPerfScripts XCMScripts
Description
Creates a new blank Price Series and returns the handle of the new Series. The newPrice Series contains the number of values equal to the ChartScript's BarCount. Thevalues in the Series are initially set to zero. Use SetSeriesValue to load values in thenew series and GetSeriesValue to read the values (or use the shorthand @ syntax).
Remarks
• Generally speaking, use CreateSeries outside of loops and then fill the series withvalues in a loop as shown in the example.
Example
{ The following script creates a new Price Series, and stores the difference between the 20 day high and the 20 day low. }var X: float;var N, BAR, MYPANE: integer;n := CreateSeries;for Bar := 20 to BarCount - 1 dobegin x := Highest( Bar, #High, 20 ) - Lowest( Bar, #Low, 20 ); SetSeriesValue( Bar, n, x );end;MyPane := CreatePane( 100, true, true );PlotSeries( n, MyPane, #Green, #ThickHist );
12.13 CreateSeriesLength
CreateSeriesLength( Length: integer ): integer;
RChartScripts RSimuScripts RPerfScripts XCMScripts
Description
Creates a new Length-sized Price Series and returns the handle of the new Series. Thenew Price Series contains the number of values equal to the Length parameter, indexedfrom zero. The values in the Series are initially set to zero. Use SetSeriesValue to setvalues and GetSeriesValue to read values (or use the shorthand @ syntax).
CreateSeriesLength provides the ability to create a Length-sized array at run-time; inother words, a pseudo-dynamic array.
Example
var x, hMySer, SerLength: integer;var f: float;
SerLength := StrToInt( Input( 'Type in an integer number' ) );hMySer := CreateSeriesLength( SerLength );
for x := 0 to SerLength - 1 do

Price Series Functions 142
© 2003-2006 FMR Corp. All rights reserved.
begin @hMySer[x] := x * 1.5; Print( IntToStr( x ) + #9 + FloatToStr( @hMySer[x] ) );end;
12.14 CrossOver
CrossOver( Bar: integer; Series1: integer; Series2: integer ): boolean;
RChartScripts RSimuScripts RPerfScripts XCMScripts
Description
Returns true when Series1 crosses above the Series2 at Bar.
Specifically, CrossOver triggers (true) if both of the following conditions are true:
@Series1[Bar] >= @Series2[Bar], AND,@Series1[Bar - 1] < @Series2[Bar - 1]
Example
{ A simple Weighted Moving Average Crossover System }var BAR: integer;InstallProfitTarget( 6 );InstallStopLoss( 4 );for Bar := 60 to BarCount - 1 dobegin ApplyAutoStops( Bar ); if CrossOver( Bar, WMASeries( #Close, 30 ), WMASeries( #Close, 60 ) )then BuyAtMarket( Bar + 1, '' );end;
12.15 CrossOverValue
CrossOverValue( Bar: integer; Series: integer; Value: float ): boolean;
RChartScripts RSimuScripts RPerfScripts XCMScripts
Description
Returns true when the Price Series crosses above the specified Value.
Specifically, CrossOver triggers (true) if both of the following conditions are true:
@Series[Bar] >= Value, AND,@Series[Bar - 1] < Value
Example
{ A Basic "Extreme RSI" type System }var BAR: integer;InstallProfitTarget( 5 );InstallStopLoss( 20 );for Bar := 30 to BarCount - 1 dobegin ApplyAutoStops( Bar );

WealthScript Function Reference, Wealth-Lab Pro™143
© 2003-2006 FMR Corp. All rights reserved.
if CrossOverValue( Bar, RSISeries( #Close, 32 ), 24 ) then BuyAtMarket( Bar + 1, 'Extreme RSI' );end;
12.16 CrossUnder
CrossUnder( Bar: integer; Series1: integer; Series2: integer ): boolean;
RChartScripts RSimuScripts RPerfScripts XCMScripts
Description
Returns true when Series1 crosses below Series2 at Bar.
Specifically, CrossUnder triggers (true) if both of the following conditions are true:
@Series1[Bar] < @Series2[Bar], AND,@Series1[Bar - 1] >= @Series2[Bar - 1]
Example
{ This system opens a new position whenever Stochastic crosses above its signal line from below 20. It closes all positions when Stochastic crosses below the signal line from above 80. }var STOCHPANE, SIGNAL, BAR, P: integer;StochPane := CreatePane( 150, true, true );Signal := EMASeries( StochDSeries( 20, 3 ), 9 );PlotSeries( StochDSeries( 20, 3 ), StochPane, 009, #Thin );PlotSeries( Signal, StochPane, #Gray, #Thin );
for Bar := 30 to BarCount - 1 dobegin if CrossUnder( Bar, StochDSeries( 20, 3 ), Signal ) then if StochD( Bar - 1, 20, 3 ) > 80 then for P := 0 to PositionCount - 1 do if PositionActive( P ) then SellAtMarket( Bar + 1, P, 'Stoch' ); if CrossOver( Bar, StochDSeries( 20, 3 ), Signal ) then if StochD( Bar - 1, 20, 3 ) < 20 then BuyAtMarket( Bar + 1, 'Stoch' );end;
12.17 CrossUnderValue
CrossUnderValue( Bar: integer; Series: integer; Value: float ): boolean;
RChartScripts RSimuScripts RPerfScripts XCMScripts
Description
Returns true when Price Series crosses below the specified Value.
Specifically, CrossUnder triggers (true) if both of the following conditions are true:
@Series[Bar] < Value, AND,@Series[Bar - 1] >= Value

Price Series Functions 144
© 2003-2006 FMR Corp. All rights reserved.
Example
{ This system buys as soon as DSS crosses below 30 }var DSSPANE, BAR: integer;DSSPane := CreatePane( 100, true, true );PlotSeries( DSSSeries( 10, 20, 5 ), DSSPane, 905, #Thick );InstallStopLoss( 5 );InstallProfitTarget( 15 );for Bar := 20 to BarCount - 1 dobegin ApplyAutoStops( Bar ); if CrossUnderValue( Bar, DSSSeries( 10, 20, 5 ), 30 ) then BuyAtMarket( Bar + 1, 'DSS' );end;
12.18 DivideSeries
DivideSeries( Series1: integer; Series2: integer ): integer;
RChartScripts RSimuScripts RPerfScripts XCMScripts
Description
Divides each element of Series1 by its corresponding element in Series2, and returns thehandle to the resulting Price Series.
Example
{ Display Relative Strength of DJIA to Nasdaq }var NAZ, DJ, RS, RSPANE: integer;Naz := GetExternalSeries( '^IXIC', #Close );DJ := GetExternalSeries( '^DJI', #Close );RS := DivideSeries( DJ, Naz );RSPane := CreatePane( 100, true, true );PlotSeries( RS, RSPane, #Black, #Thick );DrawLabel( 'Strength Relative of DJIA to Nasdaq', RSPane );
12.19 DivideSeriesValue
DivideSeriesValue( Series: integer; Value: float ): integer;
RChartScripts RSimuScripts RPerfScripts XCMScripts
Description
Divides each element of the specified Price Series by a constant Value and returns thehandle to a new Price Series. You should ensure that Value is non-zero.
Example
{ Divide RSI by 100 to get it in the range of 0 to 1 }var RSIRANGE, RSIPANE: integer;RSIRange := DivideSeriesValue( RSISeries( #Close, 30 ), 100 );RSIPane := CreatePane( 100, true, true );PlotSeries( RSIRange, RSIPane, #Teal, #Thick );

WealthScript Function Reference, Wealth-Lab Pro™145
© 2003-2006 FMR Corp. All rights reserved.
12.20 DivideValueSeries
DivideValueSeries( Value: float; Series: integer ): integer;
RChartScripts RSimuScripts RPerfScripts XCMScripts
Description
Divides a constant Value by the value of each element in the specified Price Series andreturns the handle to a new Price Series.
Note: Be careful not to confuse this with DivideSeriesValue.
12.21 EnableSynch
EnableSynch( Enable: boolean );
RChartScripts XSimuScripts XPerfScripts XCMScripts
Description
If Enable is false, EnableSynch will turn off the default synchronization that occurs forexternal series in a ChartScript. An external series is any series referenced through a callto GetExternalSeries or SetPrimarySeries.
The default synchronization options are controlled via the Options Dialog. When "EnableAutomatic Date/Time Synchronization of External Series" is checked, the synchronizationprocess truncates any secondary series that has more bars than the primary series (thesymbol that was clicked to execute the script). For detailed information on "HowSecondary Data Series are Synchronized in Wealth-Lab", see the article by the samename on the Wealth-Lab Articles page.
You can use EnableSynch to turn off the default synchronization behavior set in theOptions Dialog. If you do this, you should use the SynchAll or SynchSeries statementsin your script to perform synchronization manually. Manual synchronization will perfectlyalign any secondary series to the primary, by removing dates that don't exist in theprimary, and inserting dates in the secondary that exist in the primary but not thesecondary. By calling SynchAll or SynchSeries after any indicators are created on thesecondary series, you can be sure that the series is aligned correctly AND that theindicator values are calculated correctly, taking into account all bars in the pre-alignedsecondary series.
Example
{ Print the BarCount of each Symbol }var w: integer;EnableSynch( false );for w := 0 to WatchListCount - 1 dobegin SetPrimarySeries( WatchListSymbol( w ) ); Print( WatchListSymbol( w ) + #9 + IntToStr( BarCount ) );end;

Price Series Functions 146
© 2003-2006 FMR Corp. All rights reserved.
12.22 FindNamedSeries
FindNamedSeries( SeriesName: string ): integer;
RChartScripts RSimuScripts RPerfScripts XCMScripts
Description
Returns the integer handle of the Price Series with the specified name, SeriesName. If noPriceSeries with the given name was found, the function returns -1. This will be thePriceSeries that was created in one of the following manners:
• by a corresponding call to CreateNamedSeries.
• by adding a Custom Field during the creation of an ASCII DataSource. Pass the "FieldName" that you entered when creating the DataSource.
This function is used internally in the code created by the New Indicator Wizard, and,unless you have additional names fields for ASCII DataSources, you should rarely need tocall this function yourself.
Remarks
• ASCII Custom Fields work only in the chart data's native time frame. For example, ifyou have a daily ASCII DataSource, the Custom Field data is not available if youswitch to Weekly scale from the toolbar.
• The string passed at SeriesName is case sensitive. For example, if the custom fieldwas defined as 'PE_Ratio', passing 'PE_RATIO' will cause the function to fail. You canreview the actual field name by clicking the Properties button for the DataSource in theDataSource Manager.
Example
var MySeries: integer;MySeries := FindNamedSeries( 'SeriesName' );
12.23 FirstActualBar
FirstActualBar: integer;
RChartScripts RSimuScripts XPerfScripts XCMScripts
Description
This function is useful in scripts that loop through and execute trades on all of thesymbols in a WatchList. In these cases, Wealth-Lab's synchronization feature (seeTools|Options|Synchronization) will transform secondary data series so that theysynchronize with the Primary series, the one clicked to run the script. If a secondarydata series has a shorter history than the Primary series, data bars are appended to thebeginning of the secondary series so that it's BarCount equals that of the Primary series.FirstActualBar will return the bar number that represents the first "real" bar of thesecondary series. You can use this value to make sure that you don't enter trades on thesymbol before its actual history began.
Example
var FIRST: integer;

WealthScript Function Reference, Wealth-Lab Pro™147
© 2003-2006 FMR Corp. All rights reserved.
SetPrimarySeries( 'ABGX' );First := FirstActualBar;RestorePrimarySeries;DrawLabel( 'ABGX started trading on bar ' + IntToStr( First ), 0 );
12.24 GetDescription
GetDescription( Series: integer ): string;
RChartScripts RSimuScripts RPerfScripts XCMScripts
Description
Returns the internal description of the specified Price Series. This function is used in theNew Indicator Wizard to create a properly named Price Series for a new indicator beingcreated.
Example
var e: integer;e := EMASeries( #Close, 60 );PlotSeries( e, 0, 009, #Thin );DrawLabel( GetDescription( e ), 0 );
12.25 GetExternalSeries
GetExternalSeries( Symbol: string; Series: integer ): integer;
RChartScripts XSimuScripts XPerfScripts XCMScripts
Description
Returns the requested Price Series for the specified Symbol. Series must be one of thefollowing Standard Price Series constants (only):
#Open, #High, #Low, #Close, #Volume, and #OpenInterest
Remarks
• Wealth-Lab will first try to find the Symbol in the WatchList of the primary symbol,which is the one that was clicked. If it doesn't exist in the primary symbol's WatchList,it will try to find it in other WatchLists/DataSources, top to bottom, alphabetically. UseAllowSymbolSearch to limit symbol searches to specific WatchLists.
• You cannot call GetExternalSeries after you have changed the Primary Series withSetPrimarySeries, or after you have re-scaled the Primary Series with a Time Framefunction.
• GetExternalSeries generates an error at run time if the Series cannot be found. Ifthere's reason to suspect a Symbol will not be found, you can "catch" the error with atry/except block as shown here:
var h: integer;try h := GetExternalSeries( 'MSFT', #Close );except Print( 'No data or could not find series' );end;

Price Series Functions 148
© 2003-2006 FMR Corp. All rights reserved.
• If you require access to an external symbol's Custom Field(s), do not useGetExternalSeries. Instead, use SetPrimarySeries, followed byFindNamedSeries, and finally RestorePrimarySeries.
• External Series functionality is not available for Tick or Second-based charts.
Example
{ Display price of this series relative to CSCO }var CSCO, REL, RELPANE: integer;CSCO := GetExternalSeries( 'CSCO', #Close );Rel := DivideSeries( #Close, CSCO );RelPane := CreatePane( 100, false, true );PlotSeries( Rel, RelPane, #Teal, #Thick );
12.26 GetSeriesValue
GetSeriesValue( Bar: integer; Series: integer ): float;
RChartScripts RSimuScripts RPerfScripts XCMScripts
Description
Returns a value at a specified Bar from the specified Price Series. Use this function toreturn values from a Price Series that you create with CreateSeries, or the result of anyWealthScript function that returns a Price Series integer handle.
Remarks
Instead of using GetSeriesValue, you can use the @-symbol shorthand notation. In theexample below, the statement
Per := Round( GetSeriesValue( Bar, AdaptivePer ) );
is equivalent to
Per := Round( @AdaptivePer[ Bar ] );
Note: The @ syntax is not compatible with Price Series whose handles are stored in adeclared array; e.g., @h[i][Bar], where h[i] is an integer array of Price Series
handles, is not valid syntax. See the WealthScript Language Guide for moreinformation.
Example
{ Create an adaptive moving average by multiplying a base period by R-Squared }var ADAPTIVEPER, ADAPTIVEMA, BAR, PER: integer;AdaptivePer := CreateSeries;AdaptiveMA := CreateSeries;AdaptivePer := MultiplySeriesValue( RSquaredSeries( #Close, 30 ), 60 );for Bar := 60 to BarCount - 1 dobegin Per := Round( GetSeriesValue( Bar, AdaptivePer ) ); if Per < 5 then Per := 5; SetSeriesValue( Bar, AdaptiveMA, SMA( Bar, #Close, Per ) );end;PlotSeries( AdaptiveMA, 0, #Purple, #Thick );

WealthScript Function Reference, Wealth-Lab Pro™149
© 2003-2006 FMR Corp. All rights reserved.
12.27 MultiplySeries
MultiplySeries( Series1: integer; Series2: integer ): integer;
RChartScripts RSimuScripts RPerfScripts XCMScripts
Description
Multiples each element of two Price Series, Series1 and Series2, returning the handle to anew Price Series.
Example
var ROCPANE, ROCSMA, ROCSMA1, ROCSMA2, SMAMULT: integer;
{ Plot 30 Day SMA }PlotSeries( SMASeries( #Close, 30 ), 0, 040, #Thick );DrawText( '30 Day SMA', 0, 4, 46, 040, 8 );
{ Create a De-Trended 30 Day SMA by accounting for SMA slope }RocPane := CreatePane( 75, true, true );RocSMA := ROCSeries( SMASeries( #Close, 30 ), 1 );PlotSeries( RocSMA, ROCPane, 020, #ThickHist );DrawText( '1 Day ROC of 30 Day SMA', RocPane, 4, 4, 020, 8 );
RocSMA1 := MultiplySeriesValue( RocSMA, 0.1 );RocSMA2 := AddSeriesValue( RocSMA1, 1.0 );SMAMult := MultiplySeries( SMASeries( #Close, 30 ), RocSMA2 );
PlotSeries( SMAMult, 0, 005, 2 );DrawText( 'Detrended 30 Day SMA', 0, 4, 56, 005, 8 );
12.28 MultiplySeriesValue
MultiplySeriesValue( Series: integer; Value: float ): integer;
RChartScripts RSimuScripts RPerfScripts XCMScripts
Description
Multiplies the Price Series by a constant Value, and returns the integer handle to a newPrice Series. You can use this function to make a copy of a Price Series by passing 1 asthe Value parameter.
Example
{ Divide the stock value by the DJ Index to get a relative strength rating, multiple the result by 10000 for scaling }var DJCLOSE, DIVSERIES, DJPANE: integer;SetPrimarySeries( '^DJI' );DJClose := #Close;RestorePrimarySeries;DivSeries := DivideSeries( #Close, DJClose );DivSeries := MultiplySeriesValue( DivSeries, 10000 );DJPane := CreatePane( 150, true, true );PlotSeries( DivSeries, DJPane, 030, #Thick );

Price Series Functions 150
© 2003-2006 FMR Corp. All rights reserved.
12.29 OffsetSeries
OffsetSeries( Series: integer; Bars: integer ): integer;
RChartScripts RSimuScripts RPerfScripts XCMScripts
Description
Offsets the specified Price Series by a certain number of Bars and returns the handle to anew Price Series. Use a negative offset value to shift the Price Series to the right on thechart. Shifting a moving average to the right often leads to cleaner signals.
Example
{ Display a 60 day moving average, and the same average shifted to the right by 4 bars }var SMASER, SMAOFFSET: integer;SMASer := SMASeries( #Close, 60 );SMAOffset := OffsetSeries( SMASer, -4 );PlotSeries( SMASer, 0, #Navy, #Thick );PlotSeries( SMAOffset, 0, #Blue, #Thin );
12.30 RestorePrimarySeries
RestorePrimarySeries;
RChartScripts XSimuScripts XPerfScripts XCMScripts
Description
Restores the primary data source after a call to SetPrimarySeries. You should alwayscall RestorePrimarySeries after accessing external data sources in your ChartScript.
Example
{ Compare the RSI of the stock with the RSI of the index }var DJCLOSE, DJRSI, DJPANE: integer;SetPrimarySeries( '^DJI' );DJClose := #Close;DJRSI := RSISeries( DJClose, 30 );RestorePrimarySeries;DJPane := CreatePane( 150, true, true );PlotSeries( DJRSI, DJPane, #Navy, #Thick );PlotSeries( RSISeries( #Close, 30 ), DJPane, #Blue, #Thin );
12.31 SetDescription
SetDescription( Series: integer; Description: string );
RChartScripts XSimuScripts XPerfScripts XCMScripts
Description
Every Price Series is associated with an internal description. You normally don't need toassign a description yourself, as this is usually done automatically. SetDescriptionassigns the Description string of the specified Price Series that will be returned by a callto GetDescription. The description is displayed in the Data Window (Ctrl+Alt+V).
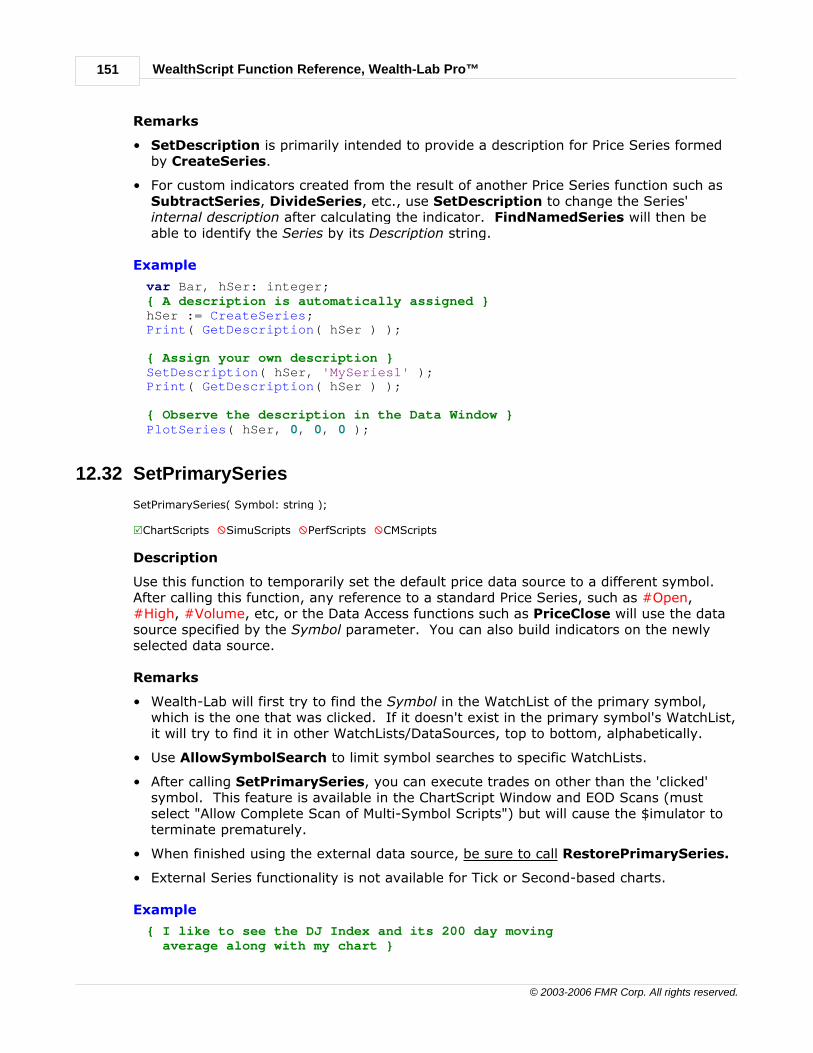
WealthScript Function Reference, Wealth-Lab Pro™151
© 2003-2006 FMR Corp. All rights reserved.
Remarks
• SetDescription is primarily intended to provide a description for Price Series formedby CreateSeries.
• For custom indicators created from the result of another Price Series function such asSubtractSeries, DivideSeries, etc., use SetDescription to change the Series'internal description after calculating the indicator. FindNamedSeries will then beable to identify the Series by its Description string.
Example
var Bar, hSer: integer;{ A description is automatically assigned }hSer := CreateSeries;Print( GetDescription( hSer ) );
{ Assign your own description }SetDescription( hSer, 'MySeries1' );Print( GetDescription( hSer ) );
{ Observe the description in the Data Window }PlotSeries( hSer, 0, 0, 0 );
12.32 SetPrimarySeries
SetPrimarySeries( Symbol: string );
RChartScripts XSimuScripts XPerfScripts XCMScripts
Description
Use this function to temporarily set the default price data source to a different symbol.After calling this function, any reference to a standard Price Series, such as #Open,#High, #Volume, etc, or the Data Access functions such as PriceClose will use the datasource specified by the Symbol parameter. You can also build indicators on the newlyselected data source.
Remarks
• Wealth-Lab will first try to find the Symbol in the WatchList of the primary symbol,which is the one that was clicked. If it doesn't exist in the primary symbol's WatchList,it will try to find it in other WatchLists/DataSources, top to bottom, alphabetically.
• Use AllowSymbolSearch to limit symbol searches to specific WatchLists.
• After calling SetPrimarySeries, you can execute trades on other than the 'clicked'symbol. This feature is available in the ChartScript Window and EOD Scans (mustselect "Allow Complete Scan of Multi-Symbol Scripts") but will cause the $imulator toterminate prematurely.
• When finished using the external data source, be sure to call RestorePrimarySeries.
• External Series functionality is not available for Tick or Second-based charts.
Example
{ I like to see the DJ Index and its 200 day moving average along with my chart }

Price Series Functions 152
© 2003-2006 FMR Corp. All rights reserved.
var DJCLOSE, DJ200, DJPANE: integer;SetPrimarySeries( '^DJI' );DJClose := #Close;DJ200 := SMASeries( DJClose, 200 );RestorePrimarySeries;DJPane := CreatePane( 150, true, true );PlotSeries( DJClose, DJPane, 310, #Thick );PlotSeries( DJ200, DJPane, #Black, #Dotted );
12.33 SetSeriesValue
SetSeriesValue( Bar: integer; Series: integer; Value: float );
RChartScripts RSimuScripts RPerfScripts XCMScripts
Description
Assigns a value to a specific Bar in the specified Price Series. Use this function to setvalues of a Price Series that you create with CreateSeries or CreateNamedSeries.
Remarks
Instead of using SetSeriesValue, you can use the @-symbol shorthand notation. In theexample below, the statement
SetSeriesValue( Bar, VolSurge, pct );
is equivalent to
@VolSurge[ Bar ] := pct;
Note: The @ syntax is not compatible with Price Series whose handles are stored in adeclared array; e.g., @h[i][Bar], where h[i] is an integer array of Price Series
handles, is not valid syntax. See the WealthScript Language Guide for moreinformation.
Example
{ Below we create and plot an indicator that displays percentage of Volume above average }var V, DIFF, PCT: float;var VOLPANE, VOLSURGE, BAR: integer;VolPane := CreatePane( 100, false, true );VolSurge := CreateSeries;for Bar := 20 to BarCount - 1 dobegin v := Volume( Bar ); diff := v - SMA( Bar, #Volume, 20 ); pct := ( diff / SMA( Bar, #Volume, 20 ) ) * 100; SetSeriesValue( Bar, VolSurge, pct );end;PlotSeries( VolSurge, VolPane, 955, #ThickHist );
12.34 SingleCalcMode
SingleCalcMode( Mode: boolean );
RChartScripts RSimuScripts RPerfScripts XCMScripts

WealthScript Function Reference, Wealth-Lab Pro™153
© 2003-2006 FMR Corp. All rights reserved.
Description
When the Mode parameter is set true, selected indicators (see Remarks) will return thevalue for the specified bar only.
Discussion
When you first call an indicator function, Wealth-Lab constructs the entire indicator PriceSeries to optimize speed for accessing indicator values. However, this makes it difficultto use indicators within a loop as you are populating the values of a custom Price Series.SingleCalcMode allows you to use selected indicator functions repetitively to recalculatea result based on the instantaneous values of the underlying series.
Remarks
• SingleCalcMode will work with a subset of supported indicators:SMA, EMA, LinearReg, RSquared, StdDev, Highest, Lowest
Check the Build descriptions on the Wealth-Lab site for the latest additions.
• Set SingleCalcMode true only for the lines of code where required. When notrequired, set the Mode back to false.
• Some indicators do not lend themselves to bar by bar calculation, because their valuesdepend on the previous value, or they use other complex indicators as components. Ifyou try to call one of these indicators when SingleCalcMode is turned on you willreceive an error message as a notification that the script might not be working asintended.
• Note that a call to SMASeries, for example, will create the complete Price Series asnormal, but you could still call SMA within SingleCalcMode to return a newly-calculated value for a specific bar.
Example
{ Instructions: Load Fixed 100 Bars and compare the results by changing the SingleCalcMode parameter to true/false }var n, MySeries, Pane: integer;
MySeries := CreateSeries;for n := 0 to 19 do @MySeries[n] := n;
{ Change the Mode value here to see the effect }SingleCalcMode( false );
for n := 20 to BarCount - 1 do @MySeries[n] := SMA( n, MySeries, 20 );
SingleCalcMode( false );Pane := CreatePane( 100, true, true );PlotSeries( MySeries, Pane, #Red, #Thin );
12.35 SubtractSeries
SubtractSeries( Series1: integer; Series2: integer ): integer;
RChartScripts RSimuScripts RPerfScripts XCMScripts
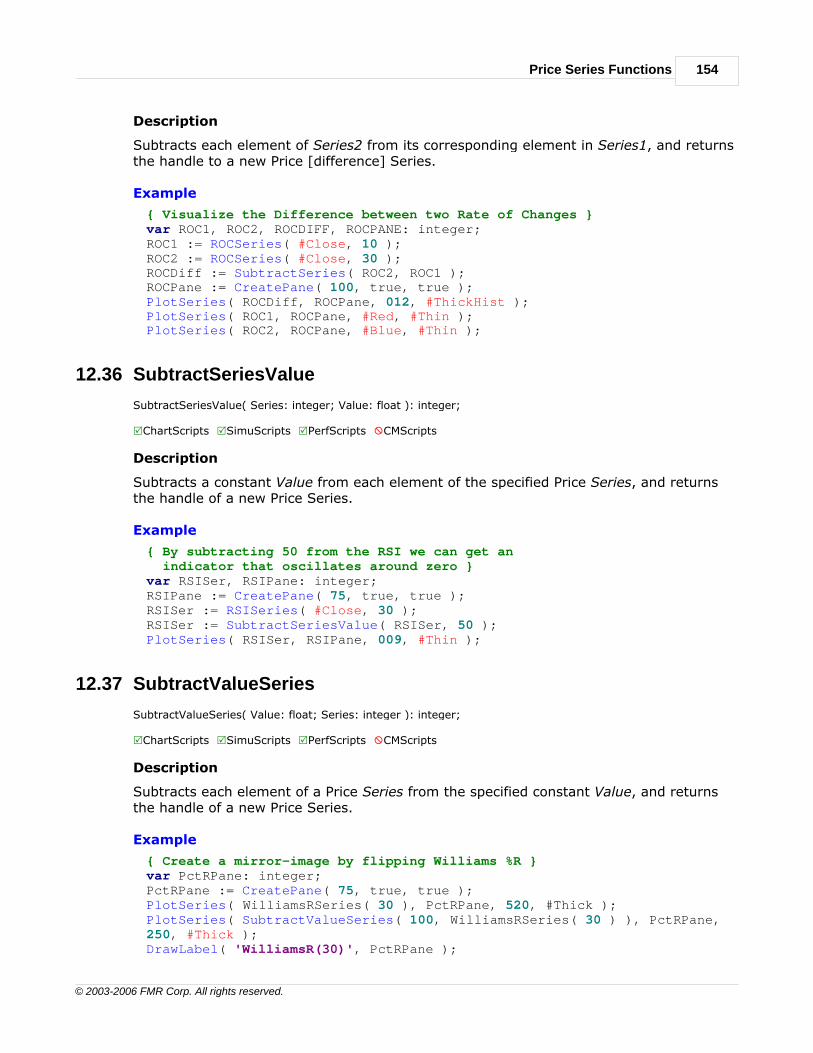
Price Series Functions 154
© 2003-2006 FMR Corp. All rights reserved.
Description
Subtracts each element of Series2 from its corresponding element in Series1, and returnsthe handle to a new Price [difference] Series.
Example
{ Visualize the Difference between two Rate of Changes }var ROC1, ROC2, ROCDIFF, ROCPANE: integer;ROC1 := ROCSeries( #Close, 10 );ROC2 := ROCSeries( #Close, 30 );ROCDiff := SubtractSeries( ROC2, ROC1 );ROCPane := CreatePane( 100, true, true );PlotSeries( ROCDiff, ROCPane, 012, #ThickHist );PlotSeries( ROC1, ROCPane, #Red, #Thin );PlotSeries( ROC2, ROCPane, #Blue, #Thin );
12.36 SubtractSeriesValue
SubtractSeriesValue( Series: integer; Value: float ): integer;
RChartScripts RSimuScripts RPerfScripts XCMScripts
Description
Subtracts a constant Value from each element of the specified Price Series, and returnsthe handle of a new Price Series.
Example
{ By subtracting 50 from the RSI we can get an indicator that oscillates around zero }var RSISer, RSIPane: integer;RSIPane := CreatePane( 75, true, true );RSISer := RSISeries( #Close, 30 );RSISer := SubtractSeriesValue( RSISer, 50 );PlotSeries( RSISer, RSIPane, 009, #Thin );
12.37 SubtractValueSeries
SubtractValueSeries( Value: float; Series: integer ): integer;
RChartScripts RSimuScripts RPerfScripts XCMScripts
Description
Subtracts each element of a Price Series from the specified constant Value, and returnsthe handle of a new Price Series.
Example
{ Create a mirror-image by flipping Williams %R }var PctRPane: integer;PctRPane := CreatePane( 75, true, true );PlotSeries( WilliamsRSeries( 30 ), PctRPane, 520, #Thick );PlotSeries( SubtractValueSeries( 100, WilliamsRSeries( 30 ) ), PctRPane,250, #Thick );DrawLabel( 'WilliamsR(30)', PctRPane );
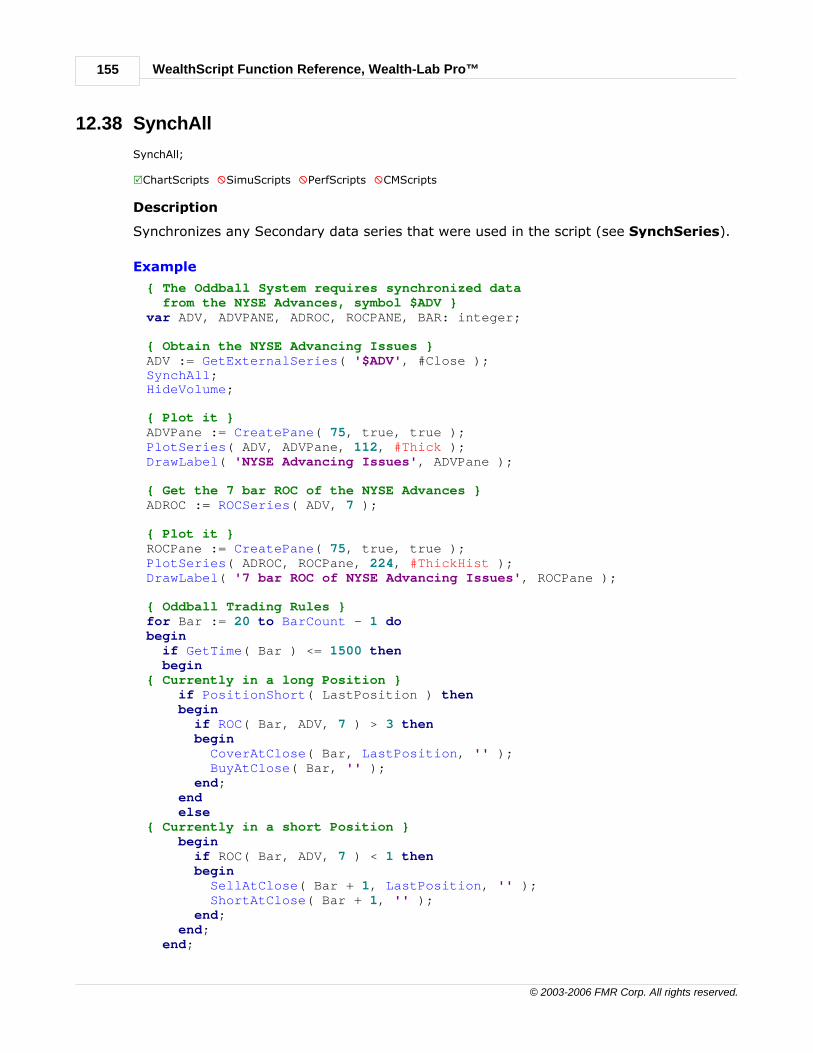
WealthScript Function Reference, Wealth-Lab Pro™155
© 2003-2006 FMR Corp. All rights reserved.
12.38 SynchAll
SynchAll;
RChartScripts XSimuScripts XPerfScripts XCMScripts
Description
Synchronizes any Secondary data series that were used in the script (see SynchSeries).
Example
{ The Oddball System requires synchronized data from the NYSE Advances, symbol $ADV }var ADV, ADVPANE, ADROC, ROCPANE, BAR: integer;
{ Obtain the NYSE Advancing Issues }ADV := GetExternalSeries( '$ADV', #Close );SynchAll;HideVolume;
{ Plot it }ADVPane := CreatePane( 75, true, true );PlotSeries( ADV, ADVPane, 112, #Thick );DrawLabel( 'NYSE Advancing Issues', ADVPane );
{ Get the 7 bar ROC of the NYSE Advances }ADROC := ROCSeries( ADV, 7 );
{ Plot it }ROCPane := CreatePane( 75, true, true );PlotSeries( ADROC, ROCPane, 224, #ThickHist );DrawLabel( '7 bar ROC of NYSE Advancing Issues', ROCPane );
{ Oddball Trading Rules }for Bar := 20 to BarCount - 1 dobegin if GetTime( Bar ) <= 1500 then begin{ Currently in a long Position } if PositionShort( LastPosition ) then begin if ROC( Bar, ADV, 7 ) > 3 then begin CoverAtClose( Bar, LastPosition, '' ); BuyAtClose( Bar, '' ); end; end else{ Currently in a short Position } begin if ROC( Bar, ADV, 7 ) < 1 then begin SellAtClose( Bar + 1, LastPosition, '' ); ShortAtClose( Bar + 1, '' ); end; end; end;

Price Series Functions 156
© 2003-2006 FMR Corp. All rights reserved.
end;{$I 'Profit Pane (Bottom)'}
12.39 SynchSeries
SynchSeries( Symbol: string );
RChartScripts XSimuScripts XPerfScripts XCMScripts
Description
Synchronizes the data in a Secondary data series from Symbol (obtained fromGetExternalSeries or SetPrimarySeries) to the Primary data series, so that all barsare perfectly aligned by date. There are two actions that SynchSeries can perform onthe Secondary Series (it never modifies the Primary Series). First, if the SecondarySeries contains dates that do not exist in the Primary Series, these bars are eliminatedfrom the Secondary Series. Next, if the Primary Series contains dates that do not exist inthe Secondary, synthetic bars of data are added to the Secondary Series to make up themissing bars. These synthetic bars obtain their value from the previous bar's data.
You should call SynchSeries only after creating any desired indicators from theSecondary Series. The synchronization process is applied to all indicators created fromthe Secondary Series, ensuring that they align properly with the dates in the PrimarySeries. If you create your indicators after calling SynchSeries, bars may be removed orduplicated, and the indicators would be based on imperfect data.
However, if you want to perform operations that combine the Secondary Series and thePrimary (using DivideSeries for example), do so after the synchronization has takenplace.
Example
{ This script shows visually how data might be misaligned. It obtains the Nasdaq index, then makes a copy of the data. The SynchSeries then synchronizes the original data series. The script then plots both the synchronized and the original Series so you can see if any data problems existed. }var NAZ, NAZCOPY, NAZPANE: integer;Naz := GetExternalSeries( '^IXIC', #Close );NazCopy := MultiplySeriesValue( Naz, 1 );SynchSeries( '^IXIC' );NazPane := CreatePane( 100, true, true );PlotSeries( Naz, NazPane, #Black, #Thin );PlotSeries( NazCopy, NazPane, #Red, #Thin );
12.40 SyntheticBar
SyntheticBar( Bar: integer ): boolean;
RChartScripts RSimuScripts XPerfScripts XCMScripts
Description
Returns true if the specified Bar number is a "synthetic" bar. A synthetic bar is a bar thatwas added to the chart as a result of a call of AddCalendarDays or AddFutureBars.

WealthScript Function Reference, Wealth-Lab Pro™157
© 2003-2006 FMR Corp. All rights reserved.
12.41 TurnDown
TurnDown( Bar: integer; Series: integer ): boolean;
RChartScripts RSimuScripts RPerfScripts XCMScripts
Description
Returns true if the Price Series has turned down as of the specified Bar. A Price Serieshas "turned down" if its value is less than its previous value, and its previous value wasgreater than or equal to the value preceding it.
Specifically, given a Series D, TurnDown returns true if
@D[Bar] < @D[Bar - 1], and,@D[Bar - 1] >= @D[Bar - 2]
Example
{ Buy when Williams %R turns down and is above 80 }var PctRPane: integer;PctRPane := CreatePane( 75, true, true );PlotSeries( WilliamsRSeries( 30 ), PctRPane, 009, #Thin );var Bar: integer;InstallStopLoss( 5 );InstallProfitTarget( 10 );for Bar := 30 to BarCount - 1 dobegin ApplyAutoStops( Bar ); if TurnDown( Bar, WilliamsRSeries( 30 ) ) then if WilliamsR( Bar, 30 ) > 80 then BuyAtMarket( Bar + 1, 'WR' );end;
12.42 TurnUp
TurnUp( Bar: integer; Series: integer ): boolean;
RChartScripts RSimuScripts RPerfScripts XCMScripts
Description
Returns true if the Price Series has turned up as of the specified Bar. A Price Series"turns up" if its value is greater than its previous value, and its previous value was lessthan or equal to the value preceding it.
Specifically, given a Series U, TurnUp returns true if
@U[Bar] > @U[Bar - 1], and,@U[Bar - 1] <= @U[Bar - 2]
Example
{ Enter the market when the slow stochastic turns up from below 15 }var Bar, StochPane: integer;StochPane := CreatePane( 100, true, true );PlotSeries( StochDSeries( 60, 5 ), StochPane, 202, #Thick );for Bar := 65 to BarCount - 1 dobegin

Price Series Functions 158
© 2003-2006 FMR Corp. All rights reserved.
if not LastPositionActive then begin if StochD( Bar - 1, 60, 5 ) < 15 then if TurnUp( Bar, StochDSeries( 60, 5 ) ) then BuyAtMarket( Bar + 1, 'StochasticD Turns Up' ); end else begin if CrossOverValue( Bar, StochDSeries( 60, 5 ), 80 ) then SellAtMarket( Bar + 1, LastPosition, 'StochD Crosses 80' ); end;end;

WealthScript Function Reference, Wealth-Lab Pro™159
© 2003-2006 FMR Corp. All rights reserved.
13 SimuScript Functions
13.1 Overview
SimuScripts are an advanced feature of Wealth-Lab Pro that let you experiment with yourvery own position-sizing rules in the $imulator as well as in the ChartScript, Rankings,and Scans tools when Portfolio Simulation mode is selected. A SimuScript is a specialtype of ChartScript that must be stored in the "SimuScripts" folder. For moreinformation, see the chapter on SimuScripts in the WealthScript Function Reference.
Generally speaking, besides the specific SimuScript-category functions, you can use anyof the functions in the other categories excluding the functions that appear in thefollowing categories:
· Alerts· Cosmetic Charts· System· Time Frame· Trading System
13.2 BarCount
BarCount: integer;
RChartScripts RùSimuScripts RPerfScripts XCMScripts
Description
Returns the total number of bars available at the time the current $imulator (or PortfolioSimulation) trade was opened.
Example
{ See if we've had at least a 20% Equity rise in the last 100 Bars }var CHANGE: float;var GAIN20: boolean;Gain20 := false;if BarCount > 100 thenbegin Change := Equity( BarCount - 1 ) - Equity( BarCount - 100 ); Change := ( Change / Equity( BarCount - 100 ) ) * 100; if Change >= 20 then SetPositionSizePct( 50 ) else SetPositionSizePct( 5 );end;
13.3 BuyAndHold
BuyAndHold( Bar: integer ): float;
RChartScripts RSimuScripts RPerfScripts XCMScripts

SimuScript Functions 160
© 2003-2006 FMR Corp. All rights reserved.
Description
Returns the Buy & Hold Equity curve value at the specified Bar.
Example
{ Use any surges in the Buy & Hold equity curve to increase out position size }var xCurrent, xPast, xDiff, xPct: float;SetPositionSizePct( 10 );if BarCount > 20 thenbegin xCurrent := BuyAndHold( BarCount - 1 ); xPast := BuyAndHold( BarCount - 20 ); xDiff := xCurrent - xPast; xPct := ( xDiff / xCurrent ) * 100; if xPct > 0 then SetPositionSizePct( 10 + xPct );end;
13.4 CandidateCount
CandidateCount: integer;
XChartScripts RSimuScripts XPerfScripts XCMScripts
Description
Returns the number of potential Positions that are being processed for the bar on whichthe SimuScript was called.
Remarks
• CandidateCount can be used, for example, to spread current cash or equity equallyover trading signals generated on the same bar in Portfolio $imulations only (seewarning).
Warning! Generally, use of CandidateCount should be restricted to testing tradingsystems that use market order entries exclusively. If used in conjunctionwith stop or limit entries a peeking effect can occur since only thetheoretical trades that actually take place are counted.
• CandidateCount returns the count of all Alerts for all order types(Market/Limit/Stop/Close).
Example
{ Spread free cash equally over multiple signals generated on the samebar if Cash > 10000. (No margin assumed) }
const MINSIZE = 10000;var Bar: integer = BarCount - 1;var Size: float;
if Cash( Bar ) < MINSIZE then SetPositionSizeShares( 0 )else if CandidateCount = 1 then SetPositionSizeFixed( MINSIZE )elsebegin

WealthScript Function Reference, Wealth-Lab Pro™161
© 2003-2006 FMR Corp. All rights reserved.
Size := Cash( Bar ) / CandidateCount; SetPositionSizeFixed( Size );end;
13.5 Cash
Cash( Bar: integer ): float;
RChartScripts RSimuScripts RPerfScripts XCMScripts
Description
Returns the Cash level at the specified Bar. The Cash level is equal to Equity minuscurrent market Exposure.
Warning! The Cash function is also available for ChartScripts, but it cannot beemployed in a system's trading rules if destined for the $imulator.
Example
{ SimuScript: Don't take a new Position if our Cash reserve is less than$5,000. If this happens we need a vacation anyway. }if Cash( BarCount - 1 ) < 5000 then SetPositionSizeShares( 0 );
13.6 DrawDown
DrawDown( Bar: integer ): float;
RChartScripts RSimuScripts RPerfScripts XCMScripts
Description
Returns the drawdown for the specified Bar. DrawDown is calculated on a closing basisand is the dollar amount below the last peak in the equity curve.
Remarks:
• DrawDown retains its negative sign. For example, a drawdown of $5,000 is returnedas -5000.
• To obtain the DrawDown for the current bar in a SimuScript, pass BarCount - 1 asthe Bar parameter.
Warning! DrawDown is also available for ChartScripts, but it cannot be employed in asystem's trading rules if destined for the $imulator.
Example
{ SimuScript sizing example based on drawdown }var HighestEquity: float;
{ Use Global Storage to track Highest Equity }if PositionCount = 0 thenbegin

SimuScript Functions 162
© 2003-2006 FMR Corp. All rights reserved.
ShowMessage( 'Init' ); SetGlobal( 'Highest', Equity( 0 ) );end;
HighestEquity := GetGlobal( 'Highest' );if Equity( BarCount - 1 ) > HighestEquity thenbegin HighestEquity := Equity( BarCount - 1 ); SetGlobal( 'Highest', HighestEquity );end;
{ Have we doubled account size? }if HighestEquity > Equity( 0 ) * 2 thenbegin if -DrawDown( BarCount - 1 ) > HighestEquity * 0.10 then SetPositionSizePct( 0 ) else SetPositionSizePct( 10 );endelse SetPositionSizePct( 25 );
13.7 DrawDownPct
DrawDownPct( Bar: integer ): float;
RChartScripts RSimuScripts RPerfScripts XCMScripts
Description
Returns the percentage drawdown for the specified Bar. DrawDownPct is calculated ona closing basis and represents the percent decrease in equity since the last peak in theequity curve.
Remarks:
• DrawDownPct is reported in percentage terms, and, it retains its negative sign. Forexample, a 5% drawdown is returned as -5.
• To obtain the DrawDownPct for the current bar in a SimuScript, pass BarCount - 1as the Bar parameter.
Warning! DrawDownPct is also available for ChartScripts, but it cannot be employedin a system's trading rules if destined for the $imulator.
Example
{ SimuScript: Preserve Capital by taking no trades during large drawdownperiods }if DrawDownPct( BarCount - 1 ) < -5 then SetPositionSizeShares( 0 )else SetPositionSizePct( 10 );

WealthScript Function Reference, Wealth-Lab Pro™163
© 2003-2006 FMR Corp. All rights reserved.
13.8 Equity
Equity( Bar: integer ): float;
RChartScripts RSimuScripts RPerfScripts XCMScripts
Description
Returns the total account value at the specified Bar. In Wealth-Lab, Equity refers to thetotal Cash plus Market Exposure.
Remarks
• Do not use Equity in a ChartScript that is destined for the $imulator, which processesPortfolio Equity while sizing Positions following ChartScript execution. Search for thefollowing articles in the Knowledge Base for more information: Interacting Dynamicallywith Portfolio Level Equity and Understanding the $imulator.
Warning! The Equity function is also available for ChartScripts, but it cannot beemployed in a system's trading rules if destined for the $imulator.
Example
{ SimuScript Take the money and run! }if Equity( BarCount - 1 ) > 120000 then SetPositionSizeShares( 0 );
13.9 SetPositionSizeFixed
SetPositionSizeFixed( Value: float );
XChartScripts RSimuScripts XPerfScripts XCMScripts
Description
Instructs the $imulator (or Portfolio Simulation) to assign a fixed Position size, a dollarValue, to the Position currently being processed by the SimuScript.
Example
{ Set a Position size of half current available cash }SetPositionSizeFixed( Cash( BarCount - 1 ) / 2 );
13.10 SetPositionSizePct
SetPositionSizePct( Value: float );
XChartScripts RSimuScripts XPerfScripts XCMScripts
Description
Instructs the $imulator (or Portfolio Simulation) to assign a percentage, Value, of thetotal Equity size (the net value of the Portfolio, cash + equities) to the Position that iscurrently being processed by the SimuScript.
Example

SimuScript Functions 164
© 2003-2006 FMR Corp. All rights reserved.
{ The ChartScript Code used SetPositionData to establish the percentage of equity that should be used. The "PositionData" must be set in the ChartScript code. }x := GetPositionData( #Current );SetPositionSizePct( x );
13.11 SetPositionSizeShares
SetPositionSizeShares( Shares: integer );
XChartScripts RSimuScripts XPerfScripts XCMScripts
Description
Tells the $imulator (or Portfolio Simulation) to assign a fixed number of Shares to thePosition currently being processed.
Example
{ Set the value number of shares based on the position's basis price. }var Basis: float;var Shrs: integer;
Basis := PositionBasisPrice( #Current );if Basis < 10 then Shrs := 800else if Basis < 20 then Shrs := 500else if Basis < 50 then Shrs := 300else Shrs := 200;
SetPositionSizeShares( Shrs );
13.12 SortByEntryDate
SortByEntryDate;
XChartScripts xSimuScripts XPerfScripts XCMScripts
Description
Instructs the SimuScript to access Positions in the order in which they were opened. Thesort order becomes important if you write SimuScripts that assign Position size based onstreaks.
Remarks
$imulator only. Not available for Portfolio Simulations run from the ChartScriptwindow.
Example
{ Increase Position Size based on last 5 submitted trades }var n, p: integer;var x: float;x := 1000;

WealthScript Function Reference, Wealth-Lab Pro™165
© 2003-2006 FMR Corp. All rights reserved.
n := 0;SortByEntryDate;for p := PositionCount - 1 downto 0 do if not PositionActive( p ) then begin n := n + 1; if n > 5 then Break; if PositionProfit( p ) > 0 then x := x * 2; end;SetPositionSizeFixed( x );
13.13 SortByExitDate
SortByExitDate;
XChartScripts xSimuScripts XPerfScripts XCMScripts
Description
Instructs the SimuScript to access Positions in the order in which they were closed. Thesort order becomes important if you write SimuScripts that assign Position size based onstreaks.
Remarks
$imulator only. Not available for Portfolio Simulations run from the ChartScriptwindow.
Example
{ Increase Position Size as we get streaks of winners }var p: integer;var x: float;x := 1000;SortByExitDate;for p := PositionCount - 1 downto 0 do if not PositionActive( p ) then if PositionProfit( p ) > 0 then x := x + 1000 else Break;SetPositionSizeFixed( x );

String Functions 166
© 2003-2006 FMR Corp. All rights reserved.
14 String Functions
14.1 Overview
To compare, parse, or otherwise manipulate string variables, the String category offunctions has what it takes.
14.2 CharAt
CharAt( Value: string; Index: integer ): string;
RChartScripts RSimuScripts RPerfScripts RCMScripts
Description
Returns a single string character at the Index position from the Value string.
Remarks
• The Index of the first character in the Value string is 1.
• If the Index is invalid, CharAt returns "NUL", i.e., ASCII Code 0.
• To return a complete substring instead of just one character, use Copy.
Example
{ A re-useable vertical labeling routine }procedure VerticalLabel( Bar: integer; str: string; AbovePrices: boolean;Color, Size: integer );beginvar n: integer; if AbovePrices then begin for n := Length( str ) downto 1 do AnnotateBar( CharAt( str, n ), Bar, AbovePrices, Color, Size ); end else for n := 1 to Length( str ) do AnnotateBar( CharAt( str, n ), Bar, AbovePrices, Color, Size );end;
const S1 = 'PEAK';const S2 = 'TROUGH';var Bar, PB, TB: integer;
{ Make extra room for peak label }HidePaneLines;CreatePane( 20, true, false );
Bar := BarCount - 1;PB := PeakBar( Bar, #Close, 5 );VerticalLabel( PB, S1, true, #Blue, 8 );TB := TroughBar( Bar, #Close, 5 );VerticalLabel( TB, S2, false, #Red, 8 );

WealthScript Function Reference, Wealth-Lab Pro™167
© 2003-2006 FMR Corp. All rights reserved.
14.3 Chr
Chr( ASCIICode: integer ): string;
RChartScripts RSimuScripts RPerfScripts RCMScripts
Description
Returns the string character of the specified ASCIICode, which may be a literal wholenumber or integer variable.
Remarks
• Alternatively, you may use the shorthand "#asciicode" notation. In this case, you
must use a literal number from 0 to 255, inclusive, as shown in the example.
• See also: Ord
Example
{ Print a list of the ASCII characters to the debug window starting with printable characters }var i: integer;for i := 33 to 255 do{ Separate the items by a Tab character, ASCII 9 } Print( IntToStr( i ) + #9 + Chr( i ) );
14.4 CompareStr
CompareStr( s1: string; s2: string ): integer;
RChartScripts RSimuScripts RPerfScripts RCMScripts
Description
Compares two strings, s1 and s2, case sensitively. The function returns 0 if the twostrings are equal. If the first string is greater than the second (alphabetically), thefunction returns a positive integer, and it returns a negative integer if the second string isgreater.
Example
var s1, s2: string;s1 := Input( 'Enter First String' );s2 := Input( 'Enter Second String' );ShowMessage( 'CompareStr Result is: ' + IntToStr( CompareStr( s1, s2 ) ) );
14.5 CompareText
CompareText( s1: string; s2: string ): integer;
RChartScripts RSimuScripts RPerfScripts RCMScripts

String Functions 168
© 2003-2006 FMR Corp. All rights reserved.
Description
Compares two strings, s1 and s2, without case sensitivity. The function returns 0 if thetwo strings are equal. If the first string is greater than the second (alphabetically), thefunction returns a positive integer, and it returns a negative integer if the second string isgreater.
Example
var s1, s2: string;s1 := Input( 'Enter First String' );s2 := Input( 'Enter Second String' );ShowMessage( 'CompareText Result is: ' + IntToStr( CompareText( s1, s2 ) ) );
14.6 Copy
Copy( String: string; Index: integer; Count: Integer ): string;
RChartScripts RSimuScripts RPerfScripts RCMScripts
Description
Returns a substring from the specified String. The substring begins at the positionspecified in the Index parameter, and has a length specified by the Count parameter.
Example
function GetFirstWord( s: string ): string;var n: integer;begin Result := ''; n := Pos( ' ', s ); if n > 2 then Result := Copy( s, 1, n - 1 );end;DrawLabel( GetFirstWord( GetSecurityName ), 0 );
14.7 Delete
Delete( String: string; Index: integer; Count: integer);
RChartScripts RSimuScripts RPerfScripts RCMScripts
Description
Removes a substring from the specified String. The substring that is removed begins atthe value of the Index parameter, and has a length specified by the Count parameter.
Example
var s: string;s := 'Honest Abe Lincoln';Delete( s, 8, 4 );ShowMessage( s );

WealthScript Function Reference, Wealth-Lab Pro™169
© 2003-2006 FMR Corp. All rights reserved.
14.8 FloatToStr
FloatToStr( Value: float ): string;
RChartScripts RSimuScripts RPerfScripts RCMScripts
Description
Converts the specified floating point Value to a string. For more control over theconversion process, use the FormatFloat function.
Example
{ Display the change over a one year period }var X, X2, XCHANGE, XPCT: float;x := PriceClose( BarCount - 251 );x2 := PriceClose( BarCount - 1 );xChange := x2 - x;xPct := ( xChange / x ) * 100;DrawLabel( 'Net Change over a past year: ' + FloatToStr( xPct ) + '%', 0 );
14.9 FormatFloat
FormatFloat( FormatString: string; Value: float );
RChartScripts RSimuScripts RPerfScripts RCMScripts
Description
Converts the specified floating point value to a string, using the specified FormatString.The following characters most commonly appear in the format string:
0 specifies a digit and forces leading/trailing zeroes if Value does not have adigit that falls in the position appearing in FormatString
# same as 0, but displays nothing if Value has no corresponding digit
, (comma) digit grouping symbol (thousands only)
. (period) decimal point
other Other printable characters are displayed as literals in the position where theyappear in the format string. You can add currency symbols ($, €, etc.) or thepercent sign (%), e.g., '$#,##0.00' or '0.0%'
Remarks
• Using a comma "," in FormatString will add the Digit grouping symbol defined in yourWindows Regional Options Numbers tab. Regardless of the comma's position in theformat string, the grouping will be by thousands.
• Using a period "." in the format code will add a Decimal symbol defined in yourWindows Regional Options Numbers tab. Using more than one period in FormatStringwill generate an error.
Example
{ Print a closing value to the debug window }

String Functions 170
© 2003-2006 FMR Corp. All rights reserved.
var BAR: integer;Print( FormatFloat( '#,##0.00', PriceClose( Bar ) ) );
14.10 GetToken
GetToken( String: string; TokenNum: integer; Delimiter: string ): string;
RChartScripts RSimuScripts RPerfScripts RCMScripts
Description
Parses a String and returns an individual token. The String itself remains unaffected bythe function call. You specify a character to use as a Delimiter, and the token number,TokenNum, to return. Pass 0 to return the first token, 1 for the second, etc.
Remarks
• GetToken returns a null string (ASCII Code 0) if the specified TokenNum does notexist in the String.
Example
{ Return a token from a space-delimited string }s := 'This is a line of tokens';sToken := GetToken( s, 5, ' ' );{ sToken now contains the string "tokens" }
14.11 Insert
Insert( Source: string; S: string; Index: Integer);
RChartScripts RSimuScripts RPerfScripts RCMScripts
Description
Inserts a substring, Source, into a string S beginning at a point specified by the Indexparameter.
Example
var s: string;s := 'Honest Lincoln';Insert( 'Abe ', s, 8 );ShowMessage( s );
14.12 IntToStr
IntToStr( Value: integer ): string;
RChartScripts RSimuScripts RPerfScripts RCMScripts
Description
Convert the integer value specified in the Value parameter to a string.

WealthScript Function Reference, Wealth-Lab Pro™171
© 2003-2006 FMR Corp. All rights reserved.
Example
{ Display the total number of bars in the chart }DrawLabel( 'The Chart has ' + IntToStr( BarCount ) + ' Bars', 0 );
14.13 Length
Length( String: string ): integer;
RChartScripts RSimuScripts RPerfScripts RCMScripts
Description
Returns the length of the specified String.
Example
var s: string;s := 'Wealth-Lab';n := Length( s ); //n is now 10
14.14 LowerCase
LowerCase( Value: string ): string;
RChartScripts RSimuScripts RPerfScripts RCMScripts
Description
Returns a lowercase copy of the specified string, Value.
Example
{ Capitalize the first letter of the name only }var S, FIRSTLETTER: string;s := LowerCase( GetSecurityName );if s = '' then Exit;FirstLetter := UpperCase( Copy( s, 1, 1 ) );s := FirstLetter + Copy( s, 2, Length( s ) );ShowMessage( s );
14.15 Ord
Ord( Value: string ): integer;
RChartScripts RSimuScripts RPerfScripts RCMScripts
Description
Returns the ordinality (ASCII code) of the first character of the specified Value.
Remarks
• Value can be any sequence of characters, but must not be a blank string.
• See also: Chr
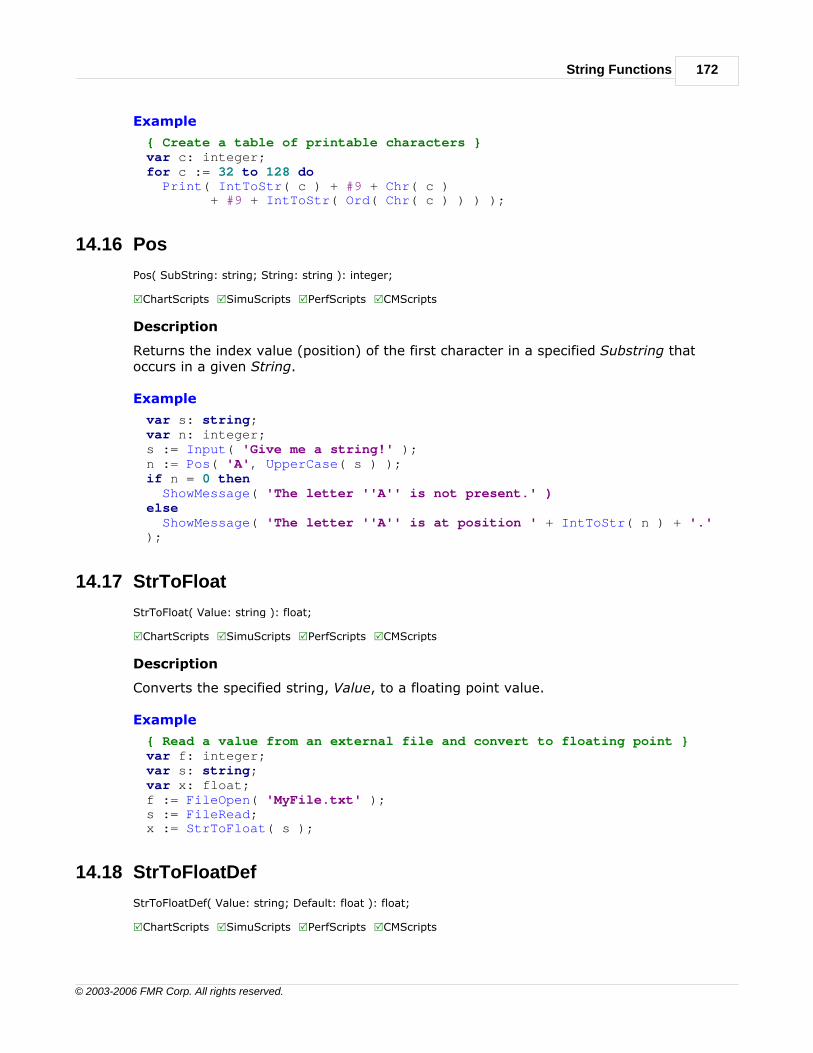
String Functions 172
© 2003-2006 FMR Corp. All rights reserved.
Example
{ Create a table of printable characters }var c: integer;for c := 32 to 128 do Print( IntToStr( c ) + #9 + Chr( c ) + #9 + IntToStr( Ord( Chr( c ) ) ) );
14.16 Pos
Pos( SubString: string; String: string ): integer;
RChartScripts RSimuScripts RPerfScripts RCMScripts
Description
Returns the index value (position) of the first character in a specified Substring thatoccurs in a given String.
Example
var s: string;var n: integer;s := Input( 'Give me a string!' );n := Pos( 'A', UpperCase( s ) );if n = 0 then ShowMessage( 'The letter ''A'' is not present.' )else ShowMessage( 'The letter ''A'' is at position ' + IntToStr( n ) + '.');
14.17 StrToFloat
StrToFloat( Value: string ): float;
RChartScripts RSimuScripts RPerfScripts RCMScripts
Description
Converts the specified string, Value, to a floating point value.
Example
{ Read a value from an external file and convert to floating point }var f: integer;var s: string;var x: float;f := FileOpen( 'MyFile.txt' );s := FileRead;x := StrToFloat( s );
14.18 StrToFloatDef
StrToFloatDef( Value: string; Default: float ): float;
RChartScripts RSimuScripts RPerfScripts RCMScripts
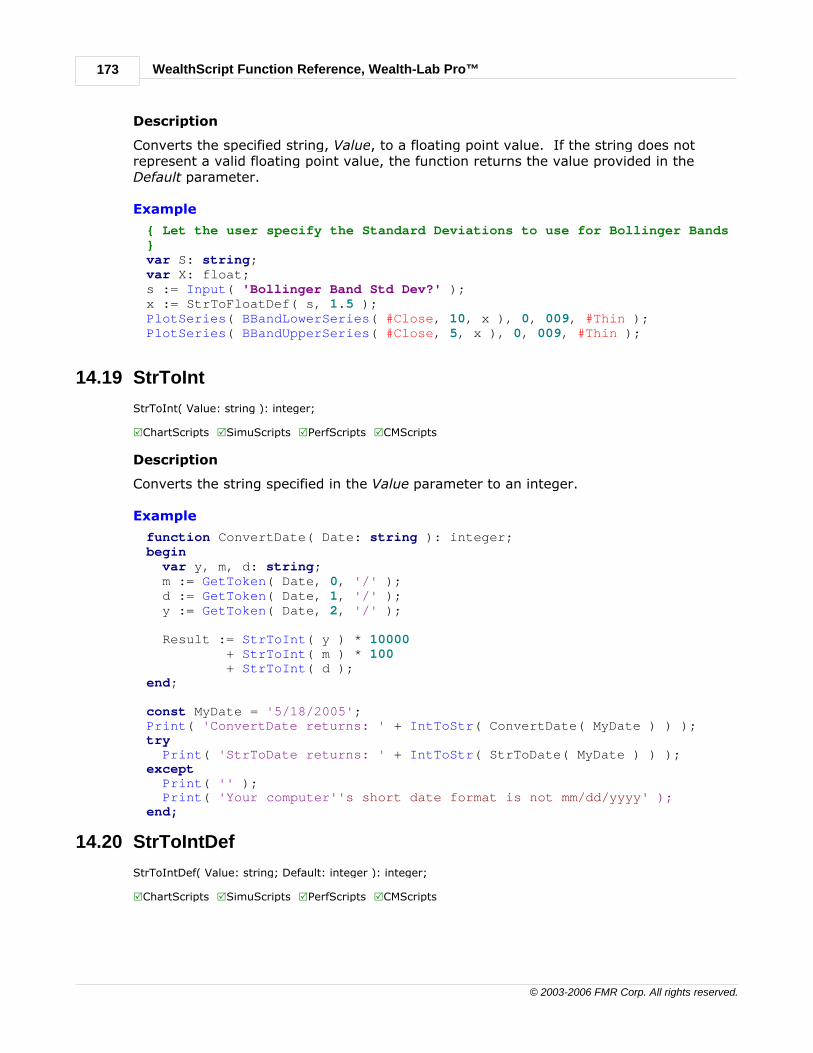
WealthScript Function Reference, Wealth-Lab Pro™173
© 2003-2006 FMR Corp. All rights reserved.
Description
Converts the specified string, Value, to a floating point value. If the string does notrepresent a valid floating point value, the function returns the value provided in theDefault parameter.
Example
{ Let the user specify the Standard Deviations to use for Bollinger Bands}var S: string;var X: float;s := Input( 'Bollinger Band Std Dev?' );x := StrToFloatDef( s, 1.5 );PlotSeries( BBandLowerSeries( #Close, 10, x ), 0, 009, #Thin );PlotSeries( BBandUpperSeries( #Close, 5, x ), 0, 009, #Thin );
14.19 StrToInt
StrToInt( Value: string ): integer;
RChartScripts RSimuScripts RPerfScripts RCMScripts
Description
Converts the string specified in the Value parameter to an integer.
Example
function ConvertDate( Date: string ): integer;begin var y, m, d: string; m := GetToken( Date, 0, '/' ); d := GetToken( Date, 1, '/' ); y := GetToken( Date, 2, '/' );
Result := StrToInt( y ) * 10000 + StrToInt( m ) * 100 + StrToInt( d );end;
const MyDate = '5/18/2005';Print( 'ConvertDate returns: ' + IntToStr( ConvertDate( MyDate ) ) );try Print( 'StrToDate returns: ' + IntToStr( StrToDate( MyDate ) ) );except Print( '' ); Print( 'Your computer''s short date format is not mm/dd/yyyy' );end;
14.20 StrToIntDef
StrToIntDef( Value: string; Default: integer ): integer;
RChartScripts RSimuScripts RPerfScripts RCMScripts

String Functions 174
© 2003-2006 FMR Corp. All rights reserved.
Description
Converts the string specified in the Value parameter to an integer. If the string isn't avalid integer, the function instead returns the value in the Default parameter.
Example
{ Let the user specify the period they want to use }var S: string;var N: integer;s := Input( 'EMA Period?' );n := StrToIntDef( s, 50 );PlotSeries( EMASeries( #Close, n ), 0, 002, #Thick );
14.21 Trim
Trim( s: string ): string;
RChartScripts RSimuScripts RPerfScripts RCMScripts
Description
Returns a copy of the specified string, s, with leading and trailing blanks trimmed off.
Example
{ Read a line from an external file }var s: string;var n: integer;n := FileOpen( 'C:\MyFile.txt' );s := FileRead( n );s := Trim( s );
14.22 TrimLeft
TrimLeft( s: string ): string;
RChartScripts RSimuScripts RPerfScripts RCMScripts
Description
Returns a copy of the specified string, s, with leading blanks trimmed off.
Example
{ Get second word of company name }var s: string;var n: integer;s := GetSecurityName;n := Pos( ' ', s );if n > 0 thenbegin s := Copy( s, n, Length( s ) ); s := TrimLeft( s );end;
WealthScript Function Reference, Wealth-Lab Pro™175
© 2003-2006 FMR Corp. All rights reserved.
14.23 TrimRight
TrimRight( s: string ): string;
RChartScripts RSimuScripts RPerfScripts RCMScripts
Description
Returns a copy of the specified string, s, with trailing blanks trimmed off.
Example
{ Output contents of a file }var s: string;var f: integer;f := FileOpen( 'C:\MyFile.txt' );while not FileEOF( f ) do Print( TrimRight( FileRead( f ) ) );
14.24 UpperCase
UpperCase( s: string ): string;
RChartScripts RSimuScripts RPerfScripts RCMScripts
Description
Returns an uppercase copy of the specified string, specified in the parameter s.
Example
{ Print the names of all your ChartBooks to the Debug window }var F: integer;f := FileOpen( 'Namespaces.txt' );while not FileEOF( f ) do Print( UpperCase( FileRead( f ) ) );
System Functions 176
© 2003-2006 FMR Corp. All rights reserved.
15 System Functions
15.1 Overview
In the System category, you'll find a broad array of functions whose primary purpose isto interact with the user and external objects or programs. They also provide a mannerto control and generate output for Scans, the Commentary Window, and chart imagefiles. Finally, a subset of the System Functions furnish methods to easily work with anentire group of symbols - a WatchList.
Note: Generally speaking, the System category of WealthScript functions are notavailable for SimuScripts.
15.2 Abort
Abort;
RChartScripts RSimuScripts RPerfScripts XCMScripts
Description
Causes a script to stop processing immediately. Wealth-Lab reports an error messageupon executing an Abort statement.
Remarks
• You can abort ChartScript processing manually by striking the Esc key.
• Use Exit instead of Abort to terminate/exit a procedure without error.
Example
if BarCount < 100 then Abort;
15.3 AddCommentary
AddCommentary( Line: string );
RChartScripts XSimuScripts XPerfScripts XCMScripts
Description
Adds a Line of commentary to the ChartScript Commentary window. You can use anyvalid HTML tags in your commentary (see the User Guide in the Help File for someexamples). To force a line break end your string with the tag '<br>'.
Tip: To open the Commentary window, select View|Commentary Window(Ctrl+Alt+C) from the main menu, or select its icon from the View toolbar.

WealthScript Function Reference, Wealth-Lab Pro™177
© 2003-2006 FMR Corp. All rights reserved.
Example
var Bar: integer;var s: string;var x1, x2, x: float;const FMT = '#0.00';
Bar := BarCount - 1;s := '<h1>' + GetSymbol + '</h1>';AddCommentary( s );if not ( GetSecurityName = '' ) thenbegin s := '<h2>(' + GetSecurityName + ')</h2>'; AddCommentary( s );end;AddCommentary( '<b>Dual Stochastic Sell Strategy</b><br>' );x1 := StochD( Bar, 45, 5 );s := 'FastD(45): ' + FormatFloat( FMT, x1 ) + '<br>';AddCommentary( s );x2 := StochD( Bar, 7, 5 );s := 'FastD(7): ' + FormatFloat( FMT, x2 ) + '<br>';AddCommentary( s );x1 := Lowest( Bar, #Low, 10 );s := 'Lowest 10 Bar Low: $' + FormatFloat( FMT, x1 ) + '<br>';AddCommentary( s );
15.4 AddScanColumn
AddScanColumn( Name: string; Value: float );
RChartScripts XSimuScripts XPerfScripts XCMScripts
Description
Adds a custom column, Name, to the Real-Time Scans and WatchList Scans tools, andpopulates the column with the numeric value specified in the Value parameter. You cansort the symbols in the Scan tools by clicking on the heading of your custom columns.
Remarks
• The Value displayed in the custom column is fixed to 2 decimals of significance. UseAddScanColumnStr to display more precision.
• Typically, you'll want to provide the value of one or more indicators on the final bar ofthe chart, i.e. the signal bar. The data is displayed in the Custom Columns View afterrunning a WatchList Scan, or as a new column in the Scan Results for Real-TimeScans.
• AddScanColumn should not be used conditionally. Since all scanned symbols arealways added to the Custom Columns view of the Scans tool, adding valuesconditionally would create variable length records, which can cause printingincompatibilities.
Example
{ Add the most recent MACD as a custom column in the WatchList Scan tool}var BAR: integer;

System Functions 178
© 2003-2006 FMR Corp. All rights reserved.
Bar := BarCount - 1;AddScanColumn( 'MACD', MACD( Bar, #Close ) );
15.5 AddScanColumnStr
AddScanColumnStr( Name: string; Value: string );
RChartScripts XSimuScripts XPerfScripts XCMScripts
Description
Adds a custom column, NAddame, to the Real-Time Scans and WatchList Scans tools,and populates the column with the string specified in the Value parameter. You can sortthe symbols in the Scan tools by clicking on the heading of your custom columns.
Remarks
• Use AddScanColumnStr with FormatFloat to control the display precision of anumber.
• Typically, you'll want to provide a string message on the final bar of the chart, i.e. thesignal bar. The data is displayed in the Custom Columns View after running aWatchList Scan, or as a new column in the Scan Results for Real-Time Scans.
• AddScanColumnStr should not be used conditionally. Since all scanned symbols arealways added to the Custom Columns view of the Scans tool, adding valuesconditionally would create variable length records, which can cause printingincompatibilities.
Example
var C: float;var S: string;s := WatchListName;AddScanColumnStr( 'List', s );
{ Show the final closing price with 3 decimals of precision }C := PriceClose( BarCount - 1 );AddScanColumnStr( 'Close', FormatFloat( '0.000', C ) );
15.6 AllowSymbolSearch
AllowSymbolSearch( DataSource: string );
RChartScripts XSimuScripts XPerfScripts XCMScripts
Description
Specifies the DataSource(s) that will be searched when an external symbol is requestedthat is not within the same DataSource as the symbol being executed in the chart. If youdo not call AllowSymbolSearch, Wealth-Lab searches for the external data in all of yourDataSources in alphabetical order. Call AllowSymbolSearch one or more times in thescript to allow only certain DataSources to be searched.
Example
{ Allow the script to search these daily DataSources only and ignore Intraday DataSources }

WealthScript Function Reference, Wealth-Lab Pro™179
© 2003-2006 FMR Corp. All rights reserved.
AllowSymbolSearch( 'Dow 30' );AllowSymbolSearch( 'Nasdaq 100' );
15.7 CreateOleObject
CreateOleObject( ClassName: string ): ComVariant;
RChartScripts RSimuScripts RPerfScripts XCMScripts
Description
Creates an instance of an OLE (Object/Linking and Embedding) object with the specifiedCOM ClassName. The return value of this function should be stored into a variable ofdata type ComVariant. Once created, you can call any methods that are available in theobject.
Example
{ Interfacing to a Wealth-Lab add-in written as a COM DLL }var lib: ComVariant;var CustomSeries: integer;lib := CreateOleObject( 'AddOnLib.WLAddOn' );lib.ExecuteProc( 123, IWealthLabAuto );CustomSeries := CreateSeries;lib.CustomIndicator( CustomSeries, #Close, 24, IWealthLabAuto );PlotSeries( CustomSeries, 0, #Red, #Thick );
15.8 GetGlobal
GetGlobal( VariableName: string ): Variant;
RChartScripts RSimuScripts XPerfScripts RCMScripts
Description
Retrieves a variant value from the variable VariableName in a global storage area, whichis available to all Wealth-Lab scripts, excluding PerfScripts. Assign values to the globalstorage area by using SetGlobal.
Values assigned to the global storage area retain their values between script runs. Youcan, for example, set a global variable in a ChartScript and then access the value in aSimuScript.
Remarks
• If the global variable VariableName does not exist GetGlobal returns Null.
Note: In prior versions of Wealth-Lab, GetGlobal returned 0 for non-existent globalvariables. This made it difficult to store strings in a global variables and testfor their existence.
Example
{ Retrieve the BarCount stored in Global Storage. See SetGlobal example}var MyVar: string;if GetGlobal( 'AABarCount' ) = Null then

System Functions 180
© 2003-2006 FMR Corp. All rights reserved.
beginMyVar := Input( 'Enter a Value:' );SetGlobal( 'AABarCount', MyVar );
endelseMyVar := GetGlobal( 'AABarCount' );
ShowMessage( 'The value is: ' + MyVar );
15.9 GetScriptName
GetScriptName: string;
RChartScripts xSimuScripts XPerfScripts XCMScripts
Description
Returns the name of the ChartScript that is currently being executed.
Remarks
• In a SimuScript, GetScriptName returns the name of the ChartScript.
• Not valid for SimuScripts used by the $imulator.
Example
var s: string;s := GetScriptName;if s = '' then s := 'Untitled';Print( 'The ChartScript name is ' + s );
15.10 GetTickCount
GetTickCount: integer;
RChartScripts RSimuScripts RPerfScripts XCMScripts
Description
Returns the number of milliseconds that the operating system has been operating. Thisvalue is used for benchmarking purposed. By taking the TickCount before and after anoperation, and then subtracting the difference, you can gauge how long an operation istaking to complete.
Example
var Bar, n1, n2, r, i: integer;var x: float;n1 := GetTickCount;x := 0;for i := 30 to BarCount - 1 do x := x + RSI( Bar, #Close, 30 );n2 := GetTickCount;ShowMessage( 'Loop took ' + IntToStr( n2 - n1 ) + ' ms to complete' );

WealthScript Function Reference, Wealth-Lab Pro™181
© 2003-2006 FMR Corp. All rights reserved.
15.11 Input
Input( Caption: string ): string;
RChartScripts RSimuScripts RPerfScripts XCMScripts
Description
Displays an input dialog where the user can enter a value, which is always returned as astring type, that is returned by the function. The specified Caption is displayed as amessage to prompt the user for input.
Note: The Input function is not compatible with ChartScript Integrated Debuggerwhen Stepping.
Example
{ Get the period for an indicator each time the ChartScript is executed }var Period: integer;var s: string;s := Input( 'Indicator Period?' );Period := StrToInt( s );PlotSeriesLabel( EMASeries( #Close, Period ), 0, #Blue, #Thick, 'EMA(' +s + ')' );
15.12 IWealthLabAddOn3
IWealthLabAddOn3: COMVariant;
RChartScripts RSimuScripts RPerfScripts XCMScripts
Description
Returns an instance of Wealth-Lab Pro's COM Add-On Interface. You can write add-ins toWealth-Lab Pro in any language capable of producing an ActiveX (COM) DLL. Your add-ins should accept the IWealthLabAddOn3 interface as a parameter to their functioncalls. They can then utilize the methods of the interface to execute trades and createcustom indicators.
For more information on the IWealthLabAddOn3 interface see the Add-On API articleon the Wealth-Lab.com web site.
Example
{ Interfacing to a Wealth-Lab add-in written in Visual Basic }var lib: ComVariant;var CustomSeries: integer;lib := CreateOleObject( 'VBWL.VBWLInterface' );lib.Execute( IWealthLabAddOn3 );CustomSeries := CreateSeries;lib.CustomIndicator( #Close, CustomSeries, 24, IWealthLabAddOn3 );PlotSeries( CustomSeries, 0, #Navy, #Thick );

System Functions 182
© 2003-2006 FMR Corp. All rights reserved.
15.13 IWealthLabAuto
IWeathLabAuto: COMVariant;
RChartScripts RSimuScripts RPerfScripts XCMScripts
Description
Returns an instance of Wealth-Lab Developer 2.1's COM Automation Interface. You canwrite add-ins to Wealth-Lab Developer 2.1 in any language capable of producing anActiveX (COM) DLL. Your add-ins should accept the IWeathLabAuto interface as aparameter to their function calls. They can then utilize the methods of the interface toexecute trades and create custom indicators.
For more information on the IWealthLabAuto interface see the COM Reference articleon the Wealth-Lab.com web site.
Example
{ Interfacing to a Wealth-Lab 2.1 add-in written in Visual Basic }var lib: ComVariant;var CustomSeries: integer;lib := CreateOleObject( 'VBWL.VBWLInterface' );lib.Execute( IWealthLabAuto );CustomSeries := CreateSeries;lib.CustomIndicator( #Close, CustomSeries, 24, IWealthLabAuto );PlotSeries( CustomSeries, 0, #Navy, #Thick );
15.14 IsRealTime
IsRealTime: boolean;
RChartScripts XSimuScripts XPerfScripts XCMScripts
Description
Returns boolean true if the script is accessing data from a Live Feed. Otherwise thefunction returns false.
Example
{ For example, use IsRealTime to disable LastBar logic }var Bar: integer;for Bar := 20 to BarCount - 1 dobegin if LastPositionActive then begin if LastBar( Bar ) and ( not IsRealTime ) then SellAtClose( Bar, LastPosition, 'EOD' ); end else begin { Entry logic } end;end;

WealthScript Function Reference, Wealth-Lab Pro™183
© 2003-2006 FMR Corp. All rights reserved.
15.15 Null
Null: variant;
RChartScripts RSimuScripts RPerfScripts XCMScripts
Description
Returns a Variant "Null" value. See GetGlobal for more information.
15.16 PlaySound
PlaySound( FileName: string );
RChartScripts XSimuScripts XPerfScripts XCMScripts
Description
Plays the sound specified in the FileName parameter. FileName should be a fully-qualified wave file (*.WAV).
For intraday trading systems that hold stop and/or limit exit signals open for multiplebars, you may not want to hear an audible Alert for each new bar. Below, wedemonstrate how to play a sound for the entry signal and once only for the bracketed-order exit signal(s).
Example
{ Be sure to turn off 'Alert Triggered from ChartScript Window' inTools|Options|Sounds }var Bar, p: integer;var EntryPrice: float;const EntrySound = 'C:\Program Files\Wealth-Lab, Inc\Wealth-Lab Developer
3.0\Alert4.wav';const ExitSound = 'C:\Program Files\Wealth-Lab, Inc\Wealth-Lab Developer
3.0\Alert1.wav';
PlotStops;for Bar := 20 to BarCount - 1 dobegin if LastPositionActive then begin p := LastPosition; EntryPrice := PositionEntryPrice( p );
{ Sound exit alert only if the first bar after entry is the last bar inthe chart }
if Bar = BarCount - 1 then if Bar - PositionEntryBar( p ) = 0 then PlaySound( ExitSound );
if not SellAtStop( Bar + 1, EntryPrice * 0.95, p, '5% StopLoss' )then SellAtLimit( Bar + 1, EntryPrice * 1.08, p, '8% ProfitTarget' ) end else if TurnUp( Bar, SMASeries( #Close, 20 ) ) then begin

System Functions 184
© 2003-2006 FMR Corp. All rights reserved.
BuyAtMarket( Bar + 1, '' ); if Bar = BarCount - 1 then // Sound entry alert PlaySound( EntrySound ); end;end;
15.17 Print
Print( Value: string );
RChartScripts RSimuScripts XPerfScripts XCMScripts
Description
Prints the specified string Value into the Debug window.
Remarks
• All messages are printed to the Debug window upon completion of script processing.Use PrintFlush to immediately force debug strings to appear in the Debug window.
• The Debug window is cleared at the end of ChartScript processing prior to printingmessages from the queue. Consequently, the window displays only the results fromthe most recent ChartScript run.
Example
{ Print the bars where there were SMA crossovers }if CrossOver( Bar, SMASeries( #Close, 20 ), SMASeries( #Close, 60 ) )then Print( IntToStr( Bar ) );
15.18 PrintFlush
PrintFlush;
RChartScripts RSimuScripts XPerfScripts XCMScripts
Description
Causes any debug strings that have been issued via Print to be immediately displayed inthe Debug window, View|Debug Window (Ctrl+Alt+D). Normally, the debug stringsare visible only after the ChartScript run completes.
Remarks
• Repetitive use of PrintFlush can increase a ChartScript's execution time significantly.
15.19 PrintStatus
PrintStatus( Value: string );
RChartScripts RSimuScripts XPerfScripts XCMScripts

WealthScript Function Reference, Wealth-Lab Pro™185
© 2003-2006 FMR Corp. All rights reserved.
Description
Causes the specified string to be immediately displayed in the lower-left status bar ofWealth-Lab Pro.
Remarks
• View | Status Bar must be selected from the main menu for the Status Bar to bevisible (default).
Example
var SSYM: string;var WL, BAR: integer;
for WL := 0 to WatchListCount -1 dobegin sSym := WatchListSymbol( WL ); PrintStatus( 'Now Processing ' + sSym ); SetPrimarySeries( sSym ); for Bar := 20 to BarCount - 1 do begin { ... more statements ... } end;end;
15.20 RunProgram
RunProgram( ProgramName: string; Wait: boolean );
RChartScripts RSimuScripts RPerfScripts XCMScripts
Description
Executes the specified program, ProgramName. If the Wait parameter is true, the scriptresumes executing only after the program terminates. Otherwise the script continuesexecuting immediately after the program is launched.
Example
ShowMessage( 'About to launch Notepad ...' );RunProgram( 'Notepad.exe', true );ShowMessage( 'Notepad Closed!' );
15.21 SaveChartImage
SaveChartImage( FileName: string; Width: integer; Height: integer; ImageType: string );
RChartScripts XSimuScripts XPerfScripts XCMScripts
Description
Saves the current chart image to either a Bitmap or a GIF file. Specify the file name inthe first parameter, FileName. Specify how large the resulting image should be bysupplying values to the Width and Height parameters. The last parameter, ImageType,should contain either 'BMP' or 'GIF' which specifies which image format to save the chart.

System Functions 186
© 2003-2006 FMR Corp. All rights reserved.
Remarks
• Available from the ChartScript window only.
• Works for Real-Time ChartScript windows as well as for static data.
Saving Multiple Chart Images
The script below demonstrates how you can perform a batch job in WealthScript usingthe WL3 COM Automation object ExecuteScript method. Open a new ChartScriptWindow (Ctrl+N) and then copy, and paste the code into the Editor. When you click on asymbol, the ChartScript specified in the ScriptName constant will be executed for eachsymbol in the WatchList. Consequently, by placing SaveChartImage in the ScriptNamescript ('Glitch Index' here), a chart image will be saved for each symbol. The name of theresulting file should be variable by symbol so that the same file is not continuouslyoverwritten.
{$NO_AUTO_EXECUTE}const ScriptName = 'Glitch Index';var obj: COMVariant;var w: integer;var sym, WatchList: string;
WatchList := WatchListName;obj := CreateOleObject( 'WealthLab.WL3' );for w := 0 to WatchListCount - 1 dobegin sym := WatchListSymbol( w ); obj.ExecuteScript( ScriptName, WatchListName, sym );end;
Example
{ Use 'as is' or paste at the bottom of any script to employ the batchmethod above }var str: string = GetSymbol + '_' + IntToStr( GetDate( BarCount - 1 ) ) +'_' + GetScriptName;
{ Note! The folder specified here must exist }SaveChartImage('C:\Data\Images\' + str + '.GIF', 600, 400, 'GIF' );
15.22 SetGlobal
SetGlobal( VariableName: string; Value: variant );
RChartScripts RSimuScripts XPerfScripts RCMScripts
Description
Allows you to store a variable, VariableName, and its Value in Wealth-Lab's globalstorage area. Use GetGlobal to retrieve the Value of the global variable assigned bySetGlobal.
Remarks
• Variables stored in the global storage area retain their values indefinitely, evenbetween script calls.
WealthScript Function Reference, Wealth-Lab Pro™187
© 2003-2006 FMR Corp. All rights reserved.
• The name of the variable is specified in the VariableName parameter. If the variablealready exists in the global storage area it will be overwritten.
• Specify the value in the Value parameter. Since the Value parameter is of typeVariant, you can store values of any type (integer, string, float or boolean) in theglobal storage area.
Example
{ Store the BarCount by symbol }var s: string;s := GetSymbol + 'BarCount';SetGlobal( s, BarCount );
15.23 SetOptimizeValue
SetOptimizeValue( OptValue : float );
RChartScripts XSimuScripts XPerfScripts XCMScripts
Description
SetOptimizeValue accepts a single parameter, OptValue, which is used as the "UserDefined" optimization metric. Typically, following the trading loop, you will cycle throughthe Positions to calculate some sort of trading metric and pass it as the OptValueparameter. This calculated value is added to the Optimization Results tabulations andgraphs for both Exhaustive and Monte Carlo techniques, and, when running MCoptimizations you may choose User Defined as the optimization target.
In the example we demonstrate a simple long-only, weighted-moving average crossoversystem with an 8% stop loss. The script is ready to optimize over the slow and fastperiods of the moving average, and at the end, it calculates the average number of daysin a trade for the User Defined metric.
Note: To see the optimization results, you must save this script and then Open theChartScript for Optimization, Ctrl+T. Then from the Optimization view, selecteither Exhaustive or Monte Carlo methods. If Monte Carlo, you can furtherchoose User Defined as the Optimization Metric, or target. Finally, click Beginto start the optimization process.
Remarks
• If a WatchList having more than one security is selected for a Portfolio $imulationMode optimization (Portfolio $imulation Mode checked in the Optimization Controlframe), the User-Defined value will be displayed as an average value.
Example
{#OptVar1 24;20;32;4}{#OptVar2 14;10;18;2}var Bar: integer;var SlowPer, FastPer, SlowMA, FastMA: integer;
SlowPer := #OptVar1;FastPer := #OptVar2;SlowMA := WMASeries( #Close, SlowPer );FastMA := WMASeries( #Close, FastPer );

System Functions 188
© 2003-2006 FMR Corp. All rights reserved.
InstallStopLoss( 8 );PlotStops;for Bar := SlowPer to BarCount - 1 dobegin ApplyAutoStops( Bar ); if not LastPositionActive then begin if CrossOver( Bar, FastMA, SlowMA ) then BuyAtMarket( Bar + 1, 'CrossedOver' ); end else if CrossUnder( Bar, FastMA, SlowMA ) then SellAtMarket( Bar + 1, LastPosition, 'CrossedUnder' );end;
{ Calculate Avg Days in Trade as User Defined optimization metric }var p, TotalDays: integer;for p := 0 to PositionCount - 1 do TotalDays := TotalDays + PositionExitBar( p ) - PositionEntryBar( p );
if PositionCount = 0 then SetOptimizeValue( 0.0 )else SetOptimizeValue( TotalDays / PositionCount );
15.24 SetPeakTroughMode
SetPeakTroughMode( Mode: integer );
RChartScripts XSimuScripts XPerfScripts XCMScripts
Description
Specifies the way the Peak/Trough functions calculate a reversal amount. You can basePeak/Trough calculations on a percentage reversal, or a raw value "point" reversal. TheMode parameter can be one of the following constants:
#AsPercent - Peak/Trough reversals are expressed as percentages (default behavior)#AsPoint - Peak/Trough reversals values are calculated based on raw value, i.e.
points
For example, imagine you are calculating Peak/Troughs based on a reversal of 10. Inpercentage mode, the underlying Price Series has to move 10 percent higher than thelowest point in order for a Trough the be recorded. Likewise, prices must move 10percent lower than a recent high for a Peak to be recorded. If you change thePeak/Trough mode to #AsPoint the the underlying Price Series must move up or down 10points rather than 10 percent.
Remarks
The #AsPoint mode is especially useful when calculating Peak/Troughs based on PriceSeries that can have zero and negative values. Percentage Peak/Trough reversals cannotbe calculated on such Price Series.

WealthScript Function Reference, Wealth-Lab Pro™189
© 2003-2006 FMR Corp. All rights reserved.
Example
{ Draw Peaks/Troughs of an indicator that can enter the negative range }var P, T: float;var REV, INDICATOR, PANE, PB_, PB, TB: integer;Rev := 5;Indicator := CMOSeries( #Close, 20 );Pane := CreatePane( 150, true, true );PlotSeries( Indicator, Pane, #Blue, #Thick );PB_ := 0;SetPeakTroughMode( #AsPoint );PB := PeakBar( BarCount - 1, Indicator, Rev );P := Peak( BarCount - 1, Indicator, Rev );while ( PB <> PB_ ) and ( PB > 0 ) dobegin TB := TroughBar( PB, Indicator, Rev ); T := Trough( PB, Indicator, Rev ); DrawLine( PB, P, TB, T, Pane, #Red, #Thick ); PB_ := PB; PB := PeakBar( TB, Indicator, Rev ); P := Peak( TB, Indicator, Rev ); DrawLine( PB, P, TB, T, Pane, #Red, #Thick );end;
15.25 ShowMessage
ShowMessage( Message: string );
RChartScripts RSimuScripts RPerfScripts XCMScripts
Description
Displays the specified Message in a dialog box. The ChartScript flow of execution issuspended until the user clicks on the dialog.
Example
if PositionProfit( LastPosition ) < 1000 thenbegin ShowMessage( 'Time to Throw in the Towel!' ); Abort;end;
15.26 Sleep
Sleep( Milliseconds: integer );
RChartScripts XSimuScripts XPerfScripts XCMScripts
Description
Causes the script to pause processing for the specified number of Milliseconds. You canabort a script that's sleeping by pressing the Esc key, or selecting Chart|StopExecution from the main menu.
Note: The Sleep function is not compatible with ChartScript Integrated Debugger.

System Functions 190
© 2003-2006 FMR Corp. All rights reserved.
Example
Sleep( 2000 );
15.27 UseUpdatedEMA
UseUpdatedEMA( Use: boolean );
RChartScripts RSimuScripts RPerfScripts XCMScripts
Description
This function controls which exponent formula is used when computing an EMA(Exponential Moving Average). By default, Wealth-Lab uses the following formula tocalculate the exponent:
( 1 / Periods ) * 2
Another common method of calculating the Exponent is:
2 / ( 1 + Periods )
Passing true as the Use parameter to UseUpdatedEMA will cause Wealth-Lab to use thesecond form when computing EMA's. This also affects native indicators that are based onEMA, such as CADO, DSS, TRIX, MACD, Volatility, etc.
Remarks
• EMA-based native indicators having the same parameters, e.g., EMASeries( #Close,
100) and EMASeries( #Close, 100), will utilize the UseUpdatedEMA setting that is
active at the time of the first reference to the indicator only. If you require bothsettings for the same EMA series, see the example for a solution.
• You can set the default preference for the EMA exponent calculation in the OptionsDialog (F12)|Indicator Calculations. UseUpdatedEMA overrides the defaultsetting.
Example
{ This script shows the difference between the 2 EMA exponent forms }var EMASER, COPIED, EMASER2: integer;UseUpdatedEMA( false );EMASer := EMASeries( #Close, 12 );Copied := AddSeriesValue( #Close, 0 );UseUpdatedEMA( true );EMASer2 := EMASeries( Copied, 12 );PlotSeries( EMASer, 0, #Red, #Thin );PlotSeries( EMASer2, 0, #Blue, #Thin );
15.28 WatchListAddSymbol
WatchListAddSymbol( Name: string; DSName: string; Symbol: string );
RChartScripts XSimuScripts XPerfScripts XCMScripts

WealthScript Function Reference, Wealth-Lab Pro™191
© 2003-2006 FMR Corp. All rights reserved.
Description
Adds the specified Symbol to the WatchList specified in the Name parameter. TheDSName parameter is optional. If provided, it should contain the name of theDataSource that contains the Symbol being added. If left blank, the value defaults to theDataSource of the symbol that was clicked to execute the script.
Remarks
• Available from the ChartScript window only.
• The Symbol will not be added to the WatchList if it already exists - even if it was froma different DataSource.
• WatchListAddSymbol creates the WatchList specified in the Name parameter if itdoes not already exist.
Example
{ Create a WatchList of the 5 most oversold symbols }var w: integer;var lst: TList;var sym: string;var x: float;
lst := TList.Create;WatchListClear( 'Oversold' );
for w := 0 to WatchListCount - 1 dobegin sym := WatchListSymbol( w ); SetPrimarySeries( sym ); x := RSI( BarCount - 1, #Close, 20 ); lst.AddData( x, sym );end;
lst.SortNumeric;for w := 0 to 4 dobegin sym := lst.Data( w ); WatchListAddSymbol( 'Oversold', '', sym );end;
15.29 WatchListClear
WatchListClear( Name: string );
RChartScripts XSimuScripts XPerfScripts XCMScripts
Description
Clears all of the symbols in the WatchList specified in the Name parameter.
Remarks
• Available from the ChartScript window only.
• The Name string is not case sensitive.

System Functions 192
© 2003-2006 FMR Corp. All rights reserved.
Example
{ Create a WatchList of all symbols where price is above 200 day moving average }var Bar, w: integer;var sym: string;WatchListClear( 'Above 200 Day SMA' );for w := 0 to WatchListCount - 1 dobegin sym := WatchListSymbol( w ); SetPrimarySeries( sym ); Bar := BarCount - 1; if PriceClose( Bar ) > SMA( Bar, #Close, 200 ) then WatchListAddSymbol( 'Above 200 Day SMA', '', sym );end;
15.30 WatchListCount
WatchListCount: integer;
RChartScripts XSimuScripts XPerfScripts XCMScripts
Description
Returns the number of symbols available in the currently selected WatchList.
Remarks
• Not compatible with real-time ChartScript mode.
• WatchList functions are generally intended for use in the ChartScript Window only.
Exceptions:
1. WatchListCount cannot be used with SetPrimarySeries in the $imulator if youcreate trades before calling RestorePrimarySeries. This will cause the $imulatorto stop processing after the first symbol. A ChartScript that does not trade onsecondary symbols can call WatchListCount to create an index indicator, forexample.
2. If the ChartScript does create trades on secondary symbols, you can force End-of-day Scans to complete an entire scan by selecting "Allow Complete Scans of Multi-Symbol Scripts".
Example
{ Create an analysis file for all symbols in the WatchList. Output the RSI level and net gain after 20 bars }var n, f, Bar: integer;var val, change: float;f := FileCreate( 'WatchList RSI Analysis.csv' );for n := 0 to WatchListCount - 1 dobegin SetPrimarySeries( WatchListSymbol( n ) ); Bar := 20; while Bar < BarCount - 20 do begin val := RSI( Bar, #Close, 20 ); change := PriceClose( Bar + 20 ) - PriceClose( Bar );
WealthScript Function Reference, Wealth-Lab Pro™193
© 2003-2006 FMR Corp. All rights reserved.
change := ( change / PriceClose( Bar ) ) * 100; FileWrite( f, GetSymbol + ',' + IntToStr( Bar ) + ',' + FloatToStr( val ) + ',' + FloatToStr( change ) ); Bar := Bar + 20; end;end;
15.31 WatchListDelete
WatchListDelete( Name: string );
RChartScripts XSimuScripts XPerfScripts XCMScripts
Description
Deletes the WatchList specified by the Name parameter completely. The Name string isnot case sensitive.
Remarks
• After running a ChartScript that contains WatchListDelete, to see the result in thesame ChartScript window you must refresh the DataSource tree by right clicking withinit and selecting Refresh.
• If the specified WatchList does not exist, no action is taken and the statement isexecuted without error.
• WatchListDelete will not delete an actual DataSource. However, after passing aDataSource Name, it will appear to be deleted after refreshing the DataSource tree inthe ChartScript window. This is because Wealth-Lab creates a mirrored WatchList foreach DataSource. You can recover such WatchLists by simply restarting Wealth-Lab.
Example
{ Delete the WatchList created by the WatchListAddSymbol example }WatchListDelete('Oversold');
15.32 WatchListName
WatchListName: string;
RChartScripts RSimuScripts XPerfScripts XCMScripts
Description
Returns WatchList name containing the symbol that was clicked to execute the script.
Example
DrawLabel( 'The WatchList is: ' + WatchListName, 0 );
15.33 WatchListRemoveSymbol
WatchListRemoveSymbol( Name: string; Symbol: string );
RChartScripts XSimuScripts XPerfScripts XCMScripts
System Functions 194
© 2003-2006 FMR Corp. All rights reserved.
Description
Removes the specified Symbol from the WatchList specified by the Name parameter.
Remarks
• Available from the ChartScript window only.
15.34 WatchListSelect
WatchListSelect( WatchList: string );
RChartScripts XSimuScripts XPerfScripts XCMScripts
Description
Executes the ChartScript on the specified WatchList. If the ChartScript is currently beingexecuted on a symbol in a WatchList different from the one specified in the WatchListparameter, this function aborts the script processing, selects the first symbol in thespecified WatchList tree folder, and re-executes the script on this symbol. If the script isalready being executed on a symbol within the selected WatchList, processing continuesnormally.
Remarks
• Available from the ChartScript window only.
• Not compatible with real-time ChartScript mode.
Example
{ Make sure the script executes in a specific Intraday WatchList }WatchListSelect( 'QCharts 15 Minute' );
15.35 WatchListSymbol
WatchListSymbol( n: integer ): string;
RChartScripts XSimuScripts XPerfScripts XCMScripts
Description
Returns the specified symbol from the currently selected WatchList. You can use thisfunction, combined with WatchListCount, to write ChartScripts that act on all of thesymbols in a WatchList.
Remarks
• Not compatible with real-time ChartScript mode.
• WatchList functions are generally intended for use in the ChartScript Window only.
Exceptions:
1. WatchListSymbol cannot be used with SetPrimarySeries in the $imulator if youcreate trades before calling RestorePrimarySeries. This will cause the $imulatorto stop processing after the first symbol.
2. If the ChartScript does create trades on secondary symbols, you can force End-of-

WealthScript Function Reference, Wealth-Lab Pro™195
© 2003-2006 FMR Corp. All rights reserved.
day Scans to complete an entire scan by selecting "Allow Complete Scans of Multi-Symbol Scripts".
Example
{ The following script executes for each symbol in the WatchList }var n: integer;for n := 0 to WatchListCount - 1 dobegin SetPrimarySeries( WatchListSymbol( n ) ); { ... }end;

Technical Indicator Functions 196
© 2003-2006 FMR Corp. All rights reserved.
16 Technical Indicator Functions
16.1 Overview
Technical Indicators make technical analysis possible. The indicators found in thisreference are native to WealthScript, but by no means include all of the indicatorsavailable to Wealth-Lab users! You have the ability to create your own CustomIndicators, and many such indicators are uploaded by Wealth-Lab users every week.These will be downloaded directly to your Studies folder when you perform theCommunity|Download ChartScripts action.
To use either native or custom indicators in your ChartScripts, you can use the QuickPlotutility by dragging and dropping them right from the main Indicators tool bar. You canalso use the Include Manager, Tools|Include Manager (F6), to make a reference to acustom indicator yourself, although Quickplot adds these references automatically.
Indicators have two syntax forms. The first form returns the value of the indicator at aspecific Bar number, and the second syntax form returns an integer handle reference tothe indicator's entire Price Series. See Working with Technical Indicator Functions in theWealthScript Guide.
16.2 AccumDist
AccumDist( Bar: integer ): float;AccumDistSeries: integer;
RChartScripts RSimuScripts XPerfScripts XCMScripts
Description
Accumulation/Distribution (created by L. Williams) uses the closing price's proximity tothe high or low to determine if accumulation or distribution is occurring in the market.The proximity value is multiplied by volume to give more weight to moves with highervolume.
You can often spot divergences between price action and the AccumDist indicator. Forexample, if prices make a new high but the move is not accompanied by sufficientvolume, AccumDist will fail to make a new high. Divergences can be a sign the trend isnearing completion.
Interpretation

WealthScript Function Reference, Wealth-Lab Pro™197
© 2003-2006 FMR Corp. All rights reserved.
The actual value of the AccumDist is unimportant, concentrate on its direction.
• When both price and AccumDist are making higher peaks and higher troughs, the uptrend is likely to continue.
• When both price and AccumDist are making lower peaks and lower troughs, the downtrend is likely to continue.
• When price continues to make higher peaks and AccumDist fails to make higher peak,the up trend is likely to stall or fail.
• When price continues to make lower troughs and AccumDist fails to make lowertroughs, the down trend is likely to stall or fail.
• If during a trading range, the AccumDist is rising then accumulation may be takingplace and is a warning of an upward break out.
• If during a trading range, the AccumDist is falling then distribution may be takingplace and is a warning of an downward break out.
Calculation
AccumDist = (((Close-Low) - (High-Close)/(High-Low)) x Volume) + II = yesterday's AccumDist value
Example
{ Look for a diverging slope of AccumDist and price }var BAR: integer;for Bar := 10 to BarCount - 1 dobegin if AccumDist( Bar ) > AccumDist( Bar - 10 ) then if PriceClose( Bar ) < PriceClose( Bar - 10 ) then SetBarColor( Bar, #Red );end;var AccumDistPane: integer;AccumDistPane := CreatePane( 100, false, true );PlotSeries( AccumDistSeries, AccumDistPane, 202, #Thick );DrawLabel( 'AccumDist', AccumDistPane );
16.3 ADX
ADX( Bar: integer; Period: integer ): float;ADXSeries( Period: integer ): integer;
RChartScripts RSimuScripts XPerfScripts XCMScripts
Description
ADX stands for Average Directional movement Index and is used to measure the overallstrength of the trend. The ADX indicator is an average of DX values, see DX. The ADX isa component of the Directional Movement System developed by Welles Wilder. Thissystem attempts to measure the strength of price movement in positive and negativedirection using the DIPlus and DIMinus indicators along with the ADX.
Technical Indicator Functions 198
© 2003-2006 FMR Corp. All rights reserved.
Interpretation
• The ADX is an excellent indicator for showing trend strength. The larger its value thestronger the current trend. A value above 25 is considered to be a trending market.
• When the ADX turns down from high values, then the trend maybe ending. It mightbe a good time to start closing open positions.
• If the ADX is declining, then the market is becoming less directional, the current trendis weakening. You should not be trading a trend system.
• When the ADX stays at a low value, the market is considered to be flat or dull. Thelonger the ADX stays at a low value the more likely a strong trending move will occur.
• If after staying low for a lengthy time, the ADX rises by 4 or 5 units, (for example,from 15 to 20), it gives a strong signal to trade the current trend.
• If the ADX is rising then the market is showing a strengthening trend. The value ofthe ADX is proportional to the slope of the trend. The slope of the ADX line isproportional to the acceleration of the price movement (changing trend slope). If thetrend is a constant slope then the ADX value tends to flatten out.
Calculation
ADX is equivalent to the Wilder's moving average (see WilderMA) of the directionmovement (DX) over the specified Period.
Example
{ Use ADX to determine how much prices are trending, color barsaccordingly }var BAR, n: integer;var x: float;for Bar := 20 to BarCount - 1 dobegin x := ADX( Bar, 20 ); n := Round( x / 5 ); SetBarColor( Bar, n * 100 );end;
16.4 ADXR
ADXR( Bar: integer; Period: integer ): float;ADXRSeries( Period: integer ): integer;
RChartScripts RSimuScripts XPerfScripts XCMScripts
Description
ADXR stands for Average Directional Movement Index Rating, and is a component of theDirectional Movement System developed by Welles Wilder. This system attempts tomeasure the strength of price movement in positive and negative directions, as well asthe overall strength of the trend. The ADXR component is simply a special type of movingaverage (WilderMA) applied to the ADX indicator.
The ADXR can be used to determine if price movement is sufficiently directional to beworth trading. In other words, use the ADXR as a filter to trade with trend following

WealthScript Function Reference, Wealth-Lab Pro™199
© 2003-2006 FMR Corp. All rights reserved.
tools.
Interpretation
· ADXR is sometimes used as a signal line. A buy signal occurs when ADX crossesabove ADXR, and a sell occurs when ADX crosses below ADXR.
· Welles Wilder's rule is to use trend follow systems when ADXR is above 25 and whenADXR drops below 20 then do not use a trend following system.
· ADXR behaves like an Averaged ADX. See ADX. The ADXR is a lagging indicator andwill give signals after the ADX.
· The ADXR can be used in place of the ADX in the Directional Movement system. Itresults in more conservative trading signals.
Calculation
ADXR = ( ADX(today) + ADX(n days ago) ) / 2
Example
{ Flag ADX/ADXR CrossOvers }var BAR: integer;for Bar := 20 to BarCount - 1 do if CrossOver( Bar, ADXSeries( 14 ), ADXRSeries( 14 ) ) then SetBackgroundColor( Bar, #RedBkg );
16.5 AroonDown
AroonDown( Bar: integer; Series: integer; Period: integer ): float;AroonDownSeries( Series: integer; Period: integer ): integer;
RChartScripts RSimuScripts RPerfScripts XCMScripts
Description
The Aroon indicator developed by Tushar Chande, indicates if a price is trending or inrange trading. It can also reveal the beginning of a new trend, its strength and alsoallows you to anticipate changes from trading ranges to trends. AroonDown and theAroonUp indicators are used together and combined are called the Aroon indicator.
AroonUp measures how long it has been since prices have recorded a new high within thespecified period. If the current price is higher then the user defined number of periodsbefore it, then the AroonUp value is %100. In other words, it's a new high for that period.If a new low occurred during the period then AroonDown will be zero. Otherwise it returnsa percent valve indicating the time since the new high occurred.
AroonDown measures how long it has been since prices have recorded a new low withinthe specified period. If the current price is lower then the user defined number of periodsbefore it, then the AroonDown value is %100. In other words, it's a new low for thatperiod. If a new high occurred during the period then AroonDown will be zero. Otherwiseit returns a percent valve indicating the time since the new low occurred.
Another indicator, the Aroon Oscillator, can be constructed by subtracting AroonDownfrom AroonUp.
Technical Indicator Functions 200
© 2003-2006 FMR Corp. All rights reserved.
Interpretation
Weakness in the market is indicated when AroonDown remains between 0 and 30 for anextended period of time. If AroonDown and AroonUp follow similar movement patterns,this is a sign of consolidation. Finally, AroonDown crossing below AroonUp is considered abearish sign.
· When AroonUp is at 100, a new uptrend may have begun. If it remains persistentlybetween 70 and 100, and the AroonDown remain between 0 and 30, then a newuptrend is underway. If AroonUp dips below 50 then the trend as lost momentum.
· When AroonDown is at 100, a new downtrend may have begun. If it remainspersistently between 70 and 100, and the AroonUp remain between 0 and 30, then anew downtrend is underway. If AroonDown dips below 50 then the trend as lostmomentum.
· Trading ranges and consolidation. When AroonUp and AroonDown move in parallel(horizontal, sloping up or down) with each other at roughly the same level, then priceis range trading or consolidating.
· New Trend, if the AroonUp crosses above the AroonDown, then a new uptrend maysoon start. Conversely, if AroonDown crosses above the AroonUp, then a newdowntrend may soon start.
Calculation
AroonUp:100 * ( n - ( Num. of bars since highest high in the last n periods ) )/n
AroonDown:100 * ( n - ( Num. of bars since lowest low in the last n periods ) )/ n
n = number of periods or bars
Example
{ Flag Bearish Aroon Crossovers }var Bar: integer;for Bar := 20 to BarCount - 1 dobegin if CrossUnder( Bar, AroonDownSeries( #Close, 20 ), AroonUpSeries( #Close, 20 ) ) then SetBarColor( Bar, #Red );end;
16.6 AroonUp
AroonUp( Bar: integer; Series: integer; Period: integer ): float;AroonUpSeries( Series: integer; Period: integer ): integer;
RChartScripts RSimuScripts RPerfScripts XCMScripts
Description
See AroonDown 199

WealthScript Function Reference, Wealth-Lab Pro™201
© 2003-2006 FMR Corp. All rights reserved.
Example
{ Flag Bullish Aroon Crossovers }var Bar: integer;for Bar := 20 to BarCount - 1 dobegin if CrossOver( Bar, AroonDownSeries( #Close, 20 ), AroonUpSeries( #Close, 20 ) ) then SetBarColor( Bar, #Lime );end;
16.7 ATR
ATR( Bar: integer; Period: integer ): float;ATRSeries( Period: integer ): integer;
RChartScripts RSimuScripts XPerfScripts XCMScripts
Description
The Average True Range is the average of the true ranges over the specified Period.WealthScript uses the moving average as formulated by Welles Wilder, the indicator'sinventor (see WilderMA and TrueRange). The ATR is a measure of volatility and it takesinto account any gaps in the price movement. Typically the ATR calculation is based on14 periods, this can be intraday, daily, weekly or monthly. To measure recent volatilityuse a shorter average, 2 to 10 periods. For longer term volatility use 20 to 50 periods.
Interpretation
• An expanding ATR indicates increased volatility in the market. The range of each bar isgetting larger. ATR often peaks at major tops and bottoms. High ATR values usuallyresult from a sharp advance or decline and are unlikely to be sustained for extendedperiods.
• A low average true range value indicates a series of periods with small ranges (quietdays). These low ATR values are often found during extended sideways price action,thus lower volatility. A prolonged period of low ATR values may indicate aconsolidation area and the beginning of a continuation move or reversal.
• ATR is very useful for stops or entry triggers, as it allows for changes in volatility.Whereas fixed dollar, points or percentage stops will not allow for volatility. The ATRstop will adapt to sharp price moves or consolidation areas, and trigger on anabnormal price movement in either area. Use a multiple of ATR, such as 1.5 x ATR(5period) to catch these abnormal price moves.
Calculation
Average True Range is calculated by applying Wilder's Moving Average to True Rangeover the period specified , see WilderMA indicator for more information:
ATR = ( Previous ATR * ( n - 1 ) + TR ) / n
where,
ATR = Average True Rangen = number of periods or bars

Technical Indicator Functions 202
© 2003-2006 FMR Corp. All rights reserved.
TR = True Range, (see TrueRange indicator)
Example
{ Plot ATRs in decreasing length if increasing blue intensity }var i, ATRPane: integer;ATRPane := CreatePane( 100, TRUE, TRUE );for i := 1 to 9 do PlotSeries( ATRSeries( i * 2 ), ATRPane, 10 - i, #Thin );DrawText( 'ATR from 2 to 18', ATRPane, 4, 4, 006, 8 );
16.8 ATRP
ATRP( Bar: integer; Period: integer ): float;ATRPSeries( Period: integer ): integer;
RChartScripts RSimuScripts XPerfScripts XCMScripts
Description
ATRP expresses the Average True Range, or ATR, as a percentage of the closing price ofthe specified Bar. ATRP provides a good picture of current volatility.
Calculation
ATRP( Bar, Period ) = 100 * ATR( Bar, Period ) / PriceClose( Bar )
where,
ATR = Average True Range (see indicator)
Example
{ Short when price hits the High of the previous bar * (1 + ATRP/100 ) Cover on trailing stop of the same series }var Bar, hATRP, hATRP_H, p: integer;
{ Convert to fractional percentage, e.g., 3.5% -> 0.035 }hATRP := DivideSeriesValue( ATRPSeries( 5 ), 100 );hATRP := AddSeriesValue( hATRP, 1.0 );hATRP_H := MultiplySeries( #High, hATRP );
{ Delay indicator plot by 1 bar to observe crossovers }PlotSeriesLabel( OffsetSeries( hATRP_H, -1), 0, #Blue, #Dotted, 'ATRP_H +2%' );PlotStops;
for Bar := 5 to BarCount - 1 dobegin if LastPositionActive then begin p := LastPosition; CoverAtTrailingStop( Bar + 1, @hATRP_H[Bar], p, '' ) end else ShortAtLimit( Bar + 1, @hATRP_H[Bar], '' );end;

WealthScript Function Reference, Wealth-Lab Pro™203
© 2003-2006 FMR Corp. All rights reserved.
16.9 BBandLower
BBandLower( Bar: integer; Series: integer; Period: integer; StdDev: float ): float;BBandLowerSeries( Series: integer; Period: integer; StdDev: float ): integer;
RChartScripts RSimuScripts RPerfScripts XCMScripts
Description
Bollinger Bands are a type of price envelope developed by John Bollinger. Bollinger Bandsare envelopes that are plotted at a standard deviation level above and below a simplemoving average of the price. Because the distance of the bands is based on standarddeviation, they adjust to volatility swings in the underlying price.
Bollinger Bands accept 2 parameters, Period and Standard Deviations, StdDev. Therecommended values are 20 for period, and 2 for standard deviations, although othercombinations offer effective results as well.
Bollinger bands help determine whether prices are high or low on a relative basis. Theyare used in pairs, both upper and lower bands and in conjunction with a moving average.Further, the pair of bands are not intended to be used on their own. Use them to confirmsignals given with other indicators. For example, RSI and Bollinger bands are a goodcombination.
Interpretation
• When the bands tighten as volatility decreases, expect a sharp move in price. Thismay begin a trending move. Watch out for a false move in opposite direction whichreverses before the proper trend begins.
• When the bands separated by an unusual large amount, volatility increases and anytrend that may be in place may be ending.
• Prices normally have a tendency to bounce within the bands envelope, touching oneband then moving to the other band. You can use this for profit targets. For example,if prices bounces of the lower band then cross above the moving average the upperband then becomes the profit target.
• Price can exceed or hug a band envelope for prolonged periods during strong trends.On divergence with a momentum oscillator you should consider taking profits.
• A strong trend continuation can be expected when the price moves out of the bands.However if prices move immediately back inside the band, then the suggested strengthis negated.
Calculation
First calculate and plot a simple moving average. Calculate the standard deviation usingthe same data used in the simple moving average. For the upper band, add the standarddeviation to the moving average, for lower band, subtract the standard deviation fromthe moving average.
Typical values used:
Short term: 10 day moving average, bands at 1.5 standard deviations.Medium term: 20 day moving average, bands at 2 standard deviations.

Technical Indicator Functions 204
© 2003-2006 FMR Corp. All rights reserved.
Long term: 50 day moving average, bands at 2.5 standard deviations.
Example
{ Flag bars that have penetrated the lower BBand }var Bar: integer;PlotSeries( BBandLowerSeries( #Close, 10, 1.50 ), 0, 205, #Thick );for Bar := 10 to BarCount - 1 do if PriceLow( Bar ) < BBandLower( Bar, #Close, 10, 1.50 ) then SetBarColor( Bar, #Red );
16.10 BBandUpper
BBandUpper( Bar: integer; Series: integer; Period: integer; StdDev: float ): float;BBandUpperSeries( Series: integer; Period: integer; StdDev: float ): integer;
RChartScripts RSimuScripts RPerfScripts XCMScripts
Description
See BBandLower
Example
{ Flag bars that have penetrated the upper BBand }var Bar: integer;PlotSeries( BBandUpperSeries( #Close, 10, 1.50 ), 0, 205, #Thick );for Bar := 10 to BarCount - 1 do if PriceHigh( Bar ) > BBandUpper( Bar, #Close, 10, 1.50 ) then SetBarColor( Bar, 050 );
16.11 BOP
BOP( Bar: integer ): float;BOPSeries: integer;
RChartScripts RSimuScripts XPerfScripts XCMScripts
Description
Balance of Power, created by Igor Livshin, is an indicator that captures the struggles ofbulls vs. bears throughout the trading day. It assigns scores to both bulls and bearsbased on how much they were able to move prices throughout the trading day.
Interpretation
· Balance of Power is normally smoothed with a moving average. Livshin recommendsa 14 bar simple moving average, but different periods and moving average types canbe used for different markets.
· During Bull markets, the indicator's tops usually cluster around the upper level of therange. This is reversed during Bear markets.
· You can look for divergences between the indicator and the underlying price to spotpotential trend reversals.
203

WealthScript Function Reference, Wealth-Lab Pro™205
© 2003-2006 FMR Corp. All rights reserved.
Calculation
Balance of Power is the result of the following simple formula:
BOP = (C - O)/(H - L)
where,
C = Close, O = Open, H = High and L = Low
Example
{ Plot a smoothed Balance of Power below Volume }var BOPSmoothed, BOPPane: integer;BOPSmoothed := SMASeries( BOPSeries, 20 );BOPPane := CreatePane( 80, false, true );PlotSeries( BOPSmoothed, BOPPane, 642, #Thick );
16.12 CADO
CADO( Bar: integer ): float;CADOSeries: integer;
RChartScripts RSimuScripts XPerfScripts XCMScripts
Description
The Chaikin Oscillator allows us to analyze accumulation and distribution in theconvenient form of an oscillator. The principle behind this oscillator is the nearer theclose is to the high, the more accumulation taken place. Conversely the nearer the closeis to the low, the more distribution is taken place. Further, healthy rallies and declinesare accompanied by increasing volume levels, conversely price tends to decline asvolume dries up. The Chaikin Oscillator allows you to compare price action to volumeflow, to help determine market tops and bottoms.
Interpretation
• The best Chaikin Oscillator sell signal is when price action develops a higher high intooverbought zones and the Chaikin Oscillator diverges with a lower high and begins tofall. Price may remain in overbought zones during strong trends.
• The best Chaikin Oscillator buy signal is when price action develops a lower low intooversold zones and the Chaikin Oscillator diverges with a higher low and begins torise. Price may remain in oversold zones during strong trends.
• You can also use the Chaikin Oscillator to assist entry into existing trends. In this caseyou look for a change of direction of the oscillator for buy or sell signal. For example, ifyou have confirmed strong uptrend and the Chaikin Oscillator turns up from a negativevalue, then buy the dip in price action.
Calculation
The Chaikin Oscillator is created by subtracting a 10-period EMA ofAccumulation/Distribution from a 3-period EMA of Accumulation/Distribution.
CADO = 3 period EMA( AccumDist() ) - 10 period EMA ( AccumDist() )

Technical Indicator Functions 206
© 2003-2006 FMR Corp. All rights reserved.
where,
CADO = Chaikin OscillatorEMA = Exponential Moving AverageAccumDist = Accumulation/Distribution indicator
Note: UseUpdatedEMA affects the calculation of EMA-based indicators such as CADOat runtime. Choose the default method for calculating the EMA exponent in theIndicator Calculations section of the Options dialog.
Example
{ Use RSI to look for divergences between price and CADO }var Bar, Diff, CADOPANE, RSIPANE, RSIPRICE, RSICADO, DiffPane: integer;
CADOPane := CreatePane( 80, true, true );PlotSeries( CADOSeries, CADOPane, 520, #ThickHist );DrawLabel( 'CADO', CADOPane );
RSIPane := CreatePane( 100, true, true );RSIPrice := RSISeries( #Close, 10 );RSICado := RSISeries( CADOSeries, 10 );PlotSeries( RSIPrice, RSIPane, #Teal, #Thin );PlotSeries( RSICado, RSIPane, 520, #Thin );DrawLabel( 'RSI of Price and CADO', RSIPane );
Diff := SubtractSeries( RSIPrice, RSICado );DiffPane := CreatePane( 100, true, true );PlotSeries( Diff, DiffPane, #Gray, #Histogram );
for Bar := 10 to BarCount - 1 dobegin if GetSeriesValue( Bar, Diff ) > 30 then SetBarColor( Bar, #Red ) else if GetSeriesValue( Bar, Diff ) < -30 then SetBarColor( Bar, 050 );end;
16.13 CCI
CCI( Bar: integer; Period: integer ): float;CCISeries( Period: integer ): integer;
RChartScripts RSimuScripts XPerfScripts XCMScripts
Description
The Commodity Channel Index (CCI) developed by Lambert, is designed to identify andtrade cyclical turns in commodities. It assumes the commodity or stock moves in cycles.Lambert recommends using 1/3 of the cycle as the calculation period. The cycle isconsidered an interval of low-to-low or high-to-high. Commodities can cycle around 60days, thus the period would be 20 days. Signals are given when CCI moves into the +100or -100 regions.

WealthScript Function Reference, Wealth-Lab Pro™207
© 2003-2006 FMR Corp. All rights reserved.
Interpretation
• When the CCI moves above +100, then a new strong uptrend is beginning, buy here,close the position on CCI falling below +100. Use trending indicators or other technicalanalysis methods to confirm.
• When the CCI moves below -100, then a new strong downtrend is beginning, sell here,close the position on CCI rising above -100. Use trending indicators or other technicalanalysis methods to confirm.
• If underlying prices make a new high or low that isn't confirmed by the CCI, thisdivergence can signal a price reversal. CSI divergences from price indicates verystrong buy or sell signal.
• Look for oversold levels below -100 and overbought levels above +100. Thesenormally occur before the underlying price chart forms a top or a bottom.
Calculation
The Commodity Channel Index (CCI) is calculated by determining the difference betweenthe mean price of a security and the average of the means over the period chosen. Thisdifference is compared to the average difference over the time period. Comparing thedifferences of the averages allows for the commodities volatility. The result is multipliedby a constant to ensure that most values fall within the standard range of +/- 100.
CCI = ( AveP - SMA_of_AveP ) / ( 0.015 * Mean Deviation )
where,
CCI = Commodity Channel IndexAveP = Average Price = (High + Low + Close) / 3
The 0.015 constant ensures 70 to 80 percent of CCI values fall within the +100 to -100range.
Example
{ Color bars oversold/overbought based on CCI level }var Bar, CCIPane: integer;CCIPane := CreatePane( 80, true, true );PlotSeries( CCISeries( 10 ), CCIPane, 505, #Histogram );DrawLabel( 'CCI(10)', CCIPane );for Bar := 10 to BarCount - 1 dobegin if CCI( Bar, 10 ) > 100 then SetBarColor( Bar, #Red ) else if CCI( Bar, 10 ) < -100 then SetBarColor( Bar, #Green );end;
16.14 CMF
CMF( Bar, Period: integer ): float;CMFSeries( Period: integer ): integer;
RChartScripts RSimuScripts XPerfScripts XCMScripts
Description

Technical Indicator Functions 208
© 2003-2006 FMR Corp. All rights reserved.
Chaikin Money Flow (CMF) is a volume weighted average of Accumulation/Distributionover the specified period. The standard CMF period is 21 days. The principle behind theChaikin Money Flow, is the nearer the close is to the high, the more accumulation hastaken place. Conversely the nearer the close is to the low, the more distribution hastaken place. If the price action consistently closes above the bar's midpoint on increasingvolume then the Chaikin Money Flow will be positive. Conversely, if the price actionconsistently closes below the bar's midpoint on increasing volume, then the ChaikinMoney Flow will be a negative value.
Interpretation
• A CMF sell signal occurs when price action develops a higher high into overboughtzones and the CMF diverges with a lower high and begins to fall.
• A CMF buy signal occurs when price action develops a lower low into oversold zonesand the CMF diverges with a higher low and begins to rise.
• A CMF value above the zero line is a sign of strength in the market, and a value belowthe zero line is a sign of weakness in the market.
• The Chaikin Money Flow provides excellent breakout confirmation. Wait for the CMF toconfirm the breakout direction of price action through trendlines or support andresistance lines. For example, if price breaks upwards through resistance then wait forthe CMF to have a positive value, thus confirming the break out direction.
Calculation
CMF = n-day Sum of ( ( ( (C - L) - (H - C) ) / (H - L) ) x Vol ) / n-daySum of Vol
where,
n = number of periods, typically 21H = highL = lowC = closeVol = volume
Example
{ Use strength of CMF above zero to color bars }var Bar, CMFPane: integer;var x: float;CMFPane := CreatePane( 80, true, true );PlotSeries( CMFSeries( 20 ), CMFPane, 509, #Histogram );DrawLabel( 'CMF( 20 )', CMFPane );for Bar := 20 to BarCount - 1 dobegin x := CMF( Bar, 20 ) * 20; if x > 0 then SetBarColor( Bar, Round( x ) );end;

WealthScript Function Reference, Wealth-Lab Pro™209
© 2003-2006 FMR Corp. All rights reserved.
16.15 CMO
CMO( Bar: integer; Series: integer; Period: integer ): float;CMOSeries( Series: integer; Period: integer ): integer;
RChartScripts RSimuScripts RPerfScripts XCMScripts
Description
The Chande Momentum Oscillator is similar to RSI or Stochastics. It is calculated bydividing the sum of up day and down day activity into the difference of up day and downday activity. The result is then multiplied by 100 to arrive at an indicator that oscillatesbetween -100 and 100. A typical value for number of periods, Period, for the CMO is 20.
Interpretation
• CMO reaches extreme levels at 50 for overbought and -50 for oversold. You can alsolook for signals based on the CMO crossing above and below a signal line composed ofa 9 period moving average of the 20 period CMO.
• CMO measures the trend strength, the higher the CMO value the stronger the trend,whereas low CMO values indicate sideways trading ranges.
• If underlying prices make a new high or low that isn't confirmed by the CMO thisdivergence can signal a price reversal.
• CMO often forms chart patterns which may not show on the underlying price chart,such as double tops and bottoms and trendlines. Also look for support or resistance onthe CMO.
Calculation
CMO = 100 * ( ( Su - Sd )/( Su + Sd ) )
where,
Su = Sum of prices on up days for the specified PeriodSd = Sum of prices on down days for the specified Period
Example
{ This simple system buys when CMO is oversold, and sells when CMO is overbought }var Bar: integer;for Bar := 20 to BarCount - 1 dobegin if not LastPositionActive then begin if CMO( Bar, #Close, 20 ) < -55 then BuyAtMarket( Bar + 1, 'CMO' ); end else begin if CMO( Bar, #Close, 20 ) > 45 then SellAtMarket( Bar + 1, LastPosition, 'CMO' ); end;end;
Technical Indicator Functions 210
© 2003-2006 FMR Corp. All rights reserved.
16.16 CumDown
CumDown( Bar: integer; Series: integer; Period: integer ): float;CumDownSeries( Series: integer; Period: integer ): integer;
RChartScripts RSimuScripts RPerfScripts XCMScripts
Description
CumDown lets you test whether a specific number of consecutive bars have elapsedwhere the prices are less than their value a certain number of bars ago. It was created tomake it easier to implement systems such as TD Sequential (by Thomas Demark). TheTD Sequential setup requires 9 consecutive bars where the closing price is lower than theclosing price 4 bars ago.
The complete TD system encompasses both entry and exit strategies and an extensivenumber of TD indicators. The CumUp and CumDown indicators are use to find setupconditions indicating overbought and oversold market conditions. They are designed toanticipate trend reversals. The CumUp looks for a number new high periods with only fewlow periods. The CumDown looks for a number of new low periods with only a few highperiods.
In Candles sticks a new high or low is called Record Sessions. Candle theory, suggest ifyou have 8 to 10 near record sessions then the proceeding trend is due for a reversal.Record sessions count the bars slightly different to CumDown and CumUp.
Interpretation
There are three stages to a TD Sequential system, the Setup, the Intersection, and theCount down. After each stage is triggered move onto the next stage. The following for isfor oversold markets.
• The buy Setup consist of a series of at least nine consecutive closes less than the closefour trading bars earlier. This indicates a possible oversold market.
• The buy Intersection, look for the high of bar 8 of the buy setup to be greater than orequal to the low of bars 5, 4, 3, 2 or 1 of the buy setup. If this is not fulfilled, theneach successive price bar is compared until its high is greater than or equal to the lowof the price bar three or more price bars earlier back to bar 1 of the buy setup.Protects against run away price action.
• The buy Countdown consists of a series of 13 successive closes less than or equal tothe low two price bars earlier. Once that has been accomplished, the market generallyis in a low-risk buy entry zone. Good time to go long.
In a similar manner, use CumUp to detect overbought conditions.
Calculation
CumDown is a running count of the number of bars whose Series value is below itsdelayed Series; in other words, Series offset forward by the Period. The count is reset tozero when the Series is above its offset series. Run the following ChartScript for a visualclarification:
{ CumDown calculation demo }const L = 5;var Bar, n: integer;
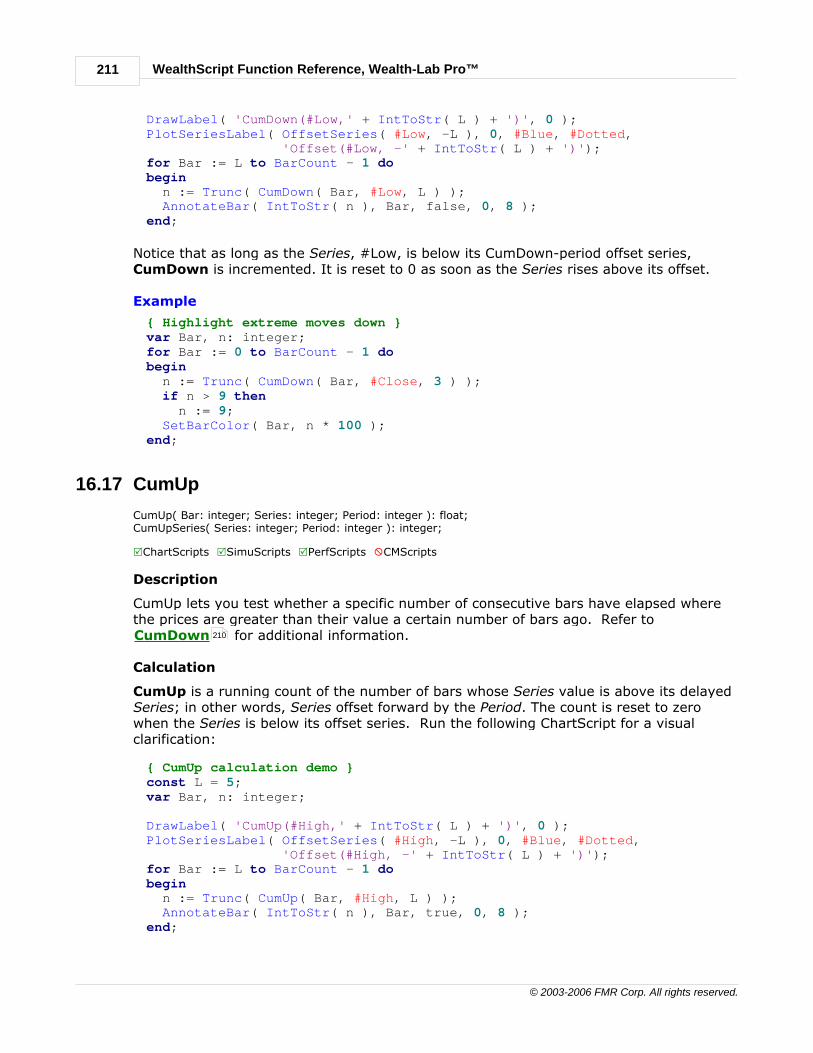
WealthScript Function Reference, Wealth-Lab Pro™211
© 2003-2006 FMR Corp. All rights reserved.
DrawLabel( 'CumDown(#Low,' + IntToStr( L ) + ')', 0 );PlotSeriesLabel( OffsetSeries( #Low, -L ), 0, #Blue, #Dotted, 'Offset(#Low, -' + IntToStr( L ) + ')');for Bar := L to BarCount - 1 dobegin n := Trunc( CumDown( Bar, #Low, L ) ); AnnotateBar( IntToStr( n ), Bar, false, 0, 8 );end;
Notice that as long as the Series, #Low, is below its CumDown-period offset series,CumDown is incremented. It is reset to 0 as soon as the Series rises above its offset.
Example
{ Highlight extreme moves down }var Bar, n: integer;for Bar := 0 to BarCount - 1 dobegin n := Trunc( CumDown( Bar, #Close, 3 ) ); if n > 9 then n := 9; SetBarColor( Bar, n * 100 );end;
16.17 CumUp
CumUp( Bar: integer; Series: integer; Period: integer ): float;CumUpSeries( Series: integer; Period: integer ): integer;
RChartScripts RSimuScripts RPerfScripts XCMScripts
Description
CumUp lets you test whether a specific number of consecutive bars have elapsed wherethe prices are greater than their value a certain number of bars ago. Refer toCumDown for additional information.
Calculation
CumUp is a running count of the number of bars whose Series value is above its delayedSeries; in other words, Series offset forward by the Period. The count is reset to zerowhen the Series is below its offset series. Run the following ChartScript for a visualclarification:
{ CumUp calculation demo }const L = 5;var Bar, n: integer;
DrawLabel( 'CumUp(#High,' + IntToStr( L ) + ')', 0 );PlotSeriesLabel( OffsetSeries( #High, -L ), 0, #Blue, #Dotted, 'Offset(#High, -' + IntToStr( L ) + ')');for Bar := L to BarCount - 1 dobegin n := Trunc( CumUp( Bar, #High, L ) ); AnnotateBar( IntToStr( n ), Bar, true, 0, 8 );end;
210

Technical Indicator Functions 212
© 2003-2006 FMR Corp. All rights reserved.
Notice that as long as the Series, #High, is above its CumUp-period offset series, CumUpis incremented. It is reset to 0 as soon as the Series falls below its offset.
Example
{ Highlight extreme moves up }var Bar, n: integer;for Bar := 0 to BarCount - 1 dobegin n := Trunc( CumUp( Bar, #Close, 3 ) ); if n > 9 then n := 9; SetBarColor( Bar, n * 10 );end;
16.18 DIMinus
DIMinus( Bar: integer; Period: integer ): float;DIMinusSeries( Period: integer ): integer;
RChartScripts RSimuScripts XPerfScripts XCMScripts
Description
DIMinus is a component of the Directional Movement System developed by Welles Wilder.This system attempts to measure the strength of price movement in positive andnegative directions, as well as the overall strength of the trend. DIPlus is normally usedwith the DIMinus, DX and ADX indicators and typically uses 14 periods.
The DIMinus value represents downward price movement as a percentage of true range.The more each down bar's price is equal to the true range, the larger the value of theDIMinus. The DIPlus and the DIMinus are not mirror images.
Interpretation
• DIMinus measures a market's negative directional movement. If DIMinus is greaterthen DIPlus, prices have a stronger negative directional movement.
• If prices fall for the number of periods specified then the DIMinus would be a highvalue and the DIPlus value would be near zero.
• If prices rise for the number of periods specified then the DIMinus value would be nearzero and DIPlus would have a high value.
• If prices fluctuate for the number of periods specified, like in a trading range, thenDIPlus and DIMinus will have similar values.
• The greater the difference between the DIPlus and DIMinus the stronger the trend. TheDX indicator takes advantage of this.
Calculation
-DI = Round( -DM / TR )* 100
where,
-DI = DIMinusTR = True Range of current bar
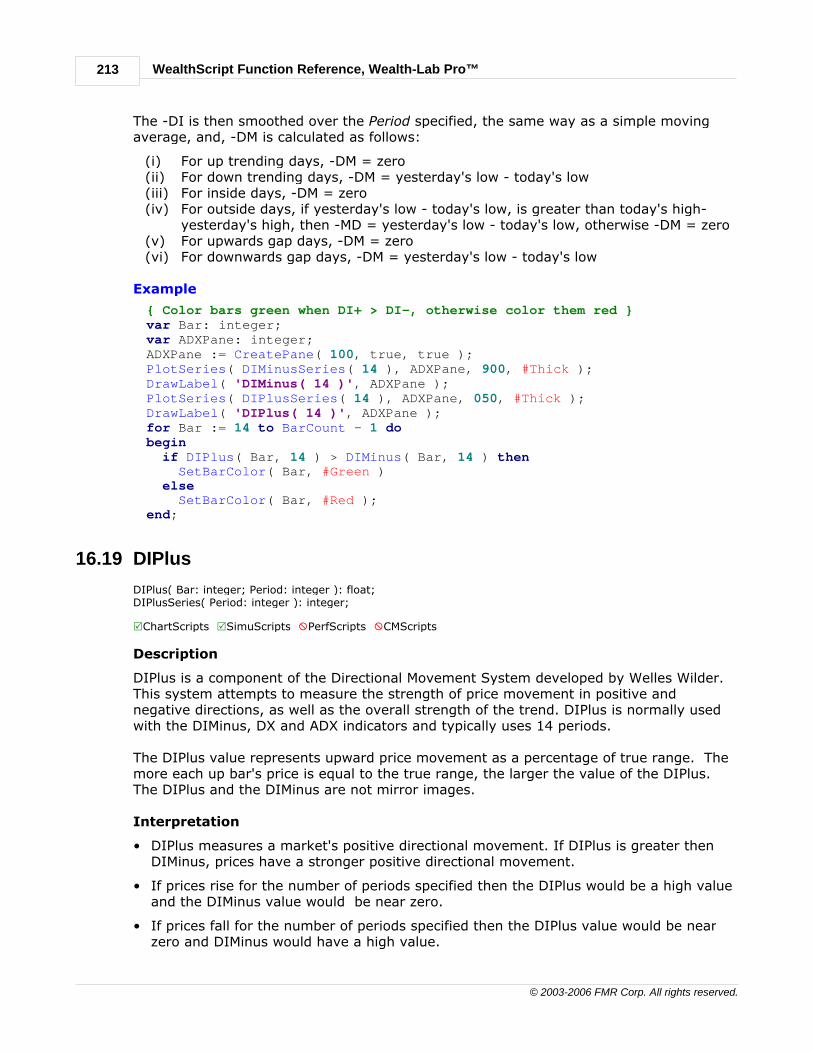
WealthScript Function Reference, Wealth-Lab Pro™213
© 2003-2006 FMR Corp. All rights reserved.
The -DI is then smoothed over the Period specified, the same way as a simple movingaverage, and, -DM is calculated as follows:
(i) For up trending days, -DM = zero(ii) For down trending days, -DM = yesterday's low - today's low(iii) For inside days, -DM = zero(iv) For outside days, if yesterday's low - today's low, is greater than today's high-
yesterday's high, then -MD = yesterday's low - today's low, otherwise -DM = zero(v) For upwards gap days, -DM = zero(vi) For downwards gap days, -DM = yesterday's low - today's low
Example
{ Color bars green when DI+ > DI-, otherwise color them red }var Bar: integer;var ADXPane: integer;ADXPane := CreatePane( 100, true, true );PlotSeries( DIMinusSeries( 14 ), ADXPane, 900, #Thick );DrawLabel( 'DIMinus( 14 )', ADXPane );PlotSeries( DIPlusSeries( 14 ), ADXPane, 050, #Thick );DrawLabel( 'DIPlus( 14 )', ADXPane );for Bar := 14 to BarCount - 1 dobegin if DIPlus( Bar, 14 ) > DIMinus( Bar, 14 ) then SetBarColor( Bar, #Green ) else SetBarColor( Bar, #Red );end;
16.19 DIPlus
DIPlus( Bar: integer; Period: integer ): float;DIPlusSeries( Period: integer ): integer;
RChartScripts RSimuScripts XPerfScripts XCMScripts
Description
DIPlus is a component of the Directional Movement System developed by Welles Wilder.This system attempts to measure the strength of price movement in positive andnegative directions, as well as the overall strength of the trend. DIPlus is normally usedwith the DIMinus, DX and ADX indicators and typically uses 14 periods.
The DIPlus value represents upward price movement as a percentage of true range. Themore each up bar's price is equal to the true range, the larger the value of the DIPlus.The DIPlus and the DIMinus are not mirror images.
Interpretation
• DIPlus measures a market's positive directional movement. If DIPlus is greater thenDIMinus, prices have a stronger positive directional movement.
• If prices rise for the number of periods specified then the DIPlus would be a high valueand the DIMinus value would be near zero.
• If prices fall for the number of periods specified then the DIPlus value would be nearzero and DIMinus would have a high value.
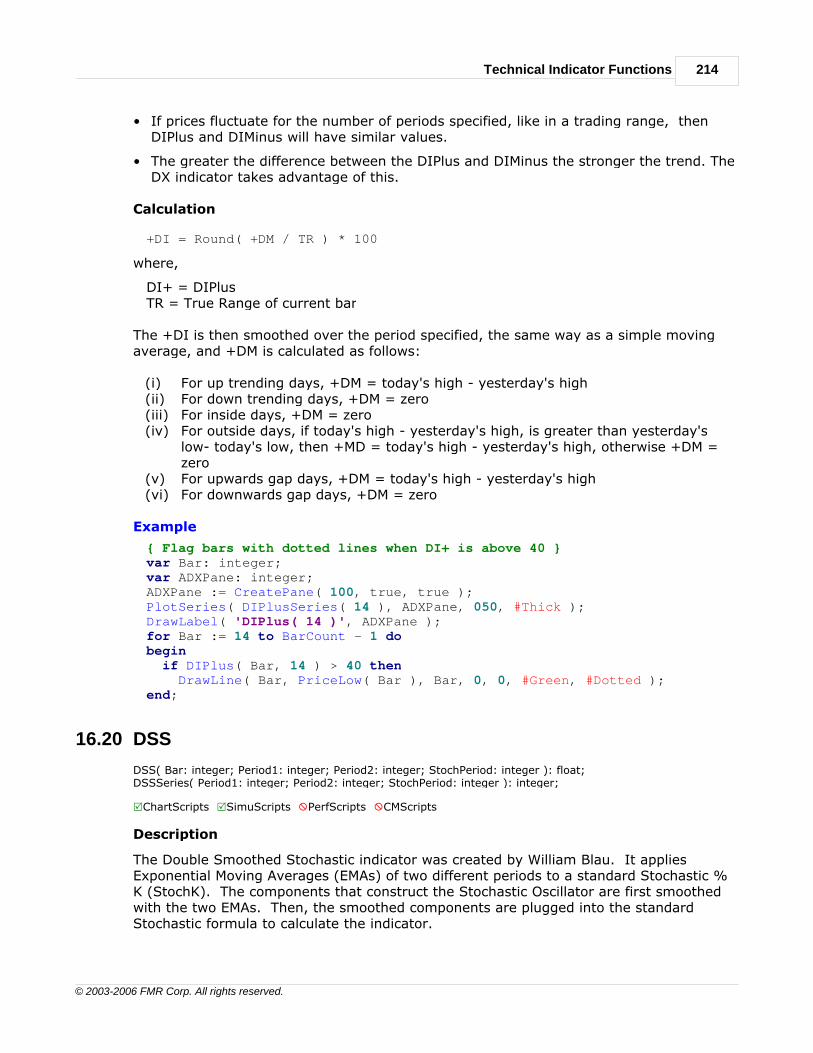
Technical Indicator Functions 214
© 2003-2006 FMR Corp. All rights reserved.
• If prices fluctuate for the number of periods specified, like in a trading range, thenDIPlus and DIMinus will have similar values.
• The greater the difference between the DIPlus and DIMinus the stronger the trend. TheDX indicator takes advantage of this.
Calculation
+DI = Round( +DM / TR ) * 100
where,
DI+ = DIPlusTR = True Range of current bar
The +DI is then smoothed over the period specified, the same way as a simple movingaverage, and +DM is calculated as follows:
(i) For up trending days, +DM = today's high - yesterday's high(ii) For down trending days, +DM = zero(iii) For inside days, +DM = zero(iv) For outside days, if today's high - yesterday's high, is greater than yesterday's
low- today's low, then +MD = today's high - yesterday's high, otherwise +DM =zero
(v) For upwards gap days, +DM = today's high - yesterday's high(vi) For downwards gap days, +DM = zero
Example
{ Flag bars with dotted lines when DI+ is above 40 }var Bar: integer;var ADXPane: integer;ADXPane := CreatePane( 100, true, true );PlotSeries( DIPlusSeries( 14 ), ADXPane, 050, #Thick );DrawLabel( 'DIPlus( 14 )', ADXPane );for Bar := 14 to BarCount - 1 dobegin if DIPlus( Bar, 14 ) > 40 then DrawLine( Bar, PriceLow( Bar ), Bar, 0, 0, #Green, #Dotted );end;
16.20 DSS
DSS( Bar: integer; Period1: integer; Period2: integer; StochPeriod: integer ): float;DSSSeries( Period1: integer; Period2: integer; StochPeriod: integer ): integer;
RChartScripts RSimuScripts XPerfScripts XCMScripts
Description
The Double Smoothed Stochastic indicator was created by William Blau. It appliesExponential Moving Averages (EMAs) of two different periods to a standard Stochastic %K (StochK). The components that construct the Stochastic Oscillator are first smoothedwith the two EMAs. Then, the smoothed components are plugged into the standardStochastic formula to calculate the indicator.

WealthScript Function Reference, Wealth-Lab Pro™215
© 2003-2006 FMR Corp. All rights reserved.
Interpretation
DSS ranges from 0 to 100, like the standard Stochastic Oscillator. The same rules ofinterpretation that you use for Stochastics can be applied to DSS, although DSS offers amuch smoother curve than the raw Stochastic.
Calculation
HH = Highest High in Look back PeriodLL = Lowest Low in Look back PeriodC-L = Close minus LLH-L = HH minus LLC-L(2) = EMA( C-L, Period2 )H-L(2) = EMA( H-L, Period2 )C-L(1) = EMA( C-L(2), Period1 )H-L(1) + EMA( H-L(2), Period1 )
DSS = ( C-L(1) / H-L(1) ) * 100
Note: UseUpdatedEMA affects the calculation of EMA-based indicators such as DSS.
Example
{ Buy when DSS turns up from an oversold level }var Bar, DSSPane: integer;DSSPane := CreatePane( 100, true, true );PlotSeries( DSSSeries( 10, 20, 5 ), DSSPane, 905, #Thick );DrawLabel( 'DSS( 10, 20, 5 )', DSSPane );for Bar := 20 to BarCount - 1 dobegin if not LastPositionActive then begin if TurnUp( Bar, DSSSeries( 10, 20, 5 ) ) then if DSS( Bar - 1, 10, 20, 5 ) < 24 then BuyAtMarket( Bar + 1, 'DSS' ); end else begin if TurnDown( Bar, DSSSeries( 10, 20, 5 ) ) then SellAtMarket( Bar + 1, LastPosition, 'DSS' ); end;end;
16.21 DX
DX( Bar: integer; Period: integer ): float;DXSeries( Period: integer ): integer;
RChartScripts RSimuScripts XPerfScripts XCMScripts
Description
DX is a component of the Directional Movement System developed by Welles Wilder. Thissystem attempts to measure the strength of price movement in positive and negativedirections, as well as the overall strength of the trend. The DX is used in calculating theADX indicator which is normally used with the DIPlus and DIMinus indicators. Typically ituses 14 periods in its calculations. Normally you would not use the DX indicator as itwhipsaws, use the ADX or ADXR.

Technical Indicator Functions 216
© 2003-2006 FMR Corp. All rights reserved.
Interpretation
• DX measures the trendiness of a market, and ranges from 0 to 100. If the Trend isstrong then the spread between the two smoothed directional lines, (DIPlus andDIMinus) increases and the DX value increases. The higher the DX, the moredirectional movement present in the market.
• If prices rise for the number of periods specified then the DIMinus value would be nearzero and DIPlus would have a high value. This very directional upwards pricemovement results in a high DX value.
• If prices fall for the number of periods specified then the DIMinus would be a highvalue and the DIPlus value would be near zero. This very directional downwards pricemovement result in a high DX value.
• If prices fluctuate for the number of periods specified, like in a trading range, thenDIPlus and DIMinus will have similar values. This non-directional sideways pricemovements results in a low DX value.
Calculation
DX = Round( 100 * |DIPlus - DIMinus| / |DIPlus + DIMinus| )
Example
{ Show how Average Directional Movement (ADX) relates to DX on the chart}var ADXPane: integer;ADXPane := CreatePane( 100, true, true );PlotSeries( DXSeries( 20 ), ADXPane, 555, #ThickHist );DrawLabel( 'DX( 20 )', ADXPane );PlotSeries( ADXSeries( 20 ), ADXPane, 009, #Thick );DrawLabel( 'ADX( 20 )', ADXPane );
16.22 EMA
EMA( Bar: integer; Series: integer; Period: integer ): float;EMASeries( Series: integer; Period: integer ): integer;
RChartScripts RSimuScripts RPerfScripts XCMScripts
Description
EMA returns the Exponential Moving Average of the specified Period. EMA is similar toSimple Moving Average (SMA), in that it averages the data over a period of time.However, whereas SMA just calculates a straight average of the data, EMA applies moreweight to the data that is more current. The most weight is placed on the most recentdata point. Because of the way it's calculated, EMA will follow prices more closely than acorresponding SMA.
Note: UseUpdatedEMA affects the calculation of EMA-based indicators such asCADO, EMA, TRIX, etc.
Interpretation
• Use the same rules that we apply to SMA when interpreting EMA. Keep in mind,though, that EMA is generally more sensitive to price movement. This can be a double-edged sword. On the one hand, it can get you into trends a bit earlier than an SMA

WealthScript Function Reference, Wealth-Lab Pro™217
© 2003-2006 FMR Corp. All rights reserved.
would. On the other hand, the EMA will probably experience more whipsaws than acorresponding SMA.
• Use the EMA to determine trend direction, and trade in that direction. When the EMArises then buy when prices dip near or a bit below the EMA. When the EMA falls thensell when prices rally towards or a bit above the EMA.
• Moving averages can also indicate support and resistance areas. A rising EMA tends tosupport the price action and a falling EMA tends to provide resistance to price action.This reinforces the idea of buying when price is near the rising EMA or selling whenprice is near the falling EMA.
• All Moving Averages, including the EMA are not designed to get you into a trade at theexact bottom and out again at the exact top. They tend to ensure your trading in thegeneral direction of the trend, but with a delay at the entry and exit. The EMA has ashorter delay than the SMA with the same period.
Calculation
You should notice how the EMA use the previous value of the EMA in its calculation, thismeans the EMA includes all the price data within its current value. The newest price datahas the most impact on the Moving Average and the oldest prices data has only aminimal impact.
EMA = ( K x ( C - P ) ) + P
where,
C = Current PriceP = Previous periods EMA (A SMA is used for the first periods calculations)K = Exponential smoothing constant
The smoothing constant K, applies appropriate weight to the most recent price. It usesthe number of periods specified in the moving average. With wealth Lab you have achoice of two methods for calculating the smoothing constant.
Two similar but not equivalent formulas are available for calculating the exponent;Wealth-Lab's original method (from Pring's Technical Analysis Explained):
K = ( 1 / Periods ) * 2
and perhaps a more common method, which is referred to as the "Updated Method":
K = 2 / ( 1 + Periods )
You can choose which is the default method in the Indicator Calculations section of theOptions dialog. Additionally, by passing true or false to the UseUpdatedEMA functionyou can control which method is used at runtime. Note that the formula in effect alsoaffects native indicators that are based on EMA, such as CADO, TRIX, etc.
Example
{ Dual EMA CrossOver System }var BAR, P: integer;{ UseUpdatedEMA( true ); } {Alternate smoothing exponent}PlotSeries( EMASeries( #Close, 60 ), 0, 002, #Thick );DrawLabel( 'EMA( Close, 60 )', 0 );PlotSeries( EMASeries( #Close, 120 ), 0, 202, #Thin );DrawLabel( 'EMA( Close, 120 )', 0 );

Technical Indicator Functions 218
© 2003-2006 FMR Corp. All rights reserved.
for Bar := 120 to BarCount - 1 dobegin if not LastPositionActive then begin if CrossOver( Bar, EMASeries( #Close, 60 ), EMASeries( #Close, 120 )) then BuyAtMarket( Bar + 1, '' ); end else begin if CrossUnder( Bar, EMASeries( #Close, 60 ), EMASeries( #Close, 120 )) then SellAtMarket( Bar + 1, LastPosition, '' ); end;end;
16.23 EMMinus
EMMinus( Bar: integer; Series: integer; Period: integer ): float;EMMinusSeries( Series: integer; Period: integer ): integer;
RChartScripts RSimuScripts RPerfScripts XCMScripts
Description
Markets that are experiencing rising trends frequently make new highs, and those infalling trends new lows. The Extreme Motion Index is a way of measuring a market'strend strength by counting the frequency of new highs and lows in a given period. EM- isthe percentage of bars that have made new lows within the specified Period.
Interpretation
• When EM- rises from zero this is an indication that a worthwhile downtrend may be inthe making. You can take a trend-following position at this point and exit once theindicator reaches a predetermined overbought level.
• Once EM- crosses 20 prices tend to follow through and a profit target or trailing stop(for short orders) often works well to capture gains.
• The crossover of EM+ and EM- can also be used as trend confirmation indicators.
Calculation
EMMinus is simply the percentage of bars that have achieved new lows within thespecified lookback period. Consider, for example, the EMMinus with a period of 40.Within the past 40 bars there have been 10 bars that have reached a 40 bar low. TheEMMinus indicator value for this bar would be 25, because 25% of the bars have reachednew lows in the period.
Example
{ Enter short when EMMinus turns up and start a trailing stop when it crosses 19 }var Bar, EMPane, hEMMinus: integer;var TStopOn: boolean;EMPane := CreatePane( 75, true, true );hEMMinus := EMMinusSeries( #Close,40 );PlotSeriesLabel( hEMMinus, EMPane, 900, #Thin, 'EMMinus(#Close,40)' );
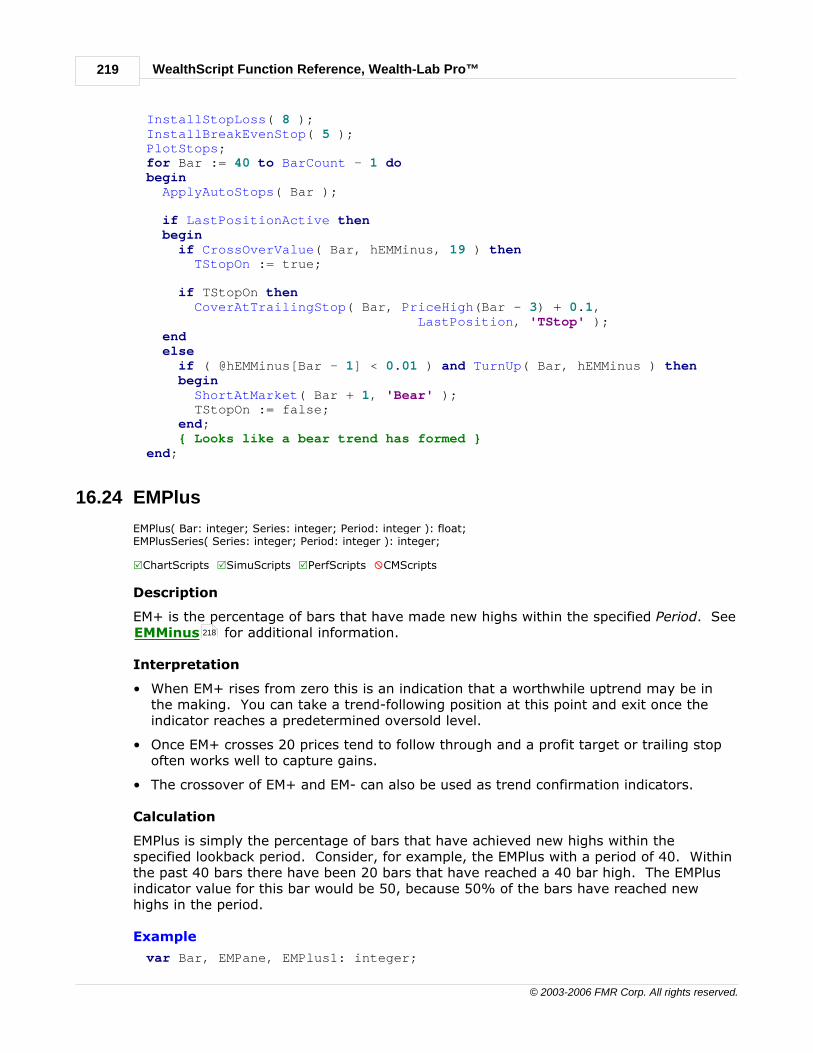
WealthScript Function Reference, Wealth-Lab Pro™219
© 2003-2006 FMR Corp. All rights reserved.
InstallStopLoss( 8 );InstallBreakEvenStop( 5 );PlotStops;for Bar := 40 to BarCount - 1 dobegin ApplyAutoStops( Bar );
if LastPositionActive then begin if CrossOverValue( Bar, hEMMinus, 19 ) then TStopOn := true;
if TStopOn then CoverAtTrailingStop( Bar, PriceHigh(Bar - 3) + 0.1, LastPosition, 'TStop' ); end else if ( @hEMMinus[Bar - 1] < 0.01 ) and TurnUp( Bar, hEMMinus ) then begin ShortAtMarket( Bar + 1, 'Bear' ); TStopOn := false; end; { Looks like a bear trend has formed }end;
16.24 EMPlus
EMPlus( Bar: integer; Series: integer; Period: integer ): float;EMPlusSeries( Series: integer; Period: integer ): integer;
RChartScripts RSimuScripts RPerfScripts XCMScripts
Description
EM+ is the percentage of bars that have made new highs within the specified Period. SeeEMMinus for additional information.
Interpretation
• When EM+ rises from zero this is an indication that a worthwhile uptrend may be inthe making. You can take a trend-following position at this point and exit once theindicator reaches a predetermined oversold level.
• Once EM+ crosses 20 prices tend to follow through and a profit target or trailing stopoften works well to capture gains.
• The crossover of EM+ and EM- can also be used as trend confirmation indicators.
Calculation
EMPlus is simply the percentage of bars that have achieved new highs within thespecified lookback period. Consider, for example, the EMPlus with a period of 40. Withinthe past 40 bars there have been 20 bars that have reached a 40 bar high. The EMPlusindicator value for this bar would be 50, because 50% of the bars have reached newhighs in the period.
Example
var Bar, EMPane, EMPlus1: integer;
218

Technical Indicator Functions 220
© 2003-2006 FMR Corp. All rights reserved.
EMPane := CreatePane( 75, true, true );EMPlus1 := EMPlusSeries( #Close,40 );PlotSeriesLabel( EMPlus1, EMPane, 009, #Thin, 'EMPlus1=EMPlus(#Close,40)');
InstallTrailingStop( 2, 25 );InstallStopLoss( 6 );PlotStops;for Bar := 40 to BarCount - 1 dobegin ApplyAutoStops( Bar ); { Looks like a bull trend has formed } if CrossOverValue( Bar, EMPlus1, 20 ) then BuyAtMarket( Bar + 1, 'Bull' );end;
16.25 FAMA
FAMA( Bar: integer; Series: integer; FastLimit: float; SlowLimit: float ): float;FAMASeries( Series: integer; FastLimit: float; SlowLimit: float ): integer;
RChartScripts RSimuScripts RPerfScripts XCMScripts
Description
FAMA stands for Following Adaptive Moving Average. It was developed by John Ehlers ofMesa Software, and presented in the September 2001 issue of Stocks & Commoditiesmagazine. FAMA is a complimentary indicator to MAMA (see MAMA indicator for moredetails).
The FAMA indicator uses an alpha (a) value that is half of its corresponding MAMAindicator. This results in an indicator that is synchronized to MAMA, but with verticalmovement that is not as great. Consequently, MAMA and FAMA do not cross unless therehas been a major change in market direction.
In addition to Price Series, FAMA accepts two additional parameters, FastLimit andSlowLimit. These control the maximum and minimum alpha (a) value that should beapplied to the most recent bar of data when calculating FAMA.
You can learn more about the Mesa Adaptive Moving Average at thewww.mesasoftware.com web site.
Interpretation
FAMA is used in conjunction with its complimentary MAMA indicator. Long signals occurwhen MAMA crosses above FAMA, and short signals when MAMA crosses below FAMA.
Calculation
FAMA = 0.5 * alpha * MAMA + ( 1 - 0.5 * alpha ) * Previous FAMA
Example
var Bar: integer;PlotSeries( MAMASeries( #Close, 0.5, 0.05 ), 0, #Red, #Thin );PlotSeries( FAMASeries( #Close, 0.5, 0.05 ), 0, #Blue, #Thin );for Bar := 40 to BarCount - 1 do
WealthScript Function Reference, Wealth-Lab Pro™221
© 2003-2006 FMR Corp. All rights reserved.
begin if CrossOver( Bar, MAMASeries( #Close, 0.5, 0.05 ), FAMASeries( #Close, 0.5, 0.05 ) ) then BuyAtMarket( Bar + 1, '' ) else if CrossOver( Bar, FAMASeries( #Close, 0.5, 0.05 ), MAMASeries( #Close, 0.5, 0.05 ) ) then SellAtMarket( Bar + 1, LastPosition, '' );end;
16.26 FIR
FIR( Bar: integer; Series: integer; Filter: string ): float;FIRSeries( Series: integer; Filter: string ): integer;
RChartScripts RSimuScripts RPerfScripts XCMScripts
Description
FIR stands for Finite Impulse Response Filter. This is a type of smoothing filter thatassigns different weights to price data a number of bars in the past. Pass the Price Seriesyou want to apply the filter to in the first parameter. The second parameter of the FIR isa string that describes the weights that will be applied to the bars of data that composethe filter. The string is formatted as a series of numbers separated by commas.
Interpretation
FIR filters are nothing more than another type of weighted moving average, with differentweight levels applied to the various components of the average. As such, you can applyany of the various interpretations of moving averages to FIR.
Calculation
A simple example will make this concept easier to explain. Assume we pass the stringvalue of '4,3,2,1' as the second parameter to FIR, and apply it to closing prices. Thefunction will perform the following calculation:
( ( 4 x current Closing Price ) + ( 3 * Closing Price 1 bar back ) + ( 2* Closing Price 2 bars back ) + ( 1 * Closing Price 3 bars back ) ) / 10
As you can see, each successive weight value is applied to the previous bar back in theprice history. The final sum of the weighted price values is divided by the sum of theweights.
Example
{ A FIR is used as a signal line for a 200 day moving average }var SMASer: integer;SMASer := SMASeries( #Close, 200 );PlotSeries( SMASer, 0, #Olive, #Thick );PlotSeries( FIRSeries( SMASer, '1,2,2,1' ), 0, #Black, #Thin );
16.27 Highest
Highest( Bar: integer; Series: integer; Period: integer ): float;HighestSeries( Series: integer; Period: integer ): integer;
RChartScripts RSimuScripts RPerfScripts XCMScripts
Technical Indicator Functions 222
© 2003-2006 FMR Corp. All rights reserved.
Description
Returns the highest value of a Price Series within the specified look back Period.
Highs and lows are found in all markets, and, they are fundamentally important totechnical analysis. Uptrends are defined by a succession of higher highs and higher lows,whereas downtrends are characterized by a succession of lower highs and lower lows.Support and resistance is often defined at significant high and low points. Patternformations are shaped by highs and lows such as double tops and bottoms, head andshoulder formations, rectangles, triangles, flags, consolidations and other formations. UseWealth-Lab functions: Highest, Lowest, HighestBar and LowestBar, for finding andanalyzing these market opportunities.
Interpretation
• Uptrends are formed by a succession of higher highs and higher lows, failure to makea new higher high or higher low means the trend has ended.
• Downtrends are formed by a succession of lower highs and lower lows failure to makea new lower high or lower low means the trend has ended.
• Divergence occurs when price action and indicators move in different directions andcommonly occur before a stock or a market changes direction. During an uptrend, if anew high appears in the price action and a lower high develops in the indicator, thenthe trend maybe ending. See RSI for more information on divergence.
• Useful for stops loss calculations such as when taking short positions, or buy ordertriggers. Add an amount to the last highest value, this can be a fixed amount like apercentage of current closing price. A better method is to allow for volatility, use amultiple of ATR for this. For example, Highest high plus, half times ATR of last 20bars.
• Entry filters, buy if today prices is higher than high for past two days. This can beuseful to ensure you start your trade in the right direction.
• Past highs can represents significant resistance to price action. Look for single ormultiple highs forming at both technical and psychological levels. (Gann, Fibonacci,whole numbers, and the like).
• Many chart patterns are defined by recent high and lows.
Calculation
Looks back the specified number of periods from the specified Bar and returns the highestprice within that Period.
Example
{ Have we made a 100 bar high? }var BAR: integer;for Bar := 100 to BarCount - 1 do if PriceHigh( Bar ) = Highest( Bar, #High, 100 ) then AnnotateBar( 'NH', Bar, true, #Black, 8 );
WealthScript Function Reference, Wealth-Lab Pro™223
© 2003-2006 FMR Corp. All rights reserved.
16.28 HighestBar
HighestBar( Bar: integer; Series: integer; Period: integer ): integer;HighestBarSeries( Series: integer; Period: integer ): integer;
RChartScripts RSimuScripts RPerfScripts XCMScripts
Description
Returns the bar in which highest value of the Price Series for the specified Period wasrecorded. Refer to Highest for more information.
Interpretation
(See Highest )
Remarks
• If more than one bar has precisely the same Highest value, then HighestBar returnsthe most recent bar, i.e., the bar with the latest date/time.
Calculation
Looks back the specified number of periods from the specified Bar and returns the Barnumber with the highest price within that period.
Example
{ Has the 200 day high ocurred within the past 20 bars? }var N: float;var BAR: integer;for Bar := 200 to BarCount - 1 dobegin n := HighestBar( Bar, #High, 200 ); if Bar - n <= 20 then SetBackgroundColor( Bar, 888 );end;
16.29 HTDCPhase
HTDCPhase( Bar: integer; Series: integer ): float;HTDCPhaseSeries( Series: integer ): integer;
RChartScripts RSimuScripts RPerfScripts XCMScripts
Description
The Hilbert Transform is a technique used to generate Inphase and Quadraturecomponents of a de-trended real-valued "analytic-like" signal (such as a Price Series) inorder to analyze variations of the instantaneous phase and amplitude.. HTDCPhasereturns the Hilbert Transform Phase of the Dominant Cycle. The Dominant Cycle Phaselies in the range of 0 to 360 degrees.
Interpretation
The DC Phase at a specific bar gives the phase position from 0 to 360 degrees within thecurrent Hilbert Transform Period instantaneously measured at that bar. It is meaningfulonly during a cyclic period of the analytic signal waveform (price series) being measured.
221
221

Technical Indicator Functions 224
© 2003-2006 FMR Corp. All rights reserved.
Its transition from 360 degrees to 0 degrees can be used to designate the start of a newcycle. It can also be utilized to signal the start or end of trending or cyclic periods.Departure from a constant rate change of phase is a sensitive way to detect the end of acycle mode. See the examples.
Calculation
More detailed information concerning the calculation of the Hilbert Transform relatedfunctions can be found in this document and others on the Mesa Software site:http://www.mesasoftware.com/pub/concepts.exeThe basic flow and simplified pseudo code for the computation for the Dominant CyclePhase as part of the computation of the Dominant Cycle is:
Compute the Hilbert Transform{Detrend Price}{Compute InPhase and Quadrature components}
Compute the Period of the Dominant Cycle {Use ArcTangent to compute the current phase}
{Resolve the ArcTangent ambiguity}
{Compute a differential phase, resolve phase wraparound, and limit delta phase
errors}
{Sum DeltaPhases to reach 360 degrees. The sum is the instantaneous period.}
{Resolve Instantaneous Period errors and smooth}
Compute Dominant Cycle PhaseReturn the Dominant Cycle Phase at the current bar of the Hilbert Transform Periodmeasured at that bar
Example
{ Example - Make bars more solid as the dominant cycle phase approaches360 }var DCPHASEPANE, htDCP, BAR, N: integer;
DCPhasePane := CreatePane( 100, true, true );htDCP := HTDCPhaseSeries( #Average );PlotSeries( htDCP, DCPhasePane, 520, #Thick );for Bar := 0 to BarCount - 1 dobegin n := 9 - ( Round( @htDCP[Bar] / 360 * 9 ) ); SetBarColor( Bar, n * 100 + n * 10 + n );end;
{ Also see ChartScript 'RocketScience v1' }
16.30 HTInPhase
HTInPhase( Bar: integer; Series: integer ): float;HTInPhaseSeries( Series: integer ): integer;
RChartScripts RSimuScripts RPerfScripts XCMScripts
Description
The Hilbert Transform is a technique used to generate inphase and quadraturecomponents of a de-trended real-valued "analytic-like" signal (such as a Price Series) in

WealthScript Function Reference, Wealth-Lab Pro™225
© 2003-2006 FMR Corp. All rights reserved.
order to analyze variations of the instantaneous phase and amplitude. HTInPhase returnsthe Hilbert Transform generated InPhase component of the input Price Series.
Interpretation
The InPhase component is used in conjunction with the Quadrature component togenerate the phase of the analytic signal (using the ArcTan function) at a specific bar orfor the entire Price Series.
Calculation
More detailed information concerning the calculation of the Hilbert Transform relatedfunctions can be found in this document and others on the Mesa Software site:http://www.mesasoftware.com/pub/concepts.exeThe basic flow for the computation for the InPhase component is:
Compute the Hilbert Transform{Detrend Price}{Compute InPhase and Quadrature components}
Return the InPhase component at the current bar of the Hilbert Transform computed atthat bar
Example
{ Color bars based on relative positions of Quadrature and In-Phase }var HTQUADPANE, BAR: integer;HTQuadPane := CreatePane( 100, true, true );PlotSeries( HTInPhaseSeries( #Average ), HTQuadPane, 025, #Thick );PlotSeries( HTQuadratureSeries( #Average ), HTQuadPane, 559, #Thick );for Bar := 0 to BarCount - 1 dobegin if HTQuadrature( Bar, #Average ) > HTInPhase( Bar, #Average ) then SetBarColor( Bar, 559 ) else SetBarColor( Bar, 025 );end;
16.31 HTLeadSin
HTLeadSin( Bar: integer; Series: integer ): float;HTLeadSinSeries( Series: integer ): integer;
RChartScripts RSimuScripts RPerfScripts XCMScripts
Description
The Hilbert Transform is a technique used to generate inphase and quadraturecomponents of a de-trended real-valued "analytic-like" signal (such as a Price Series) inorder to analyze variations of the instantaneous phase and amplitude.. HTDCPhasereturns the Hilbert Transform Phase of the Dominant Cycle. The Dominant Cycle Phaselies in the range of 0 to 360 degrees. The Hilbert Transform Lead Sine is just the sine ofthe DC Phase advanced by 45 degrees.
Interpretation
The DC Phase at a specific bar gives the phase position from 0 to 360 degrees within thecurrent Hilbert Transform Period instantaneously measured at that bar. The HTLeadSin is

Technical Indicator Functions 226
© 2003-2006 FMR Corp. All rights reserved.
the sine of the DC Phase at a specific bar. It is most often used in conjunction with theHTSin indicator to identify cyclic turning points. Quoting from Market ModeStrategies.doc by John Ehlers from MESA Software, "A clear, unequivocal cycle modeindicator can be generated by plotting the Sine of the measured phase angle advanced by45 degrees. This leading signal crosses the sinewave 1/8th of a cycle BEFORE the peaksand valleys of the cyclic turning points, enabling you to make your trading decision intime to profit from the entire amplitude swing of the cycle. A significant additionaladvantage is that the two indicator lines don't cross except at cyclic turning points,avoiding the false whipsaw signals of most "oscillators" when the market is in a TrendMode. The two lines don't cross because the phase rate of change is nearly zero in atrend mode. Since the phase is not changing, the two lines separated by 45 degrees in
phase never get the opportunity to cross." See the examples.
Calculation
More detailed information concerning the calculation of the Hilbert Transform relatedfunctions can be found in this document and others on the Mesa Software site:http://www.mesasoftware.com/pub/concepts.exeThe basic flow and simplified pseudo code for the computation for the HTLeadSin is:
Compute the Hilbert Transform{Detrend Price}{Compute InPhase and Quadrature components}
Compute the Period of the Dominant Cycle {Use ArcTangent to compute the current phase}
{Resolve the ArcTangent ambiguity}
{Compute a differential phase, resolve phase wraparound, and limit delta phase
errors}
{Sum DeltaPhases to reach 360 degrees. The sum is the instantaneous period.}
{Resolve Instantaneous Period errors and smooth}
Compute Dominant Cycle PhaseCompute the Sine of the Dominant Cycle PhaseAdvance the Sine by 45 degrees to compute the HT Lead SineReturn the Lead Sine of the Dominant Cycle Phase at the current bar of the HilbertTransform Period measured at that bar
Example
{ Flag bars where Hilbert Transform Sin/Lead Sin cross }var HTSINPANE, BAR, HTLead, HT: integer;HT := HTSinSeries( #Average );HTLead := HTLeadSinSeries( #Average );HTSinPane := CreatePane( 100, false, true );PlotSeries( HTLead, HTSinPane, 009, #Thin );PlotSeries( HT, HTSinPane, 900, #Thin );for Bar := 2 to BarCount - 1 dobegin if CrossOver( Bar, HT, HTLead ) then SetBarColor( Bar, #Red ) else if CrossUnder( Bar, HT, HTLead ) then SetBarColor( Bar, #Blue );end;

WealthScript Function Reference, Wealth-Lab Pro™227
© 2003-2006 FMR Corp. All rights reserved.
16.32 HTPeriod
HTPeriod( Bar: integer; Series: integer ): float;HTPeriodSeries( Series: integer ): integer;
RChartScripts RSimuScripts RPerfScripts XCMScripts
Description
The Hilbert Transform is a technique used to generate Inphase and Quadraturecomponents of a de-trended real-valued "analytic-like" signal (such as a Price Series) inorder to analyze variations of the instantaneous phase and amplitude. HTPeriod (orMESA Instantaneous Period) returns the period of the Dominant Cycle of the analyticsignal as generated by the Hilbert Transform. The Dominant Cycle can be thought of asbeing the "most likely" period (in the range of 10 to 40) of a sine function of the PriceSeries.
Interpretation
The HTPeriod at a specific bar gives the current Hilbert Transform Period asinstantaneously measured at that bar in the range of 10 to 40. It is meaningful onlyduring a cyclic period of the analytic signal waveform (price series) being measured. TheHTPeriod, or one of its sub-periods, is often used to adjust other indicators; for example,Stochastics and RSIs work best when using a half cycle period to peak their performance.Similarly other indicators can be made to be adaptive by using the HTPeriod, or one of itssub-periods, as the period of the indicator. See the examples.
Calculation
More detailed information concerning the calculation of the Hilbert Transform relatedfunctions can be found in this document and others on the Mesa Software site:http://www.mesasoftware.com/pub/concepts.exeThe basic flow and simplified pseudo code for the computation for the Dominant CyclePeriod is:
Compute the Hilbert Transform{Detrend Price}{Compute InPhase and Quadrature components}
Compute the Period of the Dominant Cycle {Use ArcTangent to compute the current phase}
{Resolve the ArcTangent ambiguity}
{Compute a differential phase, resolve phase wraparound, and limit delta phase
errors}
{Sum DeltaPhases to reach 360 degrees. The sum is the instantaneous period.}
{Resolve Instantaneous Period errors and smooth}
Return the Hilbert Transform Period measured at the current bar
Example
{ This code creates an adaptive moving average. The period of the MA is based on the HTPeriod for the bar }var HTPERIODPANE, DYNSMA, BAR, N: integer;HTPeriodPane := CreatePane( 50, true, true );PlotSeries( HTPeriodSeries( #Average ), HTPeriodPane, 161, #Thick );DrawLabel( 'HTPeriod( Average )', HTPeriodPane );

Technical Indicator Functions 228
© 2003-2006 FMR Corp. All rights reserved.
DynSMA := CreateSeries;for Bar := 40 to BarCount - 1 dobegin n := Round( HTPeriod( Bar, #Average ) ); if n < 2 then n := 2; SetSeriesValue( Bar, DynSMA, SMA( Bar, #Average, n ) );end;PlotSeries( DynSMA, 0, #Navy, #Thick );
{ Example - An alternative method of computing the HT Period using aHomodyne Discriminator can be used which demonstrates differentsensitivity than the Phase Accumulation approach. See ChartScript -MesaPeriodCheck V2, http://www.wealth-lab.com/cgi-bin/WealthLab.DLL/editsystem?id=4805) by ttcrep for a comparison of thetwo waveforms}
{ Example - Here the HTPeriod is used to make the acceleration of aParabolic SAR adaptive. From Parabolic SAR CyclePeriod,http://www.wealth-lab.com/cgi-bin/WealthLab.DLL/editsystem?id=2815, byWillibald. Adapted and declarations and most of script omitted.}
16.33 HTQuadrature
HTQuadrature( Bar: integer; Series: integer ): float;HTQuadratureSeries( Series: integer ): integer;
RChartScripts RSimuScripts RPerfScripts XCMScripts
Description
The Hilbert Transform is a technique used to generate inphase and quadraturecomponents of a de-trended real-valued "analytic-like" signal (such as a Price Series) inorder to analyze variations of the instantaneous phase and amplitude. HTQuadraturereturns the Hilbert Transform generated Quadrature component of the input Price Series.
Interpretation
The Quadrature component is used in conjunction with the InPhase component togenerate the phase of the analytic signal (using the ArcTan function) at a specific bar orfor the entire Price Series.
Calculation
More detailed information concerning the calculation of the Hilbert Transform relatedfunctions can be found in this document and others on the Mesa Software site:http://www.mesasoftware.com/pub/concepts.exeThe basic flow for the computation for the InPhase component is:
Compute the Hilbert Transform{Detrend Price}{Compute InPhase and Quadrature components}
Return the Quadrature component at the current bar of the Hilbert Transform computedat that bar

WealthScript Function Reference, Wealth-Lab Pro™229
© 2003-2006 FMR Corp. All rights reserved.
Example
{ Example - Use HTInPhase and HTQuadrature to compute the Signal-to-Noise Ratio (SNR) for a Price Series }var X1, X2, X4, X3, X5: float;var RANGE, TEMP1, TEMP2, AMPLITUDE, BAR, NPANE: integer;Range := CreateSeries();Temp1 := CreateSeries();Temp2 := CreateSeries();Amplitude := CreateSeries();
FOR Bar := 2 to BarCount - 1 doBEGIN x1 := HTInPhase( Bar, #Average ); x2 := HTQuadrature( Bar, #Average );{Compute "Noise" as average range. x4 = Current Bar range} x4 := 0.1 * (PriceHigh(Bar) - PriceLow(Bar)) + (0.9 *GetSeriesValue(Bar - 1, Range)); SetSeriesValue(Bar, Range, x4);{Compute smoothed signal amplitude - x3 = Current Bar Temp1} x3 := (0.2 * ((x1 * x1) + (x2 * x2))) + (0.8 * GetSeriesValue(Bar - 1,Temp1)); IF x3 < 0.001 THEN x3 := 0.001; SetSeriesValue(Bar, Temp1, x3);{Compute smoothed SNR in dB guarding against divide by zero} IF x4 > 0.0 THEN x5 := 0.25 * ( 10.0 * Log10(x3 / (x4 * x4)) + 1.9 ) + 0.75 *GetSeriesValue(Bar - 1, Temp2); SetSeriesValue(Bar, Temp2, x5); SetSeriesValue(Bar, Amplitude, x5);END;
{Plot SNR in dB}nPane := CreatePane(150, true, true);PlotSeries(Amplitude, nPane, #Red, 0);
16.34 HTSin
HTSin( Bar: integer; Series: integer ): float;HTSinSeries( Series: integer ): integer;
RChartScripts RSimuScripts RPerfScripts XCMScripts
Description
The Hilbert Transform is a technique used to generate inphase and quadraturecomponents of a de-trended real-valued "analytic-like" signal (such as a Price Series) inorder to analyze variations of the instantaneous phase and amplitude.. HTDCPhasereturns the Hilbert Transform Phase of the Dominant Cycle. The Dominant Cycle Phaselies in the range of 0 to 360 degrees. The Hilbert Transform Sine is just the sine of theDC Phase.
Interpretation
The DC Phase at a specific bar gives the phase position from 0 to 360 degrees within thecurrent Hilbert Transform Period instantaneously measured at that bar. The HTSin is thesine of the DC Phase at a specific bar. It is most often used in conjunction with the

Technical Indicator Functions 230
© 2003-2006 FMR Corp. All rights reserved.
HTLeadSin indicator to identify cyclic turning points. Quoting from Market ModeStrategies.doc by John Ehlers from MESA Software, "A clear, unequivocal cycle modeindicator can be generated by plotting the Sine of the measured phase angle advanced by45 degrees. This leading signal crosses the sinewave 1/8th of a cycle BEFORE the peaksand valleys of the cyclic turning points, enabling you to make your trading decision intime to profit from the entire amplitude swing of the cycle. A significant additionaladvantage is that the two indicator lines don't cross except at cyclic turning points,avoiding the false whipsaw signals of most "oscillators" when the market is in a TrendMode. The two lines don't cross because the phase rate of change is nearly zero in atrend mode. Since the phase is not changing, the two lines separated by 45 degrees in
phase never get the opportunity to cross." See the examples.
Calculation
More detailed information concerning the calculation of the Hilbert Transform relatedfunctions can be found in this document and others on the Mesa Software site:http://www.mesasoftware.com/pub/concepts.exe
The basic flow and simplified pseudo code for the computation for the Dominant CyclePhase as part of the computation of the Dominant Cycle is:
Compute the Hilbert Transform{Detrend Price}{Compute InPhase and Quadrature components}
Compute the Period of the Dominant Cycle {Use ArcTangent to compute the current phase}
{Resolve the ArcTangent ambiguity}
{Compute a differential phase, resolve phase wraparound, and limit delta phase
errors}
{Sum DeltaPhases to reach 360 degrees. The sum is the instantaneous period.}
{Resolve Instantaneous Period errors and smooth}
Compute Dominant Cycle PhaseCompute the Sine of the Dominant Cycle PhaseReturn the Sine of the Dominant Cycle Phase at the current bar of the Hilbert TransformPeriod measured at that bar
Example
{ Flag bars where Hilbert Transform Sin/Lead Sin cross }var HTSINPANE, HTSINSer, BAR: integer;HTSINSer := HTSinSeries( #Average );HTSinPane := CreatePane( 100, false, true );PlotSeries( HTSINSer, HTSinPane, 009, #Thin );PlotSeries( HTLeadSinSeries( #Average), HTSinPane, 900, #Thin );for Bar := 2 to BarCount - 1 dobegin if CrossOver( Bar, HTSINSer, HTLeadSinSeries( #Average) ) then SetBarColor( Bar, #Red ) else if CrossUnder( Bar, HTSINSer, HTLeadSinSeries( #Average) ) then SetBarColor( Bar, #Blue );end;

WealthScript Function Reference, Wealth-Lab Pro™231
© 2003-2006 FMR Corp. All rights reserved.
16.35 HTTrendLine
HTTrendLine( Bar: integer; Series: integer ): float;HTTrendLineSeries( Series: integer ): integer;
RChartScripts RSimuScripts RPerfScripts XCMScripts
Description
The Hilbert Transform is a technique used to generate inphase and quadraturecomponents of a de-trended real-valued "analytic-like" signal (such as a Price Series) inorder to analyze variations of the instantaneous phase and amplitude. HTTrendline (orMESA Instantaneous Trendline) returns the Price Series value after the Dominant Cycle ofthe analytic signal as generated by the Hilbert Transform has been removed. TheDominant Cycle can be thought of as being the "most likely" period (in the range of 10 to40) of a sine function of the Price Series.
Interpretation
The HTTrendline at a specific bar gives the current Hilbert Transform Trendline asinstantaneously measured at that bar. In its Series form, the Instantaneous Trendlineappears much like a Moving Average, but with minimal lag compared with the lagnormally associated with such averages for equivalent periods. The HTTrendline isformed by removing the Dominant Cycle from the Price Series. See the examples.
Calculation
More detailed information concerning the calculation of the Hilbert Transform relatedfunctions can be found in this document and others on the Mesa Software site:http://www.mesasoftware.com/pub/concepts.exe. Quoting from MarketModeStrategies.doc, "A simple average taken over the period of the dominant cycle has asmany sample points above the average as below it, with the result that the dominantcycle component is removed at the output of the filter. The filtered residual is the
Instantaneous Trendline." The basic flow and simplified pseudo code for the computation
for the Dominant Cycle Period is:
Compute the Hilbert Transform{Detrend Price}{Compute InPhase and Quadrature components}
Compute the Period of the Dominant Cycle {Use ArcTangent to compute the current phase}
{Resolve the ArcTangent ambiguity}
{Compute a differential phase, resolve phase wraparound, and limit delta phase
errors}
{Sum DeltaPhases to reach 360 degrees. The sum is the instantaneous period.}
{Resolve Instantaneous Period errors and smooth}
Compute the Instantaneous Trendline{Average over the period of the Dominant Cycle at each bar}
Return the Hilbert Transform Trendline measured at the current bar
Example
{ We focus here on the relationship between the Instantaneous Trendlineand a Zero Lag Kalman Filter. Quoting from Tutorial.doc by John Ehlersof MESA Software: "If we use a Zero Lag Kalman Filter, this filter line

Technical Indicator Functions 232
© 2003-2006 FMR Corp. All rights reserved.
will cross the Instantaneous Trendline every half cycle when the marketis in a Cycle Mode. If the Zero Lag Kalman filter fails to cross theInstantaneous Trendline within the last half cycle period, then this isanother way of declaring a Trend Mode is in force. The Trend Mode endswhen the Zero Lag Kalman Filter line again crosses the InstantaneousTrendline." }var PERIODPANE: integer;PlotSeries( HTTrendLineSeries( #Average ), 0, 732, #Thick );PlotSeries( KalmanSeries( #Average ), 0, 000, #Dotted );PeriodPane := CreatePane(80, true, true);PlotSeries(HTPeriodSeries( #Average ), PeriodPane, #Red, #Thick );
16.36 HV
HV( Bar: integer; Series: integer; Period: integer; Span: integer ): float;HVSeries( Series: integer; Period: integer; Span: integer ): integer;
RChartScripts RSimuScripts RPerfScripts XCMScripts
Description
Returns the Historical Volatility of the selected Price Series. Historical Volatility is thestandard deviation of the logarithm of the price ratio, i.e.
HV = Standard Deviation (ln(Price(Bar) / Price(Bar-1)))
Series Specifies which Price Series to use, for example #Close, #Average, etc.Series can also be a technical indicator series, or a Price Series created withinthe script.
Period e.g. 20, specifies how many bars HV shall use. The real number of periodsthat HV will use is Period - 1, because if for example you use 20 price bars,there are 19 periods in between and 19 returns.
Span Used to convert the historical volatility to a different time scale. If the Charthas weekly bars and annualized historical volatility is required, use 52 forSpan because there are 52 weeks in a year.
Interpretation
A sharp increase in HV will alert you to unusual volatility in the markets. This is often anideal time to monitor the market for entry in the opposite direction of the panic.
Calculation
HV = Sqrt( SSD / ( Period - 1 ) ) * Sqrt( Span )
where,
SSD = Sum[( LOGSi - ALOGS )²] over Period bars
LOGSi = Logarithm of Price - Previous PriceALOGS = Sum( Logarithms of Price Change over Span ) / Span
Example
var Bar: integer;var HVPane: integer;

WealthScript Function Reference, Wealth-Lab Pro™233
© 2003-2006 FMR Corp. All rights reserved.
HVPane := CreatePane( 75, true, true );var HV1: integer;HV1 := HVSeries( #Average, 20, 262 );PlotSeriesLabel( HV1, HVPane, 905, #Thick, 'HV1=HV(#Average,20,262)' );InstallProfitTarget( 15 );InstallStopLoss( 40 );for Bar := 262 to BarCount - 1 dobegin if not LastPositionActive then begin if @HV1[Bar] > 100 then begin if ROC( Bar, #Close, 30 ) > 0 then ShortAtMarket( Bar + 1, '' ) else BuyAtMarket( Bar + 1, '' ); end; end else ApplyAutoStops( Bar );end;
16.37 Kalman
Kalman( Bar: integer; Series: integer ): float;KalmanSeries( Series: integer ): integer;
RChartScripts RSimuScripts RPerfScripts XCMScripts
Description
The Kalman Filter is based on the concept of optimum estimation, first introduced by Dr.R. E. Kalman in 1960. It has generally been used in terrestrial and space-basednavigation and tracking systems. In general, it can be thought of as generating anoptimal (in a linear, white noise, mean-square-error sense) estimate of a future positionbased on the current position of a target and an estimate of its velocity and accelerationand their uncertainties.
Interpretation
Where Price Series are involved as in trading systems the mathematics can be simplifiedconsiderably and a (nearly) zero lag filter produced very straightforwardly. For furtherinformation see: Optimal Tracking Filters.doc by John Ehlers of MESA Software, here:http://www.mesasoftware.com/pub/TRACKINGFILTERS.EXE. Note that Kalman filterscan be applied to any Price Series, not just ticker prices. See Examples.
Calculation
The basic pseudo computation for the Kalman Filter value at a specific bar for a PriceSeries is:
ZeroLagValue at Bar = Weight1 * PriceSeriesValue at Bar + Weight2(PriceSeriesValue at Bar - PriceSeriesValue at Bar -3)
ZeroLagValue at Bar = ZeroLagValue at Bar + Weight3 * LastZeroLagValue
LastZeroLagValue = ZeroLagValue at Bar
Technical Indicator Functions 234
© 2003-2006 FMR Corp. All rights reserved.
Save KalmanSeriesValue at Bar = ZeroLagValue at Bar
Return KalmanSeriesValue at Bar
Example
{ This system uses the Kalman Filter as a signal line for the CMO Oscillator to time position entries }var CMOPANE, BAR, hCMO: integer;hCMO := CMOSeries( #Average, 14 );CMOPane := CreatePane( 80, true, true );PlotSeries( hCMO, CMOPane, 009, #Thick );PlotSeries( KalmanSeries( hCMO ), CMOPane, #Black, #Thin );for Bar := 14 to BarCount - 1 dobegin if LastPositionActive then begin if CrossOverValue( Bar, hCMO, 0 ) then SellAtMarket( Bar + 1, LastPosition, 'CMO 0' ); end else begin if CMO( Bar - 1, #Average, 14 ) < -50 then if CrossOver( Bar, hCMO, KalmanSeries( hCMO ) ) then BuyAtMarket( Bar + 1, 'CMO Kalman' ); end;end;
16.38 KAMA
KAMA( Bar: integer; Series: integer; Period: integer ): float;KAMASeries( Series: integer; Period: integer ): integer;
RChartScripts RSimuScripts RPerfScripts XCMScripts
Description
Returns Kaufman's Adaptive Moving Average for the Price Series specified in the Seriesparameter. KAMA is an adaptive moving average, and uses the noise level of the marketto determine the length of the trend required to calculate the average. The more noise inthe market, the slower the trend used to calculate the average. The Period parametercontrol how much data is used by KAMA to calculate its efficiency ratio (signal/noise). Avalue of 8 to 10 is recommended.
Interpretation
· You can base trading signals on whether KAMA turns down or up, indicating apotential trend reversal. Kaufman suggests using a small band around the KAMAindicator as a way to filter out whipsaws.
· Since KAMA is a type of moving average, you can use the same interpretationtechniques used for Simple Moving Averages (SMA).
Calculation
{ The WealthScript code below duplicates the KAMA indicator calculation:}var AMA, SIGNAL, DIFF, NOISE, EFRATIO, SMOOTH: float;var MYKAMA, BAR, J, Period: integer;
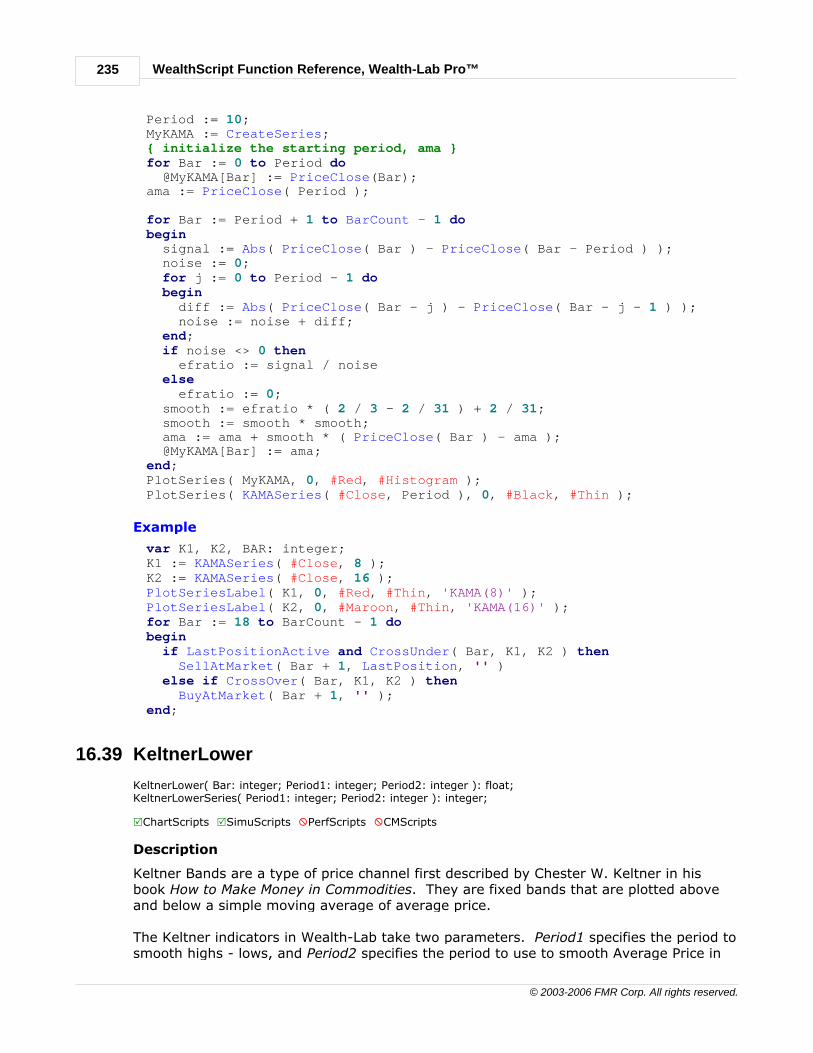
WealthScript Function Reference, Wealth-Lab Pro™235
© 2003-2006 FMR Corp. All rights reserved.
Period := 10;MyKAMA := CreateSeries;{ initialize the starting period, ama }for Bar := 0 to Period do @MyKAMA[Bar] := PriceClose(Bar);ama := PriceClose( Period );
for Bar := Period + 1 to BarCount - 1 dobegin signal := Abs( PriceClose( Bar ) - PriceClose( Bar - Period ) ); noise := 0; for j := 0 to Period - 1 do begin diff := Abs( PriceClose( Bar - j ) - PriceClose( Bar - j - 1 ) ); noise := noise + diff; end; if noise <> 0 then efratio := signal / noise else efratio := 0; smooth := efratio * ( 2 / 3 - 2 / 31 ) + 2 / 31; smooth := smooth * smooth; ama := ama + smooth * ( PriceClose( Bar ) - ama ); @MyKAMA[Bar] := ama;end;PlotSeries( MyKAMA, 0, #Red, #Histogram );PlotSeries( KAMASeries( #Close, Period ), 0, #Black, #Thin );
Example
var K1, K2, BAR: integer;K1 := KAMASeries( #Close, 8 );K2 := KAMASeries( #Close, 16 );PlotSeriesLabel( K1, 0, #Red, #Thin, 'KAMA(8)' );PlotSeriesLabel( K2, 0, #Maroon, #Thin, 'KAMA(16)' );for Bar := 18 to BarCount - 1 dobegin if LastPositionActive and CrossUnder( Bar, K1, K2 ) then SellAtMarket( Bar + 1, LastPosition, '' ) else if CrossOver( Bar, K1, K2 ) then BuyAtMarket( Bar + 1, '' );end;
16.39 KeltnerLower
KeltnerLower( Bar: integer; Period1: integer; Period2: integer ): float;KeltnerLowerSeries( Period1: integer; Period2: integer ): integer;
RChartScripts RSimuScripts XPerfScripts XCMScripts
Description
Keltner Bands are a type of price channel first described by Chester W. Keltner in hisbook How to Make Money in Commodities. They are fixed bands that are plotted aboveand below a simple moving average of average price.
The Keltner indicators in Wealth-Lab take two parameters. Period1 specifies the period tosmooth highs - lows, and Period2 specifies the period to use to smooth Average Price in
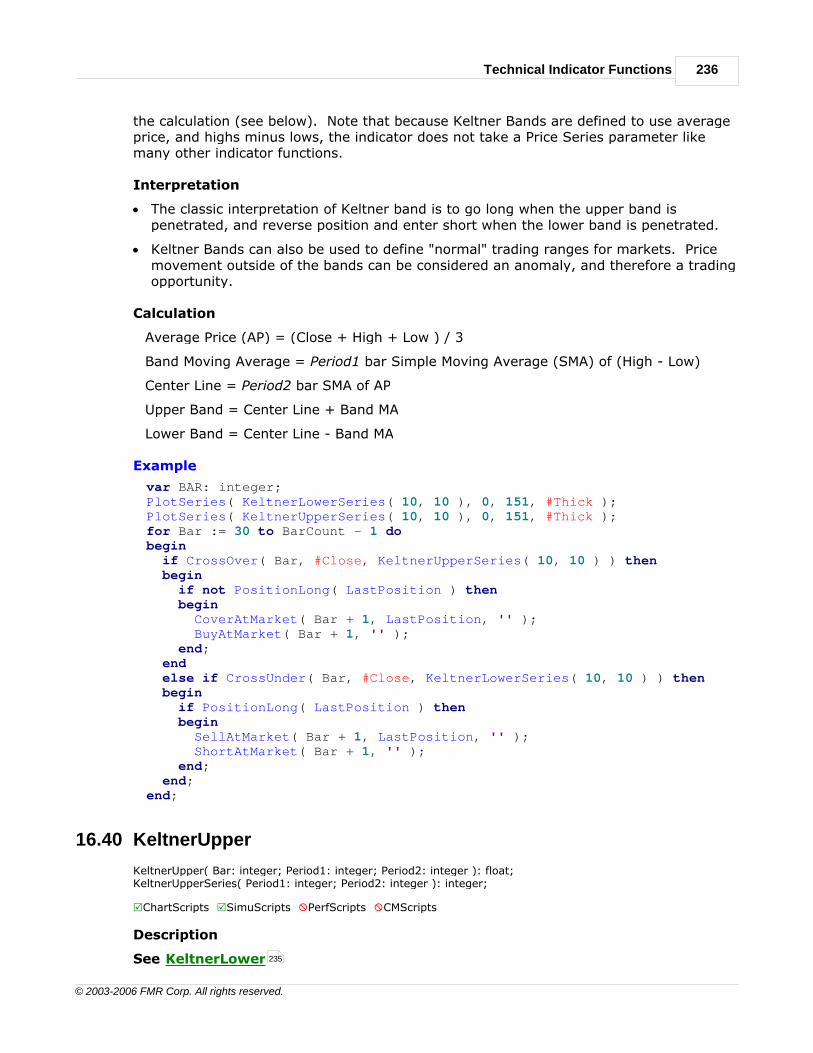
Technical Indicator Functions 236
© 2003-2006 FMR Corp. All rights reserved.
the calculation (see below). Note that because Keltner Bands are defined to use averageprice, and highs minus lows, the indicator does not take a Price Series parameter likemany other indicator functions.
Interpretation
· The classic interpretation of Keltner band is to go long when the upper band ispenetrated, and reverse position and enter short when the lower band is penetrated.
· Keltner Bands can also be used to define "normal" trading ranges for markets. Pricemovement outside of the bands can be considered an anomaly, and therefore a tradingopportunity.
Calculation
Average Price (AP) = (Close + High + Low ) / 3
Band Moving Average = Period1 bar Simple Moving Average (SMA) of (High - Low)
Center Line = Period2 bar SMA of AP
Upper Band = Center Line + Band MA
Lower Band = Center Line - Band MA
Example
var BAR: integer;PlotSeries( KeltnerLowerSeries( 10, 10 ), 0, 151, #Thick );PlotSeries( KeltnerUpperSeries( 10, 10 ), 0, 151, #Thick );for Bar := 30 to BarCount - 1 dobegin if CrossOver( Bar, #Close, KeltnerUpperSeries( 10, 10 ) ) then begin if not PositionLong( LastPosition ) then begin CoverAtMarket( Bar + 1, LastPosition, '' ); BuyAtMarket( Bar + 1, '' ); end; end else if CrossUnder( Bar, #Close, KeltnerLowerSeries( 10, 10 ) ) then begin if PositionLong( LastPosition ) then begin SellAtMarket( Bar + 1, LastPosition, '' ); ShortAtMarket( Bar + 1, '' ); end; end;end;
16.40 KeltnerUpper
KeltnerUpper( Bar: integer; Period1: integer; Period2: integer ): float;KeltnerUpperSeries( Period1: integer; Period2: integer ): integer;
RChartScripts RSimuScripts XPerfScripts XCMScripts
Description
See KeltnerLower 235

WealthScript Function Reference, Wealth-Lab Pro™237
© 2003-2006 FMR Corp. All rights reserved.
16.41 LinearReg
LinearReg( Bar: integer; Series: integer; Period: integer ): float;LinearRegSeries( Series: integer; Period: integer ): integer;
RChartScripts RSimuScripts RPerfScripts XCMScripts
Description
Returns the Linear Regression value for the specified Series and Period. LinearReggathers the prices for the number of specified periods and finds a straight line (seeLinearRegLine) which best fits all the prices using a linear regression model. Theprocedure is reinitialized and repeated for each bar in the Price Series. Since a new valueis calculated at each Bar, the result is not a straight linear regression trendline; rather, itis an indicator which loosely tracks the price action.
LinearReg is a statistical indicator. Other indicators in the same class areLinearRegSlope, StdErr, RSquared and StdDev.
Interpretation
· Since the Linear Regression indicator displays the statistically-predicted price value,you can look for cases where price veers sharply from the predicted value. UseRSquared to determine significant weakness in the trend and if due for a return to thepredicted value.
Calculation
Linear Regression is a rather complex statistical calculation. It uses the least squaremethod to fit a trendline to the data by minimizing the distance between the price andthe Linear Regression trendline. LinearReg returns the final value of theLinearRegLine, recalculated for each bar over the regression Period to completeindicator.
Example
{ Report on how far closing prices are away from predicted value }var S: string;var DIFF: float;var BAR: integer;PlotSeries( LinearRegSeries( #Close, 20 ), 0, 002, #Thick );Bar := BarCount - 1;Diff := PriceClose( Bar ) - LinearReg( Bar, #Close, 20 );Diff := Diff / PriceClose( Bar ) * 100;if Diff > 0 then s := 'Price closed above 'else s := 'Price closed below ';Diff := Abs( Diff );s := s + 'the Regression Line by ' + FormatFloat( '#0.00%', Diff );DrawLabel( s, 0 );
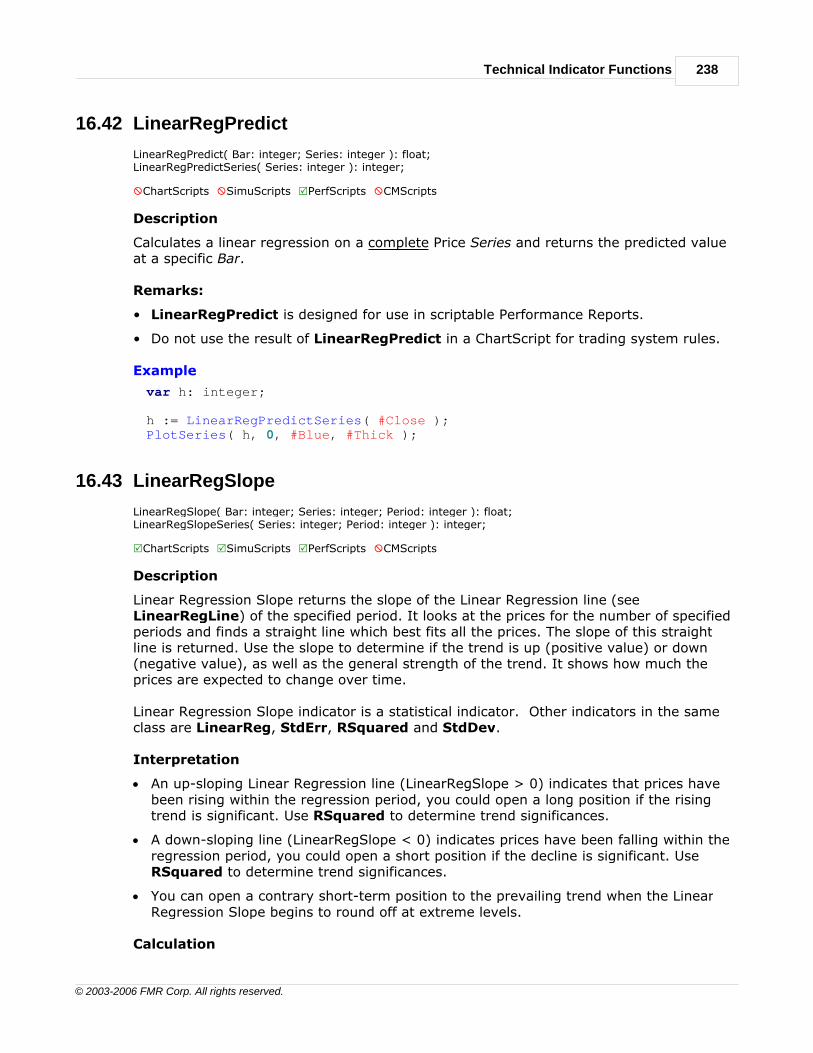
Technical Indicator Functions 238
© 2003-2006 FMR Corp. All rights reserved.
16.42 LinearRegPredict
LinearRegPredict( Bar: integer; Series: integer ): float;LinearRegPredictSeries( Series: integer ): integer;
XChartScripts XSimuScripts RPerfScripts XCMScripts
Description
Calculates a linear regression on a complete Price Series and returns the predicted valueat a specific Bar.
Remarks:
• LinearRegPredict is designed for use in scriptable Performance Reports.
• Do not use the result of LinearRegPredict in a ChartScript for trading system rules.
Example
var h: integer;
h := LinearRegPredictSeries( #Close );PlotSeries( h, 0, #Blue, #Thick );
16.43 LinearRegSlope
LinearRegSlope( Bar: integer; Series: integer; Period: integer ): float;LinearRegSlopeSeries( Series: integer; Period: integer ): integer;
RChartScripts RSimuScripts RPerfScripts XCMScripts
Description
Linear Regression Slope returns the slope of the Linear Regression line (seeLinearRegLine) of the specified period. It looks at the prices for the number of specifiedperiods and finds a straight line which best fits all the prices. The slope of this straightline is returned. Use the slope to determine if the trend is up (positive value) or down(negative value), as well as the general strength of the trend. It shows how much theprices are expected to change over time.
Linear Regression Slope indicator is a statistical indicator. Other indicators in the sameclass are LinearReg, StdErr, RSquared and StdDev.
Interpretation
· An up-sloping Linear Regression line (LinearRegSlope > 0) indicates that prices havebeen rising within the regression period, you could open a long position if the risingtrend is significant. Use RSquared to determine trend significances.
· A down-sloping line (LinearRegSlope < 0) indicates prices have been falling within theregression period, you could open a short position if the decline is significant. UseRSquared to determine trend significances.
· You can open a contrary short-term position to the prevailing trend when the LinearRegression Slope begins to round off at extreme levels.
Calculation

WealthScript Function Reference, Wealth-Lab Pro™239
© 2003-2006 FMR Corp. All rights reserved.
Linear Regression is a rather complex statistical calculation. It uses the least squaremethod to fit a trendline to the data by minimizing the distance between the price andthe Linear Regression trendline. The slope of this Linear Regression trendline (given byLinearRegLine) is the value return by the LinearRegSlope indicator.
Example
{ Minor up and down trends highlighted by confirmation of 2 linearregression lines }var Bar: integer;var LinRegSlopePane: integer;LinRegSlopePane := CreatePane( 100, true, true );PlotSeries( LinearRegSlopeSeries( #Close, 20 ), LinRegSlopePane, 205,#Thin );DrawLabel( 'LinearRegSlope( Close, 20 )', LinRegSlopePane );PlotSeries( LinearRegSlopeSeries( #Close, 10 ), LinRegSlopePane, 509,#Thin );DrawLabel( 'LinearRegSlope( Close, 10 )', LinRegSlopePane );for Bar := 20 to BarCount - 1 dobegin if LinearRegSlope( Bar, #Close, 20 ) > 0 then if LinearRegSlope( Bar, #Close, 10 ) > 0 then SetBarColor( Bar, #Blue ); if LinearRegSlope( Bar, #Close, 20 ) < 0 then if LinearRegSlope( Bar, #Close, 10 ) < 0 then SetBarColor( Bar, #Red );end;
16.44 Lowest
Lowest( Bar: integer; Series: integer; Period: integer ): float;LowestSeries( Series: integer; Period: integer ): integer;
RChartScripts RSimuScripts RPerfScripts XCMScripts
Description
Returns the lowest value of a Price Series within the specified look back Period.
See Highest for more information.
Calculation
Looks back the specified number of periods from the specified Bar and returns the lowestprice within that Period.
Example
{ Plot the most recent 40 bar low as dots on the chart }PlotSeries( LowestSeries( #Low, 40 ), 0, #Maroon, #Dots );DrawLabel( 'Lowest( Low, 40 )', 0 );
221

Technical Indicator Functions 240
© 2003-2006 FMR Corp. All rights reserved.
16.45 LowestBar
LowestBar( Bar: integer; Series: integer; Period: integer ): integer;LowestBarSeries( Series: integer; Period: integer ): integer;
RChartScripts RSimuScripts RPerfScripts XCMScripts
Description
Returns the bar in which lowest value of the Price Series for the specified Period wasrecorded.
See Highest for more information.
Remarks
• If more than one bar has precisely the same Lowest value, then LowestBar returnsthe most recent bar, i.e., the bar with the latest date/time.
Calculation
Looks back the specified number of periods from the specified Bar and returns the Barnumber with lowest price within that Period.
Example
{ Color areas of the chart where the 200 day low has occurred within thepast 20 bars }var N: float;var BAR: integer;for Bar := 200 to BarCount - 1 dobegin n := LowestBar( Bar, #Low, 200 ); if Bar - n <= 20 then SetBackgroundColor( Bar, #RedBkg );end;
16.46 MACD
MACD( Bar: integer; Series: integer ): float;MACDSeries( Series: integer ): integer;
RChartScripts RSimuScripts RPerfScripts XCMScripts
Description
MACD returns the Moving Average Convergence Divergence indicator. MACD is amomentum oscillator, yet its primary use is to trade trends. Although it is an oscillator isnot used as an over brought or oversold indicator. It appears on the chart as two lineswhich oscillates without boundaries. The crossover of the two lines give trading signalssimilar to a two moving average system.
The two lines are called, MACD Line or fast line and MACD Signal or slow line. The MACDline is displayed as a solid line on the chart, and the MACD signal line is displayed as adashed line on the chart.
Interpretation
221
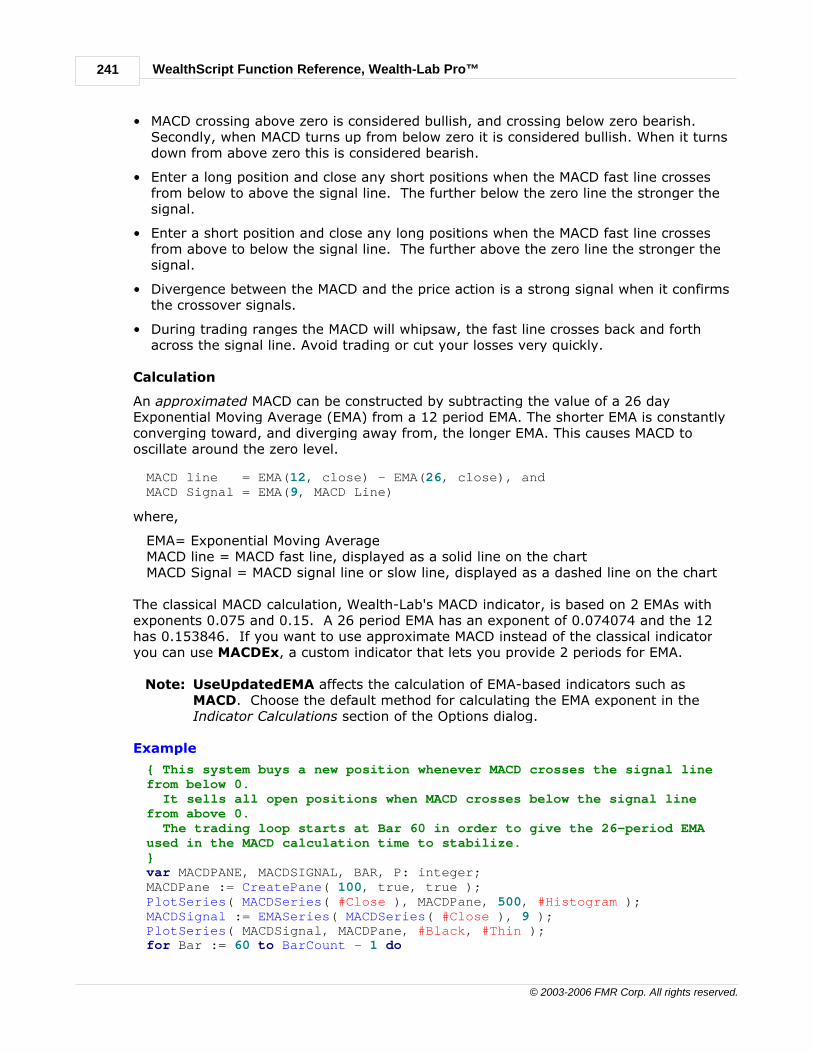
WealthScript Function Reference, Wealth-Lab Pro™241
© 2003-2006 FMR Corp. All rights reserved.
• MACD crossing above zero is considered bullish, and crossing below zero bearish.Secondly, when MACD turns up from below zero it is considered bullish. When it turnsdown from above zero this is considered bearish.
• Enter a long position and close any short positions when the MACD fast line crossesfrom below to above the signal line. The further below the zero line the stronger thesignal.
• Enter a short position and close any long positions when the MACD fast line crossesfrom above to below the signal line. The further above the zero line the stronger thesignal.
• Divergence between the MACD and the price action is a strong signal when it confirmsthe crossover signals.
• During trading ranges the MACD will whipsaw, the fast line crosses back and forthacross the signal line. Avoid trading or cut your losses very quickly.
Calculation
An approximated MACD can be constructed by subtracting the value of a 26 dayExponential Moving Average (EMA) from a 12 period EMA. The shorter EMA is constantlyconverging toward, and diverging away from, the longer EMA. This causes MACD tooscillate around the zero level.
MACD line = EMA(12, close) - EMA(26, close), andMACD Signal = EMA(9, MACD Line)
where,
EMA= Exponential Moving AverageMACD line = MACD fast line, displayed as a solid line on the chartMACD Signal = MACD signal line or slow line, displayed as a dashed line on the chart
The classical MACD calculation, Wealth-Lab's MACD indicator, is based on 2 EMAs withexponents 0.075 and 0.15. A 26 period EMA has an exponent of 0.074074 and the 12has 0.153846. If you want to use approximate MACD instead of the classical indicatoryou can use MACDEx, a custom indicator that lets you provide 2 periods for EMA.
Note: UseUpdatedEMA affects the calculation of EMA-based indicators such asMACD. Choose the default method for calculating the EMA exponent in theIndicator Calculations section of the Options dialog.
Example
{ This system buys a new position whenever MACD crosses the signal linefrom below 0. It sells all open positions when MACD crosses below the signal linefrom above 0. The trading loop starts at Bar 60 in order to give the 26-period EMAused in the MACD calculation time to stabilize.}var MACDPANE, MACDSIGNAL, BAR, P: integer;MACDPane := CreatePane( 100, true, true );PlotSeries( MACDSeries( #Close ), MACDPane, 500, #Histogram );MACDSignal := EMASeries( MACDSeries( #Close ), 9 );PlotSeries( MACDSignal, MACDPane, #Black, #Thin );for Bar := 60 to BarCount - 1 do

Technical Indicator Functions 242
© 2003-2006 FMR Corp. All rights reserved.
begin if CrossOver( Bar, MACDSeries( #Close ), MACDSignal ) then if MACD( Bar, #Close ) < 0 then BuyAtMarket( Bar + 1, ''); if CrossUnder( Bar, MACDSeries( #Close ), MACDSignal ) then if MACD( Bar, #Close ) > 0 then SellAtMarket( Bar + 1, #All, 'MACD' );end;
16.47 MAMA
MAMA( Bar: integer; Series: integer; FastLimit: float; SlowLimit: float ): float;MAMASeries( Series: integer; FastLimit: float; SlowLimit: float ): integer;
RChartScripts RSimuScripts RPerfScripts XCMScripts
Description
MAMA stands for MESA Adaptive Moving Average. It was developed by John Ehlers ofMesa Software, and presented in the September 2001 issue of Stocks & Commoditiesmagazine. MAMA is an adaptive exponential moving average. The EMA's alpha (a) isrelated to the phase rate of change (the degree to which the phase of the market cyclechanges from bar to bar).
In addition to Price Series, MAMA accepts two additional parameters, FastLimit andSlowLimit. These control the maximum and minimum alpha (a) value that should beapplied to the most recent bar of data when calculating MAMA.
You can learn more about the Mesa Adaptive Moving Average at thewww.mesasoftware.com web site.
Interpretation
• MAMA is a type of moving average. You can use the it in place of any other movingaverage, and apply the same interpretations, such as price crossovers, crossovers ofshort and long period averages, etc. MAMA crossovers typically exhibit fewerwhipsaws than traditionally moving averages.
• MAMA is also used in conjunction with its complimentary FAMA indicator. Tradingsignals occur when MAMA crosses over and under FAMA.
Calculation
MAMA = alpha * Price + ( 1 - alpha ) * Previous MAMA value
This is a typical exponential moving average calculation. The difference is that the alphavalue changes bar by bar, and is based on the following formula:
Alpha = FastLimit / DeltaPhase
DeltaPhase is the rate of change of the Hilbert Transform homodyne discriminator. Thealpha value is kept within the range of FastLimit and SlowLimit.
Example
var Bar, hMA, hFA: integer;hMA := MAMASeries( #Close, 0.5, 0.05 );

WealthScript Function Reference, Wealth-Lab Pro™243
© 2003-2006 FMR Corp. All rights reserved.
hFA := FAMASeries( #Close, 0.5, 0.05 );PlotSeries( hMA, 0, #Red, #Thin );PlotSeries( hFA, 0, #Blue, #Thin );for Bar := 40 to BarCount - 1 dobegin if CrossOver( Bar, hMA, hFA ) then BuyAtMarket( Bar + 1, '' ) else if CrossOver( Bar, hFA, hMA ) then SellAtMarket( Bar + 1, LastPosition, '' );end;
16.48 Median
Median( Bar: integer; Series: integer; Period: integer ): float;MedianSeries( Series: integer; Period: integer ): integer;
RChartScripts RSimuScripts RPerfScripts XCMScripts
Description
Median returns the Median value of a Series based on the specified Period. Median sortsthe values and returns the value occupying the "middle" slot of the group. When there isan odd number of values, the median is simply the middle value. For example, themedian of 2, 4, and 7 is 4. When there is an even number of values, the median is theaverage of the two middle numbers. Thus, the median of the numbers 2, 4, 7, 12 is(4+7)/2 = 5.5.
Example
var Bar, hMedFast, hMedSlow: integer;hMedFast := MedianSeries( #Close, 13 );hMedSlow := MedianSeries( #Close, 25 );PlotSeries( hMedFast, 0, 520, #Thick );DrawLabel( 'Median(Close,13)', 0 );PlotSeries( hMedSlow, 0, 200, #Thick );DrawLabel( 'Median(Close,25)', 0 );for Bar := 25 to BarCount - 1 dobegin if CrossOver( Bar, hMedFast, hMedSlow ) then BuyAtMarket( Bar + 1, '' ) else if CrossUnder( Bar, hMedFast, hMedSlow ) then SellAtMarket( Bar + 1, LastPosition, '' );end;
16.49 MFI
MFI( Bar: integer; Period: integer ): float;MFISeries( Period: integer ): integer;
RChartScripts RSimuScripts XPerfScripts XCMScripts
Description
Money Flow Index measures the flow of money into and out of a security over thespecified Period. Its calculation is similar to that of the Relative Strength Index (RSI), buttakes volume into account in its calculation. The indicator is calculated by accumulatingpositive and negative Money Flow values (see Money Flow indicator), then creating a

Technical Indicator Functions 244
© 2003-2006 FMR Corp. All rights reserved.
Money Ratio. The Money Ratio is then normalized into the MFI oscillator form.
Interpretation
• Look for oversold levels below 20 and overbought levels above 80. These normallyoccur before the underlying price chart forms a top or a bottom. Levels may changedepending on market conditions. Ensure that the level lines cut across the highestpeaks and the lowest troughs. During strong trends the MFI may remain in overboughtor oversold for extended periods.
• If underlying price makes a new high or low that isn't confirmed by the MFI, thisdivergence can signal a price reversal. MFI divergences from price indicates verystrong buy or sell signal.
• The mid point level of 50 will often act as support or resistance if the FMI bounce offthe 50 level. Crosses of the 50 level can be used as a buying or selling signal. WhenMFI cross above then buy, when FMI crosses below then sell.
Calculation
The follow steps are used to calculate Money Flow Index. See MoneyFlow Indicator foran excellent example script showing the construction of the MFI.
Average Price = #AverageC = ( High + Low + Close ) / 3Money Flow = Volume x Average Price
Money Flow direction: if today's average price is greater than yesterday's, then it isconsidered positive money flow, otherwise it is negative money flow.
Positive Money Flow = Sum all the Positive Money Flows day over specified periods.Negative Money Flow = Sum all the Negative Money Flows day over specified periods.Money Ratio = Sum of Positive Money Flow / Sum of Negative Money Flow
Money Flow Index (MFI) = 100 - ( 100 / ( 1 + Money Ratio ) )
Example
{ The trading system below buys a position whenever MFI crosses below 20. It sells all open positions as soon as MFI crosses above 80. The ChartScript also colors MFI bars red and green to show oversold/overbought levels. }
var MFIPANE, MFISer, BAR, P: integer;MFISer := MFISeries( 14 );MFIPane := CreatePane( 100, true, true );PlotSeries( MFISer, MFIPane, #Black, #Thick );DrawLabel( 'MFISer = MFI( 14 )', MFIPane );for Bar := 14 to BarCount - 1 dobegin if CrossUnderValue( Bar, MFISer, 20 ) then BuyAtMarket( Bar + 1, ''); if CrossOverValue( Bar, MFISer, 80 ) then for P := 0 to PositionCount - 1 do if PositionActive( P ) then SellAtMarket( Bar + 1, P, 'MFI' ); if MFI( Bar, 14 ) < 20 then SetSeriesBarColor( Bar, MFISer, #Red ); if MFI( Bar, 14 ) > 80 then

WealthScript Function Reference, Wealth-Lab Pro™245
© 2003-2006 FMR Corp. All rights reserved.
SetSeriesBarColor( Bar, MFISer, #Green );end;
16.50 Momentum
Momentum( Bar: integer; Series: integer; Period: integer ): float;MomentumSeries( Series: integer; Period: integer ): integer;
RChartScripts RSimuScripts RPerfScripts XCMScripts
Description
Momentum is the difference between current price and the price a specified number ofbars ago, Period. The momentum indicators shows the speed at which price changesfrom one period to another. It give a excellent indication of the market participantscommitment to the current trend. When the momentum begins to slow or turn, itindicates diminishing commitment and a loss of momentum. This indicator is a leading orcoincidental indicator. A momentum value above zero indicates that prices are movingup, and below zero moving down.
The momentum indicator has overbought and oversold zones. These zones are defined bylines that are placed so the Momentum indicator spends about 5% of its time within thezones. The lines should be adjust according to market conditions.
Interpretation
• In ranging markets, go long when the indicator falls below the oversold line then risesback above the oversold line.
• In ranging markets, go short when indicator rises above the overbought line the fallsback below the overbought line.
• In ranging markets, go long on bullish divergences, if the indicator's first trough is inthe oversold zone.
• In ranging markets, go short on bearish divergences, if the indicator's first peak is inthe overbought zone.
• An uptrend can be confirmed using a trend following indicator. Go long when themomentum indicator turns up from below the center line. Exit using the trendfollowing indicator. Divergences of the momentum and price in during the trend can bemisleading.
• A downtrend can be confirmed using a trend following indicator. Go short when theindicator turns down from above the center line. Exit using the trend followingindicator. Divergences of the momentum and price in during the trend can bemisleading.
Calculation
Momentum = (Price today) - (Price n periods ago)
Typically, the closing Price Series, #Close, is used.
Example
{ This ChartScript plots absolute momentum, and calculates momentum as apercentage of current price. }

Technical Indicator Functions 246
© 2003-2006 FMR Corp. All rights reserved.
var MOMPANE, MOMPCTPANE, MOMPCT: integer;MomPane := CreatePane( 100, true, true );MomPctPane := CreatePane( 100, true, true );PlotSeries( MomentumSeries( #Close, 30 ), MomPane, 202, #ThickHist );DrawLabel( 'Standard Momentum', MomPane );MomPct := DivideSeries( MomentumSeries( #Close, 30 ), #Close );MomPct := MultiplySeriesValue( MomPct, 100 );PlotSeries( MomPct, MomPctPane, 022, #ThickHist );DrawLabel( 'Percentage Momentum', MomPctPane );
16.51 MomentumPct
MomentumPct( Bar: integer; Series: integer; Period: integer ): float;MomentumPctSeries( Series: integer; Period: integer ): integer;
RChartScripts RSimuScripts RPerfScripts XCMScripts
Description
MomentumPct is the current price divided by the price of a previous Period. Further,the quotient is multiplied by 100. The result is an indicator that oscillates around 100.Values less than 100 indicate negative momentum, or decreasing price, and vice versa.
Interpretation
• MomentumPct can be interpreted in a similar way as the standard Momentumindicator. However, MomentumPct has the additional advantage of indicating theamount of commitment to the current trend in a consistent manner over a broad rangeof prices. For example, assume that ABC is priced at 60 and XYZ is quoted at 20.After X Periods, ABC is now 62 and XYZ is 22. Though Momentum is the same (2.0)for both issues, MomentumPct is 103.33 and 110.0, respectively, indicating that theprice movement is more significant for the lower-priced security, i.e., 10% vs. 3.33%.
• Subtract a constant 100 from MomentumPct to yield the absolute percentage changeover the specified Period to yield the same result as the ROC indicator.
Calculation
MomentumPct = 100 * (Current Price) / (Price n periods ago)
Example
{ Duplicate the MomentumPctSeries calculation }var Bar, Period, hTmp, hMomPct, MomPctPane: integer;Period := 20;MomPctPane := CreatePane( 100, true, true );hTmp := OffsetSeries( #Close, -Period );hMomPct := MultiplySeriesValue( DivideSeries( #Close, hTmp ), 100 );PlotSeries( hMomPct, MomPctPane, #Red, #Thick );PlotSeries( MomentumPctSeries( #Close, Period ), MomPctPane, #Black,#Thin );
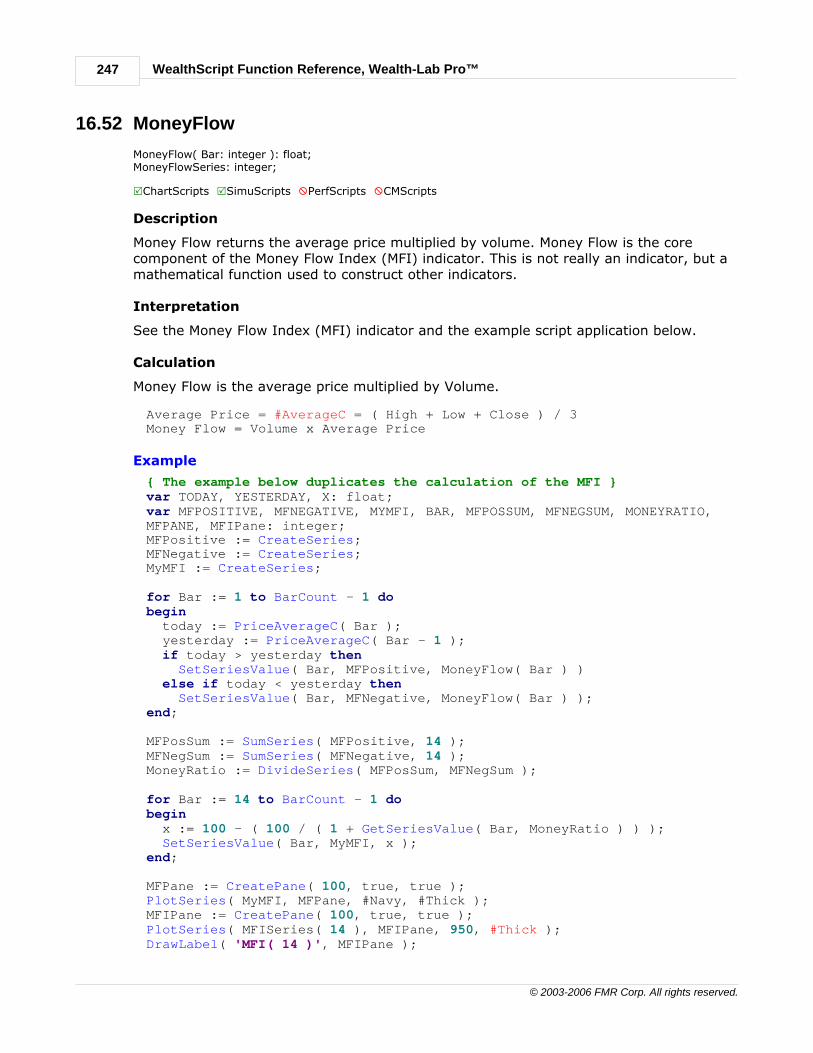
WealthScript Function Reference, Wealth-Lab Pro™247
© 2003-2006 FMR Corp. All rights reserved.
16.52 MoneyFlow
MoneyFlow( Bar: integer ): float;MoneyFlowSeries: integer;
RChartScripts RSimuScripts XPerfScripts XCMScripts
Description
Money Flow returns the average price multiplied by volume. Money Flow is the corecomponent of the Money Flow Index (MFI) indicator. This is not really an indicator, but amathematical function used to construct other indicators.
Interpretation
See the Money Flow Index (MFI) indicator and the example script application below.
Calculation
Money Flow is the average price multiplied by Volume.
Average Price = #AverageC = ( High + Low + Close ) / 3Money Flow = Volume x Average Price
Example
{ The example below duplicates the calculation of the MFI }var TODAY, YESTERDAY, X: float;var MFPOSITIVE, MFNEGATIVE, MYMFI, BAR, MFPOSSUM, MFNEGSUM, MONEYRATIO,MFPANE, MFIPane: integer;MFPositive := CreateSeries;MFNegative := CreateSeries;MyMFI := CreateSeries;
for Bar := 1 to BarCount - 1 dobegin today := PriceAverageC( Bar ); yesterday := PriceAverageC( Bar - 1 ); if today > yesterday then SetSeriesValue( Bar, MFPositive, MoneyFlow( Bar ) ) else if today < yesterday then SetSeriesValue( Bar, MFNegative, MoneyFlow( Bar ) );end;
MFPosSum := SumSeries( MFPositive, 14 );MFNegSum := SumSeries( MFNegative, 14 );MoneyRatio := DivideSeries( MFPosSum, MFNegSum );
for Bar := 14 to BarCount - 1 dobegin x := 100 - ( 100 / ( 1 + GetSeriesValue( Bar, MoneyRatio ) ) ); SetSeriesValue( Bar, MyMFI, x );end;
MFPane := CreatePane( 100, true, true );PlotSeries( MyMFI, MFPane, #Navy, #Thick );MFIPane := CreatePane( 100, true, true );PlotSeries( MFISeries( 14 ), MFIPane, 950, #Thick );DrawLabel( 'MFI( 14 )', MFIPane );
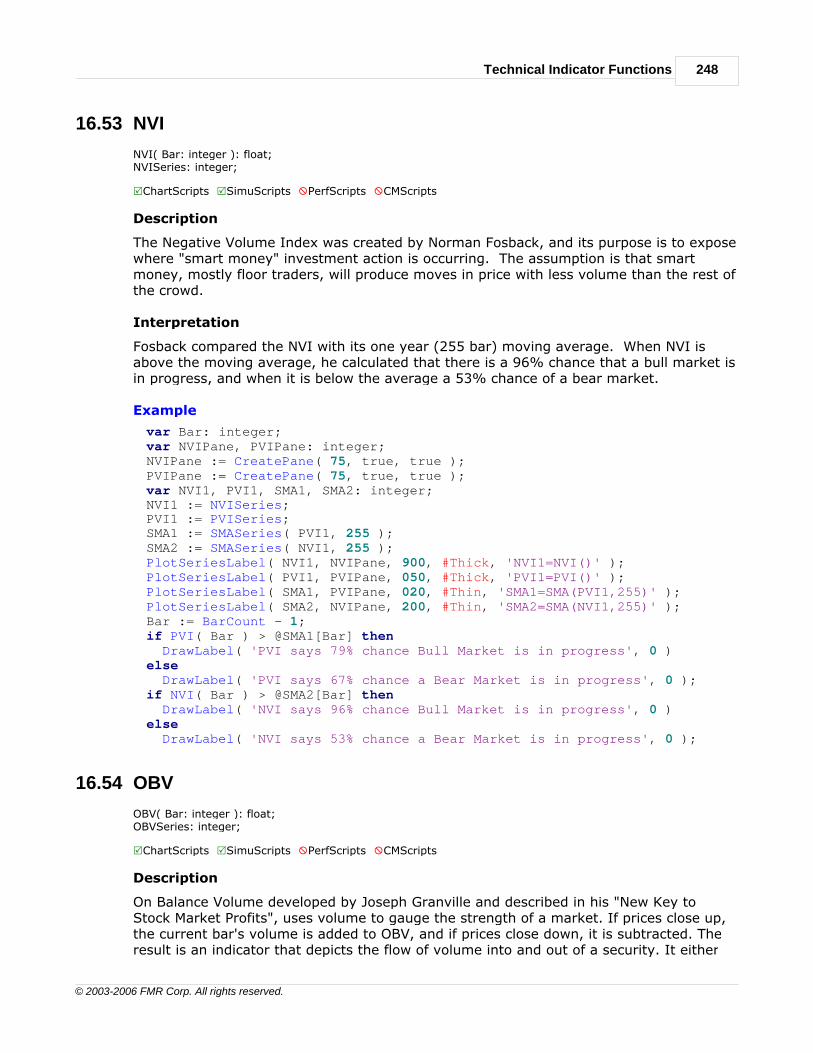
Technical Indicator Functions 248
© 2003-2006 FMR Corp. All rights reserved.
16.53 NVI
NVI( Bar: integer ): float;NVISeries: integer;
RChartScripts RSimuScripts XPerfScripts XCMScripts
Description
The Negative Volume Index was created by Norman Fosback, and its purpose is to exposewhere "smart money" investment action is occurring. The assumption is that smartmoney, mostly floor traders, will produce moves in price with less volume than the rest ofthe crowd.
Interpretation
Fosback compared the NVI with its one year (255 bar) moving average. When NVI isabove the moving average, he calculated that there is a 96% chance that a bull market isin progress, and when it is below the average a 53% chance of a bear market.
Example
var Bar: integer;var NVIPane, PVIPane: integer;NVIPane := CreatePane( 75, true, true );PVIPane := CreatePane( 75, true, true );var NVI1, PVI1, SMA1, SMA2: integer;NVI1 := NVISeries;PVI1 := PVISeries;SMA1 := SMASeries( PVI1, 255 );SMA2 := SMASeries( NVI1, 255 );PlotSeriesLabel( NVI1, NVIPane, 900, #Thick, 'NVI1=NVI()' );PlotSeriesLabel( PVI1, PVIPane, 050, #Thick, 'PVI1=PVI()' );PlotSeriesLabel( SMA1, PVIPane, 020, #Thin, 'SMA1=SMA(PVI1,255)' );PlotSeriesLabel( SMA2, NVIPane, 200, #Thin, 'SMA2=SMA(NVI1,255)' );Bar := BarCount - 1;if PVI( Bar ) > @SMA1[Bar] then DrawLabel( 'PVI says 79% chance Bull Market is in progress', 0 )else DrawLabel( 'PVI says 67% chance a Bear Market is in progress', 0 );if NVI( Bar ) > @SMA2[Bar] then DrawLabel( 'NVI says 96% chance Bull Market is in progress', 0 )else DrawLabel( 'NVI says 53% chance a Bear Market is in progress', 0 );
16.54 OBV
OBV( Bar: integer ): float;OBVSeries: integer;
RChartScripts RSimuScripts XPerfScripts XCMScripts
Description
On Balance Volume developed by Joseph Granville and described in his "New Key toStock Market Profits", uses volume to gauge the strength of a market. If prices close up,the current bar's volume is added to OBV, and if prices close down, it is subtracted. Theresult is an indicator that depicts the flow of volume into and out of a security. It either
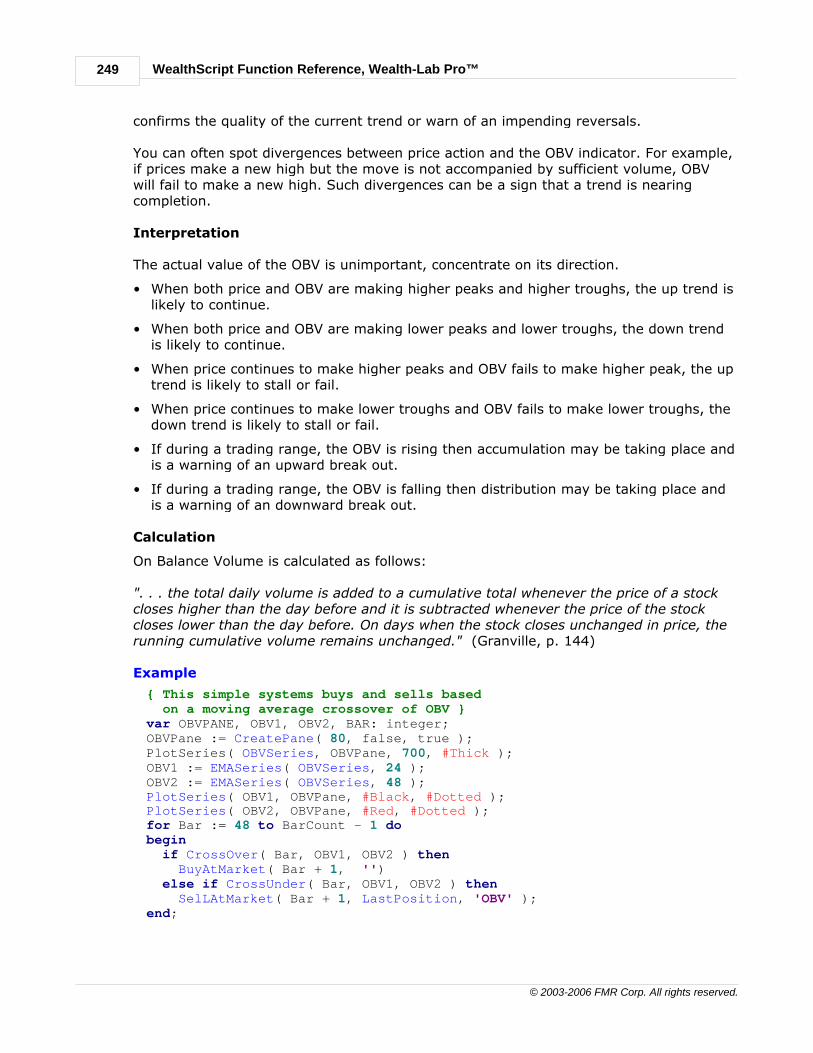
WealthScript Function Reference, Wealth-Lab Pro™249
© 2003-2006 FMR Corp. All rights reserved.
confirms the quality of the current trend or warn of an impending reversals.
You can often spot divergences between price action and the OBV indicator. For example,if prices make a new high but the move is not accompanied by sufficient volume, OBVwill fail to make a new high. Such divergences can be a sign that a trend is nearingcompletion.
Interpretation
The actual value of the OBV is unimportant, concentrate on its direction.
• When both price and OBV are making higher peaks and higher troughs, the up trend islikely to continue.
• When both price and OBV are making lower peaks and lower troughs, the down trendis likely to continue.
• When price continues to make higher peaks and OBV fails to make higher peak, the uptrend is likely to stall or fail.
• When price continues to make lower troughs and OBV fails to make lower troughs, thedown trend is likely to stall or fail.
• If during a trading range, the OBV is rising then accumulation may be taking place andis a warning of an upward break out.
• If during a trading range, the OBV is falling then distribution may be taking place andis a warning of an downward break out.
Calculation
On Balance Volume is calculated as follows:
". . . the total daily volume is added to a cumulative total whenever the price of a stockcloses higher than the day before and it is subtracted whenever the price of the stockcloses lower than the day before. On days when the stock closes unchanged in price, therunning cumulative volume remains unchanged." (Granville, p. 144)
Example
{ This simple systems buys and sells based on a moving average crossover of OBV }var OBVPANE, OBV1, OBV2, BAR: integer;OBVPane := CreatePane( 80, false, true );PlotSeries( OBVSeries, OBVPane, 700, #Thick );OBV1 := EMASeries( OBVSeries, 24 );OBV2 := EMASeries( OBVSeries, 48 );PlotSeries( OBV1, OBVPane, #Black, #Dotted );PlotSeries( OBV2, OBVPane, #Red, #Dotted );for Bar := 48 to BarCount - 1 dobegin if CrossOver( Bar, OBV1, OBV2 ) then BuyAtMarket( Bar + 1, '') else if CrossUnder( Bar, OBV1, OBV2 ) then SelLAtMarket( Bar + 1, LastPosition, 'OBV' );end;

Technical Indicator Functions 250
© 2003-2006 FMR Corp. All rights reserved.
16.55 Parabolic
Parabolic( Bar: integer; AccelUp: float; AccelDown: float; AccelMax: float ): float;ParabolicSeries( AccelUp: float; AccelDown: float; AccelMax: float ): integer;
RChartScripts RSimuScripts XPerfScripts XCMScripts
Description
Welles Wilder's Parabolic SAR is actually a type of trailing stop-based system, but it'soften used as an indicator. The SAR (Stop And Reverse) uses a trailing stop level thatfollows prices as they move up or down. The stop level increases speed based on an"Acceleration Factor". When plotted on the chart, this stop level resembles a paraboliccurve, thus the indicator's name. The Parabolic function accepts 3 parameters. The firsttwo control the Acceleration during up and down moves, respectively. The last parameterdetermines the maximum Acceleration.
The Parabolic assumes that you are trading a trend and therefore expects price to changeover time. If you are long the Parabolic SAR will move the stop up every period,regardless of whether the price has moved. It moves down if you are short.
Interpretation
• The Parabolic SAR trading system uses the Parabolic level as a Stop and Reverse point.This stop is calculated for the next period. When the stop is hit, this signals to closethe trade and take a new trade in the opposite direction. The system is typicallyalways in the market.
• When price movement trades in a narrow trading range, the Parabolic SAR willwhipsaw. The Parabolic is trend following indicator, it is useless in the absence of atrend. Use another indicator, such as ADXR, to determine trend strength.
• The Parabolic excels in fast moving trends that accelerate as they progress. The stopsare also calculated to accelerate, hence you need to have the correct "AccelerationFactor" to match the market you are trading. Up and down accelerations parametersmaybe different.
• The indicator is usually shown as a series of dots above or below the price bars. Thedots are the stop levels. You should be short when the stops are above the bars andlong when the stops are below the bars. When a stop is hit then trade in oppositedirection.
Calculation
SARt = SARc + AF * (EP - SARc), where
SARt = the stop for the next barSARc = the stop for the current barAF = Acceleration FactorEP = Extreme Point for current trade
The AF used by Wilder is 0.02. This means move the stop 2 percent of distance betweenEP and the original stop. Each time the EP changes, the AF increases by 0.02 up to themaximum acceleration, 0.2 in Wilders' case. Practical values are: AF range 0.01 to 0.025,and AFmax range of 0.1 to 0.25.
If long then EP is the highest high since going long, if short then EP is the lowest low
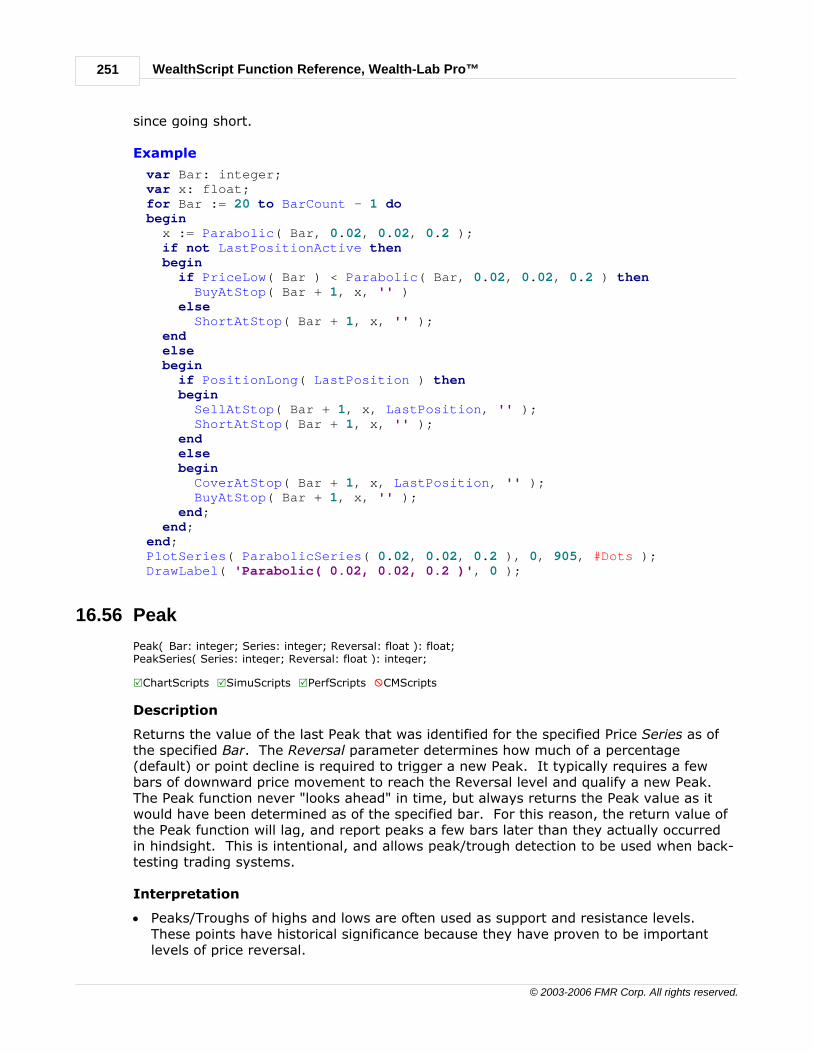
WealthScript Function Reference, Wealth-Lab Pro™251
© 2003-2006 FMR Corp. All rights reserved.
since going short.
Example
var Bar: integer;var x: float;for Bar := 20 to BarCount - 1 dobegin x := Parabolic( Bar, 0.02, 0.02, 0.2 ); if not LastPositionActive then begin if PriceLow( Bar ) < Parabolic( Bar, 0.02, 0.02, 0.2 ) then BuyAtStop( Bar + 1, x, '' ) else ShortAtStop( Bar + 1, x, '' ); end else begin if PositionLong( LastPosition ) then begin SellAtStop( Bar + 1, x, LastPosition, '' ); ShortAtStop( Bar + 1, x, '' ); end else begin CoverAtStop( Bar + 1, x, LastPosition, '' ); BuyAtStop( Bar + 1, x, '' ); end; end;end;PlotSeries( ParabolicSeries( 0.02, 0.02, 0.2 ), 0, 905, #Dots );DrawLabel( 'Parabolic( 0.02, 0.02, 0.2 )', 0 );
16.56 Peak
Peak( Bar: integer; Series: integer; Reversal: float ): float;PeakSeries( Series: integer; Reversal: float ): integer;
RChartScripts RSimuScripts RPerfScripts XCMScripts
Description
Returns the value of the last Peak that was identified for the specified Price Series as ofthe specified Bar. The Reversal parameter determines how much of a percentage(default) or point decline is required to trigger a new Peak. It typically requires a fewbars of downward price movement to reach the Reversal level and qualify a new Peak.The Peak function never "looks ahead" in time, but always returns the Peak value as itwould have been determined as of the specified bar. For this reason, the return value ofthe Peak function will lag, and report peaks a few bars later than they actually occurredin hindsight. This is intentional, and allows peak/trough detection to be used when back-testing trading systems.
Interpretation
· Peaks/Troughs of highs and lows are often used as support and resistance levels.These points have historical significance because they have proven to be importantlevels of price reversal.

Technical Indicator Functions 252
© 2003-2006 FMR Corp. All rights reserved.
· Peaks and troughs are a convenient way of detecting chart patterns. For example, oneaspect of a Head & Shoulders Top is a series of 3 Peaks, the second higher than theouter two.
Remarks
· To base reversals on point/absolute movement, pass the #AsPoint constant to theSetPeakTroughMode function in your script.
· Calculating peaks/troughs based on percentage moves is not allowed on data seriesthat contains negative or zero values. For these data series you must useSetPeakTroughMode to base the reversal amount on a point value.
Calculation
Peaks are detected by looking for a percentage (default) or point reversal in the PriceSeries greater than or equal to the reversal amount specified in the Reversal parameter.For example, if you specify a reversal value of 10, and prices make a new high of $100, apeak will be triggered at that bar as soon as prices move down to $90 (provided they donot continue above $100). The move down to $90 may take several bars. During thesebars the Peak function will not return $100, but will instead return the value of theprevious peak. This is because you would not have known that that $100 was an actualpeak yet because the reversal level has not been met. The new Peak value of $100 willbe returned only after prices have reached the $90 level, and the reversal level isreached.
Example
{ Draw the level of 7% Peaks on the chart }var PS: integer;PS := PeakSeries( #High, 7 );PlotSeries( PS, 0, #Red, #Dots );
16.57 PeakBar
PeakBar( Bar: integer; Series: integer; Reversal: float ): integer;PeakBarSeries( Series: integer; Reversal: float ): integer;
RChartScripts RSimuScripts RPerfScripts XCMScripts
Description
Returns the bar number at which the last Peak that was identified for the specified PriceSeries as of the specified Bar. The Reversal parameter determines how much of apercentage (default) decline is required to trigger a new Peak. It typically requires a fewbars of downward price movement to reach the Reversal level and qualify a new Peak.The Peak function never "looks ahead" in time, but always returns the Peak value as itwould have been determined as of the specified bar. For this reason, the return value ofthe Peak function will lag, and report peaks a few bars later than they actually occurredin hindsight. This is intentional, and allows peak/trough detection to be used when back-testing trading systems.
Interpretation
· Peaks/Troughs of highs and lows are often used as support and resistance levels.These points have historical significance because they have proven to be importantlevels of price reversal.

WealthScript Function Reference, Wealth-Lab Pro™253
© 2003-2006 FMR Corp. All rights reserved.
· Peaks and troughs are a convenient way of detecting chart patterns. For example, oneaspect of a Head & Shoulders Top is a series of 3 Peaks, the second higher than theouter two.
· PeakBar is particularly useful with working with chart patterns. You can store the barnumber of the most recent peak, then use this as an anchor bar to retrieve the barnumber for the previous peak, and so on.
Remarks
· PeakBar returns -1 if a peak has not yet been detected at the beginning of the chart.
· To base reversals on point/absolute movement, pass the #AsPoint constant to theSetPeakTroughMode function in your script.
· Calculating peaks/troughs based on percentage moves is not allowed on data seriesthat contains negative or zero values. For these data series you must useSetPeakTroughMode to base the reversal amount on a point value.
Calculation
(See Peak )
Example
{ Draw a trendline from the 2 most recent 10% Peaks }var p1, p2, Bar: integer;var Detected2Peaks: boolean = false;
Bar := BarCount - 1;p1 := PeakBar( Bar, #Close, 10 );if p1 > -1 thenbegin p2 := PeakBar( p1, #Close, 10 ); if p2 > -1 then begin DrawLine( p1, PriceClose( p1 ), p2, PriceClose( p2 ), 0, #Red, #Thick); Detected2Peaks := true; end;end;if not Detected2Peaks then DrawText( '2 peaks not detected. Try another symbol or load moredata.', 0, 5, 50, #Red, 10 );
16.58 PeakNum
PeakNum( Bar: integer; Series: integer; Number: integer; Reversal: float ): float;PeakNumSeries( Series: integer; Number: integer; Reversal: float ): integer;
RChartScripts RSimuScripts RPerfScripts XCMScripts
Description
Returns the value of the "Nth" most recent Peak that was identified for the specified PriceSeries as of the specified Bar. The Reversal parameter determines how much of apercentage (default) decline is required to trigger a new Peak. It typically requires a fewbars of downward price movement to reach the Reversal level and qualify a new Peak.
251

Technical Indicator Functions 254
© 2003-2006 FMR Corp. All rights reserved.
The Peak function never "looks ahead" in time, but always returns the Peak value as itwould have been determined as of the specified bar. For this reason, the return value ofthe Peak function will lag, and report peaks a few bars later than they actually occurredin hindsight. This is intentional, and allows peak/trough detection to be used when back-testing trading systems.
Use the Number parameter to specify which Peak to identify. To obtain the most recentPeak, pass 0 (although this is the same as using the Peak function). Number = 1 returnsthe previous Peak, 2 returns the second most previous, etc.
Interpretation
· Peaks/Troughs of highs and lows are often used as support and resistance levels.These points have historical significance because they have proven to be importantlevels of price reversal.
· Peaks and troughs are a convenient way of detecting chart patterns. For example, oneaspect of a Head & Shoulders Top is a series of 3 Peaks, the second higher than theouter two.
Remarks
· To base reversals on point/absolute movement, pass the #AsPoint constant to theSetPeakTroughMode function in your script.
· Calculating peaks/troughs based on percentage moves is not allowed on data seriesthat contains negative or zero values. For these data series you must useSetPeakTroughMode to base the reversal amount on a point value.
Calculation
Peaks are detected by looking for a percentage (default) or point reversal in the PriceSeries greater than or equal to the reversal amount specified in the Reversal parameter.For example, if you specify a reversal value of 10, and prices make a new high of $100, apeak will be triggered at that bar as soon as prices move down to $90 (provided they donot continue above $100). The move down to $90 may take several bars. During thesebars the Peak function will not return $100, but will instead return the value of theprevious peak. This is because you would not have known that that $100 was an actualpeak yet because the reversal level has not been met. The new Peak value of $100 willbe returned only after prices have reached the $90 level, and the reversal level isreached.
Example
{ Flags bars as red when a potential Head & Shoulders top is forming.Note, this script does not check for penetration of the neckline. }var P1, P2, P3, LASTHEAD: float;var BAR, pb1, pb2, pb3: integer;for Bar := 120 to BarCount - 1 dobegin p1 := Peak( Bar, #High, 7 ); p2 := PeakNum( Bar, #High, 1, 7 ); p3 := PeakNum( Bar, #High, 2, 7 ); if ROC( Bar, #Close, 120 ) > 20 then if p1 < p2 then if p2 > p3 then begin
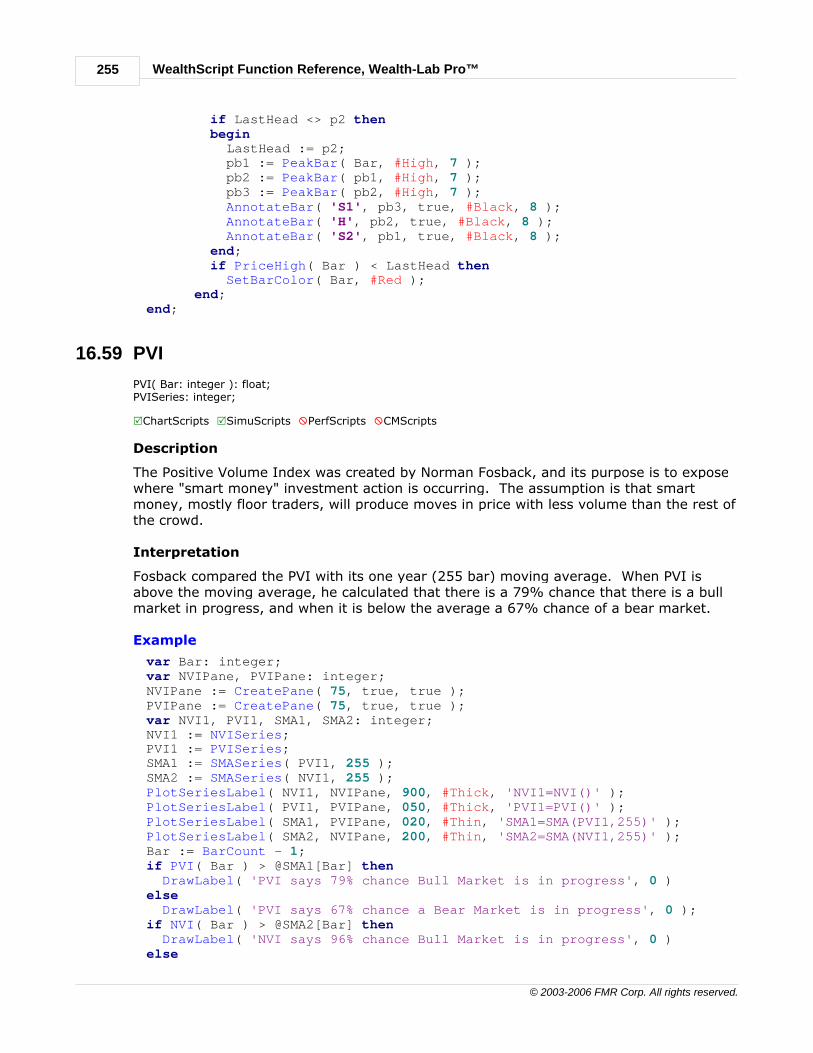
WealthScript Function Reference, Wealth-Lab Pro™255
© 2003-2006 FMR Corp. All rights reserved.
if LastHead <> p2 then begin LastHead := p2; pb1 := PeakBar( Bar, #High, 7 ); pb2 := PeakBar( pb1, #High, 7 ); pb3 := PeakBar( pb2, #High, 7 ); AnnotateBar( 'S1', pb3, true, #Black, 8 ); AnnotateBar( 'H', pb2, true, #Black, 8 ); AnnotateBar( 'S2', pb1, true, #Black, 8 ); end; if PriceHigh( Bar ) < LastHead then SetBarColor( Bar, #Red ); end;end;
16.59 PVI
PVI( Bar: integer ): float;PVISeries: integer;
RChartScripts RSimuScripts XPerfScripts XCMScripts
Description
The Positive Volume Index was created by Norman Fosback, and its purpose is to exposewhere "smart money" investment action is occurring. The assumption is that smartmoney, mostly floor traders, will produce moves in price with less volume than the rest ofthe crowd.
Interpretation
Fosback compared the PVI with its one year (255 bar) moving average. When PVI isabove the moving average, he calculated that there is a 79% chance that there is a bullmarket in progress, and when it is below the average a 67% chance of a bear market.
Example
var Bar: integer;var NVIPane, PVIPane: integer;NVIPane := CreatePane( 75, true, true );PVIPane := CreatePane( 75, true, true );var NVI1, PVI1, SMA1, SMA2: integer;NVI1 := NVISeries;PVI1 := PVISeries;SMA1 := SMASeries( PVI1, 255 );SMA2 := SMASeries( NVI1, 255 );PlotSeriesLabel( NVI1, NVIPane, 900, #Thick, 'NVI1=NVI()' );PlotSeriesLabel( PVI1, PVIPane, 050, #Thick, 'PVI1=PVI()' );PlotSeriesLabel( SMA1, PVIPane, 020, #Thin, 'SMA1=SMA(PVI1,255)' );PlotSeriesLabel( SMA2, NVIPane, 200, #Thin, 'SMA2=SMA(NVI1,255)' );Bar := BarCount - 1;if PVI( Bar ) > @SMA1[Bar] then DrawLabel( 'PVI says 79% chance Bull Market is in progress', 0 )else DrawLabel( 'PVI says 67% chance a Bear Market is in progress', 0 );if NVI( Bar ) > @SMA2[Bar] then DrawLabel( 'NVI says 96% chance Bull Market is in progress', 0 )else

Technical Indicator Functions 256
© 2003-2006 FMR Corp. All rights reserved.
DrawLabel( 'NVI says 53% chance a Bear Market is in progress', 0 );
16.60 QStick
QStick( Bar: integer; Period: integer ): float;QStickSeries( Period: integer ): integer;
RChartScripts RSimuScripts XPerfScripts XCMScripts
Description
QStick provides a way to quantify candlestick values. The QStick indicator is calculatedby taking a moving average of the difference between open and closing prices.
Interpretation
When QStick crosses above zero, this is considered bullish, and below zero bearish. Youcan also look for extreme QStick levels to determine overbought and oversold levels, orlook for divergences between QStick and price to signal trend reversals.
Example
{ See how good the QStick zero line entry rule really is }var QSTICKPANE, BAR: integer;QStickPane := CreatePane( 100, true, true );PlotSeries( QStickSeries( 24 ), QStickPane, 050, #Thick );DrawLabel( 'QStick( 24 )', QStickPane );InstallProfitTarget( 10 );InstallStopLoss( 20 );for Bar := 24 to BarCount - 1 dobegin ApplyAutoStops( Bar ); if CrossOverValue( Bar, QStickSeries( 24 ), 0 ) then BuyAtMarket( Bar + 1, ''); if CrossUnderValue( Bar, QStickSeries( 24 ), 0 ) then ShortAtMarket( Bar + 1, '');end;
16.61 RelSlope
RelSlope( Bar: integer; Series: integer; Period: integer; Smooth: integer ): float;RelSlopeSeries( Series: integer; Period: integer; Smooth: integer ): integer;
RChartScripts RSimuScripts RPerfScripts XCMScripts
Description
RelSlope stands for the "Relative Slope" Indicator, created by Dimitris Tsokakis. RelSlopetakes 3 parameters. The Series parameter specifies what you wish to apply RelativeSlope to, average price weighted with closing price is recommended (#AverageC).
Note: Series should be a Price Series that contains positive values only. CalculatingRelSlope on a Price Series that contains negative values is meaningless.
The Period parameter determines the period of an initial EMA that is taken of the Series.A Period of 10 is recommended. The final parameter, Smooth, determines a finalsmoothing of the indicator, and a value of 3 is recommended.

WealthScript Function Reference, Wealth-Lab Pro™257
© 2003-2006 FMR Corp. All rights reserved.
Interpretation
As an independent indicator, RelSlope is a fast trend follower and its divergences oftenanticipate big price movements.
Note: UseUpdatedEMA affects the calculation of EMA-based indicators such as RelSlope.
Choose the default method for calculating the EMA exponent in the IndicatorCalculations section of the Options dialog.
CalculationExample
{ This ChartScript demonstrates the calculation of RelSlope }var Period, Smooth, RSPane: integer;var K, KPLUS, KMINUS, S1, MyRelSlopeSeries: integer;UseUpdatedEMA( true );Period := 10;Smooth := 3;
K := EMASeries( #Close, Period );KPlus := AddSeries( K, OffsetSeries( K, -1 ) );KMinus := SubtractSeries( K, OffsetSeries( K, -1 ) );S1 := MultiplySeriesValue( DivideSeries( KMinus, KPlus ), 2 );MyRelSlopeSeries := MultiplySeriesValue( EMASeries( S1, Smooth ), 1000 );
RSPane := CreatePane( 75, true, true );PlotSeriesLabel( MyRelSlopeSeries, RSPane, #Blue, #Histogram,'RelSlope(calculated)' );PlotSeriesLabel( RelSlopeSeries( #Close, Period, Smooth ), RSPane, #Red,#Thin, 'RelSlope' );
16.62 ROC
ROC( Bar: integer; Series: integer; Period: integer ): float;ROCSeries( Series: integer; Period: integer ): integer;
RChartScripts RSimuScripts RPerfScripts XCMScripts
Description
The Rate of Change (ROC) indicator provides a percentage that the security's price haschanged over the specified Period. The Rate of Change shows the speed at which pricechanges from one period to another. Sometimes this is referred to as momentum. Itgives a excellent indication of the market participants' commitment to the current trend.When the ROC begins to reverse or turn, it indicates diminishing commitment and a lossof momentum. ROC is a leading or coincidental indicator.
Like other momentum indicators, ROC has overbought and oversold zones. These zonesare defined by lines that are placed so that ROC spends about 5% of its time within thezones. The lines should be adjusted according to market conditions.
Interpretation
• In ranging markets, go long after ROC falls below the oversold line then rises backabove it.
• In ranging markets, go short after ROC rises above the overbought line the falls backbelow it.
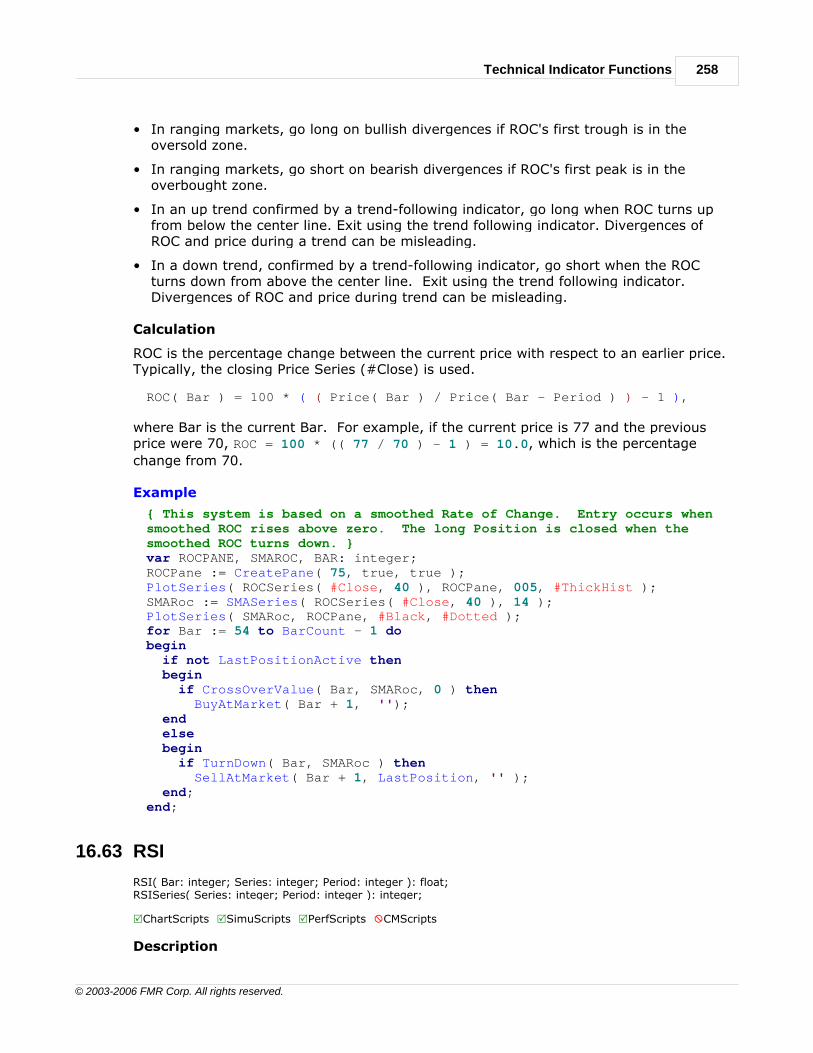
Technical Indicator Functions 258
© 2003-2006 FMR Corp. All rights reserved.
• In ranging markets, go long on bullish divergences if ROC's first trough is in theoversold zone.
• In ranging markets, go short on bearish divergences if ROC's first peak is in theoverbought zone.
• In an up trend confirmed by a trend-following indicator, go long when ROC turns upfrom below the center line. Exit using the trend following indicator. Divergences ofROC and price during a trend can be misleading.
• In a down trend, confirmed by a trend-following indicator, go short when the ROCturns down from above the center line. Exit using the trend following indicator.Divergences of ROC and price during trend can be misleading.
Calculation
ROC is the percentage change between the current price with respect to an earlier price.Typically, the closing Price Series (#Close) is used.
ROC( Bar ) = 100 * ( ( Price( Bar ) / Price( Bar - Period ) ) - 1 ),
where Bar is the current Bar. For example, if the current price is 77 and the previousprice were 70, ROC = 100 * (( 77 / 70 ) - 1 ) = 10.0, which is the percentage
change from 70.
Example
{ This system is based on a smoothed Rate of Change. Entry occurs whensmoothed ROC rises above zero. The long Position is closed when thesmoothed ROC turns down. }var ROCPANE, SMAROC, BAR: integer;ROCPane := CreatePane( 75, true, true );PlotSeries( ROCSeries( #Close, 40 ), ROCPane, 005, #ThickHist );SMARoc := SMASeries( ROCSeries( #Close, 40 ), 14 );PlotSeries( SMARoc, ROCPane, #Black, #Dotted );for Bar := 54 to BarCount - 1 dobegin if not LastPositionActive then begin if CrossOverValue( Bar, SMARoc, 0 ) then BuyAtMarket( Bar + 1, ''); end else begin if TurnDown( Bar, SMARoc ) then SellAtMarket( Bar + 1, LastPosition, '' ); end;end;
16.63 RSI
RSI( Bar: integer; Series: integer; Period: integer ): float;RSISeries( Series: integer; Period: integer ): integer;
RChartScripts RSimuScripts RPerfScripts XCMScripts
Description

WealthScript Function Reference, Wealth-Lab Pro™259
© 2003-2006 FMR Corp. All rights reserved.
The RSI function returns the Relative Strength Index indicator. RSI is one of the classicmomentum indicators and was developed by Wells Wilder. RSI measures a market'sinternal strength by dividing the average of the sum of the up day closing prices by thethe average of the sum of the down day closing prices over a specific period of time. Itreturns a value within the range of 0 to 100. The RSI is a leading or a coincidentalindicator. Popular averaging periods for the RSI are 9, 14 and 25. Wilder used 14periods. Use the Period that works best for you. The indicator becomes more volatileand amplitude widens with fewer periods used.
Interpretation
• The classic way to interpret RSI is to look for oversold levels below 30 and overboughtlevels above 70. These normally occur before the underlying price chart forms a top ora bottom. Note you should change the levels depending on market conditions. Ensurethe level lines cut across the highest peaks and the lowest troughs. During strongtrends the RSI may remain in overbought or oversold for extended periods.
• RSI also often forms chart patterns which may not show on the underlying price chart,such as double tops and bottoms and trendlines. Also look for support or resistance onthe RSI.
• If underlying prices make a new high or low that isn't confirmed by the RSI thisdivergence can signal a price reversal. RSI divergences from price indicates verystrong buy or sell signal.
• Swing Failures. If the RSI makes a lower high followed buy a downside move below aprevious low, then a Top Swing Failure has occurred. If the RSI makes a higher lowfollowed buy a upside move above a previous high, then a Bottom Swing Failure hasoccurred.
• The mid point level of 50 will often act as support or resistance if the RSI bounce offthe 50 level. Crosses of the 50 level can be used as a buying or selling signal. WhenRSI cross above then buy, when RSI crosses below then sell.
• RSI can be use to find dips in strong trends. Use trend indicator to determine a strongup trend then if the RSI is below 50, you have a dip in the up trend. In strong downtrends use RSI above 50 to detect small rallies. Buy the dip and sell the small rally.
Remarks
• As a rule of thumb, allow RSI to stabilize for 2.5 to 3 times the specified Period. Forexample, start the trading loop at Bar Number 42 for a 14-period RSI.
Calculation
RSI = 100 - ( 100 / ( 1 + RS ) )
where,
RSI relative strength indexRS = (average of n bars' up closes) / (average of n bars' down closes)n = number of bars or period, typically 14
Note in calculating the RS values for the total of closes up, add all price changes wherethe close is greater then previous close. For closes down, add all price changes where theclose is less then previous close.

Technical Indicator Functions 260
© 2003-2006 FMR Corp. All rights reserved.
Finally, the RSI formula may be found in some technical references as the followingequivalent expression:
RSI = 100 * UpDaysAvg / ( UpDaysAvg + DownDaysAvg )
Example
{ This script colors each bar based on the RSI oversold/overbought level}var X: float;var RSIPANE, BAR, COL: integer;RSIPane := CreatePane( 75, true, true );SetPaneMinMax( RSIPane, 0, 100 );PlotSeries( RSISeries( #Close, 14 ), RSIPane, 005, #Thin );DrawLabel( 'RSI( Close, 14 )', RSIPane );for Bar := 42 to BarCount - 1 dobegin x := RSI( Bar, #Close, 14 ); if x > 50 then begin x := x - 50; x := x * 2; x := x / 9; col := Trunc( x ) * 100; end else begin x := 50 - x; x := x * 2; x := x / 9; col := Trunc( x ) * 10; end; SetBarColor( Bar, col );end;
16.64 RSquared
RSquared( Bar: integer; Series: integer; Period: integer ): float;RSquaredSeries( Series: integer; Period: integer ): integer;
RChartScripts RSimuScripts RPerfScripts XCMScripts
Description
RSquared is the Correlation Coefficient squared from Linear Regression. It is used todetermine how much of the price action over the specified period can be explained by theregression line, and how much should be attributes to random noise. RSquared rangesfrom 0 to 1.
RSquared is a statistical indicator. Other indicators in the same class are LinearReg,LinearRegSlope, StdErr, and StdDev.
Interpretation
• The closer RSquared is to one, the closer prices have fitted to the linear regressionline. See the table below. During strong trends, RSquared will remain above 0.5 foran extended period of time. Use the RSquared indicator with LinearRegSlope to

WealthScript Function Reference, Wealth-Lab Pro™261
© 2003-2006 FMR Corp. All rights reserved.
determine if a significant trend is in place.
• Use RSquared for confirmation of the trend. When RSI, Stochastics, CCI and othermomentum indicators are in overbought or oversold regions, look for RSquared toshow that no statistical trend is in place before taking a contrary trading position.
• If trading a trend-following system, such as moving average crossover, you can useRSquared to confirm that the trend is statistically significant.
Table
The following table show the RSquared values for a given number of periods for astatistically significant trend to be in place. A 95% confidence means that 95% of theprices can be explained by Linear Regression and 5% by unexplained random noise.
RSquared values forNumber of periods 95% confidence
5 0.7710 0.4014 0.2720 0.2025 0.1630 0.1350 0.0860 0.06120 0.03
Calculation
RSquared is a rather complex statistical calculation. It uses the least square method tofit a trendline to the data by minimizing the distance between the price and the LinearRegression trendline and returns a percentage of price movement that is explained by theregression line.
Example
{ Plot RSquared in order to examine how prices react when they reachdifferent levels. }var RSquaredPane: integer;RSquaredPane := CreatePane( 75, true, true );PlotSeries( RSquaredSeries( #Close, 30 ), RSquaredPane, 905, #Thin );DrawLabel( 'RSquared( Close, 30 )', RSquaredPane );var LinRegSlopePane: integer;PlotSeries( LinearRegSlopeSeries( #Close, 30 ), RSquaredPane, 509, #Thin);DrawLabel( 'LinearRegSlope( Close, 30 )', RSquaredPane );
16.65 RVI
RVI( Bar: integer; Period: integer ): float;RVISeries( Period: integer ): integer;
RChartScripts RSimuScripts XPerfScripts XCMScripts
Description

Technical Indicator Functions 262
© 2003-2006 FMR Corp. All rights reserved.
RVI returns the Relative Vigor Index, and indicator created by John Ehlers of MesaSoftware (http://www.mesasoftware.com). RVI measures the average differencebetween closing and opening price, normalized to the average daily trading range. Itapplies a normalization filter to smooth the index with minimal lag.
Interpretation
RVI reaches extreme high and low levels near the peaks of uptrends and downtrends.You can trigger signals based on these extreme levels, or wait until RVI crosses above orbelow a signal line.
The RVI indicator accepts a parameter that determines the Period to use in itscalculation. You can create a dynamic RVI that is based on half of the dominant cycleperiod as described by Ehlers. Below we create a custom Price Series and populate withthe RVI values based on half of the cycle period as determined by the HTPeriodindicator.
Example
var RVIPANE, DYNRVI, BAR, N, P: integer;RVIPane := CreatePane( 100, true, true );DynRVI := CreateSeries;for Bar := 40 to BarCount - 1 dobegin n := Round( HTPeriod( Bar, #Average ) ) div 2; SetSeriesValue( Bar, DynRVI, RVI( Bar, n ) );end;PlotSeries( DynRVI, RVIPane, 009, #Thick );DrawLabel( 'DynRVI', RVIPane );for Bar := 20 to BarCount - 1 dobegin if TurnUp( Bar, DynRVI ) then if GetSeriesValue( Bar - 1, DynRVI ) < -0.35 then BuyAtMarket( Bar + 1, ''); if CrossOverValue( Bar, DynRVI, 0.35 ) then for P := 0 to PositionCount - 1 do if PositionActive( P ) then SellAtMarket( Bar + 1, P, '' );end;var HTPeriodPane: integer;HTPeriodPane := CreatePane( 100, true, true );PlotSeries( HTPeriodSeries( #Average ), HTPeriodPane, 055, #Thick );DrawLabel( 'HTPeriod( Average )', HTPeriodPane );
16.66 SMA
SMA( Bar: integer; Series: integer; Period: integer ): float;SMASeries( Series: integer; Period: integer ): integer;
RChartScripts RSimuScripts RPerfScripts XCMScripts
Description
SMA returns the Simple Moving Average indicator. Moving averages are one of thecore indicators in technical analysis, and there are a variety of different versions. SMA isthe easiest moving average to construct. It is simply the average price over the specifiedPeriod. The average is called "Moving" because it is plotted on the chart bar by bar,

WealthScript Function Reference, Wealth-Lab Pro™263
© 2003-2006 FMR Corp. All rights reserved.
forming a line that moves along the chart as the average value changes.
Interpretation
· SMAs are often used to determine Trend Direction. If the SMA is moving up, thetrend is up, moving down and the trend is down. A 200 bar SMA is common proxy forthe long term trend. 60 bar SMAs are typically used to gauge the intermediate trend.Shorter period SMAs can be used to determine shorter term trends.
· SMAs are commonly used to smooth price data and technical indicators. Applying anSMA smoothes out choppy data. The longer the period of the SMA, the smoother theresult, but the more lag that is introduced between the SMA and the source.
· SMA Crossing Price is often used to trigger trading signals. When prices cross abovethe SMA go long, when they cross below the SMA go short.
· SMA Crossing SMA is another common trading signal. When a short period SMAcrosses above a long period SMA, go long. Go short when the short term SMA crossesback below the long term.
Calculation
SMA is simply the mean, or average, of the values in a Series over the specified Period.
Example
{ An SMA Crossover system }var BAR, hSlow, hFast, SlowPer, FastPer: integer;SlowPer := 100;FastPer := 40;hSlow := SMASeries( #Close, SlowPer );hFast := SMASeries( #Close, FastPer );PlotSeries( hSlow, 0, 000, #Thick );PlotSeries( hFast, 0, 502, #Thick );
for Bar := SlowPer to BarCount - 1 dobegin if not LastPositionActive then begin if CrossOver( Bar, hFast, hSlow ) then BuyAtMarket( Bar + 1, ''); end else begin if CrossUnder( Bar, hFast, hSlow ) then SellAtMarket( Bar + 1, LastPosition, '' ); end;end;
16.67 StdDev
StdDev( Bar: integer; Series: integer; Period: integer ): float;StdDevSeries( Series: integer; Period: integer ): integer;
RChartScripts RSimuScripts RPerfScripts XCMScripts
Description
Standard Deviation is the statistical measure of market volatility. If prices trade in a tight

Technical Indicator Functions 264
© 2003-2006 FMR Corp. All rights reserved.
narrow trading range then StdDev will return a low value indicating volatility is low.Conversely if prices swing wildly up and down then StdDev returns a high valueindicating volatility is high. What it does is measure how widely prices are dispersed fromthe average or mean price.
Interpretation
· Standard deviation rises as prices become more volatile. As price action calms,standard deviation heads lower.
· Market tops accompanied by increase volatility over short periods of time, indicatenervous and indecisive traders. Or market tops with decreasing volatility over longtime frames, indicate maturing bull markets.
· Market bottoms accompanied by decreased volatility over long periods of time, indicatebored and disinterested traders. Or market bottoms with increasing volatility overrelatively sort time periods, indicate panic sell off.
Calculation
You can choose between standard deviation of a sample (compatible with Excel STDEV)or of a population (compatible with Excel STDEVP) in the Indicator Calculations section ofthe Options dialog. See the User Guide for details.
Example
{ Divide Standard Deviation by Average Price to arrive at a normalized Volatility indicator }var MYVOLATILITY, VOLPANE: integer;MyVolatility := DivideSeries( StdDevSeries( #Close, 30 ), SMASeries( #Close, 30 ) );VolPane := CreatePane( 100, true, true );PlotSeries( MyVolatility, VolPane, #Purple, #ThickHist );
16.68 StdError
StdError( Bar: integer; Series: integer; Period: integer ): float;StdErrorSeries( Series: integer; Period: integer ): integer;
RChartScripts RSimuScripts RPerfScripts XCMScripts
Description
Returns the Standard Error of the estimate for a Linear Regression line of the specifiedPeriod. Standard Error measures the difference between actual price and the estimatedprice of the Linear Regression line at every point along the line. The lower the standarderror, the closer actual prices have met the estimate. If all the closing prices matched theLinear Regression values for the specified period, then the Standard Error would be Zero.
Interpretation
· The larger the error the less reliable the trend as the price has greater variance aroundthe Linear Regression line, prices are volatile. This can be caused by the changes inthe prevailing trend within the specified number of periods.
· The smaller the error then more reliable the trend as the prices are congregatingaround the Linear Regression Linear line.
· If RSquared and Standard Error are at extreme levels and then they begin to converge
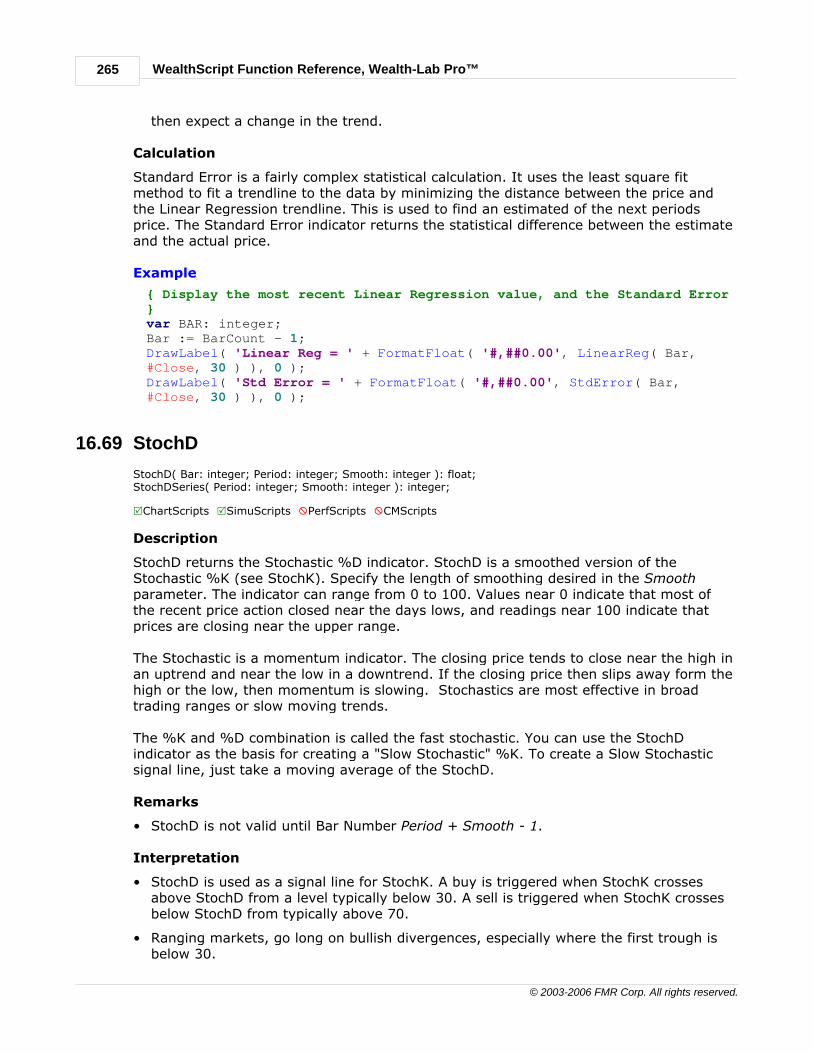
WealthScript Function Reference, Wealth-Lab Pro™265
© 2003-2006 FMR Corp. All rights reserved.
then expect a change in the trend.
Calculation
Standard Error is a fairly complex statistical calculation. It uses the least square fitmethod to fit a trendline to the data by minimizing the distance between the price andthe Linear Regression trendline. This is used to find an estimated of the next periodsprice. The Standard Error indicator returns the statistical difference between the estimateand the actual price.
Example
{ Display the most recent Linear Regression value, and the Standard Error}var BAR: integer;Bar := BarCount - 1;DrawLabel( 'Linear Reg = ' + FormatFloat( '#,##0.00', LinearReg( Bar,#Close, 30 ) ), 0 );DrawLabel( 'Std Error = ' + FormatFloat( '#,##0.00', StdError( Bar,#Close, 30 ) ), 0 );
16.69 StochD
StochD( Bar: integer; Period: integer; Smooth: integer ): float;StochDSeries( Period: integer; Smooth: integer ): integer;
RChartScripts RSimuScripts XPerfScripts XCMScripts
Description
StochD returns the Stochastic %D indicator. StochD is a smoothed version of theStochastic %K (see StochK). Specify the length of smoothing desired in the Smoothparameter. The indicator can range from 0 to 100. Values near 0 indicate that most ofthe recent price action closed near the days lows, and readings near 100 indicate thatprices are closing near the upper range.
The Stochastic is a momentum indicator. The closing price tends to close near the high inan uptrend and near the low in a downtrend. If the closing price then slips away form thehigh or the low, then momentum is slowing. Stochastics are most effective in broadtrading ranges or slow moving trends.
The %K and %D combination is called the fast stochastic. You can use the StochDindicator as the basis for creating a "Slow Stochastic" %K. To create a Slow Stochasticsignal line, just take a moving average of the StochD.
Remarks
• StochD is not valid until Bar Number Period + Smooth - 1.
Interpretation
• StochD is used as a signal line for StochK. A buy is triggered when StochK crossesabove StochD from a level typically below 30. A sell is triggered when StochK crossesbelow StochD from typically above 70.
• Ranging markets, go long on bullish divergences, especially where the first trough isbelow 30.

Technical Indicator Functions 266
© 2003-2006 FMR Corp. All rights reserved.
• Ranging markets, go short on bearish divergences, especially where the first peak isabove 70.
• Trending market, when either Stochastic line crosses below 30 (signal day), place astop order to go long if prices rise above the high of the signal day or any subsequentday with a lower low. Place stop order below the low of the same day.
• Trending markets, when either Stochastic line crosses above 70 (signal day), place astop order to go short if prices falls below the low of the signal day or any subsequentday with a higher high. Place a stop loss order above the high of the same day.
• Trending markets, Use trend following indicators to exit. Can take profits ondivergences, if confirmed by the trend following indicator.
Calculation
n = Number of periods, normally 5S = Number of smoothing intervals, normally 3%D = Slow Stochastic K, smoothed over S periods (not SMA smoothing)
HH(Bar-j) = Highest High at Bar-j over n periodsLL(Bar-j) = Lowest Low at Bar-j over n periodsC(Bar-j) = PriceClose at Bar-j
S = Summation from j = 0 to S - 1 periods
Sum1 = S ( C(Bar-j) - LL(Bar-j) )
Sum2 = S ( HH(Bar-j) - LL(Bar-j) )%D = 100 * Sum1 / Sum2
Example
{ Simple system based on Slow Stochastic }var STOCHPANE, SLOWK, SLOWD, BAR: integer;StochPane := CreatePane( 120, true, true );SlowK := StochDSeries( 10, 3 );SlowD := SMASeries( SlowK, 3 );PlotSeries( SlowK, StochPane, #Purple, #Thick );PlotSeries( SlowD, StochPane, #Black, #Thin );for Bar := 20 to BarCount - 1 dobegin if not LastPositionActive then begin if CrossOver( Bar, SlowK, SlowD ) then if GetSeriesValue( Bar - 1, SlowK ) < 20 then BuyAtMarket( Bar + 1, ''); end else begin if CrossOverValue( Bar, SlowK, 80 ) then SellAtMarket( Bar + 1, LastPosition, '' ); end;end;

WealthScript Function Reference, Wealth-Lab Pro™267
© 2003-2006 FMR Corp. All rights reserved.
16.70 StochK
StochK( Bar: integer; Period: integer ): float;StochKSeries( Period: integer ): integer;
RChartScripts RSimuScripts XPerfScripts XCMScripts
Description
StochK returns the Stochastic Oscillator %K. The Stochastic Oscillator measures howmuch price tends to close in the upper or lower areas of its trading range. The indicatorcan range from 0 to 100. Values near 0 indicate that most of the recent price actionclosed near the days lows, and readings near 100 indicate that prices are closing near theupper range.
The Stochastic is a momentum indicator. The closing price tends to close near the high inan uptrend and near the low in a downtrend. If the closing price then slips away form thehigh or the low, then momentum is slowing. Stochastics are most effective in broadtrading ranges or slow moving trends.
Interpretation
The classic way to interpret the Stochastic is to wait for %K to reach an extreme level. Alevel above 70 typically indicates an overbought condition, while below 30 indicates anoversold level. While these penetrations of extreme levels indicate a warning, the actualbuy/sell signals occur when %K crosses %D (see StochD).
• Ranging markets, go long on bullish divergences, especially where the first trough isbelow 30.
• Ranging markets, go short on bearish divergences, especially where the first peak isabove 70.
• Trending market, when either Stochastic line crosses below 30 (signal day), place astop order to go long if prices rise above the high of the signal day or any subsequentday with a lower low. Place stop order below the low of the same day.
• Trending markets, when either Stochastic line crosses above 70 (signal day), place astop order to go short if prices falls below the low of the signal day or any subsequentday with a higher high. Place a stop loss order above the high of the same day.
• Trending markets, use trend following indicators to exit. Can take profits ondivergences, if confirmed by the trend following indicator.
Calculation
n = Number of periods, normally 5HHn = Highest High over n periodsLLn = Lowest Low over n periodsC = PriceClose today%K = Stochastic K = 100 * ( C - LLn ) / ( HHn - LLn )
Example
{ A system based on Fast Stochastic Extreme Levels }var STOCHPANE, BAR, P: integer;StochPane := CreatePane( 100, true, true );PlotSeries( StochKSeries( 14 ), StochPane, 505, #Thick );DrawLabel( 'StochK( 14 )', StochPane );for Bar := 14 to BarCount - 1 do

Technical Indicator Functions 268
© 2003-2006 FMR Corp. All rights reserved.
begin if CrossUnderValue( Bar, StochKSeries( 14 ), 20 ) then BuyAtMarket( Bar + 1, ''); if CrossOverValue( Bar, StochKSeries( 14 ), 20 ) then for P := 0 to PositionCount - 1 do if PositionActive( P ) then SellAtMarket( Bar + 1, P, '' );end;
16.71 StochRSI
StochRSI( Bar: integer; Series: integer; Period: integer ): float;StochRSISeries( Series: integer; Period: integer ): integer;
RChartScripts RSimuScripts RPerfScripts XCMScripts
Description
StochRSI is an indicator created by Tushar Chande that combines Stochastics with theRelative Strength Index. Like RSI, StochRSI cycles between overbought levels below 30and oversold levels above 70. The StochRSI reaches these levels much more frequentlythan RSI, resulting in an oscillator that offers more trading opportunities. StochRSImoves within the range of 0 to 100. Unlike RSI, StochRSI frequently reaches the extreme0 and 100 levels.
Interpretation
• Look for oversold levels below 30 and overbought levels above 70. These normallyoccur before the underlying price chart forms a top or a bottom. Note, you shouldchange the levels depending on market conditions. Ensure the level lines cut acrossthe highest peaks and the lowest troughs. During strong trends the StochRSI mayremain in overbought or oversold for extended periods.
• If underlying prices make a new high or low that isn't confirmed by the StochRSI, thisdivergence can signal a price reversal. StochRSI divergences from price indicates verystrong buy or sell signal.
• Swing Failures. If the StochRSI makes a lower high followed buy a downside movebelow a previous low, then a Top Swing Failure has occurred, sell signal. If theStochRSI makes a higher low followed buy a upside move above a previous high, thena Bottom Swing Failure has occurred, buy signal.
• The mid point level of 50 will often act as support or resistance if the StochRSI bounceoff the 50 level. Crosses of the 50 level can be used as a buying or selling signal.When StochRSI cross above then buy, when StochRSI crosses below then sell.
Calculation
StochRSI is essentially a StochK of the RSI. See both StochK and RSI for moreinformation.
StochRSI = ( RSI(n) - RSI lowest low(n) ) / ( RSI highest high(n) - RSIlowest low(n) )
where, n = number of periods
Example

WealthScript Function Reference, Wealth-Lab Pro™269
© 2003-2006 FMR Corp. All rights reserved.
var STOCHRSIPANE, BAR: integer;StochRSIPane := CreatePane( 75, TRUE, TRUE );PlotSeries( StochRSISeries( #Close, 14 ), StochRSIPane, 411, 2 );
InstallBreakEvenStop( 10 );for Bar := 31 to BarCount - 1 dobegin ApplyAutoStops( Bar ); if LastPositionActive then begin if StochRSI( Bar, #Close, 14 ) = 100 then SellAtMarket( Bar + 1, LastPosition, ''); end else begin if EMA( Bar, #Close, 30 ) > EMA( Bar - 1, #Close, 30 ) then if StochRSI( Bar, #Close, 14 ) = 0 then BuyAtMarket( Bar + 1, ''); end;end;
16.72 Sum
Sum( Bar: integer; Series: integer; Period: integer ): float;SumSeries( Series: integer; Period: integer ): integer;
RChartScripts RSimuScripts RPerfScripts XCMScripts
Description
Returns the sum of values from the specified Price Series over the desired period. This isnot really an indicator per se, but a mathematical function used to summate values in aprice series. You can use this function to build your own custom indicators, like theexample shown below.
In this example, we add all the highs for twenty bars, then add all the lows for twentybars, producing two floating point values, xUp and xDown. The two floats are subtractedand the result used to build a new series called UpMinusDown. This new indicator seriesbehaves similar to the ATR indicator.
Interpretation
Sum is most useful when making your own custom indicators to integrate over aspecified number of Periods.
Calculation
Simply the addition of price over the period specified.
Sum = ( P1 + P2 + ... + Pn )
where,
Sum = summation of price valuesP = price series to be summated, #Open, #Close, TrueRangeSeries, SMASeries, etc . . .n = number of periods or Bars

Technical Indicator Functions 270
© 2003-2006 FMR Corp. All rights reserved.
Example
{ Plot 20 bar sum of Highs minus Lows }var XUP, XDOWN: float;var UPMINUSDOWN, BAR, UDPANE: integer;UpMinusDown := CreateSeries;for Bar := 20 to BarCount - 1 dobegin xUp := Sum( Bar, #High, 20 ); xDown := Sum( Bar, #Low, 20 ); SetSeriesValue( Bar, UpMinusDown, xUp - xDown );end;UDPane := CreatePane( 70, false, true );PlotSeries( UpMinusDown, UDPane, #Olive, #Thick );
16.73 TII
TII( Bar: integer; Series: integer; Period: integer; MAPeriod: integer ): float;TIISeries( Series: integer; Period, MAPeriod ): integer;
RChartScripts RSimuScripts RPerfScripts XCMScripts
Description
TII is the Trend Intensity Index. It measures the strength of a trend by tabulating thedeviation of price and its moving average. Specify the number of bars to use whencalculating the indicator in the Period parameter, and the length of the moving averageto use in the MAPeriod parameter.
TII compares the price to its MAPeriod moving average, recording the deviation at eachbar. If price is above the moving average, a positive deviation is recorded, and if price isbelow the moving average a negative deviation. The deviation is simply the distancebetween price and the moving average.
Once the deviations are calculated, TII is calculated as:
( Sum of Positive Dev ) / ( ( Sum of Positive Dev ) + ( Sum of NegativeDev ) ) * 100
Interpretation
TII moves between 0 and 100. A strong uptrend is indicated when TII is above 80. Astrong downtrend is indicated when TII is below 20.
Example
var TIIPane, TIISer, Per, MAPer: integer;Per := 30;MAPer := 60;TIISer := TIISeries( #Close,Per,MAPer );TIIPane := CreatePane( 75, true, true );PlotSeriesLabel( TIISer, TIIPane, 009, #Thin, 'TIISer=TII(#Close,' + IntToStr(Per) + ',' + IntToStr(MAPer) + ')' );

WealthScript Function Reference, Wealth-Lab Pro™271
© 2003-2006 FMR Corp. All rights reserved.
16.74 TRIX
TRIX( Bar: integer; Series: integer; Period: integer ): float;TRIXSeries( Series: integer; Period: integer ): integer;
RChartScripts RSimuScripts RPerfScripts XCMScripts
Description
TRIX displays the percentage Rate of Change (see ROC) of a triple exponentially-smoothed moving average (EMA) over the specified Period. TRIX oscillates above andbelow the zero value. The indicator applies triple smoothing in an attempt to eliminateinsignificant price movements within the trend that you're trying to isolate.
Interpretation
TRIX generates a signal when it changes direction (turns up or down). Alternately, youcan create a signal line using a moving average and wait until TRIX crosses this signalline.
Note: UseUpdatedEMA affects the calculation of EMA-based indicators such as TRIXat runtime. Choose the default method for calculating the EMA exponent in theIndicator Calculations section of the Options dialog.
Example
{ Buy when TRIX turns up from below zero. Sell when TRIX crosses abovezero. }var TRIXPANE, BAR, Per: integer;Per := 24;TRIXPane := CreatePane( 50, true, true );PlotSeries( TRIXSeries( #Close, Per ), TRIXPane, 520, #Thick );DrawLabel( 'TRIX( Close, 24 )', TRIXPane );for Bar := 60 to BarCount - 1 dobegin if not LastPositionActive then begin if TurnUp( Bar, TRIXSeries( #Close, Per ) ) then if TRIX( Bar, #Close, 24 ) < 0 then BuyAtMarket( Bar + 1, '' ); end else begin if CrossOverValue( Bar, TRIXSeries( #Close, Per ), 0 ) then SellAtMarket( Bar + 1, LastPosition, '' ); end;end;
16.75 Trough
Trough( Bar: integer; Series: integer; Reversal: float ): float;TroughSeries( Series: integer; Reversal: float ): integer;
RChartScripts RSimuScripts RPerfScripts XCMScripts
Description

Technical Indicator Functions 272
© 2003-2006 FMR Corp. All rights reserved.
Returns the value of the last Trough that was identified for the specified Price Series as ofthe specified Bar. The Reversal parameter determines how much of a percentage(default) or point advance is required to trigger a new Trough. It typically requires a fewbars of upward price movement to reach the Reversal level and qualify a new Trough.The Trough function never "looks ahead" in time, but always returns the Trough value asit would have been determined as of the specified Bar. For this reason, the return valueof the Trough function will lag, and report troughs a few bars later than they actuallyoccurred in hindsight. This is intentional, and allows peak/trough detection to be usedwhen back-testing trading systems.
Interpretation
(See Peak )
Remarks
· To base reversals on point/absolute movement, pass the #AsPoint constant to theSetPeakTroughMode function in your script.
· Calculating peaks/troughs based on percentage moves is not allowed on data seriesthat contains negative or zero values. For these data series you must useSetPeakTroughMode to base the reversal amount on a point value.
Calculation
Troughs are detected by looking for a percentage (default) or point reversal in the PriceSeries greater than or equal to the reversal amount specified in the Reversal parameter.For example, if you specify a reversal value of 10, and prices make a new low of $20, atrough will be triggered at that bar as soon as prices move up to $22 (provided they donot continue below $20). The move up to $22 may take several bars. During these barsthe Trough function will not return $20, but will instead return the value of the previoustrough. This is because you would not have known that that $20 was an actual troughyet because the Reversal level has not been met. The new Trough value of $20 will bereturned only after prices have reached the $22 level, and the reversal level is reached.
Example
{ Draw the level of 7% Troughs on the chart }var PS: integer;PS := TroughSeries( #Low, 7 );PlotSeries( PS, 0, #Green, #Dots );
16.76 TroughBar
TroughBar( Bar: integer; Series: integer; Reversal: float ): integer;TroughBarSeries( Series: integer; Reversal: float ): integer;
RChartScripts RSimuScripts RPerfScripts XCMScripts
Description
Returns the bar number at which the last Trough that was identified for the specifiedPrice Series as of the specified Bar. The Reversal parameter determines how much of apercentage (default) or point decline is required to trigger a new Trough. It typicallyrequires a few bars of upward price movement to reach the Reversal level and qualify anew Trough. The Trough function never "looks ahead" in time, but always returns theTrough value as it would have been determined as of the specified bar. For this reason,
251
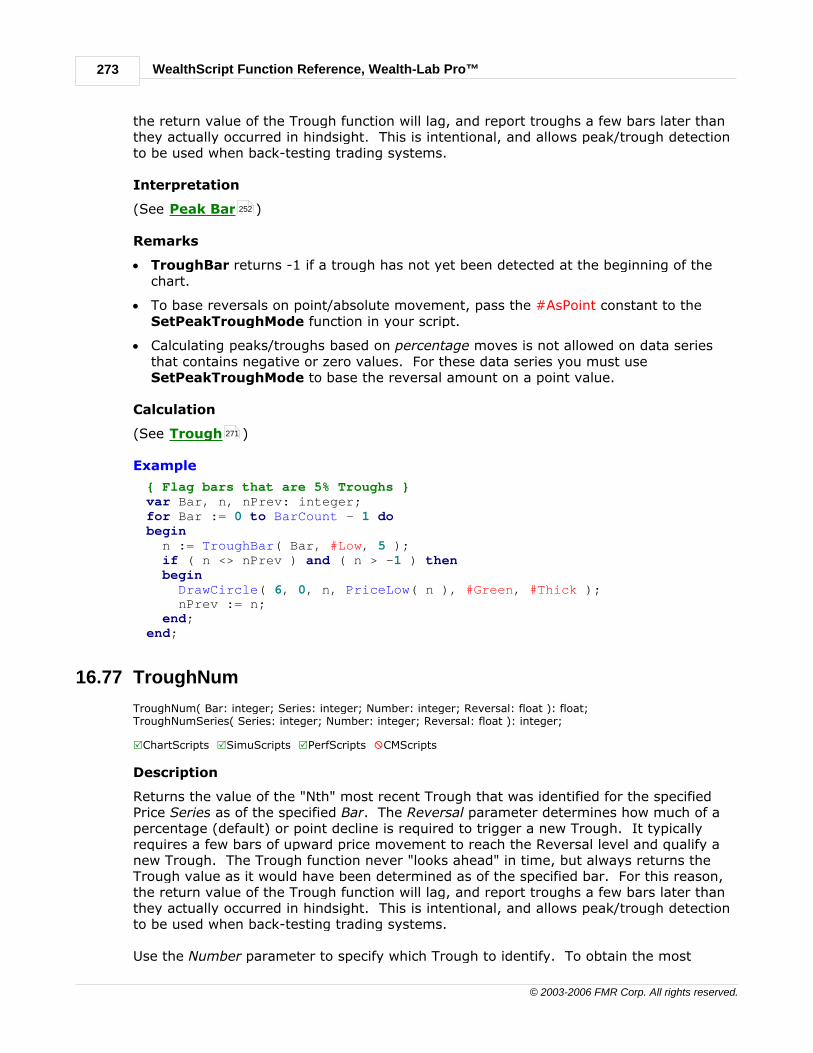
WealthScript Function Reference, Wealth-Lab Pro™273
© 2003-2006 FMR Corp. All rights reserved.
the return value of the Trough function will lag, and report troughs a few bars later thanthey actually occurred in hindsight. This is intentional, and allows peak/trough detectionto be used when back-testing trading systems.
Interpretation
(See Peak Bar )
Remarks
· TroughBar returns -1 if a trough has not yet been detected at the beginning of thechart.
· To base reversals on point/absolute movement, pass the #AsPoint constant to theSetPeakTroughMode function in your script.
· Calculating peaks/troughs based on percentage moves is not allowed on data seriesthat contains negative or zero values. For these data series you must useSetPeakTroughMode to base the reversal amount on a point value.
Calculation
(See Trough )
Example
{ Flag bars that are 5% Troughs }var Bar, n, nPrev: integer;for Bar := 0 to BarCount - 1 dobegin n := TroughBar( Bar, #Low, 5 ); if ( n <> nPrev ) and ( n > -1 ) then begin DrawCircle( 6, 0, n, PriceLow( n ), #Green, #Thick ); nPrev := n; end;end;
16.77 TroughNum
TroughNum( Bar: integer; Series: integer; Number: integer; Reversal: float ): float;TroughNumSeries( Series: integer; Number: integer; Reversal: float ): integer;
RChartScripts RSimuScripts RPerfScripts XCMScripts
Description
Returns the value of the "Nth" most recent Trough that was identified for the specifiedPrice Series as of the specified Bar. The Reversal parameter determines how much of apercentage (default) or point decline is required to trigger a new Trough. It typicallyrequires a few bars of upward price movement to reach the Reversal level and qualify anew Trough. The Trough function never "looks ahead" in time, but always returns theTrough value as it would have been determined as of the specified bar. For this reason,the return value of the Trough function will lag, and report troughs a few bars later thanthey actually occurred in hindsight. This is intentional, and allows peak/trough detectionto be used when back-testing trading systems.
Use the Number parameter to specify which Trough to identify. To obtain the most
252
271

Technical Indicator Functions 274
© 2003-2006 FMR Corp. All rights reserved.
recent Trough, pass 0 (although this is the same as using the Trough function). Number= 1 returns the previous Trough, 2 returns the second most previous, etc.
Interpretation
· Peaks/Troughs of highs and lows are often used as support and resistance levels.These points have historical significance because they have proven to be importantlevels of price reversal.
· Peaks and troughs are a convenient way of detecting chart patterns. For example, oneaspect of a Head & Shoulders Top is a series of 3 Peaks, the second higher than theouter two.
Remarks
· To base reversals on point/absolute movement, pass the #AsPoint constant to theSetPeakTroughMode function in your script.
· Calculating peaks/troughs based on percentage moves is not allowed on data seriesthat contains negative or zero values. For these data series you must useSetPeakTroughMode to base the reversal amount on a point value.
Calculation
Troughs are detected by looking for a percentage (default) or point reversal in the PriceSeries greater than or equal to the reversal amount specified in the Reversal parameter.For example, if you specify a reversal value of 10, and prices make a new low of $20, atrough will be triggered at that bar as soon as prices move up to $22 (provided they donot continue below $20). The move up to $22 may take several bars. During these barsthe Trough function will not return $20, but will instead return the value of the previoustrough. This is because you would not have known that that $20 was an actual troughyet because the reversal level has not been met. The new Trough value of $20 will bereturned only after prices have reached the $22 level, and the reversal level is reached.
Example
{ Draw resistance necklines for potential Double Bottoms }var T1, T2, DIFF, DIFFPCT, P1: float;var LASTPEAK: float;var BAR: integer;for Bar := 120 to BarCount - 1 dobegin if ROC( Bar, #Close, 120 ) < -20 then begin t1 := TroughNum( Bar, #Low, 0, 5 ); t2 := TroughNum( Bar, #Low, 1, 5 ); Diff := Abs( t1 - t2 ); DiffPct := ( Diff / PriceClose( Bar ) ) * 100; if DiffPct < 5 then begin p1 := Peak( Bar, #High, 5 ); if p1 <> LastPeak then begin LastPeak := p1; DrawLine( Bar, p1, Bar + 60, p1, 0, #Blue, #Thin ); end; end; end

WealthScript Function Reference, Wealth-Lab Pro™275
© 2003-2006 FMR Corp. All rights reserved.
end;
16.78 TrueRange
TrueRange( Bar ): float;TrueRangeSeries: integer;
RChartScripts RSimuScripts XPerfScripts XCMScripts
Description
True Range is apart of the Welles Wilder indicator collection. It is the actual range, highto low, of a bar. It includes any gap, between today's High or Low and yesterday's Close.As it can use the previous day in its calculation, the first periods true range may beundefined. The True Range is the maximum price movement over a period. True Rangeis the basis of the Average True Range (see ATR) indicator.
Interpretation
· True Range is a way to express a daily range without ignoring gaps that can occurbetween the previous close and the open.
· The True Range is not intended to be used as an indicator.
· The True Range is useful if used as a Price Series Parameter for another indicator as inthe EMA volatility example show below.
· Especially useful in volatility indicators, where the high and low prices may not includethe full volatility of price action.
· Can be incorporated in entry or exit triggers.
Calculation
True Range is always a positive number and is defined by Welles Wilder to be thegreatest of the following for each period:
The distance from today's high to today's low.The distance from yesterday's close to today's high.The distance from yesterday's close to today's low.
Example
{ Example 1, Show how the ATR indicator is created }var MYATR, ATRPANE: integer;MyATR := WilderMASeries( TrueRangeSeries, 14 );ATRPane := CreatePane( 100, true, true );PlotSeries( MyATR, ATRPane, #Maroon, #Thick );PlotSeries( ATRSeries( 14 ), ATRPane, #Red, #Thin );DrawLabel( 'Ex 1: WilderMASeries(TrueRangeSeries,14)', ATRPane );
{ Example 2, Show how True Range is used in EMA volatility }var TRPane: integer;var range_s: integer; // Series// EMA(True Range)range_s := EMASeries(TrueRangeSeries, 21);// Plot True RangeTRPane := CreatePane( 100, true, true );PlotSeries( range_s, TRPane, #Maroon, #Thick );

Technical Indicator Functions 276
© 2003-2006 FMR Corp. All rights reserved.
DrawLabel( 'Ex 2: EMA(TrueRangeSeries)', TRPane );
16.79 UltimateOsc
UltimateOsc( Bar: integer ): float;UltimateOscSeries: integer;
RChartScripts RSimuScripts XPerfScripts XCMScripts
Description
Williams' Ultimate Oscillator uses weighted sums of three oscillators, each using adifferent time period (7, 14, and 28), which represent short, medium, and long termmarket trends. The Ultimate Oscillator moves within the range of 0 to 100.
Interpretation
Williams recommended method of interpreting the Ultimate Oscillator is to look fordivergences between the indicator value and price. For example, a bullish divergenceoccurs when prices make a lower low, but the Ultimate Oscillator fails to make a lowerlow.
Example
{ Look for bullish divergences between Ultimate Oscillator and Price }var T1, T2: float;var UUP, PUP: boolean;var ULTOSCPANE, UTROUGH, PTROUGH, BAR: integer;
UltOscPane := CreatePane( 80, true, true );PlotSeries( UltimateOscSeries, UltOscPane, 022, #Thick );DrawLabel( 'UltimateOsc', UltOscPane );
SetPeakTroughMode( #AsPoint );UTrough := TroughSeries( UltimateOscSeries, 10 );PlotSeries( UTrough, UltOscPane, #Green, #Dots );PTrough := TroughSeries( #Close, 10 );PlotSeries( PTrough, 0, #Green, #Dots );for Bar := 100 to BarCount - 1 dobegin t1 := Trough( Bar, UltimateOscSeries, 10 ); t2 := TroughNum( Bar, UltimateOscSeries, 1, 10 ); UUp := t1 > t2; t1 := Trough( Bar, #Close, 10 ); t2 := TroughNum( Bar, #Close, 1, 10 ); PUp := t1 > t2; if UUp and not PUp then SetBarColor( Bar, #Green );end;
16.80 VHF
VHF( Bar: integer; Series: integer; Period: integer ): float;VHFSeries( Series: integer; Period: integer ): integer;
RChartScripts RSimuScripts RPerfScripts XCMScripts

WealthScript Function Reference, Wealth-Lab Pro™277
© 2003-2006 FMR Corp. All rights reserved.
Description
The Vertical Horizontal Filter is used to determine if prices are trending or are in acongestion stage. It is calculated by dividing the difference in the sums of highest andlowest values by the sum of the absolute values of daily price differences. Typically aperiod of 28 is used for VHF.
Interpretation
VHF describes how strongly prices are trending. The higher the VHF value, the strongerthe trend.
Example
{ Color chart background when prices are trending according to VHF }var VHFPANE, BAR: integer;VHFPane := CreatePane( 70, true, true );PlotSeries( VHFSeries( #Close, 28 ), VHFPane, 952, #Thin );DrawLabel( 'VHF( 28 )', VHFPane );for Bar := 28 to BarCount - 1 do if VHF( Bar, #Close, 28 ) > 0.4 then SetBackgroundColor( Bar, 789 );
16.81 Vidya
Vidya( Bar: integer; Series: integer; VolatilityIndex: integer; Alpha: float ): float;VidyaSeries( Series: integer; VolatilityIndex: integer; Alpha: float ): integer;
RChartScripts RSimuScripts RPerfScripts XCMScripts
Description
Vidya returns Tushar Chande's Variable Index Dynamic Average. Vidya is similar to anExponential Moving Average, but uses a different period for each bar of calculation. Theperiod to use is determined by the bar's volatility. Bars with a high volatility will use ashorter period, and those with a low volatility a longer period. This results in an indicatorthat is very responsive to abrupt market moves, but becomes less responsive duringconsolidation periods.
Vidya requires a "Volatility Index", which should be some indicator that tracks marketvolatility. Specify the Volatility Index as a Price Series in the VolatilityIndex parameter.The resulting Vidya will have lower effective periods on bars where the Index indicateshigh volatility.
Vidya also requires a floating point Alpha parameter. The values of the Volatility Indexare multiplied by Alpha to modulate the sensitivity of the Vidya. You should arrive at avalue of Alpha such that (1 - Alpha * Volatility Index) never becomes negative.
Interpretation
You can interpret Vidya as you would another moving average. Additionally, Vidya tendsto respond more quickly and go flat during consolidation periods.
Example
{ Vidya using Standard Deviation as Volatility Index }var STD, SMASTD, VOLIDX, VIDYASTDDEV: integer;
Technical Indicator Functions 278
© 2003-2006 FMR Corp. All rights reserved.
{ Obtain Current Std Dev as a ratio of Historic Std Dev }Std := StdDevSeries( #Close, 10 );SmaStd := SMASeries( Std, 50 );VolIDX := DivideSeries( Std, SmaStd );
{ Create the Vidya }VidyaStdDev := VidyaSeries( #Close, VolIDX, 0.1 );PlotSeries( VidyaStdDev, 0, #Red, 2 );
16.82 VMA
VMA( Bar: integer; Series: integer; Period: integer ): float;VMASeries( Series: integer; Period: integer ): integer;
RChartScripts RSimuScripts RPerfScripts XCMScripts
Description
VMA returns the Volume-Weighted Moving Average for the specified Price Series andPeriod. VMA is similar to a Simple Moving Average (SMA), but each bar of data isweighted by the bar's volume.
VMA places more significance on bars with the largest volume and less for bars withlowest volume for the Period specified. The VMA value attempts to represent the averagepurchase price of the past number of periods, as it assumes that all prices were traded atselected time (usually the closing value). Using VMA, you can judge if you are buying at alow value or selling at a high value compared to the averaged price paid by all marketparticipants.
Because important breakouts are often accompanied by a large increase in volume, VMAwill track aggressive moves more closely than other types of moving averages. Duringconsolidation periods, where volume is light, VMA will act like a normal Simple MovingAverage.
Interpretation
· Use the same rules that we apply to SMA when interpreting VMA. Keep in mind,though, that VMA is generally more sensitive to price movement on high volume days.
· VMA's are used to determine trend direction. If the VMA is moving up, the trend is up,if moving down then the trend is down. A 200-bar VMA is common proxy for the longterm trend. 60-bar VMA's are typically used to gauge the intermediate trend. Shorter-period VMA's can be used to determine short-term trends.
· VMA's are commonly used to smooth price data and technical indicators. Applying aVMA smooths out choppy data. The longer the period of the VMA, the smoother theresult, but more lag is introduced between the VMA and the source series.
· VMA crossing price is often used to trigger trading signals. For example, when pricescross above the VMA go long, and when they cross below the VMA go short.
· Look for differences between the SMA and the VMA with the same number of periods.When the WMA is above the SMA then buyers are active and are accumulating stock,go long. When the WMA is below the SMA then seller are active, and stock is beingsold, go short.

WealthScript Function Reference, Wealth-Lab Pro™279
© 2003-2006 FMR Corp. All rights reserved.
Calculation
VMA = ( V1 * P1 + V2 * P2 + ... + Vn * Pn ) / ( V1 + V2 + ... + Vn )
where,
P1 = current priceP2 = price one bar ago, etc . .V1 = current volumeV2 = volume one bar agon = number of periods/bars
Example
{ Compare a Volume Weighted Moving Average with a standard MA }PlotSeries( SMASeries( #Close, 60 ), 0, 005, #Thin );PlotSeries( VMASeries( #Close, 60 ), 0, 005, #Thick );
16.83 Volatility
Volatility( Bar: integer; Period: integer; ROCPeriod: integer ): float;VolatilitySeries( Period: integer; ROCPeriod: integer ): integer;
RChartScripts RSimuScripts XPerfScripts XCMScripts
Description
Return's Chaikin's Volatility indicator of the specified Moving Average and ROC periods.Chaikin's Volatility first calculates an Exponential Moving Average (EMA) of the differencebetween the High and Low price. The Volatility indicator is then created by taking theRate of Change (ROC) of this value over a period specified by ROCPeriod. The period ofthe EMA is specified in the Period parameter.
Interpretation
· High values indicate that intraday prices have a wide high to low range. Low valuesindicate that intraday prices have relatively constant high to low range.
· Market tops accompanied by increase volatility over short periods of time, indicatenervous and indecisive traders. Or market tops with decreasing volatility over longtime frames, indicate maturing bull markets.
· Market bottoms accompanied by decreased volatility over long periods of time, indicatebored and disinterested traders. Or market bottoms with increasing volatility overrelatively sort time periods, indicate panic sell off.
Calculation
First calculate an Exponential Moving Average (EMA) of the difference between High andLow price.
HLAve = 10-day EMA( High - Low)
Then take the Rate of Change (ROC) of this value over a period specified by ROCPeriod.
CV = ( HLAve) / ( HLAve n days ago)
where,
CV = Chaikin's Volatility value
Technical Indicator Functions 280
© 2003-2006 FMR Corp. All rights reserved.
n = number of ROC periods
Note: UseUpdatedEMA affects the calculation of EMA-based indicators such asVolatility. Choose the default method for calculating the EMA exponent in theIndicator Calculations section of the Options dialog.
Example
{ Colors bars with higher intensity red as volatility increases }var V: float;var VOLPANE, BAR, N: integer;VolPane := CreatePane( 100, true, true );PlotSeries( VolatilitySeries( 14, 10 ), VolPane, 062, #ThickHist );DrawLabel( 'Volatility( 14, 10 )', VolPane );for Bar := 0 to BarCount - 1 dobegin v := Volatility( Bar, 14, 10 ); n := Round( v ) div 10; if n < 0 then n := 0; if n > 9 then n := 0; SetBarColor( Bar, n * 100 );end;
16.84 WilderMA
WilderMA( Bar: integer; Series: integer; Period: integer ): float;WilderMASeries( Series: integer; Period: integer ): integer;
RChartScripts RSimuScripts RPerfScripts XCMScripts
Description
WilderMA is sometimes call Wilder's Smoothing, and it returns the Moving Average ascalculated by Welles Wilder in his book New Concepts in Technical Trading. This indicatoris similar to the Exponential Moving Average. Compared to other moving averages,WildersMA responds slowly to price changes. A n-period WildersMA gives similar valuesto a 2n period EMA. For example, a 14-period EMA has almost the same values as a 7-period WilderMA.
Interpretation
· WilderMA can be interpreted in the same way as other moving averages. The WilderMAis like a EMA with half number of periods. See the EMA indicator for more information.
· You should use a WilderMA when calculating other Wilder's indicators to ensureconsistent results with other systems and users.
· If you are after a smoothing indicator for general use, it is best to use the SMA orEMA.
Calculation
WilderMA is calculated for periods "n" as follows:
Wilder MA = ( Previous Wilder MA * ( n - 1 ) + Price Series Value ) / n
where,
WealthScript Function Reference, Wealth-Lab Pro™281
© 2003-2006 FMR Corp. All rights reserved.
n = number of periodsPrice Series Value = data you wish to average
Example
{ Compare a Simple and Exponential Moving Average with Wilder's MA }var n: integer;var s, s2: string;n := 14;s := '(Close, ' + IntToStr( n ) + ' )';s2 := '(Close, ' + IntToStr( 2 * n ) + ' )';PlotSeriesLabel( WilderMASeries( #Close, n ), 0, 090, #Thick, 'WilderMA'+ s );PlotSeriesLabel( SMASeries( #Close, n ), 0, 900, #Thin, 'SMA' + s );PlotSeriesLabel( EMASeries( #Close, 2 * n ), 0, 005, #Thin, 'EMA' + s2 );
16.85 WilliamsR
WilliamsR( Bar: integer; Period: integer ): float;WilliamsRSeries( Period: integer ): integer;
RChartScripts RSimuScripts XPerfScripts XCMScripts
Description
Williams %R is a momentum indicator developed by Larry Williams. Like StochasticOscillators (StochK, StochD), WilliamsR is used to gauge overbought and oversold levels,and ranges between 0 and 100. However, unlike most other momentum oscillators, thelow end of the scale represents an overbought area, and the high end an oversoldcondition. For this reason Williams %R is often multiplied by -1 and plotted on a negativescale.
Williams %R measures the latest closing price relative to high low range within the pastdata, thus it reflects buyers and sellers commitment to close the price within that range.At the peak of the buyer's power the oscillator reaches zero, and at the peak of theseller's power, it reaches 100. The overbought region is below 10 percent and theoversold region is over 90 percent.
Interpretation
A reading of above 80 or 90 indicates oversold levels, and below 20 or 10 indicatesoverbought. Williams %R has a tendency to peak ahead of price, so it can be a good toolin identifying trend reversals. During strong trends, the Williams %R can remain in theoversold or overbought regions for extended periods of time.
· In ranging markets, go long when the indicator falls below the oversold line then risesback above the oversold line.
· In ranging markets, go short when indicator rises above the overbought line the fallsback below the overbought line.
· In ranging markets, go long on bullish divergences, if the indicator's first trough is inthe oversold zone.
· In ranging markets, go short on bearish divergences, if the indicator's first peak is inthe overbought zone.
· In a up trend or rally, go short if the indicator fails to reach the oversold region and
Technical Indicator Functions 282
© 2003-2006 FMR Corp. All rights reserved.
begins to fall. This is a swing failure, it show the buyers are weakening.
· In a down trend, go long when the indicator fails to reach the overbought region andbegins to rise. This is a swing failure, it show the sellers are weakening.
Calculation
Wm%R = 100 * ( Hn - C ) / ( Hn - Ln )
where,
n = period, such as 7 daysHn = Highest high in last n periodsLn = Lowest low in last n periodC = closing price of latest bar
Example
{ Color the chart background for smoothed Williams %R oversold andoverbought levels }var X: float;var PCTRPANE, SMOOTHR, BAR: integer;PctRPane := CreatePane( 75, true, true );PlotSeries( WilliamsRSeries( 14 ), PctRPane, 511, #Thick );SmoothR := WilderMASeries( WilliamsRSeries( 14 ), 4 );DrawLabel( 'WilliamsR( 14 )', PctRPane );PlotSeries( SmoothR, PctRPane, #Black, #Thin );for Bar := 20 to BarCount - 1 dobegin x := GetSeriesValue( Bar, SmoothR ); if x < 20 then SetBackgroundColor( Bar, #RedBkg ) else if x > 80 then SetBackgroundColor( Bar, #BlueBkg );end;
16.86 WMA
WMA( Bar: integer; Series: integer; Period: integer ): float;WMASeries( Series: integer; Period: integer ): integer;
RChartScripts RSimuScripts RPerfScripts XCMScripts
Description
WMA returns a linearly-Weighted Moving Average of the Price Series over the specifiedPeriod.
Whereas a Simple Moving Average (SMA) calculates a straight average of the data, WMAapplies more weight to the data that is more current. The most weight is placed on themost recent data point. Because of the way it's calculated, WMA will follow prices moreclosely than a corresponding SMA.
Interpretation
· Use the same rules that we apply to SMA when interpreting WMA. Keep in mind,though, that WMA is generally more sensitive to price movement. This can be adouble-edged sword. On the one hand, it can get you into trends a bit earlier than an

WealthScript Function Reference, Wealth-Lab Pro™283
© 2003-2006 FMR Corp. All rights reserved.
WMA would. On the other hand, the WMA will probably experience more whipsawsthan a corresponding SMA.
· Use the WMA to determine trend direction, and trade in that direction. When the WMArises then buy when prices dip near or a bit below the WMA. When the WMA falls thensell when prices rally towards or a bit above the WMA.
· Moving averages can also indicate support and resistance areas. A rising WMA tends tosupport the price action and a falling WMA tends to provide resistance to price action.This reinforces the idea of buying when price is near the rising WMA or selling whenprice is near the falling WMA.
· All Moving Averages, including the WMA are not designed to get you into a trade at theexact bottom and out again at the exact top. They tend to ensure that you're tradingin the general direction of the trend, but with a delay at the entry and exit. The WMAhas a shorter delay then the SMA.
Calculation
WMA is a linearly-weighted moving average that is calculated by multiplying the first datapoint (oldest in time) by 1, the second by 2, the third by 3, etc. The final result is thendivided by the sum of the weights. More recent data is thus more heavily weighted, andcontributes more to the final WMA value. WMA excludes price data outside the length ofthe moving average, Period.
WMA = ( P1 * n + P2 * (n-1) + P3 * (n-2) + ... ) / ( n + (n-1) + (n-2) +... )
where,
P1 = Current PriceP2 = price one bar ago, etc….n = number of periods
Example
{ This sample system acts on crossovers of 60 and 80 period WMAs }var BAR, WMASlow, WMAFast: integer;WMASlow := WMASeries( #Close, 80 );WMAFast := WMASeries( #Close, 60 );PlotSeriesLabel( WMAFast, 0, 900, #Thin, 'WMAFast' );PlotSeriesLabel( WMASlow, 0, 009, #Thin, 'WMASlow' );
InstallProfitTarget( 20 );for Bar := 80 to BarCount - 1 dobegin ApplyAutoStops( Bar ); if LastPositionActive then begin if CrossUnder( Bar, WMAFast, WMASlow ) then SellAtMarket( Bar + 1, LastPosition, '' ); end else begin if CrossOver( Bar, WMAFast, WMASlow ) then BuyAtMarket( Bar + 1, '' ); end;end;

Time Frame Functions 284
© 2003-2006 FMR Corp. All rights reserved.
17 Time Frame Functions
17.1 Overview
The Time Frame functions are probably the most difficult to understand of theWealthScript functions, yet once you have mastered them, you will see how easy it is tocreate complex trading systems based on data and indicators in other time frames.
Two concepts relating to time frames are necessary to understand. The first is that youcan Scale the data in the primary series using the using the Scale toolbar for
ChartScripts ( , , ) and the Scale tab controls in the $imulator, Rankings, andScans tools. Scaling in this manner re-creates the data into a new base time frame,which allows you to generate trades in the new scale. Note that the ChangeScalefunction serves this same purpose, but it is useful only in the ChartScript window.
Unlike the aforementioned scaling features of Wealth-Lab, the Time Frame functions donot change the base time frame and therefore do not allow you to make trades onresultant Price Series. This group of functions allow you to create indicators in morecompressed time frames that must be restored or projected back to the original basetime frame.
Scaling and Time Frame Notes:
1. Transforming intraday data to multiples of its underlying interval using the Scaletoolbar is currently available only for ChartScript windows. A similar intradayscaling feature does not exist for the $imulator, Scans, and Rankings.
2. It is not possible to place trades on a Primary Series that has been time-compressedfrom within a script using SetScaleCompressed or SetScaleDaily, for example.
These WealthScript Time Frame functions allow you only to generate indicators andother Price Series in a more compressed time frame that must be referenced backto the base time frame.
For more information, see the discussion of Understanding Time Frames in theWealthScript Guide.
Note: The Time Frame category of WealthScript functions are not available forSimuScripts.
17.2 ChangeScale
ChangeScale( Scale: integer );
RChartScripts XSimuScripts XPerfScripts XCMScripts
Description
Changes the scale of the chart window to the scale specified in the Scale parameter. Youmust use the following constants to specify scale:
#Daily, #Weekly, #Monthly
284

WealthScript Function Reference, Wealth-Lab Pro™285
© 2003-2006 FMR Corp. All rights reserved.
Use this function if you have a system that should always operate on weekly data, forexample, to save you from having to manually change scale from the toolbar.
Remarks
• Available from the ChartScript window only.
• ChangeScale works differently than other functions. The parser looks for thestatement in the code and changes scale before executing the script. If you do notwant to change the scale then do not include this statement - even in a commentblock!
• Do not use ChangeScale more than once in the same ChartScript. Only the firstChangeScale call will be honored.
Example
ChangeScale( #Weekly );{ System rules for weekly scale only follow }
17.3 DailyFromMonthly
DailyFromMonthly( Series: integer ): integer;
RChartScripts XSimuScripts XPerfScripts XCMScripts
Description
Returns the daily price Series [handle] from a previously accessed monthly series (usingSetScaleMonthly) specified by the parameter Series. The function creates a new PriceSeries synched with the current daily chart, and populates it with the appropriate valuesfrom the monthly series. The result will be repeated values (typically 20 or so) for eachmonth within the series.
Example
{ Plot monthly high/low bands on the daily chart }var MH, ML, MHP, MLP: integer;SetScaleMonthly;mh := #High;ml := #Low;RestorePrimarySeries;mhp := DailyFromMonthly( mh );mlp := DailyFromMonthly( ml );PlotSeries( mhp, 0, #Red, #Thin );PlotSeries( mlp, 0, #Blue, #Thin );

Time Frame Functions 286
© 2003-2006 FMR Corp. All rights reserved.
17.4 DailyFromWeekly
DailyFromWeekly( Series: integer ): integer;
RChartScripts XSimuScripts XPerfScripts XCMScripts
Description
Returns a daily price series [handle] from a previously accessed weekly series (usingSetScaleWeekly) specified by the parameter Series. The function creates a new PriceSeries synched with the current daily chart, and populates it with the appropriate valuesfrom the weekly series. The result will be repeated values (typically 5) for each weekwithin the series.
Example
{ Plot 52 week moving average on the daily chart }var WSMA, WSMAP: integer;SetScaleWeekly;wsma := SMASeries( #Close, 52 );RestorePrimarySeries;wsmap := DailyFromWeekly( wsma );PlotSeries( wsmap, 0, #Olive, #Thick );
17.5 GetDailyBar
GetDailyBar( Bar: integer ): integer;
RChartScripts XSimuScripts XPerfScripts XCMScripts
Description
Lets you access daily data from within an intraday chart. The daily series must havebeen obtained after a call to SetScaleDaily. GetDailyBar returns the Bar Number ofthe daily series that corresponds to the specified Bar in the intraday series. This functionworks only within an intraday chart.
Example
{ Highlight bars on the intraday chart where a daily moving average crossover took place }var Bar, BarDaily, SMA1, SMA2: integer;
{ Get the daily moving averages }SetScaleDaily;SMA1 := SMASeries( #Close, 5 );SMA2 := SMASeries( #Close, 10 );RestorePrimarySeries;
{ Now, cycle through our intraday bars }for Bar := 60 to BarCount - 1 dobegin{ Get corresponding daily bar value } BarDaily := GetDailyBar( Bar ); if BarDaily > 1 then if CrossOver( BarDaily, SMA1, SMA2 ) then SetBarColor( Bar, #Green );end;

WealthScript Function Reference, Wealth-Lab Pro™287
© 2003-2006 FMR Corp. All rights reserved.
17.6 GetIntraDayBar
GetIntraDayBar( Bar: integer; Interval: integer ): integer;
RChartScripts XSimuScripts XPerfScripts XCMScripts
Note: Not applicable to second or tick-based charts.
Description
Lets you access a compressed Price Series in a higher time frame (created withSetScaleCompressed). This function takes a Bar number and converts it to thecorresponding bar in the compressed series Interval. So you can, for example, get thecorrect bar of data in a 15 minute compressed Price Series from a 1 minute chart.
Example
{ Uses 15 minute RSI for buy/sell signals }var RSIPANE, RSI_20_15, RSI_20_15_S, BAR, BAR15: integer;
RSIPane := CreatePane( 100, true, true );SetScaleCompressed( 15 );RSI_20_15 := RSISeries( #Close, 20 );RSI_20_15 := OffsetSeries( RSI_20_15, -1 );RestorePrimarySeries;RSI_20_15_S := IntradayFromCompressed( RSI_20_15, 15 );PlotSeries( RSI_20_15_S, RSIPane, #Blue, #Thin );
for Bar := 100 to BarCount - 1 dobegin Bar15 := GetIntraDayBar( Bar, 15 ); if CrossOverValue( Bar15, RSI_20_15, 30 ) and not LastPositionActivethen BuyAtMarket( Bar + 1, '15 minute RSI' ) else if CrossOverValue( Bar15, RSI_20_15, 50 ) then SellAtMarket( Bar + 1, LastPosition, '15 minute RSI' );end;
17.7 GetMonthlyBar
GetMonthlyBar( Bar: integer ): integer;
RChartScripts XSimuScripts XPerfScripts XCMScripts
Description
Lets you access monthly data from within a daily chart. GetMonthlyBar returns the BarNumber in the monthly series that corresponds to the specified Bar in the daily series.The monthly series must have been obtained after a call to SetScaleMonthly. Thisfunction only works within a daily chart.
Example
{ Highlight bars on the daily chart where 5 month RSI is below 30 }var BAR, MONTHLYBAR: integer;for Bar := 30 to BarCount - 1 dobegin

Time Frame Functions 288
© 2003-2006 FMR Corp. All rights reserved.
MonthlyBar := GetMonthlyBar( Bar ); begin SetScaleMonthly; if RSI( MonthlyBar, #Close, 5 ) < 30 then SetBarColor( Bar, #Green ); RestorePrimarySeries; end;end;
17.8 GetWeeklyBar
GetWeeklyBar( Bar: integer ): integer;
RChartScripts XSimuScripts XPerfScripts XCMScripts
Description
Lets you access weekly data from within a daily chart. GetWeeklyBar provides the barnumber in the weekly series that corresponds to the specified Bar in the daily series. Theweekly series must have been obtained after a call to SetScaleWeekly. This functiononly works within a daily chart.
Example
{ Highlight bars on the daily chart where weekly MACD has turned up }var WEEKLYMACD, BAR, WEEKLYBAR: integer;SetScaleWeekly;WeeklyMACD := MACDSeries( #Close );RestorePrimarySeries;for Bar := 10 to BarCount - 1 dobegin WeeklyBar := GetWeeklyBar( Bar ); if TurnUp( WeeklyBar, WeeklyMACD ) then SetBarColor( Bar, #Blue );end;
17.9 IntraDayFromCompressed
IntraDayFromCompressed( Series: integer; Interval: integer ): integer;
RChartScripts XSimuScripts XPerfScripts XCMScripts
Note: Not applicable to second or tick-based charts.
Description
Use this function to take a Price Series that was created in a higher time frame havingthe specified Interval (using SetScaleCompressed) and create a correspondingexpanded Price Series that is synchronized with the base time frame.IntraDayFromCompressed returns the integer Price Series handle for the newsynchronized series.
For example, you might have created a 15 minute compressed time frame Price Series ina 1-minute chart. The compressed series has 1 bar of data for every 15 bars in the basechart. This makes plotting the compressed series impossible.IntraDayFromCompressed will expand the 15-minute Price Series, effectively
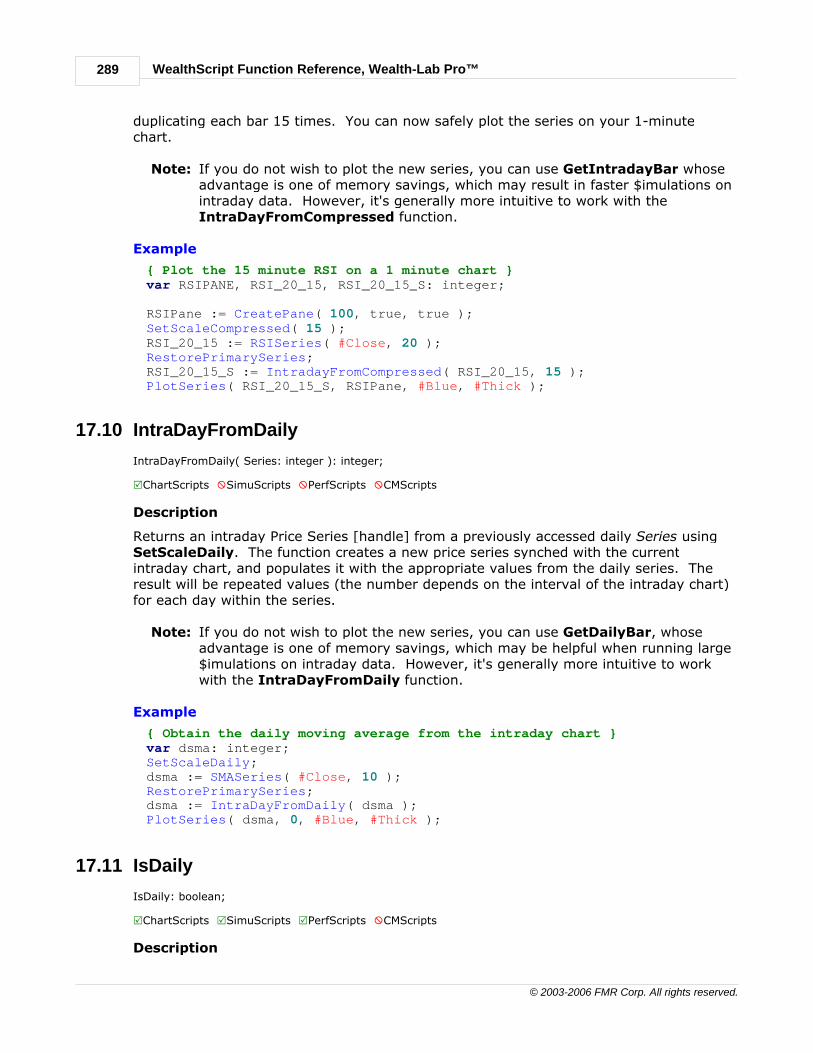
WealthScript Function Reference, Wealth-Lab Pro™289
© 2003-2006 FMR Corp. All rights reserved.
duplicating each bar 15 times. You can now safely plot the series on your 1-minutechart.
Note: If you do not wish to plot the new series, you can use GetIntradayBar whoseadvantage is one of memory savings, which may result in faster $imulations onintraday data. However, it's generally more intuitive to work with theIntraDayFromCompressed function.
Example
{ Plot the 15 minute RSI on a 1 minute chart }var RSIPANE, RSI_20_15, RSI_20_15_S: integer;
RSIPane := CreatePane( 100, true, true );SetScaleCompressed( 15 );RSI_20_15 := RSISeries( #Close, 20 );RestorePrimarySeries;RSI_20_15_S := IntradayFromCompressed( RSI_20_15, 15 );PlotSeries( RSI_20_15_S, RSIPane, #Blue, #Thick );
17.10 IntraDayFromDaily
IntraDayFromDaily( Series: integer ): integer;
RChartScripts XSimuScripts XPerfScripts XCMScripts
Description
Returns an intraday Price Series [handle] from a previously accessed daily Series usingSetScaleDaily. The function creates a new price series synched with the currentintraday chart, and populates it with the appropriate values from the daily series. Theresult will be repeated values (the number depends on the interval of the intraday chart)for each day within the series.
Note: If you do not wish to plot the new series, you can use GetDailyBar, whoseadvantage is one of memory savings, which may be helpful when running large$imulations on intraday data. However, it's generally more intuitive to workwith the IntraDayFromDaily function.
Example
{ Obtain the daily moving average from the intraday chart }var dsma: integer;SetScaleDaily;dsma := SMASeries( #Close, 10 );RestorePrimarySeries;dsma := IntraDayFromDaily( dsma );PlotSeries( dsma, 0, #Blue, #Thick );
17.11 IsDaily
IsDaily: boolean;
RChartScripts RSimuScripts RPerfScripts XCMScripts
Description

Time Frame Functions 290
© 2003-2006 FMR Corp. All rights reserved.
Returns true if the current chart is on daily scale.
Example
{ if not daily, print a message to the debug window and exit }if not IsDaily thenbegin Print('Not using daily scale'); exit;end;
17.12 IsIntraday
IsIntraday: boolean;
RChartScripts RSimuScripts RPerfScripts XCMScripts
Description
Returns true if the current chart is on an intraday scale. An intraday scale can be madeof intervals of minutes, seconds, or ticks. Use the BarInterval function to determine thenumber of minutes, ticks, or seconds per bar, i.e., the interval.
Example
{ if not intraday, print a message to the debug window and exit }if not IsIntraday thenbegin Print('Not an intraday scale'); exit;end;
17.13 IsMonthly
IsMonthly: boolean;
RChartScripts RSimuScripts RPerfScripts XCMScripts
Description
Returns true if the current chart is on monthly scale.
Example
{ if not monthly, print a message to the debug window and exit }if not IsMonthly thenbegin Print('Not using a monthly scale'); exit;end;
17.14 IsWeekly
IsWeekly: boolean;
RChartScripts RSimuScripts RPerfScripts XCMScripts

WealthScript Function Reference, Wealth-Lab Pro™291
© 2003-2006 FMR Corp. All rights reserved.
Description
Returns true if the current chart is on weekly scale.
Example
{ if not weekly, print a message to the debug window and exit }if not IsWeekly thenbegin Print('Not using a weekly scale'); exit;end;
17.15 SetScaleCompressed
SetScaleCompressed( Interval: integer );
RChartScripts XSimuScripts XPerfScripts XCMScripts
Note: Not applicable to second or tick-based charts.
Description
Sets the chart's time scale to a more compressed intraday time frame. Future PriceSeries that are acquired will be based on the new time frame, which is specified in theInterval parameter. You should always revert back to the base scale by callingRestorePrimarySeries after changing time frame.
SetScaleCompressed will work on intraday charts only. You can only change to a highertime frame that is possible to create from the current time frame. For example, if you'reworking in a base 5-minute chart, you can compress to 10, 15 or 20 minutes, but not to1 or 7 minutes. Base 1-minute charts can be compressed to any higher time interval.
You can use the higher time frame data series in your charts in 2 ways. To plot an entireseries you must first convert the higher time frame series back to the base time frame byusing IntraDayFromCompressed. To access an individual bar from a higher timeframe series (without the ability to plot the series in the lower time frame) you shoulduse GetIntraDayBar to obtain the correct bar number to access.
Important Note
When using data from a higher time frame in trading systems, you should be sure to takean action only on a bar that has complete data for the higher time frame. For example, ifaccessing 15-minute bars, only take trades on even 15 minute boundaries. Alternately,you can shift the higher time frame Price Series 1 bar to the right using OffsetSeries tosafely use the previous value.
Example
{ The chart will depict a 15 minute SMA and RSI from a 1, 3 or 5 minutechart }var SMA_20, SMA_20_15, SMA_20_15_S, RSIPANE, RSI_20_15, RSI_20_15_S:integer;
SMA_20 := SMASeries( #Close, 20 );SetScaleCompressed( 15 );SMA_20_15 := SMASeries( #Close, 20 );
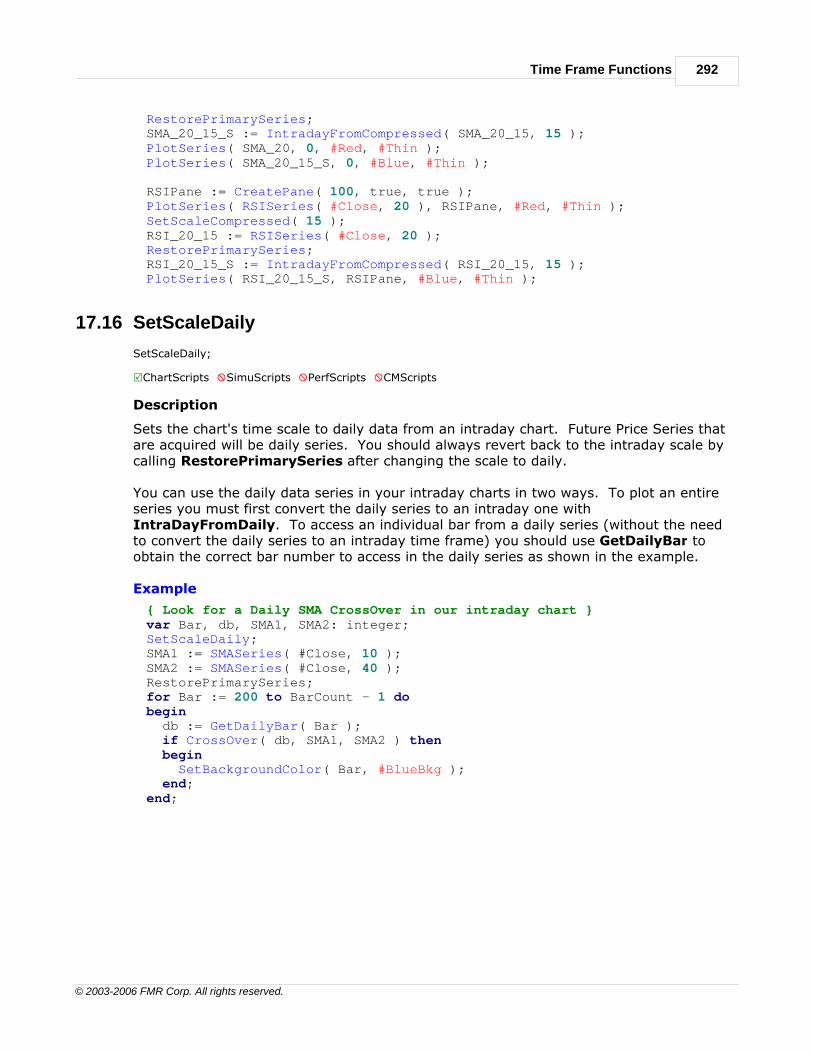
Time Frame Functions 292
© 2003-2006 FMR Corp. All rights reserved.
RestorePrimarySeries;SMA_20_15_S := IntradayFromCompressed( SMA_20_15, 15 );PlotSeries( SMA_20, 0, #Red, #Thin );PlotSeries( SMA_20_15_S, 0, #Blue, #Thin );
RSIPane := CreatePane( 100, true, true );PlotSeries( RSISeries( #Close, 20 ), RSIPane, #Red, #Thin );SetScaleCompressed( 15 );RSI_20_15 := RSISeries( #Close, 20 );RestorePrimarySeries;RSI_20_15_S := IntradayFromCompressed( RSI_20_15, 15 );PlotSeries( RSI_20_15_S, RSIPane, #Blue, #Thin );
17.16 SetScaleDaily
SetScaleDaily;
RChartScripts XSimuScripts XPerfScripts XCMScripts
Description
Sets the chart's time scale to daily data from an intraday chart. Future Price Series thatare acquired will be daily series. You should always revert back to the intraday scale bycalling RestorePrimarySeries after changing the scale to daily.
You can use the daily data series in your intraday charts in two ways. To plot an entireseries you must first convert the daily series to an intraday one withIntraDayFromDaily. To access an individual bar from a daily series (without the needto convert the daily series to an intraday time frame) you should use GetDailyBar toobtain the correct bar number to access in the daily series as shown in the example.
Example
{ Look for a Daily SMA CrossOver in our intraday chart }var Bar, db, SMA1, SMA2: integer;SetScaleDaily;SMA1 := SMASeries( #Close, 10 );SMA2 := SMASeries( #Close, 40 );RestorePrimarySeries;for Bar := 200 to BarCount - 1 dobegin db := GetDailyBar( Bar ); if CrossOver( db, SMA1, SMA2 ) then begin SetBackgroundColor( Bar, #BlueBkg ); end;end;
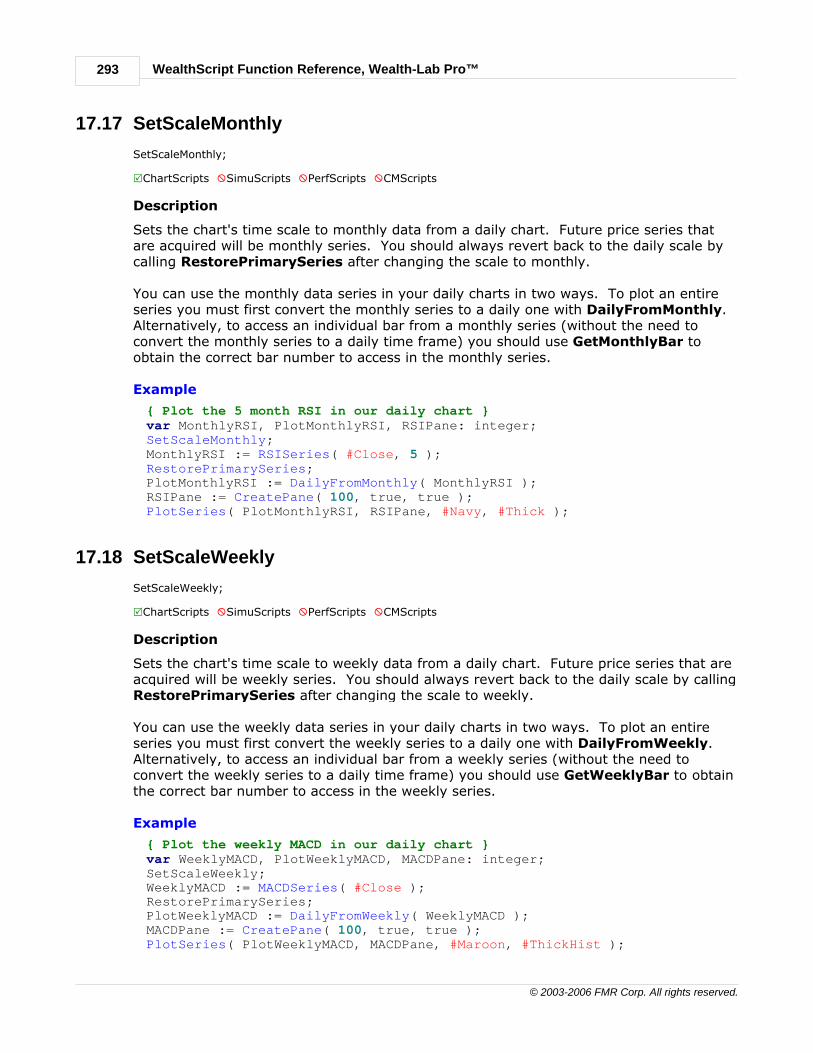
WealthScript Function Reference, Wealth-Lab Pro™293
© 2003-2006 FMR Corp. All rights reserved.
17.17 SetScaleMonthly
SetScaleMonthly;
RChartScripts XSimuScripts XPerfScripts XCMScripts
Description
Sets the chart's time scale to monthly data from a daily chart. Future price series thatare acquired will be monthly series. You should always revert back to the daily scale bycalling RestorePrimarySeries after changing the scale to monthly.
You can use the monthly data series in your daily charts in two ways. To plot an entireseries you must first convert the monthly series to a daily one with DailyFromMonthly.Alternatively, to access an individual bar from a monthly series (without the need toconvert the monthly series to a daily time frame) you should use GetMonthlyBar toobtain the correct bar number to access in the monthly series.
Example
{ Plot the 5 month RSI in our daily chart }var MonthlyRSI, PlotMonthlyRSI, RSIPane: integer;SetScaleMonthly;MonthlyRSI := RSISeries( #Close, 5 );RestorePrimarySeries;PlotMonthlyRSI := DailyFromMonthly( MonthlyRSI );RSIPane := CreatePane( 100, true, true );PlotSeries( PlotMonthlyRSI, RSIPane, #Navy, #Thick );
17.18 SetScaleWeekly
SetScaleWeekly;
RChartScripts XSimuScripts XPerfScripts XCMScripts
Description
Sets the chart's time scale to weekly data from a daily chart. Future price series that areacquired will be weekly series. You should always revert back to the daily scale by callingRestorePrimarySeries after changing the scale to weekly.
You can use the weekly data series in your daily charts in two ways. To plot an entireseries you must first convert the weekly series to a daily one with DailyFromWeekly.Alternatively, to access an individual bar from a weekly series (without the need toconvert the weekly series to a daily time frame) you should use GetWeeklyBar to obtainthe correct bar number to access in the weekly series.
Example
{ Plot the weekly MACD in our daily chart }var WeeklyMACD, PlotWeeklyMACD, MACDPane: integer;SetScaleWeekly;WeeklyMACD := MACDSeries( #Close );RestorePrimarySeries;PlotWeeklyMACD := DailyFromWeekly( WeeklyMACD );MACDPane := CreatePane( 100, true, true );PlotSeries( PlotWeeklyMACD, MACDPane, #Maroon, #ThickHist );
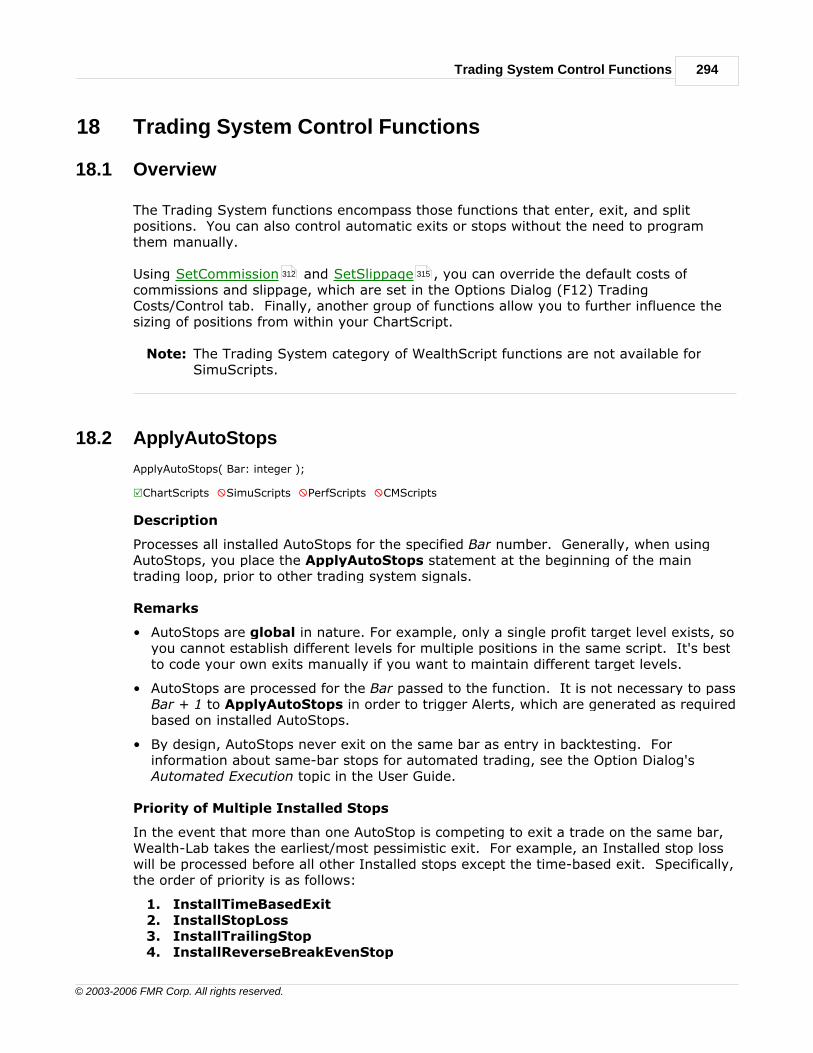
Trading System Control Functions 294
© 2003-2006 FMR Corp. All rights reserved.
18 Trading System Control Functions
18.1 Overview
The Trading System functions encompass those functions that enter, exit, and splitpositions. You can also control automatic exits or stops without the need to programthem manually.
Using SetCommission and SetSlippage , you can override the default costs ofcommissions and slippage, which are set in the Options Dialog (F12) TradingCosts/Control tab. Finally, another group of functions allow you to further influence thesizing of positions from within your ChartScript.
Note: The Trading System category of WealthScript functions are not available forSimuScripts.
18.2 ApplyAutoStops
ApplyAutoStops( Bar: integer );
RChartScripts XSimuScripts XPerfScripts XCMScripts
Description
Processes all installed AutoStops for the specified Bar number. Generally, when usingAutoStops, you place the ApplyAutoStops statement at the beginning of the maintrading loop, prior to other trading system signals.
Remarks
• AutoStops are global in nature. For example, only a single profit target level exists, soyou cannot establish different levels for multiple positions in the same script. It's bestto code your own exits manually if you want to maintain different target levels.
• AutoStops are processed for the Bar passed to the function. It is not necessary to passBar + 1 to ApplyAutoStops in order to trigger Alerts, which are generated as requiredbased on installed AutoStops.
• By design, AutoStops never exit on the same bar as entry in backtesting. Forinformation about same-bar stops for automated trading, see the Option Dialog'sAutomated Execution topic in the User Guide.
Priority of Multiple Installed Stops
In the event that more than one AutoStop is competing to exit a trade on the same bar,Wealth-Lab takes the earliest/most pessimistic exit. For example, an Installed stop losswill be processed before all other Installed stops except the time-based exit. Specifically,the order of priority is as follows:
1. InstallTimeBasedExit2. InstallStopLoss3. InstallTrailingStop4. InstallReverseBreakEvenStop
312 315

WealthScript Function Reference, Wealth-Lab Pro™295
© 2003-2006 FMR Corp. All rights reserved.
5. InstallBreakEvenStop6. InstallProfitTarget
Mixing Manual and Installed AutoStops
Manually-coded exits execute in the order that they are coded. However, if you mixmanual exits and AutoStops, manual exits that execute on Bar + 1 will take priorityunless you explicitly change the order of priority by passing Bar + 1 to ApplyAutoStops.In this case, you must place the statement in the exit logic for correct operation as shownin the following example that mixes a time-based AutoStop exit with a manual profittarget.
var Bar, p: integer;PlotStops;InstallTimeBasedExit( 20 );for Bar := 10 to BarCount - 1 dobegin if LastPositionActive then begin ApplyAutoStops( Bar + 1 ); // Note placement within exit logic p := LastPosition; SellAtLimit( Bar + 1, PositionEntryPrice( p ) * 1.05, p, '5%
ProfitTgt' ); end else BuyAtStop( Bar + 1, Highest( Bar, #High, 8 ), '' );end;
Precedence discussion: topic?id=6315Manually-coded exits will exit at whichever bar you specify, and in the order in which
they are coded. For example, to exit with a 5% profit target on the same bar, thefollowing code could be used instead of InstallProfitTarget( 5 ). Notice that in thiscase the stop is plotted on the same bar as the entry bar.
var Bar, p: integer;PlotStops;for Bar := 10 to BarCount - 1 dobegin{ Single entry condition for demo } if Bar = BarCount - 20 then BuyAtMarket( Bar + 1, '' );
if LastPositionActive then begin p := LastPosition; SellAtLimit( Bar + 1, PositionEntryPrice( p ) * 1.05, p, '5%ProfitTgt' ); end;end;
Example
{ Install and execute automated stops in our trading system }var Bar: integer;InstallStopLoss( 8 );InstallProfitTarget( 10 );InstallTimeBasedExit( 40 );for Bar := 20 to BarCount - 1 dobegin

Trading System Control Functions 296
© 2003-2006 FMR Corp. All rights reserved.
ApplyAutoStops( Bar );{ ... more trading system rules ... }end;
18.3 BuyAtClose
BuyAtClose( Bar: integer; SignalName: string ): boolean;
RChartScripts XSimuScripts XPerfScripts XCMScripts
Description
Establishes a long Position at market close of the specified Bar.
Remarks
• Slippage, when activated, can affect the trade's execution price.
• The string, which may be a blank string, passed as the SignalName parameter willappear in the Entry Signal column in the Trades View for ChartScript and $imulatorwindows, or in the Signal Name column for the Scans tools.
• BuyAtClose will return boolean false if the signal fails to establish a new position.This can occur, for example, when using 100% equity position sizing without Leeway.
Note: AtClose orders can be difficult to realize in practice.
Example
{ Buy at close on a 200 bar low }var BAR: integer;for Bar := 200 to BarCount - 1 dobegin if not LastPositionActive then begin if PriceLow( Bar ) = Lowest( Bar, #Low, 200 ) then BuyAtClose( Bar, 'Low Hit' ); end else begin{ .. Exit Rules ... } endend;
18.4 BuyAtLimit
BuyAtLimit( Bar: integer; LimitPrice: float; SignalName: string ): boolean;
RChartScripts XSimuScripts XPerfScripts XCMScripts
Description
Establishes a long Position if prices reach the indicated LimitPrice. The Position will beopened if prices meet or go below the specified LimitPrice on the specified Bar. If pricesopen below the LimitPrice, the Position will be established at open price. If prices fail toreach the LimitPrice objective, a Position is not established and the function returns false.
Remarks

WealthScript Function Reference, Wealth-Lab Pro™297
© 2003-2006 FMR Corp. All rights reserved.
• Slippage, when activated, can affect the trade's execution price.
• The string, which may be a blank string, passed as the SignalName parameter willappear in the Entry Signal column in the Trades View for ChartScript and $imulatorwindows, or in the Signal Name column for the Scans tools.
• For futures symbols, LimitPrice is automatically rounded to the nearest Tick value.
Example
{ Buy the next bar if it hits the previous 10 bar low }var X: float;var BAR: integer;for Bar := 200 to BarCount - 1 dobegin if not LastPositionActive then begin x := Lowest( Bar, #Low, 10 ); BuyAtLimit( Bar + 1, x, '10 bar low' ); end else begin{ .. Exit Rules ... } endend;
18.5 BuyAtMarket
BuyAtMarket( Bar: integer; SignalName: string ): boolean;
RChartScripts XSimuScripts XPerfScripts XCMScripts
Description
Establishes a long Position at market open of the specified Bar.
Remarks
• Slippage, when activated, can affect the trade's execution price.
• The string, which may be a blank string, passed as the SignalName parameter willappear in the Entry Signal column in the Trades View for ChartScript and $imulatorwindows, or in the Signal Name column for the Scans tools.
• BuyAtMarket will return boolean false if the signal fails to establish a new position.This can occur, for example, when using 100% equity position sizing without Leeway.
Example
{ Open a long position on the following bar based on this bar's indicatorvalues }var Bar, p: integer;for Bar := 40 to BarCount - 1 dobegin if not LastPositionActive then begin if PriceClose( Bar ) > SMA( Bar, #Close, 40 ) then if BuyAtMarket( Bar + 1, 'SMA' ) then
SetPositionPriority( LastPosition, -RSI( Bar, #Close, 14 ) );
Trading System Control Functions 298
© 2003-2006 FMR Corp. All rights reserved.
end else begin p := LastPosition; if Bar + 1 - PositionEntryBar( p ) = 5 then SellAtMarket( Bar + 1, p, 'Time-Based' ); end;end;
18.6 BuyAtStop
BuyAtStop( Bar: integer; StopPrice: float; SignalName: string ): boolean;
RChartScripts XSimuScripts XPerfScripts XCMScripts
Description
Establishes a long Position if prices reach the indicated StopPrice. The Position will beopened if prices meet or exceed the specified StopPrice on the specified Bar. If pricesopen above the StopPrice, the Position will be established at open price. If prices fail toreach the StopPrice objective, a Position is not established and the function returns false.
Remarks
• Slippage, when activated, can affect the trade's execution price.
• The string, which may be a blank string, passed as the SignalName parameter willappear in the Entry Signal column in the Trades View for ChartScript and $imulatorwindows, or in the Signal Name column for the Scans tools.
• For futures symbols, StopPrice is automatically rounded to the nearest Tick value.
Example
{ Try to buy a peak breakout }var BAR: integer;var p: float;for Bar := 40 to BarCount - 1 dobegin if not LastPositionActive then begin p := Peak( Bar, #Close, 15 ); BuyAtStop( Bar + 1, p, 'Breakout' ); end else begin{ .. Exit Rules ... } end;end;
18.7 CoverAtClose
CoverAtClose( Bar: integer; Position: integer; SignalName: string );
RChartScripts XSimuScripts XPerfScripts XCMScripts
Description
Covers and closes out an open short Position at closing price of the specified Bar.

WealthScript Function Reference, Wealth-Lab Pro™299
© 2003-2006 FMR Corp. All rights reserved.
Remarks
• Slippage, when activated, can affect the trade's execution price.
• CoverAtClose will exit any position, short or long, that is passed to it in the Positionparameter.
• To exit all open short positions pass the constant #All in the Position parameter.
• The string, which may be a blank string, passed as the SignalName parameter willappear in the Exit Signal column in the Trades View for ChartScript and $imulatorwindows, or in the Signal Name column for the Scans tools.
Note: AtClose orders can be difficult to realize in practice.
Example
{ Exit the short after 20 days }var BAR: integer;for Bar := 40 to BarCount - 1 dobegin if not LastPositionActive then begin{ ... Entry Rules ... } end else begin if Bar = PositionEntryBar( LastPosition ) + 20 then CoverAtClose( Bar, LastPosition, '20 day exit' ); end;end;
18.8 CoverAtLimit
CoverAtLimit( Bar: integer; LimitPrice: float; Position: integer; SignalName: string ): boolean;
RChartScripts XSimuScripts XPerfScripts XCMScripts
Description
Covers and closes out an open short Position if prices meet or exceed the specifiedLimitPrice. If prices open below the LimitPrice, the Position is closed at market openprice. If prices fail to reach the LimitPrice objective, the Position remains open and thefunction returns false. To exit all open short positions pass the constant #All in thePosition parameter.
Remarks
• Slippage, when activated, can affect the trade's execution price.
• CoverAtLimit can exit any position, short or long, that is passed to it in the Positionparameter.
• The string, which may be a blank string, passed as the SignalName parameter willappear in the Exit Signal column in the Trades View for ChartScript and $imulatorwindows, or in the Signal Name column for the Scans tools.
• For futures symbols, LimitPrice is automatically rounded to the nearest Tick value.

Trading System Control Functions 300
© 2003-2006 FMR Corp. All rights reserved.
Example
{ Try and exit our short position at a profit }var BAR: integer;var x: float;for Bar := 40 to BarCount - 1 dobegin if not LastPositionActive then begin{ ... Entry Rules ... } end else begin x := Lowest( Bar, #Low, 10 ); CoverAtLimit( Bar + 1, x, LastPosition, '10 day Low Limit' ); end;end;
18.9 CoverAtMarket
CoverAtMarket( Bar: integer; Position: integer; SignalName: string );
RChartScripts XSimuScripts XPerfScripts XCMScripts
Description
Used to cover and close out an open short position at the opening price of the specifiedBar.
Remarks
• Slippage, when activated, can affect the trade's execution price.
• CoverAtMarket will exit any position, short or long, that is passed to it in the Positionparameter.
• To exit all open short positions pass the constant #All in the Position parameter.
• The string, which may be a blank string, passed as the SignalName parameter willappear in the Exit Signal column in the Trades View for ChartScript and $imulatorwindows, or in the Signal Name column for the Scans tools.
Example
{ Cover the short position if CMO becomes slightly overbought }var BAR: integer;for Bar := 40 to BarCount - 1 dobegin if not LastPositionActive then begin{ ... Entry Rules ... } end else begin if CMO( Bar, #Close, 20 ) > 30 then CoverAtMarket( Bar + 1, LastPosition, '' ); end;end;

WealthScript Function Reference, Wealth-Lab Pro™301
© 2003-2006 FMR Corp. All rights reserved.
18.10 CoverAtStop
CoverAtStop( Bar: integer; StopPrice: float; Position: integer; SignalName: string ): boolean;
RChartScripts XSimuScripts XPerfScripts XCMScripts
Description
Used to cover and close out an open short Position if prices meet or go above thespecified StopPrice. If prices open above the StopPrice, the Position is closed at themarket open price. If prices fail to reach the StopPrice, the Position remains open andthe function returns false.
Remarks
• Slippage, when activated, can affect the trade's execution price.
• CoverAtStop will exit any position, short or long, that is passed to it in the Positionparameter.
• To enter a CoverAtStop order for all open short positions, pass the constant #All inthe Position parameter.
• The string, which may be a blank string, passed as the SignalName parameter willappear in the Exit Signal column in the Trades View for ChartScript and $imulatorwindows, or in the Signal Name column for the Scans tools.
• Use PlotStops to plot the effective stop price for Position.
• For futures symbols, StopPrice is automatically rounded to the nearest Tick value.
Example
{ Cover the short position if prices move against us by 10% }var BAR: integer;var x: float;for Bar := 40 to BarCount - 1 dobegin if not LastPositionActive then begin{ ... Entry Rules ... } end else begin x := PositionEntryPrice( LastPosition ) * 1.1; CoverAtStop( Bar + 1, x, LastPosition, '10% Stop' ); end;end;
18.11 CoverAtTrailingStop
CoverAtTrailingStop( Bar: integer; Price: float; Position: integer; SignalName: string ): boolean;
RChartScripts XSimuScripts XPerfScripts XCMScripts

Trading System Control Functions 302
© 2003-2006 FMR Corp. All rights reserved.
Description
Implements a trailing stop at the specified Price level. The stop level is adjusted only if itis above the current stop level. This results in a trailing stop that is always raised, andnever lowered. Otherwise, this function behaves exactly like the correspondingCoverAtStop function. It returns true if the stop level was reached and the position wasclosed.
Remarks
• Slippage, when activated, can affect the trade's execution price.
• CoverAtTrailingStop will exit any position, short or long, that is passed to it in thePosition parameter.
• To enter a CoverAtTrailingStop order for all open short positions, pass the constant#All in the Position parameter.
• The string, which may be a blank string, passed as the SignalName parameter willappear in the Exit Signal column in the Trades View for ChartScript and $imulatorwindows, or in the Signal Name column for the Scans tools.
• Use PlotStops to plot the effective stop price for Position.
Example
{ Initiate a trailing stop after a 5% gain }var Bar, p: integer;
PlotStops;for Bar := 20 to BarCount - 1 dobegin if LastPositionActive then begin p := LastPosition; if PositionOpenMFEPct( p, Bar ) > 5 then CoverAtTrailingStop( Bar + 1, SMA( Bar, #Close, 20 ), p, 'TStop' ) else CoverAtStop( Bar + 1, PositionEntryPrice( p ) * 1.10, p, 'StopLoss'); end else ShortAtStop( Bar + 1, Lowest( Bar, #Low, 20 ), '' );end;
18.12 InstallBreakEvenStop
InstallBreakEvenStop( Trigger: float );
RChartScripts XSimuScripts XPerfScripts XCMScripts
Description
Installs an automatic breakeven stop once the Position reaches the specified Triggerprofit level on a closing basis. Call ApplyAutoStops in your Trading System's main loopto process auto-stops.
Remarks

WealthScript Function Reference, Wealth-Lab Pro™303
© 2003-2006 FMR Corp. All rights reserved.
• Trigger is expressed as a percentage, points, or dollar movement as determined by theSetAutoStopMode function, where percentage is the default if not used.
• InstallBreakEvenStop is global in nature, therefore the most recent call toInstallBreakEvenStop will be used for subsequent trades.
• See ApplyAutoStops for information.
Example
{ Install a breakeven stop when we close above 5% profit }var BAR: integer;InstallBreakEvenStop( 5 );for Bar := 20 to BarCount - 1 dobegin ApplyAutoStops( Bar );{ ... Entry and Exit Rules ... }end;
18.13 InstallProfitTarget
InstallProfitTarget( TargetLevel: float );
RChartScripts XSimuScripts XPerfScripts XCMScripts
Description
Installs a profit target at the specified TargetLevel. Open Positions will be automaticallyclosed if total Position profit reaches the target level. If prices gap up above theTargetLevel value the Position will be closed at the market open price. CallApplyAutoStops in your Trading System's main loop to process AutoStops.
Remarks
• TargetLevel is expressed as a percentage, points, or dollar movement as determinedby the SetAutoStopMode function, where percentage is the default if not used.
• InstallProfitTarget is global in nature, therefore the most recent call toInstallProfitTarget will be used for subsequent trades.
• For real-time automated trading, to exit with a profit on the same bar as entry useInstallProfitTarget. See "Automated Trading Options" in the User Guide for moreinformation.
• See ApplyAutoStops for more information.
Example
{ If our trades ever see a 100% profit we'll be sure to cash out }var BAR: integer;InstallProfitTarget( 100 );for Bar := 20 to BarCount - 1 dobegin ApplyAutoStops( Bar );{ ... Entry and Exit Rules ... }end;

Trading System Control Functions 304
© 2003-2006 FMR Corp. All rights reserved.
18.14 InstallReverseBreakEvenStop
InstallReverseBreakEvenStop( LossLevel: float );
RChartScripts XSimuScripts XPerfScripts XCMScripts
Description
Installs an automatic breakeven stop order once the Position experiences the percentageloss level specified in the LossLevel parameter on a closing basis. Call ApplyAutoStopsin your Trading System's main loop to process auto-stops.
Remarks
• LossLevel is expressed as a percentage, points, or dollar movement as determined bythe SetAutoStopMode function, where percentage is the default if not used.
• InstallReverseBreakEvenStop is global in nature, therefore the most recent call willbe used for subsequent trades.
• See ApplyAutoStops for more information.
Example
{ Install a BreakEven stop to exit if we sustain losses of at least 10% }var BAR: integer;InstallReverseBreakEvenStop( 10 );for Bar := 20 to BarCount - 1 dobegin ApplyAutoStops( Bar );{ ... Entry and Exit Rules ... }end;
18.15 InstallStopLoss
InstallStopLoss( StopLevel: float );
RChartScripts XSimuScripts XPerfScripts XCMScripts
Description
Installs a stop loss at the specified StopLevel. Open Positions will be automatically closedif total Position loss reaches the loss value. If prices gap down below the stop loss valuethe Position will be closed at the market open price. Call ApplyAutoStops in yourTrading System's main loop to process AutoStops.
Remarks
• StopLevel is expressed as a percentage, points, or dollar movement as determined bythe SetAutoStopMode function, where percentage is the default if not used.
• InstallStopLoss is global in nature, therefore the most recent call will be used forsubsequent trades.
• For real-time automated trading, to activate a stop loss exit on the same bar as entry,use InstallStopLoss and/or SetRiskStopLevel. See "Automated Trading Options" inthe User Guide for more information.
• See ApplyAutoStops for information.

WealthScript Function Reference, Wealth-Lab Pro™305
© 2003-2006 FMR Corp. All rights reserved.
Example
{ Install a global automated stop loss of 15% }var BAR: integer;InstallStopLoss( 15 );for Bar := 20 to BarCount - 1 dobegin ApplyAutoStops( Bar );{ ... Entry and Exit Rules ... }end;
18.16 InstallTimeBasedExit
InstallTimeBasedExit( Bars: integer );
RChartScripts XSimuScripts XPerfScripts XCMScripts
Description
Installs an automated exit based on the specified number of Bars. Positions will beautomatically closed after a number of bars specified in the Bars parameter. Be sure tocall ApplyAutoStops in your trading system loop to activate the automated exit.
Remarks
• InstallTimeBasedExit is global in nature, therefore the most recent call will be usedfor subsequent trades.
• AutoStops are processed on the Bar Number passed to the function, but it is notrequired to pass Bar + 1 to ApplyAutoStops unless you wish to shift priority frommanual exits to AutoStops. Changing the order precedence is necessary only whenmixing InstallTimeBasedExit with manual exits that apply AtLimit, AtStop, orAtClose orders on Bar + 1. If you decide to give AutoStops priority over manual exits,then we recommend placing the ApplyAutoStops(Bar + 1) function with the rest ofthe exit logic as shown in the example.
• Some live feed providers may not include zero-volume bars in a [primarily intraday]chart. Since InstallTimeBasedExit is bar-based, you may wish to include manualexit logic using the GetTime function to achieve the desired result for sparsely-tradedissues.
• See also: ApplyAutoStops
The example shows how to properly mix a manual exit with AutoStops that include anInstalledTimeBasedExit. Priority must be given to AutoStops in this [single] instance,otherwise it would allow the SellAtStop manual exit to trigger on the third day prior toclosing the position at the open.
Example
{ Buy on a SMA crossover, and sell on a stop of the slow moving average or after 3 Bars, whichever occurs first }var Bar, p, hSMA_S, hSMA_F, perSlow, perFast: integer;var fStop: float;
perSlow := 20;perFast := 10;hSMA_S := SMASeries( #Close, perSlow );

Trading System Control Functions 306
© 2003-2006 FMR Corp. All rights reserved.
hSMA_F := SMASeries( #Close, perFast );
InstallTimeBasedExit( 3 );PlotStops;for Bar := perSlow to BarCount - 1 dobegin if not LastPositionActive then begin { ----------------- Entry Rule } if CrossOver( Bar, hSMA_F, hSMA_S ) then BuyAtMarket( Bar + 1, '' ); end else { ----------------- Exit Rules } begin { Here, installed AutoStops have priority since they are processedfirst } ApplyAutoStops( Bar + 1 );
p := LastPosition; { Round the stop value to 2 digits after the decimal } fStop := Trunc( 100 * @hSMA_S[Bar] ) / 100; SellAtStop( Bar + 1, fStop, p, 'ManualStop' ); end;end;
PlotSeriesLabel( hSMA_S, 0, #Blue, #Thin, 'SMA ' + IntToStr(perSlow) );PlotSeriesLabel( hSMA_F, 0, #Red, #Dotted, 'SMA ' + IntToStr(perFast) );
18.17 InstallTrailingStop
InstallTrailingStop( Trigger: float; StopLevel: float );
RChartScripts XSimuScripts XPerfScripts XCMScripts
Description
Installs a trailing stop to protect profits in Positions that are moving in a favorabledirection. The Trigger value is the profit on a closing basis that the trade must showbefore the trailing stop is triggered, or activated. Once triggered, the stop is set toprotect against a reversal of the value expressed in the StopLevel parameter. You mustcall the ApplyAutoStops function to actually process the stop.
Remarks
• Trigger is expressed as a percentage, points, or dollar movement as determined by theSetAutoStopMode function, where percentage is the default if not used. StopLevel isalways expressed as a percentage reversal and remains unaffected bySetAutoStopMode.
• InstallTrailingStop is global in nature, therefore the most recent call will be used forsubsequent trades.
• See ApplyAutoStops for information.
Example
{ Protect 70% of profits once we achieve 20% profit }var BAR: integer;InstallTrailingStop( 20, ( 100 - 70 ) );

WealthScript Function Reference, Wealth-Lab Pro™307
© 2003-2006 FMR Corp. All rights reserved.
for Bar := 20 to BarCount - 1 dobegin ApplyAutoStops( Bar );{ ... Entry and Exit Rules ... }end;
18.18 PortfolioSynch
PortfolioSynch( Bar: integer; Portfolio: string );
RChartScripts XSimuScripts XPerfScripts XCMScripts
Description
PortfolioSynch creates entries and exits based on the actual Trade History for thespecified Portfolio. Historical entry and exit signals are ignored, and the trades thatappear on the chart are based on realized trades only. Consequently, this function allowsyou to base trading system processing on the actual signals from a specified Portfolio.
Bar The bar being processed. Synchronization occurs on the signal, or alert Bar.
Portfolio Specifies which Portfolio Manager portfolio to synchronize with. Pass anempty string in the Portfolio parameter to match against positions in anyportfolio.
Remarks
• PortfolioSynch is functional only for Real-time ChartScript Windows and both theScans tools (WatchList Scans and Real-Time Scans).
• When using PortfolioSynch, exits for the next bar (alerts) are processed only foropen positions in the Portfolio.
• Orders that are filled in parts will show up as discrete, partial fills in the Trades list ofthe ChartScript window as well as in the portfolio's Trade History.
ChartScript Placement
Method 1: Call PortfolioSynch the first thing in your main trading system loop. Thismethod is sufficient for most trading scripts. If your script usesSetPositionData or otherwise initializes local variables during the entrylogic that are accessed in the exit logic, use Method 2.
Method 2: Place PortfolioSynch in both the entry and exit logic, after testing foractive Positions as shown in the example. It is important thatPortfolioSynch is called once for each Bar in the trading loop.
Example
{ A Real-Time testing script that issues buys and sells every other bar }const MYPORT = ''; // Ensure an empty string, not a white spacevar Bar: integer;for Bar := 20 to BarCount - 1 dobegin // PortfolioSynch( Bar, MYPORT ); // Method 1 placement if LastPositionActive then begin PortfolioSynch( Bar, MYPORT ); // Method 2 placement (1 of 2)
Trading System Control Functions 308
© 2003-2006 FMR Corp. All rights reserved.
if Bar mod 2 = 0 then SellAtMarket( Bar + 1, LastPosition, '' ); end else begin PortfolioSynch( Bar, MYPORT ); // Method 2 placement (2 of 2) if Bar mod 2 = 0 then BuyAtMarket( Bar + 1, '' ); end;end;
18.19 SellAtClose
SellAtClose( Bar: integer; Position: integer; SignalName: string );
RChartScripts XSimuScripts XPerfScripts XCMScripts
Description
Sells and closes out an open long Position at closing price of the specified Bar.
Remarks
• Slippage, when activated, can affect the trade's execution price.
• SellAtClose will exit any position, short or long, that is passed to it in the Positionparameter.
• To exit all open long positions pass the constant #All in the Position parameter.
• The string, which may be a blank string, passed as the SignalName parameter willappear in the Exit Signal column in the Trades View for ChartScript and $imulatorwindows, or in the Signal Name column for the Scans tools.
Note: AtClose orders can be difficult to realize in practice.
Example
{ 10 days is long enough for this system }var BAR: integer;for Bar := 40 to BarCount - 1 dobegin if not LastPositionActive then begin{ ... Entry Rules ... } end else begin if Bar - PositionEntryBar( LastPosition ) = 10 then SellAtClose( Bar, LastPosition, '10 Day Exit' ); end;end;
18.20 SellAtLimit
SellAtLimit( Bar: integer; LimitPrice: float; Position: integer; SignalName: string ): boolean;
RChartScripts XSimuScripts XPerfScripts XCMScripts
WealthScript Function Reference, Wealth-Lab Pro™309
© 2003-2006 FMR Corp. All rights reserved.
Description
Sells and closes out an open long Position on the specified Bar if prices meet or exceedthe specified LimitPrice. If prices open above the LimitPrice, the Position is closed atmarket open price. If prices fail to reach the LimitPrice objective, the Position remainsopen and the function returns false. To exit all open long positions pass the constant#All in the Position parameter.
Remarks
• Slippage, when activated, can affect the trade's execution price.
• SellAtLimit can exit any position, short or long, that is passed to it in the Positionparameter.
• The string, which may be a blank string, passed as the SignalName parameter willappear in the Exit Signal column in the Trades View for ChartScript and $imulatorwindows, or in the Signal Name column for the Scans tools.
• For futures symbols, LimitPrice is automatically rounded to the nearest Tick value.
Example
{ Try to get out at a recent high }var BAR: integer;var x: float;for Bar := 40 to BarCount - 1 dobegin if not LastPositionActive then begin{ ... Entry Rules ... } end else begin x := Highest( Bar, #High, 10 ) * 1.02; if SellAtLimit( Bar + 1, x, LastPosition, 'Limit Sell' ) then Print( 'Sold!' ); end;end;
18.21 SellAtMarket
SellAtMarket( Bar: integer; Position: integer; SignalName: string );
RChartScripts XSimuScripts XPerfScripts XCMScripts
Description
Sells and closes out an open long Position at open price of the specified Bar.
Remarks
• Slippage, when activated, can affect the trade's execution price.
• SellAtMarket can exit any position, short or long, that is passed to it in the Positionparameter.
• To exit all open long positions pass the constant #All in the Position parameter.

Trading System Control Functions 310
© 2003-2006 FMR Corp. All rights reserved.
• The string, which may be a blank string, passed as the SignalName parameter willappear in the Exit Signal column in the Trades View for ChartScript and $imulatorwindows, or in the Signal Name column for the Scans tools.
Example
{ Sell when prices go below the 200 day moving average }var BAR: integer;for Bar := 40 to BarCount - 1 dobegin if not LastPositionActive then begin{ ... Entry Rules ... } end else begin if CrossUnder( Bar, #Close, SMASeries( #Close, 200 ) ) then SellAtMarket( Bar + 1, LastPosition, 'Below 200 day SMA' ); end;end;
18.22 SellAtStop
SellAtStop( Bar: integer; StopPrice: float; Position: integer; SignalName: string ): boolean;
RChartScripts XSimuScripts XPerfScripts XCMScripts
Description
Sells and closes out an open long Position if prices meet or go below the specifiedStopPrice. If prices open below the StopPrice, the Position is closed at market open price.If prices fail to reach the StopPrice, the Position remains open and the function returnsfalse.
Remarks
• Slippage, when activated, can affect the trade's execution price.
• SellAtStop can exit any position, short or long, that is passed to it in the Positionparameter.
• To enter a SellAtStop order for all open long positions at StopPrice, simply pass theconstant #All in the Position parameter.
• The string, which may be a blank string, passed as the SignalName parameter willappear in the Exit Signal column in the Trades View for ChartScript and $imulatorwindows, or in the Signal Name column for the Scans tools.
• Use PlotStops to plot the effective stop price for Position.
• For futures symbols, StopPrice is automatically rounded to the nearest Tick value.
Example
{ Sell at a 20% stop loss level }var BAR: integer;var xStop: float;for Bar := 40 to BarCount - 1 dobegin
WealthScript Function Reference, Wealth-Lab Pro™311
© 2003-2006 FMR Corp. All rights reserved.
if not LastPositionActive then begin{ ... Entry Rules ... } end else begin xStop := PositionEntryPrice( LastPosition ) * 0.8; SellAtStop( Bar + 1, xStop, LastPosition, 'Stop Loss' ); end;end;
18.23 SellAtTrailingStop
SellAtTrailingStop( Bar: integer; Price: float; Position: integer; SignalName: string ): boolean;
RChartScripts XSimuScripts XPerfScripts XCMScripts
Description
Implements a trailing stop at the specified Price level. The stop level is adjusted only if itis above the current stop level. This results in a trailing stop that is always raised, andnever lowered. Otherwise, this function behaves exactly like the correspondingSellAtStop function. It returns true if the stop level was reached and the position wasclosed.
Remarks
• Slippage, when activated, can affect the trade's execution price.
• SellAtTrailingStop will exit any position, short or long, that is passed to it in thePosition parameter.
• To enter a SellAtTrailingStop order for all open long positions at the specified Price,simply pass the constant #All in the Position parameter.
• The string, which may be a blank string, passed as the SignalName parameter willappear in the Exit Signal column in the Trades View for ChartScript and $imulatorwindows, or in the Signal Name column for the Scans tools.
• Use PlotStops to plot the effective stop price for Position.
Example
{ Initiate a trailing stop after a 5% gain }var Bar, p: integer;
PlotStops;for Bar := 20 to BarCount - 1 dobegin if LastPositionActive then begin p := LastPosition; if PositionOpenMFEPct( p, Bar ) > 5 then SellAtTrailingStop( Bar + 1, SMA( Bar, #Close, 20 ), p, 'TStop' ) else SellAtStop( Bar + 1, PositionEntryPrice( p ) * 0.90, p, 'StopLoss'); end else

Trading System Control Functions 312
© 2003-2006 FMR Corp. All rights reserved.
BuyAtStop( Bar + 1, Highest( Bar, #High, 20 ), '' );end;
18.24 SetAutoStopMode
SetAutoStopMode( Mode: integer );
RChartScripts XSimuScripts XPerfScripts XCMScripts
Description
Allows you to control how the parameters of AutoStops are interpreted. This affectsInstallStopLoss, InstallProfitTarget, InstallTrailingStop (first parameter only),InstallBreakEvenStop and InstallReverseBreakEvenStop.
The Mode parameter can be one of the following constants:
#AsPercent - AutoStop values are expressed as percentage moves (default)#AsPoint - AutoStop values are expressed as point moves#AsDollar - AutoStop values are expressed as dollar moves
Remarks
• The AutoStop Mode is currently a global value within a script execution. You cannothave some AutoStops using percent and others using point, etc.
• Remember to call ApplyAutoStops to execute your automated stops.
Example
{ Stop Loss if price declines 5% or more }SetAutoStopMode( #AsPercent );InstallStopLoss( 5 );
{ Stop Loss if price declines 5 points or more }SetAutoStopMode( #AsPoint );InstallStopLoss( 5 );
{ Stop Loss if Position declines by $2,000 or more }SetAutoStopMode( #AsDollar );InstallStopLoss( 2000 );
18.25 SetCommission
SetCommission( Commission: float );
XChartScripts XSimuScripts XPerfScripts XCMScripts
Description
The SetCommission function sets the Commission value that is deducted from net profitevery time a trade is executed. The default commission setting can be found underTrading Costs/Control in the Options Dialog (F12).
Note: SetCommission no longer has any effect on setting commissions. The use ofSetCommission in the ChartScript Window will generate an error; though inScans, $imulations, Rankings, and Optimizations, no error will be triggered so

WealthScript Function Reference, Wealth-Lab Pro™313
© 2003-2006 FMR Corp. All rights reserved.
as not to disrupt these processes. As an alternative, use CommissionScripts forcustomized control of commissions. This information is included to support useof older ChartScripts that employed the function.
Remarks
• SetCommission has been deprecated. Use CommissionScripts to control complexcommission calculations with user-defined functions.
18.26 SetPositionSize
SetPositionSize( Size: float );
RChartScripts XSimuScripts XPerfScripts XCMScripts
Description
Sets the Position Size, in dollars, that will be used for new Positions. Subsequent tradeswill be sized with the dollar Size specified.
Remarks
• Use of SetPositionSize is generally discouraged since SimuScripts are available to setposition sizing in all tools (see SetPositionSizeFixed). The function is primarily forcompatibility with earlier versions of Wealth-Lab.
• When using the $imulator tool or Portfolio Simulation mode in the Position Sizingcontrol, you must choose the radio button for SetShare/PositionSize Value toenable SetPositionSize to influence position sizing.
• In Raw Profit modes, SetPositionSize will override the Position Sizing control'sselection. Exception: SetPositionSize has no effect in a Raw Profit WatchList orChartScript Ranking.
• You can use both SetPositionSize and SetShareSize in the same script. As thesefunctions are global in nature, the next time a trade is processed it will use the valuefrom the function last called.
Example
{ Set a dynamic position size based on overbought/oversold levels }var PS: float;var BAR: integer;for Bar := 40 to BarCount - 1 dobegin if not LastPositionActive then begin ps := ( CMO( Bar, #Close, 14 ) + 200 ) * 10; SetPositionSize( ps );{ ... Entry Rules ... } end else begin{ ... Exit Rules ... } end;end;
Trading System Control Functions 314
© 2003-2006 FMR Corp. All rights reserved.
18.27 SetShareCap
SetShareCap( Cap: integer );
RChartScripts XSimuScripts XPerfScripts XCMScripts
Description
Sets a maximum number of shares per position to Cap. Ordinarily, the size of a Positionis established by what you select in the Position Sizing control. However, if you useSetShareCap you can limit the number of shares. You can also use this feature to forcea certain number of shares per Position, as follows.
Remarks
• SetShareCap is global in nature, therefore the most recent call to SetShareCap willbe used for subsequent trades. This implies that in the $imulator only the last call inthe final raw-profit run of the last symbol will be used as the share cap.
Example
{ Force Positions to be 100 shares each }SetPositionSize( 999999999 ); //would result in VERY large PositionsSetShareCap( 100 ); //but here we cap shares at 100
18.28 SetShareFloor
SetShareFloor( Floor: integer );
RChartScripts XSimuScripts XPerfScripts XCMScripts
Description
Sets a minimum number of shares per position to Floor. Ordinarily, the size of a Positionis established by what you select in the Position Sizing control. However, if you useSetShareFloor you can limit the number of shares.
Remarks
• SetShareFloor is global in nature, therefore the most recent call to SetShareFloorwill be used for subsequent trades. This implies that in the $imulator only the last callin the final raw-profit run of the last symbol will be used as the share floor.
Example
{ Minimum trade size of 100 shares }SetShareFloor( 100 );
18.29 SetShareSize
SetShareSize( Shares: integer );
RChartScripts XSimuScripts XPerfScripts XCMScripts

WealthScript Function Reference, Wealth-Lab Pro™315
© 2003-2006 FMR Corp. All rights reserved.
Description
Use SetShareSize to assign a fixed number of Shares (or contracts) per Position in yourscript. Subsequent trades will use the number of Shares or contracts that you specified.
Remarks
• Use of SetShareSize is generally discouraged since SimuScripts are available to setposition sizing in all tools (see SetPositionSizeShares). The function is primarily forcompatibility with earlier versions of Wealth-Lab.
• When using the $imulator tool or Portfolio Simulation mode in the Position Sizingcontrol, you must choose the radio button for SetShare/PositionSize Value toenable SetShareSize to influence position sizing.
• In Raw Profit modes, SetShareSize will override the Position Sizing control'sselection. Exception: SetShareSize has no effect in a Raw Profit WatchList orChartScript Ranking.
• You can use both SetPositionSize and SetShareSize in the same script. As thesefunctions are global in nature, the next time a trade is processed it will use the valuefrom the function last called.
Example
{ Assign a trade size of 200 shares to new positions }SetShareSize( 200 );
18.30 SetSlippage
SetSlippage( EnableSlippage: boolean; Slippage: float; LimitOrders: boolean );
RChartScripts XSimuScripts XPerfScripts XCMScripts
Description
Lets you override the default Slippage settings in the Options Dialog|TradingCosts/Control from within your script.
EnableSlippage Controls whether Slippage is on (activated) or off.
Slippage Controls the amount of Slippage to use.
LimitOrders Controls whether prices must move to at least the Slippage-adjustedamount in order for Limit and Stop orders to be executed.
Remarks
• Settings for the most recent SetSlippage call are used for the trading signals thatfollow (see example).
• See the Options Dialog|Trading Costs/Control topic in the Wealth-Lab User Guidefor details on how Slippage affects entry and exit price.
Example
var Bar: integer;InstallTimeBasedExit( 10 );InstallStopLoss( 5 );
Trading System Control Functions 316
© 2003-2006 FMR Corp. All rights reserved.
for Bar := 20 to BarCount - 1 dobegin{ Enable 2 units of slippage for the Autostops } SetSlippage( true, 2, true ); ApplyAutoStops( Bar );
{ Disable slippage for other [manual] trading signals } SetSlippage( false, 2, true );// rest of trading system...end;
18.31 ShortAtClose
ShortAtClose( Bar: integer; SignalName: string ): boolean;
RChartScripts XSimuScripts XPerfScripts XCMScripts
Description
Establishes a short Position at market close of the specified Bar.
Remarks
• Slippage, when activated, can affect the trade's execution price.
• The string, which may be a blank string, passed as the SignalName parameter willappear in the Entry Signal column in the Trades View for ChartScript and $imulatorwindows, or in the Signal Name column for the Scans tools.
• ShortAtClose will return boolean false if the signal fails to establish a new position.This can occur, for example, when using 100% equity position sizing without Leeway.
Note: AtClose orders can be difficult to realize in practice.
Example
{ Short at Close on a TD Power of 9 Signal }var BAR: integer;for Bar := 40 to BarCount - 1 dobegin if not LastPositionActive then begin if CumUp( Bar, #Close, 4 ) = 9 then ShortAtClose( Bar, 'TD Power of 9' ); end else begin{ ... Exit Rules ... } end;end;
18.32 ShortAtLimit
ShortAtLimit( Bar: integer; LimitPrice: float; SignalName: string ): boolean;
RChartScripts XSimuScripts XPerfScripts XCMScripts

WealthScript Function Reference, Wealth-Lab Pro™317
© 2003-2006 FMR Corp. All rights reserved.
Description
Establishes a short Position if prices reach the indicated LimitPrice. The Position will beopened if prices meet or exceed the LimitPrice on the specified Bar. If prices open abovethe LimitPrice, the Position will be established at open price. If prices fail to reach theLimitPrice objective, a Position is not established and the function returns false.
Remarks
• Slippage, when activated, can affect the trade's execution price.
• The string, which may be a blank string, passed as the SignalName parameter willappear in the Entry Signal column in the Trades View for ChartScript and $imulatorwindows, or in the Signal Name column for the Scans tools.
• For futures symbols, LimitPrice is automatically rounded to the nearest Tick value.
Example
{ Short the next bar at limit price of recent 10 bar high }var BAR: integer;var p: float;for Bar := 40 to BarCount - 1 dobegin if not LastPositionActive then begin p := Highest( Bar, #Close, 10 ); ShortAtLimit( Bar + 1, p, '' ); end else begin{ ... Exit Rules ... } end;end;
18.33 ShortAtMarket
ShortAtMarket( Bar: integer; SignalName: string ): boolean;
RChartScripts XSimuScripts XPerfScripts XCMScripts
Description
Establishes a short Position at market open of the specified Bar.
Remarks
• Slippage, when activated, can affect the trade's execution price.
• The string, which may be a blank string, passed as the SignalName parameter willappear in the Entry Signal column in the Trades View for ChartScript and $imulatorwindows, or in the Signal Name column for the Scans tools.
• ShortAtMarket will return boolean false if the signal fails to establish a new position.This can occur, for example, when using 100% equity position sizing without Leeway.
Example
{ Establish a short position if RSI gets overbought }

Trading System Control Functions 318
© 2003-2006 FMR Corp. All rights reserved.
var BAR: integer;for Bar := 40 to BarCount - 1 dobegin if not LastPositionActive then begin if RSI( Bar, #Close, 20 ) > 70 then ShortAtMarket( Bar + 1, 'RSI Short Signal'); end else begin{ ... Exit Rules ... } end;end;
18.34 ShortAtStop
ShortAtStop( Bar: integer; StopPrice: float; SignalName: string ): boolean;
RChartScripts XSimuScripts XPerfScripts XCMScripts
Description
Establishes a short Position if prices reach the indicated StopPrice. The Position will beopened if prices meet or go below the specified StopPrice on the specified Bar. If pricesopen below the StopPrice, the Position will be established at open price. If prices fail toreach the StopPrice objective, a Position is not established and the function returns false.
Remarks
• Slippage, when activated, can affect the trade's execution price.
• The string passed as the SignalName parameter, which may be a blank string, willappear in the Entry Signal column in the Trades View for ChartScript and $imulatorwindows, or in the Signal Name column for the Scans tools.
• For futures symbols, StopPrice is automatically rounded to the nearest Tick value.
Example
{ Enter short if prices go a BIT lower than today's low }var BAR: integer;var sp: float;for Bar := 40 to BarCount - 1 dobegin if not LastPositionActive then begin sp := PriceLow( Bar ) * 0.95; ShortAtStop( Bar + 1, sp, '' ); end else begin{ ... Exit Rules ... } end;end;

WealthScript Function Reference, Wealth-Lab Pro™319
© 2003-2006 FMR Corp. All rights reserved.
18.35 SplitPosition
SplitPosition( Position: integer; RetainPct: float ): integer;
RChartScripts XSimuScripts XPerfScripts XCMScripts
Description
Splits a single Position into two and returns the Position Number of the new position. Youcan then close off one of the Positions if desired. The RetainPct parameter specifies thepercentage of shares/contracts to retain in the original position. For example, to keep75% of the Position, specify 75 for this parameter. The new Position will contain 25% ofthe shares of the original Position.
Remarks
• The Position Number of the original position is not affected by SplitPosition. The newposition is added to the PositionCount and becomes the LastActivePosition.
• When using an exact 50% split for odd-sized Positions, e.g. 7, 11, or 13 contracts, it'spossible that floating point rounding errors can cause the odd lot to be exited in somecases and retained for others. You can work around this issue by passing a numberslightly less than or greater than 50 for the RetainPct parameter. For example, use49.999 to force the sale of the odd share (and retain the lesser amount).
• You cannot use SplitPosition in a ChartScript used for automated trading with theOrder Manager. See the User Guide for details.
• See the SplitPosition Tutorial for additional information and examples in the Wealth-Lab Knowledge Base.
Special Notes:
• Since SplitPosition has the effect of creating multiple positions on the entry bar,trading systems that use this function cannot be supported by the Order Manager.
• "Merging" positions is currently not possible.
Example
{ Split our Position into two and sell one half }var BAR, NP: integer;for Bar := 40 to BarCount - 1 dobegin if not LastPositionActive then begin{ ... Entry Rules ... } end else begin{ ... Exit Rules ... } end;{ Exit half after 10 days } if LastPositionActive then if Bar - PositionEntryBar( LastPosition ) > 10 then begin np := SplitPosition( LastPosition, 50 ); SellAtClose( Bar, np, ''); end;

Trading System Control Functions 320
© 2003-2006 FMR Corp. All rights reserved.
end;