Wealth Inequality and the Importance of Public Pension ... · PDF fileWealth Inequality and...
30
1 Wealth Inequality and the Importance of Public Pension Entitlements ∗ by Joachim R. Frick i and Markus M. Grabka ii Paper prepared for the LIS conference “Inequality and the Status of the Middle Class: Lessons from the Luxembourg Income Study,” Luxembourg, 29 – 30 June 2010 Abstract: In recent years, the social policy discussion in Germany—but elsewhere as well—has been heavily dominated by the issue of income inequality and rising poverty risk rates. Yet very lit- tle research has been done on the personal wealth distribution to date, not least of all due to the severe lack of appropriate data. Using representative micro-data from the Socio-Economic Panel Study (SOEP), the German contribution to the Luxembourg Wealth Study (LWS), this paper analyzes a standard measure of net worth (including property, financial assets, business assets) for 2007. Detailed analyses by SES reveal significant differences in wealth holdings by occupational status as well as across age groups, but are based on a “standard” net worth con- cept and thus ignore any entitlements to public pension schemes. In the present paper, we use statistical matching to link the SOEP survey data to data from the German Social Security Administration. Using retrospective life history data as well as concurrently collected data from up to 24 annual interviews in the SOEP, our matching is based on education, employ- ment, and income history as well as fertility data, all of which are relevant correlates of pension entitlements. This approach allows us to calculate the present value of an individual’s public pension entitlements as of 2007. Our results for the extended wealth measure indicate a very strong impact of pension entitle- ments on wealth levels and wealth aggregates (plus 95 percent of non-pension wealth), on the portfolio structure, as well as on wealth inequality (the Gini coefficient is reduced by roughly one quarter), all of which reflect the dominant role of the public pension system in Germany. The effect on “middle-class” households is particularly strong when using either income or net worth measures as the basis for defining the middle class. This augmented wealth measure may be useful to reduce the respective inequality bias within a given country (here Germany) resulting from different incentives to invest in old-age provision depending on employment status (self-employed, public servant, dependent employee), but it may be most important for comparative research on wealth inequality across countries and welfare regimes. JEL-codes: C49, D31, D63, I39 Keywords: Wealth inequality, statistical matching, public pension entitlements, SOEP, LWS ∗ The authors are grateful to Anika Rasner for very valuable comments and to Rainer Siegers for outstanding programming assistance. We also thank the research data centre of the German Public Pension Administra- tion (FDZ-RV) for providing micro data. i Corresponding Author: SOEP at DIW Berlin, TU Berlin, and IZA Bonn, [email protected] ii SOEP at DIW Berlin and TU Berlin, [email protected]
Transcript of Wealth Inequality and the Importance of Public Pension ... · PDF fileWealth Inequality and...
1
Wealth Inequality and the Importance of Public Pension Entitlements∗
by Joachim R. Fricki and Markus M. Grabkaii
Paper prepared for the LIS conference “Inequality and the Status of the Middle Class:
Lessons from the Luxembourg Income Study,” Luxembourg, 29 – 30 June 2010
Abstract: In recent years, the social policy discussion in Germany—but elsewhere as well—has been heavily dominated by the issue of income inequality and rising poverty risk rates. Yet very lit-tle research has been done on the personal wealth distribution to date, not least of all due to the severe lack of appropriate data. Using representative micro-data from the Socio-Economic Panel Study (SOEP), the German contribution to the Luxembourg Wealth Study (LWS), this paper analyzes a standard measure of net worth (including property, financial assets, business assets) for 2007. Detailed analyses by SES reveal significant differences in wealth holdings by occupational status as well as across age groups, but are based on a “standard” net worth con-cept and thus ignore any entitlements to public pension schemes. In the present paper, we use statistical matching to link the SOEP survey data to data from the German Social Security Administration. Using retrospective life history data as well as concurrently collected data from up to 24 annual interviews in the SOEP, our matching is based on education, employ-ment, and income history as well as fertility data, all of which are relevant correlates of pension entitlements. This approach allows us to calculate the present value of an individual’s public pension entitlements as of 2007.
Our results for the extended wealth measure indicate a very strong impact of pension entitle-ments on wealth levels and wealth aggregates (plus 95 percent of non-pension wealth), on the portfolio structure, as well as on wealth inequality (the Gini coefficient is reduced by roughly one quarter), all of which reflect the dominant role of the public pension system in Germany. The effect on “middle-class” households is particularly strong when using either income or net worth measures as the basis for defining the middle class. This augmented wealth measure may be useful to reduce the respective inequality bias within a given country (here Germany) resulting from different incentives to invest in old-age provision depending on employment status (self-employed, public servant, dependent employee), but it may be most important for comparative research on wealth inequality across countries and welfare regimes.
JEL-codes: C49, D31, D63, I39 Keywords: Wealth inequality, statistical matching, public pension entitlements, SOEP, LWS
∗ The authors are grateful to Anika Rasner for very valuable comments and to Rainer Siegers for outstanding
programming assistance. We also thank the research data centre of the German Public Pension Administra-tion (FDZ-RV) for providing micro data.
i Corresponding Author: SOEP at DIW Berlin, TU Berlin, and IZA Bonn, [email protected] ii SOEP at DIW Berlin and TU Berlin, [email protected]

2
1 Motivation
Pension entitlements—whether statutory, occupational, or private—represent a considerable
source of wealth. But despite the importance of this wealth component—often referred to as
public pension wealth3—in obtaining unbiased wealth estimates, it has not been adequately
investigated in the wealth distribution research.
There are two main reasons why pension wealth is typically disregarded in wealth analyses
based on survey data. First, interviewees usually do not know their accumulated pension en-
titlements, given that in a standard pay-as-you-go old age security system, contributions are
compulsory for employers and employees. Pension entitlements are based on earnings but al-
so may cover periods of child-rearing, education, long-term care, or unemployment, with
pension entitlements for each of these periods being calculated differently. The insured person
generally does not know the precise sum of all of these entitlements.4
Second, one may argue that pension wealth represents only a “notional” asset. Simply adding
this component to financial and material assets is problematic because such standard assets
carry specific functions that pension entitlements largely fail to fulfill. For example, in con-
trast to interest payments received from savings, no (further) income can be gained from
pension entitlements; the latter also lack the usage function of real estate, and the possibility
of bequeathing them takes only the severely limited form of provision for dependants (in the
form of widow/er pensions). The power, socialization, and prestige functions associated with
great monetary and material wealth holdings are also not relevant in the case of old-age
pension entitlements. Premature liquidation of entitlements, for example for the purchase of
3 The terms public pension wealth and social security wealth are defined as the total sum of individual pension rights accrued so far over the life course. These pension rights translate into old-age public pension benefits as the individual retires. Both terms are used interchangeably throughout the paper and refer only to entitlements in the old-age public pension scheme. 4 In a small pretest of the German Socio-Economic Panel Study (SOEP) in 2002, interviewees were asked for individual social security wealth. The question generated an extraordinarily high percentage of missing data; the reliability of the information given by the remainder of respondents was questionable. Similarly, a 2009 pilot study tested the willingness of SHARE respondents to allow for record linkage with administrative data using their Social Security Number (SSN). While 77 percent gave their consent, only 64 percent of these respondents actually provided their SSN.

3
real estate, is barred, as is taking an advance. What remains, then, is merely the security func-
tion. But even this function is limited to the phase of life that follows retirement, or to cases
of occupational disability or provision for dependants. Finally, although pension wealth
represents protected private-sector capital stock, the state could change the value of assess-
ment-financed entitlements, making pension entitlements a variable stock of wealth.
Notwithstanding all these arguments, which are similarly valid across countries, conventional
analyses using a standard net worth measure also face the problem of major differences be-
tween occupational groups within a given country in terms of both pension scheme designs
and the savings behaviour resulting from different incentive structures. In the case of Germa-
ny, some occupational groups are exempted from the statutory pension system and therefore
have to put away money for retirement on their own. This is true for most self-employed
people, who typically invest in private insurance plans, real estate, or business assets, i.e.,
types of assets that are usually adequately captured in a standard measure of net worth. A
second important group not covered by the statutory pension system is civil servants, who
generally do not contribute a significant percentage of their earnings to their pension scheme
but still enjoy fairly high tax-financed benefits after retirement.5 By contrast, wage-earners
and salaried employees generally have compulsory pension schemes and in some cases occu-
pational pension schemes as well.6
The problem of dissimilarities across occupational groups is considerably larger in the case of
international comparisons. Depending on which welfare regime is being examined, the relev-
ance of public pension wealth in an extended measure of net worth may differ widely. For
countries like Germany with a mature pay-as-you-go pension (PAYG) system, pension wealth
is clearly more important in quantitative terms than in liberal welfare systems that put more
emphasis on private pension provision. Convincing evidence is presented by Frick and Head-
5 The replacement rate for civil servants in Germany retiring after forty years of full-time employment amounts to almost 72 percent of their recent gross earnings. In contrast, the replacement level for the standard public pension system retiree (the so-called “Eckrentner”), who worked for 45 years with average earnings, is as high as approximately 48 percent of previous earnings (Bundesministerium für Arbeit und Soziales 2008). 6 The consideration of public pension entitlements in wealth analyses might also be helpful for a better under-standing of savings behavior across occupational groups, given that there is still not a fully satisfying theoretical model to explain savings behavior (see Börsch-Supan 2001).
4
ey (2009), who compare the wealth position of retirees (aged 65 and over) in Australia and
Germany, that adequately accounting for the present value of pension wealth in an extended
wealth measure yields very similar levels of wealth for these groups in both countries—in
contrast to the results based on standard net worth, which clearly favor elderly Australians.
Furthermore, while net worth is clearly less equally distributed in Germany than in Australia,
taking public pension wealth into consideration in the extended wealth measure brings in-
equality down to similar levels in both countries.
Last but not least, when assessing the impact of public pension wealth, one should also con-
sider inter-temporal changes in benefit levels in the different pension schemes. Demographic
changes such as population aging place social security systems under pressure, reducing the
generosity of public pensions and the public/private pension mix (Bonin 2009). This may af-
fect middle-income earners most severely, given that a large share of total net worth is con-
tained in pension entitlements.
The aim of this paper is to show the relevance and magnitude of public pension wealth when
considered in an extended wealth measure. Given that such information is not readily availa-
ble in survey data, we describe how, in the German case, pension entitlements can be deter-
mined by means of statistical matching and how the present value can be defined.7 We
analyze the impact of pension entitlements on the distribution of net worth, considering varia-
tion in wealth across socio-economic groups defined according to age, income, and occupa-
tional status. Based on our findings for Germany, we strongly recommend the use of an
extended wealth measure like the one proposed here, taking the present value of pension en-
titlements fully into account in cross-country comparative research on wealth inequality.
7 We follow the approach by Gruber and Wise (1999) converting future income flows from old age pension
schemes into a stock measure.
5
2 Determining public pension entitlements
Population surveys in Germany typically do not ask for information about social security
wealth, because respondents usually do not know their total pension entitlements at any par-
ticular point in time. Register data, on the other hand, contain detailed information on pension
entitlements, but no information about other wealth components or the individual’s socio-
economic background or household situation. For the purpose of a comprehensive analysis of
the wealth distribution, ideally, survey and administrative data could be directly merged using
a unique identifier such as the individual’s social security number (“record linkage”). Howev-
er, at least in Germany, this option is not feasible for data confidentiality reasons, i.e., one has
to ask for the social security number and for informed consent (with respect to record lin-
kage), both of which motivate respondents to reject (further) participation. Statistical match-
ing may provide a second-best option to overcome the drawbacks of both data sources and
make use of their respective merits. Unlike record linkage, statistical matching does not aim
at finding the exact same person, but links observations that are statistically similar, at least in
terms of certain characteristics observed in both data sets (“matching variables”).
2.1 Statistical matching of survey data and pension account information
The following section describes our double matching approach in determining public pension
entitlements. First, we combine standard data on net worth from the representative German
Socio-Economic Panel (SOEP) study with data on total pension entitlements accrued over the
life course from the German Social Security Administration’s sample of active pension ac-
counts (Versicherungskontenstichprobe, VSKT). An additional link to data from the “statis-
tics on pension benefits splitting after divorce” (Versorgungsausgleichsstatistik), or divorce
statistics, provides an effective control of effects of divorce on pension benefits, which would
otherwise be ignored but can have important impacts on divorced people’s pension entitle-
ments. The most important outcome measure resulting from this double matching procedure
is an estimate of the individual’s social security wealth as of 2007.
The German SOEP is a multidisciplinary household panel study (Wagner at al. 2007). Start-

6
ing in 1984, it covers a representative sample of the total population living in private house-
holds in Germany. In 2007, about 12,000 households and 22,000 individuals were inter-
viewed. The micro-data provide detailed information on individuals, households, and
families, and enable researchers to monitor changes in living conditions over time. The stan-
dard components are surveyed annually, whereas certain special topic modules are surveyed
at roughly five-year intervals. In 2007, a special wealth module collected detailed data on ma-
terial and financial wealth at the individual level (Frick et al. 2007), but no information on
public pension entitlements. This paper seeks to fill this gap by using data from the sample of
active pension accounts (VSKT). This is a one percent random sample of pension accounts,
containing records for approximately 570,000 individuals, both actively insured and already
retired. These records are representative of all those individuals who contribute(d) to the GRV
pension scheme. The VSKT collects detailed longitudinal pension-relevant information on
monthly earnings, unemployment spells, and periods of child care as well as long-term care
over the course of working life. The third data set used in the analysis is the “statistics on
pension benefits splitting after divorce” (Versorgungsausgleichsstatistik), or divorce statistics.
The divorce statistics are designed to aid the administration of the pension system, and con-
tain information on the splitting of pension benefits in all relevant divorce settlements—a to-
tal of 5.5 million cases since their introduction in 1977. Further, these statistics contain
information about marriages and divorces that goes beyond the information provided in the
VSKT.
We slice both data sets, SOEP and VSKT, by sex, region, and immigrant status, taking into
account pronounced regional and gender differences in pension entitlements. Pensionable
earnings and pension-relevant transfer payments (e.g., unemployment benefits, etc.) are the
most important determinants of the individual’s social security wealth, and hence, our key
matching variables. An income measure summarizes all income that qualifies for the accrual
of pension benefits (earnings, unemployment benefits, sickness allowances, etc.).8 For the
8 Both data sets contain earnings and income information for the years 1983 to 2007 for West Germany and 1991 to 2007 for East Germany. Thus, we are covering the entire period since German unification in 1990, when the West German social security system was by and large transferred to East Germany, providing GDR workers with pension entitlements for all years of employment during the existence of the GDR without having paid any contributions.

7
computation of the distance function, income enters the equation as a three-year moving aver-
age to smooth individual income histories (average income for the years 1984-1986; 1985-
1987, …, 2003-2005): for each individual, this adds up to a maximum of 20 variables.9 A
woman’s fertility history is used in the statistical matching as additional information, since it
determines the number of childcare credits that translate directly into pension entitlements
credited to the woman’s pension account. In addition, we take various duration variables into
account in the computation of the distance metric reflecting the number of years spent in dif-
ferent activities such as employment, unemployment, education, compulsory military or
community service (men only), and long-term care. Finally, the statistical matching includes
the age of the respondent as of 2007.
Given the representativeness of the SOEP sample for the German population, we match
VSKT information to SOEP data, i.e., the SOEP data provides the recipient file. Matching the
data in this way enables us to maintain the representative demographic structure of the SOEP
population and eliminate potential issues of selectivity inherent to VSKT data.
The statistical matching between the SOEP and the VSKT data makes use of Mahalanobis
distance matching (Kantor 2006), which is frequently used in cluster analysis. For each ob-
servation xi in the SOEP, the statistical software measures the Mahalanobis distance dij from
each observation xj in the VSKT on the basis of the selected matching variables p. The statis-
tical donor chosen is the VSKT observation with the smallest distance from the SOEP case.
Unlike the Euclidean distance, the Mahalanobis score incorporates correlations between
matching variables and differences in variances. This implies that highly correlated matching
variables do not enter the computation of the Mahalanobis distance with the same weight.
This property is particularly useful in our application, since the individual’s annual income at
time t is likely to be highly correlated with the annual income at time t+1.10
9 For all 2007 SOEP respondents with incomplete income profiles, missing information was imputed starting in 2007 and going back to 1984 for West Germany and to 1991 for East Germany. The imputation process made maximum use of all available longitudinal income information since the respondent’s initial participation in the SOEP. 10 In alternative specifications, OLS regression, univariate imputation sampling, and hotdeck imputation were used to combine the two data sets. Using information on actual pension payments received by retired SOEP res-pondents, we compared imputed results using the different approaches with the observed amounts. The Mahala-

8
Figure 1: Statistical matching process: SOEP, VSKT, and divorce statistics
Source: Rasner et al. (2010)
Divorce cannot be adequately considered when matching SOEP data with the administrative
pension data provided by the VSKT, so an additional match is required to correct for the split-
ting of statutory pension benefits between former spouses. For every divorce, the pension
rights accrued by husband and wife during their marriage are summed up and split in half at
the date of divorce.11 Information provided in the divorce statistics of the statutory pension
insurance is the appropriate data source to correct for this potential bias. To estimate the di-
vorce correction, we combine VSKT and divorce statistics using record linkage. The unique
identifier used for the linkage is a combination of the exact amount of the split pension, gend-
er, region, and age. Based on the linked data, we estimate group-wise linear regression mod-
els that provide us with the divorce correction, which is then applied to SOEP data. Figure 1
illustrates the statistical matching process between the three data sources including matching
nobis distance performed best with respect to absolute differences, distribution, and correlation (see Rasner et al. 2010). 11 In practice, women are the main beneficiaries of pension splitting because of their weaker labor market at-tachment. For the majority of divorced couples, the pension is split immediately upon divorce, while bonuses and maluses remain unaffected by the remarriage of either former spouse.

9
strata and the respective matching variables.12
2.2 The principle of capitalization of pension entitlements
For the following analysis of (extended) wealth inequality, we use a measure of net worth
from SOEP data in conjunction with the present value of pension wealth entitlements accrued
so far from statutory, occupational, and private pension schemes. The latter complement the
asset information contained in the SOEP data: owner-occupied and other real estate holdings,
financial assets, assets from life insurance policies and private pension schemes, building so-
ciety savings agreements (Bausparverträge), business assets, valuables, and consumer and
mortgage loans. Total net worth—the relevant criterion when discussing social welfare and
the key indicator when analyzing the personal wealth distribution—is determined by subtract-
ing liabilities from gross assets.
The income section of the SOEP questionnaire asks retired people a number of questions
about benefit payments from the different types of pension schemes. As a result, pension en-
titlements, i.e., the present value of the respective future income streams for those already re-
tired, can be derived directly from their answers, assuming these benefits will be paid as an
annuity for the remaining lifetime. However, for the insured but not yet retired people, i.e.,
people of working age, the information about pension entitlements from the statutory pension
insurance is obtained through statistical matching as described above. The SOEP does not
contain questions about pension benefits such as occupational pensions or pensions for inde-
pendent professionals (such as architects or physicians) or tradesmen for the currently insured
population (due to the fact that respondents are by and large unable to provide specific an-
swers), nor is there external information comparable to the statutory VSKT data that could be
used to generate this missing information through statistical matching. For the cohorts prior to
entry into retirement, therefore, the entitlements under these old-age pension systems have
been underestimated.13 A crucial exception is data on pension entitlements for non-retired civ-
12 For a detailed description of the matching process, the employed matching variables and a simulation to de-termine the appropriate matching strategy, see Rasner et al. (2010). 13 Figures in this paper do not include any provisions for dependents (widows or orphans).

10
il servants. For these active civil servants the amount of the entitlements can be reliably ap-
proximated based on the current pay level and the years of service. For each year of service,
civil servants are entitled to 1.79375 percent of the level of gross earnings received during the
last three years prior to retirement14. After 40 years of service, this accumulates to a maxi-
mum share of 71.75 percent.
Pension entitlements are assessed through capitalization, that is, by calculating the discounted
present value of recurring future payments (see formula 1). For the payout period, the average
further life expectancy (according to the 2005/2007 mortality charts of the German Federal
Office of Statistics, separated by East and West Germany and by sex) is considered. In addi-
tion, a retirement entry age that varies between 65 and 67 (according to the Pension Reform
Act 2007) depending on the age cohort is used as a basis. With the additional assumption that
future pension increases and inflation will balance each other out, the calculations are simpli-
fied in such a way that the real value of the entitlements is preserved.15 An interest rate of two
percent is assumed for discounting purposes.16 The resulting value is the gross pension en-
titlement.
Formula 1: Determining the Present Value (PV) of pension entitlements
with C = pension benefit, i = discount rate, n = further life expectancy in years (payment period)
However, various status groups differ with respect to the tax treatment of retirement income.
For example, life annuities and other benefits such as GRV pensions, agricultural pension
funds, or trade association pension funds are not fully taxed; rather, a taxable income share,
14 Using the current pay level most likely leads to an underestimation of the true future pension entitlement of civil servants, given that subsequent earnings increases are not considered. 15 Because of the pension reform act of 2004 and the sustainability factor introduced with it, future pension en-titlements will decline from birth cohort to birth cohort for the same number of payment points. For reasons of simplicity, however, this aspect is ignored here. 16 In alternative specifications we vary the interest rate between one and three percent; the choice of interest rate influences, by definition, the amount of the present value but changes little in the basic relationships according
11
which varies depending on when one starts receiving the pension, applies (§22 of the German
Income Tax Act [Einkommensteuergesetz]). For example, the taxable share of pensions re-
ceived for the first time in 2007 is as high as 54 percent. With each additional calendar year,
the income share for new pensions increases, reaching 80 percent by the year 2020 and 100
percent by 2040.17 On the other hand, civil servants’ annuities are already fully taxable. To
determine the net present value of any pension entitlements, the individual tax rate applicable
in 2007 is used here and is also differentiated according to the various status groups.18
In order to prevent double counting, no present value is determined for entitlements from pri-
vate pension plans, since the SOEP collects data on these wealth components in the part of the
SOEP questionnaire dealing with net financial assets.
3 The impact of pension entitlements on wealth inequality
3.1 Individual net worth without pension entitlements
The aggregated net worth of individuals in private households in Germany amounted to about
5.9 trillion euros in 2007 (Table 1)19 which is about 83,000 euros per capita. However, such
mean values can be highly affected by outliers, which appears to be more of an issue for
wealth analysis than for income analysis. Additionally, one should keep in mind that net
worth can take on negative values. As such, comparing the mean and median of the distribu-
tion is already very informative: indeed, in the year 2007, the latter takes on a value of less
than 15,000 euros, thus, the mean exceeds the median by a factor of 5.5, which is very indica-
tive of the overall degree of inequality.
to occupational groups as described here. 17 Under the German Retirement Income Act (Alterseinkünftegesetz), the principle of deferred taxation of pensions has been applied in Germany since 2005. Under this act, all old-age income will be gradually made ful-ly taxable by the year 2040. In return, old-age provision expenses can be deducted from personal income taxes, reducing the progressive effect and the tax burden during the period in which income is earned from employ-ment. 18 By applying the current individual tax rate, a relatively high tax burden is assumed for insured working per-sons. The actual tax burden would, however, have to be simulated separately for each age cohort at the time of entry into retirement. Because of the recently introduced deferred taxation, however, such a simulation is com-bined with major assumptions about the future income situation of the persons in question.

12
Figure 2: Individual net worth by status group, Germany 2007
⎯ Self-employed, ⎯ civil servants, ⎯ Members of the statutory public pension scheme (GRV), ⎯ Persons with continuous GRV insurance Note: for each group, the five lines represent the individual net worth derived from the multiple imputation pro-cedures applied to compensate for missing wealth information arising from non-response (see Frick et al. 2007). Source: SOEP 2007
Following the standard life-cycle hypothesis (Modigliani 1988) there is a strong relationship
between net worth and age, assuming that with increased age wealth is typically accumulated
until retirement. After leaving the labor force, dissaving occurs to smooth income gaps. How-
ever there are pronounced deviations in the levels of wealth accumulation between various
status groups over the life cycle (Figure 2). Not surprisingly, self-employed persons in Ger-
many accumulate the highest levels of net worth: around retirement (60 years old), their net
worth is around 400,000 euros, twice as high as that of civil servants and 3.5 times higher
than individuals insured under the statutory pension scheme (GRV). Even for members of the
GRV with a continuous occupational history and few to no periods of unemployment that
would lead to a reduced ability to save, net worth adds up to only 140,000 euros around re-
tirement.
19 See also Frick and Grabka (2009, 2010).

13
3.2 Individual net worth considering public pension entitlements
The general shape of the age profile of the present value of pension entitlements is as ex-
pected: it increases with age up to the time of retirement with a somewhat steeper slope in the
second half of working life (Figure 3). Apparently, this results mainly from the fact that earn-
ings typically increase with age, as does the absolute value of the contributions, given that
these are calculated as a fixed percentage of earnings (up to a certain income threshold). With
retirement, contributions are no longer paid into the system; rather, pensions are paid out, re-
ducing the present value of future pension income flows until the statistical death occurs.
Obviously, the choice of discount rate matters: using a discount rate of two percent, the net
present value of all pension entitlements in Germany amounts to about 5.6 trillion euros (Ta-
ble 1) in 2007, which nearly doubles the figure of net worth. Across all adults in Germany,
this equals a mean value of 78,500 euros or a median of roughly 47,000 euros.
Table 1: Net worth and public pension wealth in Germany1, 2007 Net Worth (€) Public Pension
Wealth2 (€) Extended Wealth (€) Change (%)
Basic Statistics (1) (2) (3) [(1) / (3)] - Mean (s.e.) 83,077 (2,851) 78,479 (871) 161,556 (2979) 94,5 - Median (s.e.) 14,751 (656) 46,680 (849) 94,675 (1795) 541,8 - Sum in billion euros 5.908 5.581 11.489 94,5 Inequality - Gini (s.e.) 0,8004 (0,0071) 0,5661 (0,0031) 0,6039 (0,0065) -24,6 - HSCV (s.e.) 6,5146 (2,6251) 0,7300 (0,0264) 2,0259 (0,7538) -68,9 - P90:P50 (s.e.) 3 14,1517 (0,6641) 4,1161 (0,0758) 3,8287 (0,0753) -72,9 Wealth shares (%) - lowest quintile -1,5 0,9 0,4 -126,7 - 2nd q. 0,4 5,2 4,5 1025,0 - 3rd q. 3,9 12 11,8 202,6 - 4th q. 17,3 24,1 22,4 29,5 - highest quintile 79,9 57,7 60,9 -23,8 Population with zero ornegative wealth (%) 28,1 4,5 3,3 -88,3 1 Population: persons in private households aged 17 or older (N=69.321.834). 2 With a discount rate of two percent, without provision for dependants. 3 Lowest value for the top ten percent in the wealth distribution in relation to the median (50 percent). Source: SOEP 2007.
The application of a discount rate of about 2 percent is a rather normative decision, which is
oriented toward the long-term real interest rate of federal bonds in Germany. In alternative
specifications, we apply an interest rate of 1 percent and 3 percent, yielding an aggregated net

14
value of pension wealth of about 6.5 trillion euros and 4.9 trillion euros, respectively. The re-
spective mean values vary between about 91,000 euros and about 68,000 euros for a discount
rate of 1 percent and 3 percent. Comparing the present value of pension entitlements for three
different discount rates, there are clear differences with respect to overall levels but not for
the distribution over the life course. For all three graphs in Figure 3, the highest present val-
ues can be observed at retirement age, with about 210,000 euros when using a discount rate of
1 percent, more than 190,000 euros applying a discount rate of 2 percent, and finally, 170,000
euros based on a discount rate of 3 percent.
Figure 3: Present value of pension wealth entitlements by age using different discount rates,
Germany 2007
Source: SOEP 2007
Comparing the age profile of net worth, pension entitlements, and the resulting extended
wealth measure over the life course (Figure 4), the highest values for pension entitlements can
be observed for those around retirement age (about 65 years old) with almost 200,000 euros,
while for net worth, the highest values of about 140,000 euros can be observed somewhat ear-
lier in life around age 60. Thereafter net worth decreases slightly, probably due to early inhe-
050
100
150
200
in 1
000
Eur
o
20 30 40 50 60 70 80age in years
discount rate i=1% discount rate i=2%discount rate i=3%

15
ritances and gifts to younger generations. However, for the elderly, i.e., those older than 80,
net worth increases again, which might reflect a concentration of wealth holdings due to inhe-
ritances by widower(s) as well as demographic processes including selective mortality, which
tends to favor the wealthy (“survival of the wealthiest”).
Figure 4: Net worth, present value of pension wealth entitlements and extended wealth by
age, Germany 2007
Source: SOEP 2007; Public pension wealth using a discount rate of 2 percent.
3.3 Wealth inequality and pension entitlements
Net worth is typically far more concentrated than (equivalent) post-government income. This
is certainly also true in the German case. In 2007, the Gini coefficient for net worth takes a
value of 0.80 (Table 1). The richest fifth of the adult population holds a share of nearly 80
percent of total net worth, while the poorest 60 percent own less than 3 percent of total net
worth. In contrast to net worth—where about one-twelfth of the adult population had liabili-
ties exceeding gross wealth, yielding a negative value for net worth—in our application,
010
020
030
0in
100
0 Eu
ro
20 30 40 50 60 70 80age in years
public pension entitlements net worthextended wealth

16
pension entitlements can take only positive values.20 Thus even the poorest fifth of the adult
population had a positive value for present values of pension entitlements.
As expected, pension entitlements are less concentrated, given that nearly everyone is insured
in at least one old-age pension scheme. More than 28 percent of the population has zero or
negative net worth, while less than 5 percent of the population—mostly very young people—
have not yet accrued any public pension entitlements at all. Hence, the Gini coefficient of
0.566 for public pension wealth is much lower than for net worth. Adding pension entitle-
ments to net worth yields a Gini coefficient for extended wealth of around 0.6, which is a sig-
nificant decrease in inequality of about one-quarter.
The lower concentration of pension entitlements can also be observed when looking at the
top-sensitive half-squared coefficient of variation (HSCV). While this measure takes an ex-
traordinary high value of 6.5 for net worth, the respective outcome for public pension entitle-
ments is only 0.7. For the resulting extended wealth measure, the HSCV comes to just 2.0—a
decrease in inequality of more than two-thirds. The reason for the stronger reduction effect for
the HSCV than for the Gini coefficient is the extreme top-sensitivity of the wealth data. This
result is mirrored for the P90:P50 percentile ratio as well. While the top ten percent of the net
worth distribution owns a minimum of 14 times more wealth than the median, this relation-
ship is “only” 3.8 for extended wealth (again, a significant decrease of 73 percent).
The very widespread existence as well as the more even distribution of old-age pension en-
titlements and the equalizing effect on extended wealth become apparent when comparing the
respective present value by decile of net worth (Figure 5).The lower part of each bar depicts
the average net worth ranging from a negative 12,000 euros in the lowest decile to more than
500,000 euros in the top decile. Keeping those deciles fixed and adding the average present
value of public pension entitlements yields the average extended wealth per decile of net
worth. Apparently, for the lower half of the distribution, the mean values for the pension en-
20 A precise quantification of liabilities to PAYG pension schemes is complex. It requires, among other things, simulating cohorts as yet unborn, all of whom would already have negative wealth by the time they are born.

17
titlements vary only slightly between 45,000 and 65,000 euros. However, for the lower half of
the wealth distribution, this wealth component is far more relevant than net worth. Higher in
the wealth hierarchy, pension entitlements do also increase—which is in line with the prin-
ciple of equivalence applied in the German pension schemes—but not as much as net worth.
For the top net worth decile, pension entitlements amount to more than 130,000 euros, but
compared with the net worth of more than 500,000 euros in the very same decile, this equals
only 20 percent of an extended wealth measure. This process is also dampened by the top-
coding effect in the GRV resulting from an upper income threshold (social security contribu-
tion ceiling).
Figure 5: Mean net worth and mean present value of pension entitlements by net worth de-
ciles, Germany 2007
133.270
508.448157.46192.81549.83423.2739.5382.857640-12.210
52.44245.23653.15951.111
65.347 79.78987.161
103.856
113.907
-100.000
0
100.000
200.000
300.000
400.000
500.000
600.000
700.000
1 2 3 4 5 6 7 8 9 10
Net Worth Decile
in E
uro
PPWNet Worth
PPW: Present value of public pension wealth using a discount rate of 2 percent. Source: SOEP 2007
Here we refrain from calculating any liabilities, i.e., future contributions to pension schemes; thus, the lowest possible value is zero.

18
With respect to wealth composition or portfolio structure, public pension wealth accounts for
basically almost all of “extended wealth” in the lower half the net worth distribution (Figure
5). In the sixth decile, public pension entitlements account for some 80 percent, in the eighth
decile for about half of extended wealth, and among the wealthiest 10 percent only one-fifth
comes from public pension wealth.
3.4 Net worth and public pension entitlements by occupational status
In addition to inheritances and gifts, current or earlier employment represents an important
source for the accumulation of wealth. Savings are determined largely by professional posi-
tion and, accordingly, by the income level achieved.21 While unskilled or semi-skilled work-
ers and salaried employees (without an apprenticeship) in Germany held roughly 34,000 euros
in financial and material assets in 2007, the figure for qualified skilled personnel (such as
foremen and masters) was close to 70,000 euros (Table 2). Net worth for employees with
management responsibilities amounted to more than 120,000 euros. Civil servants in Germa-
ny typically have above-average net worth. This can be seen alone in the executive or admin-
istrative class of civil servants, who have an average individual net worth of more than
140,000 euros. For civil servants in the sub-clerical or clerical service class, net worth is only
67,000 euros but still considerably higher than for skilled workers and salaried employees in
lower-level positions.
The self-employed have the highest level of financial and material wealth. This is the result of
business assets but is also due to the fact that the self-employed have to make their own pro-
visions for old age, usually by buying private life insurance plans and property. The larger a
business is—as measured in this instance by the number of employees—the higher the value
of net worth. For self-employed people without employees, net worth was approximately
170,000 euros in 2007; the figure for the self-employed with up to nine employees was about
twice that, and for the self-employed with ten or more employees amounted to more than 1.1
million euros.
21 Here we differentiate individuals by the occupational positions stated in the 2007 SOEP survey. Nevertheless, a person may have held another occupational position previously, which may affect both the amount of financial and material wealth and old-age pension entitlements.

19
Table 2: Net worth and public pension wealth by occupational status in Germany1, 2007
Individual Net Worth
Present Value of Pension En-
titlements3
Extended in-dividual Net
Worth
Relative Change
Age in years
Share Female
in Euro in % Median in % Trainees, apprentices, those in military / community service 11.142 5.645 16.788 51 21 49
Unskilled and semi-skilled workers, sala-ried employees without an apprenticeship 33.618 53.965 87.582 161 43 55
Trained and skilled workers, salaried em-ployees in low qualification positions 46.964 56.043 103.007 119 42 41
Foremen, master craftsmen, supervisors, salaried employees in qualified positions 69.256 60.128 129.384 87 42 58
Salaried employees with extensive man-agement responsibilities 122.778 74.955 197.734 61 42 33
Civil servants in the sub-clerical or cleri-cal service class 67.019 92.135 159.154 137 40 36
Civil servants in the executive or adminis-trative class 145.775 149.484 295.259 103 47 41
Self-employed persons … without employees2 169.683 56.296 225.980 33 47 39 … with 1 to 9 employees 351.185 38.064 389.249 11 46 25 … with 10 or more employees 1.138.372 35.909 1.174.281 3 45 26 Persons of working age not gainfully em-ployed 74.553 39.620 114.173 53 44 89
Unemployed 15.406 52.070 67.476 338 42 53 Pensioners in the statutory pension scheme 98.956 129.763 228.719 131 71 56
Retired civil servants 187.510 313.436 500.946 167 69 20 NB: No information as to occupational position 47.583 72.464 120.047 152 17 48
Total 83.077 78.479 161.556 94 48 50 1 Population: persons in private households aged 17 or older. 2 Including family members helping out 3 With a discount rate of two percent, without provision for dependants. Source: SOEP 2007
Trainees and apprentices are very early in their occupational careers, and at a median age of
only 21, they have only accrued pension entitlements worth around 5,000 euros. Unemployed
people also have a far below-average net worth of about 15,000 euros in 2007. Following the
standard life cycle model of saving, the elderly hold above-average net worth. This is espe-
cially true for retired civil servants, with a net worth measure of nearly 190,000 euros, while
pensioners in the GRV have a net worth of only about 100,000 euros. The higher net wealth
of civil servants not only reflects the somewhat better educational level of this group; more

20
importantly, they make only an implicit contribution to their tax-financed old-age provisions,
which ceteris paribus allows them to accumulate more wealth than comparable dependent
employees who have to make higher contributions to the GRV22.
As described above, old-age pension schemes differ widely by occupational position in terms
of their structure and the level of benefits they provide. Accordingly, large differences are
seen in the present value of pension benefits accrued to date. The group of currently working
people that gains most from considering pension entitlements is that of civil servants. Their
pension entitlements amount to 92,000 euros for low and medium-level civil servants and al-
most 150,000 euros for high-level civil servants. In fact, this implies more than a doubling of
their respective standard net worth. For all other dependent employees, the present value of
pension entitlements is between 54,000 and 75,000 euros. Even the unemployed have accrued
52,000 euros on average. This indicates the importance of old-age provisions in stabilizing the
individual economic position, even in the case of (short-term) unemployment. With the most
recent German labor market reform of 2005, however, pension entitlements for long-term un-
employment were drastically reduced. Thus, old-age poverty will become more prevalent in
future cohorts of retirees, especially for individuals who suffered from long-term unemploy-
ment during their working career, since they generally do not have any relevant net worth. For
the self-employed, the respective figures vary on a somewhat lower level between 35,000 eu-
ros and 56,000 euros, given that they typically make their own provisions for retirement.
Thus, when using the extended wealth measure, the self-employed still hold the highest aver-
age wealth position, but civil servants significantly improve their position relative to the self-
employed.
These findings are supported by the age profiles of net worth and extended wealth shown in
Figure 6 separately for self-employed, civil servants, and those with a mandatory GRV insur-
ance. While the self-employed top the net worth hierarchy throughout their entire working
lives (20 to 65 years), the extraordinarily generous pension provisions for civil servants gives
them the lead in the extended wealth distribution even before the age of 60. Looking at the
22 As of January 1, 2007, the contribution to the GRV is 19.9 percent of the relevant labor earnings up to a ceil-
ing of 63,000 (54,600) euros in West (East) Germany, split equally between employee and employer.

21
majority of the working-age population insured under the statutory pension scheme (GRV), it
is clear that this group is far behind in both respects. First, members in the GRV have below-
average net worth throughout working life, and second, the benefit levels of the statutory
pension scheme and thus the pension entitlements are far below those received by civil ser-
vants.
Given the long period over which pension contributions are made, the elderly profit substan-
tially from taking pension entitlements into account in the wealth measure. At the same time,
one must consider that due to the mode of calculation, each additional year reduces the
present value of the remaining pension entitlements. Bearing this in mind, pensioners in the
GRV, who are 71 years old on average, are entitled to pension payments amounting to almost
130,000 euros (Table 2). Yet the favorable position of retired civil servants, who are some-
what younger on average, is even better. Their pension entitlements are worth more than
310,000 euros. Summing up net worth and pension entitlements for this group yields more
than 500,000 euros. Thus, retired civil servants have more extended wealth than self-
employed people with up to nine employees, who hold roughly 390,000 euros after adding
pension entitlements to the measure of net worth.
The pronounced difference between pensioners in the GRV and retired civil servants is due to
three main effects: first, civil servants tend to have a continuous employment history, without
any periods of unemployment that would have reduced the level of contributions to and bene-
fits from the public pension insurance. Second, civil servants tend to be better educated, thus
receiving ceteris paribus higher earnings. Third, and presumably most important, civil ser-
vants receive much higher benefits than people insured under the GRV scheme, given that a
civil servant’s pension is based on pensionable earnings received during the last years of em-
ployment and not, as in the case of those insured under the GRV rules, on social insurance
contributions made throughout working life.23
23 In addition, any company pensions that might accrue to employees subject to social insurance generally represent a voluntary benefit provided by the employer.

22
Figure 6: Net worth, present value of pension wealth entitlements and extended wealth by
age and occupational group, Germany 2007 – working age individuals (20-65 years old)
Source: SOEP 2007, with a discount rate of two percent, without provision for dependants.
010
020
030
040
050
060
070
080
0in
100
0 Eu
ro
20 30 40 50 60age in years
public pension entitlements net worthextended wealth
010
020
030
040
050
060
070
080
0in
100
0 Eu
ro
20 30 40 50 60age in years
public pension entitlements net worthextended wealth
010
020
030
040
050
060
070
080
0in
100
0 Eu
ro
20 30 40 50 60age in years
public pension entitlements net worthextended wealth
A) Members of the statu-tory pension scheme (GRV)
B) Self-employed
C) Civil servants

23
3.5 Inequality decomposition by occupational status
Focusing only on the population of employable age (20 to 65 years) and using occupational
status as the independent variable, Table 3 gives average wealth levels before (column B) and
after (column C) inclusion of public pension entitlements and the relative change (column D).
It is obvious that those who had already retired by the age of 65 (this includes former GRV
employees as well as former civil servants) “profit” considerably from widening the wealth
definition. Above and beyond owning a net worth of almost 90.000 euros, this group is en-
titled to more than 210,000 euros from public pensions, yielding an extended wealth measure
of 304,000 euros (an increase of about 240 percent).
Among those currently working, civil servants hold an above-average net worth of 113,000
euros. Their very generous public pension entitlements boost them to 240,000 euros in the ex-
tended wealth measure, an increase of more than 110 percent. While GRVemployees also
gain substantially, moving from 63,000 up to 123,000 euros (an increase of 50,000 euros or
94 percent of their net worth), their relative wealth position does not change significantly,
staying at just 84 percent of the overall average. Here, the self-employed have clearly lost
ground in relative terms: although they have 43,000 euros in public pension entitlements, their
relative wealth position has declined from 370 percent to “only” 220 percent of the overall
average. While unemployed persons—as expected—have very limited net worth (16,000 eu-
ros), they also have significant public pension entitlements, making them clearly much better
off in the analyses of extended wealth: in fact, this group shows an increase of about 340 per-
cent when considering pension entitlements.
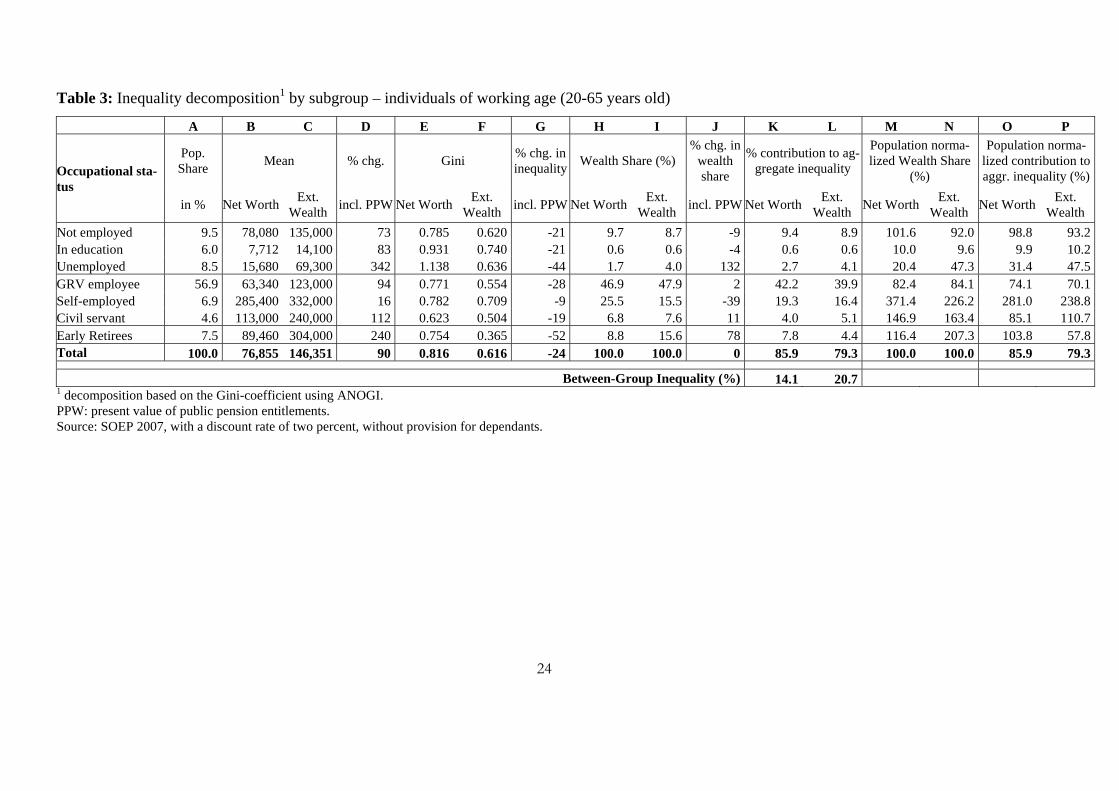
Wealth shares are also influenced substantially by the extension of the wealth definition: reti-
rees double their wealth holdings (up from 8.8 percent to 15.6 percent in columns H through
J), while the wealth share contributed by the self-employed drops from more than 25 percent
down to roughly 15 Percent.
24
Table 3: Inequality decomposition1 by subgroup – individuals of working age (20-65 years old)
A B C D E F G H I J K L M N O P
Occupational sta-tus
Pop. Share Mean % chg. Gini % chg. in
inequality Wealth Share (%) % chg. in
wealth share
% contribution to ag-gregate inequality
Population norma-lized Wealth Share
(%)
Population norma-lized contribution to aggr. inequality (%)
in % Net Worth Ext. Wealth incl. PPW Net Worth Ext.
Wealth incl. PPW Net Worth Ext. Wealth incl. PPW Net Worth Ext.
Wealth Net Worth Ext. Wealth Net Worth Ext.
Wealth Not employed 9.5 78,080 135,000 73 0.785 0.620 -21 9.7 8.7 -9 9.4 8.9 101.6 92.0 98.8 93.2 In education 6.0 7,712 14,100 83 0.931 0.740 -21 0.6 0.6 -4 0.6 0.6 10.0 9.6 9.9 10.2 Unemployed 8.5 15,680 69,300 342 1.138 0.636 -44 1.7 4.0 132 2.7 4.1 20.4 47.3 31.4 47.5 GRV employee 56.9 63,340 123,000 94 0.771 0.554 -28 46.9 47.9 2 42.2 39.9 82.4 84.1 74.1 70.1 Self-employed 6.9 285,400 332,000 16 0.782 0.709 -9 25.5 15.5 -39 19.3 16.4 371.4 226.2 281.0 238.8 Civil servant 4.6 113,000 240,000 112 0.623 0.504 -19 6.8 7.6 11 4.0 5.1 146.9 163.4 85.1 110.7 Early Retirees 7.5 89,460 304,000 240 0.754 0.365 -52 8.8 15.6 78 7.8 4.4 116.4 207.3 103.8 57.8 Total 100.0 76,855 146,351 90 0.816 0.616 -24 100.0 100.0 0 85.9 79.3 100.0 100.0 85.9 79.3
Between-Group Inequality (%) 14.1 20.7 1 decomposition based on the Gini-coefficient using ANOGI. PPW: present value of public pension entitlements. Source: SOEP 2007, with a discount rate of two percent, without provision for dependants.

All of this has the expected significant dampening impact on inequality: starting from a value
of 0.816 for net worth, the Gini coefficient for the population aged 20 to 65 years decreases
by about one quarter to “only” 0.616 when including public pension entitlements. Given the
group-specific variations described above, this goes hand in hand with massive changes in the
inequality decomposition by subgroup.24 In all groups, we see a pronounced reduction in in-
equality as shown in columns E thru G on the basis of the group-specific Gini coefficients.
Not surprisingly, this reduction is smallest among the self-employed (-9 percent) and very
strong among those already retired (-52 percent). In fact, between-group inequality goes up
from 14 percent to 21 percent (columns K and L). The group-specific contribution to overall
inequality has reached an above-average level for civil servants (columns O and P) while be-
ing considerably reduced for the self-employed and retirees.
3.6 The relevance of public pension entitlements for the middle class
The concept of a middle class has a long tradition in Germany, not only since the seminal
work of Schelsky (1965), who argued that after World War II, modern societies would tend to
be more mobile with more and more people from the lower (higher) income class moving up
(down) the social ladder. As a result, he predicted that the middle class would gain in impor-
tance (nivellierte Mittelstandsgesellschaft) and form the most important pillar of the social se-
curity system. Although this theory has been widely criticized, today’s middle income classes
bear a large portion of the financial burden of the welfare systems in many countries world-
wide. Due to the statutory nature of the pension scheme, a significant share of wealth is tied to
pension entitlements, in particular for the middle class.
Yet there is still no commonly agreed definition of the middle class distinguishing it from
lower and upper classes. In the socio-political discussions surrounding the emergence of
“new poverty” in the 1980s, concerns were expressed that Germany was becoming a “two-
thirds society,” with one-third of the population locked into poverty or near the poverty line
(see e.g. Headey et al. 1994) and the upper two-thirds living in (relative) affluence. Further-
more, there is not even consensus on how to define “high” incomes. In the following, we
24 We run Gini decomposition as suggested by Lerman and Yitzhaki (1985) using the Stata routine ANOGI, provided by Jann (2006). Typically such decomposition analyses are based on Generalized Entropy Measures such as the Mean Log Deviation (MLD). This was not possible for the analysis at hand, as net worth can take on negative values.

26
simply define a person’s income position relative to the national median. The middle class
consists of individuals with a needs-adjusted or equivalized annual post-government income
between 70 percent and 150 percent of the median.25 In 2007, this middle class makes up
about 60 percent.
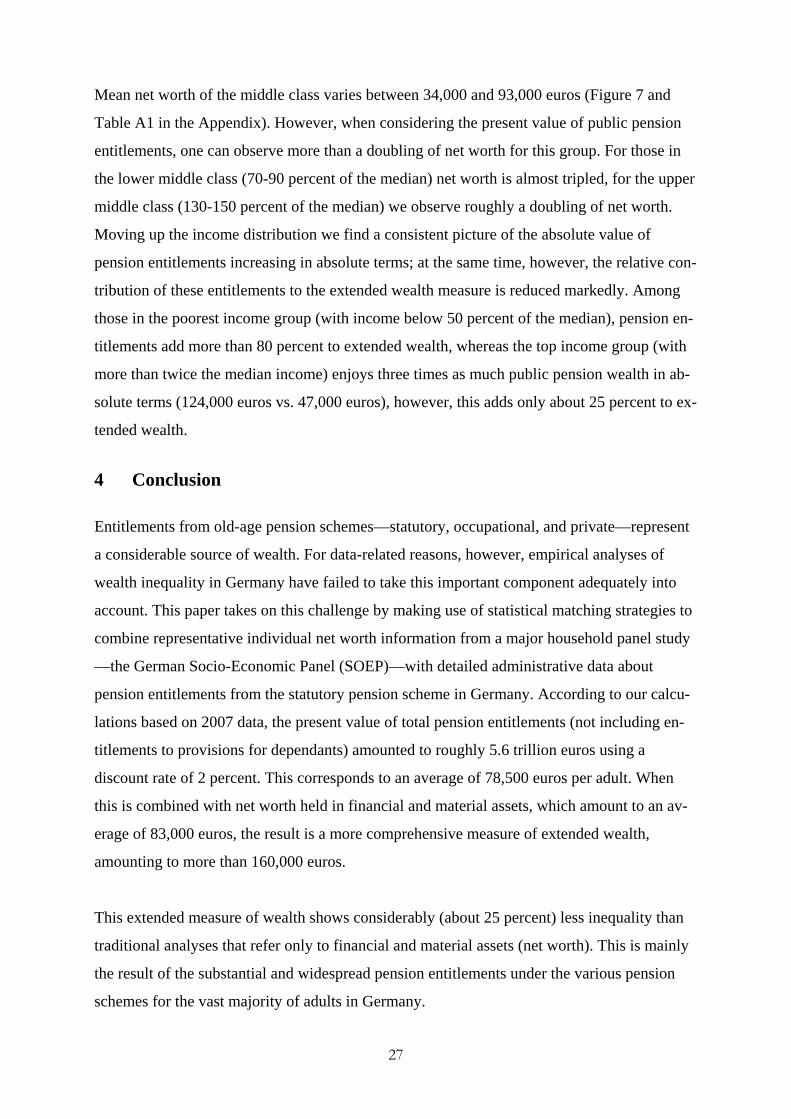
Figure 7: Absolute and relative impact of public pension wealth by income group
Source: SOEP 2007, with a discount rate of two percent, without provision for dependants.
25 This equals to about 1,100 and 2,300 euros per month for a one-person household in Germany in 2008. For a detailed development of the middle income class in Germany, see Grabka and Frick (2008). The modified OECD equivalence scale has been applied.
10.70119.840
34.37255.046 71.466
92.697 129.635
343.516
46.84956.752
64.14073.807 82.934
87.904 104.945
123.587
0%
20%
40%
60%
80%
100%
up to 50 50-<70 70-<90 90-<110 110-<130 130-<150 150-<200 >= 200
Mean Public PensionMean Net Worth
55.046 71.466 92.697129.635
343.516
19.84010.701 34.372
46.84956.752
64.14073.807
82.93487.904
104.945
123.587
0
50.000
100.000
150.000
200.000
250.000
300.000
350.000
400.000
450.000
500.000
up to 50 50-<70 70-<90 90-<110 110-<130 130-<150 150-<200 >= 200
Relative Income Position (in % of Median)
Mean Public PensionMean Net Worth
27
Mean net worth of the middle class varies between 34,000 and 93,000 euros (Figure 7 and
Table A1 in the Appendix). However, when considering the present value of public pension
entitlements, one can observe more than a doubling of net worth for this group. For those in
the lower middle class (70-90 percent of the median) net worth is almost tripled, for the upper
middle class (130-150 percent of the median) we observe roughly a doubling of net worth.
Moving up the income distribution we find a consistent picture of the absolute value of
pension entitlements increasing in absolute terms; at the same time, however, the relative con-
tribution of these entitlements to the extended wealth measure is reduced markedly. Among
those in the poorest income group (with income below 50 percent of the median), pension en-
titlements add more than 80 percent to extended wealth, whereas the top income group (with
more than twice the median income) enjoys three times as much public pension wealth in ab-
solute terms (124,000 euros vs. 47,000 euros), however, this adds only about 25 percent to ex-
tended wealth.
4 Conclusion
Entitlements from old-age pension schemes—statutory, occupational, and private—represent
a considerable source of wealth. For data-related reasons, however, empirical analyses of
wealth inequality in Germany have failed to take this important component adequately into
account. This paper takes on this challenge by making use of statistical matching strategies to
combine representative individual net worth information from a major household panel study
—the German Socio-Economic Panel (SOEP)—with detailed administrative data about
pension entitlements from the statutory pension scheme in Germany. According to our calcu-
lations based on 2007 data, the present value of total pension entitlements (not including en-
titlements to provisions for dependants) amounted to roughly 5.6 trillion euros using a
discount rate of 2 percent. This corresponds to an average of 78,500 euros per adult. When
this is combined with net worth held in financial and material assets, which amount to an av-
erage of 83,000 euros, the result is a more comprehensive measure of extended wealth,
amounting to more than 160,000 euros.
This extended measure of wealth shows considerably (about 25 percent) less inequality than
traditional analyses that refer only to financial and material assets (net worth). This is mainly
the result of the substantial and widespread pension entitlements under the various pension
schemes for the vast majority of adults in Germany.

28
There are marked differences in levels of pension entitlements across occupational groups.
While civil servants have the highest entitlements, self-employed people, who typically make
their own provisions for old age, have below-average public pension entitlements. Such dif-
ferences are not specific to Germany but are likely to exist in other countries as well. The
strong variation in relevance and magnitude of publicly provided pension insurance across
welfare regimes should be carefully considered when conducting comparative wealth analys-
es, such as those based on the Luxembourg Wealth Study (LWS, see Sierminska et al. 2006).
In other words, every effort should be made to take the present value of any pension entitle-
ments into account in comparative analysis of wealth data.
Future research in this area should address appropriate means of determining the present val-
ue of pension entitlements. Based on the findings presented here, it appears necessary to in-
vest more effort in defining the discount rate, in determining future pension adjustments, and
in addressing the problem of selectivity in mortality rates, since high income earners typically
live longer than low income earners (see Himmelreicher et al. 2008). This should be accom-
panied by a discussion about the necessity to consider liabilities to pension schemes. In a pay-
as-you-go pension system, there is already an implicit liability with birth, which levels off un-
til middle age, when the entitlements accrued so far are higher than the present value of the
future contributions. Adequately dealing with this phenomenon would also mean taking lia-
bilities outside the private household sector into consideration, since employers and the state
both have make considerable contributions to overall pension expenditures.
Summing up, this paper gives clear evidence that neglecting public pension entitlements in
wealth analyses yields massive biases with respect to the level and the degree of inequality in
the distribution of wealth, as well as with respect to differences across socio-economic
groups. While data on net worth can be collected successfully in population surveys, respon-
dents’ information on pension entitlements appears incomplete at best. This shortcoming can
be overcome best by employing the social security number (or similar information), with the
individual’s informed consent, to link the microdata at hand with the relevant administrative
data. But since this may significantly reduce the respondents’ willingness to participate (fur-
ther) in (panel) surveys—most likely in a selective way—, the statistical matching approach
presented here may be seen as a successful second-best solution.

29
5 References
Börsch-Supan, A. (2001): Das Sparverhalten verstehen. Berlin-Brandenburgische Akademie der Wissenschaften. Akademie Verlag. Berichte und Abhandlungen Band 8. (www.boersch-supan.de/axel/Sparverhalten.pdf
Bonin, H. (2009): 15 Years of Pension Reform in Germany: Old Success and New Threats. The Geneva Papers, 34, pp. 548-60.
Bundesministerium für Arbeit und Soziales (2008): Ergänzender Bericht der Bundesregierung zum Rentenversicherungsbericht 2008 gemäß §154 Abs. 2 SGB VI. http://www.bmas.de/portal/29492/property=pdf/2008__11__19__alterssicherungsbericht__2008.pdf
Frick, J. R.; Grabka, M. M. and Marcus, J. (2007): Editing and Multiple Imputation of Item-Non-Response in the 2002 Wealth Module of the German Socio-Economic Panel (SOEP), Berlin: Deutsches Institut für Wirtschaftsforschung (DIW).
Frick, J. R. and Grabka, M. M. (2009): Wealth Inequality on the Rise in Germany. DIW Berlin Week-ly Report, 5(10), pp. 62-73.
Frick, J. R. and Headey, B. (2009): Living Standards in Retirement: Accepted International Compari-sons are Misleading. Schmoller's Jahrbuch - Journal of Applied Social Science Studies, 129(2), pp. 309-19.
Frick, J. R. and Grabka, M. M. (2010): Old-Age Pension Entitlements Mitigate Inequality - But Con-centration of Wealth Remains High. DIW Berlin Weekly Report, 6(8), pp. 55-64.
Grabka, M. M. and Frick, J, (2008): The Shrinking German Middle Class—Signs of Long-Term Pola-rization in Disposable Income?. DIW Berlin Weekly Report 4/2008, 21-27.
Gruber, J. and Wise, D. A. eds. (1999): Social Security and Retirement Around the World. Chicago: Chicago University Press.
Headay, B., Krause, P. and Habich, R. (1994): Long and short term poverty: Is Germany a two-thirds society?, Social Indicators Research, 31(1): 1-25.
Himmelreicher, R.K., Sewöster Rembrandt, D. and Schulz, A. (2008): Die fernere Lebenserwartung von Rentnern und Pensionären im Vergleich. WSI Mitteilungen 5, pp. 274-280
Jann, B. (2006): ANOGI: Stata module to generate Analysis of Gini. Statistical Software Components S456730, Boston College Department of Economics.
Kantor, D. (2006) MAHAPICK: Stata module to select matching observations based on a Mahalano-bis distance measure," Statistical Software Components S456703, Boston College Department of Economics, April .
Lerman, R. I. and Yitzhaki, S. (1985): Income Inequality Effects by Income Source: A New Approach and Applications to the United States. The Review of Economics and Statistics, 67(1), pp. 151-156.
Modigliani, F. (1988): The Role of Intergenerational Transfers and Life Cycle Saving in the Accumu-lation of Wealth. The Journal of Economic Perspectives 2, 15-40
Rasner, A.; Frick, J.R. and Grabka, M.M. (2010): Extending the Empirical Basis for Wealth Inequality Research Using Statistical Matching of Administrative and Survey Data. Paper prepared for the IARIW conference 2010, St.Gallen Switzerland.
Schelsky, H. (1965): Auf der Suche nach Wirklichkeit. Gesammelte Aufsätze. Düsseldorf-Köln: Diederichs.
Sierminska, E., Brandolini, A., and Smeeding, T. (2006): The Luxembourg Wealth Study - A cross-country comparable database for household wealth research. Journal of Economic Inequality, 4(3): 375-383.
Wagner, G. G.; Frick, J. R. and Schupp, J. (2007): The German Socio-Economic Panel Study (SOEP) - Scope, Evolution and Enhancements. Schmollers Jahrbuch - Journal of Applied Social Science Studies, 127(1), pp. 139-69.

30
Appendix:
Table A1: Net worth and extended wealth by income groups.
Mean Median
Relative Income Position (in % me-dian*)
Net Worth PPW
Ext. Wealth
Net Worth PPW
Ext. Wealth
Popula-tion Share
(%) Women's share (%)
Age (Me-dian)
up to 50 10,701 46,849 57,550 0 23,842 28,715 7.8 55 44
50-<70 19,840 56,752 76,592 0 29,684 39,310 12.3 57 46
70-<90 34,372 64,140 98,512 4,954 37,767 63,403 18.4 55 47
90-<110 55,046 73,807 128,853 15,000 49,338 95,274 17.7 53 47
110-<130 71,466 82,934 154,399 27,761 54,830 117,637 13.1 48 48
130-<150 92,697 87,904 180,601 37,360 55,186 124,995 9.9 48 48
150-<200 129,635 104,945 234,580 75,913 59,865 176,081 12.2 48 50
>= 200 343,516 123,587 467,103 156,175 68,144 278,811 8.5 46 52
Shaded cells indicate the middle income class in Germany * Median Equivalent Post-Government Income (based on the total population) using modified OECD-Scale. Source: SOEP 2007