Weakness in Non-Commodity Exports: Demand versus Supply Factors · 2018-08-27 · These patterns...
12
Bank of Canada staff analytical notes are short articles that focus on topical issues relevant to the current economic and financial context, produced independently from the Bank’s Governing Council. This work may support or challenge prevailing policy orthodoxy. Therefore, the views expressed in this note are solely those of the authors and may differ from official Bank of Canada views. No responsibility for them should be attributed to the Bank. www.bank-banque-canada.ca Staff Analytical Note/Note analytique du personnel 2018-28 Weakness in Non-Commodity Exports: Demand versus Supply Factors by José Dorich, 1 Vadym Lepetyuk 2 and Jonathan Swarbrick 3 Canadian Economic Analysis Department Bank of Canada Ottawa, Ontario, Canada K1A 0G9 1 [email protected], 2 [email protected], 3 [email protected]
Transcript of Weakness in Non-Commodity Exports: Demand versus Supply Factors · 2018-08-27 · These patterns...
Bank of Canada staff analytical notes are short articles that focus on topical issues relevant to the current economic and financial context, produced independently from the Bank’s Governing Council. This work may support or challenge prevailing policy orthodoxy. Therefore, the views expressed in this note are solely those of the authors and may differ from official Bank of Canada views. No responsibility for them should be attributed to the Bank.
www.bank-banque-canada.ca
Staff Analytical Note/Note analytique du personnel 2018-28
Weakness in Non-Commodity Exports: Demand versus Supply Factors
by José Dorich,1 Vadym Lepetyuk2 and Jonathan Swarbrick3
Canadian Economic Analysis Department Bank of Canada Ottawa, Ontario, Canada K1A 0G9 [email protected], [email protected], [email protected]

ISSN 2369-9639 © 2018 Bank of Canada
Acknowledgements
The authors are grateful to André Binette, Russell Barnett, Thomas Carter, Jing Yang and Eric Santor for helpful comments and suggestions. All remaining errors are our own.
ii
Abstract
We use the Terms-of-Trade Economic Model (ToTEM) to conduct demand- and supply-driven simulations, both of which deliver weakness in Canadian non-commodity exports relative to foreign activity in line with recent data. We then compare the predictions of the simulations with observed outcomes to shed light on the source of weakness in non-commodity exports. Our results suggest that demand factors, such as competitiveness challenges, likely play a dominant role in explaining the recent weakness in non-commodity exports. The simulations also reveal that a monetary policy response is required, independent of the source of the weakness in non-commodity exports.
Bank topics: International topics; Recent economic and financial developments; Trade integration; Monetary policy JEL codes: F10, F14, F17, E52
Résumé
Nous utilisons le modèle TOTEM (Terms of Trade Economic Model) pour effectuer des simulations basées sur l’offre et la demande. Dans les deux cas, les simulations font état de faibles exportations canadiennes hors produits de base par rapport à l’activité étrangère, ce qui cadre avec les données récentes. Nous comparons ensuite les prévisions issues des simulations aux observations pour mettre en lumière la source de cette faiblesse. D’après nos résultats, cette récente faiblesse serait surtout imputable aux facteurs de demande, comme les défis sur le plan de la compétitivité. Par ailleurs, les simulations révèlent la nécessité d’une réponse de la politique monétaire, peu importe la source de la faiblesse des exportations hors produits de base.
Sujets : Questions internationales; Évolution économique et financière récente; Intégration des échanges; Politique monétaire
Codes JEL : F10, F14, F17, E52
1
1. Introduction
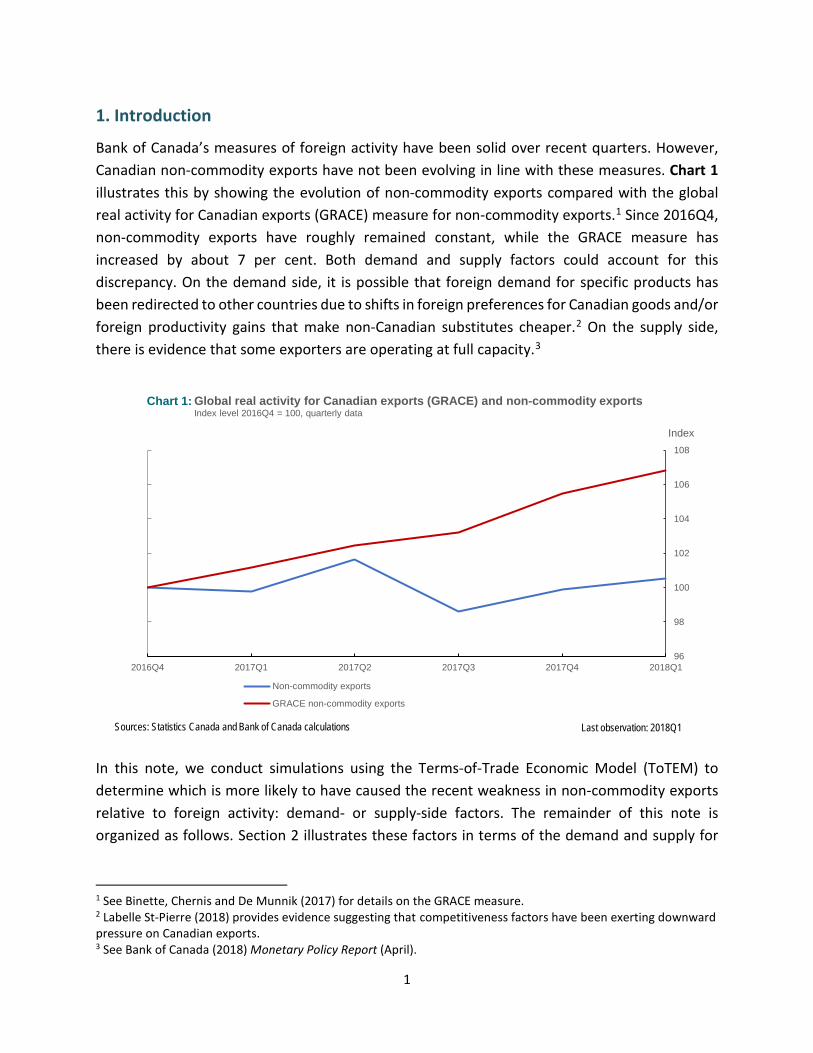
Bank of Canada’s measures of foreign activity have been solid over recent quarters. However, Canadian non-commodity exports have not been evolving in line with these measures. Chart 1 illustrates this by showing the evolution of non-commodity exports compared with the global real activity for Canadian exports (GRACE) measure for non-commodity exports.1 Since 2016Q4, non-commodity exports have roughly remained constant, while the GRACE measure has increased by about 7 per cent. Both demand and supply factors could account for this discrepancy. On the demand side, it is possible that foreign demand for specific products has been redirected to other countries due to shifts in foreign preferences for Canadian goods and/or foreign productivity gains that make non-Canadian substitutes cheaper.2 On the supply side, there is evidence that some exporters are operating at full capacity.3
In this note, we conduct simulations using the Terms-of-Trade Economic Model (ToTEM) to determine which is more likely to have caused the recent weakness in non-commodity exports relative to foreign activity: demand- or supply-side factors. The remainder of this note is organized as follows. Section 2 illustrates these factors in terms of the demand and supply for
1 See Binette, Chernis and De Munnik (2017) for details on the GRACE measure. 2 Labelle St-Pierre (2018) provides evidence suggesting that competitiveness factors have been exerting downward pressure on Canadian exports. 3 See Bank of Canada (2018) Monetary Policy Report (April).
96
98
100
102
104
106
108
2016Q4 2017Q1 2017Q2 2017Q3 2017Q4 2018Q1
Index
Global real activity for Canadian exports (GRACE) and non-commodity exportsIndex level 2016Q4 = 100, quarterly data
Non-commodity exports
GRACE non-commodity exports
Sources: Statistics Canada and Bank of Canada calculations Last observation: 2018Q1
Chart 1:
2
Canadian non-commodity exports and explains how we capture these factors in ToTEM. Section 3 briefly explains the simulations and presents the results. Section 4 concludes.
2. Demand and supply of Canadian non-commodity exports
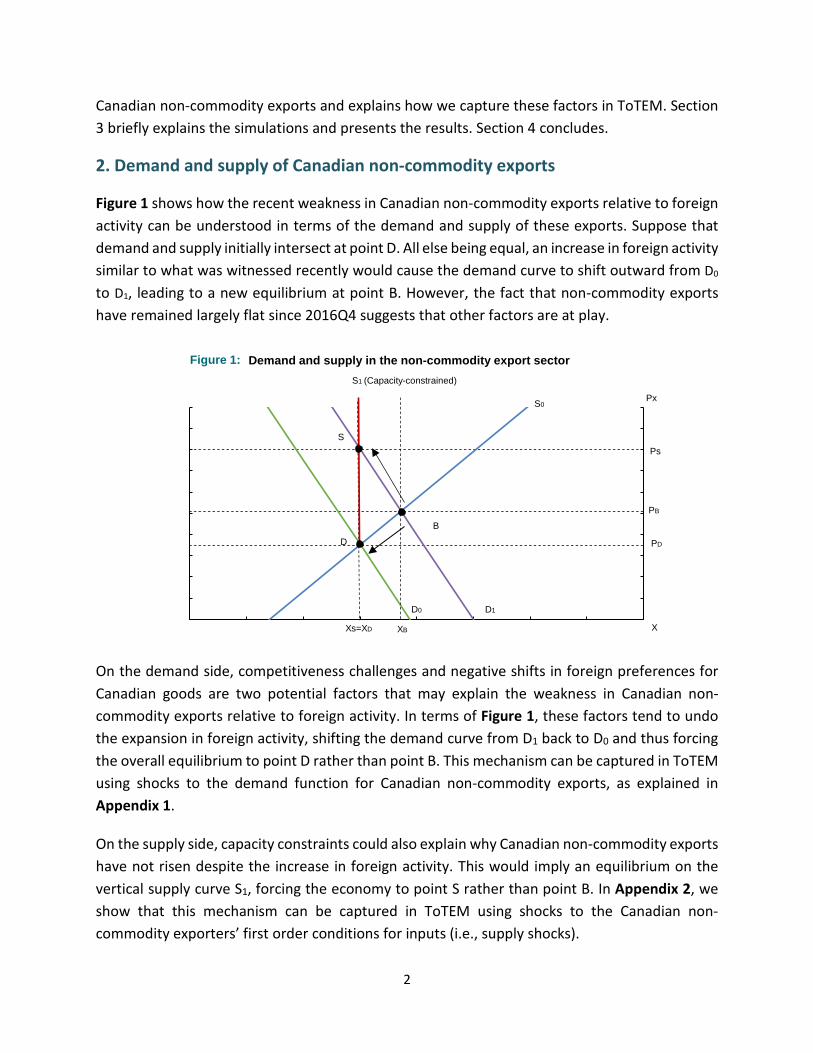
Figure 1 shows how the recent weakness in Canadian non-commodity exports relative to foreign activity can be understood in terms of the demand and supply of these exports. Suppose that demand and supply initially intersect at point D. All else being equal, an increase in foreign activity similar to what was witnessed recently would cause the demand curve to shift outward from D0 to D1, leading to a new equilibrium at point B. However, the fact that non-commodity exports have remained largely flat since 2016Q4 suggests that other factors are at play.
On the demand side, competitiveness challenges and negative shifts in foreign preferences for Canadian goods are two potential factors that may explain the weakness in Canadian non-commodity exports relative to foreign activity. In terms of Figure 1, these factors tend to undo the expansion in foreign activity, shifting the demand curve from D1 back to D0 and thus forcing the overall equilibrium to point D rather than point B. This mechanism can be captured in ToTEM using shocks to the demand function for Canadian non-commodity exports, as explained in Appendix 1.
On the supply side, capacity constraints could also explain why Canadian non-commodity exports have not risen despite the increase in foreign activity. This would imply an equilibrium on the vertical supply curve S1, forcing the economy to point S rather than point B. In Appendix 2, we show that this mechanism can be captured in ToTEM using shocks to the Canadian non-commodity exporters’ first order conditions for inputs (i.e., supply shocks).
D0
S0
Xs=XD
PD
Px
D
X
BPB
XB
D1
PsS
S1 (Capacity-constrained)
Figure 1: Demand and supply in the non-commodity export sector

3
3. Simulations and results
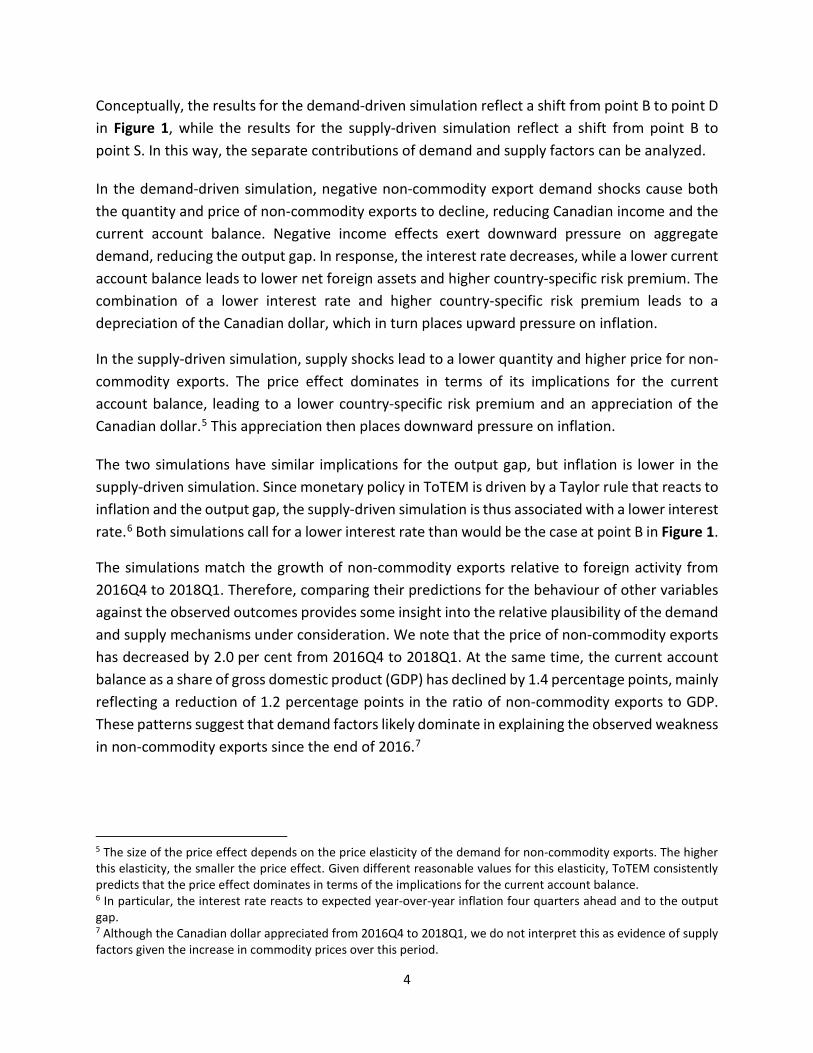
We use ToTEM to conduct two simulations: demand-driven and supply-driven.4 In the demand-driven simulation, negative shocks to the demand for Canadian non-commodity exports are calibrated to reproduce the weakness in non-commodity exports relative to foreign activity observed from 2016Q4 to 2018Q1. The supply-driven simulation also aims to match this weakness, but does so using supply shocks. In both simulations, the relevant shocks are assumed to dissipate from 2018Q2 onward, with a moderate degree of persistence. Figure 2 illustrates the evolution of key macroeconomic variables under these two simulations.
4 A brief description of the changes introduced to ToTEM in 2017 can be found in the appendix to the Bank of Canada Monetary Policy Report (October 2017).
-0.5
-0.4
-0.3
-0.2
-0.1
0.0
0.1
2 4 6 8 10 12 14 16 18
%
quarters
a. Output gap
-2
-1
0
1
2
3
4
2 4 6 8 10 12 14 16 18
Percentage points
quarters
b. Current account balance (per cent of GDP)
-2
-1
0
1
2
2 4 6 8 10 12 14 16 18
%
quarters
Demand-driven simulation
c. Nominal exchange rate(Foreign currency/Canadian dollar)
-0.12
-0.10
-0.08
-0.06
-0.04
-0.02
0.00
0.02
0.04
2 4 6 8 10 12 14 16 18
Percentagepoints
quarters
Supply-driven simulation
d. Core inflation (year-over-year)
Figure 2: Evolution of key macroeconomic variables
4
Conceptually, the results for the demand-driven simulation reflect a shift from point B to point D in Figure 1, while the results for the supply-driven simulation reflect a shift from point B to point S. In this way, the separate contributions of demand and supply factors can be analyzed.
In the demand-driven simulation, negative non-commodity export demand shocks cause both the quantity and price of non-commodity exports to decline, reducing Canadian income and the current account balance. Negative income effects exert downward pressure on aggregate demand, reducing the output gap. In response, the interest rate decreases, while a lower current account balance leads to lower net foreign assets and higher country-specific risk premium. The combination of a lower interest rate and higher country-specific risk premium leads to a depreciation of the Canadian dollar, which in turn places upward pressure on inflation.
In the supply-driven simulation, supply shocks lead to a lower quantity and higher price for non-commodity exports. The price effect dominates in terms of its implications for the current account balance, leading to a lower country-specific risk premium and an appreciation of the Canadian dollar.5 This appreciation then places downward pressure on inflation.
The two simulations have similar implications for the output gap, but inflation is lower in the supply-driven simulation. Since monetary policy in ToTEM is driven by a Taylor rule that reacts to inflation and the output gap, the supply-driven simulation is thus associated with a lower interest rate.6 Both simulations call for a lower interest rate than would be the case at point B in Figure 1.
The simulations match the growth of non-commodity exports relative to foreign activity from 2016Q4 to 2018Q1. Therefore, comparing their predictions for the behaviour of other variables against the observed outcomes provides some insight into the relative plausibility of the demand and supply mechanisms under consideration. We note that the price of non-commodity exports has decreased by 2.0 per cent from 2016Q4 to 2018Q1. At the same time, the current account balance as a share of gross domestic product (GDP) has declined by 1.4 percentage points, mainly reflecting a reduction of 1.2 percentage points in the ratio of non-commodity exports to GDP. These patterns suggest that demand factors likely dominate in explaining the observed weakness in non-commodity exports since the end of 2016.7
5 The size of the price effect depends on the price elasticity of the demand for non-commodity exports. The higher this elasticity, the smaller the price effect. Given different reasonable values for this elasticity, ToTEM consistently predicts that the price effect dominates in terms of the implications for the current account balance. 6 In particular, the interest rate reacts to expected year-over-year inflation four quarters ahead and to the output gap. 7 Although the Canadian dollar appreciated from 2016Q4 to 2018Q1, we do not interpret this as evidence of supply factors given the increase in commodity prices over this period.
5
4. Concluding remarks
The relative importance of demand and supply factors in explaining recent weakness in Canadian non-commodity exports relative to foreign activity has important macroeconomic implications. If demand factors dominate, weakness in Canadian non-commodity exports relative to foreign activity should, all else being equal, be associated with a lower current account, weaker Canadian dollar and higher inflation. In contrast, if supply factors dominate, we should expect a higher current account balance, stronger Canadian dollar and lower inflation. Compared with the evolution of recent data, our simulation results suggest that demand factors likely play a dominant role in explaining the weakness in non-commodity exports.
In terms of avenues for future work, we note that ToTEM assumes that non-commodity exporters sell only in international markets. A potential extension could allow for the more realistic possibility that these firms service both domestic and foreign markets. In this case, capacity constraints on these firms would lead to domestic inflationary pressures that could offset the lower inflation that emerges under our supply-driven scenario.

6
References
Bank of Canada. 2017. Monetary Policy Report (October).
———. 2018. Monetary Policy Report (April).
Binette, A., T. Chernis and D. de Munnik. 2017. “Global Real Activity for Canadian Exports: GRACE.” Bank of Canada Staff Discussion Paper No. 2017-2.
Labelle St-Pierre, N. 2018. “Decomposing Canada’s Market Shares: An Update.” Bank of Canada Staff Analytical Note No. 2018-26.
7
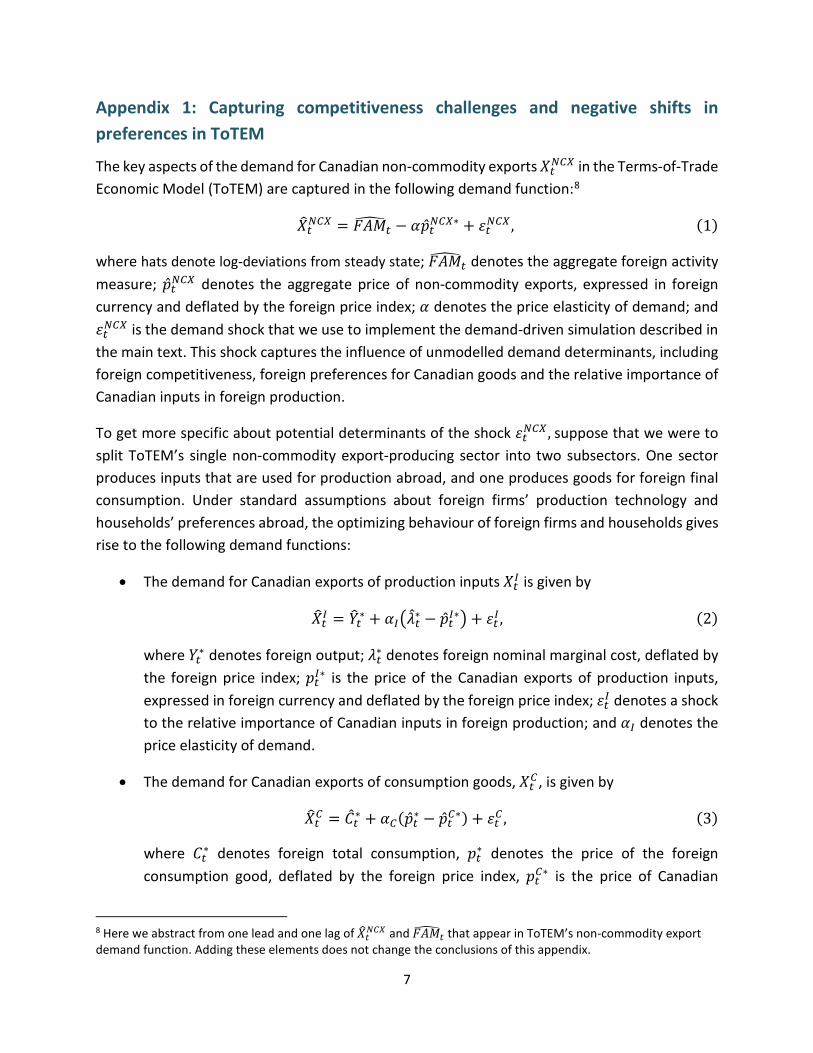
Appendix 1: Capturing competitiveness challenges and negative shifts in preferences in ToTEM
The key aspects of the demand for Canadian non-commodity exports 𝑋𝑋𝑡𝑡𝑁𝑁𝑁𝑁𝑁𝑁 in the Terms-of-Trade Economic Model (ToTEM) are captured in the following demand function:8
𝑋𝑋�𝑡𝑡𝑁𝑁𝑁𝑁𝑁𝑁 = 𝐹𝐹𝐹𝐹𝐹𝐹�𝑡𝑡 − 𝛼𝛼�̂�𝑝𝑡𝑡𝑁𝑁𝑁𝑁𝑁𝑁∗ + 𝜀𝜀𝑡𝑡𝑁𝑁𝑁𝑁𝑁𝑁, (1)
where hats denote log-deviations from steady state; 𝐹𝐹𝐹𝐹𝐹𝐹�𝑡𝑡 denotes the aggregate foreign activity measure; �̂�𝑝𝑡𝑡𝑁𝑁𝑁𝑁𝑁𝑁 denotes the aggregate price of non-commodity exports, expressed in foreign currency and deflated by the foreign price index; 𝛼𝛼 denotes the price elasticity of demand; and 𝜀𝜀𝑡𝑡𝑁𝑁𝑁𝑁𝑁𝑁 is the demand shock that we use to implement the demand-driven simulation described in the main text. This shock captures the influence of unmodelled demand determinants, including foreign competitiveness, foreign preferences for Canadian goods and the relative importance of Canadian inputs in foreign production.
To get more specific about potential determinants of the shock 𝜀𝜀𝑡𝑡𝑁𝑁𝑁𝑁𝑁𝑁, suppose that we were to split ToTEM’s single non-commodity export-producing sector into two subsectors. One sector produces inputs that are used for production abroad, and one produces goods for foreign final consumption. Under standard assumptions about foreign firms’ production technology and households’ preferences abroad, the optimizing behaviour of foreign firms and households gives rise to the following demand functions:
• The demand for Canadian exports of production inputs 𝑋𝑋𝑡𝑡𝐼𝐼 is given by
𝑋𝑋�𝑡𝑡𝐼𝐼 = 𝑌𝑌�𝑡𝑡∗ + 𝛼𝛼𝐼𝐼��̂�𝜆𝑡𝑡∗ − �̂�𝑝𝑡𝑡𝐼𝐼∗� + 𝜀𝜀𝑡𝑡𝐼𝐼 , (2)
where 𝑌𝑌𝑡𝑡∗ denotes foreign output; 𝜆𝜆𝑡𝑡∗ denotes foreign nominal marginal cost, deflated by the foreign price index; 𝑝𝑝𝑡𝑡𝐼𝐼∗ is the price of the Canadian exports of production inputs, expressed in foreign currency and deflated by the foreign price index; 𝜀𝜀𝑡𝑡𝐼𝐼 denotes a shock to the relative importance of Canadian inputs in foreign production; and 𝛼𝛼𝐼𝐼 denotes the price elasticity of demand.
• The demand for Canadian exports of consumption goods, 𝑋𝑋𝑡𝑡𝑁𝑁 , is given by
𝑋𝑋�𝑡𝑡𝑁𝑁 = �̂�𝐶𝑡𝑡∗ + 𝛼𝛼𝑁𝑁(�̂�𝑝𝑡𝑡∗ − �̂�𝑝𝑡𝑡𝑁𝑁∗) + 𝜀𝜀𝑡𝑡𝑁𝑁 , (3)
where 𝐶𝐶𝑡𝑡∗ denotes foreign total consumption, 𝑝𝑝𝑡𝑡∗ denotes the price of the foreign consumption good, deflated by the foreign price index, 𝑝𝑝𝑡𝑡𝑁𝑁∗ is the price of Canadian
8 Here we abstract from one lead and one lag of 𝑋𝑋�𝑡𝑡𝑁𝑁𝑁𝑁𝑁𝑁 and 𝐹𝐹𝐹𝐹𝐹𝐹�𝑡𝑡 that appear in ToTEM’s non-commodity export demand function. Adding these elements does not change the conclusions of this appendix.
8
exports of consumption goods, expressed in foreign currency and deflated by the foreign price index; and 𝜀𝜀𝑡𝑡𝑁𝑁 denotes a shock to foreign preferences for Canadian consumption goods.
Under a simplifying assumption that 𝛼𝛼𝐼𝐼 = 𝛼𝛼𝑁𝑁 = 𝛼𝛼, aggregate non-commodity export demand is given by
𝑋𝑋�𝑡𝑡𝑁𝑁𝑁𝑁𝑁𝑁 = 𝐹𝐹𝐹𝐹𝐹𝐹�𝑡𝑡 − 𝛼𝛼�̂�𝑝𝑡𝑡𝑁𝑁𝑁𝑁𝑁𝑁∗ + 𝛼𝛼�𝜃𝜃(�̂�𝜆𝑡𝑡∗ + 𝜀𝜀𝑡𝑡𝐼𝐼) + (1 − 𝜃𝜃)(�̂�𝑝𝑡𝑡∗ + 𝜀𝜀𝑡𝑡𝑁𝑁)�, (4)
where 𝑋𝑋�𝑡𝑡𝑁𝑁𝑁𝑁𝑁𝑁 denotes total non-commodity exports; 𝐹𝐹𝐹𝐹𝐹𝐹�𝑡𝑡 denotes the aggregate foreign activity measure; �̂�𝑝𝑡𝑡𝑁𝑁𝑁𝑁𝑁𝑁 denotes the aggregate price of non-commodity exports, expressed in foreign currency and deflated by the foreign price index; and 𝜃𝜃 is the weight on exports of production inputs in total non-commodity exports. Comparing equation (4) with equation (1) allows us to identify some of the determinants of the demand shock 𝜀𝜀𝑡𝑡𝑁𝑁𝑁𝑁𝑁𝑁, namely foreign competitiveness (�̂�𝜆𝑡𝑡∗, �̂�𝑝𝑡𝑡∗), foreign preferences for Canadian goods (𝜀𝜀𝑡𝑡𝑁𝑁) and the relative importance of Canadian inputs in foreign production (𝜀𝜀𝑡𝑡𝐼𝐼).

9
Appendix 2: Capturing capacity constraints in ToTEM
In the absence of capacity constraints, Figure 1 shows that a rise in foreign activity, all else being equal, implies a shift in the equilibrium from point D to point B. Accounting for capacity constraints implies that the equilibrium moves from point B to point S. In this appendix, we explain how shocks to the non-commodity exporters’ first order conditions for inputs in the Terms-of-Trade Economic Model (ToTEM) drive the movement from point B to point S in the supply-driven simulation.
In the supply-driven simulation, supply shocks reduce non-commodity exporters’ inputs, so that the increase in the quantity of non-commodity exports due to higher foreign activity is undone. To illustrate how these shocks work, we present the first order condition for capital. Abstracting from capital adjustment costs, this optimality condition is given by
𝑞𝑞�𝑡𝑡𝑁𝑁𝑁𝑁𝑁𝑁 = 11+�̅�𝑟
𝐸𝐸𝑡𝑡 �(�̅�𝑟 + 𝛿𝛿)�𝑚𝑚𝑚𝑚�𝑡𝑡𝑁𝑁𝑁𝑁𝑁𝑁 + 𝐹𝐹𝑀𝑀𝑀𝑀�𝑡𝑡+1
𝑁𝑁𝑁𝑁𝑁𝑁� + (1 − 𝛿𝛿)𝑞𝑞�𝑡𝑡+1𝑁𝑁𝑁𝑁𝑁𝑁 − �̂�𝑟𝑡𝑡� + 𝜀𝜀𝑘𝑘,𝑡𝑡, (5)
where 𝑞𝑞𝑡𝑡𝑁𝑁𝑁𝑁𝑁𝑁 is the nominal shadow value of capital in the non-commodity export sector, deflated by the domestic consumption good price index; 𝑚𝑚𝑚𝑚𝑡𝑡𝑁𝑁𝑁𝑁𝑁𝑁 is the nominal marginal cost of non-commodity export firms deflated by the consumption good price index; 𝐹𝐹𝑀𝑀𝑀𝑀𝑡𝑡𝑁𝑁𝑁𝑁𝑁𝑁 is the marginal product of capital in the non-commodity export sector; 𝑟𝑟𝑡𝑡 is the ex ante real interest rate; �̅�𝑟 is the steady state real interest rate; 𝛿𝛿 is the depreciation rate; and 𝜀𝜀𝑘𝑘,𝑡𝑡 is the shock to the first order condition. In the absence of this shock, a rise in foreign activity implies higher capital and, consequently, higher exports. However, we find a value for 𝜀𝜀𝑘𝑘,𝑡𝑡 that offsets this effect, reducing capital back to the level that would be obtained without the rise in foreign activity. We impose analogous shocks on the optimality conditions for all other factors of production in the non-commodity export sector, thus preventing this sector from expanding in response to higher foreign activity and forcing the economy to point S in Figure 1.