Weaker land–climate feedbacks from nutrient uptake during ...
51
Weaker land–climate feedbacks from nutrient uptake during photosynthesis inactive periods William J. Riley Qing Zhu, Jinyun Tang Lawrence Berkeley National Laboratory
Transcript of Weaker land–climate feedbacks from nutrient uptake during ...

Weaker land–climate feedbacks from nutrient uptake during
photosynthesis inactive periods
William J. RileyQing Zhu, Jinyun Tang
Lawrence Berkeley National Laboratory

Overview• Background
– Global-scale land C cycle and nutrient constraints– Plant and microbial dynamics and nutrient competition– Observations of Photosynthesis Inactive Period (PIP) plant
nutrient uptake• Modeling approaches and concepts
– CMIP-class models and Relative Demand approach– Enzyme mediated reactions– ELMv1-ECA approach
• Results and Implications

Overview• Background
– Global-scale C cycle and nutrient constraints– Plant and microbial dynamics and nutrient competition– Observations of Photosynthesis Inactive Period (PIP) plant
nutrient uptake• Modeling approaches and concepts
– CMIP-class models and Relative Demand approach– Enzyme mediated reactions– ELMv1-ECA approach
• Results and Implications

Global C Budget
Ciais et al. (2013); IPCC FAR Chpt. 64

Global C Budget
5
Ciais et al. (2013); IPCC FAR Chpt. 6
• Gross terrestrial CO2fluxes are ~10 times as large as current anthropogenic emissions
• Relatively small biases in land fluxes have large implications on atmospheric CO2burden

• Above ground variability and heterogeneity
6
Land Models Must Represent a Wide Variety of Terrestrial Systems and Processes

• Belowground variability and heterogeneity
Land Models Must Represent a Wide Variety of Terrestrial Systems and Processes
7

Successional Dynamics
Hours Week Month Year Decade Time Scale
Direct Competition
Plant Allocation &
Microbial Diversity
8
Time Scales

• How are nutrient controls important to terrestrial responses to increasing CO2?– Photosynthesis (carboxylation, ATP)
– Microbial turnover, N fixation, mycorrhizal associations– Allocation (e.g., investment for P acquisition)
– N losses (e.g., N2O, leaching)
• Observational constraints– Free Air Carbon Enrichment (FACE) studies– Fertilization experiments
9
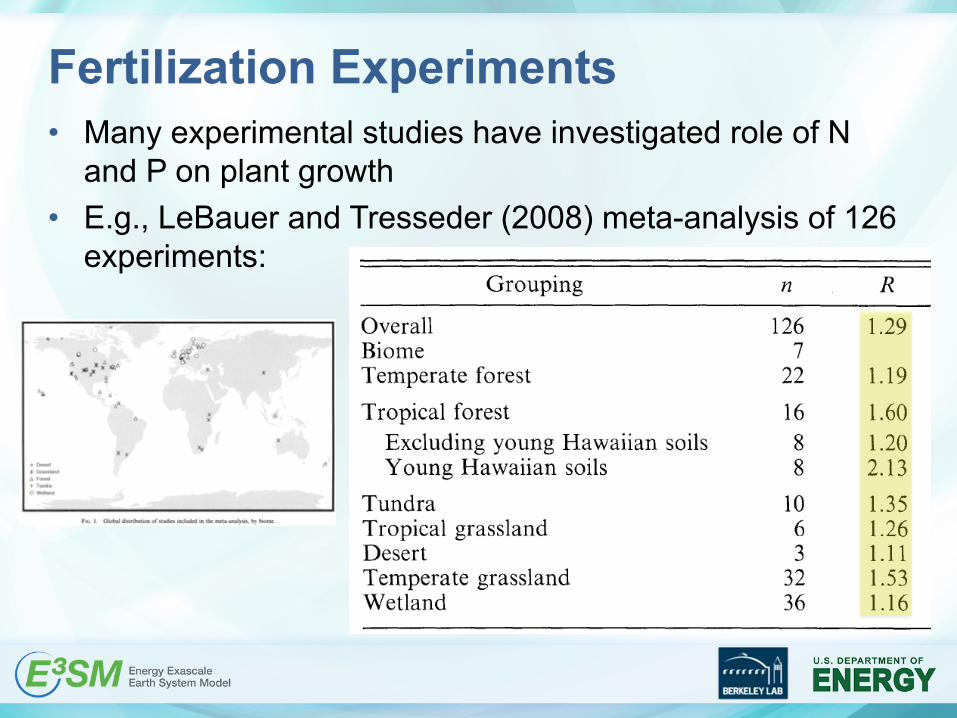
Fertilization Experiments• Many experimental studies have investigated role of N
and P on plant growth
• E.g., LeBauer and Tresseder (2008) meta-analysis of 126 experiments:

Fertilization Experiments• Elser et al. (2007)
performed a meta-analysis of 173 terrestrial experiments
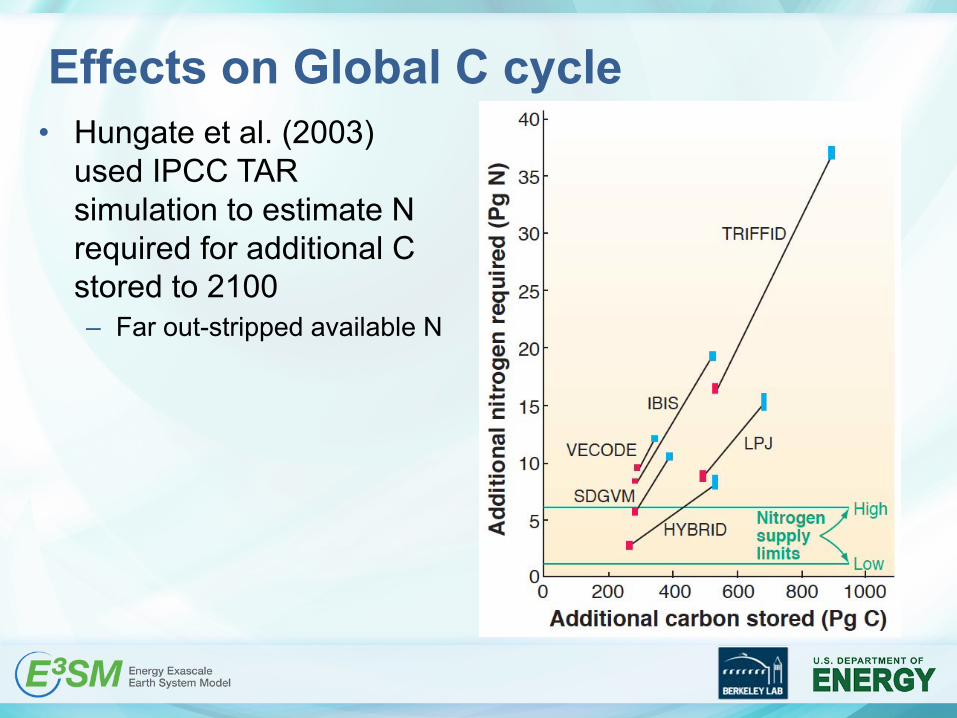
Effects on Global C cycle• Hungate et al. (2003)
used IPCC TAR simulation to estimate N required for additional C stored to 2100– Far out-stripped available N
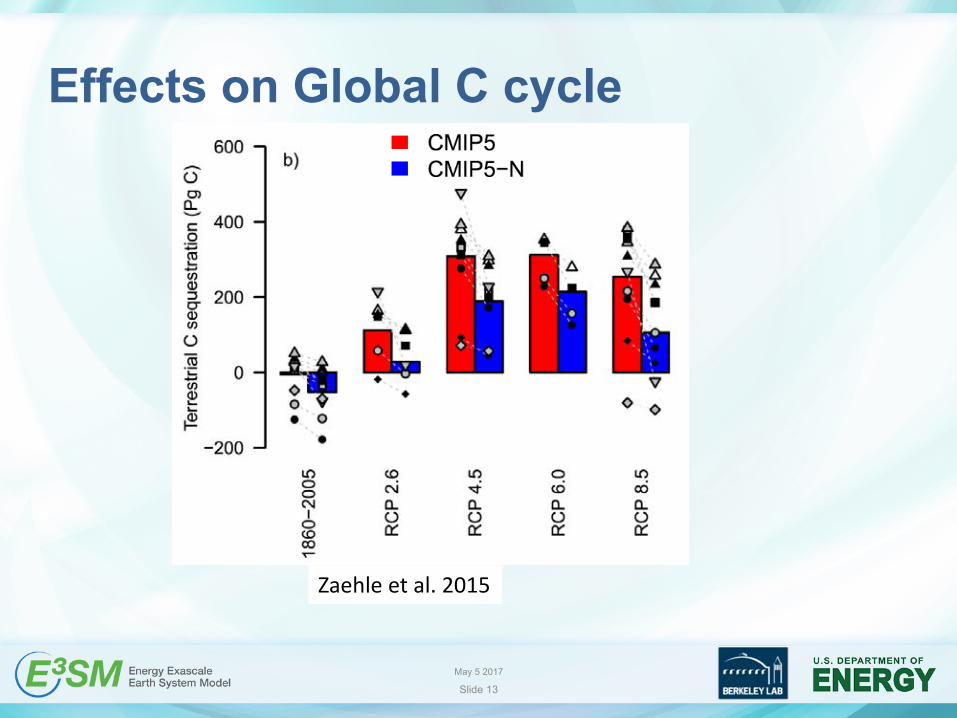
Effects on Global C cycle
May 5 2017
Slide 13
Zaehle et al. 2015

Effects on Global C cycle• Wieder et al. (2015) estimated N and N+P limitations on
CMIP5 estimated changes in NPP over 21st Century
NN+P
CMIP5 C only
Wieder et al. 2015

Nighttime and Non-Growing Season Nutrient Uptake Observations

Nighttime Uptake Observations
Schimel et al. (1999)
Light Dark
Lejay et al. (1999)

Nighttime Uptake Observations
Steingrover et al. (1980)
Dark Light

Nighttime Uptake Observations• We identified ~20 isotope-labeling studies
of nighttime nutrient uptake– All indicate nighttime uptake accounts for ~30
to 60% of total uptake• No studies contradict this finding

Non-Growing Season Uptake Observations
• Up to 90% of tundra vascular plant biomass is belowground, and root production is often delayed compared to aboveground (Iversen et al. 2015; Blume-Werry et al. 2016)
• Root infrastructure exists, and can be active, all year
Blume-Werry et al. (2016)

Non-Growing Season Uptake Observations• Observational studies demonstrate that plants acquire soil
nutrients well past plant senescence• E.g., Keuper et al. (2017)
Over the winter, deep-rooted plants acquire 15N injected at PF boundary

Non-Growing Season Uptake Observations• E.g., at the NGEE-Arctic Barrow
polygonal tundra site
ccsi.ornl.gov
Grant et al. 2017a,b
Day of Year Riley et al. in prep.

Non-Growing Season Uptake Observations• We identified ~10 isotope-labeling studies
of non-growing season nutrient uptake– All indicate non-growing season uptake
accounts for ~10 to 50% of annual uptake• No studies contradict this finding

• Background– Global-scale land C cycle and nutrient constraints– Plant and microbial dynamics and nutrient competition– Observations of Photosynthesis Inactive Period (PIP) plant
nutrient uptake• Modeling approaches and concepts
– CMIP-class models, Relative Demand approach– Enzyme mediated reactions– ELMv1-ECA approach
• Results and Implications

Competitive Interactions
Zhu et al. 2017

Competitive Interactions
Zhu et al. 2017

Traditional Approach to Represent Nutrient Competition in Models• We reviewed 12 nutrient-enabled CMIP6 land models • All represent nutrient competition with the “Relative
Demand” concept:– Root and soil microbe competition resolved based on non-nutrient-
constrained demand– Acquisition scaled by relative demand of all competitors– Simplifies interactions and is relatively easy to implement
• But, instantaneous Relative Demand approach precludes non-growing season and nighttime plant nutrient uptake

New Methods to Model Nutrient Competition
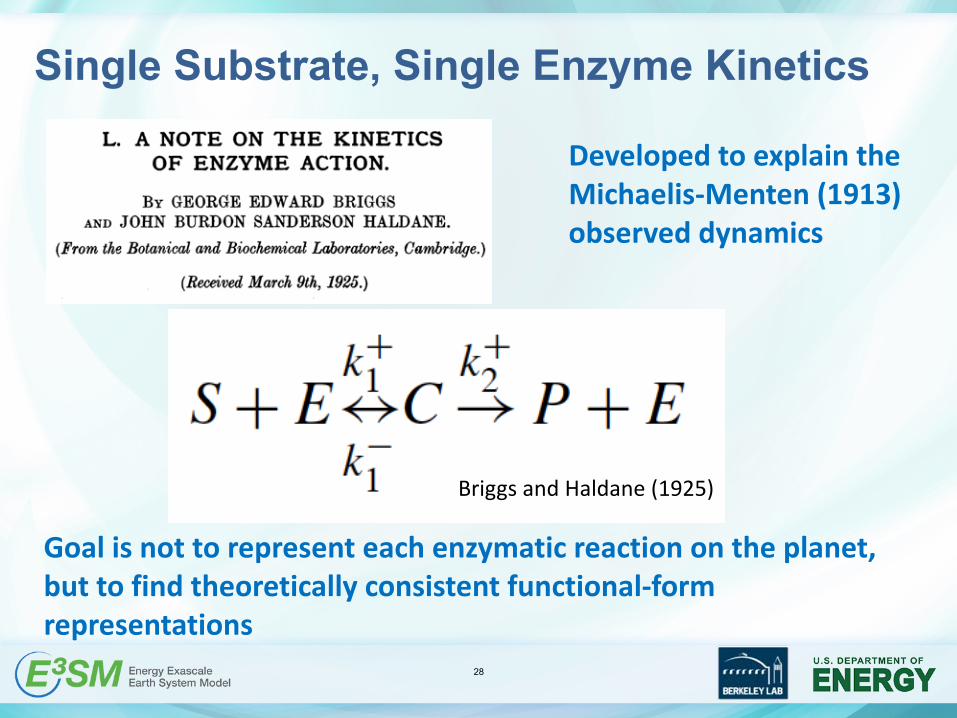
Single Substrate, Single Enzyme Kinetics
Briggs and Haldane (1925)
28
Developed to explain the Michaelis-Menten (1913) observed dynamics
Goal is not to represent each enzymatic reaction on the planet, but to find theoretically consistent functional-form representations
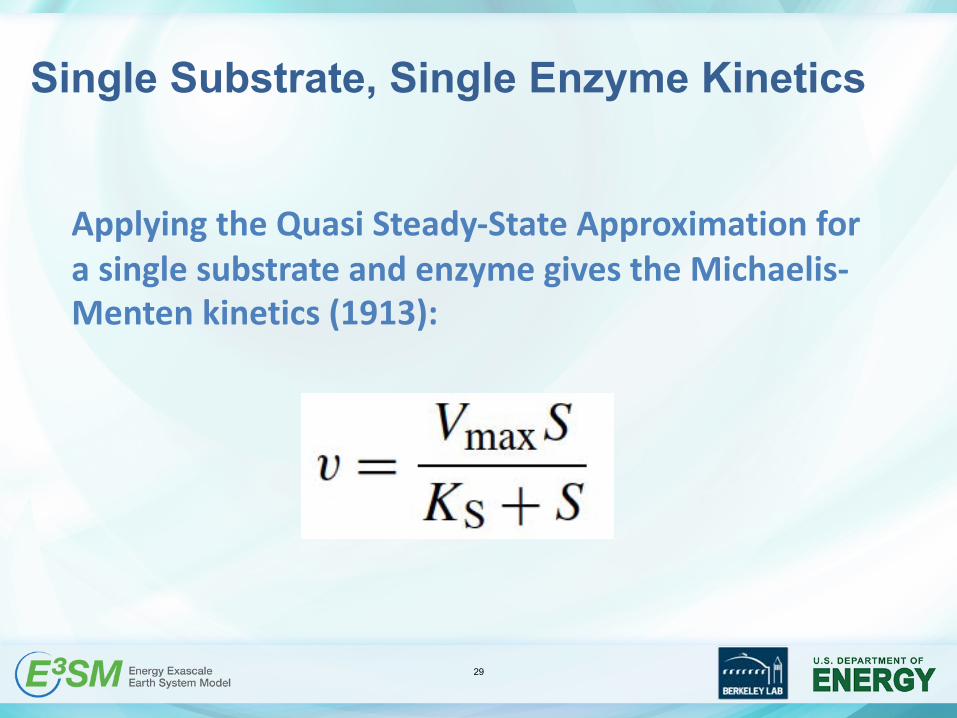
Single Substrate, Single Enzyme Kinetics
Applying the Quasi Steady-State Approximation for a single substrate and enzyme gives the Michaelis-Menten kinetics (1913):
29

• Studies have found discrepancies between Michaelis-Menten kinetics and observations– Cha and Cha (1965); Williams (1973); Suzuki et al.
(1989); Maggi and Riley (2009)
• So, a number of modifications have been proposed (e.g., Cha and Cha (1965)):
Single Substrate, Single Enzyme Kinetics
30
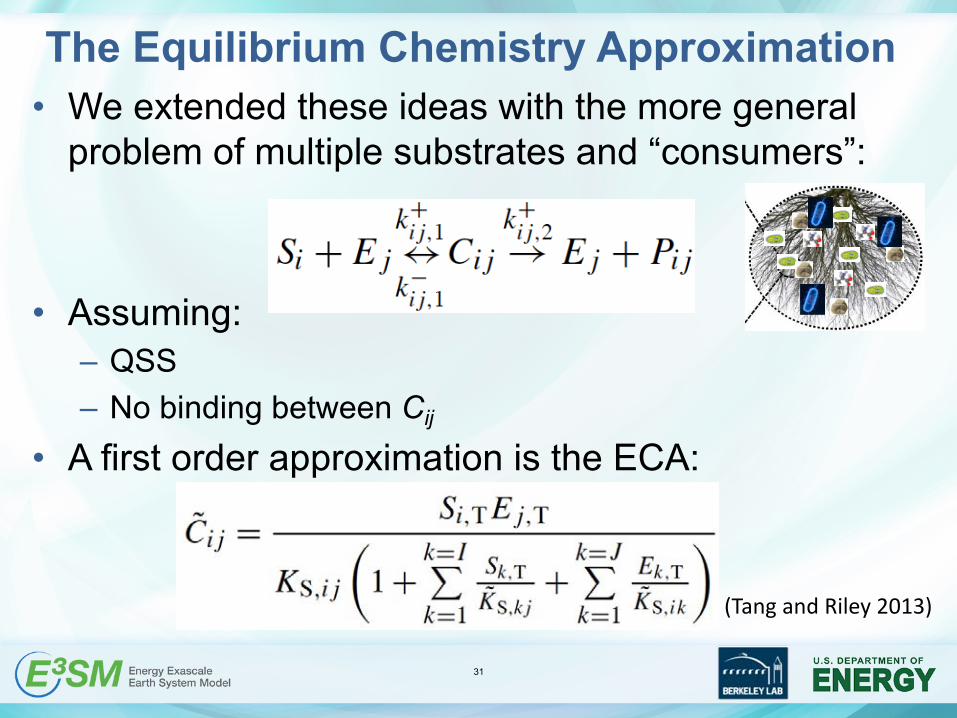
• We extended these ideas with the more general problem of multiple substrates and “consumers”:
• Assuming:– QSS– No binding between Cij
• A first order approximation is the ECA:
The Equilibrium Chemistry Approximation
(Tang and Riley 2013)
31

ECA
Method facilitates inclusion of an arbitrary number of sorption,
(Tang and Riley 2013; Tang 2015; Tang and Riley 2017, 2018)
inhibitory mechanisms, diffusion limitations, and microbial traits
32

• Soil NO3-, NH4
+, POx competition between plants, microbes, and mineral surfaces in several tropical forests
ECA Application: Tropical Sites
33
Zhu et al. 2016

0 1 2 3 4 5 60
10
20
30
40
Root biomass density (kg m−2)
Mic
robi
al N
Upt
ake/
Pla
nt N
Upt
ake
ECA ensemble mean (CT5)ECA ensemble 95% CI (CT5)Observations
0 1 2 3 4 5 60
10
20
30
40
Root biomass density (kg m−2)
Mic
robi
al N
Upt
ake/
Pla
nt N
Upt
ake
ECA ensemble mean (CT5)ECA ensemble 95% CI (CT5)ECA best fit (CT5)Observations
0 1 2 3 4 5 60
10
20
30
40
Root biomass density (kg m−2)
Mic
robi
al N
Upt
ake/
Pla
nt N
Upt
ake
ECA ensemble mean (CT5)ECA ensemble 95% CI (CT5)ECA best fit (CT5)Relative Demand approach (CT4)Observations
0 1 2 3 4 5 60
10
20
30
40
Root biomass density (kg m−2)
Mic
robi
al N
Upt
ake/
Pla
nt N
Upt
ake
ECA ensemble mean (CT5)ECA ensemble 95% CI (CT5)ECA best fit (CT5)Relative Demand approach (CT4)Microbes outcompete plant (CT2)Observations
ECA Application: Soil 15N tracer in an alpine meadow (Xu et al. 2011)
(Zhu et al. 2017)
• ECA approach qualitatively matches observations with parameters from other systems– Excellent
match after calibration
• No calibration results in the other Competition Theories having the correct functional form
34

• Two other land models have also implemented the ECA concept for nutrient competition– ED2 (Medvigy et al. (in review))– ORCHIDEE (Huang et al. 2018)

ELMv1-ECA• ECA kinetics for nutrient competition• Dynamic plant allocation responds to resources and
stress• Dynamic plant stoichiometry based on a large meta-
analysis
Zhu et al. (in revision)
• Background– Global-scale land C cycle and nutrient constraints– Plant and microbial dynamics and nutrient competition– Observations of Photosynthesis Inactive Period (PIP) plant
nutrient uptake• Modeling approaches and concepts
– CMIP-class models and Relative Demand approavh– Enzyme mediated reactions– ELMv1-ECA approach
• Results and Implications
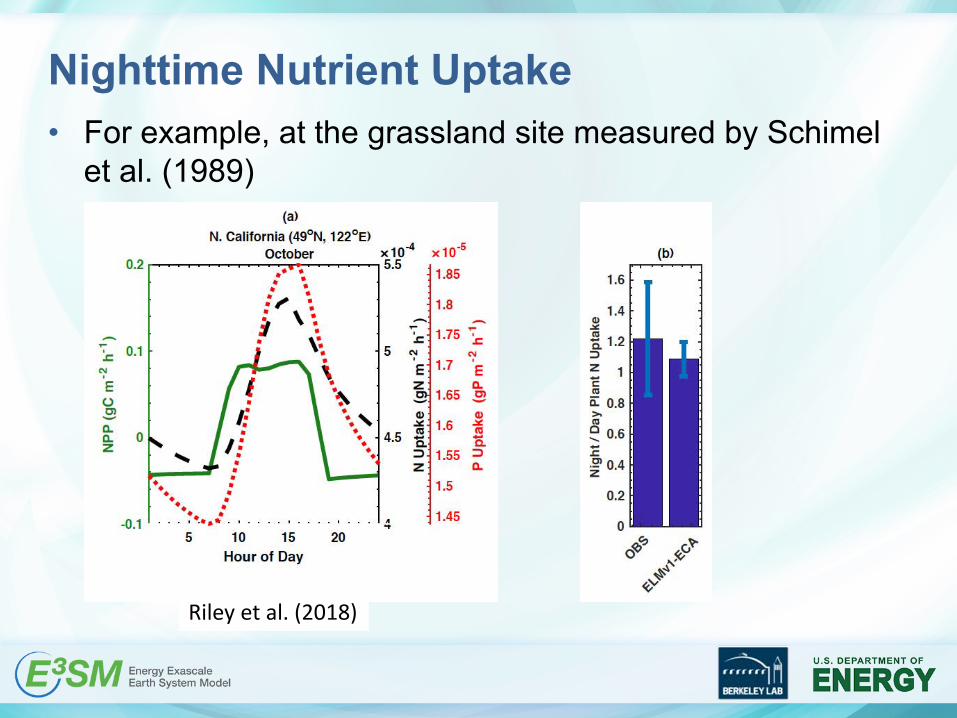
Nighttime Nutrient Uptake• For example, at the grassland site measured by Schimel
et al. (1989)
Riley et al. (2018)

Short-Term N Uptake Evaluation• We also evaluated the model
against observed ratios of microbial to plant nitrogen uptake from 123 short-term isotopic tracer studies from 23 sites.
Riley et al. (2018)

ELMv1-ECA Performance• GPP Bias
0.67 0.75 0.78
Zhu et al. (2018)

ELMv1-ECA Performance• Plant biomass Bias
0.45 0.48 0.74
Zhu et al. (2018)

ELMv1-ECA Performance• Comparison based on Houghton et al. (2015); Zhu and
Riley (2015) Nature Climate Change
Frac
tion
N Lo
ss v
ia N
2O
Zhu et al. (2018)

PIP Nutrient Dynamics• ELMv1-ECA predicted large fractions of annual N and P
uptake occurs during photosynthesis-inactive periods

PIP Nutrient Dynamics• ELMv1-ECA predicts large fractions of annual N and P
uptake occurs during photosynthesis-inactive periods
Nighttime
Non-growingSeason
Riley et al. (2018)

PIP Nutrient Dynamics• ELMv1-ECA predicts large fractions of annual N and P
uptake occurs during photosynthesis-inactive periods

Implications of Ignoring PIP Nutrient Uptake• Two sets of simulations
– From baseline ELMv1-ECA model, suppress N and P uptake during PIPs for 10 years
– Fully spinup “no-PIP nutrient uptake” model version, then allow PIP N and P uptake for 10 years
• Differences from 2 baseline simulations indicate relative magnitude of PIP nutrient uptake effects

Implications of Ignoring PIP Nutrient Uptake: Ecosystems Become N “Leakier”
Increased losses: • 5.7 – 7.2 TgN y-1 of
N2O– 2.4 to 3.0 Pg CO2-
equivalent y-1
– Current land C sink: 0 to 12 Pg-CO2 y-1
– ~25% to >100% of the current land CO2 sink
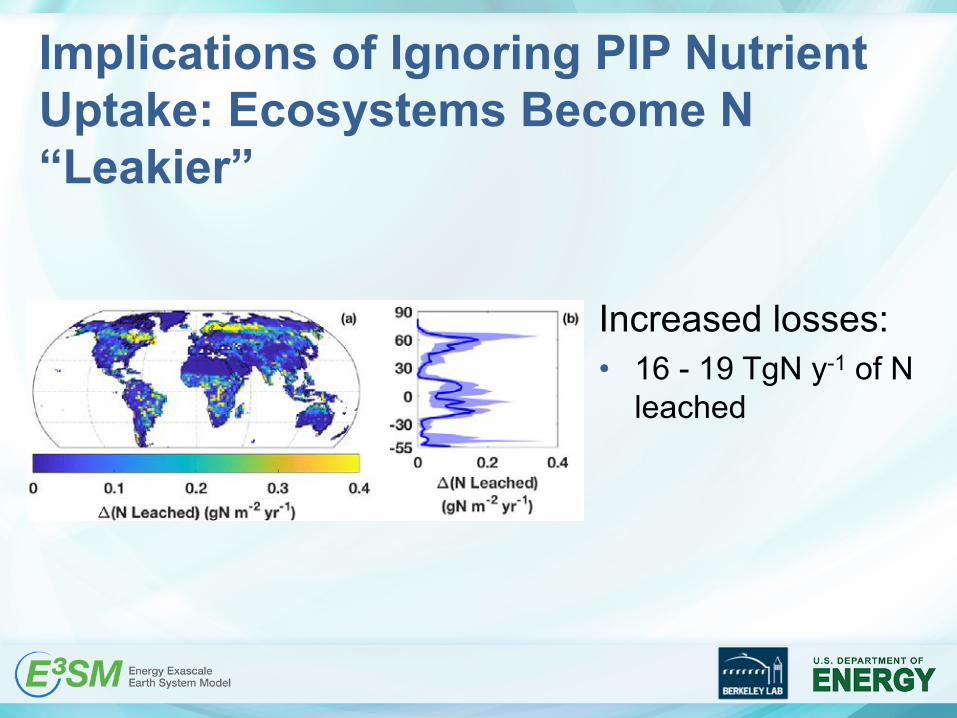
Implications of Ignoring PIP Nutrient Uptake: Ecosystems Become N “Leakier”
Increased losses: • 16 - 19 TgN y-1 of N
leached

High-Latitude Non-Growing Season Uptake• 5 to >50% of annual N and P uptake occurs
outside of growing season• Large variation between plant functional types

Summary• Photosynthesis-Inactive Period (nighttime and non-
growing season) nutrient uptake accounts for 20-60% of annual uptake– ~45% NPP-weighted global average
• Ignoring this process, as is done in all CMIP6 models reviewed and ELMv1-CTC (i.e., those using a Relative Demand approach), leads to:– Biased ‘leaky’ terrestrial ecosystems: N leaching (16 - 19 TgN y-1)
and N2O emissions (5.7 – 7.2 TgN y-1)– This N2O emission bias has a GWP equivalent of ~25% to >100%
of the current terrestrial CO2 sink– Potentially large effects on modeled terrestrial C exchanges with
the atmosphere

ELM Papers Cited• Riley, W. J., Zhu, Q., and Tang, J. Y.: Weaker land-climate feedbacks from nutrient uptake during photosynthesis-
inactive periods, Nature Climate Change, https://doi.org/10.1038/s41558-018-0325-4, 2018.• Tang, J. Y.: On the relationships between the Michaelis-Menten kinetics, reverse Michaelis-Menten kinetics,
equilibrium chemistry approximation kinetics, and quadratic kinetics, Geoscientific Model Development, 8, 3823-3835, 2015.
• Tang, J. Y., and Riley, W. J.: Technical Note: A generic law-of-the-minimum flux limiter for simulating substrate limitation in biogeochemical models, Biogeosciences, 13, 723-735, doi:10.5194/bg-13-723-2016, 2016.
• Tang, J. Y., and Riley, W. J.: SUPECA kinetics for scaling redox reactions in networks of mixed substrates and consumers and an example application to aerobic soil respiration, Geoscientific Model Development, 10, 3277-3295, https://doi.org/10.5194/gmd-10-3277-2017, 2017.
• Tang, J. Y., and Riley, W. J.: Divergent global carbon cycle predictions resulting from ambiguous numerical interpretation of nitrogen limitation, Earth Interactions, doi: 10.1175/EI-D-17-0023.1, 2018.
• Zhu, Q., and Riley, W. J.: Improved modeling of soil nitrogen losses, Nature Climate Change, 5, 705-706, doi:10.1038/nclimate2696, 2015.
• Zhu, Q., Riley, W. J., Tang, J. Y., and Koven, C. D.: Multiple soil nutrient competition between plants, microbes, and mineral surfaces: Model development, parameterization, and example applications in several tropical forests, Biogeosciences, 13, 341-363, doi:10.5194/bg-13-341-2016, 2016.
• Zhu, Q., Riley, W. J., and Tang, J. Y.: A new theory of plant and microbe nutrient competition resolves inconsistencies between observations and models, Ecol Appl, DOI:10.1002/eap.1490, 2017.