We surveyed nearly 21,000 consumers in 42 countries that ...
4
1 IBM Institute for Business Value Highlights from the fall 2016 Global Telecom Consumer Survey We surveyed nearly 21,000 consumers in 42 countries that account for 73 percent of global population and 90 percent of global GDP. What did they tell us? The primary hurdle telecom companies face today is their low customer experience reputation, which has affected customer loyalty. To find out more about this, the IBM Institute for Business Value conducted a survey based on three specific aspects: • Consumer experiences with the basic (network) services, in particular video • The extent to which telecom companies create meaningful connections with their customers • Digital trust and the willingness of customers to share personal data with their telecom providers.
Transcript of We surveyed nearly 21,000 consumers in 42 countries that ...

1 IBM Institute for Business Value
Highlights from the fall 2016 Global Telecom Consumer Survey
We surveyed nearly 21,000 consumers in 42 countries that account for 73 percent of global population and 90 percent of global GDP. What did they tell us?
The primary hurdle telecom companies face today is their low customer experience reputation, which has affected customer loyalty. To find out more about this, the IBM Institute for Business Value conducted a survey based on three specific aspects:
• Consumer experiences with the basic (network) services, in particular video
• The extent to which telecom companies create meaningful connections with their customers
• Digital trust and the willingness of customers to share personal data with their telecom providers.
2 IBM Institute for Business Value
Highlights from the fall 2016 Global Telecom Consumer Survey
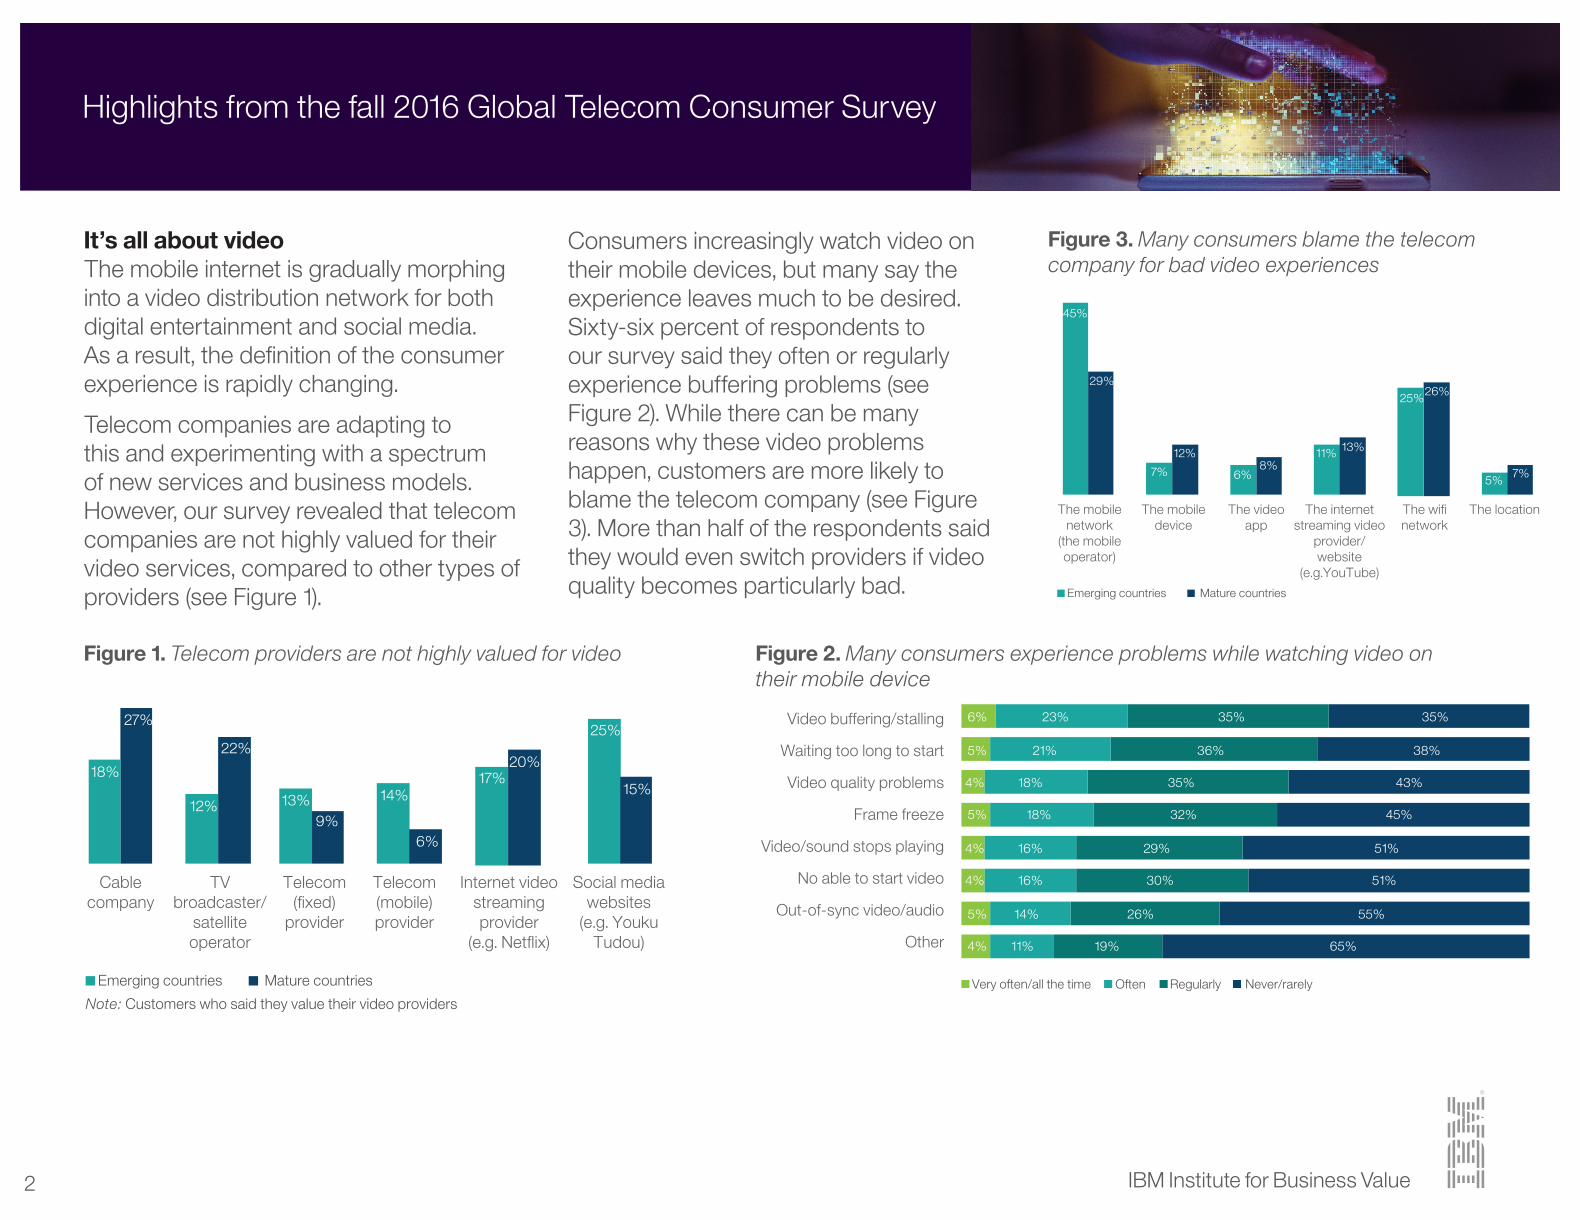
It’s all about videoThe mobile internet is gradually morphing into a video distribution network for both digital entertainment and social media. As a result, the definition of the consumer experience is rapidly changing.
Telecom companies are adapting to this and experimenting with a spectrum of new services and business models. However, our survey revealed that telecom companies are not highly valued for their video services, compared to other types of providers (see Figure 1).
Figure 1. Telecom providers are not highly valued for video Figure 2. Many consumers experience problems while watching video on their mobile device
Figure 3. Many consumers blame the telecom company for bad video experiences
Consumers increasingly watch video on their mobile devices, but many say the experience leaves much to be desired. Sixty-six percent of respondents to our survey said they often or regularly experience buffering problems (see Figure 2). While there can be many reasons why these video problems happen, customers are more likely to blame the telecom company (see Figure 3). More than half of the respondents said they would even switch providers if video quality becomes particularly bad.
27%
18%
Cable company
TVbroadcaster/
satelliteoperator
Telecom (fixed)
provider
Telecom (mobile) provider
Internet video streamingprovider
(e.g. Netflix)
Social media websites
(e.g. Youku Tudou)
22%
12% 13%9%
14%
6%
20%17%
25%
15%
Emerging countries Mature countries
Note: Customers who said they value their video providers
Video buffering/stalling
Waiting too long to start
Video quality problems
Frame freeze
Video/sound stops playing
No able to start video
Out-of-sync video/audio
Other
6% 23% 35% 35%
5% 21% 36% 38%
4% 18% 35% 43%
5% 18% 32% 45%
4% 16% 29% 51%
4% 16% 30% 51%
5% 14% 26% 55%
4% 11% 19% 65%
Very often/all the time Often Regularly Never/rarely
29%
45%
The mobile network
(the mobile operator)
The mobile device
The video app
The internet streaming video
provider/website
(e.g.YouTube)
The wifi network
The location
12%
7% 6%8%
11% 13%
26%25%
5%7%
Emerging countries Mature countries

3 IBM Institute for Business Value
Highlights from the fall 2016 Global Telecom Consumer Survey
Call center interactions are not enjoyableThe customer experience and loyalty section of the survey reflected that telecom companies generally have negative “reputational” Net Promoter Scores (NPS), often scoring near the bottom of lists that rank various industries.
Delighting customers involves surprising them with an experience that forms an emotional engagement. Yet telecom companies are falling far short of that ideal. They are generally rated average to good – but that isn’t good enough (see Figure 4). To be competitive, they will need to excel at customer experience.
The fine line of trust in customer relationshipsMonetizing personal data has become the new battleground. The ultimate potential for competitive advantage goes to those companies that can extract insight from personal data and create value for consumers. That requires customers to trust the companies that collect and analyze their data. In that regard, telecom companies actually score on the high end. On our list of different business sectors – including retail stores, social media and others – telecom companies and banks are, globally, the most trusted (see Figure 5).
Figure 4. Rating “customer experience” factors
Figure 5. Consumers’ trust in companies
Prompt and effective responses to queries
Ease and speed of contacting provider
Outstanding customer service
Fair resolution of complaints and problems
Compelling products/services/experiences
App for online purchase/self-service
Enable me to tailor products/services to my needs
Personalized advice to improve experience
Exceeding my expectations
Excellent Good Average Poor (extremely poor, not good)
17% 40% 35% 8%
17% 40% 35% 8%
16% 38% 37% 9%
15% 38% 37% 9%
12% 41% 38% 8%
13% 36% 42% 8%
12% 34% 41% 12%
12% 33% 42% 13%
12% 31% 43% 14%
Communications service providers
Bank and credit card companies
Device manufacturers
Pay TV providers
Internet video providers (such as Netflix)
Physical retail stores
Internet service providers (e.g. Google)
Online retail stores
App developers
Disruptive players, such as Uber and Airbnb
Social media companies
30% 40%
31% 45%
33% 30%
33% 32%
34% 30%
34% 32%
34% 34%
36% 33%
39% 24%
41% 21%
41% 30%
Somewhat to very uncomfortable Rather to very comfortable

4 IBM Institute for Business Value
Highlights from the fall 2016 Global Telecom Consumer Survey
If telecom providers are going to manage consumer data in digital ecosystems, trust is imperative. Yet the survey indicated that trust in telecom providers has declined in the last three years in all mature countries surveyed, although it has increased in most emerging markets (see Figure 6).
© Copyright IBM Corporation 2017
IBM CorporationRoute 100Somers, NY 10589
Produced in the United States of America February 2017
IBM, the IBM logo, ibm.com and Watson are trademarks of International Business Machines Corp., registered in many jurisdictions worldwide. Other product and service names might be trademarks of IBM or other companies. A current list of IBM trademarks is available on the web at “Copyright and trademark information” at: ibm.com/legal/copytrade.shtml.
This document is current as of the initial date of publication and may be changed by IBM at any time. Not all offerings are available in every country in which IBM operates.
THE INFORMATION IN THIS DOCUMENT IS PROVIDED “AS IS” WITHOUT ANY WARRANTY, EXPRESS OR IMPLIED, INCLUDING WITHOUT ANY WARRANTIES OF MERCHANTABILITY, FITNESS FOR A PARTICULAR PURPOSE AND ANY WARRANTY OR CONDITION OF NON-INFRINGEMENT. IBM products are warranted according to the terms and conditions of the agreements under which they are provided.
This report is intended for general guidance only. It is not intended to be a substitute for detailed research or the exercise of professional judgment. IBM shall not be responsible for any loss whatsoever sustained by any organization or person who relies on this publication.
The data used in this report may be derived from third-party sources and IBM does not independently verify, validate or audit such data. The results from the use of such data are provided on an “as is” basis and IBM makes no representations or warranties, express or implied.
GBE03804USEN-01
The biggest concerns consumers expressed about data collection involve companies selling data to third parties (60 percent) and failing to keep it secure (45 percent). Clearly, it is important to consumers, that their providers tell them how personal data is used and allow them more control over their data (see Figure 7).
1%PakistanEgypt 2%
Nigeria 12%
-3%-8%
-11%11%-11%-11%-11%
-13%-13%-13%-13%-13%
-14%-15%-17%
-18%-20%
-21%-21%
-22%-22%
-24%-24%
-25%-26%
-27%-28%
-29%-33%
-34%
11%10%
7%5%
4%4%4%
3%
IndonesiaThailand
IndiaChinaKenyaRussia
BrazilPhilippines
HungaryKSARomaniaNorwayJapanDenmarkCanadaTurkeySlovakiaPolandMexicoItalyCzech RepRSAAustraliaUSNetherlandsUKFranceSpainBelgiumSwedenAustriaIrelandSwitzerlandPortugalGermanyArgentinaSouth KoreaGreece
0%UAE
Figure 6. Change in consumers’ trust in telecom companies in the last three years Figure 7. Importance of telling consumers how
personal data is used and giving them control of data
Not at all important
Not so important
Neutral
Rather important
Extremely important
Do not need control
Need some control
Like moderate control
Like significant control
Like full control
4%
7%
28%
26%
35%
4%
13%
29%
26%
37%
People want to be informed about the usage of their data
People want to have control over the usage of their data