
WCEE2012_5795
10
Experimental analysis for identification of bridges structural damage using Operational Modal Analysis based methods E. D’Amore & S. Trovato Department of Mechanics and Materials, University Mediterranea of Reggio Calabria, Italy SUMMARY Recent structural collapses of bridges and damaging occurred on deck and dampers of suspension bridges, are driving the development of monitoring techniques for the structural integrity assessment of primary lifelines. Structural Health Monitoring combines a variety of methods for observed dynamic systems response detection of different structural systems. Among others techniques, Operational Modal Analysis, combined with efficient techniques for modal parameters identification, seems well suited for Vibration-Based Damage Detection (VBDD) of bridges under operating traffic loads. This paper addresses the issue, of the effectiveness of VBDD algorithms based on strain energy or modal flexibility matrices for the damage detection of bridge structures under operational loads. A reduced scale model of a three-span bridge was developed to evaluate the interaction effects between moving loads and structure and to investigate the algorithms sensitivity to different input levels and the damage prediction for different sensors density and damage size. Keywords: Structural Health Monitoring, Bridges, Operational Modal Analysis 1. INTRODUCTION Recent cases of structural collapse of bridges, such as I-35W Mississippi River bridge Minnesota, USA (2007), and the damage of the deck and some seismic dampers device of large suspension bridges such as the Vincent Thomas Bridge in the harbor area of Los Angeles CA (Amaddeo et al., 2008), have revealed the need to develop and implement technologies for monitoring the safety assessment of bridges and major lifelines. The civil infrastructures and bridges in particular, over time inevitably deteriorate. The most common causes of degradation of bridges (Mufti, 2001) are related primarily to corrosion of structural steel parts and rebars, or deterioration of the concrete and damage of constraint devices. The continuous evolutions of traffic loads induce an increase of structural stresses, and it requires an adjustment, expansion or replacement of the bridge. In this context, monitoring techniques of structural integrity through estimation of dynamic parameters are emerging as tools for planning and retrofitting of involved structures. The Structural Health Monitoring (SHM) combines a variety of methodologies for monitoring the performance and health status of various structures. Generally, the objectives of Structural Health Monitoring (Mufti, 2001) are: (1) Monitor the behavior of a structure with precision and efficiency, (2) Locate the damage and degradation, (3) Determine the health status and the condition of a structure in order to evaluate performance. The analysis techniques can be divided into three main classes (Xianfei, 2008): (1) Vibration-Based Damage Detection method (VBDD), (2) Statically-Based Damage Detection method (SBDD), (3) Direct inspection of structural elements. VBDD weigh changes in dynamic characteristics of a system, such as the natural frequencies, mode shapes and damping, as indicators of damage. Then, in order that damage can be properly identified by the VBDD methods, a reliable evaluation of the structural dynamic parameters is necessary (Farrar et al., 1997). The properties of a structure can be obtained analytically or through experimental analysis (EMA). Particularly, there are two approaches: in the first, called Experimental Modal Analysis (EMA), input and output are known, in the second, called Operational Modal Analysis (OMA) unknown input is given by environment excitation (wind,
-
Upload
gabrielcuba83 -
Category
Documents
-
view
6 -
download
0
description
articol
Transcript of WCEE2012_5795
Experimental analysis for identification of bridges
structural damage using Operational Modal Analysis
based methods
E. D’Amore & S. Trovato Department of Mechanics and Materials, University Mediterranea of Reggio Calabria, Italy
SUMMARY Recent structural collapses of bridges and damaging occurred on deck and dampers of suspension bridges, are
driving the development of monitoring techniques for the structural integrity assessment of primary lifelines.
Structural Health Monitoring combines a variety of methods for observed dynamic systems response detection of
different structural systems. Among others techniques, Operational Modal Analysis, combined with efficient
techniques for modal parameters identification, seems well suited for Vibration-Based Damage Detection
(VBDD) of bridges under operating traffic loads. This paper addresses the issue, of the effectiveness of VBDD
algorithms based on strain energy or modal flexibility matrices for the damage detection of bridge structures
under operational loads. A reduced scale model of a three-span bridge was developed to evaluate the interaction
effects between moving loads and structure and to investigate the algorithms sensitivity to different input levels
and the damage prediction for different sensors density and damage size.
Keywords: Structural Health Monitoring, Bridges, Operational Modal Analysis
1. INTRODUCTION
Recent cases of structural collapse of bridges, such as I-35W Mississippi River bridge Minnesota,
USA (2007), and the damage of the deck and some seismic dampers device of large suspension
bridges such as the Vincent Thomas Bridge in the harbor area of Los Angeles CA (Amaddeo et al.,
2008), have revealed the need to develop and implement technologies for monitoring the safety
assessment of bridges and major lifelines. The civil infrastructures and bridges in particular, over time
inevitably deteriorate. The most common causes of degradation of bridges (Mufti, 2001) are
related primarily to corrosion of structural steel parts and rebars, or deterioration of the concrete and
damage of constraint devices. The continuous evolutions of traffic loads induce an increase of
structural stresses, and it requires an adjustment, expansion or replacement of the bridge. In this
context, monitoring techniques of structural integrity through estimation of dynamic parameters are
emerging as tools for planning and retrofitting of involved structures. The Structural Health
Monitoring (SHM) combines a variety of methodologies for monitoring the performance and health
status of various structures. Generally, the objectives of Structural Health Monitoring (Mufti, 2001)
are: (1) Monitor the behavior of a structure with precision and efficiency, (2) Locate the damage and
degradation, (3) Determine the health status and the condition of a structure in order to evaluate
performance. The analysis techniques can be divided into three main classes (Xianfei, 2008): (1)
Vibration-Based Damage Detection method (VBDD), (2) Statically-Based Damage Detection method
(SBDD), (3) Direct inspection of structural elements. VBDD weigh changes in dynamic characteristics
of a system, such as the natural frequencies, mode shapes and damping, as indicators of damage. Then,
in order that damage can be properly identified by the VBDD methods, a reliable evaluation of the
structural dynamic parameters is necessary (Farrar et al., 1997). The properties of a structure can be
obtained analytically or through experimental analysis (EMA). Particularly, there are two approaches:
in the first, called Experimental Modal Analysis (EMA), input and output are known, in the second,
called Operational Modal Analysis (OMA) unknown input is given by environment excitation (wind,
traffic), similar to a random signal, while the response is measurable. EMA is feasible with difficulty
in the case of large structures (Brincker et al., 1990) (Brincker et al., 1991) (Caicedo et al., 2004). The
main advantages of OMA are (Aktan et al., 2005): the test is quicker and cheaper since they are not
required equipment for the excitation of the structure; the measurements are performed under
actual operating conditions of the structure and the modal parameters obtained are representative of
the dynamic behavior of the structure in its actual conditions of use; the test does not interfere with the
operation of the structure ; so that, for example, it is not necessary to close a bridge to the traffic when
it is tested. It is worth noting that the output-only techniques for the identification of the system are
necessary for the development of a continuous monitoring based on natural vibrations in order to
assess the health status of the structure.
This paper contains results of numerical and experimental studies on a reduced scale model of a three
spans bridge, with the aim to investigate same questions regarding the potential use of VBDD output-
only for structural health monitoring of bridges. The dynamic identification of the system was realized
through the combined use of the Eigensystem Realization Algorithm (ERA) (Juang, 1994) and the
Natural Excitation Technique (NExT) (James et al., 1993) for the determination of the impulse response
functions. The reliability of these methodologies primarily depends on the trustworthiness of the
dynamic characteristics of the system identified by OMA, and the ability to localize with sufficient
accuracy the damage. Main objectives of this study are: (1) Assessing the interaction between moving
loads and structure in the dynamic and damage identification (2) Evaluating the quality of the dynamic
identification and their sensitivity at different input levels, (3) Assessing the ability of the used
identification damage methods to correctly locate damage and to evaluate the sensitivity of damage
prediction for different sensors density and damage size.
2. METHODS FOR DAMAGE IDENTIFICATION
2.1 Damage Index Method (DI)
The Damage Index Method was developed by (Stubbs et al., 1995). The indicator of damage is
based on the variation of the beam strain energy. The variations in the strain energy may be related to
changes in its curvature. The indicator of damage at the node of the beam and at the mode shape
is defined as
(2.1)
where e
are respectively the curvature at node of the mode shape before and after damage,
is the number of nodes and is the number of identified modal shapes (Farrar et al., 1994).
Assuming that the collection of the damage indices, , represents a sample population of a normally
distributed random variable, a normalized damage localization indicator is obtained as follows
(2.2)
where and represent the mean and standard deviation of the damage indices, respectively. For a
value of equal to two it has got a significance level of 95% (Wang et al., 2000).
2.2 Positive Bending Inspection Load (PBIL)
This method developed by (Koo et al., 2009) is based on the explicit relationship between the modal
deformation of the structure before and after the damage. Through the dynamic flexibility matrix is
possible to evaluate the deformed shape of the structure induced by an arbitrary load vector as follows:
(2.3)
where is the vector containing the deformed shape, is the load vector and is the flexibility
modal matrix that contains only the first modes:
(2.4)
where is the diagonal matrix of modal frequencies and is the normalized mode shape matrix
with respect to the mass. If you do not know the mass distribution, the normalization must be
performed by the experimental tests of "added mass" or "mass perturbation method” (Brinker et al.,
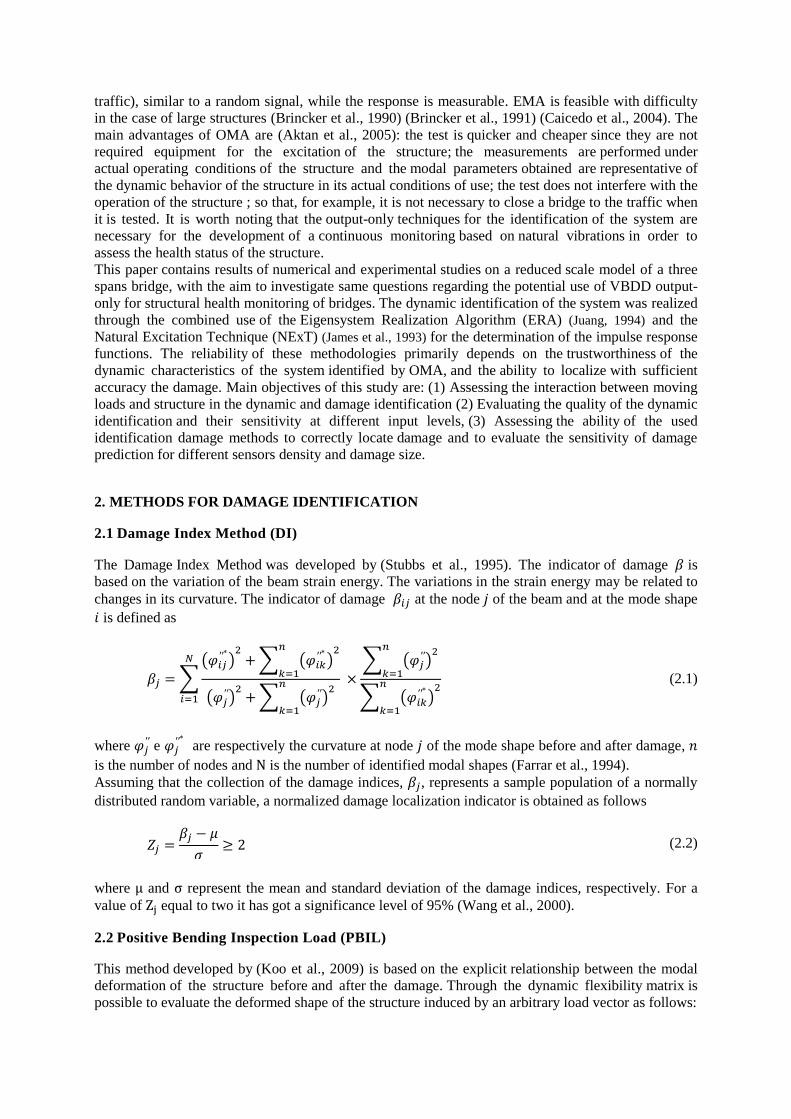
2002), (Bernal, 2002). To locate the damage in interest region, we must use a load or sets of loads that
does not produce an inflection point in this region. It is possible to presume that damage, when is
localized in the immediate vicinity of an inflection point, do not induce a significant
additional strain on the structure since the bending moment in that section is negligible. In addition, in
order to ensure easy recognition of the damage, the load vector will ensure a positive bending
moment in the same portion of the structure (Koo et al., 2009).
Table 2.1: Positive Bending Inspection Loads for test model
Inspection region Loads Definition of PBILs
1st and 3
rd span
2nd
span
1st intermediate
support
2nd
intermediate
support
After we calculated the difference between the flexibility matrix pre-and post-damage (
as
follows:
(2.5)
and we define all the load vectors in order to cover different areas of the structure to be inspected,
following the references listed above, and we calculate for each of them the strain induced
(2.6)
The procedure of damage location occurs through the use of an approach of chord deformation
(Damage-Induced Chord-wise deflection DI-CD), which can be defined as the additional
deformation caused by damage and measured along the cord that connects two points and :
(2.7)
where is the region inspected.

The algorithm of location of the damage can be determined as follows:
(2.8)
The load vectors PBIL, as they have been defined, will ensure the inspected region a value of
positive bending moment. The damage can then be located in that region where the deformation
reaches a maximum and at the same time its derivate abruptly changes. Deflections of the test models
were estimated using Eq. (2.7) with the PBILs as shown in Table 2.1.
3. NUMERICAL AND EXPERIMENTAL STUDY
3.1 Characterization of model
The experimental validation was carried out through two scale models with different mass density.
Tested models are composed of a continuous steel beam with rectangular cross section. To
experimentally simulate the traffic loads, issue that it was treated by several authors including (Yun et
al., 2004), it was realized a system constituted by moving arm with three pendulums connected in
series reproducing a multiple-input/multiple-output system (MIMO). The arm connected to the shake
table simulates a random moving load through three wheels that are dragged on the deck.
Figure 3.1: Scale model and accelerometers layout
The total length of the model is equal to 2 m, while the cross section is of 30x5mm. In Table 3.1
and Table 3.2 the geometrical dimensions of model and adopted scale factors are listed.
Table 3.1: Geometrical dimensions of prototype
and model
Prototype
(m)
Model
(m)
140 2
56 0.8
42 0.6
Table 3.2: Scale factors for 1st and 2
nd test model
Physical
quantities
Scale factor
1st model
Scale factor
2st model
Length
Young’s
modulus
Mass
Moment of
inertia
Force
Time
Frequency
3.2.1 Equipment
The chain of excitation-acquisition is composed by: Quanser Shake Table II, four PCB 393B04 and
seven PCB 626B04 accelerometers, one unit LMS Scadas mobile M05 with 16 acquisition channels
(24bit) and simultaneous sampling, LMS Test.Xpress v9.0A software.
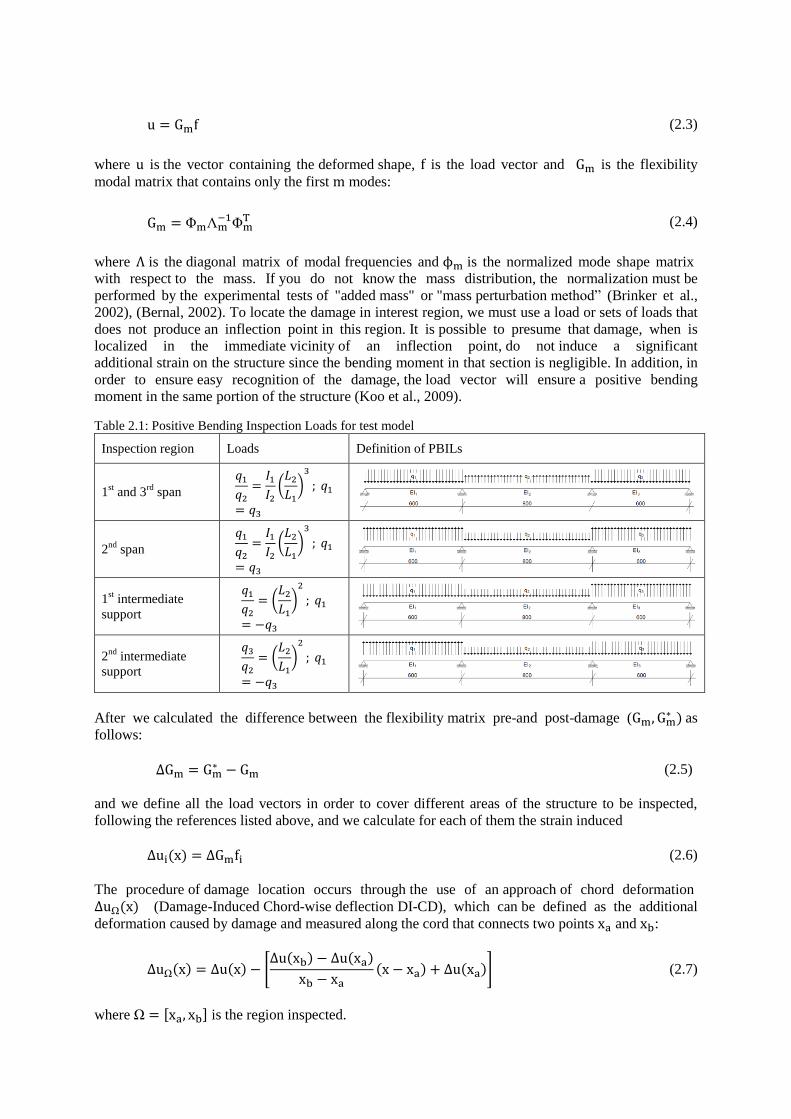
3.2 Quality assessment of modal identification for different input levels
To assess the sensitivity of the modal identification technique were performed experimental tests on
the model with three different levels of input intensity. The acceleration measurements were repeated
10 times for each level of input, and then they were measured average RMS of output acceleration
values for each test (see Table 3.3). Figure 3.2 also shows the second mode shape identified and
standard deviation values for the first and the second test. In the third test, due to low acceleration
values, were not correctly identified the first two modes.
Table 3.3: Results of dynamic identification, frequencies and their deviation for each level of input
Test N.1 20 ≤ aRMS ≤40 (mg) Test N.2 5 ≤ aRMS ≤ 12 (mg) Test N.2 0.5 ≤ aRMS ≤ 2 (mg)
F(Hz) Deviation F(Hz) Deviation F(Hz) Deviation
20,2431 0,03476 20,2510 0,01385 / /
23,8768 0,01035 23,9206 0,00545 / /
44,4853 0,01485 44,5379 0,02560 45,6422 2.13
Figure 3.2: 2nd
identified mode shape and standard deviation for the first and the second test
Figure 3.2 shows that the levels of standard deviation in the portion of the structure not subject to
moving loads are less than 2x10⁻³
while they grow up to 8x10⁻³
in the section directly loaded,
influencing negatively the identification of a possible small damage located just in that span.
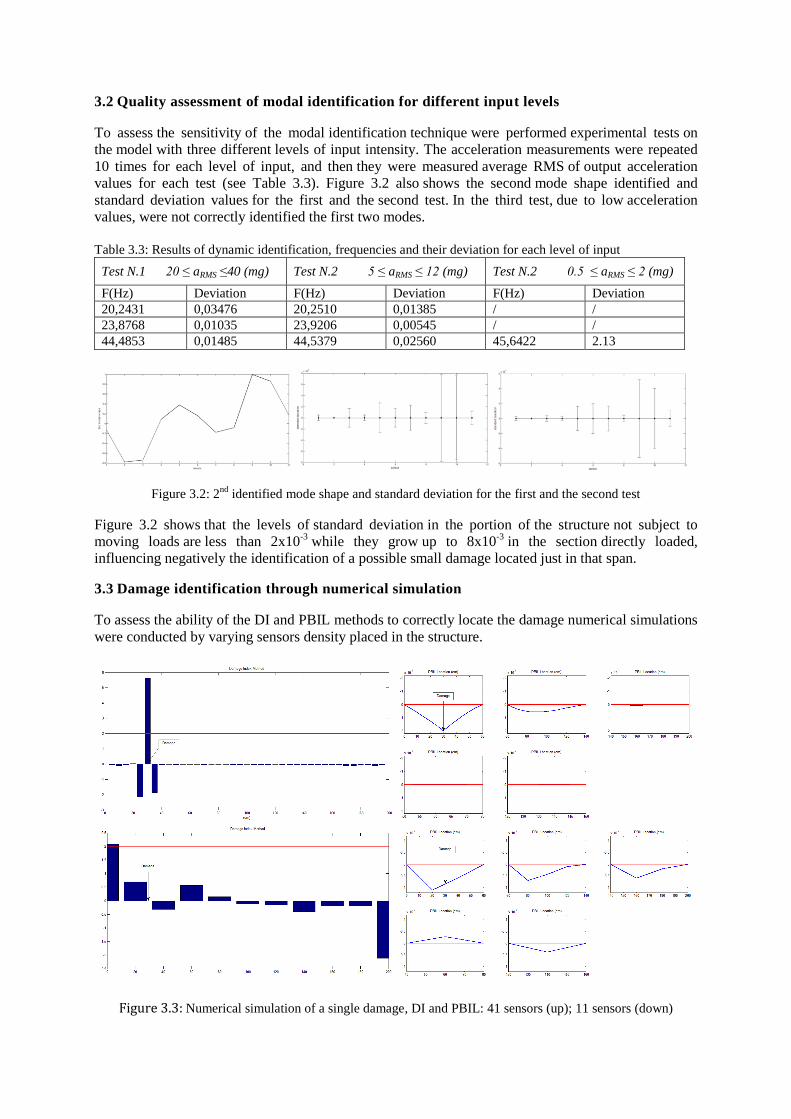
3.3 Damage identification through numerical simulation
To assess the ability of the DI and PBIL methods to correctly locate the damage numerical simulations
were conducted by varying sensors density placed in the structure.
Figure 3.3: Numerical simulation of a single damage, DI and PBIL: 41 sensors (up); 11 sensors (down)
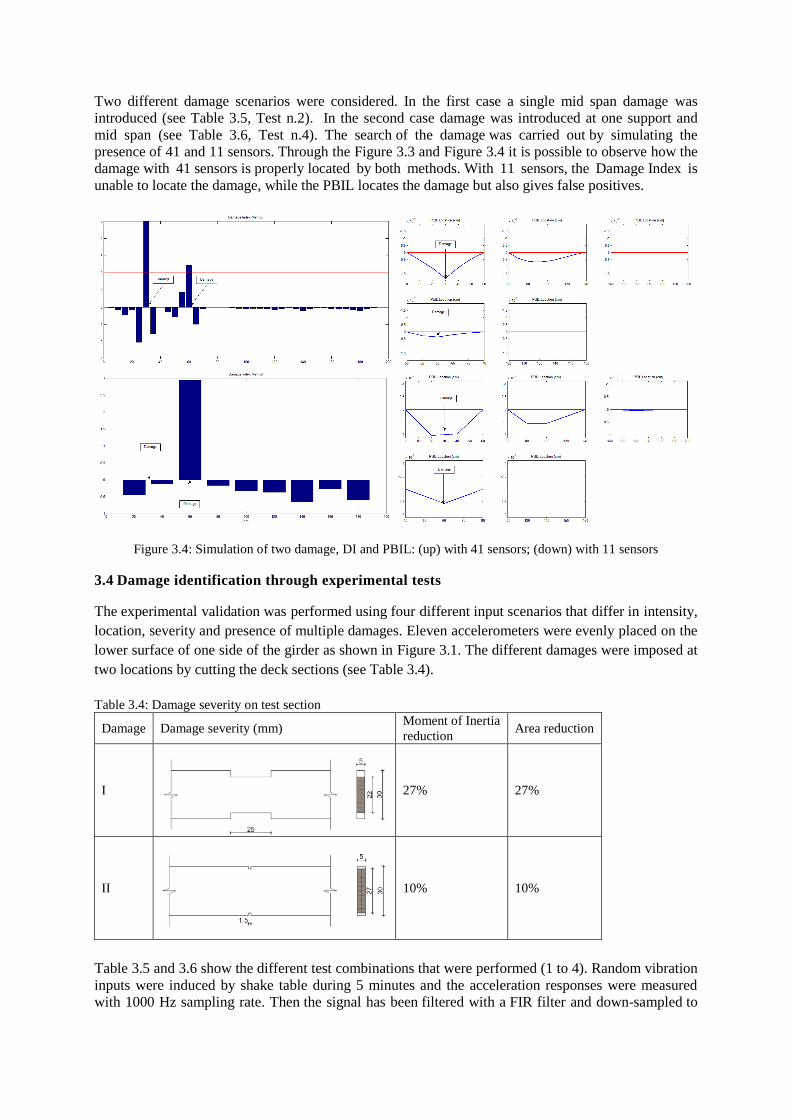
Two different damage scenarios were considered. In the first case a single mid span damage was
introduced (see Table 3.5, Test n.2). In the second case damage was introduced at one support and
mid span (see Table 3.6, Test n.4). The search of the damage was carried out by simulating the
presence of 41 and 11 sensors. Through the Figure 3.3 and Figure 3.4 it is possible to observe how the
damage with 41 sensors is properly located by both methods. With 11 sensors, the Damage Index is
unable to locate the damage, while the PBIL locates the damage but also gives false positives.
Figure 3.4: Simulation of two damage, DI and PBIL: (up) with 41 sensors; (down) with 11 sensors
3.4 Damage identification through experimental tests
The experimental validation was performed using four different input scenarios that differ in intensity,
location, severity and presence of multiple damages. Eleven accelerometers were evenly placed on the
lower surface of one side of the girder as shown in Figure 3.1. The different damages were imposed at
two locations by cutting the deck sections (see Table 3.4).
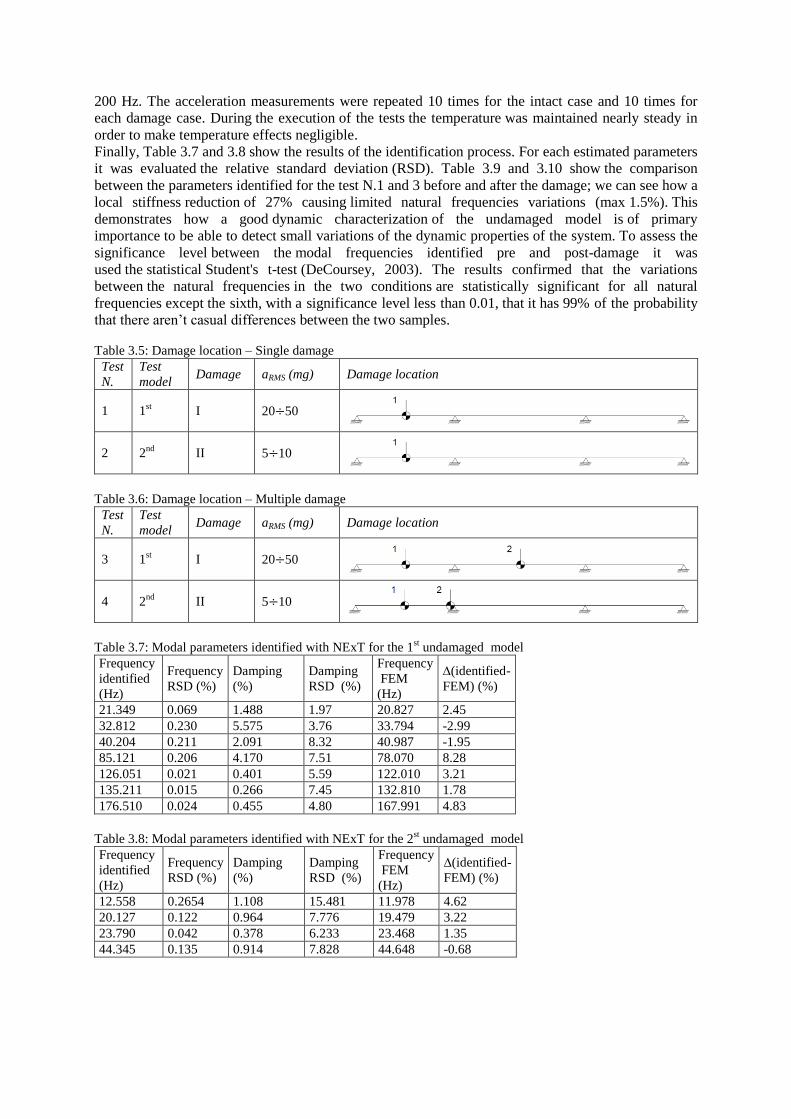
Table 3.4: Damage severity on test section
Damage Damage severity (mm) Moment of Inertia
reduction Area reduction
I
27% 27%
II
10% 10%
Table 3.5 and 3.6 show the different test combinations that were performed (1 to 4). Random vibration
inputs were induced by shake table during 5 minutes and the acceleration responses were measured
with 1000 Hz sampling rate. Then the signal has been filtered with a FIR filter and down-sampled to
200 Hz. The acceleration measurements were repeated 10 times for the intact case and 10 times for
each damage case. During the execution of the tests the temperature was maintained nearly steady in
order to make temperature effects negligible.
Finally, Table 3.7 and 3.8 show the results of the identification process. For each estimated parameters
it was evaluated the relative standard deviation (RSD). Table 3.9 and 3.10 show the comparison
between the parameters identified for the test N.1 and 3 before and after the damage; we can see how a
local stiffness reduction of 27% causing limited natural frequencies variations (max 1.5%). This
demonstrates how a good dynamic characterization of the undamaged model is of primary
importance to be able to detect small variations of the dynamic properties of the system. To assess the
significance level between the modal frequencies identified pre and post-damage it was
used the statistical Student's t-test (DeCoursey, 2003). The results confirmed that the variations
between the natural frequencies in the two conditions are statistically significant for all natural
frequencies except the sixth, with a significance level less than 0.01, that it has 99% of the probability
that there aren’t casual differences between the two samples.
Table 3.5: Damage location – Single damage
Test
N.
Test
model Damage aRMS (mg) Damage location
1 1st I 20 50
2 2nd
II 5 10
Table 3.6: Damage location – Multiple damage
Test
N.
Test
model Damage aRMS (mg) Damage location
3 1st I 20 50
4 2nd
II 5 10
Table 3.7: Modal parameters identified with NExT for the 1
st undamaged model
Frequency
identified
(Hz)
Frequency
RSD (%)
Damping
(%)
Damping
RSD (%)
Frequency
FEM
(Hz)
∆(identified-
FEM) (%)
21.349 0.069 1.488 1.97 20.827 2.45
32.812 0.230 5.575 3.76 33.794 -2.99
40.204 0.211 2.091 8.32 40.987 -1.95
85.121 0.206 4.170 7.51 78.070 8.28
126.051 0.021 0.401 5.59 122.010 3.21
135.211 0.015 0.266 7.45 132.810 1.78
176.510 0.024 0.455 4.80 167.991 4.83
Table 3.8: Modal parameters identified with NExT for the 2
st undamaged model
Frequency
identified
(Hz)
Frequency
RSD (%)
Damping
(%)
Damping
RSD (%)
Frequency
FEM
(Hz)
∆(identified-
FEM) (%)
12.558 0.2654 1.108 15.481 11.978 4.62
20.127 0.122 0.964 7.776 19.479 3.22
23.790 0.042 0.378 6.233 23.468 1.35
44.345 0.135 0.914 7.828 44.648 -0.68
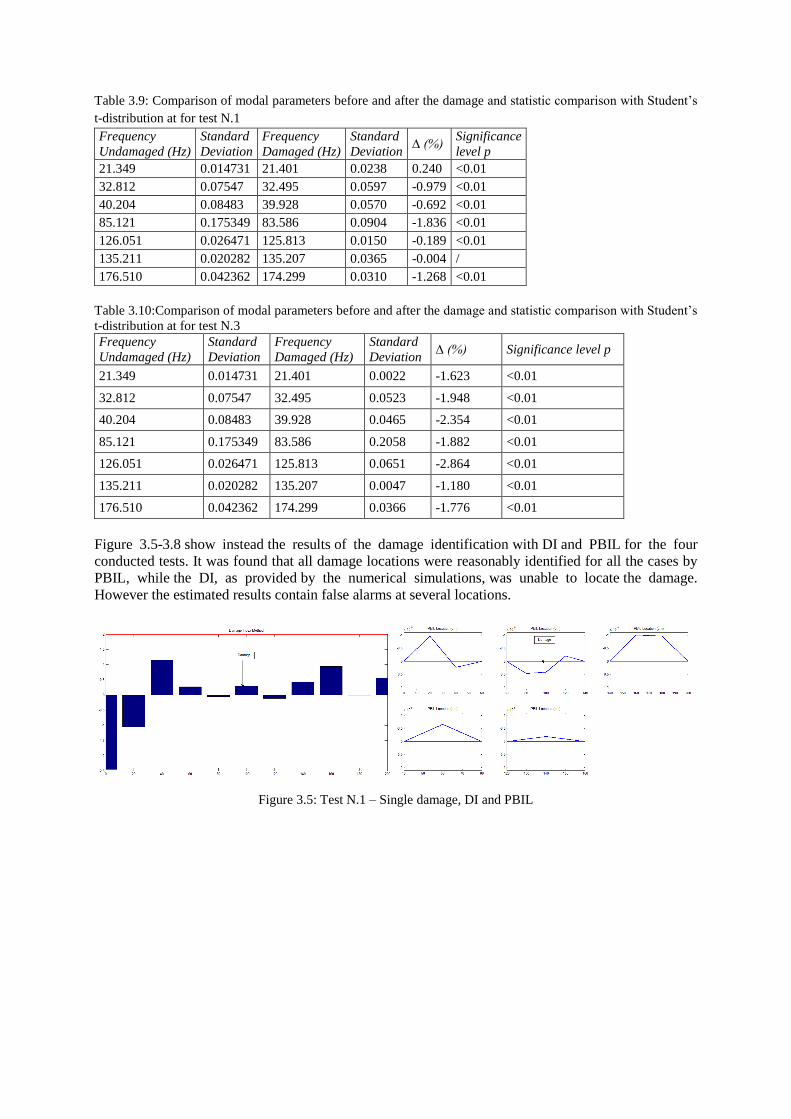
Table 3.9: Comparison of modal parameters before and after the damage and statistic comparison with Student’s
t-distribution at for test N.1
Frequency
Undamaged (Hz)
Standard
Deviation
Frequency
Damaged (Hz)
Standard
Deviation ∆ (%)
Significance
level p
21.349 0.014731 21.401 0.0238 0.240 <0.01
32.812 0.07547 32.495 0.0597 -0.979 <0.01
40.204 0.08483 39.928 0.0570 -0.692 <0.01
85.121 0.175349 83.586 0.0904 -1.836 <0.01
126.051 0.026471 125.813 0.0150 -0.189 <0.01
135.211 0.020282 135.207 0.0365 -0.004 /
176.510 0.042362 174.299 0.0310 -1.268 <0.01
Table 3.10:Comparison of modal parameters before and after the damage and statistic comparison with Student’s
t-distribution at for test N.3
Frequency
Undamaged (Hz)
Standard
Deviation
Frequency
Damaged (Hz)
Standard
Deviation ∆ (%) Significance level p
21.349 0.014731 21.401 0.0022 -1.623 <0.01
32.812 0.07547 32.495 0.0523 -1.948 <0.01
40.204 0.08483 39.928 0.0465 -2.354 <0.01
85.121 0.175349 83.586 0.2058 -1.882 <0.01
126.051 0.026471 125.813 0.0651 -2.864 <0.01
135.211 0.020282 135.207 0.0047 -1.180 <0.01
176.510 0.042362 174.299 0.0366 -1.776 <0.01
Figure 3.5-3.8 show instead the results of the damage identification with DI and PBIL for the four
conducted tests. It was found that all damage locations were reasonably identified for all the cases by
PBIL, while the DI, as provided by the numerical simulations, was unable to locate the damage.
However the estimated results contain false alarms at several locations.
Figure 3.5: Test N.1 – Single damage, DI and PBIL
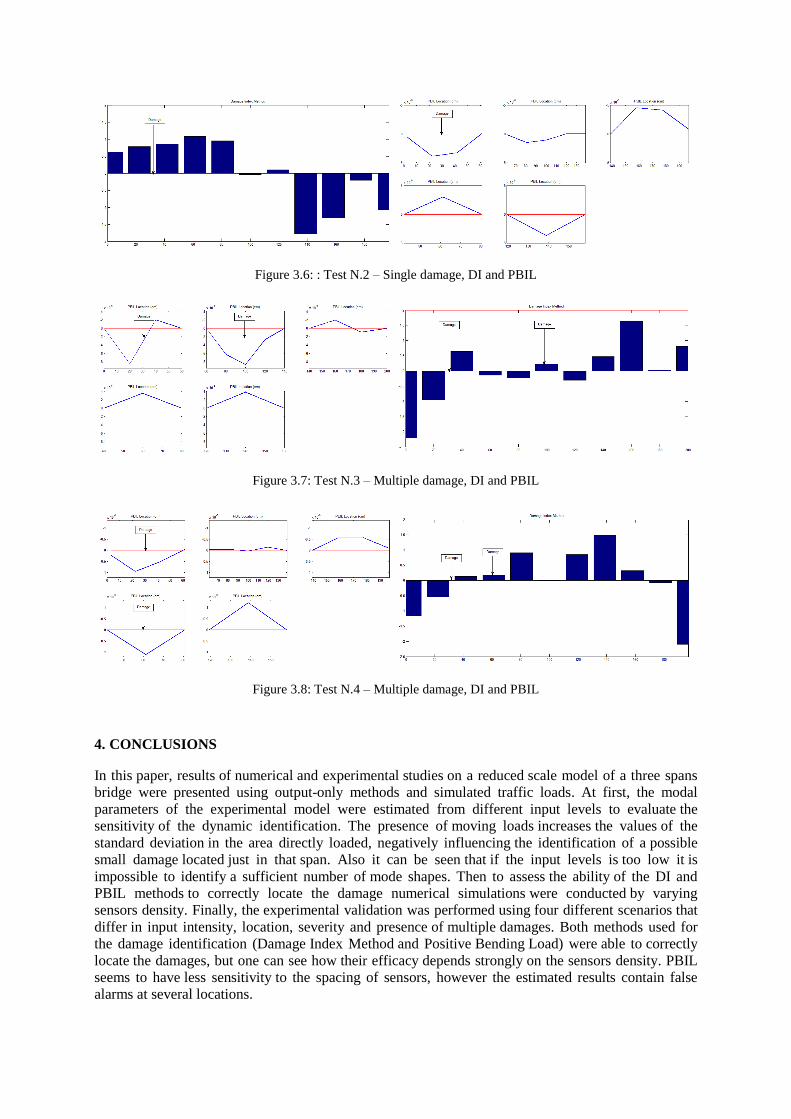
Figure 3.6: : Test N.2 – Single damage, DI and PBIL
Figure 3.7: Test N.3 – Multiple damage, DI and PBIL
Figure 3.8: Test N.4 – Multiple damage, DI and PBIL
4. CONCLUSIONS
In this paper, results of numerical and experimental studies on a reduced scale model of a three spans
bridge were presented using output-only methods and simulated traffic loads. At first, the modal
parameters of the experimental model were estimated from different input levels to evaluate the
sensitivity of the dynamic identification. The presence of moving loads increases the values of the
standard deviation in the area directly loaded, negatively influencing the identification of a possible
small damage located just in that span. Also it can be seen that if the input levels is too low it is
impossible to identify a sufficient number of mode shapes. Then to assess the ability of the DI and
PBIL methods to correctly locate the damage numerical simulations were conducted by varying
sensors density. Finally, the experimental validation was performed using four different scenarios that
differ in input intensity, location, severity and presence of multiple damages. Both methods used for
the damage identification (Damage Index Method and Positive Bending Load) were able to correctly
locate the damages, but one can see how their efficacy depends strongly on the sensors density. PBIL
seems to have less sensitivity to the spacing of sensors, however the estimated results contain false
alarms at several locations.

REFERENCES
Aktan, A.E., Ciloglu, S.K. Grimmelsman, Pan, Q. and Catbas, F.N. (2005). “Opportunities and challenges in
health monitoring of constructed systems by modal analysis” . s.l. : Proc. of the International Conference on
Experimental Vibration Analysis for Civil Engineering Structures, Bordeaux,France
Amaddeo C, Benzoni G, D'Amore E. (2008). Structural health monitoring of a bridge with energy dissipators.
s.l. : Mercea’08 Seismic Engineering International Conference, July 08-11, Prooceedings, MERCEA'08,
Seismic Engineering International Conference, AIP, American Institute of Physics, Reggio Calabria And
Messina, Italy
Amaddeo C, Benzoni G, D'Amore E. (2008).Damage detection algorithm for bridge anti-seismic devices, Cshm-
2 (civil Structure Health Monitoring 2) International Workshop On Wim (weigh In Motion), Taormina,
Italy, September28th-october 1st, 2008, Proceedings, CSHM-2 (Civil Structure Health Monitoring 2)
International Workshop on WIM (Weigh In Motion), Load Capacity, and Bridge Performance in the
Context of Risk Assessment, Maintenance and Life Cost Based Design, Taormina, Italy, September28th-
October 1st, 2008., Taormina, Italy
Bernal, D. (2002). " Load vectors for damage localization". s.l. : Journal of Engineering and Mechanics;
128(1):7–14.
Brincker, R., Krenk, S., Jensen, J.L. (1990). “Estimation of correlation functions by random decrement
technique.”. Lund, Sweden. : Proceedings of Skandinavisk Forum for Stokastisk Mechanik.
Brincker, R., Krenk, S., Jensen, J.L. (1991). “Estimation of correlation functions by random decrement
technique.”. Firenze, Italy : Proceedings of the 9th International Modal Analysis Conference and Exhibit.
Brinker, R. and P. Andersen. (2002). "A way of getting scaled mode shapes in output-only modal testing". s.l. :
21th Modal Analysis Conf. (IMAC XXI), Orlando, FL.
Caicedo, J. M., Dyke, S. J., Johnson, E. A. (2004). “Natural excitation technique and eigensystem realization
algorithm for phase I of the IASC-ASCE benchmark problem: simulated data.”. s.l. : Journal of Engineering
Mechanics, ASCE, 130(1), 49-60.
D'Amore E., Astaneh-asl A, Amaddeo C (2008), System identification of Burbank six-story building using
earthquake data, Merceà08 Seismic Engineering International Conference, 08-11 Luglio
2008, Prooceedings, MERCEA'08, Seismic Engineering International Conference, Reggio Calabria and
Messina, Italy, July 2008, AIP, American Institute of Physics, Reggio Calabria E Messina (USA).
DeCoursey, W.J. (2003). " Statistics and probability for engineering applications" . s.l. : Newnes, USA, 2003.
Farrar, C. R., and James III, G. H. (1997). “System identification from ambient vibration measurements on a
bridge.” . s.l. : Journal of Sound and Vibration, 205 (1),1-18.
Farrar, C.R., Baker, W.E., Bell, T.M., Cone, K.M., Darling, T.W, Duffey, T.A., Eklund, A., and Migliori, A.
(1994). “Dynamic Characterization and Damage Detection in the I-40 Bridge over the Rio Grande”. s.l. :
Los Alamos National Laboratory report LA-12767-M.
James, G. H., Carne, T. G., and Lauffer, J. P. (1993). “The natural excitation technique for modal parameters
extraction from operating wind turbines.” . Sandia National Laboratories, Sandia, NM, USA : Report No.
SAND92-1666, UC-261
Juang, J. N. (1994). "Applied System Identification". Upper Saddle River, NJ : Prentice Hall PTR
Koo, K. Y., Lee, J.J., Yun, C.B., and Brownjohn, J. MW. (2009). Damage Detection in Beam-like Structures
Using Deflections Obtained by Modal Flexibility Matrices. s.l. : Proceedings of the IMAC-XXVII February
9-12, Orlando, Florida USA.
Mufti, A.A. (2001). ” Guidelines for structural health monitoring”. Winnipeg, Manitoba. : ISIS Canada ,The
Canadian Network of Centres on Intelligent Sensing for Innovative Structures, Design Manual No.2, 2001.
Sohn, H., Farrar, C.R., Hemez, F.M., Shunk, D.D., Stinemates D.W., Nadler, B.R., Czarnecki, J.J. 2004. "A
Review of Structural Health Monitoring Literature: 1996–2001" . s.l. : Los Alamos National Laboratory
Report, LA-13976-MS, 2004.
Stubbs, N., Kim, J. T., Farrar, C. R. (1995). Field Verification of a Nondestructive Damage Localization and
Severity Estimation Algorithm . s.l. : Proc. SPIE Vol. 2460, Proceedings of the 13th International Modal
Analysis Conference., p.210.
Wang, M.L., Xu, F.L. and Lloyd, G.M. (2000). "Results and implications of the damage index method applied to
multi-span continuous segmental presstressed concrete bridge". s.l. : Structural Engineering and Mechanics,
10(1):37-51.
Xianfei, He. (2008). “Vibration-Based Damage Identification and Health Monitoring of Civil Structures”.
University of California, San Diego : PhD thesis.
Yun, C.B., Lee, J.J., Koo, K.Y, Lee, J.W., Kim, J.D. (2004). Neural Networks-Based Damage Detection for
Bridges Using Ambient Vibration Data due to Ordinary Traffic Loadings. s.l. : NASCC 2004 Proceedings,
Long Beach CA.


