WAYNESBORO OPERATIONS PLAN · information regarding sampling procedures, data generation and...
188
THE CITY AND BOROUGH OF JUNEAU MENDENHALL WASTEWATER TREATMENT PLANT Permit No.: AK0022951 Operations and Maintenance Plan Prepared by: City and Borough of Juneau Department of Engineering and Public Works Utilities Division-Wastewater 2009 Radcliffe Road Juneau, AK 99801 & CH2M Hill Revisions: May 2006 January 2015 May 2016
Transcript of WAYNESBORO OPERATIONS PLAN · information regarding sampling procedures, data generation and...
THE CITY AND BOROUGH OF JUNEAUMENDENHALL WASTEWATER TREATMENT PLANT
Permit No.: AK0022951
Operations and Maintenance Plan
Prepared by:City and Borough of Juneau
Department of Engineering and Public WorksUtilities Division-Wastewater
2009 Radcliffe RoadJuneau, AK 99801
&CH2M Hill
Revisions:May 2006
January 2015May 2016

MWWTP Operations and Maintenance Plan
TABLE OF CONTENTSA. INTRODUCTION..................................................................................................................................................... 5
A.1 MENDENHALL WWTP 2014 APDES PERMIT LIMITS................................................................................................ 6
B. FACILITY DESCRIPTION .......................................................................................................................................... 8
B.1 PLANT PROCESS ..................................................................................................................................................... 8B.2 PRELIMINARY TREATMENT PROCESS ..................................................................................................................... 9
B.2.1 Grinder and Auger ......................................................................................................................................... 9B.2.2 IPS Wet Well ................................................................................................................................................ 11B.2.3 Grit Removal ................................................................................................................................................ 11
B.3 SECONDARY TREATMENT PROCESS ..................................................................................................................... 13B.3.1 SBR Cycles .................................................................................................................................................... 13
B.4 DISINFECTION ...................................................................................................................................................... 15B.5 DISCHARGE TO RECEIVING WATERS .................................................................................................................... 16B.6 NON-POTABLE WATER SYSTEM ........................................................................................................................... 16B.7 SOLIDS PROCESSING ............................................................................................................................................ 17
B.7.1 SBR Waste Solids.......................................................................................................................................... 17B.7.2 Waste and Thickened Sludge Tank .............................................................................................................. 18B.7.3 Solids Dewatering and Transport................................................................................................................. 18
C. AUTOMATIC CONTROLS ...................................................................................................................................... 20
D. PROCESS CONTROL STRATEGY ............................................................................................................................ 21
E. SAMPLING PLAN.................................................................................................................................................. 22
E.1 SAMPLING PROGRAM DESIGN ............................................................................................................................. 22E.1.1 NPDES Permit Monitoring Locations, Parameters Measured, And Collection Frequencies........................ 23
E.2 SAMPLING METHOD REQUIREMENTS ................................................................................................................. 23E.2.1 Sample Types ............................................................................................................................................... 23E.2.2 Sample Equipment and Containers ............................................................................................................. 24
F. SPILL PREVENTION AND CONTROL ...................................................................................................................... 26
F.1 SPILL PREVENTION ............................................................................................................................................... 26F.1.1 Sludge Storage and Transport...................................................................................................................... 26F.1.2 Polymer Storage .......................................................................................................................................... 27F.1.3 Ancillary Operations .................................................................................................................................... 27F.1.4 Laboratory.................................................................................................................................................... 27
F.2S SPILL AND LEAK RESPONSE................................................................................................................................... 28F.2.1 Sludge .......................................................................................................................................................... 28F.2.2 Polymer........................................................................................................................................................ 28F.2.3 Ancillary Operations .................................................................................................................................... 28F.2.4 Laboratory.................................................................................................................................................... 28
F.3 OPTIMIZATION OF CHEMICAL USAGE .................................................................................................................. 28F.4 PREVENTIVE MAINTENANCE PROGRAM.............................................................................................................. 29F.5 MINIMIZATION OF INDUSTRIAL POLLUTANT INPUTS........................................................................................... 29F.6 PUBLIC EDUCATION AND OUTREACH................................................................................................................... 29F.7 WATER CONSERVATION....................................................................................................................................... 30
MWWTP Operations and Maintenance Plan
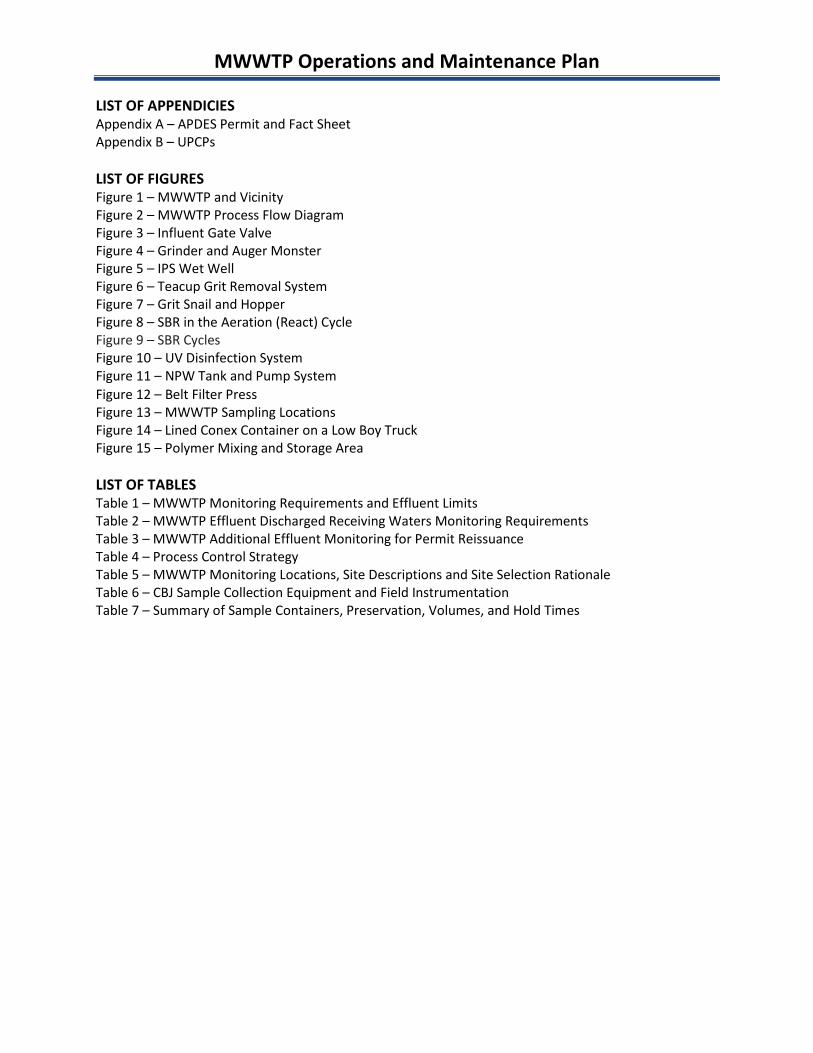
LIST OF APPENDICIESAppendix A – APDES Permit and Fact SheetAppendix B – UPCPs
LIST OF FIGURESFigure 1 – MWWTP and VicinityFigure 2 – MWWTP Process Flow DiagramFigure 3 – Influent Gate ValveFigure 4 – Grinder and Auger MonsterFigure 5 – IPS Wet WellFigure 6 – Teacup Grit Removal SystemFigure 7 – Grit Snail and HopperFigure 8 – SBR in the Aeration (React) CycleFigure 9 – SBR CyclesFigure 10 – UV Disinfection SystemFigure 11 – NPW Tank and Pump SystemFigure 12 – Belt Filter PressFigure 13 – MWWTP Sampling LocationsFigure 14 – Lined Conex Container on a Low Boy TruckFigure 15 – Polymer Mixing and Storage Area
LIST OF TABLESTable 1 – MWWTP Monitoring Requirements and Effluent LimitsTable 2 – MWWTP Effluent Discharged Receiving Waters Monitoring RequirementsTable 3 – MWWTP Additional Effluent Monitoring for Permit ReissuanceTable 4 – Process Control StrategyTable 5 – MWWTP Monitoring Locations, Site Descriptions and Site Selection RationaleTable 6 – CBJ Sample Collection Equipment and Field InstrumentationTable 7 – Summary of Sample Containers, Preservation, Volumes, and Hold Times

MWWTP Operations and Maintenance Plan
Page 5 of 30
A. INTRODUCTION
This Operations and Maintenance Plan (OMP or Plan) is prepared to assist the City and Borough ofJuneau’s (CBJ) Wastewater Treatment staff to properly manage and operate the MendenhallWastewater Treatment plant (MWWTP) and is part of the requirements of the Alaska PollutantDischarge Elimination System (APDES) permit issued for the plant on August 1, 2014 (Appendix A). ThisPlan is not intended to be all inclusive. Operations and maintenance staff members should review andfully understand state regulations, and the design and operations and maintenance manuals provided bythe equipment suppliers for the plant.
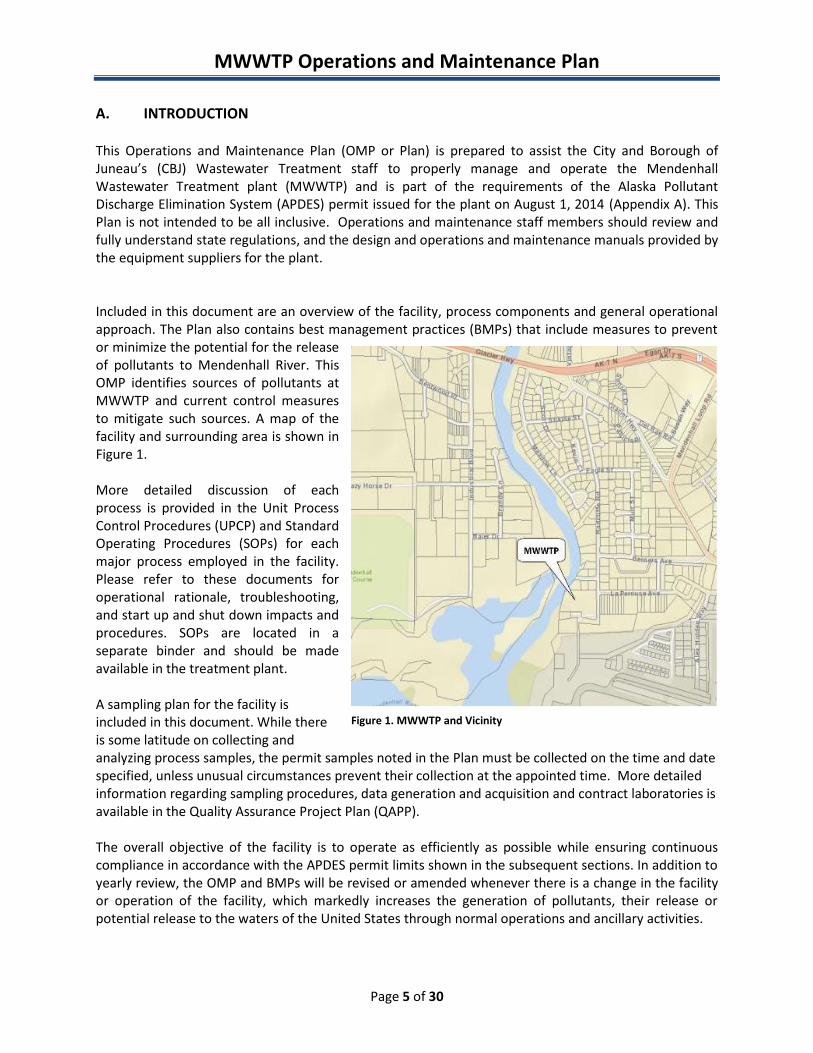
Included in this document are an overview of the facility, process components and general operationalapproach. The Plan also contains best management practices (BMPs) that include measures to preventor minimize the potential for the releaseof pollutants to Mendenhall River. ThisOMP identifies sources of pollutants atMWWTP and current control measuresto mitigate such sources. A map of thefacility and surrounding area is shown inFigure 1.
More detailed discussion of eachprocess is provided in the Unit ProcessControl Procedures (UPCP) and StandardOperating Procedures (SOPs) for eachmajor process employed in the facility.Please refer to these documents foroperational rationale, troubleshooting,and start up and shut down impacts andprocedures. SOPs are located in aseparate binder and should be madeavailable in the treatment plant.
A sampling plan for the facility isincluded in this document. While thereis some latitude on collecting andanalyzing process samples, the permit samples noted in the Plan must be collected on the time and datespecified, unless unusual circumstances prevent their collection at the appointed time. More detailedinformation regarding sampling procedures, data generation and acquisition and contract laboratories isavailable in the Quality Assurance Project Plan (QAPP).
The overall objective of the facility is to operate as efficiently as possible while ensuring continuouscompliance in accordance with the APDES permit limits shown in the subsequent sections. In addition toyearly review, the OMP and BMPs will be revised or amended whenever there is a change in the facilityor operation of the facility, which markedly increases the generation of pollutants, their release orpotential release to the waters of the United States through normal operations and ancillary activities.
Figure 1. MWWTP and Vicinity
MWWTP Operations and Maintenance Plan
Page 6 of 30
A.1 MENDENHALL WWTP 2014 APDES PERMIT LIMITS
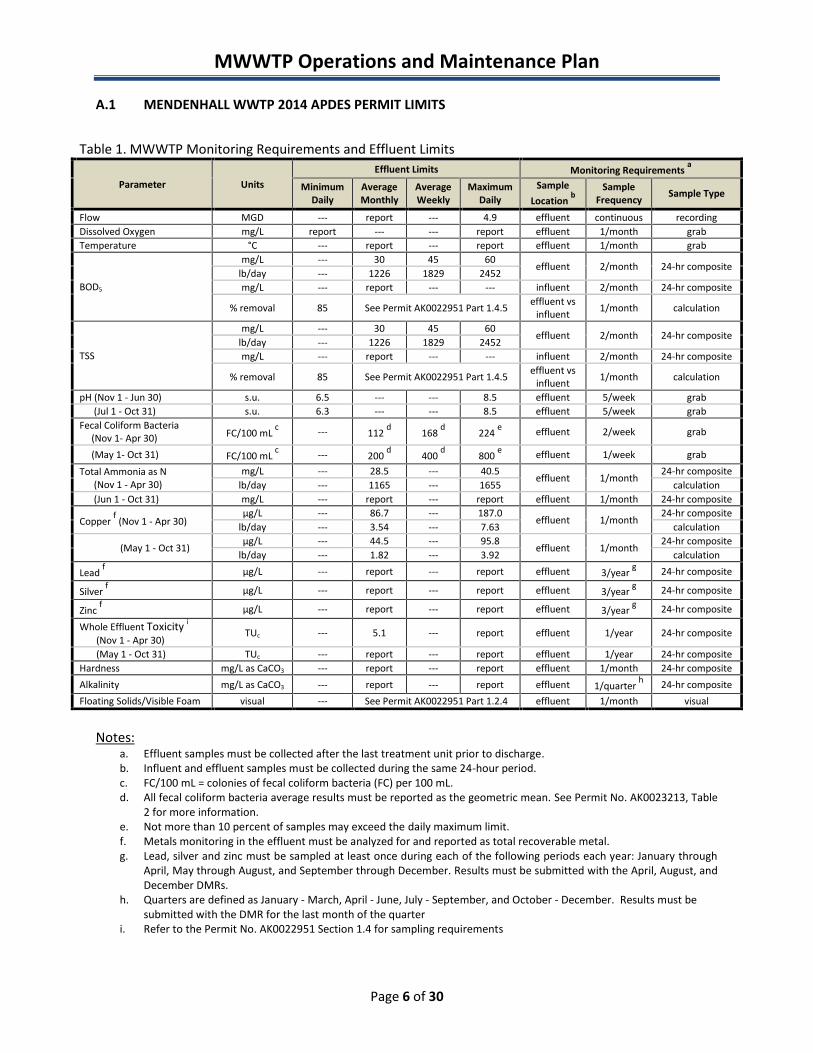
Table 1. MWWTP Monitoring Requirements and Effluent Limits
Parameter UnitsEffluent Limits Monitoring Requirements a
MinimumDaily
AverageMonthly
AverageWeekly
MaximumDaily
SampleLocation b
SampleFrequency Sample Type
Flow MGD --- report --- 4.9 effluent continuous recordingDissolved Oxygen mg/L report --- --- report effluent 1/month grabTemperature °C --- report --- report effluent 1/month grab
BOD5
mg/L --- 30 45 60effluent 2/month 24-hr composite
lb/day --- 1226 1829 2452mg/L --- report --- --- influent 2/month 24-hr composite
% removal 85 See Permit AK0022951 Part 1.4.5 effluent vsinfluent 1/month calculation
TSS
mg/L --- 30 45 60effluent 2/month 24-hr composite
lb/day --- 1226 1829 2452mg/L --- report --- --- influent 2/month 24-hr composite
% removal 85 See Permit AK0022951 Part 1.4.5 effluent vsinfluent 1/month calculation
pH (Nov 1 - Jun 30) s.u. 6.5 --- --- 8.5 effluent 5/week grab(Jul 1 - Oct 31) s.u. 6.3 --- --- 8.5 effluent 5/week grab
Fecal Coliform Bacteria(Nov 1- Apr 30) FC/100 mL c --- 112 d 168 d 224 e effluent 2/week grab
(May 1- Oct 31) FC/100 mL c --- 200 d 400 d 800 e effluent 1/week grabTotal Ammonia as N
(Nov 1 - Apr 30)mg/L --- 28.5 --- 40.5
effluent 1/month24-hr composite
lb/day --- 1165 --- 1655 calculation(Jun 1 - Oct 31) mg/L --- report --- report effluent 1/month 24-hr composite
Copper f (Nov 1 - Apr 30)µg/L --- 86.7 --- 187.0
effluent 1/month24-hr composite
lb/day --- 3.54 --- 7.63 calculation
(May 1 - Oct 31)µg/L --- 44.5 --- 95.8
effluent 1/month24-hr composite
lb/day --- 1.82 --- 3.92 calculation
Lead f µg/L --- report --- report effluent 3/year g 24-hr composite
Silver f µg/L --- report --- report effluent 3/year g 24-hr composite
Zinc f µg/L --- report --- report effluent 3/year g 24-hr composite
Whole Effluent Toxicity i
(Nov 1 - Apr 30)TUc --- 5.1 --- report effluent 1/year 24-hr composite
(May 1 - Oct 31) TUc --- report --- report effluent 1/year 24-hr compositeHardness mg/L as CaCO3 --- report --- report effluent 1/month 24-hr compositeAlkalinity mg/L as CaCO3 --- report --- report effluent 1/quarter h 24-hr compositeFloating Solids/Visible Foam visual --- See Permit AK0022951 Part 1.2.4 effluent 1/month visual
Notes:a. Effluent samples must be collected after the last treatment unit prior to discharge.b. Influent and effluent samples must be collected during the same 24-hour period.c. FC/100 mL = colonies of fecal coliform bacteria (FC) per 100 mL.d. All fecal coliform bacteria average results must be reported as the geometric mean. See Permit No. AK0023213, Table
2 for more information.e. Not more than 10 percent of samples may exceed the daily maximum limit.f. Metals monitoring in the effluent must be analyzed for and reported as total recoverable metal.g. Lead, silver and zinc must be sampled at least once during each of the following periods each year: January through
April, May through August, and September through December. Results must be submitted with the April, August, andDecember DMRs.
h. Quarters are defined as January - March, April - June, July - September, and October - December. Results must besubmitted with the DMR for the last month of the quarter
i. Refer to the Permit No. AK0022951 Section 1.4 for sampling requirements

MWWTP Operations and Maintenance Plan
Page 7 of 30
Table 2. MWWTP Effluent Discharged Receiving Waters Monitoring Requirements
Parameter Units Sampling Location SamplingFrequency
SampleType
ReportingLimit
Temperature oC upstream and downstream 1/month grab ---
Fecal coliform a FC/100 mL upstream and downstream 1/month grab 1.0
Total Ammonia as N mg/L upstream and downstream 4/year b grab 0.05pH s.u. upstream and downstream 1/month grab ---
Copper c µg/L upstream and downstream 2/year d grab 2.0
Lead c µg/L upstream 2/year d grab 2.0Hardness mg/L as CaCO3 upstream and downstream 1/month grab 10Dissolved oxygen mg/L upstream and downstream 1/month grab ---Alkalinity mg/L as CaCO3 upstream 1/month grab 10
Notes:a. All mixing zone fecal coliform bacteria average results must be reported as geometric means. See Permit No.
AK0023213, Table 2 for more information.b. Sampling must occur at least twice during each of the following time periods: November through April; and May
through October.c. Analysis values for copper and lead must be as dissolved metal.d. Sampling must occur at least once during each of the following: May 1 through October 31; and November 1 through
April 30.
Table 3. MWWTP Additional Effluent Monitoring for Permit ReissuanceParameter Units Sample Location Sample Frequency Sample Type
Total Ammonia as N mg/L effluent 3x/4.5 years 24-hr compositeDissolved Oxygen mg/L effluent 3x/4.5 years grabNitrate Plus Nitrite Nitrogen mg/L effluent 3x/4.5 years 24-hr compositeTotal Kjeldahl Nitrogen mg/L effluent 3x/4.5 years 24-hr compositeOil and Grease mg/L effluent 3x/4.5 years grabTotal Phosphorous mg/L effluent 3x/4.5 years 24-hr compositeTotal Dissolved Solids mg/L effluent 3x/4.5 years 24-hr compositeExpanded Effluent Testing varies effluent 3x/4.5 years ---
MWWTP Operations and Maintenance Plan
Page 8 of 30
B. FACILITY DESCRIPTION
The Mendenhall Wastewater Treatment Plant is a Level III, 4.9 MG daily maximum, activated sludgefacility utilizing sequencing batch reactor (SBR) technology. This facility is designed to treat domesticwastewater from the City and Borough of Juneau community.
The MWWTP is open six days a week, Monday through Saturday, and has at least two operators on staffduring business hours. During business hours, there must always be at least one Level III licensedoperator on staff to oversee plant operations. During off hours or non-business days, an on-call operatormakes daily rounds and is the primary contact for emergencies. The plant’s SCADA system alerts the on-call operator of any issues occurring after hours.
This section discusses the basic purpose of each process in the plant, which primary process units orequipment is implemented and identifies potential sources of pollution to the receiving waters. Moredetailed operating parameters are shown in the Process Control Strategy (Section C), UPCPs (AppendixB) and SOPs.
B.1 PLANT PROCESS
Figure 2 demonstrates the flow of wastewater and solids handling for the MWWTP. Wastewater entersthe facility via the influent pump station (IPS). Debris is removed in the headworks by a grinder andauger equipment, followed by centrifugal grit removal. A combination of five pumps then transfers theraw water to the grit removal system. Influent then flows to the SBR tanks for biological treatment.Normal operating conditions only require that seven SBRs be operated due to the hydraulic ratiosloading on the facility. Supernatant is then decanted and disinfected by UV light before final dischargeinto Mendenhall River. Solids are pumped to one of two holding tanks before being dewatered anddisposed.
The following sections will discuss the various stages and their purpose at MWWTP: Preliminary Treatment-Grinder/Auger, Grit Removal Secondary Treatment- SBR Aeration, Settling, Decant Disinfection Side Streams Solids Handling

MWWTP Operations and Maintenance Plan
Page 9 of 30
Influent
OregonLandfill
GrinderIPS Wet Well
UV Disinfection
Belt Filter Press
Sludge Shipping Container
Solids Wasting
Liquid Effluent
Headworks BiologicalTreatment
Solids Handling
SolidsDisposal
TeaCups
SBR 1
SBR 2 SBR 6
SBR 4
SBR 5
SBR 8
SBR 7SBR 3
Standby
Discharge toMendenhall River
FiltrateWaste Sludge Tank
Thickened Sludge Tank
Figure 2. MWWTP Process Flow Diagram
B.2 PRELIMINARY TREATMENT PROCESS
Upon entering the treatment plant, raw influent begins preliminary treatment. The preliminarytreatment process occurs at the headworks and consists of grinding/auger screening and grit removal toeliminate any large, undesirable material that can wear down equipment and hinder the overalltreatment process.
Flow may be redirected at any point during preliminary treatment. Should the grinder/auger be offline,flow may be redirected to a manually-cleaned bar rack without any interruption to the influent flow tosecondary treatment.
B.2.1 Grinder and Auger
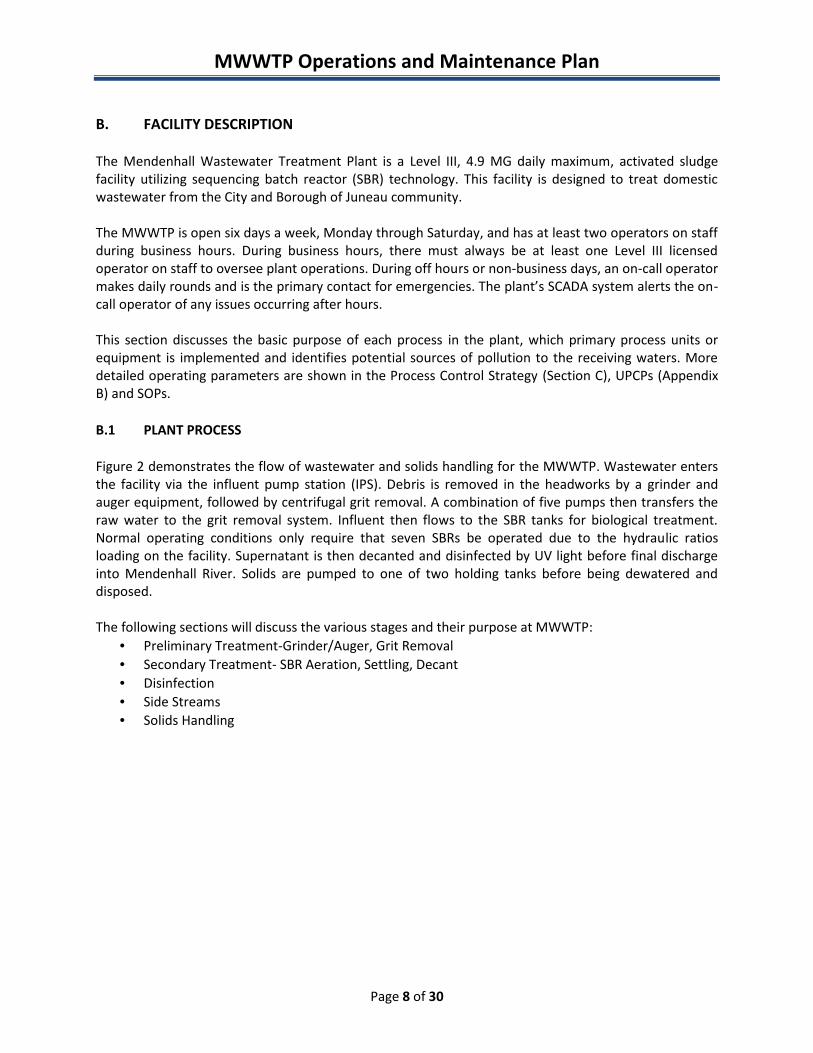
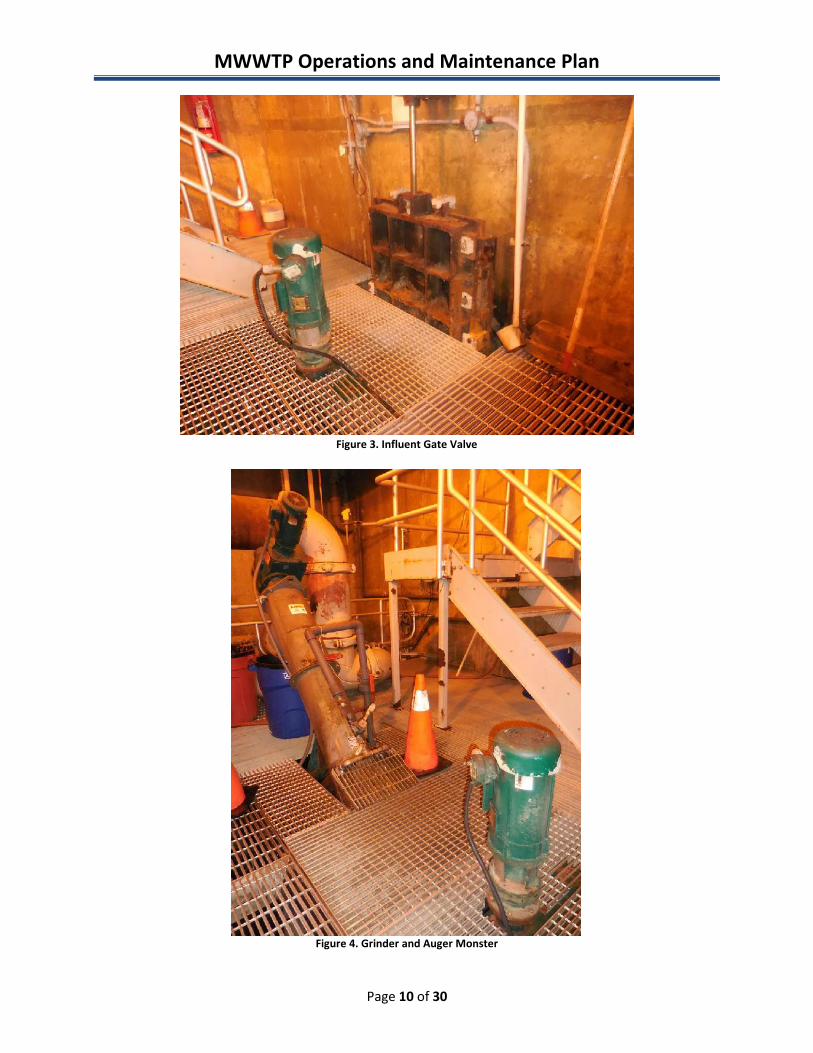
Wastewater enters the influent pump station (IPS) by gravity through a pair of 30” gate valves intoindividual channels (Figure 3). It then gravity flows through the main channel into a grinder and JWCAuger Monster where debris is shredded, washed and screened (Figure 4) out of the influent. Materialcollected by the auger is deposited to a trash receptacle for disposal to a landfill.
The influent flow may be bypassed through the secondary channel, which employs a manual bar rack, toallow for maintenance to the Auger Monster without interruption of influent flow to the wet well.
MWWTP Operations and Maintenance Plan
Page 10 of 30
Figure 3. Influent Gate Valve
Figure 4. Grinder and Auger Monster

MWWTP Operations and Maintenance Plan
Page 11 of 30
B.2.2 IPS Wet Well
Immediately following screening, wastewater flows by gravity into the IPS wet well (Figure 5). The IPSis equipped with five submersible pumps, each of which is capable of 2100 GPM (at 64 ft. TDH). Thepumps are controlled automatically to activate/ deactivate as the liquid level in the wet well rises/falls.This type of operation allows the pump station to accommodate the wide variations in influent flowrates. During normal operation, the influent pumps operate in Automatic mode. In Manual Mode, theoperating sequence of the pumps can be selected by the operator.
Figure 5. IPS Wet Well
B.2.3 Grit Removal
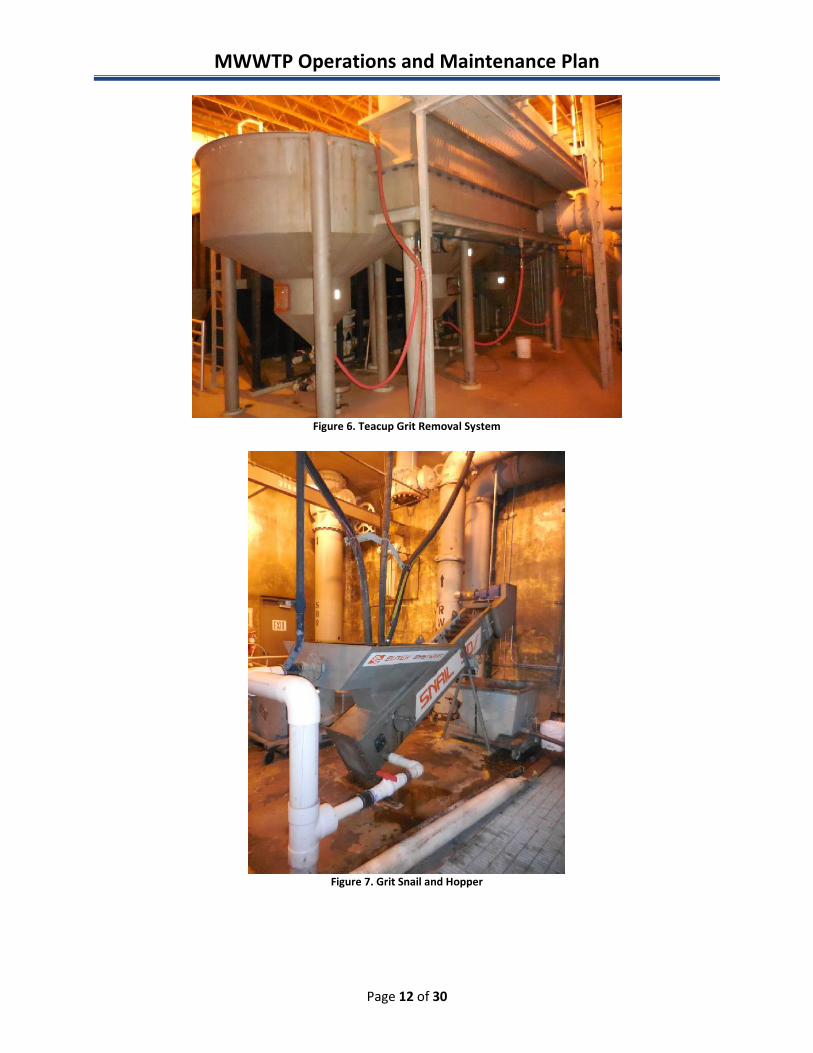
Fluid from the wet well is pumped to the grit chamber head box at an approximate elevation of 52.0 ftto a splitter box where it goes through three centrifugal grit separator vessels (Tea Cups) and isconcentrated into slurry (Figure 6). The concentrate then drops down to the main floor level where itenters a clarifier and conveyor (Grit Snail) where it is dewatered and conveyed into a hopper for landfilldisposal (Figure 7). The influent flow is monitored continuously through two flow meters.
MWWTP Operations and Maintenance Plan
Page 12 of 30
Figure 6. Teacup Grit Removal System
Figure 7. Grit Snail and Hopper
MWWTP Operations and Maintenance Plan
Page 13 of 30
B.3 SECONDARY TREATMENT PROCESS
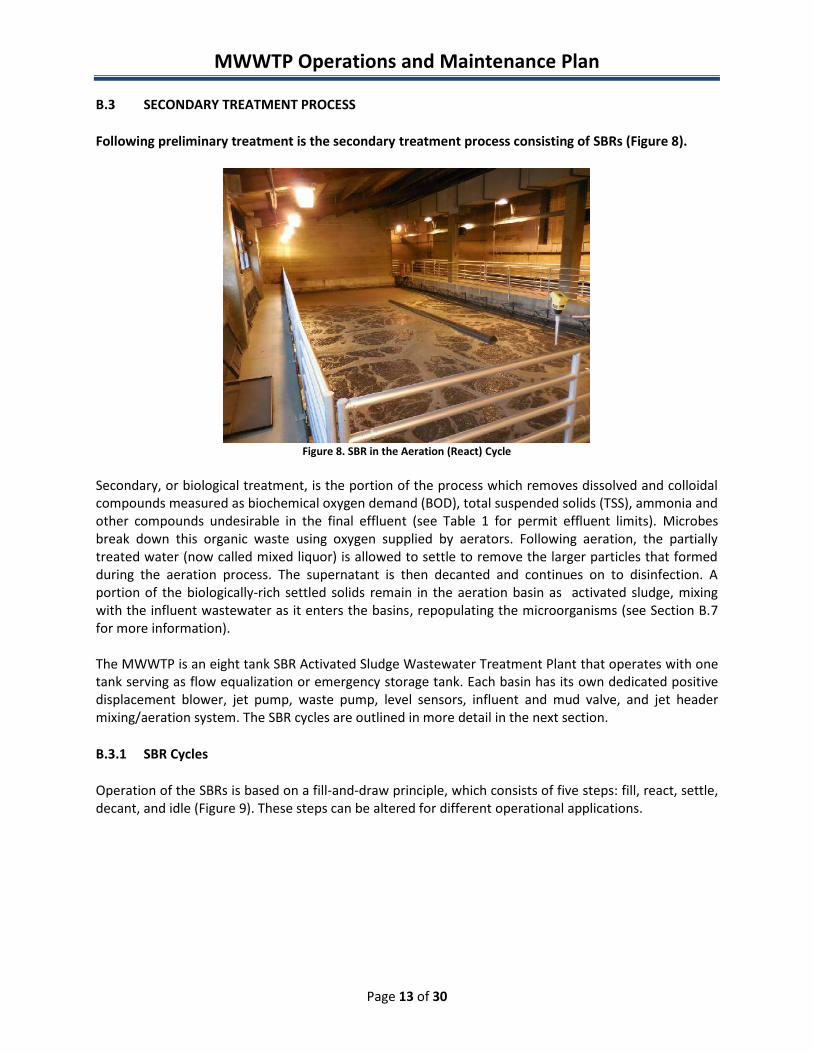
Following preliminary treatment is the secondary treatment process consisting of SBRs (Figure 8).
Figure 8. SBR in the Aeration (React) Cycle
Secondary, or biological treatment, is the portion of the process which removes dissolved and colloidalcompounds measured as biochemical oxygen demand (BOD), total suspended solids (TSS), ammonia andother compounds undesirable in the final effluent (see Table 1 for permit effluent limits). Microbesbreak down this organic waste using oxygen supplied by aerators. Following aeration, the partiallytreated water (now called mixed liquor) is allowed to settle to remove the larger particles that formedduring the aeration process. The supernatant is then decanted and continues on to disinfection. Aportion of the biologically-rich settled solids remain in the aeration basin as activated sludge, mixingwith the influent wastewater as it enters the basins, repopulating the microorganisms (see Section B.7for more information).
The MWWTP is an eight tank SBR Activated Sludge Wastewater Treatment Plant that operates with onetank serving as flow equalization or emergency storage tank. Each basin has its own dedicated positivedisplacement blower, jet pump, waste pump, level sensors, influent and mud valve, and jet headermixing/aeration system. The SBR cycles are outlined in more detail in the next section.
B.3.1 SBR Cycles
Operation of the SBRs is based on a fill-and-draw principle, which consists of five steps: fill, react, settle,decant, and idle (Figure 9). These steps can be altered for different operational applications.

MWWTP Operations and Maintenance Plan
Page 14 of 30
Figure 9. SBR Cycles
Fill – During the fill cycle, the basin receives influent wastewater. The influent flow brings food to themicrobes in the activated sludge, creating an environment for biochemical reactions to take place.Mixing and aeration can be varied during the fill cycle to create the following three different scenarios:
Static Fill – Under a static-fill scenario, there is no mixing or aeration while the influentwastewater is entering the tank. Static fill can be used when there is no need to nitrify ordenitrify, and during low flow periods to save power. Because the jet pumps and aeratorsremain off, this scenario has an energy-saving component.
Mixed Fill – Under a mixed-fill scenario, the jet pumps are active, but the blowers remain off.The mixing action produces a uniform blend of influent wastewater and biomass. Because thereis no aeration, an anoxic condition is present, which promotes denitrification. Anaerobicconditions can also be achieved during the mixed-fill cycle. Under anaerobic conditions thebiomass undergoes a release of phosphorous. This release is reabsorbed by the biomass onceaerobic conditions are reestablished. This phosphorous release will not happen with anoxicconditions.
Aerated Fill – Under an aerated-fill scenario, both the aerators and the jet pump are activated.The contents of the basin are aerated to convert the anoxic or anaerobic zone over to an aerobiczone. No adjustments to the aerated-fill cycle are needed to reduce organics and achievenitrification. However, to achieve denitrification, it is necessary to switch the oxygen off topromote anoxic conditions for denitrification. By switching the oxygen on and off during thiscycle with the blowers, anoxic conditions are created, allowing for nitrification anddenitrification. Dissolved oxygen (DO) should be monitored during this cycle so it does not goover 0.2 mg/L. This ensures that an anoxic condition will occur during the idle cycle.

MWWTP Operations and Maintenance Plan
Page 15 of 30
React – This cycle allows for further reduction or "polishing" of wastewater parameters. During thiscycle, no wastewater enters the basin and the mechanical mixing and aeration units are on. Becausethere are no additional volume and organic loadings, the rate of organic removal increases dramatically.
Most of the carbonaceous biochemical oxygen demand (BOD) removal occurs in the react cycle. Furthernitrification occurs by allowing the mixing and aeration to continue—the majority of denitrification takesplace in the mixed-fill cycle. The phosphorus released during mixed fill, plus some additionalphosphorus, is taken up during the react cycle.
Settle – During this cycle, activated sludge is allowed to settle under quiescent conditions—no flowenters the basin and no aeration or mixing takes place. The activated sludge tends to settle as aflocculent mass, forming a distinctive interface with the clear supernatant. The sludge mass is called thesludge blanket. This cycle is a critical part of the treatment process because if the solids do not settlerapidly, some sludge can be drawn off during the subsequent decant cycle and thereby degrade effluentquality.
Decant – During this cycle, a decanter is used to remove the clear supernatant effluent. Once the settlecycle is complete, a signal is sent to the decanter actuator to initiate the opening of an effluent-discharge valve. The floating decanter maintains the inlet orifice slightly below the water surface tominimize the removal of solids in the effluent removed during the decant cycle. It is optimal that thedecanted volume is the same as the volume that enters the basin during the fill cycle. It is also importantthat no surface foam or scum is decanted. The vertical distance from the decanter to the bottom of thetank should be maximized to avoid disturbing the settled biomass.
Wasting/Idle – This step occurs between the decant and the fill cycles. The time varies, based on theinfluent flow rate and the operating strategy. During this cycle, a small amount of activated sludge at thebottom of the SBR basin is pumped out—a process called wasting. Sludge wasting should occur duringthe idle cycle to provide the highest concentration of mixed liquor suspended solids (MLSS). The plantshould be operated on pounds of MLSS and not concentration.
Sludge from the SBR basins is wasted to a holding tank for future processing and disposal. The sludge-holding-tank capacity is not sized for extended storage of the wasted sludge and should be processeddaily to allow room for additional wasting.
B.4 DISINFECTION
Disinfection of the secondary effluent is accomplished with an ultraviolet (UV) system. The high intensitylight deactivates pathogenic bacteria, viruses or protozoa which may still be present after secondarybiological treatment. This is the final step of water treatment in the system before discharging intoMendenhall River.
The Mendenhall UV 3000 system consists of three banks of 24 modules each (Figure 10). Each modulehas eight lamps and sleeves. Lamps are cleaned at a rate of one bank each week, thus the lamp cleaningfrequency is once every three weeks. This system may be manually or automatically controlled toincrease or decrease UV intensity, hydraulic detention time as indicated by flow rate, effluent quality,and actual bulb intensity.

MWWTP Operations and Maintenance Plan
Page 16 of 30
Figure 10. UV Disinfection System
The MWWTP converted its chlorine and sulfur dioxide disinfection system because of changingregulations and public safety concerns. As a result, UV disinfection became the choice for wastewaterdisinfection due to some significant advantages over chlorine-based disinfection. Specifically, UV hasbeen proven effective in various types of effluent, requires less maintenance, non-hazardous and is cost-effective.
B.5 DISCHARGE TO RECEIVING WATERS
The fully treated final effluent flows from the UV Disinfection room by gravity to an outfall pipelineflowing into Mendenhall River. Information regarding the mixing zone and sampling requirements inMendenhall River can be found in Section E.
B.6 NON-POTABLE WATER SYSTEM
The Non-Potable Water (NPW) system is a side-stream system used throughout the treatment plant,most notably for the belt filter press (BFP). Treated effluent is collected by a splitter box in the UVchannel and redirected to one of the two 113,883 gallon storage tanks. Turbine pumps transfer theNPW from the storage tanks to a contact chamber, where it is disinfected by chlorination. A 2,422gallon pneumatic tank located in the NPW supply room (Figure 11) holds the treated NPW for usearound the plant. An air compressor in the same room keeps the tank pressurized. A 6" diameter pipecarries NPW from the pneumatic tank to the SBR facility and BFP.

MWWTP Operations and Maintenance Plan
Page 17 of 30
Figure 11. NPW Tank and Pump System
B.7 SOLIDS PROCESSING
The solids handling process includes: SBR Waste Solids Waste and Thickened Sludge Tank Solids Dewatering and Transport
B.7.1 SBR Waste Solids
Once the mixed liquor has settled, a small volume of activated sludge is pumped out, or wasted, fromthe SBRs. The waste activated sludge (WAS) removal system is one of the most important processcontrol tools for an activated sludge treatment plant. Sludge wasting from the basins regulates themicroorganism population in the aeration basins, effectively controlling treatment. The volume of WASto be removed depends on the solids concentration target, which is based on the solids retention time(SRT) calculations for the day as well as the food (influent) to microorganism ratio (F/M). Sludge iswasted only when necessary based on calculations (see section B.7.1.1 for more detail).
To remove WAS from the basins, sludge is drawn through the influent distribution/sludge collectionmanifold (ID/SC) at the base of the tank. Waste sludge pumps are activated, and the WAS is transportedto the WAS holding tank.
B.7.1.1 SBR Sludge Wasting Rates
The wasting rate is the primary control in the activated sludge process as it determines the health of thebiological population and sludge yield. The MWWTP design loading indicates a concentration of 2,200mg/l MLSS, an F/M of .15 - .30 and a SRT of 7.5 days.
To calculate the pounds to waste per day, a modified version of SRT is applied and is as follows:

MWWTP Operations and Maintenance Plan
Page 18 of 30
Pounds per day to waste = (7cells)(0.311650 MG/cell)(average MLSS)(8.34)Desired SRT
Gallons per day to waste = (Pounds per day to waste)(1000000)(WASSS)(8.34lbs/gal)
Minutes per cycle to waste = ___________Gallons per day to waste_____________(# of SBR cycles per daily wasting period)(1200 gal/min)
B.7.2 Waste and Thickened Sludge Tank
Beneath the blower room are two 178,000 gallon storage tanks: the waste and thickened sludge tanks.During the SBR wasting cycle, the centrifugal WAS pump will transfer solids from the basins to the wastesludge tank. WAS is then transferred to the thickened sludge tank for holding until dewatering.
Each tank has its own continuously operated jet aeration pump, with controls located in the blowerroom. Waste sludge flow into the waste sludge tank is monitored by two Polysonics Model LCDT singlehead doppler ultrasonic flow meters. Thickened sludge flow going to the belt filter press is monitoredby a 4" MAG Meter. These three meters transmit 4 to 20 mA signals to the PLC, and flow information isdisplayed on both the control panel and on the IDT screens. Actual flows are presented on the controlpanel on analog gauges, while IDT screens provide digital readouts of actual and total flows.
B.7.3 Solids Dewatering and Transport
The purpose of sludge dewatering is to remove as much as water from the sludge as possible bycapturing the solids in the dry cake and minimizing the return solids to the liquid treatment process. Thisreduces the total volume and cost of material to be disposed of by hauling.
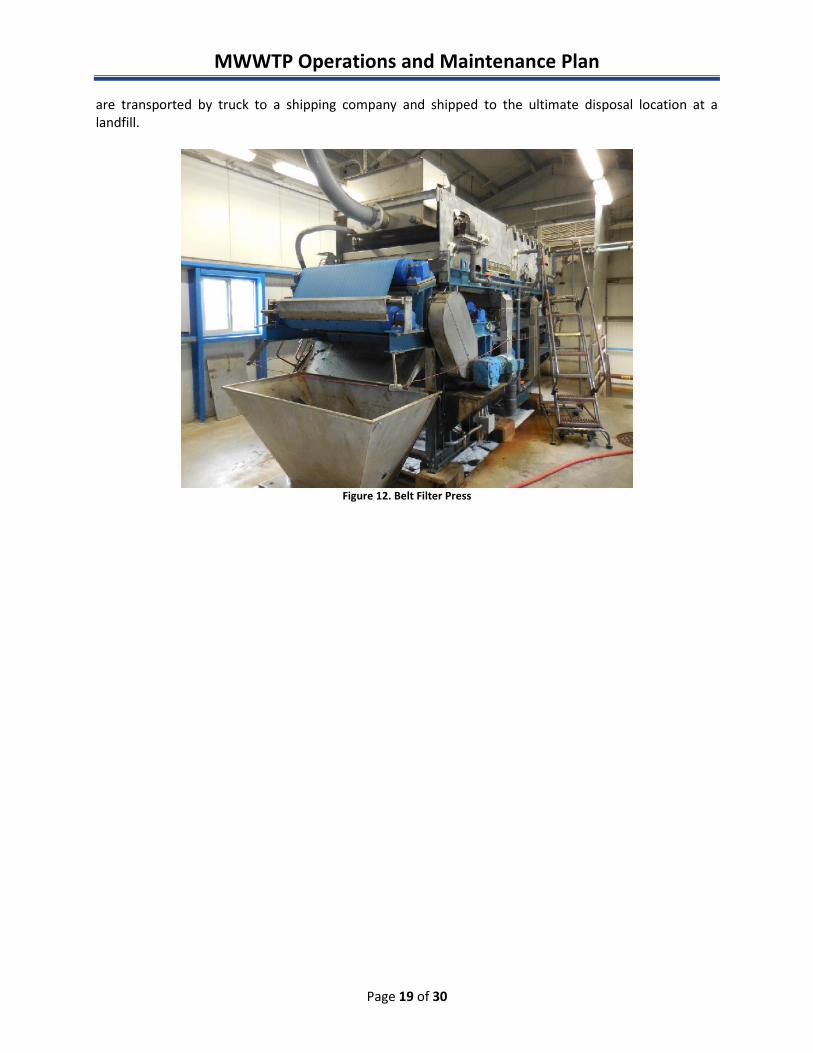
The belt filter press (BFP) is used for dewatering solids from the thickened sludge tank an average of 6days per week (Figure 12). Aerated sludge is withdrawn from the thickened sludge tank by a variablespeed, progressive cavity feed pump. The sludge is mixed with a cationic polymer upstream of the BFPusing a venture tube apparatus, which facilitates mixing. Emulsion polymer is used to flocculate thesludge in a step known as conditioning, whereby the polymer pulls solids particles together releasingfree water that is then drained away. Polymer is dosed manually by the operator.
Dewatering consists of two phases: draining and pressurization. The flocculated sludge is firstdistributed across a gravity belt which drains nearly all the free water as it moves. Plows on the gravitybelt help the sludge turn over, which allows more free water to drain away. Sludge is then directedbetween a top and bottom belt and continues through a series of rollers which squeeze the remainingwater from the sludge to produce a dewatered cake that is between 10 and 20 percent solids. Belts arecontinuously washed with non-potable water (NPW) while the equipment is running. Belt speed, sludgeflow rate and polymer feed rate are all controlled manually by the operator.
The free water removed from the gravity and pressurized belts (filtrate) drains to a sump beneath theBFP Building and returns to the headworks by gravity. The cake is discharged through a chute into aplastic lined, 4,800 gallon metal Conex container, custom designed for intermodal shipping. Containers
MWWTP Operations and Maintenance Plan
Page 19 of 30
are transported by truck to a shipping company and shipped to the ultimate disposal location at alandfill.
Figure 12. Belt Filter Press
MWWTP Operations and Maintenance Plan
Page 20 of 30
C. AUTOMATIC CONTROLS
Access to the control system is through a graphical computer interface Supervisory Control And DataAcquisition (SCADA) system running on a dedicated pair of PCs. One PC functions as the principal controlinterface and the second, as a “hot backup” and ancillary terminal. This enables process adjustmentsand logging data/trends of levels and alarms. Operator adjustable process variables are accessiblethrough the computer interface. The interface also enables access to logged information on DO levels,tank levels, alarms, hour meter readings, elapsed step times, pump and blower running status, etc. Thelevels in the reactors, IPS, and sludge holding tanks are monitored by level sensors mounted in eachtank. Influent and effluent flowmeters monitor the flow through the plant.
The control system can be accessed from virtually anywhere in the world using a remote computer,software and electrical communication access. By this method the operator and support personnel canremotely adjust process variables, check plant status and operational trends. This is particularly usefulfor alarm 'call outs' so the operator can check the nature of the call and determine before leaving home,the type of response required. Also if the operator is away for a period of time, the operator canmonitor plant status and adjust process settings from anywhere in the world. The data acquisition isparticularly useful for troubleshooting the plant. The system also incorporates an auto-dialer for alarmconditions while the plant is unmanned.
The control system interacts with field devices and equipment through a programmable logic controller(PLC). A PLC consists of two basic sections: the central processing unit (CPU) and the input/outputinterface system. The CPU controls all PLC activity and the input/output system is physically connectedto field devices (e.g., actuators, level sensors, pumps, blowers, etc.) and provides the interface betweenthe CPU and the information providers (inputs) and controllable devices (outputs).
To operate, the CPU "reads" input data from connected field devices through the use of its inputinterfaces, and then performs the control program that is stored in its memory system. Programs arecreated in ladder logic, a language that closely resembles a wiring schematic, and are entered into theCPU's memory prior to operation. Finally, based on the program, the PLC updates output devices via theoutput interfaces. This process continues in the same sequence without interruption, and changes onlywhen a change is made to the control program.
MWWTP Operations and Maintenance Plan
Page 21 of 30
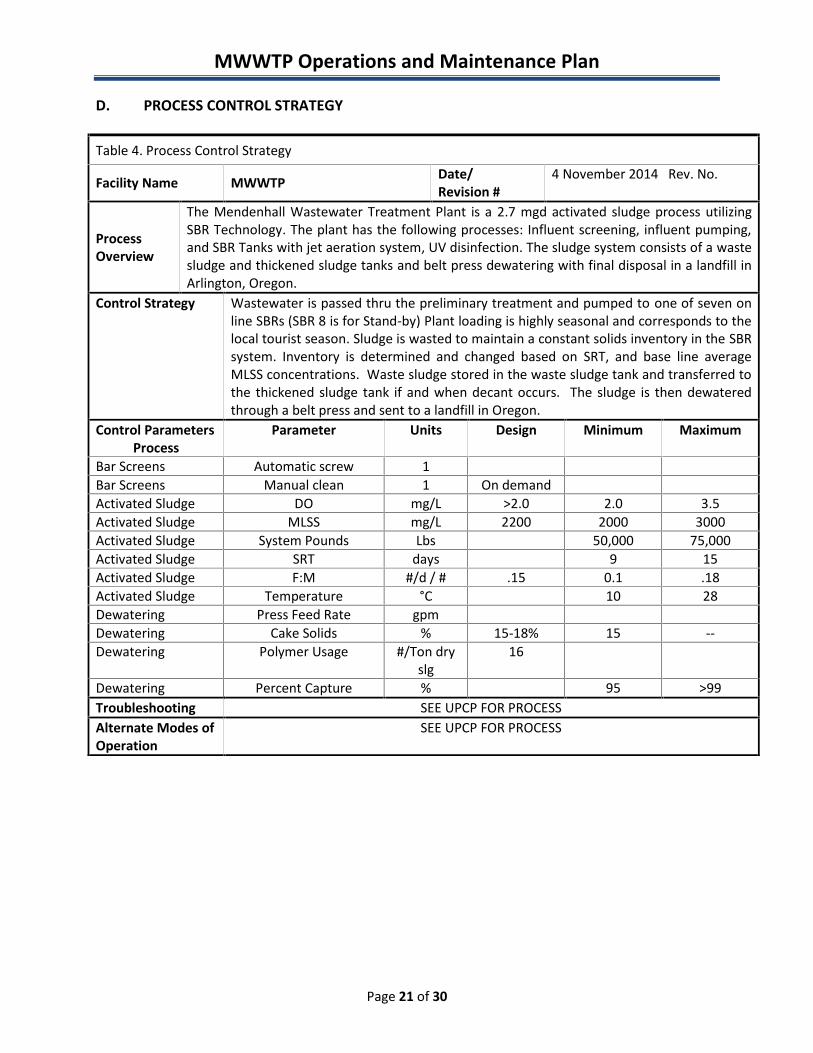
D. PROCESS CONTROL STRATEGY
Table 4. Process Control Strategy
Facility Name MWWTP Date/Revision #
4 November 2014 Rev. No.
ProcessOverview
The Mendenhall Wastewater Treatment Plant is a 2.7 mgd activated sludge process utilizingSBR Technology. The plant has the following processes: Influent screening, influent pumping,and SBR Tanks with jet aeration system, UV disinfection. The sludge system consists of a wastesludge and thickened sludge tanks and belt press dewatering with final disposal in a landfill inArlington, Oregon.
Control Strategy Wastewater is passed thru the preliminary treatment and pumped to one of seven online SBRs (SBR 8 is for Stand-by) Plant loading is highly seasonal and corresponds to thelocal tourist season. Sludge is wasted to maintain a constant solids inventory in the SBRsystem. Inventory is determined and changed based on SRT, and base line averageMLSS concentrations. Waste sludge stored in the waste sludge tank and transferred tothe thickened sludge tank if and when decant occurs. The sludge is then dewateredthrough a belt press and sent to a landfill in Oregon.
Control ParametersProcess
Parameter Units Design Minimum Maximum
Bar Screens Automatic screw 1Bar Screens Manual clean 1 On demandActivated Sludge DO mg/L >2.0 2.0 3.5Activated Sludge MLSS mg/L 2200 2000 3000Activated Sludge System Pounds Lbs 50,000 75,000Activated Sludge SRT days 9 15Activated Sludge F:M #/d / # .15 0.1 .18Activated Sludge Temperature °C 10 28Dewatering Press Feed Rate gpmDewatering Cake Solids % 15-18% 15 --Dewatering Polymer Usage #/Ton dry
slg16
Dewatering Percent Capture % 95 >99Troubleshooting SEE UPCP FOR PROCESSAlternate Modes ofOperation
SEE UPCP FOR PROCESS

MWWTP Operations and Maintenance Plan
Page 22 of 30
E. SAMPLING PLAN
This section is supplemental to the CBJ Quality Assurance Project Plan (QAPP) and does not replace orshould not be mistaken for the actual QAPP in use for CBJ.
Proper sampling is required to determine the efficiency of the process, to meet CBJ standards and tocomply with State and Federal Law. Primary sampling locations are shown in Figure 13 and the samplingschedule is shown in Table 1. All sampling points are labeled to clearly identify where the sample is to becollected. Monitoring locations, sampling equipment and holding times are discussed in the subsequentsections.
Figure 13. MWWTP Sampling Locations
E.1 SAMPLING PROGRAM DESIGN
Sample collection locations, required sampling parameters, and frequency of collection are specified inthe MWWTP APDES Permit AK0022951. Receiving water sample collection locations have beenindicated on Figure 13 and described in Table 5 below. Influent and effluent are sampled at the locations
MWWTP Operations and Maintenance Plan
Page 23 of 30
described in Table 5. Sampling parameters and collection frequencies have been summarized in Tables1, 2, and 3.
Influent samples assess the chemical/physical characteristics of wastewater entering theMWWTP and are used to calculate the percent removal for BOD and TSS (as compared to theeffluent sample results).
Effluent samples assess the chemical/physical characteristics of the treated wastewaterdischarged from the plant.
Ambient receiving water samples are collected to provide the data necessary for DEC tocalculate the applicable water quality criteria. The MWWTP mixing zone extends 150 metersupstream and downstream from the discharge.
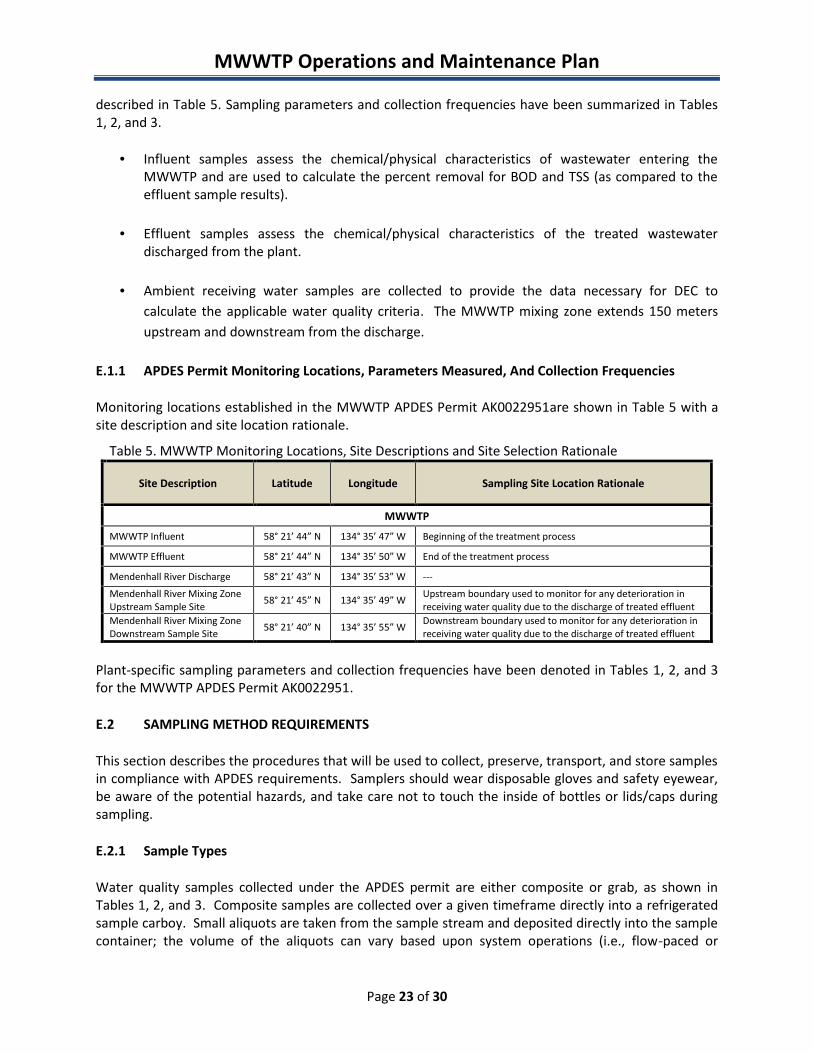
E.1.1 APDES Permit Monitoring Locations, Parameters Measured, And Collection Frequencies
Monitoring locations established in the MWWTP APDES Permit AK0022951are shown in Table 5 with asite description and site location rationale.
Table 5. MWWTP Monitoring Locations, Site Descriptions and Site Selection Rationale
Site Description Latitude Longitude Sampling Site Location Rationale
MWWTP
MWWTP Influent 58° 21’ 44” N 134° 35’ 47” W Beginning of the treatment process
MWWTP Effluent 58° 21’ 44” N 134° 35’ 50” W End of the treatment process
Mendenhall River Discharge 58° 21’ 43” N 134° 35’ 53” W ---
Mendenhall River Mixing ZoneUpstream Sample Site 58° 21’ 45” N 134° 35’ 49” W Upstream boundary used to monitor for any deterioration in
receiving water quality due to the discharge of treated effluentMendenhall River Mixing ZoneDownstream Sample Site 58° 21’ 40” N 134° 35’ 55” W Downstream boundary used to monitor for any deterioration in
receiving water quality due to the discharge of treated effluent
Plant-specific sampling parameters and collection frequencies have been denoted in Tables 1, 2, and 3for the MWWTP APDES Permit AK0022951.
E.2 SAMPLING METHOD REQUIREMENTS
This section describes the procedures that will be used to collect, preserve, transport, and store samplesin compliance with APDES requirements. Samplers should wear disposable gloves and safety eyewear,be aware of the potential hazards, and take care not to touch the inside of bottles or lids/caps duringsampling.
E.2.1 Sample Types
Water quality samples collected under the APDES permit are either composite or grab, as shown inTables 1, 2, and 3. Composite samples are collected over a given timeframe directly into a refrigeratedsample carboy. Small aliquots are taken from the sample stream and deposited directly into the samplecontainer; the volume of the aliquots can vary based upon system operations (i.e., flow-paced or
MWWTP Operations and Maintenance Plan
Page 24 of 30
standard volume). The sample container is held at 4°C ± 2°C for sample preservation. The time of thefirst sample aliquot, composite intervals, and the final compositing time are noted in logbooks or onbench sheets. The final compositing time is the sample collection time noted on the COC form. Grabsamples are collected in one collection bottle at a discrete time.
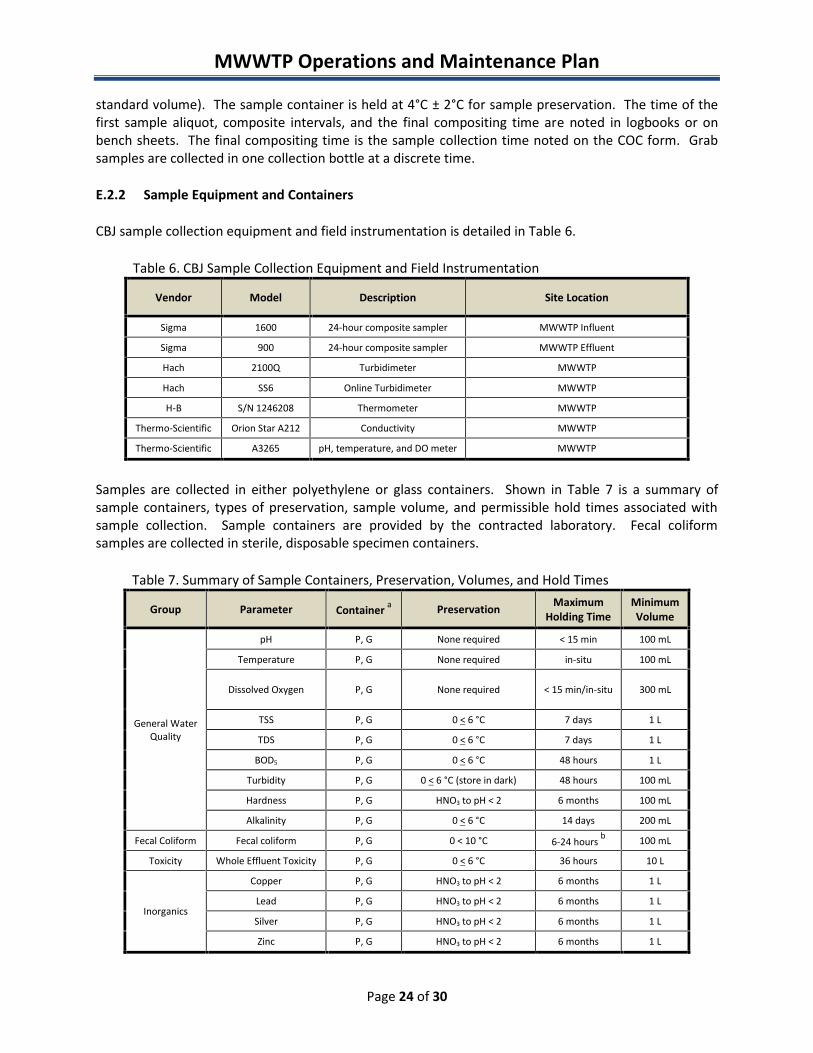
E.2.2 Sample Equipment and Containers
CBJ sample collection equipment and field instrumentation is detailed in Table 6.
Table 6. CBJ Sample Collection Equipment and Field Instrumentation
Vendor Model Description Site Location
Sigma 1600 24-hour composite sampler MWWTP Influent
Sigma 900 24-hour composite sampler MWWTP Effluent
Hach 2100Q Turbidimeter MWWTP
Hach SS6 Online Turbidimeter MWWTP
H-B S/N 1246208 Thermometer MWWTP
Thermo-Scientific Orion Star A212 Conductivity MWWTP
Thermo-Scientific A3265 pH, temperature, and DO meter MWWTP
Samples are collected in either polyethylene or glass containers. Shown in Table 7 is a summary ofsample containers, types of preservation, sample volume, and permissible hold times associated withsample collection. Sample containers are provided by the contracted laboratory. Fecal coliformsamples are collected in sterile, disposable specimen containers.
Table 7. Summary of Sample Containers, Preservation, Volumes, and Hold Times
Group Parameter Container a Preservation MaximumHolding Time
MinimumVolume
General WaterQuality
pH P, G None required < 15 min 100 mL
Temperature P, G None required in-situ 100 mL
Dissolved Oxygen P, G None required < 15 min/in-situ 300 mL
TSS P, G 0 < 6 °C 7 days 1 L
TDS P, G 0 < 6 °C 7 days 1 L
BOD5 P, G 0 < 6 °C 48 hours 1 L
Turbidity P, G 0 < 6 °C (store in dark) 48 hours 100 mL
Hardness P, G HNO3 to pH < 2 6 months 100 mL
Alkalinity P, G 0 < 6 °C 14 days 200 mL
Fecal Coliform Fecal coliform P, G 0 < 10 °C 6-24 hours b 100 mL
Toxicity Whole Effluent Toxicity P, G 0 < 6 °C 36 hours 10 L
Inorganics
Copper P, G HNO3 to pH < 2 6 months 1 L
Lead P, G HNO3 to pH < 2 6 months 1 L
Silver P, G HNO3 to pH < 2 6 months 1 L
Zinc P, G HNO3 to pH < 2 6 months 1 L
MWWTP Operations and Maintenance Plan
Page 25 of 30
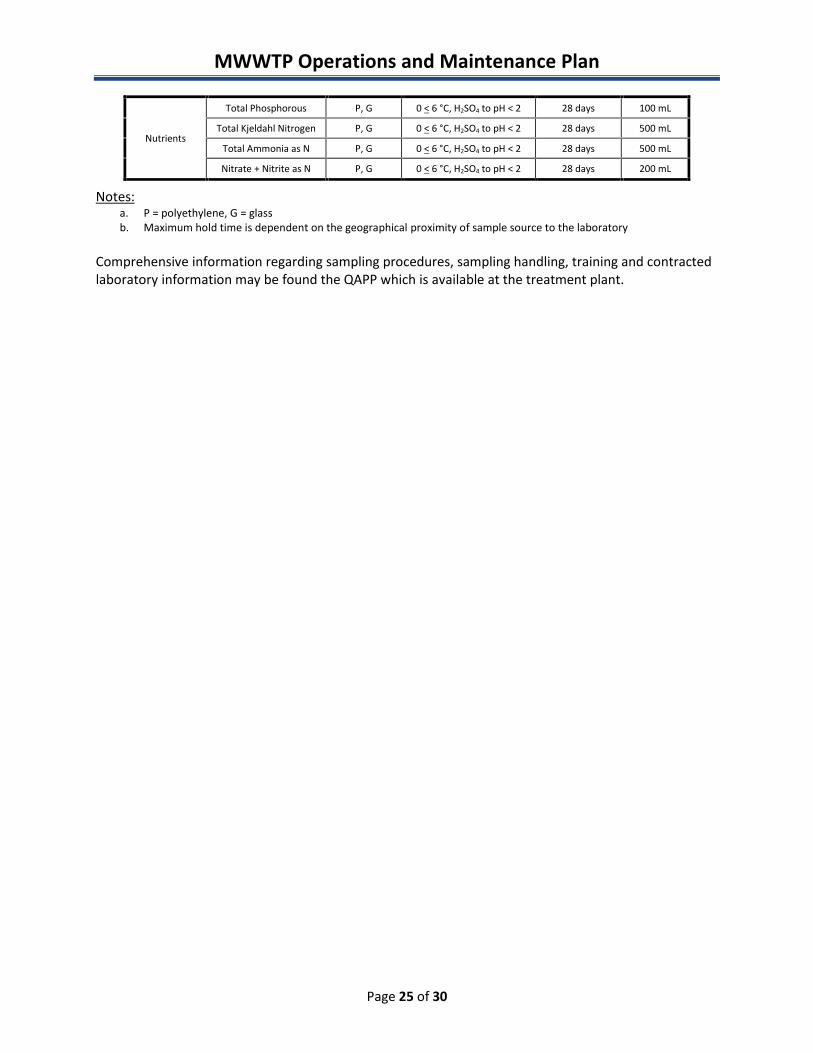
Nutrients
Total Phosphorous P, G 0 < 6 °C, H2SO4 to pH < 2 28 days 100 mL
Total Kjeldahl Nitrogen P, G 0 < 6 °C, H2SO4 to pH < 2 28 days 500 mL
Total Ammonia as N P, G 0 < 6 °C, H2SO4 to pH < 2 28 days 500 mL
Nitrate + Nitrite as N P, G 0 < 6 °C, H2SO4 to pH < 2 28 days 200 mL
Notes:a. P = polyethylene, G = glassb. Maximum hold time is dependent on the geographical proximity of sample source to the laboratory
Comprehensive information regarding sampling procedures, sampling handling, training and contractedlaboratory information may be found the QAPP which is available at the treatment plant.
MWWTP Operations and Maintenance Plan
Page 26 of 30
F. SPILL PREVENTION AND CONTROL
While not a requirement of the MWWTP APDES permit, included in this section are best managementpractices (BMPs) that demonstrate measures to prevent or minimize the potential for the release ofpollutants into Mendenhall River. This section discusses the pollution prevention and control measuresin place for principal and ancillary operations.
F.1 SPILL PREVENTION
Potential pollutants to Mendenhall River are identified as: activated sludge and dewatered cake,polymer and chemicals used in ancillary operations such as lubricants, fuel, paints and cleaningproducts. Laboratory and process control work is minimal. Storage and handling of these pollutants areoutlined in the sections below.
F.1.1 Sludge Storage and Transport
Prior to dewatering, activated sludge is contained in the waste sludge and thickened sludge tanks untilthere is enough volume to send to the BFP in the ABF Building.
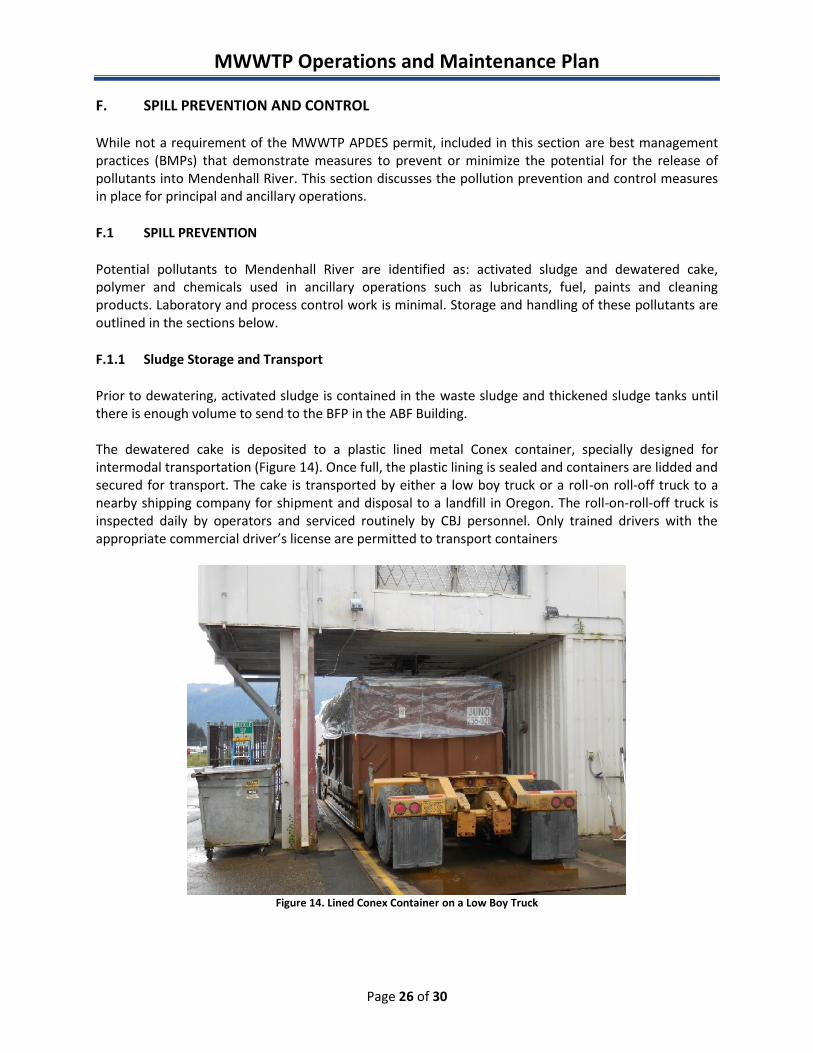
The dewatered cake is deposited to a plastic lined metal Conex container, specially designed forintermodal transportation (Figure 14). Once full, the plastic lining is sealed and containers are lidded andsecured for transport. The cake is transported by either a low boy truck or a roll-on roll-off truck to anearby shipping company for shipment and disposal to a landfill in Oregon. The roll-on-roll-off truck isinspected daily by operators and serviced routinely by CBJ personnel. Only trained drivers with theappropriate commercial driver’s license are permitted to transport containers
Figure 14. Lined Conex Container on a Low Boy Truck

MWWTP Operations and Maintenance Plan
Page 27 of 30
F.1.2 Polymer Storage
Emulsion polymer is contained in covered bins in a designated storage area in the ABF Building. Thesolution is held in large storage containers. Areas where polymer is used have floor drains and sumpsthat transfer spilled material back to the headworks (Figure 15).
Figure 15. Polymer Addition Area
F.1.3 Ancillary Operations
For ancillary operations, inventories of lubricants, fuels, paint and cleaning products are maintained inlow inventories, segregated and stored in an OSHA approved storage area in the ABF Building. Storageareas are designed for easy control of drainage and cleanup, and to prevent accidental material spillagefrom entering the process waste stream.
Used oil, polymer, used UV-lamps and spent batteries are collected and contained on site and deliveredto a hazardous waste disposal facility. Refuse waste is collected by a contracting company fortransportation to the local landfill. Operators collect and transport all recyclables to the local recyclingcenter.
F.1.4 Laboratory
Small amounts of chemicals for chemical oxygen demand (COD) and ammonia testing are maintained inlow inventories, segregated and stored in laboratory-grade storage areas in the Laboratory. Storageareas are designed for easy control of drainage and cleanup, and to prevent accidental material spillagefrom entering the process waste stream.
Used chemicals are collected and contained on site and delivered to a hazardous waste disposal facility.
MWWTP Operations and Maintenance Plan
Page 28 of 30
F.2 SPILL AND LEAK RESPONSE
Hazardous materials are stored and handled in a manner as to prevent the possibility of contaminationof receiving waters. The following sections outline controls and protocols should hazardous spills orleaks occur at MWWTP.
F.2.1 Sludge
Sludge transfer from the thickened sludge tank to the BFP is contained through piping and pumps. Anyfree water or cake falling off the belt during the dewatering process is contained by drains and sumpsbeneath the building and flows back by gravity to the headworks. Minor spills on the facility grounds arecleaned up immediately by the operators. Should a larger spill occur, the Biosolids Spill Prevention andResponse Plan (see SOP binder) provides guidance for containment, cleanup and reporting for onsitespills and on public roadways. Spill response kits are located at MWWTP. The drainage and containmentcapacity in the sludge loading area is such as to prevent any spill from reaching the waters of Alaska.
F.2.2 Polymer
Polymer solution for sludge flocculation is premixed. All materials and equipment are located in the UVBuilding. Any spilled material flows into drains leading to sumps beneath the floor and flows back bygravity to the headworks.
Polymer is mixed with sludge in piping prior to entering the BFP. Any polymer coming off the beltsduring the dewatering process is contained by drains and sumps beneath the building and flows back bygravity to the headworks.
Small polymer spills are immediately cleaned up by the Operators. Larger spill response procedures areoutlined in the Polymer Spill Response SOP.
F.2.3 Ancillary Operations
Only small quantities of lubricants, fuels, paint and cleaning products are held at MWWTP. Small spills ofthese materials are immediately cleaned by the Operators.
F.2.4 Laboratory
Only small quantities of lubricants, fuels, paint and cleaning products are held at the MWWTPLaboratory. Small spills of these materials are immediately cleaned by the Operators.
F.3 OPTIMIZATION OF CHEMICAL USAGE
Chemical usage of polymer are tracked and recorded to monitor usage rates and provide information foroptimization. Operators manually monitor and adjust polymer dosing rates to the BFP system to achievecake dryness levels and avoid overfeeding of chemicals.

MWWTP Operations and Maintenance Plan
Page 29 of 30
F.4 PREVENTIVE MAINTENANCE PROGRAM
The MWWTP uses Antero, a computer-based preventive maintenance program. This programsystematically schedules recurring maintenance on facility equipment and is carried out by bothOperators and Maintenance staff.
F.5 MINIMIZATION OF INDUSTRIAL POLLUTANT INPUTS
Inputs from industrial users are monitored by industrial user surveys and source control sampling.
Per the conditions of the permit, an industrial user survey is performed once per permit cycle.Commercial and industrial facilities which may be discharging non-domestic wastewater or otherchemicals and materials into the sewer system are identified. In addition, the volume of waste input tothe sewer system from these sources is identified. This information assists MWWTP in identifying anynew significant industrial users, and the amount and type of waste being discharged to the municipalsewer system.
A source control program was developed to monitor various locations around the sewer system forindustrial inputs. An ISCO composite sampler is placed in a predetermined manhole and allowed tosample for five days. Samples are then taken to a contracted laboratory and are analyzed for BOD, COD,TSS, ammonia, phosphorus, and total Kjeldahl nitrogen. Sampling locations are rotated bi-weekly toobtain a comprehensive analysis of industrial inputs.
F.6 PUBLIC EDUCATION AND OUTREACH
A public information and education program, a required element of the BMPs, has been implementedfor all treatment plants in the CBJ Wastewater Division. The complete details of this program areoutlined in in the Public Information and Education Program Plan. A short summary of some activitiesfollows:
CBJ Divisions of Wastewater and Hazardous Waste (HW) have partnered to provide properdisposal guidelines for household hazardous waste. Wastewater developed a flyer outliningproper disposal of hazardous waste, specifically stating products such as paints, pesticides,spent fuel and motor oil, etc. should not be disposed of in the sewer. The flyer is distributed tothe public on a regular basis and lists contact information of Wastewater and HW to provideguidance over the telephone.
All facilities are open to the public for tours, though most tours are scheduled at the MendenhallWastewater Treatment Plant. Tours focus on basic wastewater treatment processes but alsoprovide information about proper disposal of household hazardous waste. Educationalpamphlets regarding proper disposal of pollutants are available to the public at the treatmentplant.
A reuse program, the HazBin Exchange Program, sponsored by the CBJ’s Waste ManagementDivision has had notable success. If a material is over 50% full and in its original packaging, otherresidents are allowed to obtain the material for free. A waiver is required for liability purposesas to the material’s integrity. Currently, citizens are taking 2000 lbs. per month of partially usedproducts that would otherwise be disposed of as hazardous waste.
CBJ Wastewater has ongoing construction projects to replace and repair sewer systemcomponents to reduce infiltration/inflow into the sewer system.
MWWTP Operations and Maintenance Plan
Page 30 of 30
F.7 WATER CONSERVATION
The Mendenhall Wastewater Treatment Plant has two water systems, potable and non-potablerecirculated effluent.
The potable water is treated drinking water from the CBJ Water Utility system and is used for alldomestic needs throughout the facility. This includes drinking, showering and laundry.
The NPW system is treated recirculated effluent. Treated effluent is collected by a splitter box in the UVchannel and redirected to one of two storage tanks. Effluent is treated again with chlorine and issubsequently distributed around the plant for use (see B.6 for more detail). Primary uses of NPW wateris for seal water, BFP washing and general indoor cleaning procedures.
MWWTP Operations and Maintenance Plan
Appendix AAPDES Permit & Fact Sheet
TABLE OF CONTENTS SCHEDULE OF SUBMISSIONS ......................................................................................................... 3
1.0 LIMITATIONS AND MONITORING REQUIREMENTS ...................................................... 4
1.1 Discharge Authorization ......................................................................................................... 4
1.2 Effluent Limits and Monitoring .............................................................................................. 4
1.3 Additional Monitoring ............................................................................................................ 7
1.4 Whole Effluent Toxicity (WET) Testing Requirements ........................................................ 8
1.5 Mixing Zone ......................................................................................................................... 10
1.6 Receiving Water Monitoring ................................................................................................ 10
2.0 SPECIAL CONDITIONS ........................................................................................................... 12
2.1 Quality Assurance Project Plan ............................................................................................ 12
2.2 Operation and Maintenance Plan .......................................................................................... 13
2.3 Facility Plan Requirement .................................................................................................... 13
2.4 Pretreatment Requirements ................................................................................................... 14
2.5 Identification Sign(s) ............................................................................................................ 15
2.6 Removed Substances ............................................................................................................ 15
APPENDIX A. Standard Conditions ............................................................................................. A-1
APPENDIX B. Acronyms ............................................................................................................... B-1
APPENDIX C. Definitions .............................................................................................................. C-1
LIST OF TABLES Table 1: Schedule of Submissions ............................................................................................................ 3
Table 2: Outfall 001 Effluent Limits and Monitoring Requirements ....................................................... 4
Table 3: Additional Effluent Monitoring for Reissuance Application ..................................................... 7
Table 4: Receiving Water Monitoring Requirements ............................................................................. 11
June 23, 2014 Permit No. AK0022951 Page 3
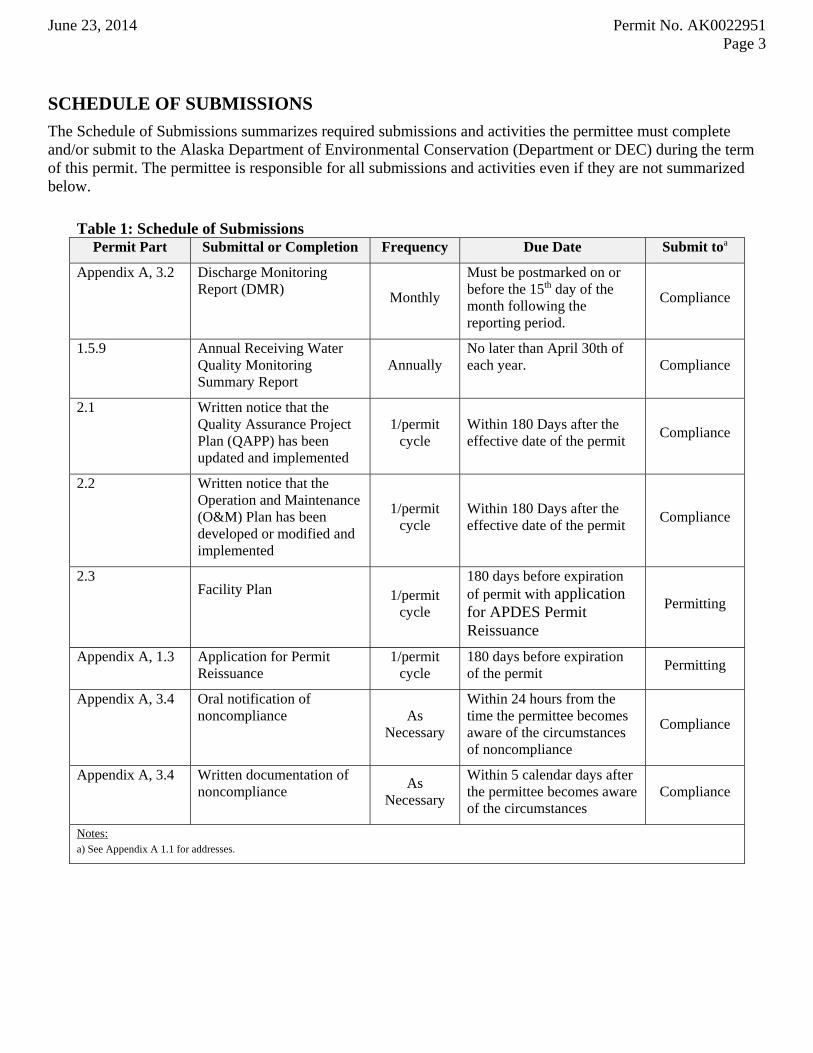
SCHEDULE OF SUBMISSIONS
The Schedule of Submissions summarizes required submissions and activities the permittee must complete and/or submit to the Alaska Department of Environmental Conservation (Department or DEC) during the term of this permit. The permittee is responsible for all submissions and activities even if they are not summarized below.
Table 1: Schedule of Submissions
Permit Part Submittal or Completion Frequency Due Date Submit toa
Appendix A, 3.2 Discharge Monitoring Report (DMR)
Monthly
Must be postmarked on or before the 15th day of the month following the reporting period.
Compliance
1.5.9 Annual Receiving Water Quality Monitoring Summary Report
Annually No later than April 30th of each year. Compliance
2.1 Written notice that the Quality Assurance Project Plan (QAPP) has been updated and implemented
1/permit cycle
Within 180 Days after the effective date of the permit
Compliance
2.2 Written notice that the Operation and Maintenance (O&M) Plan has been developed or modified and implemented
1/permit cycle
Within 180 Days after the effective date of the permit
Compliance
2.3 Facility Plan 1/permit
cycle
180 days before expiration of permit with application for APDES Permit Reissuance
Permitting
Appendix A, 1.3 Application for Permit Reissuance
1/permit cycle
180 days before expiration of the permit
Permitting
Appendix A, 3.4 Oral notification of noncompliance As
Necessary
Within 24 hours from the time the permittee becomes aware of the circumstances of noncompliance
Compliance
Appendix A, 3.4 Written documentation of noncompliance
As Necessary
Within 5 calendar days after the permittee becomes aware of the circumstances
Compliance
Notes: a) See Appendix A 1.1 for addresses.
June 23, 2014 Permit No. AK0022951 Page 4
1.0 LIMITATIONS AND MONITORING REQUIREMENTS
1.1 Discharge Authorization
During the effective period of this permit, the permittee is authorized to discharge pollutants from Outfall 001 specified herein to Mendenhall River, within the limits and subject to conditions set forth herein. This permit authorizes discharge of only those pollutants resulting from facility processes, waste streams, and operations clearly identified in the permit application process.
1.2 Effluent Limits and Monitoring
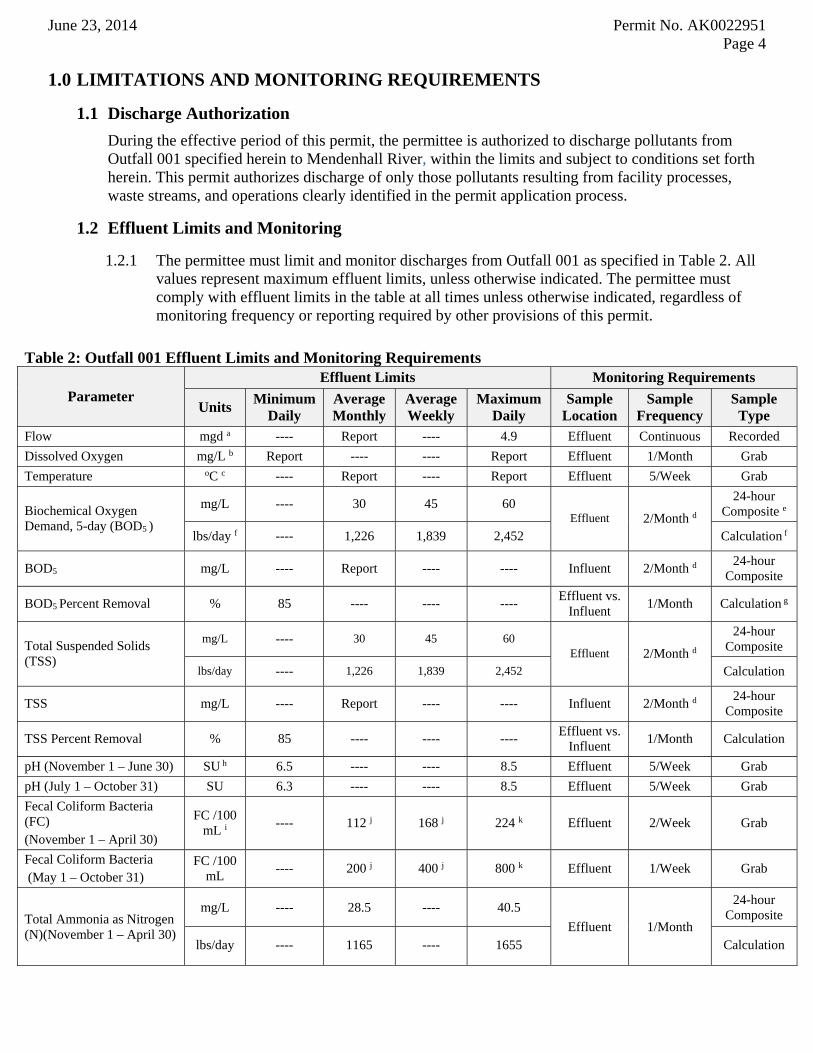
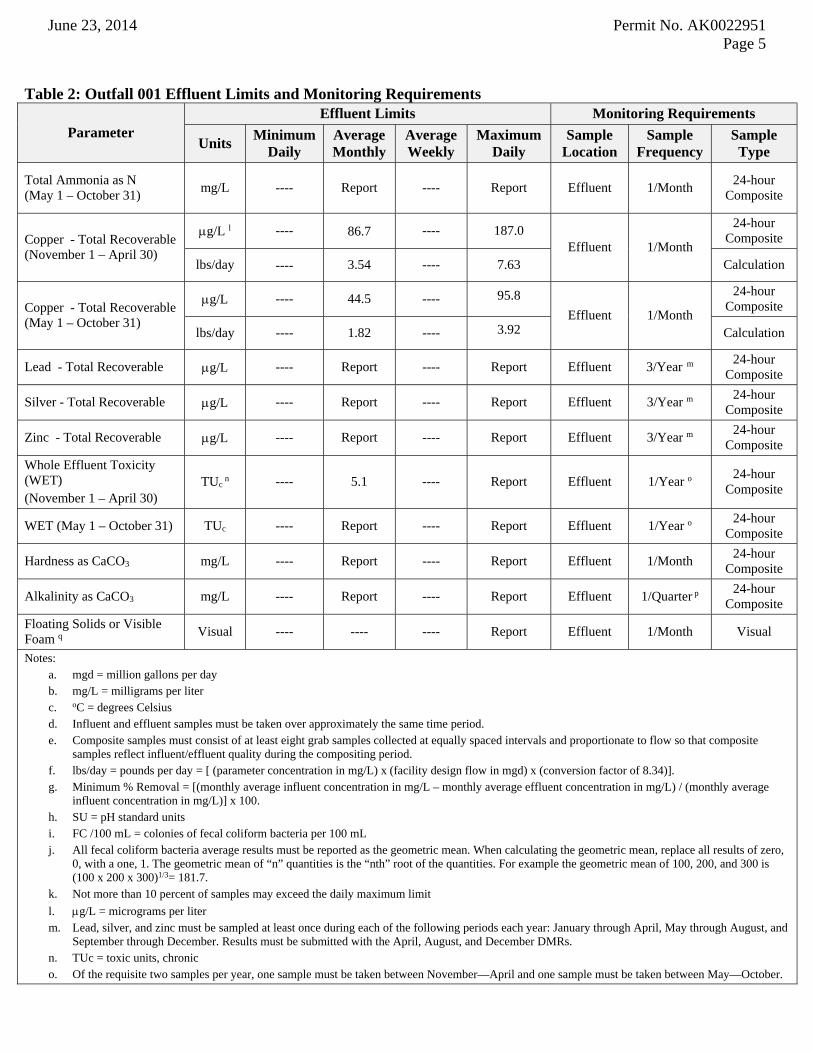
1.2.1 The permittee must limit and monitor discharges from Outfall 001 as specified in Table 2. All values represent maximum effluent limits, unless otherwise indicated. The permittee must comply with effluent limits in the table at all times unless otherwise indicated, regardless of monitoring frequency or reporting required by other provisions of this permit.
Table 2: Outfall 001 Effluent Limits and Monitoring Requirements
Parameter Effluent Limits Monitoring Requirements
Units Minimum
Daily Average Monthly
Average Weekly
Maximum Daily
Sample Location
Sample Frequency
Sample Type
Flow mgd a ---- Report ---- 4.9 Effluent Continuous Recorded
Dissolved Oxygen mg/L b Report ---- ---- Report Effluent 1/Month Grab
Temperature oC c ---- Report ---- Report Effluent 5/Week Grab
Biochemical Oxygen Demand, 5-day (BOD5 )
mg/L ---- 30 45 60 Effluent 2/Month d
24-hour Composite e
lbs/day f ---- 1,226 1,839 2,452 Calculation f
BOD5 mg/L ---- Report ---- ---- Influent 2/Month d 24-hour
Composite
BOD5 Percent Removal % 85 ---- ---- ---- Effluent vs.
Influent 1/Month Calculation g
Total Suspended Solids (TSS)
mg/L ---- 30 45 60 Effluent 2/Month d
24-hour Composite
lbs/day ---- 1,226 1,839 2,452 Calculation
TSS mg/L ---- Report ---- ---- Influent 2/Month d 24-hour
Composite
TSS Percent Removal % 85 ---- ---- ---- Effluent vs.
Influent 1/Month Calculation
pH (November 1 – June 30) SU h 6.5 ---- ---- 8.5 Effluent 5/Week Grab
pH (July 1 – October 31) SU 6.3 ---- ---- 8.5 Effluent 5/Week Grab
Fecal Coliform Bacteria (FC)
(November 1 – April 30)
FC /100 mL i
---- 112 j 168 j 224 k Effluent 2/Week Grab
Fecal Coliform Bacteria (May 1 – October 31)
FC /100 mL
---- 200 j 400 j 800 k Effluent 1/Week Grab
Total Ammonia as Nitrogen (N)(November 1 – April 30)
mg/L ---- 28.5 ---- 40.5
Effluent 1/Month
24-hour Composite
lbs/day ---- 1165 ---- 1655 Calculation
June 23, 2014 Permit No. AK0022951 Page 5
Table 2: Outfall 001 Effluent Limits and Monitoring Requirements
Parameter Effluent Limits Monitoring Requirements
Units Minimum
Daily Average Monthly
Average Weekly
Maximum Daily
Sample Location
Sample Frequency
Sample Type
Total Ammonia as N (May 1 – October 31)
mg/L ---- Report ---- Report Effluent 1/Month 24-hour
Composite
Copper - Total Recoverable (November 1 – April 30)
g/L l ---- 86.7 ---- 187.0 Effluent 1/Month
24-hour Composite
lbs/day ---- 3.54 ---- 7.63 Calculation
Copper - Total Recoverable (May 1 – October 31)
g/L ---- 44.5 ---- 95.8
Effluent 1/Month
24-hour Composite
lbs/day ---- 1.82 ---- 3.92 Calculation
Lead - Total Recoverable g/L ---- Report ---- Report Effluent 3/Year m 24-hour
Composite
Silver - Total Recoverable g/L ---- Report ---- Report Effluent 3/Year m 24-hour
Composite
Zinc - Total Recoverable g/L ---- Report ---- Report Effluent 3/Year m 24-hour
Composite
Whole Effluent Toxicity (WET) (November 1 – April 30)
TUc n ---- 5.1 ---- Report Effluent 1/Year o
24-hour Composite
WET (May 1 – October 31) TUc ---- Report ---- Report Effluent 1/Year o 24-hour
Composite
Hardness as CaCO3 mg/L ---- Report ---- Report Effluent 1/Month 24-hour
Composite
Alkalinity as CaCO3 mg/L ---- Report ---- Report Effluent 1/Quarter p 24-hour
Composite
Floating Solids or Visible Foam q
Visual ---- ---- ---- Report Effluent 1/Month Visual
Notes: a. mgd = million gallons per day b. mg/L = milligrams per liter c. oC = degrees Celsius d. Influent and effluent samples must be taken over approximately the same time period. e. Composite samples must consist of at least eight grab samples collected at equally spaced intervals and proportionate to flow so that composite
samples reflect influent/effluent quality during the compositing period. f. lbs/day = pounds per day = [ (parameter concentration in mg/L) x (facility design flow in mgd) x (conversion factor of 8.34)]. g. Minimum % Removal = [(monthly average influent concentration in mg/L – monthly average effluent concentration in mg/L) / (monthly average
influent concentration in mg/L)] x 100. h. SU = pH standard units i. FC /100 mL = colonies of fecal coliform bacteria per 100 mL j. All fecal coliform bacteria average results must be reported as the geometric mean. When calculating the geometric mean, replace all results of zero,
0, with a one, 1. The geometric mean of “n” quantities is the “nth” root of the quantities. For example the geometric mean of 100, 200, and 300 is (100 x 200 x 300)1/3= 181.7.
k. Not more than 10 percent of samples may exceed the daily maximum limit
l. g/L = micrograms per liter m. Lead, silver, and zinc must be sampled at least once during each of the following periods each year: January through April, May through August, and
September through December. Results must be submitted with the April, August, and December DMRs. n. TUc = toxic units, chronic o. Of the requisite two samples per year, one sample must be taken between November—April and one sample must be taken between May—October.
June 23, 2014 Permit No. AK0022951 Page 6
Table 2: Outfall 001 Effluent Limits and Monitoring Requirements
Parameter Effluent Limits Monitoring Requirements
Units Minimum
Daily Average Monthly
Average Weekly
Maximum Daily
Sample Location
Sample Frequency
Sample Type
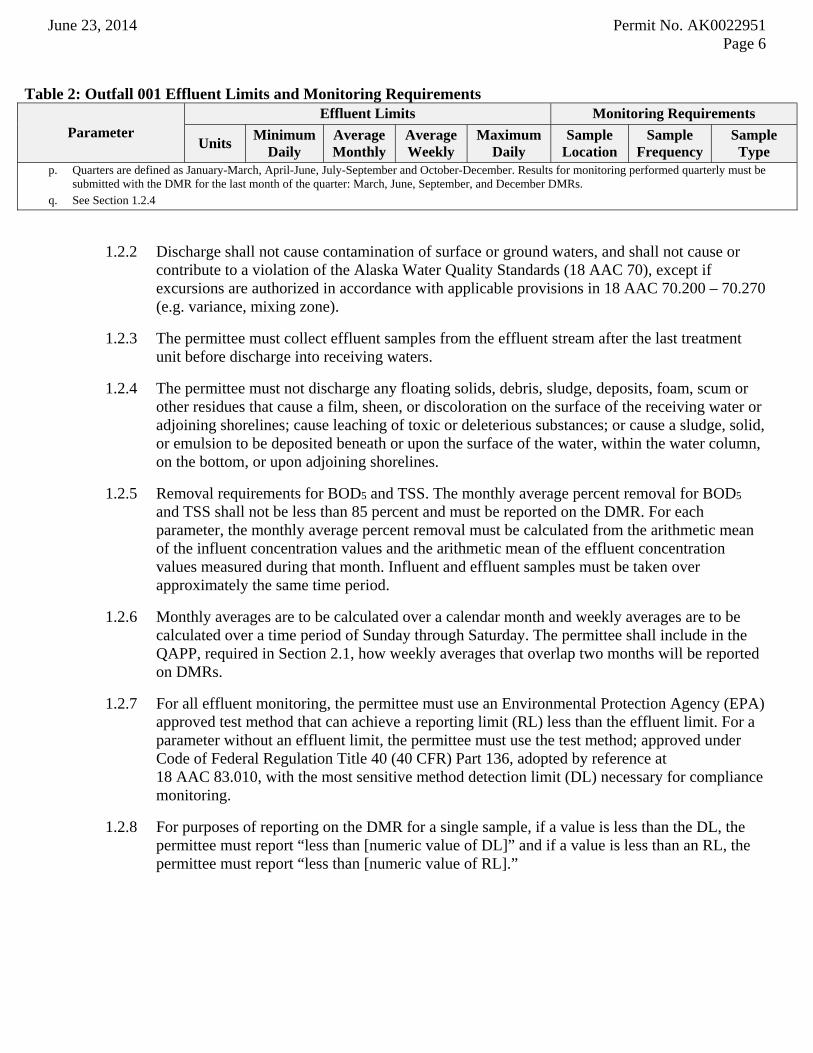
p. Quarters are defined as January-March, April-June, July-September and October-December. Results for monitoring performed quarterly must be submitted with the DMR for the last month of the quarter: March, June, September, and December DMRs.
q. See Section 1.2.4
1.2.2 Discharge shall not cause contamination of surface or ground waters, and shall not cause or contribute to a violation of the Alaska Water Quality Standards (18 AAC 70), except if excursions are authorized in accordance with applicable provisions in 18 AAC 70.200 – 70.270 (e.g. variance, mixing zone).
1.2.3 The permittee must collect effluent samples from the effluent stream after the last treatment unit before discharge into receiving waters.
1.2.4 The permittee must not discharge any floating solids, debris, sludge, deposits, foam, scum or other residues that cause a film, sheen, or discoloration on the surface of the receiving water or adjoining shorelines; cause leaching of toxic or deleterious substances; or cause a sludge, solid, or emulsion to be deposited beneath or upon the surface of the water, within the water column, on the bottom, or upon adjoining shorelines.
1.2.5 Removal requirements for BOD5 and TSS. The monthly average percent removal for BOD5 and TSS shall not be less than 85 percent and must be reported on the DMR. For each parameter, the monthly average percent removal must be calculated from the arithmetic mean of the influent concentration values and the arithmetic mean of the effluent concentration values measured during that month. Influent and effluent samples must be taken over approximately the same time period.
1.2.6 Monthly averages are to be calculated over a calendar month and weekly averages are to be calculated over a time period of Sunday through Saturday. The permittee shall include in the QAPP, required in Section 2.1, how weekly averages that overlap two months will be reported on DMRs.
1.2.7 For all effluent monitoring, the permittee must use an Environmental Protection Agency (EPA) approved test method that can achieve a reporting limit (RL) less than the effluent limit. For a parameter without an effluent limit, the permittee must use the test method; approved under Code of Federal Regulation Title 40 (40 CFR) Part 136, adopted by reference at 18 AAC 83.010, with the most sensitive method detection limit (DL) necessary for compliance monitoring.
1.2.8 For purposes of reporting on the DMR for a single sample, if a value is less than the DL, the permittee must report “less than [numeric value of DL]” and if a value is less than an RL, the permittee must report “less than [numeric value of RL].”
June 23, 2014 Permit No. AK0022951 Page 7
1.2.9 For purposes of calculating a monthly average, zero (0) may be assigned for a value less than the DL, and the [numeric value of DL] may be assigned for a value between the DL and the RL. If the calculated average value is less than the DL, the permittee must report “less than [numeric value of DL].” If the calculated average value is less than the RL, the permittee must report “less than [numeric value of RL].” If a value is equal to or greater than the RL, the permittee must report and use the actual value. The resulting average value must be compared to the compliance level in assessing compliance.
1.3 Additional Monitoring
1.3.1 Design Flow Greater than 1.0 mgd
1.3.1.1 In accordance with the Alaska Pollutant Discharge Elimination System (APDES) application Form 2A, Section 10, Section 11, and Supplement A, a facility with a design flow greater than 1.0 mgd shall conduct additional effluent monitoring of pollutants during the life of the permit and include results of such monitoring with the permittee’s reissuance application. The permittee shall perform effluent monitoring at least three times in the first four and one-half years of the permit term (see Table 3 requirements).
1.3.1.2 Each monitoring event shall be conducted in a different calendar year and different season as follows:
Winter – December through February,
Summer – June through August, and
Spring or Fall – March through May or September through November, respectively.
1.3.1.3 Monitoring for these parameters performed to satisfy other monitoring requirements of this permit may be used to satisfy this specific monitoring requirement as long as the “different calendar year and season” criteria are met.
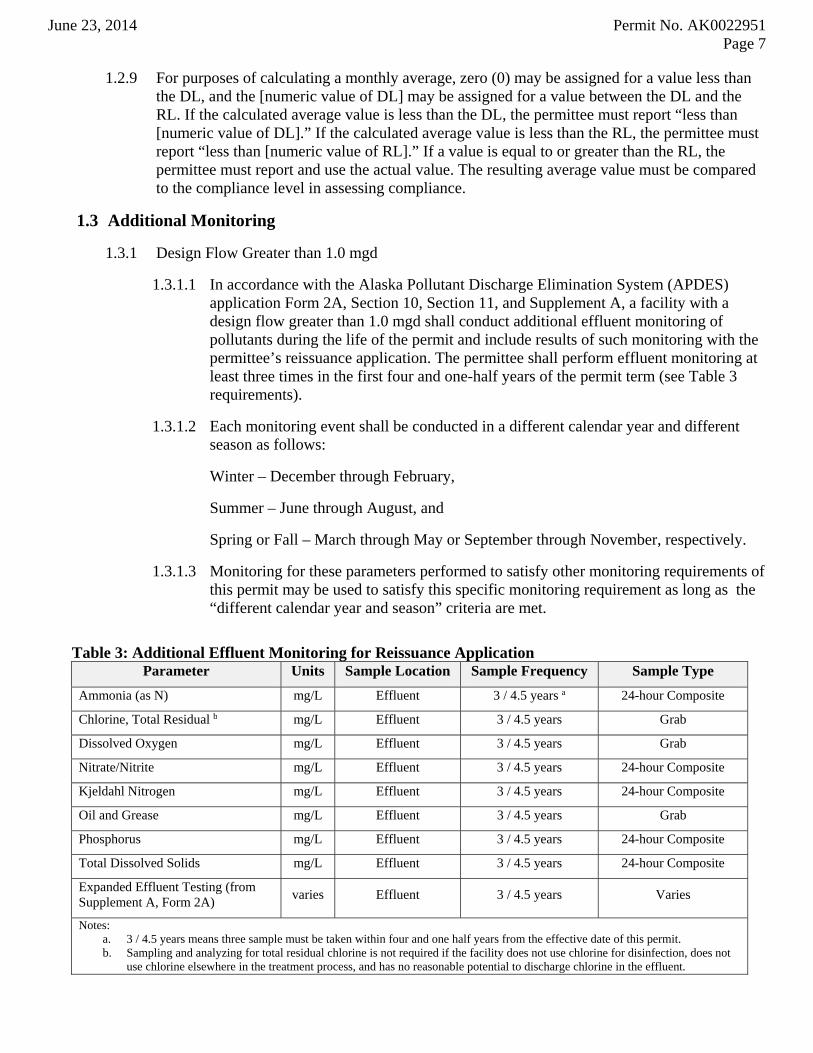
Table 3: Additional Effluent Monitoring for Reissuance Application
Parameter Units Sample Location Sample Frequency Sample Type
Ammonia (as N) mg/L Effluent 3 / 4.5 years a 24-hour Composite
Chlorine, Total Residual b mg/L Effluent 3 / 4.5 years Grab
Dissolved Oxygen mg/L Effluent 3 / 4.5 years Grab
Nitrate/Nitrite mg/L Effluent 3 / 4.5 years 24-hour Composite
Kjeldahl Nitrogen mg/L Effluent 3 / 4.5 years 24-hour Composite
Oil and Grease mg/L Effluent 3 / 4.5 years Grab
Phosphorus mg/L Effluent 3 / 4.5 years 24-hour Composite
Total Dissolved Solids mg/L Effluent 3 / 4.5 years 24-hour Composite
Expanded Effluent Testing (from Supplement A, Form 2A)
varies Effluent 3 / 4.5 years Varies
Notes: a. 3 / 4.5 years means three sample must be taken within four and one half years from the effective date of this permit. b. Sampling and analyzing for total residual chlorine is not required if the facility does not use chlorine for disinfection, does not
use chlorine elsewhere in the treatment process, and has no reasonable potential to discharge chlorine in the effluent.
June 23, 2014 Permit No. AK0022951 Page 8
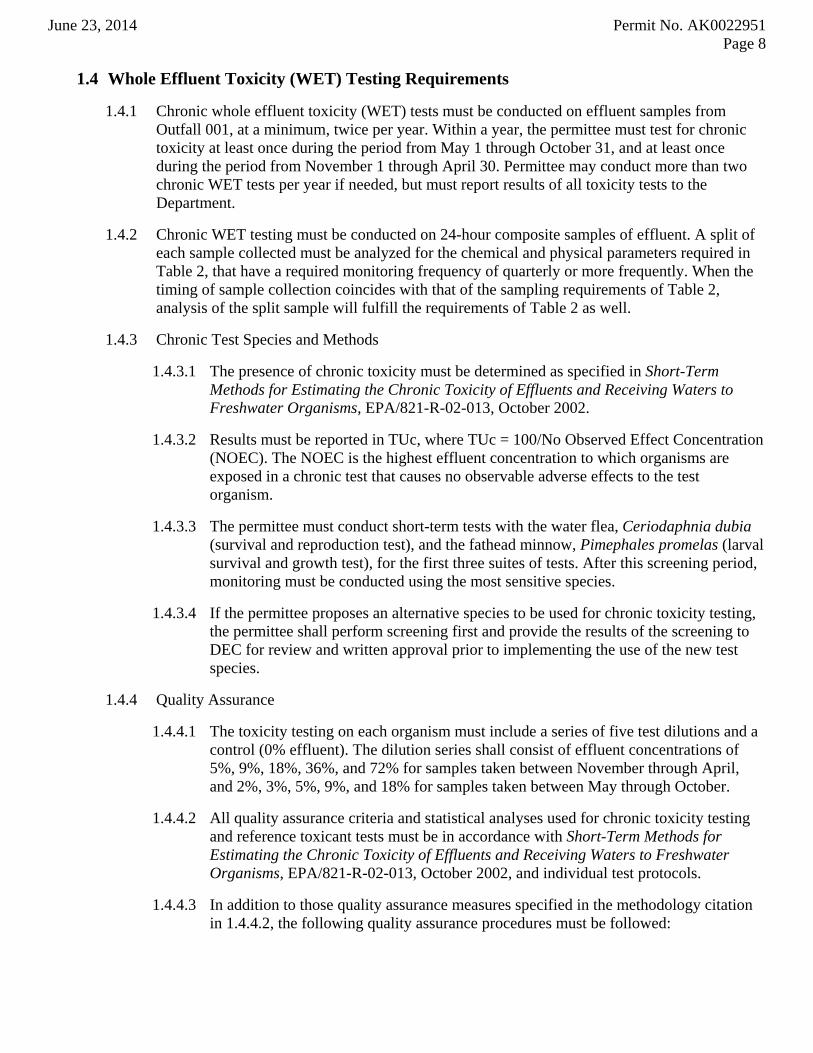
1.4 Whole Effluent Toxicity (WET) Testing Requirements
1.4.1 Chronic whole effluent toxicity (WET) tests must be conducted on effluent samples from Outfall 001, at a minimum, twice per year. Within a year, the permittee must test for chronic toxicity at least once during the period from May 1 through October 31, and at least once during the period from November 1 through April 30. Permittee may conduct more than two chronic WET tests per year if needed, but must report results of all toxicity tests to the Department.
1.4.2 Chronic WET testing must be conducted on 24-hour composite samples of effluent. A split of each sample collected must be analyzed for the chemical and physical parameters required in Table 2, that have a required monitoring frequency of quarterly or more frequently. When the timing of sample collection coincides with that of the sampling requirements of Table 2, analysis of the split sample will fulfill the requirements of Table 2 as well.
1.4.3 Chronic Test Species and Methods
1.4.3.1 The presence of chronic toxicity must be determined as specified in Short-Term Methods for Estimating the Chronic Toxicity of Effluents and Receiving Waters to Freshwater Organisms, EPA/821-R-02-013, October 2002.
1.4.3.2 Results must be reported in TUc, where TUc = 100/No Observed Effect Concentration (NOEC). The NOEC is the highest effluent concentration to which organisms are exposed in a chronic test that causes no observable adverse effects to the test organism.
1.4.3.3 The permittee must conduct short-term tests with the water flea, Ceriodaphnia dubia (survival and reproduction test), and the fathead minnow, Pimephales promelas (larval survival and growth test), for the first three suites of tests. After this screening period, monitoring must be conducted using the most sensitive species.
1.4.3.4 If the permittee proposes an alternative species to be used for chronic toxicity testing, the permittee shall perform screening first and provide the results of the screening to DEC for review and written approval prior to implementing the use of the new test species.
1.4.4 Quality Assurance
1.4.4.1 The toxicity testing on each organism must include a series of five test dilutions and a control (0% effluent). The dilution series shall consist of effluent concentrations of 5%, 9%, 18%, 36%, and 72% for samples taken between November through April, and 2%, 3%, 5%, 9%, and 18% for samples taken between May through October.
1.4.4.2 All quality assurance criteria and statistical analyses used for chronic toxicity testing and reference toxicant tests must be in accordance with Short-Term Methods for Estimating the Chronic Toxicity of Effluents and Receiving Waters to Freshwater Organisms, EPA/821-R-02-013, October 2002, and individual test protocols.
1.4.4.3 In addition to those quality assurance measures specified in the methodology citation in 1.4.4.2, the following quality assurance procedures must be followed:
June 23, 2014 Permit No. AK0022951 Page 9
1.4.4.3.1 If organisms are not cultured in-house, concurrent testing with reference toxicants must be conducted. If organisms are cultured in-house, monthly reference toxicant testing is sufficient. Reference toxicant tests must be conducted using the same test conditions as the effluent toxicity tests.
1.4.4.3.2 If either of the reference toxicant tests or the effluent tests does not meet all test acceptability criteria as specified in the test methods manual, the permittee must resample and retest within 14 days of receipt of the test results.
1.4.4.3.3 Control and dilution water must be receiving water or lab water, as appropriate, as described in the manual. If the dilution water used is different from the culture water, a second control, using culture water, must also be used. Receiving water may be used as control and dilution water upon notification of DEC. In no case shall water that has not met test acceptability criteria be used for either dilution or control.
1.4.5 Accelerated Testing
1.4.5.1 If chronic toxicity is detected above the effluent limit specified in Table 2 of this permit and the permittee demonstrates through an initial investigation and evaluation of facility operations that the cause of the exceedance is known and corrective actions have been implemented, only one accelerated test is necessary. It toxicity exceeding the chronic toxicity limit is detected in this test, then the Toxicity Reduction Evaluation requirement in Section 1.4.6 shall apply.
1.4.5.2 If chronic toxicity is detected above the effluent limit specified in Table 2 of this permit and no initial investigation is conducted or cause is determined by the initial investigation, then the permittee must conduct four additional biweekly tests over an eight week period. This accelerated testing must be initiated within 14 days of receipt of the test results that indicated an exceedance.
1.4.5.3 The permittee must notify DEC of the exceedance in writing within 14 days of receipt of test results. The notice must include the following information:
1.4.5.3.1 A status report on any actions required by the permit with a schedule for actions not yet completed;
1.4.5.3.2 A description of any additional actions the permittee has taken or will take to investigate and correct the cause(s) of the toxicity; and
1.4.5.3.3 Where no actions have been taken, a discussion of the reasons for not taking action.
1.4.5.4 If none of the four accelerated tests exceed effluent limits, the permittee may return to the normal testing frequency. If any of the four tests exceed the limit, then the toxicity reduction evaluation requirements, in Section 1.4.6, shall apply.
1.4.6 Toxicity Reduction Evaluation (TRE) and Toxicity Identification Evaluation (TIE) - Whole Effluent Toxicity
1.4.6.1 If the chronic toxicity limit is exceeded during accelerated testing under Section 1.4.5, the permittee must initiate and submit to DEC a TRE in accordance with Generalized Methodology for Conducting Industrial Toxicity Reduction Evaluations, (EPA/600/2-88/070) within 14 days of the exceedance. At a minimum, the TRE must include:
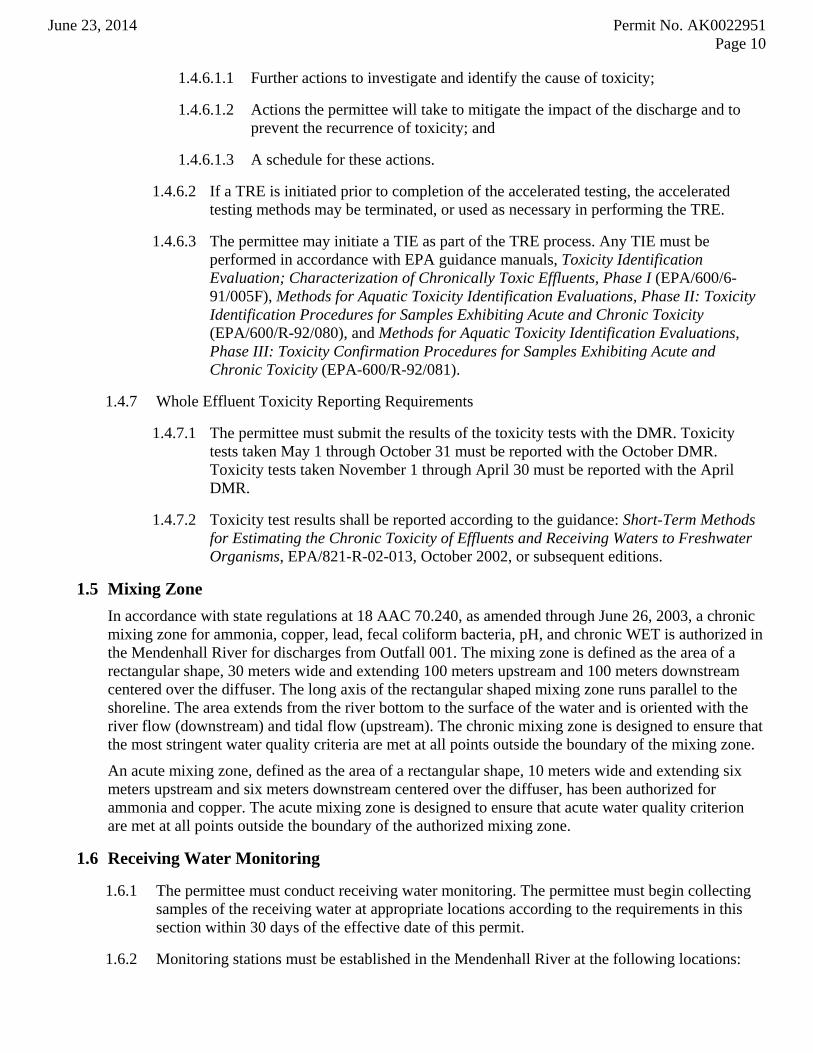
June 23, 2014 Permit No. AK0022951 Page 10
1.4.6.1.1 Further actions to investigate and identify the cause of toxicity;
1.4.6.1.2 Actions the permittee will take to mitigate the impact of the discharge and to prevent the recurrence of toxicity; and
1.4.6.1.3 A schedule for these actions.
1.4.6.2 If a TRE is initiated prior to completion of the accelerated testing, the accelerated testing methods may be terminated, or used as necessary in performing the TRE.
1.4.6.3 The permittee may initiate a TIE as part of the TRE process. Any TIE must be performed in accordance with EPA guidance manuals, Toxicity Identification Evaluation; Characterization of Chronically Toxic Effluents, Phase I (EPA/600/6-91/005F), Methods for Aquatic Toxicity Identification Evaluations, Phase II: Toxicity Identification Procedures for Samples Exhibiting Acute and Chronic Toxicity (EPA/600/R-92/080), and Methods for Aquatic Toxicity Identification Evaluations, Phase III: Toxicity Confirmation Procedures for Samples Exhibiting Acute and Chronic Toxicity (EPA-600/R-92/081).
1.4.7 Whole Effluent Toxicity Reporting Requirements
1.4.7.1 The permittee must submit the results of the toxicity tests with the DMR. Toxicity tests taken May 1 through October 31 must be reported with the October DMR. Toxicity tests taken November 1 through April 30 must be reported with the April DMR.
1.4.7.2 Toxicity test results shall be reported according to the guidance: Short-Term Methods for Estimating the Chronic Toxicity of Effluents and Receiving Waters to Freshwater Organisms, EPA/821-R-02-013, October 2002, or subsequent editions.
1.5 Mixing Zone
In accordance with state regulations at 18 AAC 70.240, as amended through June 26, 2003, a chronic mixing zone for ammonia, copper, lead, fecal coliform bacteria, pH, and chronic WET is authorized in the Mendenhall River for discharges from Outfall 001. The mixing zone is defined as the area of a rectangular shape, 30 meters wide and extending 100 meters upstream and 100 meters downstream centered over the diffuser. The long axis of the rectangular shaped mixing zone runs parallel to the shoreline. The area extends from the river bottom to the surface of the water and is oriented with the river flow (downstream) and tidal flow (upstream). The chronic mixing zone is designed to ensure that the most stringent water quality criteria are met at all points outside the boundary of the mixing zone.
An acute mixing zone, defined as the area of a rectangular shape, 10 meters wide and extending six meters upstream and six meters downstream centered over the diffuser, has been authorized for ammonia and copper. The acute mixing zone is designed to ensure that acute water quality criterion are met at all points outside the boundary of the authorized mixing zone.
1.6 Receiving Water Monitoring
1.6.1 The permittee must conduct receiving water monitoring. The permittee must begin collecting samples of the receiving water at appropriate locations according to the requirements in this section within 30 days of the effective date of this permit.
1.6.2 Monitoring stations must be established in the Mendenhall River at the following locations:
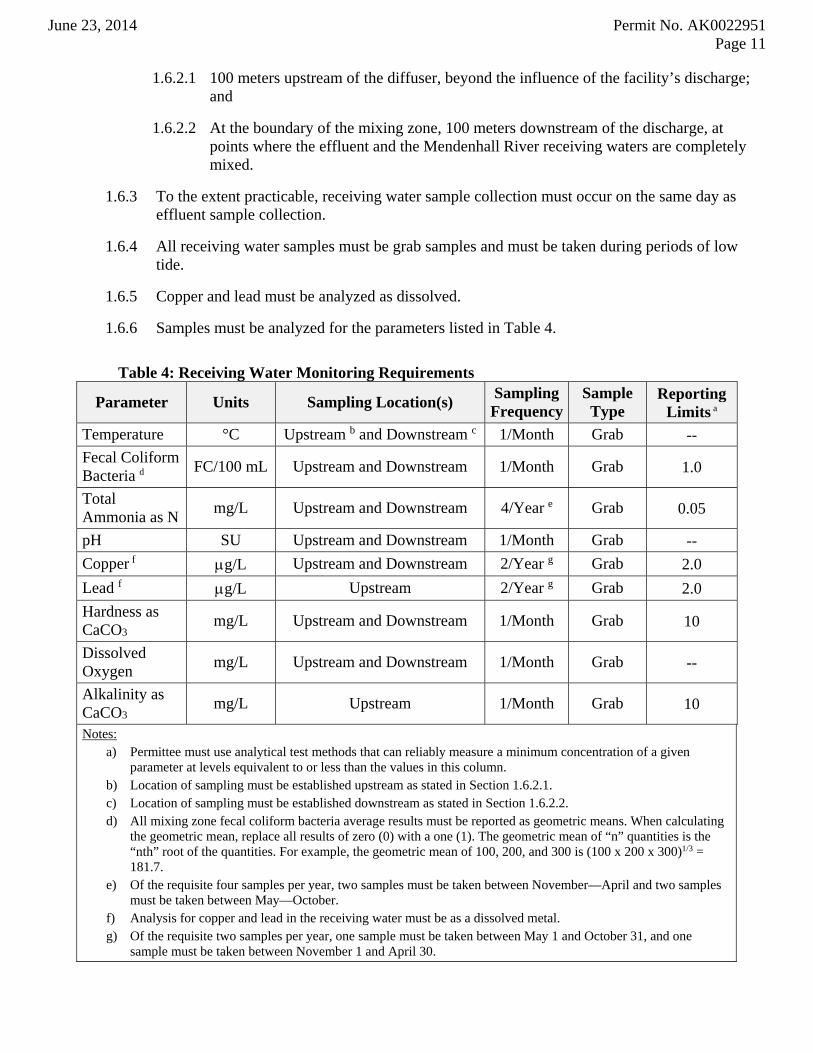
June 23, 2014 Permit No. AK0022951 Page 11
1.6.2.1 100 meters upstream of the diffuser, beyond the influence of the facility’s discharge; and
1.6.2.2 At the boundary of the mixing zone, 100 meters downstream of the discharge, at points where the effluent and the Mendenhall River receiving waters are completely mixed.
1.6.3 To the extent practicable, receiving water sample collection must occur on the same day as effluent sample collection.
1.6.4 All receiving water samples must be grab samples and must be taken during periods of low tide.
1.6.5 Copper and lead must be analyzed as dissolved.
1.6.6 Samples must be analyzed for the parameters listed in Table 4.
Table 4: Receiving Water Monitoring Requirements
Parameter Units Sampling Location(s) Sampling Frequency
Sample Type
Reporting Limits a
Temperature °C Upstream b and Downstream c 1/Month Grab --
Fecal Coliform Bacteria d FC/100 mL Upstream and Downstream 1/Month Grab 1.0
Total Ammonia as N
mg/L Upstream and Downstream 4/Year e Grab 0.05
pH SU Upstream and Downstream 1/Month Grab --
Copper f g/L Upstream and Downstream 2/Year g Grab 2.0
Lead f g/L Upstream 2/Year g Grab 2.0
Hardness as CaCO3
mg/L Upstream and Downstream 1/Month Grab 10
Dissolved Oxygen
mg/L Upstream and Downstream 1/Month Grab --
Alkalinity as CaCO3
mg/L Upstream 1/Month Grab 10
Notes: a) Permittee must use analytical test methods that can reliably measure a minimum concentration of a given
parameter at levels equivalent to or less than the values in this column. b) Location of sampling must be established upstream as stated in Section 1.6.2.1. c) Location of sampling must be established downstream as stated in Section 1.6.2.2. d) All mixing zone fecal coliform bacteria average results must be reported as geometric means. When calculating
the geometric mean, replace all results of zero (0) with a one (1). The geometric mean of “n” quantities is the “nth” root of the quantities. For example, the geometric mean of 100, 200, and 300 is (100 x 200 x 300)1/3 = 181.7.
e) Of the requisite four samples per year, two samples must be taken between November—April and two samples must be taken between May—October.
f) Analysis for copper and lead in the receiving water must be as a dissolved metal. g) Of the requisite two samples per year, one sample must be taken between May 1 and October 31, and one
sample must be taken between November 1 and April 30.
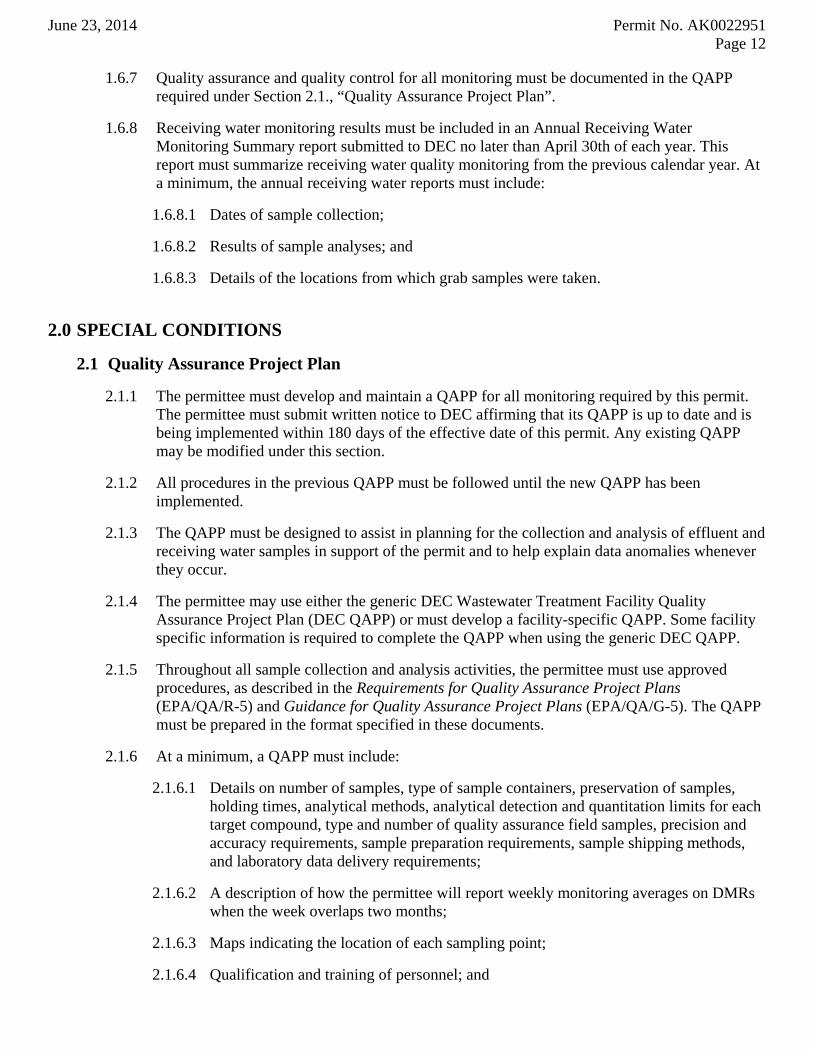
June 23, 2014 Permit No. AK0022951 Page 12
1.6.7 Quality assurance and quality control for all monitoring must be documented in the QAPP required under Section 2.1., “Quality Assurance Project Plan”.
1.6.8 Receiving water monitoring results must be included in an Annual Receiving Water Monitoring Summary report submitted to DEC no later than April 30th of each year. This report must summarize receiving water quality monitoring from the previous calendar year. At a minimum, the annual receiving water reports must include:
1.6.8.1 Dates of sample collection;
1.6.8.2 Results of sample analyses; and
1.6.8.3 Details of the locations from which grab samples were taken.
2.0 SPECIAL CONDITIONS
2.1 Quality Assurance Project Plan
2.1.1 The permittee must develop and maintain a QAPP for all monitoring required by this permit. The permittee must submit written notice to DEC affirming that its QAPP is up to date and is being implemented within 180 days of the effective date of this permit. Any existing QAPP may be modified under this section.
2.1.2 All procedures in the previous QAPP must be followed until the new QAPP has been implemented.
2.1.3 The QAPP must be designed to assist in planning for the collection and analysis of effluent and receiving water samples in support of the permit and to help explain data anomalies whenever they occur.
2.1.4 The permittee may use either the generic DEC Wastewater Treatment Facility Quality Assurance Project Plan (DEC QAPP) or must develop a facility-specific QAPP. Some facility specific information is required to complete the QAPP when using the generic DEC QAPP.
2.1.5 Throughout all sample collection and analysis activities, the permittee must use approved procedures, as described in the Requirements for Quality Assurance Project Plans (EPA/QA/R-5) and Guidance for Quality Assurance Project Plans (EPA/QA/G-5). The QAPP must be prepared in the format specified in these documents.
2.1.6 At a minimum, a QAPP must include:
2.1.6.1 Details on number of samples, type of sample containers, preservation of samples, holding times, analytical methods, analytical detection and quantitation limits for each target compound, type and number of quality assurance field samples, precision and accuracy requirements, sample preparation requirements, sample shipping methods, and laboratory data delivery requirements;
2.1.6.2 A description of how the permittee will report weekly monitoring averages on DMRs when the week overlaps two months;
2.1.6.3 Maps indicating the location of each sampling point;
2.1.6.4 Qualification and training of personnel; and
June 23, 2014 Permit No. AK0022951 Page 13
2.1.6.5 Name, address, and telephone number of all laboratories used by or proposed to be used by the permittee.
2.1.7 The permittee must amend the QAPP whenever sample collection, sample analysis, or other procedure addressed by the QAPP is modified.
2.1.8 Copies of the QAPP must be kept on site and made available to DEC upon request.
2.2 Operation and Maintenance Plan
2.2.1 In addition to requirements specified in Appendix A, Part 1.6 of this permit (Proper Operation and Maintenance), the permittee shall develop, maintain and implement an O&M plan for the wastewater treatment facility. An existing O&M plan may be modified under this section.
2.2.2 The permittee must submit written notice to DEC that the plan has been developed or modified and implemented within 180 days of the effective date of this permit.
2.2.3 All procedures in the previous O&M plan must be followed until the new O&M plan has been implemented.
2.2.4 The permittee shall ensure that the plan includes appropriate best management practices (BMPs). BMPs include measures that prevent or minimize the potential for the release of pollutants to Mendenhall River.
2.2.5 The permittee must ensure that the plan includes a maintenance schedule for the diffuser including a schedule for inspecting the diffuser.
2.2.6 The O&M plan must be reviewed annually and documentation of annual plan review by the permittee shall be retained on-site and made available to DEC upon request.
2.3 Facility Plan Requirement
2.3.1 The permittee must develop a Facility Plan that evaluates the facility’s existing condition and identifies near- and long-term needs and improvements appropriate for a 10-20 year planning period. A guidance manual for preparing a facility plan has been published by EPA (EPA-430/9-76-015 Construction Grants Program Requirements, 1975). Permittee may, at its discretion, follow procedures outlined in this publication. The finalized Facility Plan must be submitted with the application for APDES Permit Reissuance, at least 180 days before expiration of this permit.
2.3.2 The Facility Plan must include, but is not limited to:
2.3.2.1 An evaluation of existing wastewater treatment and disposal systems used by the facility. This section of the Facility Plan must assess performance relative to existing design capacity given current conditions and identify any existing deficiencies and/or problems;
2.3.2.2 A determination of the adequacy of the facility’s treatment process, maintenance program, process control measures, operating procedures, and records management protocols;
2.3.2.3 An evaluation of reasonably foreseeable future wasteloads and flows including, industrial dischargers;
June 23, 2014 Permit No. AK0022951 Page 14
2.3.2.4 An evaluation of future needs for treatment and infrastructure changes or upgrades, including identifying when changes or upgrades should be initiated;
2.3.2.5 A proposed schedule for implementation of specific recommendations identified from Sections 2.3.2.1-2.3.2.3; and
2.3.2.6 A specified schedule wherein the Facility Plan will be reviewed, revised, and amended in order to keep the plan up to date.
2.4 Pretreatment Requirements
2.4.1 The general prohibitions of the National Pretreatment Standards, adopted by reference at 18 AAC 83.010, require that the POTW must not allow non-domestic wastes from point sources covered by pretreatment standards, or sources subject to National Pretreatment Standards, to indirectly discharge or otherwise introduce into the POTW pollutants that would cause pass through or interference. The specific prohibitions of the National Pretreatment Standards, adopted by reference at 18 AAC 83.010, are described below in Section 2.4.2 and apply to all point sources discharging non-domestic waste that could introduce pollutants into the POTW whether or not the discharge is subject to other National Pretreatment Standards or any federal, state, or local requirements.
2.4.2 The permittee must not allow the introduction of the following pollutants into the POTW:
2.4.2.1 Pollutants that create a fire or explosion hazard in the POTW including, but not limited to, wastestreams with a closed cup flashpoint of less than 60 °C (140 degrees Fahrenheit (°F)) using the test methods specified in 40 CFR 261.21.
2.4.2.2 Pollutants that will cause corrosive structural damage to the POTW, but in no case discharges with pH lower than 5.0, unless the treatment is specifically designed to accommodate such discharges.
2.4.2.3 Solid or viscous pollutants in amounts that will cause obstruction to the flow in the POTW, including sewers, resulting in interference.
2.4.2.4 Any pollutant, including oxygen demanding pollutants (BOD5, etc.) released in a discharge at a flow rate and/or pollutant concentration that will cause interference with the POTW.
2.4.2.5 Heat in amounts that will inhibit biological activity in the POTW resulting in interference, but in no case heat in such quantities that the temperature at the POTW exceeds 40 °C (104 °F) unless the Department, upon request of the permittee, approves alternate temperature limits.
2.4.2.6 Petroleum oil, nonbiodegradable cutting oil, or products of mineral oil origin in amounts that will cause interference or pass through.
2.4.2.7 Pollutants that result in the presence of toxic gases, vapors, or fumes within the POTW in a quantity that may cause acute worker health and safety problems.
2.4.2.8 Any trucked or hauled pollutants, except at discharge points designated by the POTW.
June 23, 2014 Permit No. AK0022951 Page 15
2.4.3 The permittee must enforce any National Pretreatment Standards including the above listed prohibited discharges (40 CFR 403.5(a) and (b)), Categorical Standards (40 CFR 403.6), and locally developed effluent limits (40 CFR 403.5(c)), adopted by reference at 18 AAC 83.010(g)) in accordance with Sections 307(b) and (c) of the CWA.
2.4.4 The permittee must require any industrial user of its treatment works to comply with any applicable requirements in 40 CFR 403 through 471, adopted by reference in 18 AAC 83.010.
2.4.5 The permittee must implement and enforce local law and regulations (e.g. municipal code, sewer use ordinance) addressing the regulation of non-domestic users.
2.4.6 The permittee must retain all records relating to its pretreatment activities in accordance with 40 CFR 403.12(o), adopted by reference in 18 AAC 83.010, and must make such records available to DEC and/or EPA upon request.
2.4.7 The permittee must require SIUs to conduct wastewater sampling as specified in 40 CFR 403.12(e) or (h), adopted by reference at 18 AAC 83.010. Frequency of wastewater sampling by the SIUs must be appropriate for the character and volume of the wastewater but no less than once every six months. Sample collection and analysis must be performed in accordance with 40 CFR 403.12 (b)(5)(ii) through (v), adopted by reference at 18 AAC 83.010 and 40 CFR 136. If the permittee elects to conduct all of the non-domestic user monitoring for any SIU instead of requiring self-monitoring, the permittee must conduct sampling in accordance with the requirements of this paragraph.
2.4.8 The permittee must require all categorical and non-categorical users to notify the permittee immediately of all discharges that could cause problems to the POTW, including any slug loadings as defined by 40 CFR 403.5 adopted by reference at 18 AAC 83.010. As soon as the permittee becomes aware of such discharges, the permittee must immediately implement slug control response measures consistent with the Guidance Manual for Control of Slug Loadings to POTWs, EPA, 1991.
2.4.9 The permittee must enforce and obtain remedies for any industrial user noncompliance with applicable pretreatment standards and requirements or local law and regulations. This must include timely and appropriate reviews of industrial reports to identify all violations of the local ordinance and federal pretreatment standards and requirements. Once violations have been uncovered, the permittee must take timely and appropriate action to address the noncompliance.
2.5 Identification Sign(s)
The permittee shall continue to post a sign or signs on the shoreline adjacent to the discharge point that indicate the name and contact number for the facility, the permit number, the type of discharge (treated domestic wastewater), and the approximate location and size of the mixing zone. The sign(s) must inform the public that certain activities, such as harvesting of aquatic life for raw consumption and primary contact recreation, should not take place in the mixing zone.
2.6 Removed Substances
Collected screenings, grit, solids, scum, and other facility residuals, or other pollutants removed in the course of treatment or control of water and wastewaters shall be disposed of in a Department approved manner and method in accordance with 18 AAC 60, such as to prevent any pollution from such materials from entering navigable waters.
June 23 2014 Permit No. AK0022951 Page A-1
APPENDIX A. Standard Conditions
Appendix A
Standard Conditions
APDES Individual Permit Publicly Owned Treatment Works
TABLE OF CONTENTS
1.0 Standard Conditions Applicable to All Permits ..................................................................... A-1
1.1 Contact Information and Addresses .................................................................................................. A-1 1.2 Duty to Comply ................................................................................................................................. A-1 1.3 Duty to Reapply ................................................................................................................................ A-2 1.4 Need to Halt or Reduce Activity Not a Defense ............................................................................... A-2 1.5 Duty to Mitigate ................................................................................................................................ A-2 1.6 Proper Operation and Maintenance ................................................................................................... A-2 1.7 Permit Actions ................................................................................................................................... A-2 1.8 Property Rights .................................................................................................................................. A-2 1.9 Duty to Provide Information ............................................................................................................. A-2 1.10 Inspection and Entry ......................................................................................................................... A-3 1.11 Monitoring and Records .................................................................................................................... A-3 1.12 Signature Requirement and Penalties ................................................................................................ A-4 1.13 Proprietary or Confidential Information............................................................................................ A-5 1.14 Oil and Hazardous Substance Liability ............................................................................................. A-5 1.15 Cultural and Paleontological Resources ............................................................................................ A-6 1.16 Fee ..................................................................................................................................................... A-6 1.17 Other Legal Obligations .................................................................................................................... A-6
2.0 Special Reporting Obligations .................................................................................................. A-6
2.1 Planned Changes ............................................................................................................................... A-6 2.2 Anticipated Noncompliance .............................................................................................................. A-6 2.3 Transfers ............................................................................................................................................ A-7 2.4 Compliance Schedules ...................................................................................................................... A-7 2.5 Corrective Information ...................................................................................................................... A-7 2.6 Bypass of Treatment Facilities .......................................................................................................... A-7 2.7 Upset Conditions ............................................................................................................................... A-8 2.8 Notice of New Introduction of Pollutants ......................................................................................... A-8
3.0 Monitoring, Recording, and Reporting Requirements .......................................................... A-8
3.1 Representative Sampling ................................................................................................................... A-8 3.2 Reporting of Monitoring Results ....................................................................................................... A-8 3.3 Additional Monitoring by Permittee ................................................................................................. A-9 3.4 Twenty-four Hour Reporting ............................................................................................................ A-9 3.5 Other Noncompliance Reporting .................................................................................................... A-10
4.0 Penalties for Violations of Permit Conditions ....................................................................... A-10
4.1 Civil Action ..................................................................................................................................... A-10 4.2 Injunctive Relief .............................................................................................................................. A-11 4.3 Criminal Action ............................................................................................................................... A-11 4.4 Other Fines ...................................................................................................................................... A-11
Appendix A, Standard Conditions is an integral and enforceable part of the permit. Failure to comply with a Standard Condition in this Appendix constitutes a violation of the permit and is subject to enforcement.
1.0 Standard Conditions Applicable to All Permits
1.1 Contact Information and Addresses
1.1.1 Permitting Program Documents, reports, and plans required under the permit and Appendix A are to be sent to the following address:
State of Alaska Department of Environmental Conservation
Division of Water Wastewater Discharge Authorization Program
555 Cordova Street Anchorage, Alaska 99501 Telephone (907) 269-6285
Fax (907) 269-3487 Email: [email protected]
1.1.2 Compliance and Enforcement Program Documents and reports required under the permit and Appendix A relating to compliance are to be sent to the following address:
State of Alaska
Department of Environmental Conservation Division of Water
Compliance and Enforcement Program 555 Cordova Street
Anchorage, Alaska 99501 Telephone Nationwide (877) 569-4114
Anchorage Area / International (907) 269-4114Fax (907) 269-4604
Email: [email protected]
1.2 Duty to Comply
A permittee shall comply with all conditions of the permittee’s APDES permit. Any permit noncompliance constitutes a violation of 33 U.S.C 1251-1387 (Clean Water Act) and state law and is grounds for enforcement action including termination, revocation and reissuance, or modification of a permit, or denial of a permit renewal application. A permittee shall comply with effluent standards or prohibitions established under 33 U.S.C. 1317(a) for toxic pollutants within the time provided in the regulations that establish those effluent standards or prohibitions even if the permit has not yet been modified to incorporate the requirement.
A-1
1.3 Duty to Reapply
If a permittee wishes to continue an activity regulated by this permit after its expiration date, the permittee must apply for and obtain a new permit. In accordance with 18 AAC 83.105(b), a permittee with a currently effective permit shall reapply by submitting a new application at least 180 days before the existing permit expires, unless the Department has granted the permittee permission to submit an application on a later date. However, the Department will not grant permission for an application to be submitted after the expiration date of the existing permit.
1.4 Need to Halt or Reduce Activity Not a Defense
In an enforcement action, a permittee may not assert as a defense that compliance with the conditions of the permit would have made it necessary for the permittee to halt or reduce the permitted activity.
1.5 Duty to Mitigate
A permittee shall take all reasonable steps to minimize or prevent any discharge in violation of this permit that has a reasonable likelihood of adversely affecting human health or the environment.
1.6 Proper Operation and Maintenance
1.6.1 A permittee shall at all times properly operate and maintain all facilities and systems of treatment and control and related appurtenances that the permittee installs or uses to achieve compliance with the conditions of the permit. The permittee’s duty to operate and maintain properly includes using adequate laboratory controls and appropriate quality assurance procedures. However, a permittee is not required to operate back-up or auxiliary facilities or similar systems that a permittee installs unless operation of those facilities is necessary to achieve compliance with the conditions of the permit.
1.6.2 Operation and maintenance records shall be retained and made available at the site. 1.6.3 In accordance with 18 AAC 72.065, the owner of operator of a domestic system that has 100
or more service connections or that is used, or intended for use, by 500 or more people per day shall ensure that the system is operated by a person certified under 18 AAC 74.
1.7 Permit Actions
A permit may be modified, revoked and reissued, or terminated for cause as provided in 18 AAC 83.130. If a permittee files a request to modify, revoke and reissue, or terminate a permit, or gives notice of planned changes or anticipated noncompliance, the filing or notice does not stay any permit condition.
1.8 Property Rights A permit does not convey any property rights or exclusive privilege.
1.9 Duty to Provide Information
A permittee shall, within a reasonable time, provide to the Department any information that the Department requests to determine whether a permittee is in compliance with the permit, or whether cause exists to modify, revoke and reissue, or terminate the permit. A permittee shall also provide to the Department, upon request, copies of any records the permittee is required to keep under the permit.
A-2
1.10 Inspection and Entry
A permittee shall allow the Department, or an authorized representative, including a contractor acting as a representative of the Department, at reasonable times and on presentation of credentials establishing authority and any other documents required by law, to:
1.10.1 Enter the premises where a permittee’s regulated facility or activity is located or conducted, or where permit conditions require records to be kept;
1.10.2 Have access to and copy any records that permit conditions require the permittee to keep; 1.10.3 Inspect any facilities, equipment, including monitoring and control equipment, practices, or
operations regulated or required under a permit; and 1.10.4 Sample or monitor any substances or parameters at any location for the purpose of assuring
permit compliance or as otherwise authorized by 33 U.S.C. 1251-1387 (Clean Water Act).
1.11 Monitoring and Records A permittee must comply with the following monitoring and recordkeeping conditions:
1.11.1 Samples and measurements taken for the purpose of monitoring must be representative of the monitored activity.
1.11.2 The permittee shall retain records in Alaska of all monitoring information for at least three years, or longer at the Department’s request at any time, from the date of the sample, measurement, report, or application. Monitoring records required to be kept include:
1.11.2.1 All calibration and maintenance records,
1.11.2.2 All original strip chart recordings or other forms of data approved by the Department for continuous monitoring instrumentation,
1.11.2.3 All reports required by a permit,
1.11.2.4 Records of all data used to complete the application for a permit,
1.11.2.5 Field logbooks or visual monitoring logbooks,
1.11.2.6 Quality assurance chain of custody forms,
1.11.2.7 Copies of discharge monitoring reports, and
1.11.2.8 A copy of this APDES permit.
1.11.3 Records of monitoring information must include:
1.11.3.1 The date, exact place, and time of any sampling or measurement;
1.11.3.2 The name(s) of any individual(s) who performed the sampling or measurement(s);
1.11.3.3 The date(s) and time any analysis was performed;
1.11.3.4 The name(s) of any individual(s) who performed any analysis;
1.11.3.5 Any analytical technique or method used; and
1.11.3.6 The results of the analysis.
1.11.4 Monitoring Procedures
Analyses of pollutants must be conducted using test procedures approved under 40 CFR Part 136, adopted by reference at 18 AAC 83.010, for pollutants with approved test procedures, and using test procedures specified in the permit for pollutants without approved methods.
A-3
1.12 Signature Requirement and Penalties
1.12.1 Any application, report, or information submitted to the Department in compliance with a permit requirement must be signed and certified in accordance with 18 AAC 83.385. Any person who knowingly makes any false material statement, representation, or certification in any application, record, report, or other document filed or required to be maintained under a permit, or who knowingly falsifies, tampers with, or renders inaccurate any monitoring device or method required to be maintained under this permit shall, upon conviction, be subject to penalties under 33 U.S.C. 1319(c)(4), AS 12.55.035(c)(1)(B), (c)(2) and (c)(3), and AS 46.03.790(g).
1.12.2 In accordance with 18 AAC 83.385, an APDES permit application must be signed as follows:
1.12.2.1 For a corporation, a responsible corporate officer shall sign the application; in this subsection, a responsible corporate officer means:
1.12.2.1.1 A president, secretary, treasurer, or vice-president of the corporation in charge of a principal business function, or any other person who performs similar policy- or decision-making functions for the corporation; or
1.12.2.1.2 The manager of one of more manufacturing, production, or operating facilities, if
1.12.2.1.2.1 The manager is authorized to make management decisions that govern the operation of the regulated facility, including having the explicit or implicit duty of making major capital investment recommendations, and initiating and directing other comprehensive measures to assure long term environmental compliance with environmental statutes and regulations;
1.12.2.1.2.2 The manager can ensure that the necessary systems are established or actions taken to gather complete and accurate information for permit application requirements; and
1.12.2.1.2.3 Authority to sign documents has been assigned or delegated to the manager in accordance with corporate procedures.
1.12.2.2 For a partnership or sole proprietorship, by the general partner or the proprietor, respectively, shall sign the application.
1.12.2.3 For a municipality, state, federal, or other public agency, either a principal executive officer or ranking elected official shall sign the application; in this subsection, a principal executive officer of an agency means:
1.12.2.3.1 The chief executive officer of the agency; or
1.12.2.3.2 A senior executive officer having responsibility for the overall operations of a principal geographic unit or division of the agency.
1.12.3 Any report required by an APDES permit, and a submittal with any other information requested by the Department, must be signed by a person described in Appendix A, Part 1.12.2, or by a duly authorized representative of that person. A person is a duly authorized representative only if:
1.12.3.1 The authorization is made in writing by a person described in Appendix A, Part 1.12.2;
A-4

1.12.3.2 The authorization specifies either an individual or a position having responsibility for the overall operation of the regulated facility or activity, including the position of plant manager, operator of a well or a well field, superintendent, or position of equivalent responsibility; or an individual or position having overall responsibility for environmental matters for the company; and
1.12.3.3 The written authorization is submitted to the Department to the Permitting Program address in Appendix A, Part 1.1.1.
1.12.4 If an authorization under Appendix A, Part 1.12.3 is no longer effective because a different individual or position has responsibility for the overall operation of the facility, a new authorization satisfying the requirements of Appendix A, Part 1.12.3 must be submitted to the Department before or together with any report, information, or application to be signed by an authorized representative.
1.12.5 Any person signing a document under Appendix A, Part 1.12.2 or Part 1.12.3 shall certify as follows:
"I certify under penalty of law that this document and all attachments were prepared under my direction or supervision in accordance with a system designed to assure that qualified personnel properly gather and evaluate the information submitted. Based on my inquiry of the person or persons who manage the system, or those persons directly responsible for gathering the information, the information submitted is, to the best of my knowledge and belief, true, accurate, and complete. I am aware that there are significant penalties for submitting false information, including the possibility of fine and imprisonment for knowing violations."
1.13 Proprietary or Confidential Information
1.13.1 A permit applicant or permittee may assert a claim of confidentiality for proprietary or confidential business information by stamping the words “confidential business information” on each page of a submission containing proprietary or confidential business information. The Department will treat the stamped submissions as confidential if the information satisfies the test in 40 CFR §2.208, adopted by reference at 18 AAC 83.010, and is not otherwise required to be made public by state law.
1.13.2 A claim of confidentiality under Appendix A, Part 1.13.1 may not be asserted for the name and address of any permit applicant or permittee, a permit application, a permit, effluent data, sewage sludge data, and information required by APDES or NPDES application forms provided by the Department, whether submitted on the forms themselves or in any attachments used to supply information required by the forms.
1.13.3 A permittee’s claim of confidentiality authorized under Appendix A, Part 1.13.1 is not waived if the Department provides the proprietary or confidential business information to the EPA or to other agencies participating in the permitting process. The Department will supply any information obtained or used in the administration of the state APDES program to the EPA upon request under 40 CFR §123.41, as revised as of July 1, 2005. When providing information submitted to the Department with a claim of confidentiality to the EPA, the Department will notify the EPA of the confidentiality claim. If the Department provides the EPA information that is not claimed to be confidential, the EPA may make the information available to the public without further notice.
1.14 Oil and Hazardous Substance Liability
Nothing in this permit shall be construed to preclude the institution of any action or relieve a permittee
A-5
from any responsibilities, liabilities, or penalties to which the permittee is or may be subject to under state laws addressing oil and hazardous substances.
1.15 Cultural and Paleontological Resources
If cultural or paleontological resources are discovered because of this disposal activity, work that would disturb such resources is to be stopped, and the Office of History and Archaeology, a Division of Parks and Outdoor Recreation of the Alaska Department of Natural Resources (http://www.dnr.state.ak.us/parks/oha/), is to be notified immediately at (907) 269-8721.
1.16 Fee
A permittee must pay the appropriate permit fee described in 18 AAC 72.
1.17 Other Legal Obligations
This permit does not relieve the permittee from the duty to obtain any other necessary permits from the Department or from other local, state, or federal agencies and to comply with the requirements contained in any such permits. All activities conducted and all plan approvals implemented by the permittee pursuant to the terms of this permit shall comply with all applicable local, state, and federal laws and regulations.
2.0 Special Reporting Obligations
2.1 Planned Changes
2.1.1 The permittee shall give notice to the Department as soon as possible of any planned physical alteration or addition to the permitted facility if:
2.1.1.1 The alteration or addition may make the facility a “new source” under one or more of the criteria in 18 AAC 83.990(44); or
2.1.1.2 The alteration or addition could significantly change the nature or increase the quantity of pollutants discharged if those pollutants are not subject to effluent limitations in the permit or to notification requirements under 18 AAC 83.610.
2.1.2 If the proposed changes are subject to plan review, then the plans must be submitted at least 30 days before implementation of changes (see 18 AAC 15.020 and 18 AAC 72 for plan review requirements). Written approval is not required for an emergency repair or routine maintenance.
2.1.3 Written notice must be sent to the Permitting Program address in Appendix A, Part 1.1.1.
2.2 Anticipated Noncompliance
2.2.1 A permittee shall give seven days’ notice to the Department before commencing any planned change in the permitted facility or activity that may result in noncompliance with permit requirements.
2.2.2 Written notice must be sent to the Compliance and Enforcement Program address in Appendix A, Part 1.1.2.
A-6

2.3 Transfers
2.3.1 A permittee may not transfer a permit for a facility or activity to any person except after notice to the Department in accordance with 18 AAC 83.150. The Department may modify or revoke and reissue the permit to change the name of the permittee and incorporate such other requirements under 33 U.S.C. 1251-1387 (Clean Water Act) or state law.
2.3.2 Written notice must be sent to the Permitting Program address in Appendix A, Part 1.1.1.
2.4 Compliance Schedules
2.4.1 A permittee must submit progress or compliance reports on interim and final requirements in any compliance schedule of a permit no later than 14 days following the scheduled date of each requirement.
2.4.2 Written notice must be sent to the Compliance and Enforcement Program address in Appendix A, Part 1.1.2.
2.5 Corrective Information
2.5.1 If a permittee becomes aware that it failed to submit a relevant fact in a permit application or submitted incorrect information in a permit application or in any report to the Department, the permittee shall promptly submit the relevant fact or the correct information.
2.5.2 Information must be sent to the Permitting Program address in Appendix A, Part 1.1.1.
2.6 Bypass of Treatment Facilities
2.6.1 Prohibition of Bypass
Bypass is prohibited. The Department may take enforcement action against a permittee for any bypass, unless:
2.6.1.1 The bypass was unavoidable to prevent loss of life, personal injury, or severe property damage;
2.6.1.2 There were no feasible alternatives to the bypass, including use of auxiliary treatment facilities, retention of untreated wastes, or maintenance during normal periods of equipment downtime. However, this condition is not satisfied if the permittee, in the exercise of reasonable engineering judgment, should have installed adequate back-up equipment to prevent a bypass that occurred during normal periods of equipment downtime or preventive maintenance; and
2.6.1.3 The permittee provides notice to the Department of a bypass event in the manner, as appropriate, under Appendix A, Part 2.6.2.
2.6.2 Notice of bypass
2.6.2.1 For an anticipated bypass, the permittee submits notice at least 10 days before the date of the bypass. The Department may approve an anticipated bypass, after considering its adverse effects, if the Department determines that it will meet the conditions of Appendix A, Parts 2.6.1.1 and 2.6.1.2.
2.6.2.2 For an unanticipated bypass, the permittee submits 24-hour notice, as required in 18 AAC 83.410(f) and Appendix A, Part 3.4, Twenty-four Hour Reporting.
2.6.2.3 Written notice must be sent to the Compliance and Enforcement Program address in Appendix A, Part 1.1.2.
2.6.3 Notwithstanding Appendix A, Part 2.6.1, a permittee may allow a bypass that:
A-7
2.6.3.1 Does not cause an effluent limitation to be exceeded, and
2.6.3.2 Is for essential maintenance to assure efficient operation.
2.7 Upset Conditions
2.7.1 In any enforcement action for noncompliance with technology-based permit effluent limitations, a permittee may claim upset as an affirmative defense. A permittee seeking to establish the occurrence of an upset has the burden of proof to show that the requirements of Appendix A, Part 2.7.2 are met.
2.7.2 To establish the affirmative defense of upset, the permittee must demonstrate, through properly signed, contemporaneous operating logs or other relevant evidence that:
2.7.2.1 An upset occurred and the permittee can identify the cause or causes of the upset;
2.7.2.2 The permitted facility was at the time being properly operated;
2.7.2.3 The permittee submitted 24-hour notice of the upset, as required in 18 AAC 83.410(f) and Appendix A, Part 3.4, Twenty-four Hour Reporting; and
2.7.2.4 The permittee complied with any mitigation measures required under 18 AAC 83.405(e) and Appendix A, Part 1.5, Duty to Mitigate.
2.7.3 Any determination made in administrative review of a claim that noncompliance was caused by upset, before an action for noncompliance is commenced, is not final administrative action subject to judicial review.
2.8 Notice of New Introduction of Pollutants
2.8.1 Any POTW shall provide adequate notice to the Department, including information on the quality and quantity of effluent introduced into the POTW, and any anticipated impact of the change on the quantity or quality of effluent to be discharged from the POTW as soon as the POTW has knowledge of a change, but no later than seven days in advance of any:
2.8.1.1 New introduction of pollutants into the POTW from an indirect discharger if that introduction of pollutants would be subject to 33 U.S.C 1311 or 33 U.S.C 1316 if the POTW directly discharged those pollutants, and
2.8.1.2 Substantial change in the volume or character of pollutants being introduced into that POTW by a source introducing pollutants into the POTW at the time of issuance of the permit.
2.8.2 Written notice must be sent to the Permitting Program address in Appendix A, Part 1.1.1.
3.0 Monitoring, Recording, and Reporting Requirements
3.1 Representative Sampling
A permittee must collect effluent samples from the effluent stream after the last treatment unit before discharge into the receiving waters. Samples and measurements must be representative of the volume and nature of the monitored activity or discharge.
3.2 Reporting of Monitoring Results
At intervals specified in the permit, monitoring results must be reported on the EPA discharge monitoring report (DMR) form, as revised as of March 1999, adopted by reference.
A-8
3.2.1 Monitoring results shall be summarized each month on the DMR or an approved equivalent report. The permittee must submit reports monthly postmarked by the 15th day of the following month.
3.2.2 The permittee must sign and certify all DMRs and all other reports in accordance with the requirements of Appendix A, Part 1.12, Signatory Requirements and Penalties. All signed and certified legible original DMRs and all other documents and reports must be submitted to the Department at the Compliance and Enforcement Program address in Appendix A, Part 1.1.2.
3.2.3 If, during the period when this permit is effective, the Department makes available electronic reporting, the permittee may, as an alternative to the requirements of Appendix A, Part 3.2.2, submit monthly DMRs electronically by the 15th day of the following month in accordance with guidance provided by the Department. The permittee must certify all DMRs and other reports, in accordance with the requirements of Appendix A, Part 1.12, Signatory Requirements and Penalties. The permittee must retain the legible originals of these documents and make them available to the Department upon request.
3.3 Additional Monitoring by Permittee
If the permittee monitors any pollutant more frequently than the permit requires using test procedures approved in 40 CFR Part 136, adopted by reference at 18 AAC 83.010, or as specified in this permit, the results of that additional monitoring must be included in the calculation and reporting of the data submitted in the DMR required by Appendix A, Part 3.2. All limitations that require averaging of measurements must be calculated using an arithmetic means unless the Department specifies another method in the permit. Upon request by the Department, the permittee must submit the results of any other sampling and monitoring regardless of the test method used.
3.4 Twenty-four Hour Reporting
A permittee shall report any noncompliance event that may endanger health or the environment as follows:
3.4.1 A report must be made:
3.4.1.1 Orally within 24 hours after the permittee becomes aware of the circumstances, and
3.4.1.2 In writing within five days after the permittee becomes aware of the circumstances.
3.4.2 A report must include the following information:
3.4.2.1 A description of the noncompliance and its causes, including the estimated volume or weight and specific details of the noncompliance;
3.4.2.2 The period of noncompliance, including exact dates and times;
3.4.2.3 If the noncompliance has not been corrected, a statement regarding the anticipated time the noncompliance is expected to continue; and
3.4.2.4 Steps taken or planned to reduce, eliminate, and prevent reoccurrence of the noncompliance.
3.4.3 An event that must be reported within 24 hours includes:
3.4.3.1 An unanticipated bypass that exceeds any effluent limitation in the permit (see Appendix A, Part 2.6, Bypass of Treatment Facilities).
A-9

3.4.3.2 An upset that exceeds any effluent limitation in the permit (see Appendix A, Part 2.7, Upset Conditions).
3.4.3.3 A violation of a maximum daily discharge limitation for any of the pollutants listed in the permit as requiring 24-hour reporting.
3.4.4 The Department may waive the written report on a case-by-case basis for reports under Appendix A, Part 3.4 if the oral report has been received within 24 hours of the permittee becoming aware of the noncompliance event.
3.4.5 The permittee may satisfy the written reporting submission requirements of Appendix A, Part 3.4.1.2 by submitting the written report via email, if the following conditions are met:
3.4.5.1 The Noncompliance Notification Form or equivalent form is used to report the noncompliance;
3.4.5.2 The written report includes all the information required under Appendix A, Part 3.4.2;
3.4.5.3 The written report is properly certified and signed in accordance with Appendix A, Parts 1.12.3 and 1.12.5.;
3.4.5.4 The written report is scanned as a PDF (portable document format) document and transmitted to the Department as an attachment to the email; and
3.4.5.5 The permittee retains in the facility file the original signed and certified written report and a printed copy of the conveying email.
3.4.6 The email and PDF written report will satisfy the written report submission requirements of this permit provided the email is received by the Department within five days after the time the permittee becomes aware of the noncompliance event, and the email and written report satisfy the criteria of Part 3.4.5. The email address to report noncompliance is: [email protected]
3.5 Other Noncompliance Reporting
A permittee shall report all instances of noncompliance not required to be reported under Appendix A, Parts 2.4 (Compliance Schedules), 3.3 (Additional Monitoring by Permittee), and 3.4 (Twenty-four Hour Reporting) at the time the permittee submits monitoring reports under Appendix A, Part 3.2 (Reporting of Monitoring Results). A report of noncompliance under this part must contain the information listed in Appendix A, Part 3.4.2 and be sent to the Compliance and Enforcement Program address in Appendix A, Part 1.1.2.
4.0 Penalties for Violations of Permit Conditions
Alaska laws allow the State to pursue both civil and criminal actions concurrently. The following is a summary of Alaska law. The permittee should read the applicable statutes for further substantive and procedural details.
4.1 Civil Action
Under AS 46.03.760(e), a person who violates or causes or permits to be violated a regulation, a lawful order of the Department, or a permit, approval, or acceptance, or term or condition of a permit, approval or acceptance issued under the program authorized by AS 46.03.020 (12) is liable, in a civil action, to the state for a sum to be assessed by the court of not less than $500 nor more than $100,000 for the initial violation, nor more than $10,000 for each day after that on which the violation continues,
A-10
A-11
and that shall reflect, when applicable: 4.1.1 Reasonable compensation in the nature of liquated damages for any adverse environmental
effects caused by the violation, that shall be determined by the court according to the toxicity, degradability, and dispersal characteristics of the substance discharged, the sensitivity of the receiving environment, and the degree to which the discharge degrades existing environmental quality;
4.1.2 Reasonable costs incurred by the state in detection, investigation, and attempted correction of the violation;
4.1.3 The economic savings realized by the person in not complying with the requirements for which a violation is charged; and
4.1.4 The need for an enhanced civil penalty to deter future noncompliance.
4.2 Injunctive Relief
4.2.1 Under AS 46.03.820, the Department can order an activity presenting an imminent or present danger to public health or that would be likely to result in irreversible damage to the environment be discontinued. Upon receipt of such an order, the activity must be immediately discontinued.
4.2.2 Under AS 46.03.765, the Department can bring an action in Alaska Superior Court seeking to enjoin ongoing or threatened violations for Department-issued permits and Department statutes and regulations.
4.3 Criminal Action
Under AS 46.03.790(h), a person is guilty of a Class A misdemeanor if the person negligently: 4.3.1 Violates a regulation adopted by the Department under AS 46.03.020(12); 4.3.2 Violates a permit issued under the program authorized by AS 46.03.020(12); 4.3.3 Fails to provide information or provides false information required by a regulation adopted
under AS 46.03.020(12); 4.3.4 Makes a false statement, representation, or certification in an application, notice, record,
report, permit, or other document filed, maintained, or used for purposes of compliance with a permit issued under or a regulation adopted under AS 46.03.020(12); or
4.3.5 Renders inaccurate a monitoring device or method required to be maintained by a permit issued or under a regulation adopted under AS 46.03.020(12).
4.4 Other Fines
Upon conviction of a violation of a regulation adopted under AS 46.03.020(12), a defendant who is not an organization may be sentenced to pay a fine of not more than $10,000 for each separate violation (AS 46.03.790(g)). A defendant that is an organization may be sentenced to pay a fine not exceeding the greater of: (1) $200,000; (2) three times the pecuniary gain realized by the defendant as a result of the offense; or (3) three times the pecuniary damage or loss caused by the defendant to another, or the property of another, as a result of the offense (AS 12.55.035(c)(1)(B), (c)(2), and (c)(3)).

June 23, 2014 Permit No. AK0022951 Page B-1
APPENDIX B. Acronyms
Appendix B
Acronyms

June 23, 2014 Permit No. AK0022951 Page B-2
The following acronyms are common terms that may be found in an Alaska Pollutant Discharge Elimination System (APDES) permit and fact sheet.
18 AAC 15 Alaska Administrative Code. Title 18 Environmental Conservation, Chapter 15: Administrative Procedures
18 AAC 70 Alaska Administrative Code. Title 18 Environmental Conservation, Chapter 70: Water Quality Standards
18 AAC 72 Alaska Administrative Code. Title 18 Environmental Conservation, Chapter 72: Wastewater Disposal
18 AAC 83 Alaska Administrative Code. Title 18 Environmental Conservation, Chapter 83: Alaska Pollutant Discharge Elimination System
All chapters of Alaska Administrative Code, Title 18 are available at the Alaska Administrative Code database http://www.legis.state.ak.us/cgi-bin/folioisa.dll/aac 1Q10
30B3
7Q10
40 CFR
Lowest One-Day Average Flow Rate Expected to Occur Once Every 10 Years
Biologically-Based Flow - Excursion Freq. < Once Every 3 Years for 30-day Average Flow
Lowest 7-Day Average Flow Rate Expected to Occur Once Every 10 Years
Code of Federal Regulations Title 40: Protection of Environment
AAC Alaska Administrative Code
ADEC Alaska Department of Environmental Conservation
ADF&G Alaska Department of Fish and Game
Ag Silver
AML Average Monthly Limit
APDES Alaska Pollutant Discharge Elimination System
AS Alaska Statutes
AS 46.03 Alaska Statutes Title 46, Chapter 03: Environmental Conservation. Available at http://www.legis.state.ak.us/default.htm
BOD5 Biochemical Oxygen Demand, 5-day
BMP Best Management Practice
CBJ City and Borough of Juneau
CFR
CFS or cfs
COD
Code of Federal Regulations
Cubic Feet Per Second
Chemical Oxygen Demand
Cu Copper
CV
CWA
Coefficient Variation
Clean Water Act
DEC Department of Environmental Conservation
DL Method Detection Limit
DMR Discharge Monitoring Report
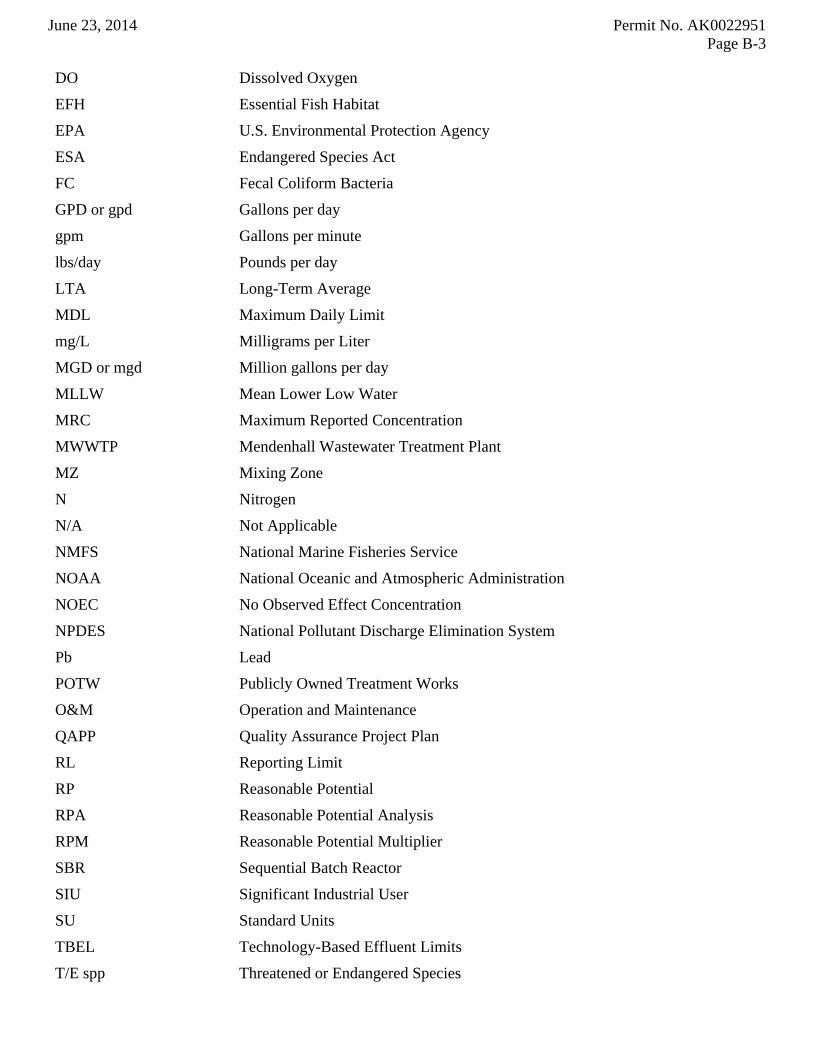
June 23, 2014 Permit No. AK0022951 Page B-3
DO Dissolved Oxygen
EFH
EPA
Essential Fish Habitat
U.S. Environmental Protection Agency
ESA
FC
Endangered Species Act
Fecal Coliform Bacteria
GPD or gpd Gallons per day
gpm Gallons per minute
lbs/day Pounds per day
LTA Long-Term Average
MDL
mg/L
Maximum Daily Limit
Milligrams per Liter
MGD or mgd Million gallons per day
MLLW Mean Lower Low Water
MRC
MWWTP
MZ
Maximum Reported Concentration
Mendenhall Wastewater Treatment Plant
Mixing Zone
N Nitrogen
N/A Not Applicable
NMFS
NOAA
NOEC
National Marine Fisheries Service
National Oceanic and Atmospheric Administration
No Observed Effect Concentration
NPDES
Pb
National Pollutant Discharge Elimination System
Lead
POTW Publicly Owned Treatment Works
O&M Operation and Maintenance
QAPP Quality Assurance Project Plan
RL Reporting Limit
RP Reasonable Potential
RPA
RPM
Reasonable Potential Analysis
Reasonable Potential Multiplier
SBR Sequential Batch Reactor
SIU Significant Industrial User
SU Standard Units
TBEL Technology-Based Effluent Limits
T/E spp Threatened or Endangered Species
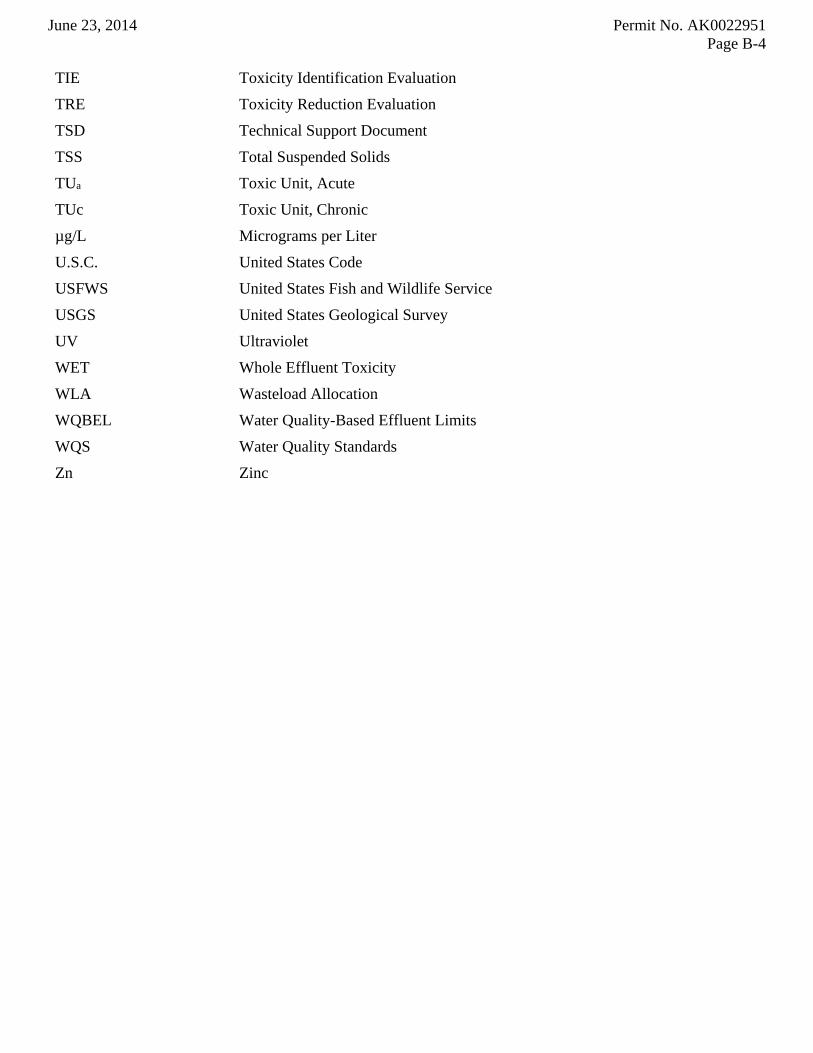
June 23, 2014 Permit No. AK0022951 Page B-4
TIE Toxicity Identification Evaluation
TRE Toxicity Reduction Evaluation
TSD
TSS
TUa
Technical Support Document
Total Suspended Solids
Toxic Unit, Acute
TUc Toxic Unit, Chronic
µg/L Micrograms per Liter
U.S.C. United States Code
USFWS United States Fish and Wildlife Service
USGS
UV
WET
WLA
WQBEL
WQS
United States Geological Survey
Ultraviolet
Whole Effluent Toxicity
Wasteload Allocation
Water Quality-Based Effluent Limits
Water Quality Standards
Zn Zinc
June 23, 2014 Permit No. AK0022951 Page C-1
APPENDIX C. Definitions
Appendix C
Definitions
June 23, 2014 Permit No. AK0022951 Page C-2
a) See 18 AAC 83 b) See 18 AAC 70.990 c) See 18 AAC 72.990 d) See 40 CFR Part 136 e) See EPA Technical Support Document f) See Standard Methods for the Examination of Water and Wastewater 18th Edition g) See EPA Permit Writers Manual
The following are common definitions of terms associated with APDES permits. Not all the terms listed may appear in a permit. Consult the footnote references for a complete list of terms and definitions.
Administratora Means the Administrator of the EPA or an authorized representative
Alaska Pollutant Discharge Elimination System (APDES)a
Means the state’s program, approved by EPA under 33 U.S.C. 1342(b), for issuing, modifying, revoking and reissuing, terminating, monitoring and enforcing permits and imposing and enforcing pretreatment requirements under 33 U.S.C. 1317, 1328, 1342, and 1345
Annual Means once per calendar year
Aquacultureb Means the cultivation of aquatic plants or animals for human use or consumption
Average Means an arithmetic mean obtained by adding quantities and dividing the sum by the number of quantities
Average Monthly Discharge Limitationa
Means the highest allowable average of “daily discharges” over a calendar month calculated as the sum of all “daily discharges” measured during a calendar month divided by the number of “daily discharges” measured for that month
Best Management Practices (BMPs)a
Means schedules of activities, prohibitions of practices, maintenance procedures, and other management practices to prevent or reduce the pollution of waters of the United States. BMPs also include treatment requirements, operating procedures, and practices to control plant site runoff, spillage or leaks, sludge or waste disposal, or drainage from raw material storage areas.
Biochemical Oxygen Demand, 5-day (BOD5)
Means the amount, in milligrams per liter, of oxygen used in the biochemical oxidation of organic matter in five days at 20º C
Boundaryb Means line or landmark that serves to clarify, outline, or mark a limit, border, or interface
Bypassa Means the intentional diversion of waste streams from any portion of a treatment facility
Chemical Oxygen Demand (COD)f
Is used as a measure of the oxygen equivalent of the organic matter content of a sample that is susceptible to oxidation by a strong chemical oxidant
Clean Water Act (CWA)a
Means the federal law codified at 33 U.S.C. 1251-1387, also referred to as the Federal Water Pollution Control Act or Federal Water Pollution Control Act Amendments of 1972
Commissionera Means the commissioner of the Alaska Department of Environmental Conservation or the commissioner’s designee
Composite Samples Composite samples must consist of at least eight equal volume grab samples. 24 hour composite sample means a combination of at least eight discrete samples of equal volume collected at equal time intervals over a 24-hour period at the same location. A "flow proportional composite" sample means a combination of at least eight discrete samples collected at equal time intervals over a 24-hour period with each sample volume proportioned according to the flow volume. The sample aliquots must be

June 23, 2014 Permit No. AK0022951 Page C-3
a) See 18 AAC 83 b) See 18 AAC 70.990 c) See 18 AAC 72.990 d) See 40 CFR Part 136 e) See EPA Technical Support Document f) See Standard Methods for the Examination of Water and Wastewater 18th Edition g) See EPA Permit Writers Manual
collected and stored in accordance with procedures prescribed in the most recent edition of Standard Methods for the Examination of Water and Wastewater.
Contact Recreationb Means activities in which there is direct and intimate contact with water. Contact recreation includes swimming, diving, and water skiing. Contact recreation does not include wading.
Criterionb Means a set concentration or limit of a water quality parameter that, when not exceeded, will protect an organism, a population of organisms, a community of organisms, or a prescribed water use with a reasonable degree of safety. A criterion might be a narrative statement instead of a numerical concentration or limit.
Daily Dischargea Means the discharge of a pollutant measured during a calendar day or any 24-hour period that reasonably represents the calendar day for the purposes of sampling. For pollutants measured in units of mass, the “daily discharge” is calculated as the total mass of the pollutant discharged over the day. For pollutants with a limitation expressed in other units of measurement, the “daily discharge” is calculated as the average measurement of the pollutant over the day.
Datum A datum defines the position of the spheroid, a mathematical representation of the earth, relative to the center of the earth. It provides a frame of reference for measuring locations on the surface of the earth by defining the origin and orientation of latitude and longitude lines.
Departmenta Means the Alaska Department of Environmental Conservation
Design Flowa Means the wastewater flow rate that the plant was designed to handle
Directora Means the commissioner or the commissioner’s designee assigned to administer the APDES program or a portion of it, unless the context identifies an EPA director
Dischargea When used without qualification, discharge means the discharge of a pollutant
Discharge of a Pollutanta
Means any addition of any pollutant or combination of pollutants to waters of the United States from any point source or to waters of the contiguous zone or the ocean from any point source other than a vessel or other floating craft that is being used as a means of transportation. Discharge includes any addition of pollutants into waters of the United States from surface runoff that is collected or channeled by humans; discharges through pipes, sewers, or other conveyances owned by a state, municipality, or other person that do not lead to a treatment works; discharges through pipes, sewers, or other conveyances leading into privately owned treatment works; and does not include an addition of pollutants by any indirect discharger.
Dissolved Oxygen (DO)b
Means the concentration of oxygen in water as determined either by the Winkler (iodometric) method and its modifications or by the membrane electrode method.
The oxygen dissolved in water or wastewater and usually expressed in milligrams per liter or percent saturation
June 23, 2014 Permit No. AK0022951 Page C-4
a) See 18 AAC 83 b) See 18 AAC 70.990 c) See 18 AAC 72.990 d) See 40 CFR Part 136 e) See EPA Technical Support Document f) See Standard Methods for the Examination of Water and Wastewater 18th Edition g) See EPA Permit Writers Manual
Domestic Wastewaterc Means waterborne human wastes or graywater derived from dwellings, commercial buildings, institutions, or similar structures. "Domestic wastewater" includes the contents of individual removable containers used to collect and temporarily store human wastes.
Ecosystemb Means a system made up of a community of animals, plants, and bacteria and the system’s interrelated physical and chemical environment
Effluentb Means the segment of a wastewater stream that follows the final step in a treatment process and precedes discharge of the wastewater stream to the receiving environment
Estimated Means a way to estimate the discharge volume. Approvable estimations include, but are not limited to, the number of persons per day at the facility, volume of potable water produced per day, lift station run time, etc.
Fecal Coliform Bacteria (FC)b
Bacteria that can ferment lactose at 44.5 + 0.2C to produce gas in a multiple tube procedure. Fecal coliform bacteria also means all bacteria that produce blue colonies in a membrane filtration procedure within 24 ± 2 hours of incubation at 44.5 + 0.2C in an M-FC broth.
Final Approval to Operate
Means the approval that the Department issues after it has reviewed and approved the construction and operation of the engineered wastewater treatment works plans submitted to the Department in accordance with 18 AAC 72.215 through 18 AAC 72.280 or as amended.
Geometric Mean The geometric mean is the Nth root of the product of N. All sample results of zero will use a value of 1 for calculation of the geometric mean. Example geometric mean calculation: 559903423124 xxx .
Grab Sample Means a single instantaneous sample collected at a particular place and time that represents the composition of wastewater only at that time and place
Influent Means untreated wastewater before it enters the first treatment process of a wastewater treatment works
Maximum Daily Discharge Limitationa
Means the highest allowable “daily discharge”
Meanb Means the average of values obtained over a specified period and, for fecal coliform analysis, is computed as a geometric mean
Mean Lower Low Waterb
Means the tidal datum plane of the average of the lower of the two low waters of each day, as would be established by the National Geodetic Survey, at any place subject to tidal influence
Measured Means the actual volume of wastewater discharged using appropriate mechanical or electronic equipment to provide a totalized reading. Measure does not provide a recorded measurement of instantaneous rates.
Method Detection Limit (DL)d
Means the minimum concentration of a substance (analyte) that can be measured and reported with 99 percent confidence that the analyte concentration is greater than zero and is determined from analysis of a sample in a given matrix containing the analyte
June 23, 2014 Permit No. AK0022951 Page C-5
a) See 18 AAC 83 b) See 18 AAC 70.990 c) See 18 AAC 72.990 d) See 40 CFR Part 136 e) See EPA Technical Support Document f) See Standard Methods for the Examination of Water and Wastewater 18th Edition g) See EPA Permit Writers Manual
Micrograms per Liter (g/L)b
Means the concentration at which one millionth of a gram (10-6 g) is found in a volume of one liter
Milligrams per Liter (mg/L)b
Means the concentration at which one thousandth of a gram (10-3 g) is found in a volume of one liter. It is approximately equal to the unit “parts per million (ppm),” formerly of common use.
Mixing Zoneb Means a volume of water adjacent to a discharge in which wastes discharged mix with the receiving water
Month Means the time period from the 1st of a calendar month to the last day in the month
Monthly Average Means the average of daily discharges over a monitoring calendar month calculated as the sum of all daily discharges measured during a calendar month divided by the number of daily discharges measured during that month
No Observed Effect Concentration (NOEC)e
Means the highest concentration of an effluent or a toxicant at which no adverse effects are observed on the aquatic test organisms at a specific time of observation. NOEC is determined using hypothesis testing.
Permittee Means a company, organization, association, entity, or person who is issued a wastewater permit and is responsible for ensuring compliance, monitoring, and reporting as required by the permit
pHg Means a measure of the hydrogen ion concentration of water or wastewater; expressed as the negative log of the hydrogen ion concentration in mg/L. A pH of 7 is neutral. A pH less than 7 is acidic, and a pH greater than 7 is basic.
Primary Contact Recreation
See Contact Recreation
Principal Executive Officera
Means the chief executive officer of the agency or a senior executive officer having responsibility for the overall operations of a principal geographic unit of division of the agency
Pollutanta Means dredged spoil, solid waste, incinerator residue, filter backwash, sewage, garbage, sewage sludge, munitions, chemical wastes, biological materials, radioactive materials (except those regulated under 42 U.S.C. 2011), heat, wrecked or discarded equipment, rock, sand, cellar dirt, and industrial, municipal, or agricultural waste discharged into water
Quality Assurance Project Plan (QAPP)
Means a system of procedures, checks, audits, and corrective actions to ensure that all research design and performance, environmental monitoring and sampling, and other technical and reporting activities are of the highest achievable quality
Quarter Means the time period of three months based on the calendar year beginning with January
Receiving Water Body Means lakes, bays, sounds, ponds, impounding reservoirs, springs, wells, rivers, streams, creeks, estuaries, marshes, inlets, straits, passages, canals, the Pacific Ocean, Gulf of Alaska, Bering Sea, and Arctic Ocean, in the territorial limits of the state, and all other bodies of surface water, natural or artificial, public or private, inland or
June 23, 2014 Permit No. AK0022951 Page C-6
a) See 18 AAC 83 b) See 18 AAC 70.990 c) See 18 AAC 72.990 d) See 40 CFR Part 136 e) See EPA Technical Support Document f) See Standard Methods for the Examination of Water and Wastewater 18th Edition g) See EPA Permit Writers Manual
coastal, fresh or salt, which are wholly or partially in or bordering the state or under the jurisdiction of the state. (See “Waters of the U.S.” at 18 AAC 83.990(77))
Recorded Means a permanent record using mechanical or electronic equipment to provide a totalized reading, as well as a record of instantaneous readings
Report
Reporting Limits
Report results of analysis
Minimum concentration of a given parameter that can be reliably measured and reported by a laboratory using a particular analytical method. A reporting limit is greater than or equal to a method detection limit and is typically set by a laboratory.
Residual Chlorine Means chlorine remaining in water or wastewater at the end of a specified contact period as combined or free chlorine
Responsible Corporate Officera
Means a president, secretary, treasurer, or vice-president of the corporation in charge of a principal business function or any other person who performs similar policy or decision making functions for the corporation
The Responsible Corporate Officer can also be the manager of one or more manufacturing, production, or operating facilities if the requirements of 18 AAC 83.385(a)(1)(B)(i)-(iii) are met.
Secondary Recreationb Means activities in which incidental water use can occur. Secondary recreation includes boating, camping, hunting, hiking, wading, and recreational fishing. Secondary contact recreation does not include fish consumption.
Settleable Solidsb Means solid material of organic or mineral origin that is transported by and deposited from water, as measured by the volumetric Imhoff cone method and at the method detection limits specified in method 2540(F), Standard Methods for the Examination of Water and Wastewater, 18th edition (1992), adopted by reference in 18 AAC 70.020(c)(1)
Severe Property Damagea
Means substantial physical damage to property, damage to the treatment facilities which causes them to become inoperable, or substantial and permanent loss of natural resources which can reasonably be expected to occur in the absence of a bypass. Severe property damage does not mean economic loss caused by delays in production.
Sheenb Means an iridescent appearance on the water surface
Shellfishb Means a species of crustacean, mollusk, or other aquatic invertebrate with a shell or shell-like exoskeleton in any stage of its life cycle
Significant Industrial User (SIU)g
Means an indirect discharger that is the focus of control efforts under the national pretreatment program; includes all indirect dischargers subject to national categorical pretreatment standards, and all other indirect dischargers that contribute 25,000 gpd or more of process wastewater, or which make up five percent or more of the hydraulic or organic loading to the municipal treatment plant, subject to certain exceptions [40 CFR $403.3(t)].
Suspended Solids Means insoluble solids that either float on the surface of, or are in suspension in, water, wastewater, or other liquids. The quantity of material removed from

June 23, 2014 Permit No. AK0022951 Page C-7
a) See 18 AAC 83 b) See 18 AAC 70.990 c) See 18 AAC 72.990 d) See 40 CFR Part 136 e) See EPA Technical Support Document f) See Standard Methods for the Examination of Water and Wastewater 18th Edition g) See EPA Permit Writers Manual
wastewater in a laboratory test, as prescribed in Standard Methods for the Examination of Water and Wastewater and referred to as nonfilterable.
Total Suspended Solids (TSS)g
Means a measure of the filterable solids present in a sample, as determined by the method specified in 40 CFR Part 136
Toxic Unit, Chronic (TUc)e
Means the reciprocal of the effluent concentration that causes no observable effect on the test organisms by the end of the chronic exposure period (i.e., 100/NOEC)
Twice per year Means two time periods during the calendar year: October through April and May through September
Upseta Means an exceptional incident in which there is unintentional and temporary noncompliance with technology-based effluent limitations because of factors beyond the reasonable control of the permittee. An upset does not include noncompliance to the extent caused by operational error, improperly designed treatment facilities, inadequate treatment facilities, lack of preventive maintenance, or careless or improper operation.
Wastewater Treatment Means any process to which wastewater is subjected in order to remove or alter its objectionable constituents and make it suitable for subsequent use or acceptable for discharge to the environment
Waters of the United States or Waters of the U.S.
Has the meaning given in 18 AAC 83.990(77)
Water Recreationb See contact recreation or secondary recreation
Water Supplyb Means any of the waters of the United States that are designated in 18 AAC 70 to be protected for fresh water or marine water uses. Water supply includes waters used for drinking, culinary, food processing, agricultural, aquacultural, seafood processing, and industrial purposes. Water supply does not necessarily mean that water in a waterbody that is protected as a supply for the uses listed in this paragraph is safe to drink in its natural state.
Week Means the time period of Sunday through Saturday

June 23, 2014 AK0022951
Page 1 of 61
Public Comment Period Start Date: April 11, 2014 Public Comment Period Expiration Date: May 12, 2014 Alaska Online Public Notice System Technical Contact: Sally Wanstall
Alaska Department of Environmental ConservationDivision of Water Wastewater Discharge Authorization Program 410 Willoughby Ave., Suite 303 Juneau, AK 99811-1800 (907) 465-5216 Fax: (907) 465-5177 [email protected]
Proposed issuance of an Alaska Pollutant Discharge Elimination System (APDES) permit to the
CITY AND BOROUGH OF JUNEAU
For wastewater discharges from
Mendenhall Wastewater Treatment Plant 2009 Radcliffe Road Juneau, AK, 99801
The Alaska Department of Environmental Conservation (the Department or DEC) proposes to issue an APDES individual permit (AK0022951) to the City and Borough of Juneau. The permit authorizes and sets conditions on the discharge of pollutants from this facility to waters of the United States. In order to ensure protection of water quality and human health, the permit places limits on the types and amounts of pollutants that can be discharged from the facility and outlines best management practices to which the facility must adhere.
ALASKA POLLUTANT DISCHARGE ELIMINATION SYSTEM
PERMIT FACT SHEET – FINAL
Permit Number: AK0022951
City and Borough of Juneau – Mendenhall Wastewater Treatment Plant
DEPARTMENT OF ENVIRONMENTAL CONSERVATION
Wastewater Discharge Authorization Program
555 Cordova Street
Anchorage, AK 99501
June 23, 2014 AK0022951
Page 2 of 61
This fact sheet explains the nature of potential discharges from Mendenhall Wastewater Treatment Plant and the development of the permit including:
information on public comment, public hearing, and appeal procedures a listing of proposed effluent limitations and other conditions technical material supporting the conditions in the permit proposed monitoring requirements in the permit
Appeals Process
The Department has both an informal review process and a formal administrative appeal process for final APDES permit decisions. An informal review request must be delivered within 15 days after receiving the Department’s decision to the Director of the Division of Water at the following address:
Director, Division of Water Alaska Department of Environmental Conservation 410 Willoughby Avenue, Suite 310 Juneau, AK 99811-1800
Interested persons can review 18 AAC 15.185 for the procedures and substantive requirements regarding a request for an informal Department review.
See http://www.dec.state.ak.us/commish/InformalReviews.htm for information regarding informal reviews of Department decisions.
An adjudicatory hearing request must be delivered to the Commissioner of the Department within 30 days of the permit decision or a decision issued under the informal review process. An adjudicatory hearing will be conducted by an administrative law judge in the Office of Administrative Hearings within the Department of Administration. A written request for an adjudicatory hearing shall be delivered to the Commissioner at the following address:
Commissioner Alaska Department of Environmental Conservation 410 Willoughby Street, Suite 303 P.O. Box 111800 Juneau AK, 99811-1800.
Interested persons can review 18 AAC 15.200 for the procedures and substantive requirements regarding a request for an adjudicatory hearing. See http://www.dec.state.ak.us/commish/ReviewGuidance.htm for information regarding appeals of Department decisions.
Documents are Available
The permit, fact sheet, application, and related documents can be obtained by visiting or contacting DEC between 8:00 a.m. and 4:30 p.m. Monday through Friday at the addresses below. The permit, fact sheet, application, and other information are located on the Department’s Wastewater Discharge Authorization Program website: http://www.dec.state.ak.us/water/wwdp/index.htm .
June 23, 2014 AK0022951
Page 3 of 61
Alaska Department of Environmental Conservation Division of Water Wastewater Discharge Authorization Program 555 Cordova Street Anchorage, AK 99501 (907) 269-6285
Alaska Department of Environmental Conservation Division of Water Wastewater Discharge Authorization Program 410 Willoughby Avenue, Suite 310 P.O. Box 111800 Juneau, AK 99811-1800 (907) 465-5180

June 23, 2014 AK0022951
Page 4 of 61
TABLE OF CONTENTS
1.0 APPLICANT .................................................................................................................................... 6
2.0 FACILITY INFORMATION ......................................................................................................... 6
2.1 Background ............................................................................................................................... 7
3.0 COMPLIANCE HISTORY ............................................................................................................ 7
4.0 EFFLUENT LIMITS AND MONITORING REQUIREMENTS ............................................. 10
4.1 Basis for Permit Effluent Limits ............................................................................................. 10
4.2 Basis for Effluent and Receiving Water Monitoring .............................................................. 10
4.3 Effluent Limits ........................................................................................................................ 10
4.4 Effluent and Influent Monitoring ............................................................................................ 15
4.5 Additional Monitoring ............................................................................................................ 16
4.6 Whole Effluent Toxicity Monitoring ...................................................................................... 17
4.7 Receiving Water Body Limits and Monitoring Requirements ............................................... 18
5.0 RECEIVING WATER BODY ...................................................................................................... 20
5.1 Low Flow Conditions ............................................................................................................. 20
5.2 Water Quality Standards ......................................................................................................... 21
5.3 Water Quality Status of Receiving Water ............................................................................... 21
5.4 Mixing Zone Analysis............................................................................................................. 21
6.0 ANTIBACKSLIDING ................................................................................................................... 25
7.0 ANTIDEGRADATION ................................................................................................................. 27
8.0 OTHER PERMIT CONDITIONS ............................................................................................... 30
8.1 Quality Assurance Project Plan .............................................................................................. 30
8.2 Operation and Maintenance Plan ............................................................................................ 30
8.3 Facility Plan ............................................................................................................................ 30
8.4 Pretreatment Requirements ..................................................................................................... 30
8.5 Standard Conditions ................................................................................................................ 31
9.0 OTHER LEGAL REQUIREMENTS .......................................................................................... 31
9.1 Endangered Species Act ......................................................................................................... 31
9.2 Essential Fish Habitat ............................................................................................................. 31
9.3 Sludge (Biosolids) Requirements ........................................................................................... 32
9.4 Permit Expiration .................................................................................................................... 33
10.0 REFERENCES ............................................................................................................................... 34

June 23, 2014 AK0022951
Page 5 of 61
TABLES
Table 1: Design Criteria for Mendenhall Wastewater Treatment Plant ..................................................... 7
Table 2: Permit Limit Exceedances ............................................................................................................ 8
Table 3: Outfall 001 Effluent Limits and Monitoring Requirements ....................................................... 13
Table 4: Additional Effluent Monitoring for Reissuance Application ..................................................... 17
Table 5: Receiving Water Body Monitoring Requirements ..................................................................... 19
Table 6: Low Flows in the Mendenhall River at the Point of Discharge ................................................. 21
Table 7: Effluent Dilution Factors ............................................................................................................ 22
Table 8: Dilutions Factors Used ............................................................................................................... 23
Table B- 1: Secondary Treatment Effluent Limits ................................................................................... 37
Table B- 2: Calculation of Metals Criteria, November - April ................................................................. 40
Table B- 3: Calculation of Metals Criteria, May - October ...................................................................... 40
Table B- 4: Water Quality Criteria for Ammonia ..................................................................................... 43
Table B- 5: Selection of pH Permit Limits, November - June .................................................................. 43
Table B- 6: Selection of pH Permit Limits, July - October ...................................................................... 43
Table B- 7: Selection of Fecal Coliform Bacteria Permit Limits ............................................................. 44
Table B- 8: Selection of Effluent Ammonia Limits for November - April .............................................. 44
Table C- 1: Calculating Maximum Projected Effluent Concentration ..................................................... 49
Table C- 2: Reasonable Potential Determination, November - April ....................................................... 49
Table C- 3: Reasonable Potential Determination, May - October ............. Error! Bookmark not defined.
Table D- 1: Summary of Effluent Limit Calculations .............................................................................. 54
FIGURES
Figure 1: Mendenhall Wastewater Treatment Plant, Location Relative to Mendenhall River ................. 35
Figure 2: Mendenhall Wastewater Treatment Plant Process Flow Diagram ............................................ 36
LIST OF APPENDICES
APPENDIX A. FACILITY INFORMATION ...................................................................................... 35
APPENDIX B. BASIS FOR EFFLUENT LIMITS ............................................................................. 37
APPENDIX C. REASONABLE POTENTIAL DETERMINATION ................................................ 45
APPENDIX D. EFFLUENT LIMIT CALCULATION ...................................................................... 51
APPENDIX E. MIXING ZONE ANALYSIS CHECKLIST .............................................................. 56
June 23, 2014 AK0022951
Page 6 of 61
1.0 APPLICANT
This fact sheet provides information on the Alaska Pollutant Discharge Elimination System (APDES) permit for the following entity:
Name of Facility: Mendenhall Wastewater Treatment Plant (MWWTP) APDES Permit Number: AK0022951 Facility Location: 2009 Radcliffe Road, Juneau, AK 99801 Mailing Address: 2009 Radcliffe Road, Juneau, AK 99801 Facility Contact: Ms. Samantha Stoughtenger
2.0 FACILITY INFORMATION
The City and Borough of Juneau (CBJ or permittee) owns, operates, and maintains the MWWTP located in Juneau, Alaska. The sequential batch reactor (SBR) secondary treatment plant discharges treated municipal wastewater to the Mendenhall River though a submerged multi-port diffuser located approximately 5,800 feet downriver of the Brotherhood Bridge, and 1.4 miles upstream from the Gastineau Channel. The map in Appendix A to the Fact Sheet depicts the location of the treatment plant and the discharge location.
The design flow of the MWWTP is 4.9 million gallons per day (mgd) and is the largest of three wastewater treatment facilities in the Juneau area. The plant services a resident population of approximately 20,000 and supporting commercial businesses. Because Juneau is a summer season destination area, the actual population is higher during the summer months. The MWWTP only receives wastewater from the domestic wastewater collection system and storm water is conveyed through a separate sewer collection system.
The Alaskan Brewing Company has been identified as a Significant Industrial User that discharges to the domestic wastewater collection system and ultimately to the MWWTP. The brewing company discharges 31,500 gallons per day (gpd) intermittently into the MWWTP collection system. The permittee indicated in their permit reissuance application that the brewing company has not caused or contributed to any problems at the plant in the three years prior to application submittal.
The MWWTP provides preliminary treatment of the influent sewage by fine screening and grit removal. The influent flows into the plant, solids are ground, and a sieve removes large debris. The wastewater settles in the influent well and is lifted into tea cup strainers that remove grit. The grit falls into a grit clarifier where it is removed. From the influent pump station, the wastewater is distributed to one of eight SBRs where it receives secondary biological treatment facilitated by the use of aeration blowers and jet circulation pumps. When an SBR completes a reaction cycle, the treated effluent is decanted and disinfected by ultra-violet (UV) light treatment prior to discharge to Mendenhall River. Treated effluent is discharged on an intermittent basis from the MWWTP coinciding with the decanting of each SBR. Each SBR is decanted at a rate of approximately 5,000 to 6,000 gallons per minute (gpm) for approximately 20 minutes at the end of each respective SBR reaction cycle. The treated effluent is conveyed through a 48-inch diameter high density polyethylene (HDPE) outfall pipeline that is anchored to the river bottom and oriented perpendicularly to the direction of flow in Mendenhall River. The diffuser fitted at the end of the outfall is approximately 70 feet in length and contains 13-rectangular ports each having a cross sectional area of 0.5 square feet (ft2).
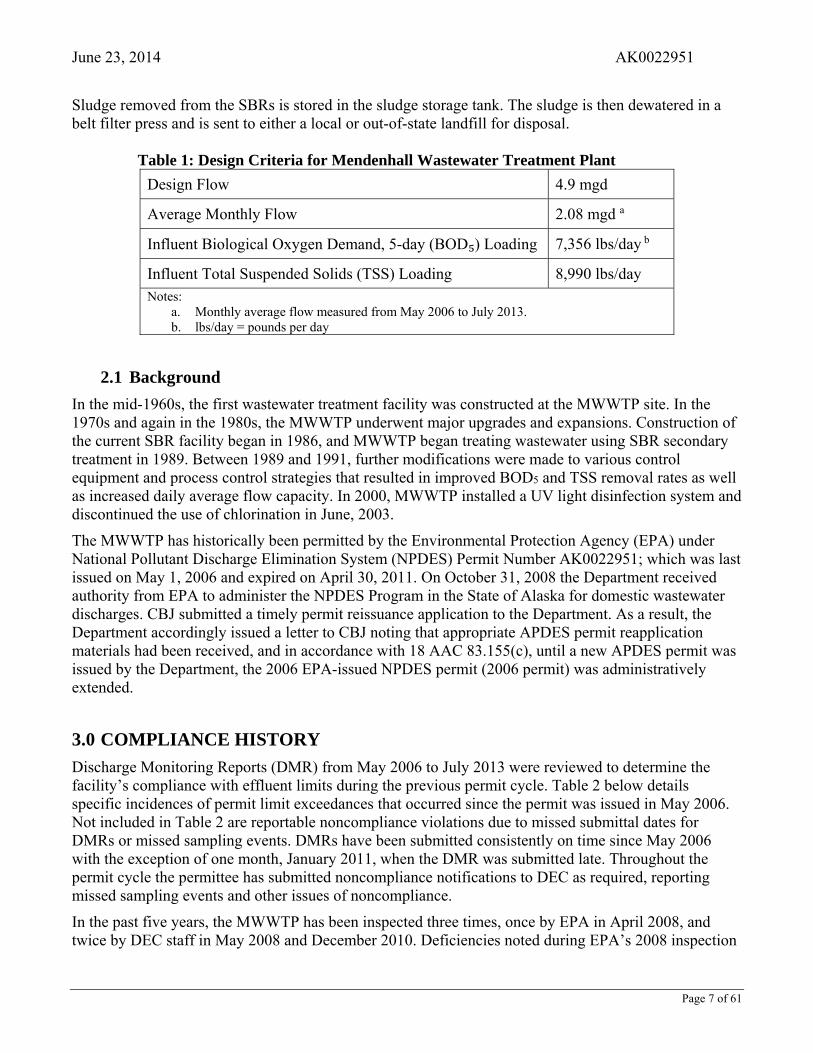
June 23, 2014 AK0022951
Page 7 of 61
Sludge removed from the SBRs is stored in the sludge storage tank. The sludge is then dewatered in a belt filter press and is sent to either a local or out-of-state landfill for disposal.
Table 1: Design Criteria for Mendenhall Wastewater Treatment Plant
Design Flow 4.9 mgd
Average Monthly Flow 2.08 mgd a
Influent Biological Oxygen Demand, 5-day (BOD₅) Loading 7,356 lbs/day b
Influent Total Suspended Solids (TSS) Loading 8,990 lbs/day Notes:
a. Monthly average flow measured from May 2006 to July 2013. b. lbs/day = pounds per day
2.1 Background
In the mid-1960s, the first wastewater treatment facility was constructed at the MWWTP site. In the 1970s and again in the 1980s, the MWWTP underwent major upgrades and expansions. Construction of the current SBR facility began in 1986, and MWWTP began treating wastewater using SBR secondary treatment in 1989. Between 1989 and 1991, further modifications were made to various control equipment and process control strategies that resulted in improved BOD5 and TSS removal rates as well as increased daily average flow capacity. In 2000, MWWTP installed a UV light disinfection system and discontinued the use of chlorination in June, 2003.
The MWWTP has historically been permitted by the Environmental Protection Agency (EPA) under National Pollutant Discharge Elimination System (NPDES) Permit Number AK0022951; which was last issued on May 1, 2006 and expired on April 30, 2011. On October 31, 2008 the Department received authority from EPA to administer the NPDES Program in the State of Alaska for domestic wastewater discharges. CBJ submitted a timely permit reissuance application to the Department. As a result, the Department accordingly issued a letter to CBJ noting that appropriate APDES permit reapplication materials had been received, and in accordance with 18 AAC 83.155(c), until a new APDES permit was issued by the Department, the 2006 EPA-issued NPDES permit (2006 permit) was administratively extended.
3.0 COMPLIANCE HISTORY
Discharge Monitoring Reports (DMR) from May 2006 to July 2013 were reviewed to determine the facility’s compliance with effluent limits during the previous permit cycle. Table 2 below details specific incidences of permit limit exceedances that occurred since the permit was issued in May 2006. Not included in Table 2 are reportable noncompliance violations due to missed submittal dates for DMRs or missed sampling events. DMRs have been submitted consistently on time since May 2006 with the exception of one month, January 2011, when the DMR was submitted late. Throughout the permit cycle the permittee has submitted noncompliance notifications to DEC as required, reporting missed sampling events and other issues of noncompliance.
In the past five years, the MWWTP has been inspected three times, once by EPA in April 2008, and twice by DEC staff in May 2008 and December 2010. Deficiencies noted during EPA’s 2008 inspection
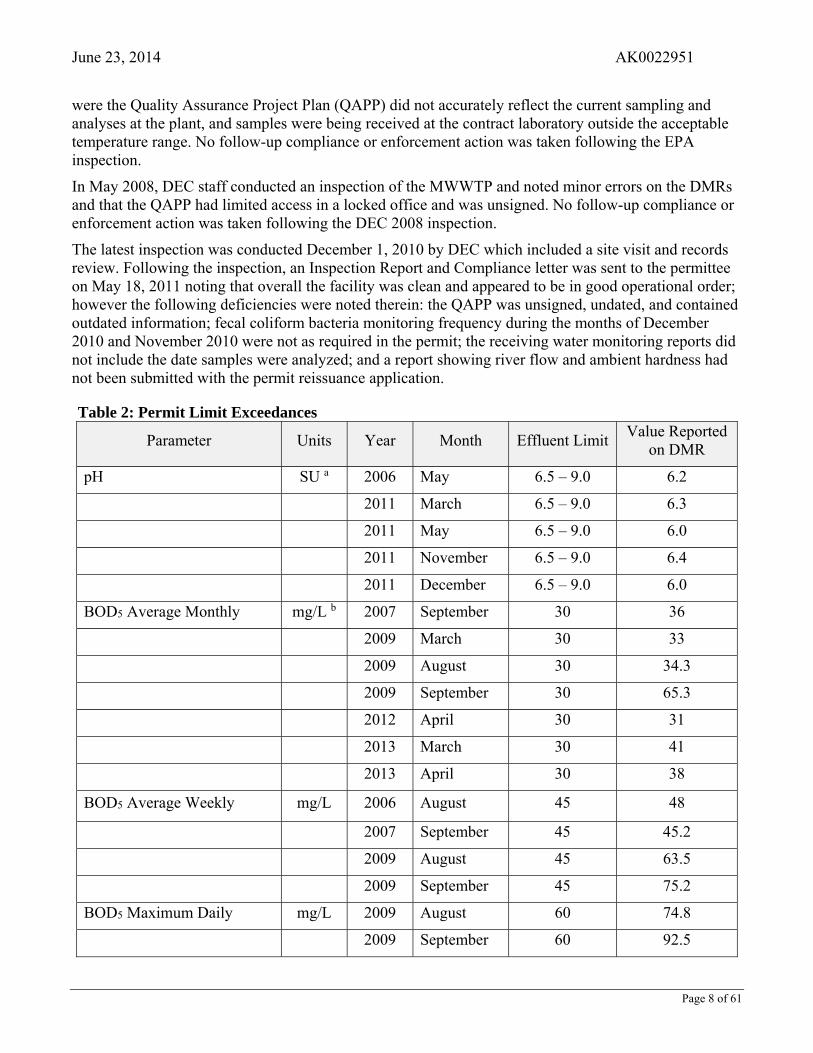
June 23, 2014 AK0022951
Page 8 of 61
were the Quality Assurance Project Plan (QAPP) did not accurately reflect the current sampling and analyses at the plant, and samples were being received at the contract laboratory outside the acceptable temperature range. No follow-up compliance or enforcement action was taken following the EPA inspection.
In May 2008, DEC staff conducted an inspection of the MWWTP and noted minor errors on the DMRs and that the QAPP had limited access in a locked office and was unsigned. No follow-up compliance or enforcement action was taken following the DEC 2008 inspection.
The latest inspection was conducted December 1, 2010 by DEC which included a site visit and records review. Following the inspection, an Inspection Report and Compliance letter was sent to the permittee on May 18, 2011 noting that overall the facility was clean and appeared to be in good operational order; however the following deficiencies were noted therein: the QAPP was unsigned, undated, and contained outdated information; fecal coliform bacteria monitoring frequency during the months of December 2010 and November 2010 were not as required in the permit; the receiving water monitoring reports did not include the date samples were analyzed; and a report showing river flow and ambient hardness had not been submitted with the permit reissuance application.
Table 2: Permit Limit Exceedances
Parameter Units Year Month Effluent Limit Value Reported
on DMR
pH SU a 2006 May 6.5 – 9.0 6.2
2011 March 6.5 – 9.0 6.3
2011 May 6.5 – 9.0 6.0
2011 November 6.5 – 9.0 6.4
2011 December 6.5 – 9.0 6.0
BOD5 Average Monthly mg/L b 2007 September 30 36
2009 March 30 33
2009 August 30 34.3
2009 September 30 65.3
2012 April 30 31
2013 March 30 41
2013 April 30 38
BOD5 Average Weekly mg/L 2006 August 45 48
2007 September 45 45.2
2009 August 45 63.5
2009 September 45 75.2
BOD5 Maximum Daily mg/L 2009 August 60 74.8
2009 September 60 92.5
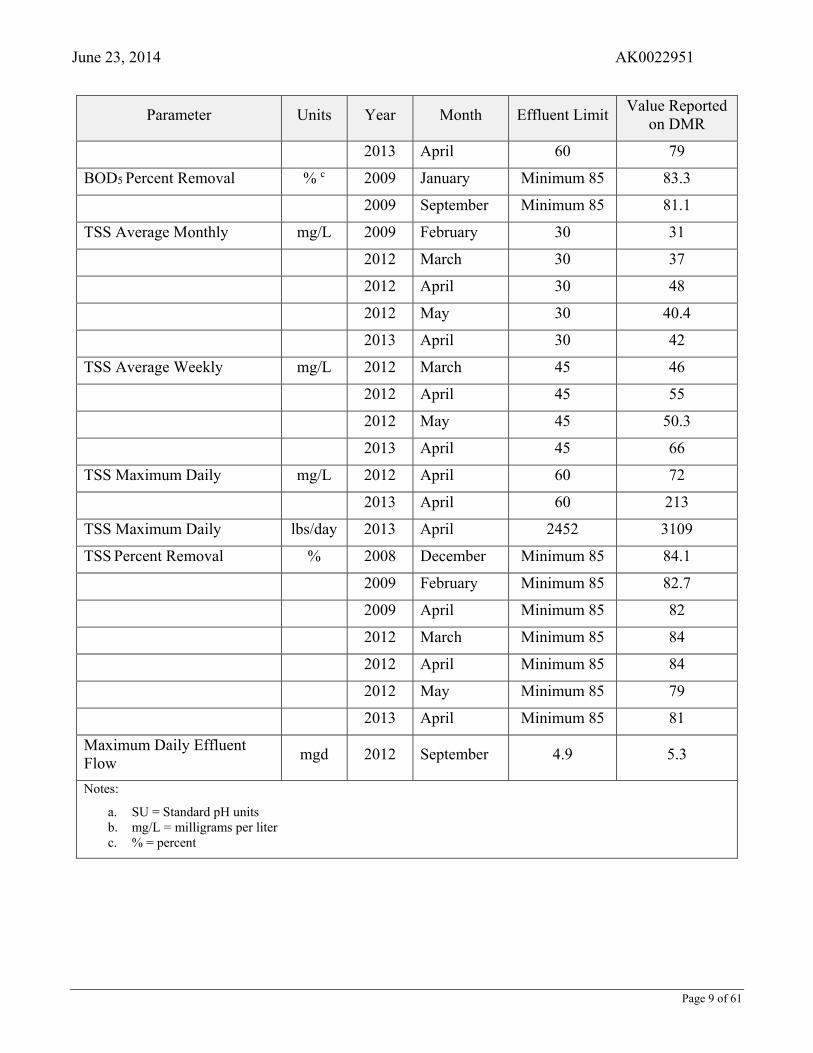
June 23, 2014 AK0022951
Page 9 of 61
Parameter Units Year Month Effluent Limit Value Reported
on DMR
2013 April 60 79
BOD5 Percent Removal % c 2009 January Minimum 85 83.3
2009 September Minimum 85 81.1
TSS Average Monthly mg/L 2009 February 30 31
2012 March 30 37
2012 April 30 48
2012 May 30 40.4
2013 April 30 42
TSS Average Weekly mg/L 2012 March 45 46
2012 April 45 55
2012 May 45 50.3
2013 April 45 66
TSS Maximum Daily mg/L 2012 April 60 72
2013 April 60 213
TSS Maximum Daily lbs/day 2013 April 2452 3109
TSS Percent Removal % 2008 December Minimum 85 84.1
2009 February Minimum 85 82.7
2009 April Minimum 85 82
2012 March Minimum 85 84
2012 April Minimum 85 84
2012 May Minimum 85 79
2013 April Minimum 85 81
Maximum Daily Effluent Flow
mgd 2012 September 4.9 5.3
Notes:
a. SU = Standard pH units b. mg/L = milligrams per liter c. % = percent
June 23, 2014 AK0022951
Page 10 of 61
4.0 EFFLUENT LIMITS AND MONITORING REQUIREMENTS
4.1 Basis for Permit Effluent Limits
The Clean Water Act (CWA) requires that the permit limits for a particular pollutant be the more stringent of either technology-based effluent limits (TBEL) or water quality-based effluent limits (WQBEL). A TBEL is set according to the level of treatment that is achievable using available technology. A WQBEL is designed to ensure that the water quality standards (WQS) of a water body are met. A WQBEL may be more stringent than a TBEL. The basis for the proposed effluent limits in the permit is provided in Section 4.3 and Appendices B through D of this document.
4.2 Basis for Effluent and Receiving Water Monitoring
In accordance with Alaska Statute (AS) 46.03.110(d), the Department may specify in a permit the terms and conditions under which waste material may be disposed. Monitoring in a permit is required to determine compliance with effluent limits. Monitoring may also be required to gather effluent and receiving water body data to determine if additional effluent limits are required and/or to monitor effluent impact on the receiving water body quality.
The permit also requires the permittee to perform effluent monitoring required by the APDES Form 2A application, so that this data is available when the permittee applies for reissuance of their APDES permit. The permittee is responsible to conduct the monitoring and report results on DMRs or on the application for reissuance, as appropriate, to the Department.
4.3 Effluent Limits
The permit contains limits that are both TBELs and WQBELs. The Department first determines if TBELs are required to be incorporated into the permit. TBELs for publicly owned treatment works (POTWs), which apply to the publicly owned MWWTP, are derived from the secondary treatment standards found in Title 40 Code of Federal Regulations (40 CFR) §133.102 and (adopted by reference at 18 AAC 83.010(e)). The effluent limits imposed in this permit for BOD5, BOD5 percent removal, TSS, and TSS percent removal, are based on secondary treatment standards. For pollutants of concern with no associated TBELs, but that have reasonable potential to cause or contribute to an exceedance of water quality criteria, WQBELs are established to be protective of the designated uses of the receiving water. In cases where both TBELs and WQBELs are calculated, as is the case with pH in the permit, the more stringent limit is retained as the final permit effluent limit.
In the 2006 permit, calculated permit effluent limits for pH, fecal coliform bacteria, copper, and ammonia varied throughout the year to correspond to the seasonal variations of the Mendenhall River. In the 2014 APDES permit (2014 permit), the Department continues to consider the river’s seasonal variations with respect to calculating and setting effluent limits for these parameters. However, the 2014 permit divides the year into hydrological similar time periods that are different than those used in the 2006 permit.
The 2006 permit divided the year into four time periods, November through May, June, July through September, and October. Following a review of 10 years of historic river flow data (October 3, 2002 through October 3, 2012), the Department has changed the number of hydrological divisions from the four divisions previously identified in the 2006 permit to two
June 23, 2014 AK0022951
Page 11 of 61
identified for the 2014 permit and this fact sheet. Of the two temporal divisions identified, one, which includes the months of November through April, has lower dilution availability in the receiving water with average river flows from 110 cubic feet per second (cfs) to 445 cfs and the second division, which includes the months of May through October, has higher dilution availability in the receiving water with average river flows of 959 cfs to 3568 cfs. For the parameter of pH, the two annual divisions are modified. Additional discussion on pH is included later in this section.
This change to two temporal divisions in a year has resulted in effluent limit changes that apply to only a couple of months in the year. In particular are the months of May, June, and October. May was previously considered a month with low river flows but the Department has determined that May is more accurately characterized as a month having higher river flows. June and October each were considered previously to have unique hydrological river flows; however, the Department has determined that these two months have river flow rates that are within the higher flow range.
Effluent limit changes made in the 2014 permit as compared to the 2006 permit are:
pH - The pH minimum daily effluent limits included in the 2014 permit are based on a modification of the two temporal divisions applied to other parameters. The modified divisions are November through June and July through October. A review of five years of data from August 2008 through July 2013 indicated that a pH minimum daily concentration of 6.5 SU can be achieved by the treatment plant during the months of November through June. This is consistent with the pH minimum daily effluent limits included in the 2006 permit with the exception of the daily minimum for the month of June which is more stringent in the 2014 permit than in the 2006 permit. The month of June was considered a unique hydrological time period in the 2006 permit and a pH minimum daily effluent limit of 6.4 SU was imposed. The same five years of data also indicated that the treatment plant can achieve a more stringent daily maximum limit of 8.5 SU year round. The 2006 permit established a pH maximum daily effluent limit based on secondary treatment TBELs and in the 2014 permit the pH maximum daily effluent limit is based on water quality criterion.
Fecal coliform bacteria - Fecal coliform bacteria limits in the 2006 permit were contingent upon the average effluent/receiving water dilution ratio for a calendar month and whether chlorine was being used for total or partial disinfection. This approach resulted in tiered effluent limits for fecal coliform bacteria with only one effluent limit tier effective during a given month. Applicable fecal coliform bacteria effluent limits during the months of June through October were dependent on chlorine use alone and during the months of November through May both the calculated average monthly effluent/receiving water dilution ratio and chlorine use were used by the permittee to determine the applicable fecal coliform bacterial limits for the month.
Currently, the MWWTP does not use chlorine for disinfection which eliminates the need for fecal coliform bacteria effluent limits to vary due to chlorine usage. In an effort to further simplify fecal coliform bacteria effluent limits in the 2014 permit, the Department reviewed the average effluent/receiving water dilution ratios used by the permittee to determine applicable fecal coliform bacteria effluent limits from August 2008 through July 2013. Submitted data indicated that during the months of November through May,
June 23, 2014 AK0022951
Page 12 of 61
when the dilution ratio was a factor in determining applicable fecal coliform bacteria effluent limits, the same tier was used each month with the exception of two months, January 2009 and January 2010. During those two month, a lower calculated average dilution ratio resulted in lower fecal coliform bacteria effluent limits.
The fecal coliform bacteria effluent limits included in the 2014 permit are based on historic monthly river conditions and the permittee will not be required to calculate an effluent/receiving water dilution ratio to determine the applicable fecal coliform bacteria effluent limit. During the months of November through April, new river flow data indicates that the critical dilution is less than a 15:1 ratio. This ratio corresponds to the lowest tiered limit in the 2006 permit for the same months, and the tiered limit that was applied for the months of January 2009 and January 2010. The fecal coliform bacteria effluent limits included in the 2014 permit for months with lower available dilution (November through April) are more stringent than those applied during the 2006 permit cycle when the effluent/receiving water dilution ratio was calculated to be less than 15:1. To be consistent with requirements found in 18 AAC 83.530, an average weekly geometric limit has also been included in the 2014 permit for the months of November through April, which were not present in the 2006 permit.
The fecal coliform bacteria effluent limits included in the 2014 permit for months with higher available dilution (May through October) are more stringent than those applied during the 2006 permit cycle. The Department reviewed five years of data from August 2008 through July 2013 and determined that the MWWTP’s treatment system can treat wastewater during the months of May through October to a level that can achieve a monthly geometric mean of 200 FC/100 mL, a maximum weekly geometric mean of 400 FC/100 mL, and a maximum daily count of 800 FC/100 mL.
Copper - Copper limits for the months of May, June, and October are more stringent in the 2014 permit than those included in the 2006 permit. In the 2006 permit, the effluent copper limits during the month of May were consistent with the other months that were determined to have low river flows. The months of June and October did not have copper effluent limits but monitoring results were to be reported.
There is an inverse relationship between river flow and river hardness, and metals, such as copper, are more toxic in soft water; therefore, water quality criteria becomes more stringent as the river flow increases. The change in effluent copper limits during the months of May, June, and October are a result of the determination that the river flows during these months are similar to other months with higher river flows. In the 2014 permit, all other months have copper effluent limits consistent with those set in the 2006 permit.
Ammonia - Consistent with the rational above for available dilution for the month of May, the Department has determined that the discharge does not have the reasonable potential to cause or contribute to a violation of ammonia water quality criteria during the month of May; therefore, effluent limits for ammonia have been removed for the month of May. However, ammonia monitoring will continue and limits may be reinstated in the next permit if determined appropriate based on a review of ammonia data collected during the permit cycle. Ammonia limits in the 2014 permit for all other months are either more stringent or remain the same as the 2006 permit. The elimination of ammonia

June 23, 2014 AK0022951
Page 13 of 61
effluent limits during the month of May is compliant with 18 AAC 83.480(b)(2). See Section 6.0, Antibacksliding, for further discussion.
Total residual chlorine – As discussed in Section 2.1 of the fact sheet, the MWWTP discontinued the use of chlorine as a method of wastewater disinfection in June 2003 and there is no reason to believe chlorine is otherwise expected to be present in the effluent. Accordingly, there is no documented basis for concern warranting the continued inclusion of chlorine permit effluent limits; therefore, no chlorine effluent limits are included in the 2014 permit. See Section 6.0, Antibacksliding, for further discussion.
Chronic whole effluent toxicity (WET) - An average monthly limit for chronic WET has been included in the 2014 permit for the months of November through April because the Department found that there is reasonable potential for chronic WET to exceed water quality criteria for chronic WET at the boundary of the mixing zone.
See Appendices B through D for more details on each of the changes. Table 3 summarizes the effluent limits and monitoring.
Table 3: Outfall 001 Effluent Limits and Monitoring Requirements
Parameter Effluent Limits Monitoring Requirements
Units Minimum
Daily Average Monthly
Average Weekly
Maximum Daily
Sample Location
Sample Frequency
Sample Type
Flow mgd ---- Report ---- 4.9 Effluent Continuous Recorded
Dissolved Oxygen mg/L Report ---- ---- Report Effluent 1/Month Grab
Temperature oC a ---- Report ---- Report Effluent 5/Week Grab
BOD5
mg/L ---- 30 45 60 Effluent 2/Month b
24-hour Composite c
lbs/day ---- 1,226 1,839 2,452 Calculation d
BOD5 mg/L ---- Report ---- ---- Influent 2/Month b 24-hour
Composite
BOD5 Percent Removal % 85 ---- ---- ---- Effluent
vs. Influent
1/Month Calculation e
TSS mg/L ---- 30 45 60
Effluent 2/Month b
24-hour Composite
lbs/day ---- 1,226 1,839 2,452 Calculation
TSS mg/L ---- Report ---- ---- Influent 2/Month b 24-hour
Composite
TSS Percent Removal % 85 ---- ---- ---- Effluent
vs. Influent
1/Month Calculation
pH (November 1 – June 30) SU 6.5 ---- ---- 8.5 Effluent 5/Week Grab
pH (July 1 – October 31) SU 6.3 ---- ---- 8.5 Effluent 5/Week Grab
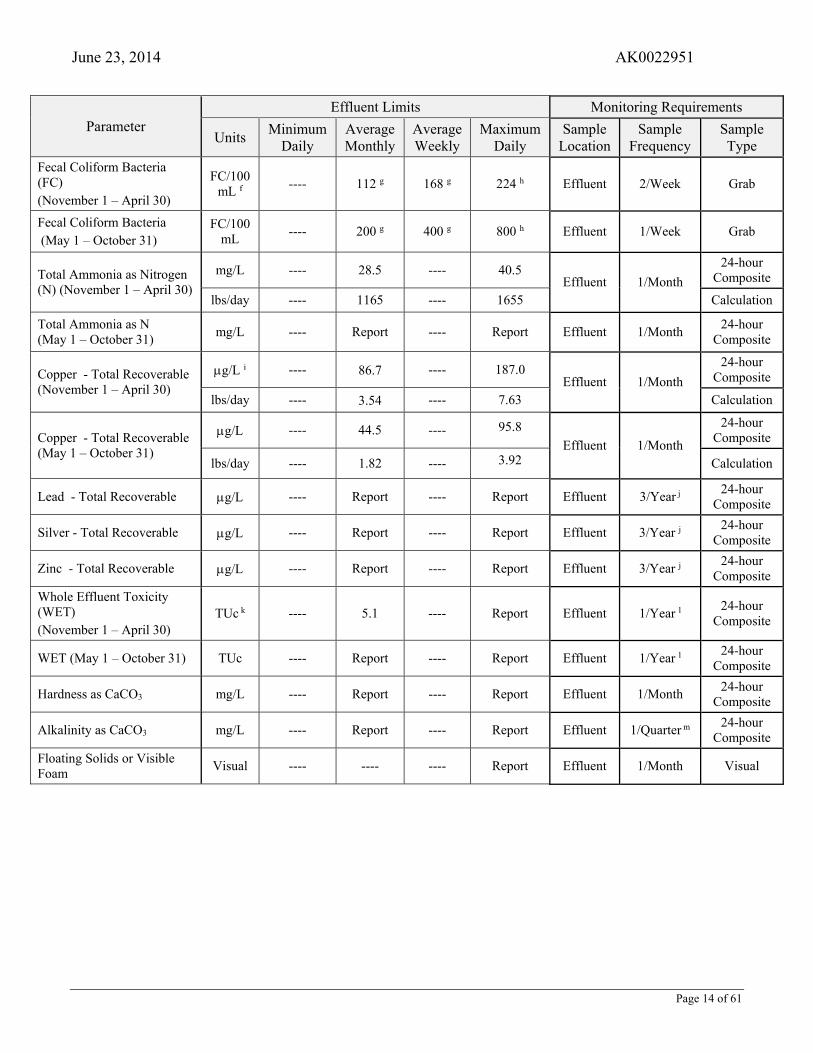
June 23, 2014 AK0022951
Page 14 of 61
Parameter Effluent Limits Monitoring Requirements
Units Minimum
Daily Average Monthly
Average Weekly
Maximum Daily
Sample Location
Sample Frequency
Sample Type
Fecal Coliform Bacteria (FC)
(November 1 – April 30)
FC/100 mL f
---- 112 g 168 g 224 h Effluent 2/Week Grab
Fecal Coliform Bacteria (May 1 – October 31)
FC/100 mL
---- 200 g 400 g 800 h Effluent 1/Week Grab
Total Ammonia as Nitrogen (N) (November 1 – April 30)
mg/L ---- 28.5 ---- 40.5 Effluent 1/Month
24-hour Composite
lbs/day ---- 1165 ---- 1655 Calculation
Total Ammonia as N (May 1 – October 31)
mg/L ---- Report ---- Report Effluent 1/Month 24-hour
Composite
Copper - Total Recoverable (November 1 – April 30)
g/L i ---- 86.7 ---- 187.0 Effluent 1/Month
24-hour Composite
lbs/day ---- 3.54 ---- 7.63 Calculation
Copper - Total Recoverable (May 1 – October 31)
g/L ---- 44.5 ---- 95.8
Effluent 1/Month
24-hour Composite
lbs/day ---- 1.82 ---- 3.92 Calculation
Lead - Total Recoverable g/L ---- Report ---- Report Effluent 3/Year j 24-hour
Composite
Silver - Total Recoverable g/L ---- Report ---- Report Effluent 3/Year j 24-hour
Composite
Zinc - Total Recoverable g/L ---- Report ---- Report Effluent 3/Year j 24-hour
Composite
Whole Effluent Toxicity (WET) (November 1 – April 30)
TUc k ---- 5.1 ---- Report Effluent 1/Year l 24-hour
Composite
WET (May 1 – October 31) TUc ---- Report ---- Report Effluent 1/Year l 24-hour
Composite
Hardness as CaCO3 mg/L ---- Report ---- Report Effluent 1/Month 24-hour
Composite
Alkalinity as CaCO3 mg/L ---- Report ---- Report Effluent 1/Quarter m 24-hour
Composite
Floating Solids or Visible Foam
Visual ---- ---- ---- Report Effluent 1/Month Visual
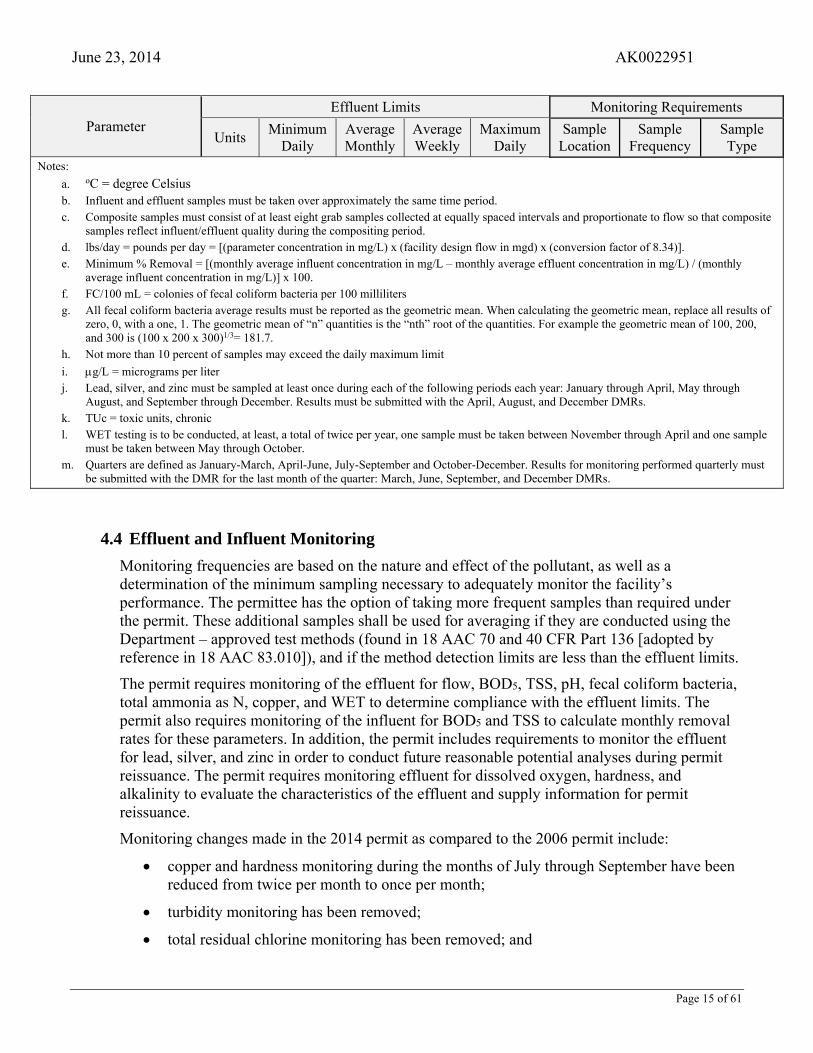
June 23, 2014 AK0022951
Page 15 of 61
Parameter Effluent Limits Monitoring Requirements
Units Minimum
Daily Average Monthly
Average Weekly
Maximum Daily
Sample Location
Sample Frequency
Sample Type
Notes:
a. oC = degree Celsius
b. Influent and effluent samples must be taken over approximately the same time period. c. Composite samples must consist of at least eight grab samples collected at equally spaced intervals and proportionate to flow so that composite
samples reflect influent/effluent quality during the compositing period. d. lbs/day = pounds per day = [(parameter concentration in mg/L) x (facility design flow in mgd) x (conversion factor of 8.34)]. e. Minimum % Removal = [(monthly average influent concentration in mg/L – monthly average effluent concentration in mg/L) / (monthly
average influent concentration in mg/L)] x 100. f. FC/100 mL = colonies of fecal coliform bacteria per 100 milliliters g. All fecal coliform bacteria average results must be reported as the geometric mean. When calculating the geometric mean, replace all results of
zero, 0, with a one, 1. The geometric mean of “n” quantities is the “nth” root of the quantities. For example the geometric mean of 100, 200, and 300 is (100 x 200 x 300)1/3= 181.7.
h. Not more than 10 percent of samples may exceed the daily maximum limit
i. g/L = micrograms per liter j. Lead, silver, and zinc must be sampled at least once during each of the following periods each year: January through April, May through
August, and September through December. Results must be submitted with the April, August, and December DMRs. k. TUc = toxic units, chronic l. WET testing is to be conducted, at least, a total of twice per year, one sample must be taken between November through April and one sample
must be taken between May through October. m. Quarters are defined as January-March, April-June, July-September and October-December. Results for monitoring performed quarterly must
be submitted with the DMR for the last month of the quarter: March, June, September, and December DMRs.
4.4 Effluent and Influent Monitoring
Monitoring frequencies are based on the nature and effect of the pollutant, as well as a determination of the minimum sampling necessary to adequately monitor the facility’s performance. The permittee has the option of taking more frequent samples than required under the permit. These additional samples shall be used for averaging if they are conducted using the Department – approved test methods (found in 18 AAC 70 and 40 CFR Part 136 [adopted by reference in 18 AAC 83.010]), and if the method detection limits are less than the effluent limits.
The permit requires monitoring of the effluent for flow, BOD5, TSS, pH, fecal coliform bacteria, total ammonia as N, copper, and WET to determine compliance with the effluent limits. The permit also requires monitoring of the influent for BOD5 and TSS to calculate monthly removal rates for these parameters. In addition, the permit includes requirements to monitor the effluent for lead, silver, and zinc in order to conduct future reasonable potential analyses during permit reissuance. The permit requires monitoring effluent for dissolved oxygen, hardness, and alkalinity to evaluate the characteristics of the effluent and supply information for permit reissuance.
Monitoring changes made in the 2014 permit as compared to the 2006 permit include:
copper and hardness monitoring during the months of July through September have been reduced from twice per month to once per month;
turbidity monitoring has been removed;
total residual chlorine monitoring has been removed; and
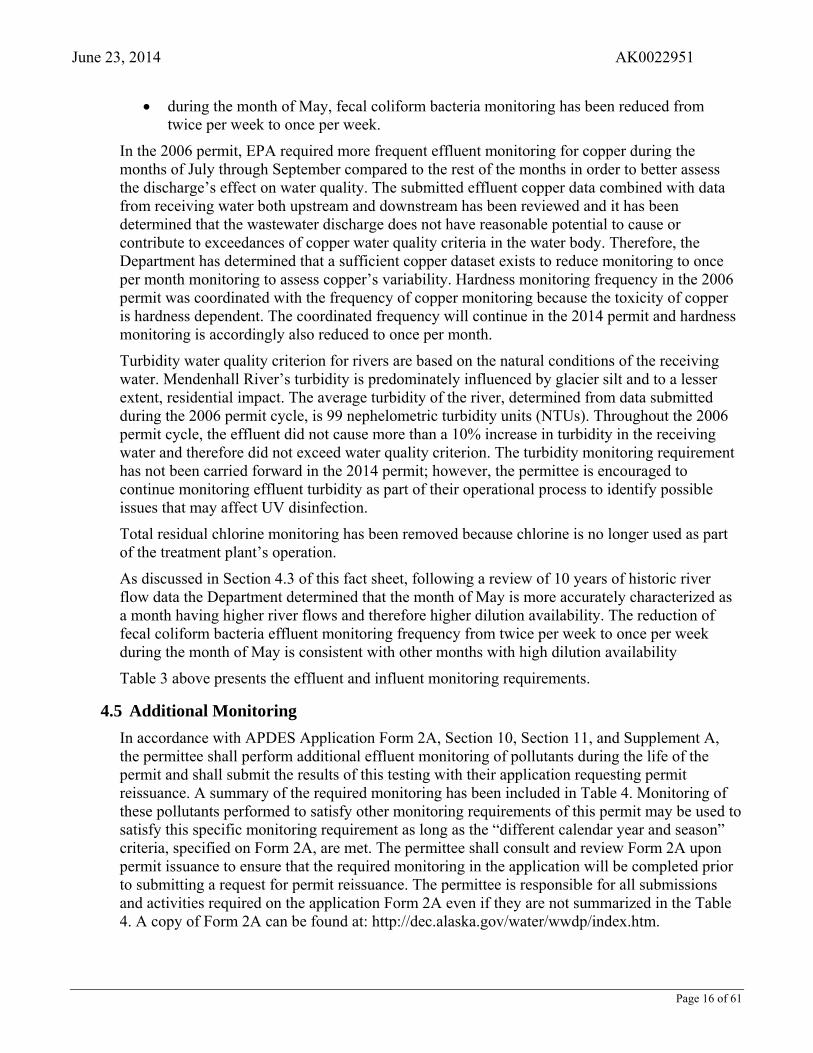
June 23, 2014 AK0022951
Page 16 of 61
during the month of May, fecal coliform bacteria monitoring has been reduced from twice per week to once per week.
In the 2006 permit, EPA required more frequent effluent monitoring for copper during the months of July through September compared to the rest of the months in order to better assess the discharge’s effect on water quality. The submitted effluent copper data combined with data from receiving water both upstream and downstream has been reviewed and it has been determined that the wastewater discharge does not have reasonable potential to cause or contribute to exceedances of copper water quality criteria in the water body. Therefore, the Department has determined that a sufficient copper dataset exists to reduce monitoring to once per month monitoring to assess copper’s variability. Hardness monitoring frequency in the 2006 permit was coordinated with the frequency of copper monitoring because the toxicity of copper is hardness dependent. The coordinated frequency will continue in the 2014 permit and hardness monitoring is accordingly also reduced to once per month.
Turbidity water quality criterion for rivers are based on the natural conditions of the receiving water. Mendenhall River’s turbidity is predominately influenced by glacier silt and to a lesser extent, residential impact. The average turbidity of the river, determined from data submitted during the 2006 permit cycle, is 99 nephelometric turbidity units (NTUs). Throughout the 2006 permit cycle, the effluent did not cause more than a 10% increase in turbidity in the receiving water and therefore did not exceed water quality criterion. The turbidity monitoring requirement has not been carried forward in the 2014 permit; however, the permittee is encouraged to continue monitoring effluent turbidity as part of their operational process to identify possible issues that may affect UV disinfection.
Total residual chlorine monitoring has been removed because chlorine is no longer used as part of the treatment plant’s operation.
As discussed in Section 4.3 of this fact sheet, following a review of 10 years of historic river flow data the Department determined that the month of May is more accurately characterized as a month having higher river flows and therefore higher dilution availability. The reduction of fecal coliform bacteria effluent monitoring frequency from twice per week to once per week during the month of May is consistent with other months with high dilution availability
Table 3 above presents the effluent and influent monitoring requirements.
4.5 Additional Monitoring
In accordance with APDES Application Form 2A, Section 10, Section 11, and Supplement A, the permittee shall perform additional effluent monitoring of pollutants during the life of the permit and shall submit the results of this testing with their application requesting permit reissuance. A summary of the required monitoring has been included in Table 4. Monitoring of these pollutants performed to satisfy other monitoring requirements of this permit may be used to satisfy this specific monitoring requirement as long as the “different calendar year and season” criteria, specified on Form 2A, are met. The permittee shall consult and review Form 2A upon permit issuance to ensure that the required monitoring in the application will be completed prior to submitting a request for permit reissuance. The permittee is responsible for all submissions and activities required on the application Form 2A even if they are not summarized in the Table 4. A copy of Form 2A can be found at: http://dec.alaska.gov/water/wwdp/index.htm.
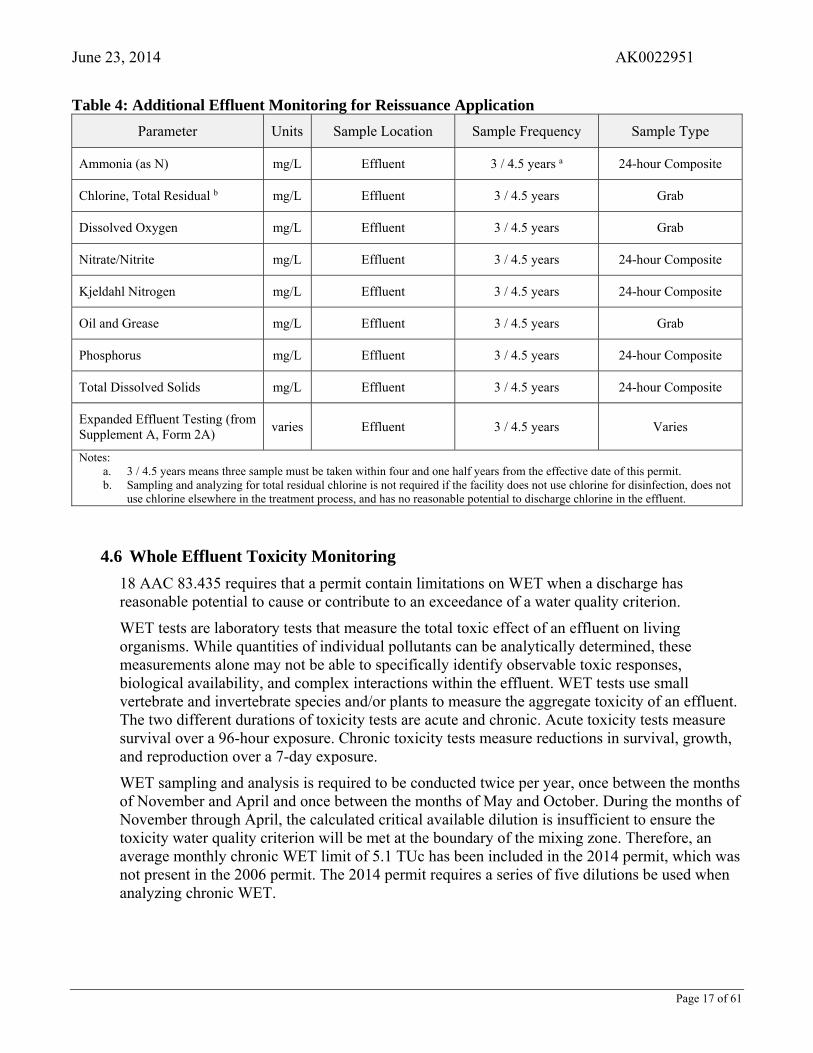
June 23, 2014 AK0022951
Page 17 of 61
Table 4: Additional Effluent Monitoring for Reissuance Application
Parameter Units Sample Location Sample Frequency Sample Type
Ammonia (as N) mg/L Effluent 3 / 4.5 years a 24-hour Composite
Chlorine, Total Residual b mg/L Effluent 3 / 4.5 years Grab
Dissolved Oxygen mg/L Effluent 3 / 4.5 years Grab
Nitrate/Nitrite mg/L Effluent 3 / 4.5 years 24-hour Composite
Kjeldahl Nitrogen mg/L Effluent 3 / 4.5 years 24-hour Composite
Oil and Grease mg/L Effluent 3 / 4.5 years Grab
Phosphorus mg/L Effluent 3 / 4.5 years 24-hour Composite
Total Dissolved Solids mg/L Effluent 3 / 4.5 years 24-hour Composite
Expanded Effluent Testing (from Supplement A, Form 2A) varies Effluent 3 / 4.5 years Varies
Notes: a. 3 / 4.5 years means three sample must be taken within four and one half years from the effective date of this permit. b. Sampling and analyzing for total residual chlorine is not required if the facility does not use chlorine for disinfection, does not
use chlorine elsewhere in the treatment process, and has no reasonable potential to discharge chlorine in the effluent.
4.6 Whole Effluent Toxicity Monitoring
18 AAC 83.435 requires that a permit contain limitations on WET when a discharge has reasonable potential to cause or contribute to an exceedance of a water quality criterion.
WET tests are laboratory tests that measure the total toxic effect of an effluent on living organisms. While quantities of individual pollutants can be analytically determined, these measurements alone may not be able to specifically identify observable toxic responses, biological availability, and complex interactions within the effluent. WET tests use small vertebrate and invertebrate species and/or plants to measure the aggregate toxicity of an effluent. The two different durations of toxicity tests are acute and chronic. Acute toxicity tests measure survival over a 96-hour exposure. Chronic toxicity tests measure reductions in survival, growth, and reproduction over a 7-day exposure.
WET sampling and analysis is required to be conducted twice per year, once between the months of November and April and once between the months of May and October. During the months of November through April, the calculated critical available dilution is insufficient to ensure the toxicity water quality criterion will be met at the boundary of the mixing zone. Therefore, an average monthly chronic WET limit of 5.1 TUc has been included in the 2014 permit, which was not present in the 2006 permit. The 2014 permit requires a series of five dilutions be used when analyzing chronic WET.
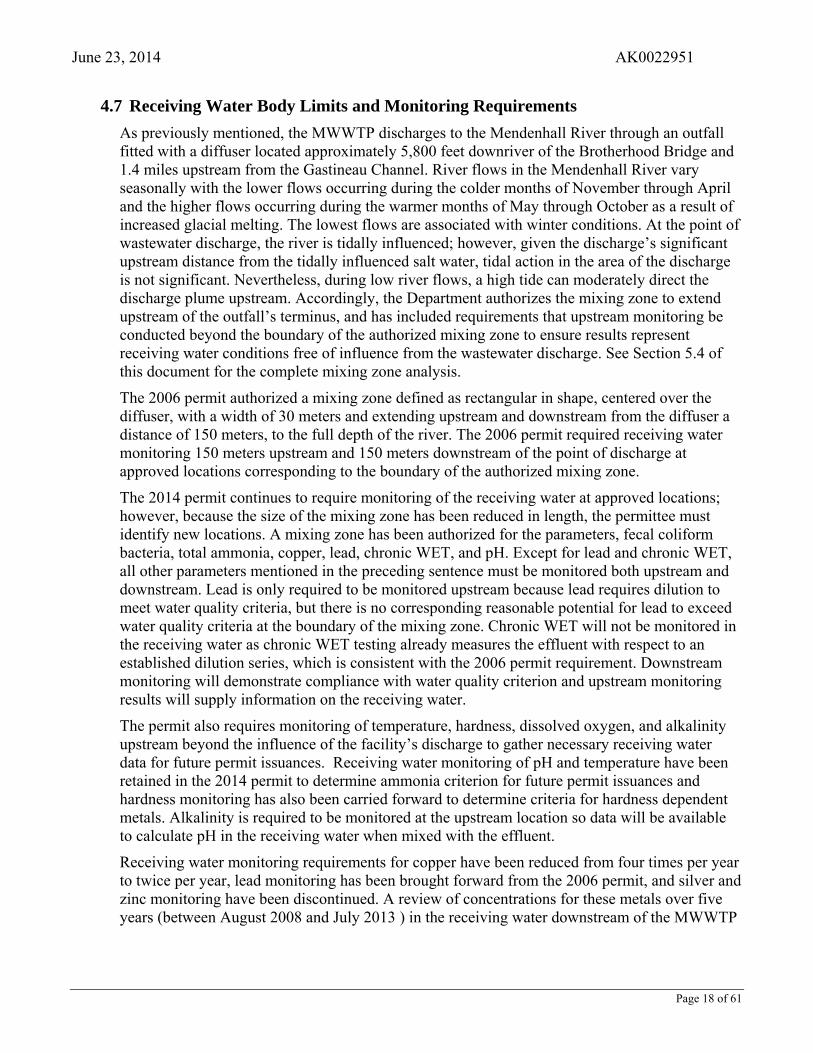
June 23, 2014 AK0022951
Page 18 of 61
4.7 Receiving Water Body Limits and Monitoring Requirements
As previously mentioned, the MWWTP discharges to the Mendenhall River through an outfall fitted with a diffuser located approximately 5,800 feet downriver of the Brotherhood Bridge and 1.4 miles upstream from the Gastineau Channel. River flows in the Mendenhall River vary seasonally with the lower flows occurring during the colder months of November through April and the higher flows occurring during the warmer months of May through October as a result of increased glacial melting. The lowest flows are associated with winter conditions. At the point of wastewater discharge, the river is tidally influenced; however, given the discharge’s significant upstream distance from the tidally influenced salt water, tidal action in the area of the discharge is not significant. Nevertheless, during low river flows, a high tide can moderately direct the discharge plume upstream. Accordingly, the Department authorizes the mixing zone to extend upstream of the outfall’s terminus, and has included requirements that upstream monitoring be conducted beyond the boundary of the authorized mixing zone to ensure results represent receiving water conditions free of influence from the wastewater discharge. See Section 5.4 of this document for the complete mixing zone analysis.
The 2006 permit authorized a mixing zone defined as rectangular in shape, centered over the diffuser, with a width of 30 meters and extending upstream and downstream from the diffuser a distance of 150 meters, to the full depth of the river. The 2006 permit required receiving water monitoring 150 meters upstream and 150 meters downstream of the point of discharge at approved locations corresponding to the boundary of the authorized mixing zone.
The 2014 permit continues to require monitoring of the receiving water at approved locations; however, because the size of the mixing zone has been reduced in length, the permittee must identify new locations. A mixing zone has been authorized for the parameters, fecal coliform bacteria, total ammonia, copper, lead, chronic WET, and pH. Except for lead and chronic WET, all other parameters mentioned in the preceding sentence must be monitored both upstream and downstream. Lead is only required to be monitored upstream because lead requires dilution to meet water quality criteria, but there is no corresponding reasonable potential for lead to exceed water quality criteria at the boundary of the mixing zone. Chronic WET will not be monitored in the receiving water as chronic WET testing already measures the effluent with respect to an established dilution series, which is consistent with the 2006 permit requirement. Downstream monitoring will demonstrate compliance with water quality criterion and upstream monitoring results will supply information on the receiving water.
The permit also requires monitoring of temperature, hardness, dissolved oxygen, and alkalinity upstream beyond the influence of the facility’s discharge to gather necessary receiving water data for future permit issuances. Receiving water monitoring of pH and temperature have been retained in the 2014 permit to determine ammonia criterion for future permit issuances and hardness monitoring has also been carried forward to determine criteria for hardness dependent metals. Alkalinity is required to be monitored at the upstream location so data will be available to calculate pH in the receiving water when mixed with the effluent.
Receiving water monitoring requirements for copper have been reduced from four times per year to twice per year, lead monitoring has been brought forward from the 2006 permit, and silver and zinc monitoring have been discontinued. A review of concentrations for these metals over five years (between August 2008 and July 2013 ) in the receiving water downstream of the MWWTP
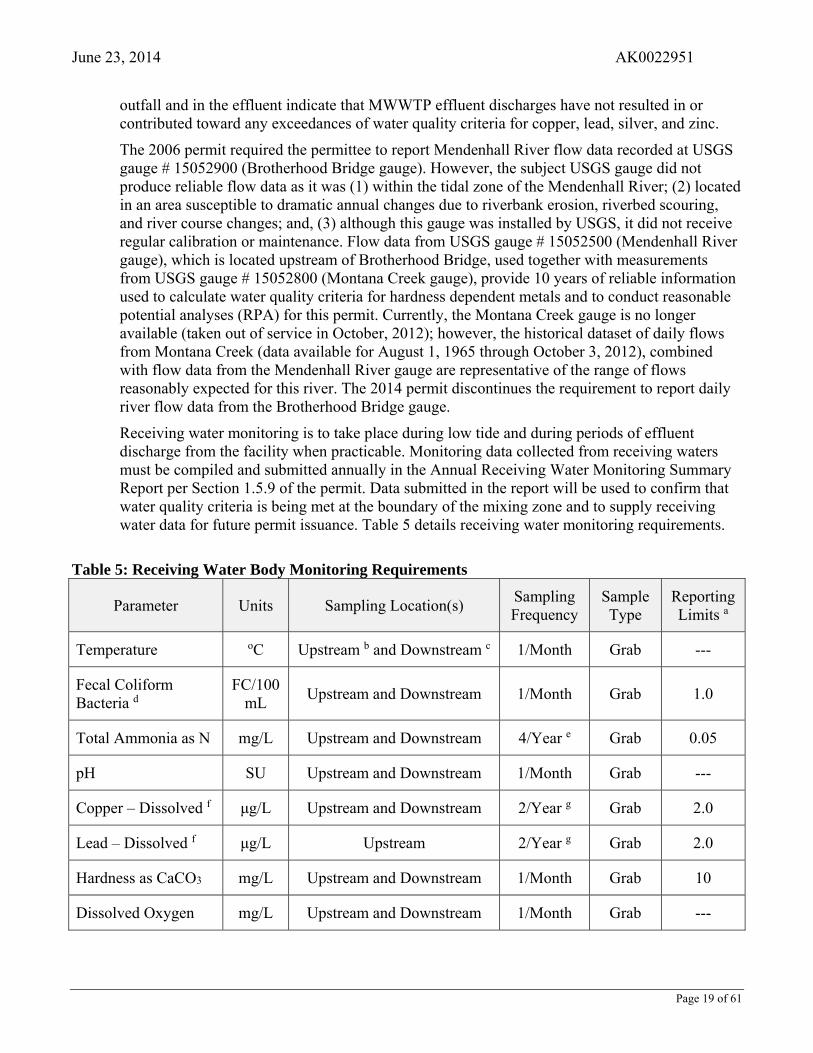
June 23, 2014 AK0022951
Page 19 of 61
outfall and in the effluent indicate that MWWTP effluent discharges have not resulted in or contributed toward any exceedances of water quality criteria for copper, lead, silver, and zinc.
The 2006 permit required the permittee to report Mendenhall River flow data recorded at USGS gauge # 15052900 (Brotherhood Bridge gauge). However, the subject USGS gauge did not produce reliable flow data as it was (1) within the tidal zone of the Mendenhall River; (2) located in an area susceptible to dramatic annual changes due to riverbank erosion, riverbed scouring, and river course changes; and, (3) although this gauge was installed by USGS, it did not receive regular calibration or maintenance. Flow data from USGS gauge # 15052500 (Mendenhall River gauge), which is located upstream of Brotherhood Bridge, used together with measurements from USGS gauge # 15052800 (Montana Creek gauge), provide 10 years of reliable information used to calculate water quality criteria for hardness dependent metals and to conduct reasonable potential analyses (RPA) for this permit. Currently, the Montana Creek gauge is no longer available (taken out of service in October, 2012); however, the historical dataset of daily flows from Montana Creek (data available for August 1, 1965 through October 3, 2012), combined with flow data from the Mendenhall River gauge are representative of the range of flows reasonably expected for this river. The 2014 permit discontinues the requirement to report daily river flow data from the Brotherhood Bridge gauge.
Receiving water monitoring is to take place during low tide and during periods of effluent discharge from the facility when practicable. Monitoring data collected from receiving waters must be compiled and submitted annually in the Annual Receiving Water Monitoring Summary Report per Section 1.5.9 of the permit. Data submitted in the report will be used to confirm that water quality criteria is being met at the boundary of the mixing zone and to supply receiving water data for future permit issuance. Table 5 details receiving water monitoring requirements.
Table 5: Receiving Water Body Monitoring Requirements
Parameter Units Sampling Location(s) Sampling Frequency
Sample Type
Reporting Limits a
Temperature oC Upstream b and Downstream c 1/Month Grab ---
Fecal Coliform Bacteria d
FC/100 mL
Upstream and Downstream 1/Month Grab 1.0
Total Ammonia as N mg/L Upstream and Downstream 4/Year e Grab 0.05
pH SU Upstream and Downstream 1/Month Grab ---
Copper – Dissolved f μg/L Upstream and Downstream 2/Year g Grab 2.0
Lead – Dissolved f μg/L Upstream 2/Year g Grab 2.0
Hardness as CaCO3 mg/L Upstream and Downstream 1/Month Grab 10
Dissolved Oxygen mg/L Upstream and Downstream 1/Month Grab ---

June 23, 2014 AK0022951
Page 20 of 61
Parameter Units Sampling Location(s) Sampling Frequency
Sample Type
Reporting Limits a
Alkalinity as CaCO3 mg/L Upstream 1/Month Grab 10
Notes: a. Permittee must use analytical test methods that achieve a reporting limit equivalent to or less than the values
in this column. b. Location of sampling must be upstream of the point of discharge, beyond the mixing zone boundary, and
taken during periods of low tide. c. Location of sampling must be 100 meters downstream of the diffuser, at the boundary of the authorized
mixing zone. d. All mixing zone fecal coliform bacteria average results must be reported as the geometric mean. When
calculating the geometric mean, replace all results of zero (0) with a one (1). The geometric mean of “n” quantities is the “nth” root of the quantities. For example, the geometric mean of 100, 200, and 300 is (100 x 200 x 300)1/3 = 181.7.
e. Of the requisite four samples per year, two samples must be taken during November through April in different months and two samples must be taken during May through October in different months.
f. Analysis for copper and lead in the receiving water must be as a dissolved metal. g. Of the requisite two samples per year, one sample must be taken between November 1 and April 30, and one
sample must be taken between May 1 and October 31.
5.0 RECEIVING WATER BODY
The permittee discharges treated domestic wastewater effluent into Mendenhall River at latitude 58° 21’43” N, longitude 134° 35’ 53” W. The WQS at 18 AAC 70.020(a) classifies the Mendenhall River as being protected for the following freshwater uses: Classes (1) (A), (B), and (C) for use in water supply (drinking, culinary and food processing, agriculture, aquaculture, and industrial), water recreation (contact and secondary recreation), and growth and propagation of fish, shellfish, other aquatic life and wildlife.
5.1 Low Flow Conditions
The Technical Support Document for Water Quality-Based Toxics Control (TSD) (EPA, 1991) and the WQS recommend the flow conditions for use in calculation WQBELs using steady-state modeling. The TSD and WQS state that WQBELs intended to protect aquatic life uses should be based on the lowest seven-day average flow rate expected to occur once every 10 years (7Q10) for chronic criteria and the lowest one-day average flow rate expected to occur once every 10 years (1Q10) for acute criteria. Because the chronic criterion for ammonia is based on a 30-day average concentration, the 30B3 has been used for the chronic ammonia criterion instead of the 7Q10. The 30B3 is a biologically-based design flow intended to ensure an excursion frequency of once every three years for a 30-day average flow rate. The 7Q10, 1Q10, and 30B3 have been calculated for the two identified hydrological seasons.
DEC analyzed 10 years of Mendenhall River flow data from October 3, 2002 through October 3, 2012. Monthly averages, minimum flows, and maximum flows were determined by combining the flows from the USGS gauges #15052500 at Mendenhall River, upstream from the MWWTP discharge, and Montana Creek gauge #15052800, also upstream from the treatment plant but further downstream than gauge #15052500. The Department determined that dividing the year into two seasons, November through April and May through October, results in a permit
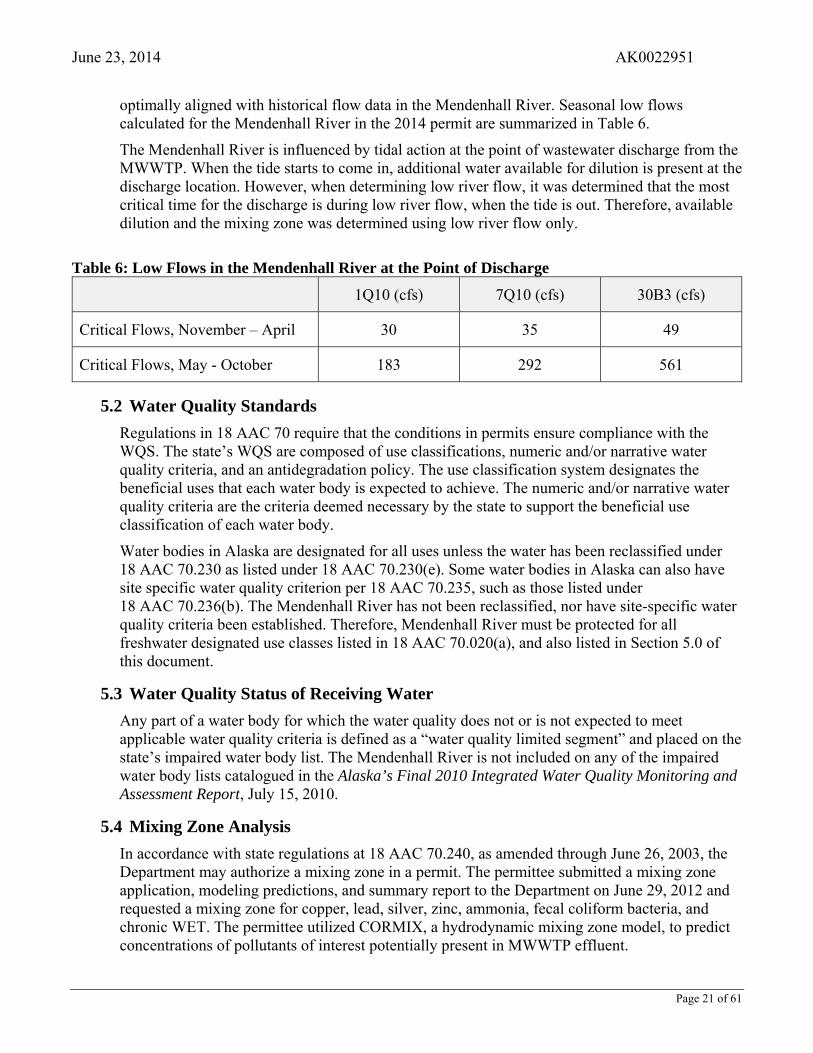
June 23, 2014 AK0022951
Page 21 of 61
optimally aligned with historical flow data in the Mendenhall River. Seasonal low flows calculated for the Mendenhall River in the 2014 permit are summarized in Table 6.
The Mendenhall River is influenced by tidal action at the point of wastewater discharge from the MWWTP. When the tide starts to come in, additional water available for dilution is present at the discharge location. However, when determining low river flow, it was determined that the most critical time for the discharge is during low river flow, when the tide is out. Therefore, available dilution and the mixing zone was determined using low river flow only.
Table 6: Low Flows in the Mendenhall River at the Point of Discharge
1Q10 (cfs) 7Q10 (cfs) 30B3 (cfs)
Critical Flows, November – April 30 35 49
Critical Flows, May - October 183 292 561
5.2 Water Quality Standards
Regulations in 18 AAC 70 require that the conditions in permits ensure compliance with the WQS. The state’s WQS are composed of use classifications, numeric and/or narrative water quality criteria, and an antidegradation policy. The use classification system designates the beneficial uses that each water body is expected to achieve. The numeric and/or narrative water quality criteria are the criteria deemed necessary by the state to support the beneficial use classification of each water body.
Water bodies in Alaska are designated for all uses unless the water has been reclassified under 18 AAC 70.230 as listed under 18 AAC 70.230(e). Some water bodies in Alaska can also have site specific water quality criterion per 18 AAC 70.235, such as those listed under 18 AAC 70.236(b). The Mendenhall River has not been reclassified, nor have site-specific water quality criteria been established. Therefore, Mendenhall River must be protected for all freshwater designated use classes listed in 18 AAC 70.020(a), and also listed in Section 5.0 of this document.
5.3 Water Quality Status of Receiving Water
Any part of a water body for which the water quality does not or is not expected to meet applicable water quality criteria is defined as a “water quality limited segment” and placed on the state’s impaired water body list. The Mendenhall River is not included on any of the impaired water body lists catalogued in the Alaska’s Final 2010 Integrated Water Quality Monitoring and Assessment Report, July 15, 2010.
5.4 Mixing Zone Analysis
In accordance with state regulations at 18 AAC 70.240, as amended through June 26, 2003, the Department may authorize a mixing zone in a permit. The permittee submitted a mixing zone application, modeling predictions, and summary report to the Department on June 29, 2012 and requested a mixing zone for copper, lead, silver, zinc, ammonia, fecal coliform bacteria, and chronic WET. The permittee utilized CORMIX, a hydrodynamic mixing zone model, to predict concentrations of pollutants of interest potentially present in MWWTP effluent.
June 23, 2014 AK0022951
Page 22 of 61
The Department reviewed the CORMIX models submitted by the permittee and conducted additional CORMIX modeling for pollutants: fecal coliform bacteria, ammonia, copper, lead, and chronic WET. Models were performed by the Department to simulate conditions during the two river flow scenarios. Based on the modeling, a review of the application, and other submitted data, the Department is authorizing a chronic and an acute mixing zone.
The Department authorizes a chronic mixing zone for: fecal coliform bacteria, pH, ammonia, chronic toxicity, copper, and lead. The Department authorizes a smaller, initial acute mixing zone for ammonia, and copper.
Appendix E, Mixing Zone Analysis Checklist, outlines regulatory criteria that the Department must consider when analyzing a mixing zone request. These regulatory criteria include: the size of the mixing zone, treatment technology, existing uses of the water body, human consumption, spawning areas, human health, aquatic life, and endangered species. All criteria must be met for the Department to authorize a mixing zone. The following sections summarize the Department’s mixing zone analysis.
Size In sizing the mixing zone, available dilution during critical flow conditions and the size of the bounded area of the river were taken into consideration. Dilution factors were determined for each hydrological seasons by comparing the ratio of critical river flow to discharge flow. All dilution factors are calculated with the discharge flow rate set equal to MWWTP’s design flow of 4.9 mgd. For each of the two seasons, (November - April and May – October) there are three values for the dilution factor: one based on the 1Q10 flow rate of the receiving water and used to determine reasonable potential (RP) and wasteload allocations for acute aquatic life criteria, one based on the 7Q10 flow rate of the receiving water and used to determine RP and wasteload allocations for chronic aquatic life criteria (except ammonia) and conventional pollutants, and one based on the 30B3 flow rate of the receiving water and used to determine RP and wasteload allocations for the chronic ammonia criterion. This resulted in a total of six different dilution factors under initial consideration, as summarized in Table 7 below.
Table 7: Effluent Dilution Factors
Season Acute (1Q10) Chronic (7Q10) Chronic (30B3)
November-April
5.0 5.6 a 7.5
May-October 25.1 39.5 75.0
Note: a. Dilution value = 5.6 was also used in setting chronic fecal coliform bacteria effluent limits.
Receiving water and facility-specific variables were entered into the CORMIX model to determine the behavior of the effluent as it mixes with the receiving water. A range of variables were considered while modeling boundary conditions including, but not limited to: positioning of the outfall structure, diffuser and effluent port diameters, effluent discharge velocity, river flows, the temperature and pH of the effluent and river, effluent pollutant concentrations, and receiving water pollutant concentration. Conservative (i.e. 99th percentile of effluent pollutant concentrations and maximum effluent flow rate) conditions were used as effluent input variables.
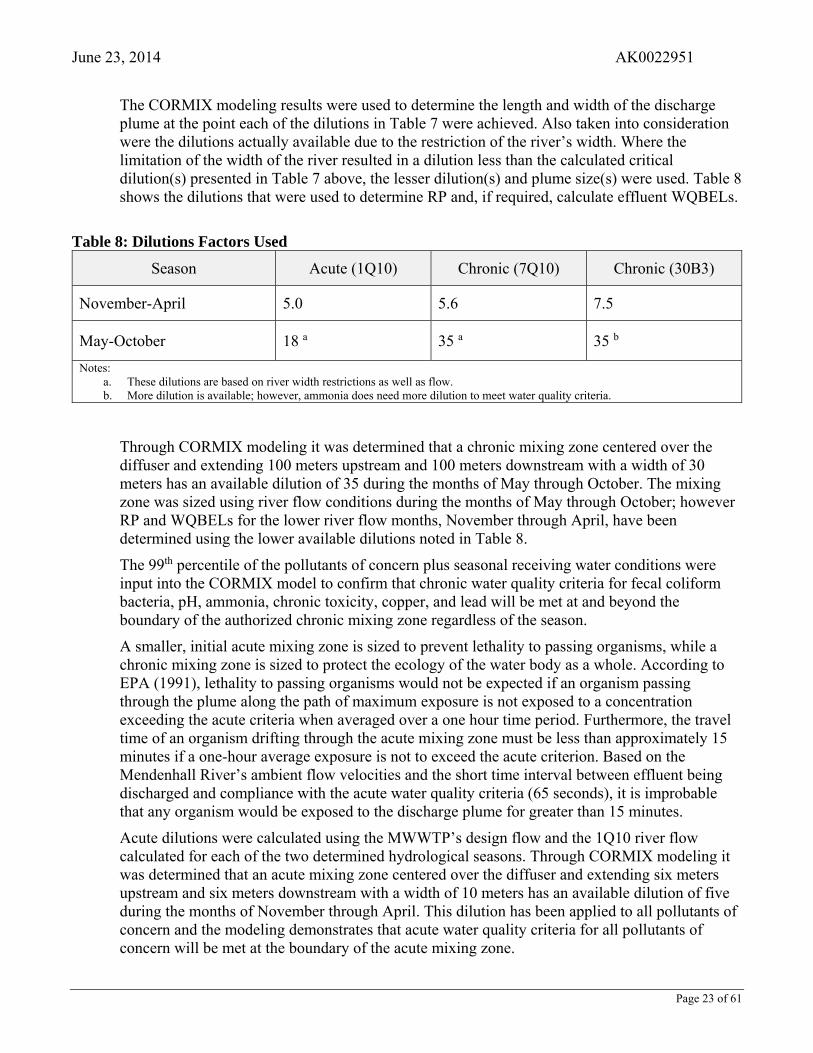
June 23, 2014 AK0022951
Page 23 of 61
The CORMIX modeling results were used to determine the length and width of the discharge plume at the point each of the dilutions in Table 7 were achieved. Also taken into consideration were the dilutions actually available due to the restriction of the river’s width. Where the limitation of the width of the river resulted in a dilution less than the calculated critical dilution(s) presented in Table 7 above, the lesser dilution(s) and plume size(s) were used. Table 8 shows the dilutions that were used to determine RP and, if required, calculate effluent WQBELs.
Table 8: Dilutions Factors Used
Season Acute (1Q10) Chronic (7Q10) Chronic (30B3)
November-April 5.0 5.6 7.5
May-October 18 a 35 a 35 b
Notes: a. These dilutions are based on river width restrictions as well as flow. b. More dilution is available; however, ammonia does need more dilution to meet water quality criteria.
Through CORMIX modeling it was determined that a chronic mixing zone centered over the diffuser and extending 100 meters upstream and 100 meters downstream with a width of 30 meters has an available dilution of 35 during the months of May through October. The mixing zone was sized using river flow conditions during the months of May through October; however RP and WQBELs for the lower river flow months, November through April, have been determined using the lower available dilutions noted in Table 8.
The 99th percentile of the pollutants of concern plus seasonal receiving water conditions were input into the CORMIX model to confirm that chronic water quality criteria for fecal coliform bacteria, pH, ammonia, chronic toxicity, copper, and lead will be met at and beyond the boundary of the authorized chronic mixing zone regardless of the season.
A smaller, initial acute mixing zone is sized to prevent lethality to passing organisms, while a chronic mixing zone is sized to protect the ecology of the water body as a whole. According to EPA (1991), lethality to passing organisms would not be expected if an organism passing through the plume along the path of maximum exposure is not exposed to a concentration exceeding the acute criteria when averaged over a one hour time period. Furthermore, the travel time of an organism drifting through the acute mixing zone must be less than approximately 15 minutes if a one-hour average exposure is not to exceed the acute criterion. Based on the Mendenhall River’s ambient flow velocities and the short time interval between effluent being discharged and compliance with the acute water quality criteria (65 seconds), it is improbable that any organism would be exposed to the discharge plume for greater than 15 minutes.
Acute dilutions were calculated using the MWWTP’s design flow and the 1Q10 river flow calculated for each of the two determined hydrological seasons. Through CORMIX modeling it was determined that an acute mixing zone centered over the diffuser and extending six meters upstream and six meters downstream with a width of 10 meters has an available dilution of five during the months of November through April. This dilution has been applied to all pollutants of concern and the modeling demonstrates that acute water quality criteria for all pollutants of concern will be met at the boundary of the acute mixing zone.
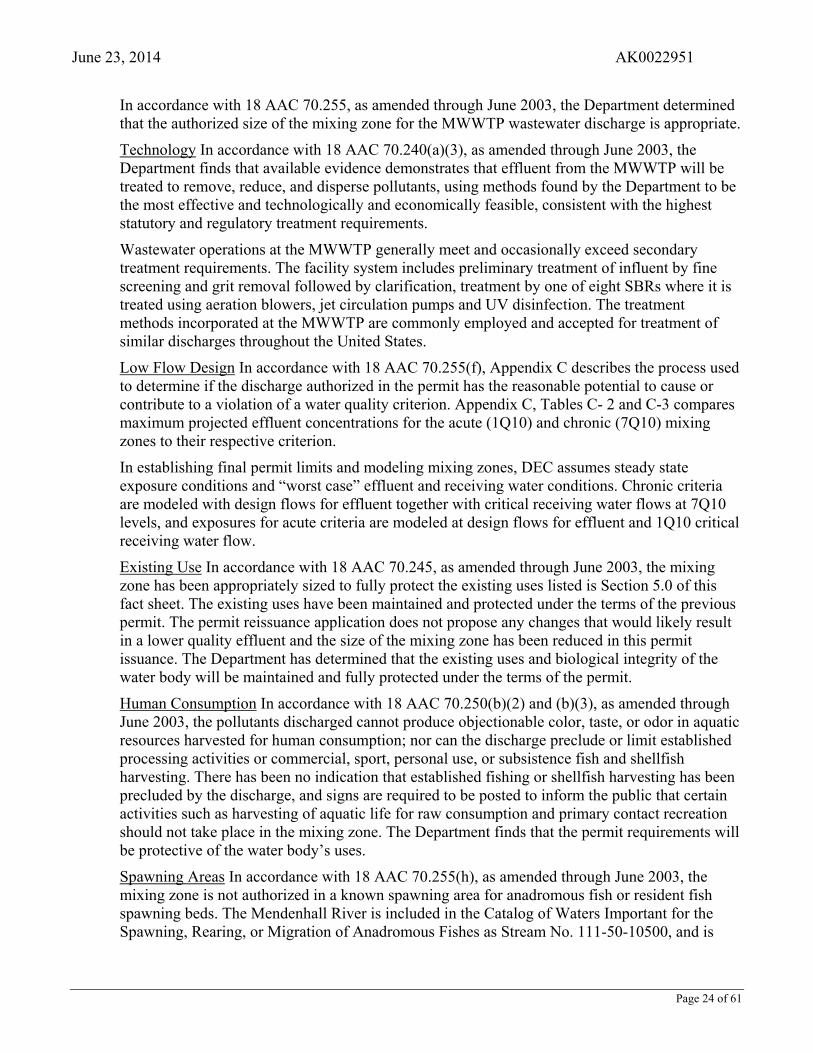
June 23, 2014 AK0022951
Page 24 of 61
In accordance with 18 AAC 70.255, as amended through June 2003, the Department determined that the authorized size of the mixing zone for the MWWTP wastewater discharge is appropriate.
Technology In accordance with 18 AAC 70.240(a)(3), as amended through June 2003, the Department finds that available evidence demonstrates that effluent from the MWWTP will be treated to remove, reduce, and disperse pollutants, using methods found by the Department to be the most effective and technologically and economically feasible, consistent with the highest statutory and regulatory treatment requirements.
Wastewater operations at the MWWTP generally meet and occasionally exceed secondary treatment requirements. The facility system includes preliminary treatment of influent by fine screening and grit removal followed by clarification, treatment by one of eight SBRs where it is treated using aeration blowers, jet circulation pumps and UV disinfection. The treatment methods incorporated at the MWWTP are commonly employed and accepted for treatment of similar discharges throughout the United States.
Low Flow Design In accordance with 18 AAC 70.255(f), Appendix C describes the process used to determine if the discharge authorized in the permit has the reasonable potential to cause or contribute to a violation of a water quality criterion. Appendix C, Tables C- 2 and C-3 compares maximum projected effluent concentrations for the acute (1Q10) and chronic (7Q10) mixing zones to their respective criterion.
In establishing final permit limits and modeling mixing zones, DEC assumes steady state exposure conditions and “worst case” effluent and receiving water conditions. Chronic criteria are modeled with design flows for effluent together with critical receiving water flows at 7Q10 levels, and exposures for acute criteria are modeled at design flows for effluent and 1Q10 critical receiving water flow.
Existing Use In accordance with 18 AAC 70.245, as amended through June 2003, the mixing zone has been appropriately sized to fully protect the existing uses listed is Section 5.0 of this fact sheet. The existing uses have been maintained and protected under the terms of the previous permit. The permit reissuance application does not propose any changes that would likely result in a lower quality effluent and the size of the mixing zone has been reduced in this permit issuance. The Department has determined that the existing uses and biological integrity of the water body will be maintained and fully protected under the terms of the permit.
Human Consumption In accordance with 18 AAC 70.250(b)(2) and (b)(3), as amended through June 2003, the pollutants discharged cannot produce objectionable color, taste, or odor in aquatic resources harvested for human consumption; nor can the discharge preclude or limit established processing activities or commercial, sport, personal use, or subsistence fish and shellfish harvesting. There has been no indication that established fishing or shellfish harvesting has been precluded by the discharge, and signs are required to be posted to inform the public that certain activities such as harvesting of aquatic life for raw consumption and primary contact recreation should not take place in the mixing zone. The Department finds that the permit requirements will be protective of the water body’s uses.
Spawning Areas In accordance with 18 AAC 70.255(h), as amended through June 2003, the mixing zone is not authorized in a known spawning area for anadromous fish or resident fish spawning beds. The Mendenhall River is included in the Catalog of Waters Important for the Spawning, Rearing, or Migration of Anadromous Fishes as Stream No. 111-50-10500, and is
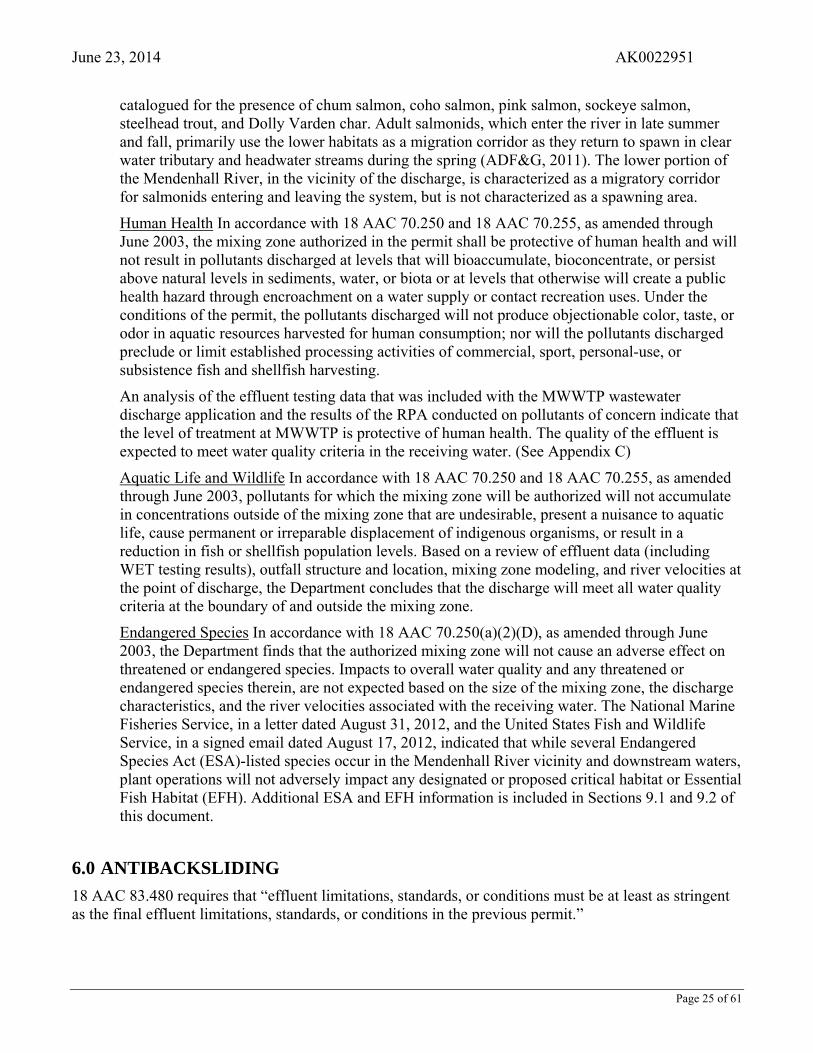
June 23, 2014 AK0022951
Page 25 of 61
catalogued for the presence of chum salmon, coho salmon, pink salmon, sockeye salmon, steelhead trout, and Dolly Varden char. Adult salmonids, which enter the river in late summer and fall, primarily use the lower habitats as a migration corridor as they return to spawn in clear water tributary and headwater streams during the spring (ADF&G, 2011). The lower portion of the Mendenhall River, in the vicinity of the discharge, is characterized as a migratory corridor for salmonids entering and leaving the system, but is not characterized as a spawning area.
Human Health In accordance with 18 AAC 70.250 and 18 AAC 70.255, as amended through June 2003, the mixing zone authorized in the permit shall be protective of human health and will not result in pollutants discharged at levels that will bioaccumulate, bioconcentrate, or persist above natural levels in sediments, water, or biota or at levels that otherwise will create a public health hazard through encroachment on a water supply or contact recreation uses. Under the conditions of the permit, the pollutants discharged will not produce objectionable color, taste, or odor in aquatic resources harvested for human consumption; nor will the pollutants discharged preclude or limit established processing activities of commercial, sport, personal-use, or subsistence fish and shellfish harvesting.
An analysis of the effluent testing data that was included with the MWWTP wastewater discharge application and the results of the RPA conducted on pollutants of concern indicate that the level of treatment at MWWTP is protective of human health. The quality of the effluent is expected to meet water quality criteria in the receiving water. (See Appendix C)
Aquatic Life and Wildlife In accordance with 18 AAC 70.250 and 18 AAC 70.255, as amended through June 2003, pollutants for which the mixing zone will be authorized will not accumulate in concentrations outside of the mixing zone that are undesirable, present a nuisance to aquatic life, cause permanent or irreparable displacement of indigenous organisms, or result in a reduction in fish or shellfish population levels. Based on a review of effluent data (including WET testing results), outfall structure and location, mixing zone modeling, and river velocities at the point of discharge, the Department concludes that the discharge will meet all water quality criteria at the boundary of and outside the mixing zone.
Endangered Species In accordance with 18 AAC 70.250(a)(2)(D), as amended through June 2003, the Department finds that the authorized mixing zone will not cause an adverse effect on threatened or endangered species. Impacts to overall water quality and any threatened or endangered species therein, are not expected based on the size of the mixing zone, the discharge characteristics, and the river velocities associated with the receiving water. The National Marine Fisheries Service, in a letter dated August 31, 2012, and the United States Fish and Wildlife Service, in a signed email dated August 17, 2012, indicated that while several Endangered Species Act (ESA)-listed species occur in the Mendenhall River vicinity and downstream waters, plant operations will not adversely impact any designated or proposed critical habitat or Essential Fish Habitat (EFH). Additional ESA and EFH information is included in Sections 9.1 and 9.2 of this document.
6.0 ANTIBACKSLIDING
18 AAC 83.480 requires that “effluent limitations, standards, or conditions must be at least as stringent as the final effluent limitations, standards, or conditions in the previous permit.”
June 23, 2014 AK0022951
Page 26 of 61
18 AAC 83.480(c) also states that a permit may not be reissued “to contain an effluent limitation that is less stringent than required by effluent guidelines in effect at the time the permit is renewed or reissued.”
Effluent limitations may be relaxed under two categories as allowed under 18 AAC 83.480 (CWA §402(o)) and CWA §303(d)(4). 18 AAC 83.480(b) allows relaxed limitations in renewed, reissued, or modified permits when there have been material and substantial alterations or additions to the permitted facility that justify the relaxation. CWA §303(d)(4)(A) states that, for water bodies where the water quality does not meet applicable water quality standards, effluent limitations may be revised under two conditions; the revised effluent limitation must ensure the attainment of the water quality standard (based on the water body’s total maximum daily load or the WLA) or the designated use which is not being attained is removed in accordance with the water quality standard regulations. CWA §303(d)(4)(B) states that, for water bodies where the water quality meets or exceeds the level necessary to support the water body's designated uses, water quality-based effluent limitations may be revised as long as the revision is consistent with the State's antidegradation policy. Even if the requirements of CWA §303(d)(4) or 18 AAC 83.480(b) are satisfied, 18 AAC 83.480(c) prohibits relaxed limits that would result in violations of WQS or effluent limitation guidelines.
The 2014 permit eliminates effluent limits for ammonia during the month of May and eliminates all effluent limits for total residual chlorine. Effluent limitations for all other pollutants are as stringent as or more stringent than those in the 2006 permit.
Following a review of new information gathered during the 2006 permit cycle, the Department has determined that the discharge from the MWWTP does not have the reasonable potential to cause or contribute to a violation of ammonia water quality criteria at the boundary of the mixing zone during the month of May; therefore, effluent limits for ammonia have been removed for the month of May. The Department reviewed new river flow rates and reported average monthly effluent/receiving water dilution ratios the permittee submitted for each month since it was first required in the 2006 permit. For the month of May, 76:1 was the lowest reported dilution ratio, which is well above the dilution ratio required (7.3:1) to meet ammonia water quality criteria. Based on this new information, the elimination of ammonia effluent limits during the month of May is compliant with 18 AAC 83.480(b)(2). All other ammonia effluent limits in the 2014 permit are either more stringent or remain the same as the 2006 permit.
The MWWTP has not used chlorine in the treatment process since the installation of the UV disinfection system prior to issuance of the 2006 permit. Chlorine effluent limits in the 2006 permit applied only if chlorine was added to the effluent for total or partial disinfection. Chlorine effluent limits were included in the 2006 permit to allow CBJ to disinfect its effluent should the UV system fail. Throughout the 2006 permit cycle the UV disinfection system has proved to be reliable and the use of chlorine has not been needed. The removal of effluent limits for total residual chlorine is consistent with the requirements applied during the 2006 permit cycle.
Monitoring frequency of copper and hardness during the months of July through September have been reduced from twice per month to once per month and the monitoring of fecal coliform bacteria during the month of May has been reduced from twice per week to once per week.
Due to the inverse relationship between river flow and hardness, and the increase in the toxicity of copper as hardness decreases, water quality criteria for copper is more stringent during times of high river flows. However, as river flow rates increase more dilution becomes available which can offset the increased toxicity of copper. The 2006 permit required monitoring of copper and hardness in the effluent more frequently during the summer months with the highest river flows, July through September, in
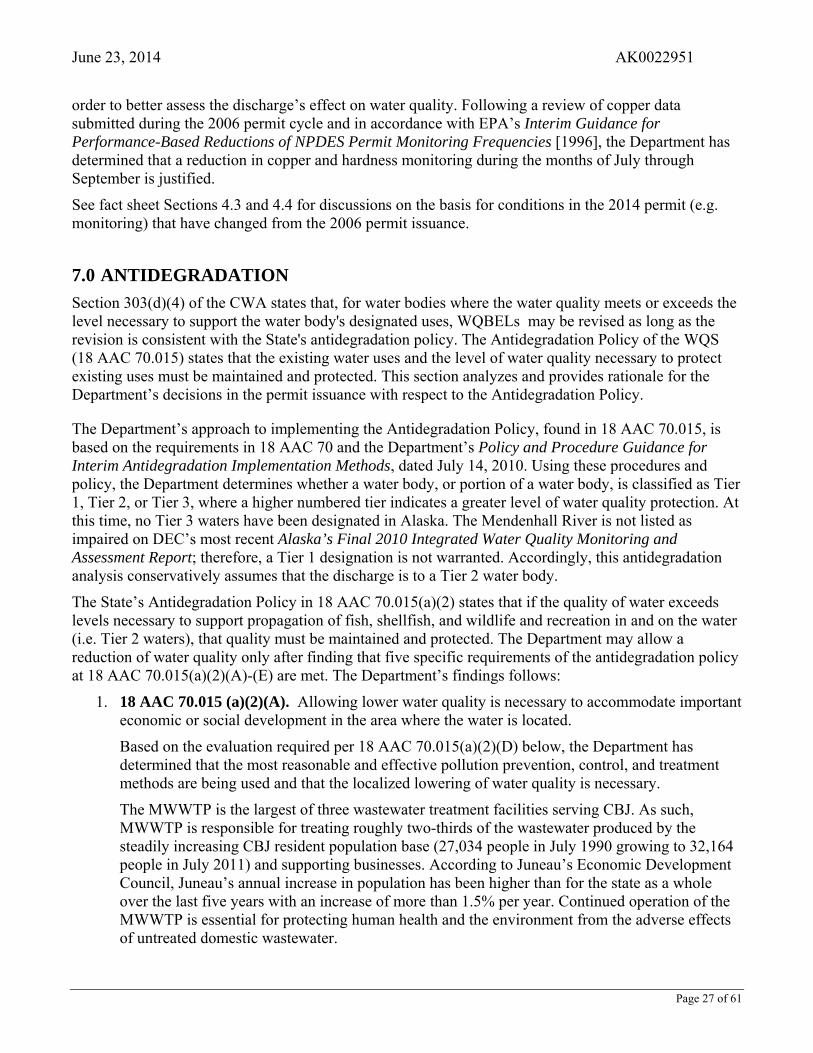
June 23, 2014 AK0022951
Page 27 of 61
order to better assess the discharge’s effect on water quality. Following a review of copper data submitted during the 2006 permit cycle and in accordance with EPA’s Interim Guidance for Performance-Based Reductions of NPDES Permit Monitoring Frequencies [1996], the Department has determined that a reduction in copper and hardness monitoring during the months of July through September is justified.
See fact sheet Sections 4.3 and 4.4 for discussions on the basis for conditions in the 2014 permit (e.g. monitoring) that have changed from the 2006 permit issuance.
7.0 ANTIDEGRADATION
Section 303(d)(4) of the CWA states that, for water bodies where the water quality meets or exceeds the level necessary to support the water body's designated uses, WQBELs may be revised as long as the revision is consistent with the State's antidegradation policy. The Antidegradation Policy of the WQS (18 AAC 70.015) states that the existing water uses and the level of water quality necessary to protect existing uses must be maintained and protected. This section analyzes and provides rationale for the Department’s decisions in the permit issuance with respect to the Antidegradation Policy.
The Department’s approach to implementing the Antidegradation Policy, found in 18 AAC 70.015, is based on the requirements in 18 AAC 70 and the Department’s Policy and Procedure Guidance for Interim Antidegradation Implementation Methods, dated July 14, 2010. Using these procedures and policy, the Department determines whether a water body, or portion of a water body, is classified as Tier 1, Tier 2, or Tier 3, where a higher numbered tier indicates a greater level of water quality protection. At this time, no Tier 3 waters have been designated in Alaska. The Mendenhall River is not listed as impaired on DEC’s most recent Alaska’s Final 2010 Integrated Water Quality Monitoring and Assessment Report; therefore, a Tier 1 designation is not warranted. Accordingly, this antidegradation analysis conservatively assumes that the discharge is to a Tier 2 water body.
The State’s Antidegradation Policy in 18 AAC 70.015(a)(2) states that if the quality of water exceeds levels necessary to support propagation of fish, shellfish, and wildlife and recreation in and on the water (i.e. Tier 2 waters), that quality must be maintained and protected. The Department may allow a reduction of water quality only after finding that five specific requirements of the antidegradation policy at 18 AAC 70.015(a)(2)(A)-(E) are met. The Department’s findings follows:
1. 18 AAC 70.015 (a)(2)(A). Allowing lower water quality is necessary to accommodate important economic or social development in the area where the water is located.
Based on the evaluation required per 18 AAC 70.015(a)(2)(D) below, the Department has determined that the most reasonable and effective pollution prevention, control, and treatment methods are being used and that the localized lowering of water quality is necessary.
The MWWTP is the largest of three wastewater treatment facilities serving CBJ. As such, MWWTP is responsible for treating roughly two-thirds of the wastewater produced by the steadily increasing CBJ resident population base (27,034 people in July 1990 growing to 32,164 people in July 2011) and supporting businesses. According to Juneau’s Economic Development Council, Juneau’s annual increase in population has been higher than for the state as a whole over the last five years with an increase of more than 1.5% per year. Continued operation of the MWWTP is essential for protecting human health and the environment from the adverse effects of untreated domestic wastewater.
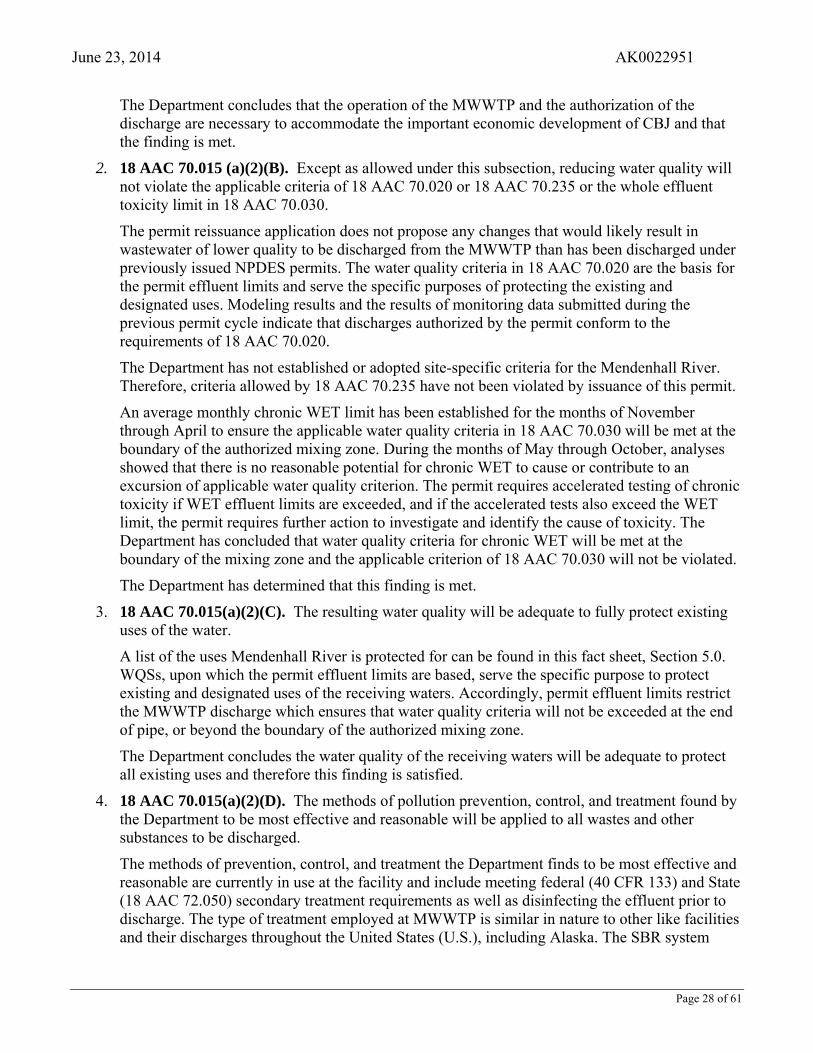
June 23, 2014 AK0022951
Page 28 of 61
The Department concludes that the operation of the MWWTP and the authorization of the discharge are necessary to accommodate the important economic development of CBJ and that the finding is met.
2. 18 AAC 70.015 (a)(2)(B). Except as allowed under this subsection, reducing water quality will not violate the applicable criteria of 18 AAC 70.020 or 18 AAC 70.235 or the whole effluent toxicity limit in 18 AAC 70.030.
The permit reissuance application does not propose any changes that would likely result in wastewater of lower quality to be discharged from the MWWTP than has been discharged under previously issued NPDES permits. The water quality criteria in 18 AAC 70.020 are the basis for the permit effluent limits and serve the specific purposes of protecting the existing and designated uses. Modeling results and the results of monitoring data submitted during the previous permit cycle indicate that discharges authorized by the permit conform to the requirements of 18 AAC 70.020.
The Department has not established or adopted site-specific criteria for the Mendenhall River. Therefore, criteria allowed by 18 AAC 70.235 have not been violated by issuance of this permit.
An average monthly chronic WET limit has been established for the months of November through April to ensure the applicable water quality criteria in 18 AAC 70.030 will be met at the boundary of the authorized mixing zone. During the months of May through October, analyses showed that there is no reasonable potential for chronic WET to cause or contribute to an excursion of applicable water quality criterion. The permit requires accelerated testing of chronic toxicity if WET effluent limits are exceeded, and if the accelerated tests also exceed the WET limit, the permit requires further action to investigate and identify the cause of toxicity. The Department has concluded that water quality criteria for chronic WET will be met at the boundary of the mixing zone and the applicable criterion of 18 AAC 70.030 will not be violated.
The Department has determined that this finding is met.
3. 18 AAC 70.015(a)(2)(C). The resulting water quality will be adequate to fully protect existing uses of the water.
A list of the uses Mendenhall River is protected for can be found in this fact sheet, Section 5.0. WQSs, upon which the permit effluent limits are based, serve the specific purpose to protect existing and designated uses of the receiving waters. Accordingly, permit effluent limits restrict the MWWTP discharge which ensures that water quality criteria will not be exceeded at the end of pipe, or beyond the boundary of the authorized mixing zone.
The Department concludes the water quality of the receiving waters will be adequate to protect all existing uses and therefore this finding is satisfied.
4. 18 AAC 70.015(a)(2)(D). The methods of pollution prevention, control, and treatment found by the Department to be most effective and reasonable will be applied to all wastes and other substances to be discharged.
The methods of prevention, control, and treatment the Department finds to be most effective and reasonable are currently in use at the facility and include meeting federal (40 CFR 133) and State (18 AAC 72.050) secondary treatment requirements as well as disinfecting the effluent prior to discharge. The type of treatment employed at MWWTP is similar in nature to other like facilities and their discharges throughout the United States (U.S.), including Alaska. The SBR system
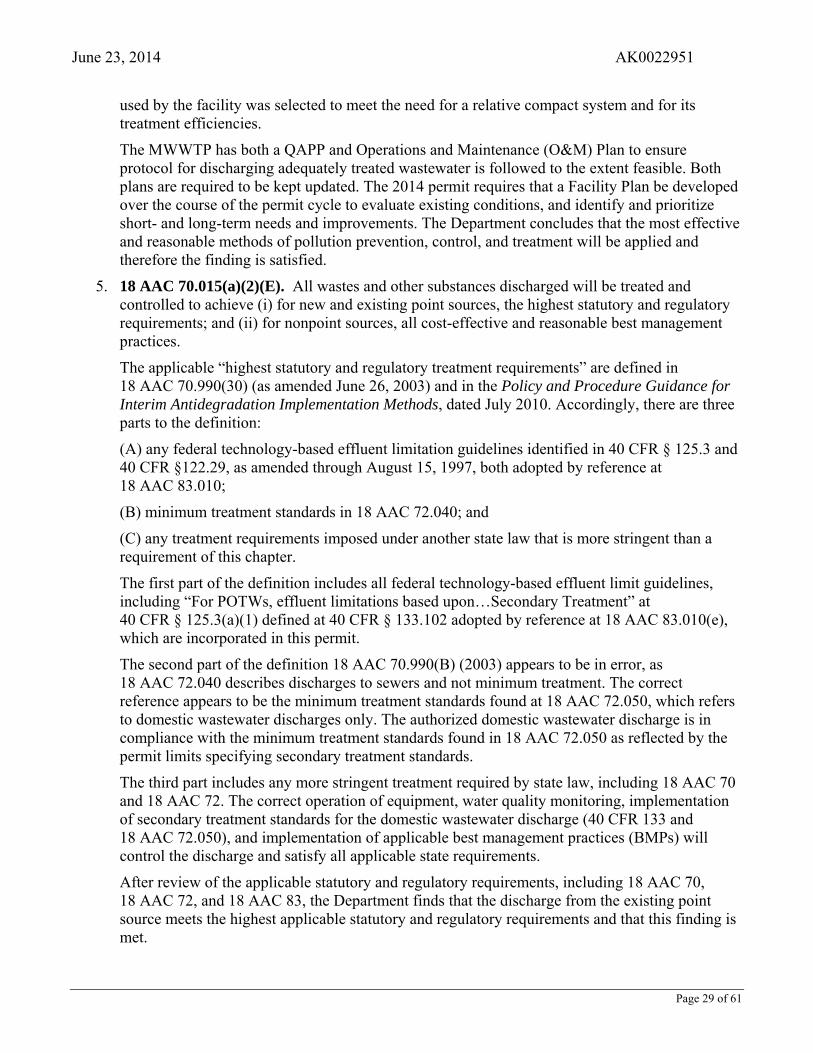
June 23, 2014 AK0022951
Page 29 of 61
used by the facility was selected to meet the need for a relative compact system and for its treatment efficiencies.
The MWWTP has both a QAPP and Operations and Maintenance (O&M) Plan to ensure protocol for discharging adequately treated wastewater is followed to the extent feasible. Both plans are required to be kept updated. The 2014 permit requires that a Facility Plan be developed over the course of the permit cycle to evaluate existing conditions, and identify and prioritize short- and long-term needs and improvements. The Department concludes that the most effective and reasonable methods of pollution prevention, control, and treatment will be applied and therefore the finding is satisfied.
5. 18 AAC 70.015(a)(2)(E). All wastes and other substances discharged will be treated and controlled to achieve (i) for new and existing point sources, the highest statutory and regulatory requirements; and (ii) for nonpoint sources, all cost-effective and reasonable best management practices.
The applicable “highest statutory and regulatory treatment requirements” are defined in 18 AAC 70.990(30) (as amended June 26, 2003) and in the Policy and Procedure Guidance for Interim Antidegradation Implementation Methods, dated July 2010. Accordingly, there are three parts to the definition:
(A) any federal technology-based effluent limitation guidelines identified in 40 CFR § 125.3 and 40 CFR §122.29, as amended through August 15, 1997, both adopted by reference at 18 AAC 83.010;
(B) minimum treatment standards in 18 AAC 72.040; and
(C) any treatment requirements imposed under another state law that is more stringent than a requirement of this chapter.
The first part of the definition includes all federal technology-based effluent limit guidelines, including “For POTWs, effluent limitations based upon…Secondary Treatment” at 40 CFR § 125.3(a)(1) defined at 40 CFR § 133.102 adopted by reference at 18 AAC 83.010(e), which are incorporated in this permit.
The second part of the definition 18 AAC 70.990(B) (2003) appears to be in error, as 18 AAC 72.040 describes discharges to sewers and not minimum treatment. The correct reference appears to be the minimum treatment standards found at 18 AAC 72.050, which refers to domestic wastewater discharges only. The authorized domestic wastewater discharge is in compliance with the minimum treatment standards found in 18 AAC 72.050 as reflected by the permit limits specifying secondary treatment standards.
The third part includes any more stringent treatment required by state law, including 18 AAC 70 and 18 AAC 72. The correct operation of equipment, water quality monitoring, implementation of secondary treatment standards for the domestic wastewater discharge (40 CFR 133 and 18 AAC 72.050), and implementation of applicable best management practices (BMPs) will control the discharge and satisfy all applicable state requirements.
After review of the applicable statutory and regulatory requirements, including 18 AAC 70, 18 AAC 72, and 18 AAC 83, the Department finds that the discharge from the existing point source meets the highest applicable statutory and regulatory requirements and that this finding is met.
June 23, 2014 AK0022951
Page 30 of 61
8.0 OTHER PERMIT CONDITIONS
8.1 Quality Assurance Project Plan
The permittee is required to develop procedures to ensure that the monitoring data submitted are accurate and to explain data anomalies if they occur. The permittee is required to update the QAPP within 180 days of the effective date of the final permit. Additionally, the permittee must submit a letter to the Department within 180 days of the effective date of the permit stating that the plan has been implemented within the required time frame. The QAPP shall consist of standard operating procedures the permittee must follow for collecting, handling, storing and shipping samples; laboratory analysis; and data reporting. The permittee is required to amend the QAPP whenever any procedure addressed by the QAPP is modified. The plan shall be retained on-site and made available to the Department upon request.
8.2 Operation and Maintenance Plan
The permit requires the permittee to properly operate and maintain all facilities and systems of treatment and control. Proper operation and maintenance is essential to meeting discharge limits, monitoring requirements, and all other permit requirements at all times. The permittee is required to develop or update and implement an O&M Plan for its facility within 180 days of the effective date of the final permit. If an O&M Plan has already been developed and implemented, the permittee need only to review the existing plan to make sure it is up to date and all necessary revisions are made. The plan must be reviewed annually and retained on site and made available to the Department upon request.
8.3 Facility Plan
The permittee is required to develop, over the course of the permit cycle, a Facility Plan evaluating MWWTP’s existing condition and identifying near- and long-term needs and potential improvements to ensure that the MWWTP continues to provide environmentally responsible waste treatment and disposal services to CBJ. The Facility Plan shall develop a strategy to address present and projected future problems and/or needs for a time period of 10-20 years. The Facility Plan shall evaluate existing systems and design capacities using current conditions and determine adequacy of the facility’s treatment process, maintenance program, process control measures, operating procedures, and record management. The Facility Plan shall also evaluate anticipated future wasteloads and flows, identify potential deficiencies and/or problems, and evaluate whether and when infrastructure changes or upgrades should be initiated.
The Facility Plan must be submitted to the Department with the permit reissuance application 180 days before permit expiration.
8.4 Pretreatment Requirements
The results of the 2002 industrial user survey indicated that the MWWTP receives wastewater from only one significant industrial user (SIU), the Alaska Brewing Company. MWWTP’s Effluent Mixing Zone Analysis (Tetra Tech, 2012) listed a second “significant user”, Lemon Creek Correctional Center/Industrial Laundry Facility. The Department determined that though the Correctional Facility discharged an average daily volume of 15,244 gallons to the MWWTP during 2012, this quantity is below the regulatory threshold to be considered a SIU according to 40 CFR §403.3(v), adopted by reference in 18 AAC 83.010(g)(2).
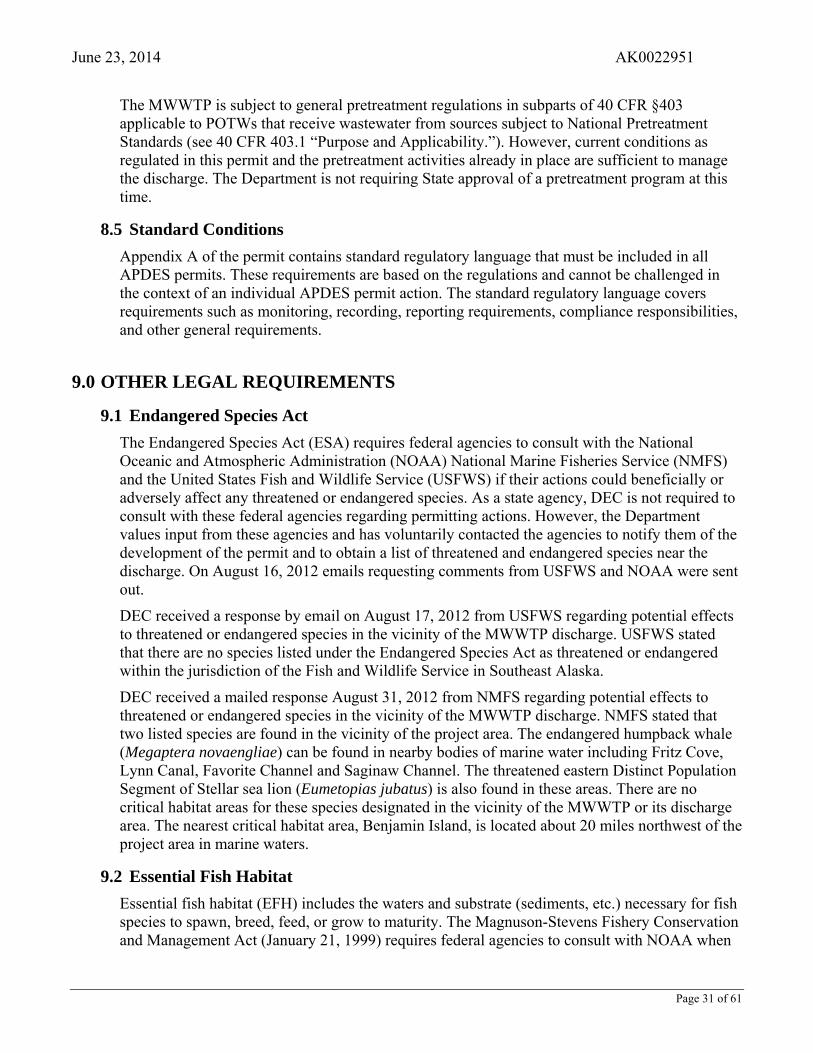
June 23, 2014 AK0022951
Page 31 of 61
The MWWTP is subject to general pretreatment regulations in subparts of 40 CFR §403 applicable to POTWs that receive wastewater from sources subject to National Pretreatment Standards (see 40 CFR 403.1 “Purpose and Applicability.”). However, current conditions as regulated in this permit and the pretreatment activities already in place are sufficient to manage the discharge. The Department is not requiring State approval of a pretreatment program at this time.
8.5 Standard Conditions
Appendix A of the permit contains standard regulatory language that must be included in all APDES permits. These requirements are based on the regulations and cannot be challenged in the context of an individual APDES permit action. The standard regulatory language covers requirements such as monitoring, recording, reporting requirements, compliance responsibilities, and other general requirements.
9.0 OTHER LEGAL REQUIREMENTS
9.1 Endangered Species Act
The Endangered Species Act (ESA) requires federal agencies to consult with the National Oceanic and Atmospheric Administration (NOAA) National Marine Fisheries Service (NMFS) and the United States Fish and Wildlife Service (USFWS) if their actions could beneficially or adversely affect any threatened or endangered species. As a state agency, DEC is not required to consult with these federal agencies regarding permitting actions. However, the Department values input from these agencies and has voluntarily contacted the agencies to notify them of the development of the permit and to obtain a list of threatened and endangered species near the discharge. On August 16, 2012 emails requesting comments from USFWS and NOAA were sent out.
DEC received a response by email on August 17, 2012 from USFWS regarding potential effects to threatened or endangered species in the vicinity of the MWWTP discharge. USFWS stated that there are no species listed under the Endangered Species Act as threatened or endangered within the jurisdiction of the Fish and Wildlife Service in Southeast Alaska.
DEC received a mailed response August 31, 2012 from NMFS regarding potential effects to threatened or endangered species in the vicinity of the MWWTP discharge. NMFS stated that two listed species are found in the vicinity of the project area. The endangered humpback whale (Megaptera novaengliae) can be found in nearby bodies of marine water including Fritz Cove, Lynn Canal, Favorite Channel and Saginaw Channel. The threatened eastern Distinct Population Segment of Stellar sea lion (Eumetopias jubatus) is also found in these areas. There are no critical habitat areas for these species designated in the vicinity of the MWWTP or its discharge area. The nearest critical habitat area, Benjamin Island, is located about 20 miles northwest of the project area in marine waters.
9.2 Essential Fish Habitat
Essential fish habitat (EFH) includes the waters and substrate (sediments, etc.) necessary for fish species to spawn, breed, feed, or grow to maturity. The Magnuson-Stevens Fishery Conservation and Management Act (January 21, 1999) requires federal agencies to consult with NOAA when
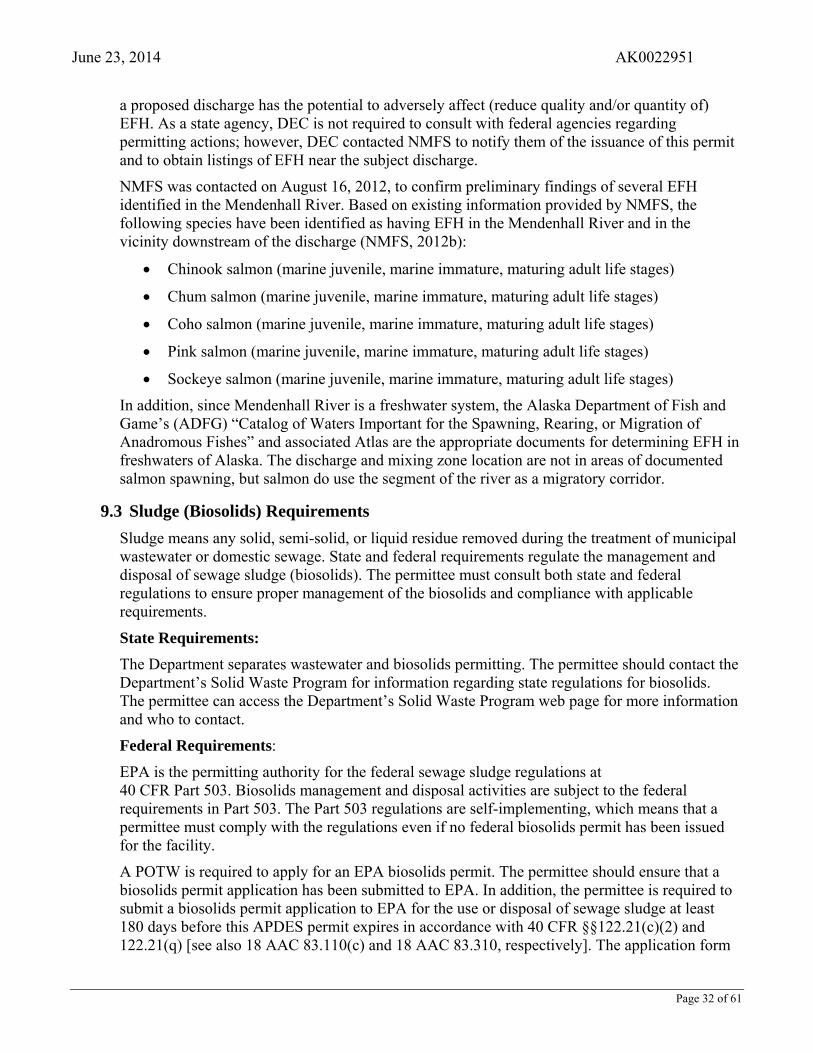
June 23, 2014 AK0022951
Page 32 of 61
a proposed discharge has the potential to adversely affect (reduce quality and/or quantity of) EFH. As a state agency, DEC is not required to consult with federal agencies regarding permitting actions; however, DEC contacted NMFS to notify them of the issuance of this permit and to obtain listings of EFH near the subject discharge.
NMFS was contacted on August 16, 2012, to confirm preliminary findings of several EFH identified in the Mendenhall River. Based on existing information provided by NMFS, the following species have been identified as having EFH in the Mendenhall River and in the vicinity downstream of the discharge (NMFS, 2012b):
Chinook salmon (marine juvenile, marine immature, maturing adult life stages)
Chum salmon (marine juvenile, marine immature, maturing adult life stages)
Coho salmon (marine juvenile, marine immature, maturing adult life stages)
Pink salmon (marine juvenile, marine immature, maturing adult life stages)
Sockeye salmon (marine juvenile, marine immature, maturing adult life stages)
In addition, since Mendenhall River is a freshwater system, the Alaska Department of Fish and Game’s (ADFG) “Catalog of Waters Important for the Spawning, Rearing, or Migration of Anadromous Fishes” and associated Atlas are the appropriate documents for determining EFH in freshwaters of Alaska. The discharge and mixing zone location are not in areas of documented salmon spawning, but salmon do use the segment of the river as a migratory corridor.
9.3 Sludge (Biosolids) Requirements
Sludge means any solid, semi-solid, or liquid residue removed during the treatment of municipal wastewater or domestic sewage. State and federal requirements regulate the management and disposal of sewage sludge (biosolids). The permittee must consult both state and federal regulations to ensure proper management of the biosolids and compliance with applicable requirements.
State Requirements:
The Department separates wastewater and biosolids permitting. The permittee should contact the Department’s Solid Waste Program for information regarding state regulations for biosolids. The permittee can access the Department’s Solid Waste Program web page for more information and who to contact.
Federal Requirements:
EPA is the permitting authority for the federal sewage sludge regulations at 40 CFR Part 503. Biosolids management and disposal activities are subject to the federal requirements in Part 503. The Part 503 regulations are self-implementing, which means that a permittee must comply with the regulations even if no federal biosolids permit has been issued for the facility.
A POTW is required to apply for an EPA biosolids permit. The permittee should ensure that a biosolids permit application has been submitted to EPA. In addition, the permittee is required to submit a biosolids permit application to EPA for the use or disposal of sewage sludge at least 180 days before this APDES permit expires in accordance with 40 CFR §§122.21(c)(2) and 122.21(q) [see also 18 AAC 83.110(c) and 18 AAC 83.310, respectively]. The application form
June 23, 2014 AK0022951
Page 33 of 61
is NPDES Form 2S and can be found on EPA’s website, www.epa.gov, under NPDES forms. A completed NPDES Form 2S should be submitted to: U.S. Environmental Protection Agency, Region 10, NPDES Permits Unit OWW-130, Attention: Biosolids Contact, 1200 Sixth Avenue, Suite 900, Seattle, WA 98101-3140. The EPA Region 10 telephone number is 1-800-424-4372.
Information about EPA’s biosolids program and CWA Part 503 is available at www.epa.gov and either search for ‘biosolids’ or go to the EPA Region 10 website link and search for ‘NPDES Permits’.
9.4 Permit Expiration
The permit will expire five years from the effective date of the permit.

June 23, 2014 AK0022951
Page 34 of 61
10.0 REFERENCES
1. Alaska Department of Environmental Conservation, Alaska’s Final 2010 Integrated Water Quality Monitoring and Assessment Report, July 15, 2010.
2. Alaska Department of Environmental Conservation, Interim Antidegradation Implementation Methods, Policy and Procedure 05.03.103, July 14, 2010.
3. Alaska Department of Environmental Conservation, Alaska Water Quality Criteria Manual for Toxics and Other Deleterious Organic and Inorganic Substances, as amended through December 12, 2008.
4. Alaska Department of Fish and Game. (ADF&G). Technical Report No. 11-03. Juvenile Salmonid presence in the Mendenhall River, Juneau, Alaska. May 2011.
5. EPA 1991. Technical Support Document for Water Quality-based Toxics Control. US Environmental Protection Agency, Office of Water, the Department/505/2-90-001.
6. EPA April 19, 1996, Interim Guidance for Performance-Based Reductions of NPDES Permit Monitoring Frequencies, (EPA/833/B-96-001)
7. National Marine Fisheries Service (NMFS), Alaska Region, Protected Resources Division, Email correspondence. August 16, 2012.
8. Tetra Tech, 2012. City and Borough of Juneau. Mendenhall Wastewater Treatment Plant Effluent Mixing Zone Analysis.
9. NMFS, Office of Habitat Conservation, 2012. Essential Fish Habitat Mapper. Retrieved from http://www.habitat.noaa.gov/protection/efh/habitatmapper.html
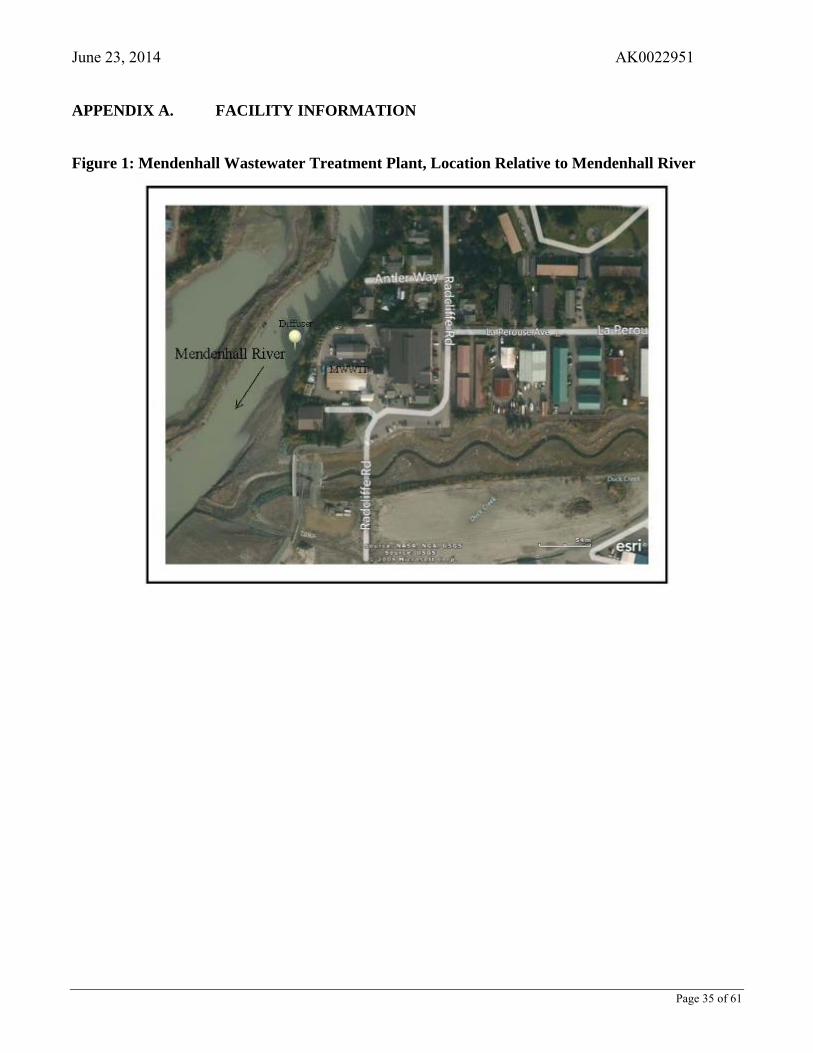
June 23, 2014 AK0022951
Page 35 of 61
APPENDIX A. FACILITY INFORMATION
Figure 1: Mendenhall Wastewater Treatment Plant, Location Relative to Mendenhall River
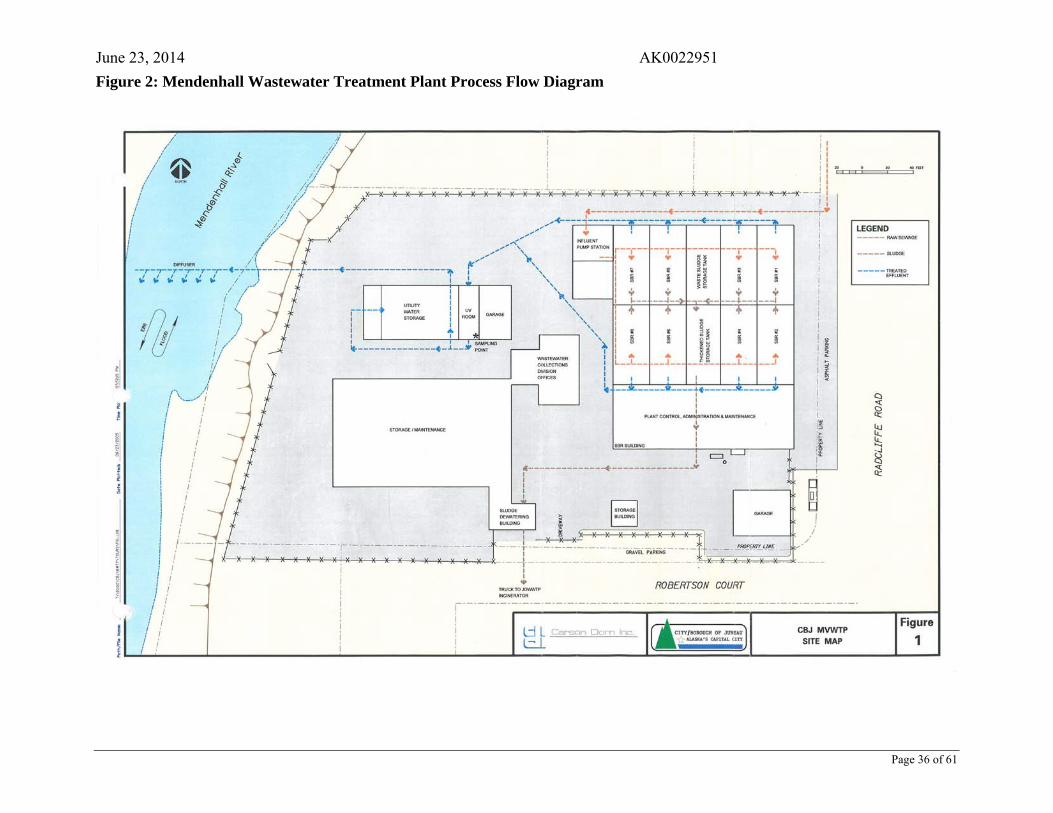
June 23, 2014 AK0022951
Page 36 of 61
Figure 2: Mendenhall Wastewater Treatment Plant Process Flow Diagram

June 23, 2014 AK0022951
Page 37 of 61
APPENDIX B. BASIS FOR EFFLUENT LIMITS
The Clean Water Act (CWA) requires a Publicly Owned Treatment Works (POTWs) to meet effluent limits based on available wastewater treatment technology, specifically, the secondary treatment standards found in Title 40 Code of Federal Regulations (CFR) 40 CFR 133, adopted by reference in Alaska Administrative Code (AAC) 18 AAC 83.010(c)(9)(e). The Department may find, by analyzing the effect of an effluent discharge on the receiving water body, that secondary treatment effluent limits alone are not sufficiently stringent to meet State of Alaska water quality criteria found at 18 AAC 70. In such cases, the Department is required to develop more stringent water quality-based effluent limits (WQBEL), which are designed to ensure that the water quality standards (WQS) of the receiving water body are met.
Secondary treatment effluent limits for POTWs do not limit every parameter that may be present in the effluent. Technology-based effluent limits (TBEL) have only been developed for biochemical oxygen demand, 5-day (BOD5), total suspended solids (TSS), and pH. Effluent from a POTW may contain other pollutants, such as bacteria, chlorine, ammonia, or metals, depending on the type of treatment system used and the quality of the influent entering the POTW (e.g., industrial facilities, as well as residential areas may discharge into the POTW). When TBELs do not exist for a particular pollutant expected to be in the effluent, the Department must determine if the pollutant may cause or contribute to an exceedance of a water quality criteria for the water body. If a pollutant causes or contributes to an exceedance of a water quality criteria, a WQBEL for the pollutant must be established in the permit.
B.1 SecondaryTreatmentEffluentLimits
The CWA requires a POTW to meet requirements based on available wastewater treatment technology. Section 301 of the CWA established a required performance level, referred to as secondary treatment, which all POTWs were required to meet by July 1, 1977. As mentioned above, the Department has adopted the secondary treatment effluent limits, which are found in 40 CFR 133.102. The secondary treatment TBELs apply to all POTWs and identify the minimum level of effluent quality attainable by application of secondary treatment in terms of BOD5, TSS, and pH. In addition to the federal secondary treatment regulations in 40 CFR Part 133, the State of Alaska requires maximum daily limits of 60 milligrams per liter (mg/L) for BOD5 and TSS in its own secondary treatment regulations (18 AAC 72.990). The secondary treatment standards of 40 CFR 133 are more prescriptive than the 18 AAC 72.990 standards (i.e., the 40 CFR 133 standards also include minimum percent removal requirements for BOD5 and TSS) and are the final TBELs included in the permit as listed in Table B-1.
Table B- 1: Secondary Treatment Effluent Limits
Parameter Average Monthly
Limit Average Weekly
Limit Maximum Daily
Limit Range
BOD5 30 mg/L 45 mg/L 60 mg/L ---
TSS 30 mg/L 45 mg/L 60 mg/L ---
Removal Rates for BOD5 and TSS
85% (minimum) --- --- ---
pH --- --- --- 6.0 – 9.0 SU a Notes:
a. SU = Standard pH units
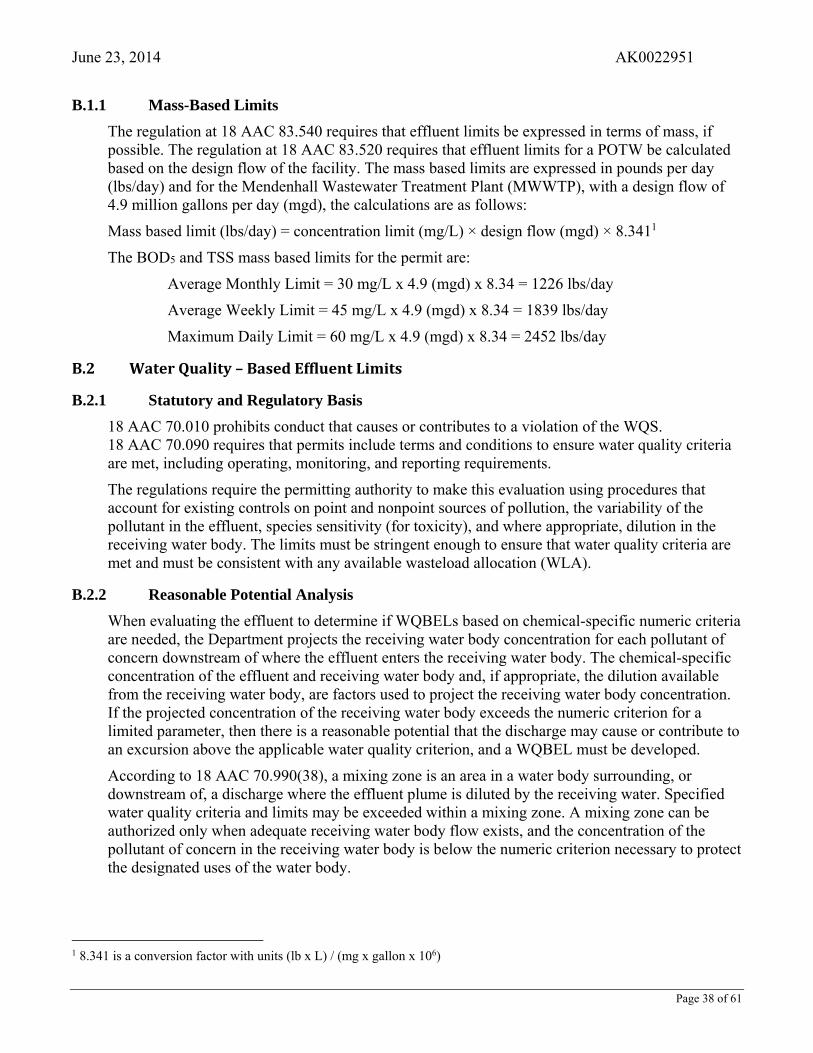
June 23, 2014 AK0022951
Page 38 of 61
B.1.1 Mass-Based Limits
The regulation at 18 AAC 83.540 requires that effluent limits be expressed in terms of mass, if possible. The regulation at 18 AAC 83.520 requires that effluent limits for a POTW be calculated based on the design flow of the facility. The mass based limits are expressed in pounds per day (lbs/day) and for the Mendenhall Wastewater Treatment Plant (MWWTP), with a design flow of 4.9 million gallons per day (mgd), the calculations are as follows:
Mass based limit (lbs/day) = concentration limit (mg/L) × design flow (mgd) × 8.3411
The BOD5 and TSS mass based limits for the permit are:
Average Monthly Limit = 30 mg/L x 4.9 (mgd) x 8.34 = 1226 lbs/day
Average Weekly Limit = 45 mg/L x 4.9 (mgd) x 8.34 = 1839 lbs/day
Maximum Daily Limit = 60 mg/L x 4.9 (mgd) x 8.34 = 2452 lbs/day
B.2 WaterQuality–BasedEffluentLimits
B.2.1 Statutory and Regulatory Basis
18 AAC 70.010 prohibits conduct that causes or contributes to a violation of the WQS. 18 AAC 70.090 requires that permits include terms and conditions to ensure water quality criteria are met, including operating, monitoring, and reporting requirements.
The regulations require the permitting authority to make this evaluation using procedures that account for existing controls on point and nonpoint sources of pollution, the variability of the pollutant in the effluent, species sensitivity (for toxicity), and where appropriate, dilution in the receiving water body. The limits must be stringent enough to ensure that water quality criteria are met and must be consistent with any available wasteload allocation (WLA).
B.2.2 Reasonable Potential Analysis
When evaluating the effluent to determine if WQBELs based on chemical-specific numeric criteria are needed, the Department projects the receiving water body concentration for each pollutant of concern downstream of where the effluent enters the receiving water body. The chemical-specific concentration of the effluent and receiving water body and, if appropriate, the dilution available from the receiving water body, are factors used to project the receiving water body concentration. If the projected concentration of the receiving water body exceeds the numeric criterion for a limited parameter, then there is a reasonable potential that the discharge may cause or contribute to an excursion above the applicable water quality criterion, and a WQBEL must be developed.
According to 18 AAC 70.990(38), a mixing zone is an area in a water body surrounding, or downstream of, a discharge where the effluent plume is diluted by the receiving water. Specified water quality criteria and limits may be exceeded within a mixing zone. A mixing zone can be authorized only when adequate receiving water body flow exists, and the concentration of the pollutant of concern in the receiving water body is below the numeric criterion necessary to protect the designated uses of the water body.
1 8.341 is a conversion factor with units (lb x L) / (mg x gallon x 106)

June 23, 2014 AK0022951
Page 39 of 61
B.2.3 Procedure for Deriving Water Quality-Based Effluent Limits
The Technical Support Document for Water Quality-Based Toxics Control (TSD) (EPA, 1991) and the WQS recommend the flow conditions for use in calculating WQBEL using steady-state modeling. The TSD and WQS state the WQBELs intended to protect aquatic life uses should be based on the lowest seven-day average flow rate expected to occur once every ten years (7Q10) for chronic criteria and the lowest one-day average flow rate expected to occur once every ten years (1Q10) for acute criteria.
The first step in developing a WQBEL is to develop a WLA for the pollutant. A WLA is the concentration or loading of a pollutant that the permittee may discharge without causing or contributing to an exceedance of water quality criterion or a total maximum daily load in the receiving water body. If a mixing zone is authorized in the permit, the WQBELs apply at all points outside the mixing zone.
In cases where a mixing zone is not authorized, either because the receiving water body already exceeds the criterion, the receiving water body flow is too low to provide dilution, or for some other reason one is not authorized, the criterion becomes the WLA. Establishing the criterion as the WLA ensures that the permittee will not cause or contribute to an exceedance of the criterion.
The WQS at 18 AAC 70.020(a) designates classes of water for beneficial uses of water supply, water recreation, and of growth and propagation of fish, shellfish, other aquatic life, and wildlife.
B.2.4 Specific Water Quality-Based Effluent Limits
B.2.4.1 Toxic Substances
The WQS for toxic and other deleterious organic and inorganic substances for freshwater uses are codified in 18 AAC 70.020(b)(11). Individual criteria are summarized in the Department’s, Alaska Water Quality Criteria Manual for Toxics and Other Deleterious Organic and Inorganic Substances, as amended through December 12, 2008. In WQS, the most stringent criteria for metals, other than arsenic, are the chronic criteria for the protection of aquatic life.
As discussed in Section 4.3 of the fact sheet, the Department evaluated five years of data detailing ambient receiving water and effluent concentrations of copper, lead, silver, and zinc to determine if there was reasonable potential for the metals contained in the MWWTP effluent to cause or contribute to an excursion of water quality criteria in the receiving water body. The toxicities of these four metals vary with the hardness of the water. Therefore, the water quality criteria for these metals also vary with hardness. The Department used updated hardness numbers for calculating the metals water quality criteria that are different than those used by EPA in the 2006 permit issuance and those used by the permittee in the mixing zone application. The Department’s updated calculations resulted in different calculated water quality criteria. Formulas from Alaska Water Quality Criteria Manual for Toxics and Other Deleterious Organic and Inorganic Substances were used to calculate applicable criteria. The hardness of the receiving water when mixed with the effluent was applied in the formulas (detailed in Tables B-2 and B-3) using the equation:
(EHd –RHd) / dilution + RHd
Where,
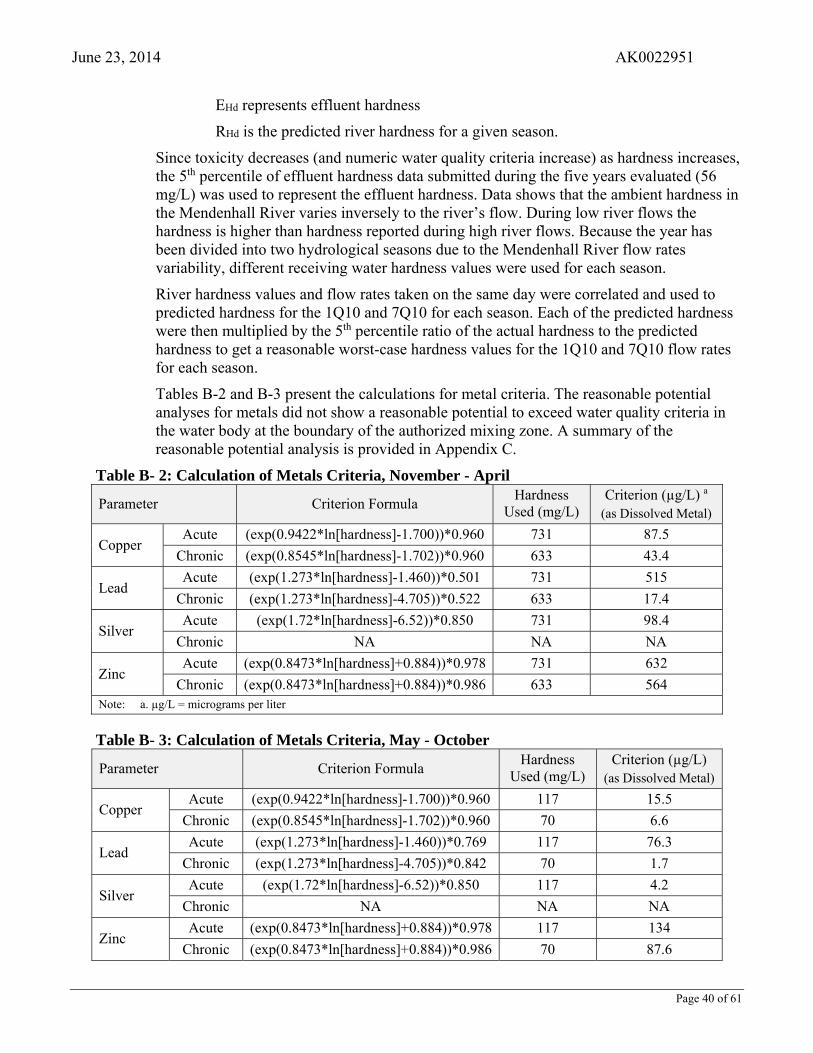
June 23, 2014 AK0022951
Page 40 of 61
EHd represents effluent hardness
RHd is the predicted river hardness for a given season.
Since toxicity decreases (and numeric water quality criteria increase) as hardness increases, the 5th percentile of effluent hardness data submitted during the five years evaluated (56 mg/L) was used to represent the effluent hardness. Data shows that the ambient hardness in the Mendenhall River varies inversely to the river’s flow. During low river flows the hardness is higher than hardness reported during high river flows. Because the year has been divided into two hydrological seasons due to the Mendenhall River flow rates variability, different receiving water hardness values were used for each season.
River hardness values and flow rates taken on the same day were correlated and used to predicted hardness for the 1Q10 and 7Q10 for each season. Each of the predicted hardness were then multiplied by the 5th percentile ratio of the actual hardness to the predicted hardness to get a reasonable worst-case hardness values for the 1Q10 and 7Q10 flow rates for each season.
Tables B-2 and B-3 present the calculations for metal criteria. The reasonable potential analyses for metals did not show a reasonable potential to exceed water quality criteria in the water body at the boundary of the authorized mixing zone. A summary of the reasonable potential analysis is provided in Appendix C.
Table B- 2: Calculation of Metals Criteria, November - April
Parameter Criterion Formula Hardness
Used (mg/L) Criterion (µg/L) a
(as Dissolved Metal)
Copper Acute (exp(0.9422*ln[hardness]-1.700))*0.960 731 87.5
Chronic (exp(0.8545*ln[hardness]-1.702))*0.960 633 43.4
Lead Acute (exp(1.273*ln[hardness]-1.460))*0.501 731 515
Chronic (exp(1.273*ln[hardness]-4.705))*0.522 633 17.4
Silver Acute (exp(1.72*ln[hardness]-6.52))*0.850 731 98.4
Chronic NA NA NA
Zinc Acute (exp(0.8473*ln[hardness]+0.884))*0.978 731 632
Chronic (exp(0.8473*ln[hardness]+0.884))*0.986 633 564 Note: a. µg/L = micrograms per liter
Table B- 3: Calculation of Metals Criteria, May - October
Parameter Criterion Formula Hardness
Used (mg/L) Criterion (µg/L)
(as Dissolved Metal)
Copper Acute (exp(0.9422*ln[hardness]-1.700))*0.960 117 15.5
Chronic (exp(0.8545*ln[hardness]-1.702))*0.960 70 6.6
Lead Acute (exp(1.273*ln[hardness]-1.460))*0.769 117 76.3
Chronic (exp(1.273*ln[hardness]-4.705))*0.842 70 1.7
Silver Acute (exp(1.72*ln[hardness]-6.52))*0.850 117 4.2
Chronic NA NA NA
Zinc Acute (exp(0.8473*ln[hardness]+0.884))*0.978 117 134
Chronic (exp(0.8473*ln[hardness]+0.884))*0.986 70 87.6
June 23, 2014 AK0022951
Page 41 of 61
B.2.4.2 Floating, Suspended or Submerged Matter, including Oil and Grease
The water quality criteria for floating, suspended or submerged matter, including oil and grease, are narrative. The most stringent standard, found at 18 AAC 70.020(b)(8)(A)(i), require that fresh waters, “may not, alone or in combination with other substances or wastes, make the water unfit or unsafe for the use; cause a film, sheen, or discoloration on the receiving of the water or adjoining shorelines; cause leaching of toxic or deleterious substances; or cause a sludge, solid, or emulsion to be deposited beneath or upon the receiving of the water, within the water column, on the bottom, or upon adjoining shorelines.”
B.2.4.3 pH
TBELs exist for pH as well as water quality criteria. The water quality criteria, found at 18 AAC 70.020(b)(6), for water supply, aquaculture; water contact recreation; and growth and propagation of fish, shellfish, other aquatic life, and wildlife are the most stringent standards for pH. These standards state that fresh waters, “May not be less than 6.5 or greater than 8.5.”
Because pH is based on logarithms, determining a receiving water plus effluent pH concentration cannot be calculated the same as would other parameters. The calculation of pH for the mixture of the two flows is based on the procedures described in Technical Guidance of Supplementary Stream Design Conditions for Steady State Modeling, Environmental Protection Agency (EPA 1988).
B.2.4.4 Dissolved Oxygen
The criteria for agricultural water supply are the most stringent standards for dissolved oxygen (DO). The standards at 18 AAC 70.020(b)(3)(A)(iii) require that “DO must be greater than 7 mg/L in receiving waters; the concentration of total dissolved gas may not exceed 110% of saturation at any point of sample collection.” The standards at 18 AAC 70.020(b)(3)(C) require that “DO must be greater than 7 mg/L in waters used by anadromous or resident fish. In no case may DO be less than 5 mg/L to a depth of 20 centimeters (cm) in the interstitial waters of gravel used by anadromous or resident fish for spawning. For waters not used by anadromous or resident fish, DO must be greater than or equal to 5 mg/L. In no case may DO be greater than 17 mg/L. The concentration of total dissolved gas may not exceed 110% of saturation at any point of sample collection.”
B.2.4.5 Fecal Coliform Bacteria
The criteria at 18 AAC 70.020(b)(2) for waters designated for use as water supply for drinking, culinary, and food processing purposes are the most stringent standards for fecal coliform bacteria. The standards require that in a 30-day period, the geometric mean of samples may not exceed 20 colonies of fecal coliform bacteria per 100 mL (FC/100 mL), and not more than 10% of the total samples may exceed 40 FC/100 mL.
Though TBELs for fecal coliform bacteria do not exist in regulations, POTWs that employ ultraviolet (UV) disinfection have demonstrated the capability of achieving a monthly geometric mean of 400 FC/100 mL, a weekly geometric mean of 800 FC/100 mL, and a maximum daily count of 1200 FC/100 mL on a regular basis. If sufficient dilution and assimilative capacity exists in the receiving water, the fecal coliform bacteria limits
June 23, 2014 AK0022951
Page 42 of 61
mentioned in the preceding paragraph can be applied. Following an evaluation of the previous five years of fecal coliform bacteria effluent data from the MWWTP, DEC determined that the plant can achieve more stringent limits.
For the months of November through April, the chronic mixing zone dilution of 5.6, derived from the 7Q10 river flow, has been applied to assure the 20 FC/100 mL and 40 FC/100 mL water quality criteria are met at the boundary of the mixing zone during critical conditions. This resulted in an average monthly geometric mean limit of 112 FC/100 mL, an average weekly geometric mean of 168 FC/100 mL, and a maximum daily limit of 224 FC/100 mL. For the months of May through October DEC has determined that the plant can treat wastewater to a level that can achieve a monthly geometric mean of 200 FC/100 mL, a maximum weekly geometric mean of 400 FC/100 mL, and a maximum daily count of 800 FC/100 mL. Dilution is available to meet these limits and the authorized mixing zone is as small as practicable.
B.2.4.6 Total Residual Chlorine
The MWWTP does not use chlorine for disinfection, thus there are no effluent limits for total residual chlorine in the permit. The MWWTP has not used chlorine in its treatment process since the installation of an UV disinfection system. Therefore the proposed permit no longer contains effluent limits for total residual chlorine.
B.2.4.7 Total Ammonia (as Nitrogen)
The WQS contain criteria for the protection of aquatic life from the toxic effects of ammonia. Because the Mendenhall River is known to be a migratory corridor for salmonids, ammonia criteria has been applied which are protection of salmonids, including early life stages. The criteria for ammonia is dependent on pH and temperature because the fraction of ammonia present as the toxic, unionized form increases with increasing pH and temperature; therefore, the ammonia criteria are also pH and temperature dependent. Receiving water data for temperature and pH collected from August 2008 through July 2013 were evaluated. The 85th percentile for pH, for the entire year (7.6 SU) was used to represent reasonable worst-case conditions. The chronic ammonia criterion for water with fish early life stages present is a function of both pH and temperature; however, only temperatures greater than 14 degrees Celsius (OC) affect the criterion. The temperature of the Mendenhall River is consistently below 14 OC and a single pH is used to represent the worst-case condition for the entire year. As a result, the chronic criterion for total ammonia does not have seasonal variation. Ammonia acute criterion is based on pH only. With a single pH representing the worst-case condition for the year, the acute criterion also does not have seasonal variation.
Data collected by the permittee from August 2008 through July 2013 were evaluated to determine whether there was reasonable potential for ammonia to cause or contribute to an exceedance of the criteria. Ammonia concentrations exceed the applicable water quality criteria at the end of the pipe; however, no reasonable potential was found for ammonia at the boundary of the authorized chronic or acute mixing zones. The permit continues to require monthly monitoring of ammonia throughout the year and permit limits set in the 2006 permit for the months of November through April have been retained as the plant has demonstrated the ability to meet the ammonia limits as well as to meet the requirements of 18 AAC 83.480 stating that effluent limitations, standards, or conditions must be at least as
June 23, 2014 AK0022951
Page 43 of 61
stringent as the final effluent limitations, standards, or conditions in the previous permit. Ammonia limits for the month of May have been removed, which is discussed in Section 4.3 and Section 6.0 of this document.
Table B-4 details the equations used to determine water quality criteria for ammonia and Section B.2.4.11 and Table B-8 summarizes the selection of limits.
Table B- 4: Water Quality Criteria for Ammonia Acute Criteria Chronic Criteria
Equations 0.275
1 10 .
391 10 .
0.05771 10 .
2.4871 10 . 2.85, 1.45 10 .
Results 11.4 mg/L 3.98 mg/L
B.2.5 Selection of Most Stringent Limits
B.2.5.1 BOD5 and TSS
The permit proposes technology-based effluent limits for BOD5 and TSS.
B.2.5.2 pH
Water quality criteria for pH, between 6.5 SU and 8.5 SU, are the most stringent WQBELs for pH and shall be applied at the end of the pipe during the months of November through June. During the months of July through October the minimum daily limit has been reduced to 6.3 SU based on plant performance. This minimum daily limit is still above TBEL mandated limit for pH of 6.0 SU and pH water quality criteria will be met at the boundary of the mixing zone.
Table B- 5: Selection of pH Permit Limits, November - June Minimum Daily (SU) Maximum Daily (SU)
Technology Based Limits 6.0 9.0
Water Quality-Based Limits 6.5 8.5
Selected Limits 6.5 8.5
Table B- 6: Selection of pH Permit Limits, July - October Minimum Daily (SU) Maximum Daily (SU)
Technology Based Limits 6.0 9.0
Water Quality-Based Limits 6.3 8.5
Selected Limits 6.3 8.5
B.2.5.3 Fecal Coliform Bacteria
A monthly geometric mean of 200 FC/100 mL, a weekly geometric mean of 400 FC/100 mL, and a maximum daily count of 800 FC/100 mL are appropriate limits for the MWWTP for the months of May through October when high river flows supply the necessary dilution to be protective of the applicable water quality criteria. From November through April, the Department determined that more stringent fecal coliform bacteria effluent limits are necessary due to the lower river flows. This determination is consistent with the 2006 permit.
June 23, 2014 AK0022951
Page 44 of 61
Table B- 7: Selection of Fecal Coliform Bacteria Permit Limits
Average Monthly
(FC/100 mL) Average Weekly
(FC/100 mL) Maximum Daily
(FC/100 mL)
UV-Based Limits 400 800 1200
Selected Limits November - April 112 ------ 224
Selected Limits May - October 200 400 800
B.2.5.4 Ammonia
WQBEL for ammonia were calculated for the months of November through April using updated data collected during the previous permit cycle. These newly calculated limits were then compared to those limits set in the 2006 permit and the more stringent limits have been applied in the 2014 permit.
Table B- 8: Selection of Effluent Ammonia Limits for November - April
Average Monthly Limit (mg/L)
Maximum Daily Limit (mg/L)
2006 Permit Limits 28.5 48.0
WQBEL 29.5 40.5
Selected Limits 28.5 40.5
June 23, 2014 AK0022951
Page 45 of 61
APPENDIX C. REASONABLE POTENTIAL DETERMINATION
The following describes the process the Alaska Department of Environmental Conservation (the Department or DEC) used to determine if the discharge authorized in the draft permit has the reasonable potential to cause or contribute to a violation of Alaska Water Quality Standards (WQS). The Department used the process described in the Technical Support Document for Water Quality-Based Toxics Control (TSD) (Environmental Protection Agency (EPA), 1991) and DEC’s guidance, Reasonable Potential Procedure for Water Quality-Based Effluent Limits, APDES Permit (January 2009) to determine the reasonable potential for any pollutant to exceed a water quality criterion.
To determine if there is reasonable potential for the discharge to cause or contribute to an exceedance of water quality criteria for a given pollutant, the Department compares the maximum projected receiving water body concentration to the criteria for that pollutant. Reasonable potential to exceed exists if the projected receiving water body concentration exceeds the criteria, and a water quality-based effluent limit must be included in the permit (18 Alaska Administrative Code (AAC) 83.435). This section discusses how the maximum projected receiving water body concentration is determined.
C.1 MassBalance
For a discharge to a flowing water body, the maximum projected receiving water body concentration is determined using a steady state model represented by the following mass balance equation:
(Equation C-1)
where,
Cd = Receiving water body concentration downstream of the effluent discharge
Ce = Maximum projected effluent concentration
Cu = 95th percentile measured receiving water body upstream concentration
Qd = Receiving water body flow rate downstream of the effluent discharge = Qe + Qu
Qe = Effluent flow rate (set equal to the design flow of the wastewater treatment plant)
Qu = Receiving water body low flow rate upstream of the discharge (1Q10, 7Q10 or 30B3)
When the mass balance equation is solved for Cd, it becomes:
(Equation C-2)
The above form of the equation is based on the assumption that the discharge is rapidly and completely mixed with the receiving stream. If a mixing zone based on a percentage of the critical flow in the receiving stream is authorized based on the assumption of incomplete mixing with the receiving water body, the equation becomes:
(Equation C-3)
where MZ is the fraction of the receiving water body flow available for dilution. Where mixing is rapid and complete, MZ is equal to 1 and equation C-2 is equal to equation C-3 (i.e., all of the critical low flow volume is available for mixing).
June 23, 2014 AK0022951
Page 46 of 61
If a mixing zone is not authorized, dilution is not considered when projecting the receiving water body concentration, and
(Equation C-4)
In other words, if a mixing zone is not authorized (either because the stream already exceeds water quality criteria or the Department does not allow one), the Department considers only the concentration of the pollutant in the effluent regardless of the upstream flow and concentration. If the concentration of the pollutant in the effluent is less than the water quality standard, the discharge cannot cause or contribute to a water quality violation for that pollutant. In this case, the mixing or dilution factor (% MZ) is equal to zero and the mass balance equation is simplified to Cd = Ce.
Equation C-2 can be simplified by introducing a “dilution factor” (D):
(Equation C-5)
After the dilution factor simplification, this becomes:
(Equation C-6)
If the criterion is expressed as dissolved metal, the effluent concentrations are measured in total recoverable metal and must be converted to dissolved metal as shown in Equation C-7.
(Equation C-7)
Where Ce is expressed as total recoverable metal, Cu and Cd are expressed as dissolved metal, and CF is a conversion factor used to convert between dissolved and total recoverable metal. Equations C-6 and C-7 are the forms of the mass balance equation which were sued to determine reasonable potential and calculated wasteload allocations.
C.2 MaximumProjectedEffluentConcentration
To calculate the maximum projected effluent concentration, the Department used the procedure described in Section 3.3 of the TSD, “Determining the Need for Permit Limits with Effluent Monitoring Data.” In this procedure, the 95th percentile of the effluent data is the maximum projected effluent concentration which is used in the calculation of the maximum projected receiving water body concentration.
Since there are a limited number of data points available, the 95th percentile is calculated by multiplying the maximum reported effluent concentration by a “reasonable potential multiplier” (RPM). The RPM is the ratio of the 99th percentile concentration to the maximum reported effluent concentration and accounts for the statistical uncertainty in the effluent data. The RPM is calculated from the coefficient of variation (CV) of the data and the number of data points. The CV is defined as the ratio of the standard deviation of the data set to the mean. When fewer than 10 data points are available, the TSD recommends making the assumption that the CV is equal to 0.6. A CV value of 0.6 is a conservative estimate that assumes a relatively high variability.
Using the equations in Section 3.3.2 of the TSD, the RPM for chronic whole effluent toxicity (WET) is calculated as follows.
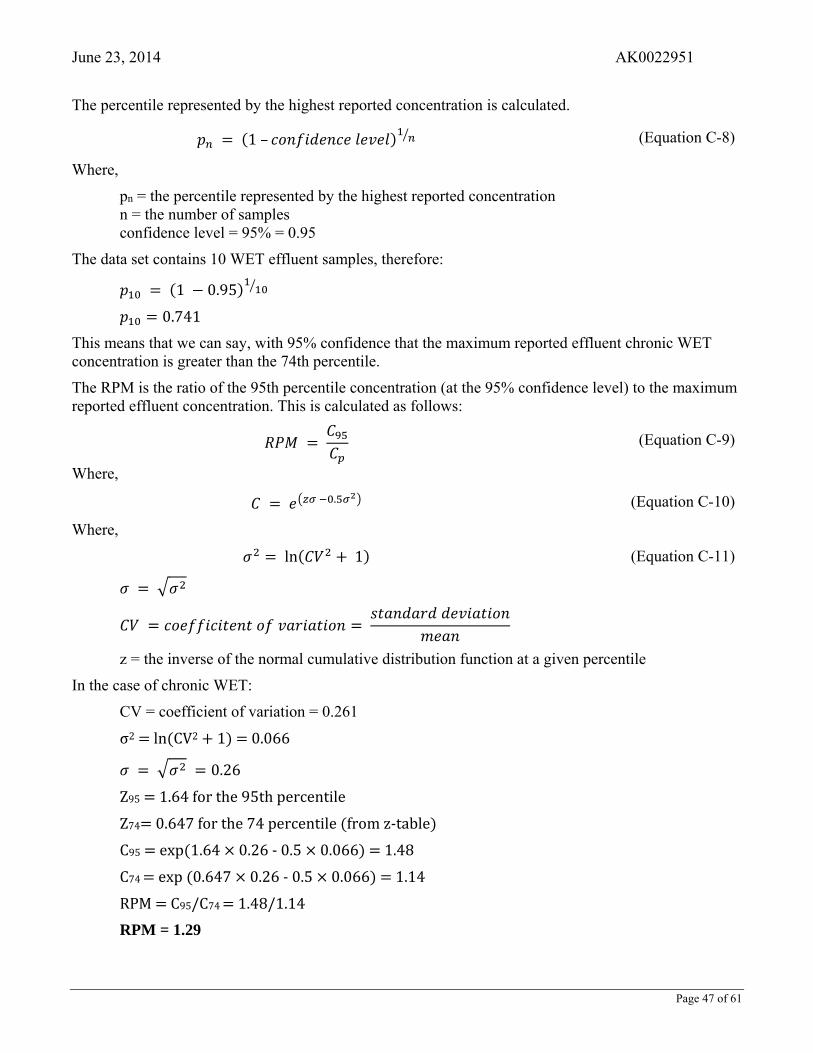
June 23, 2014 AK0022951
Page 47 of 61
The percentile represented by the highest reported concentration is calculated.
1– (Equation C-8)
Where,
pn = the percentile represented by the highest reported concentration n = the number of samples confidence level = 95% = 0.95
The data set contains 10 WET effluent samples, therefore:
1 0.95
0.741
This means that we can say, with 95% confidence that the maximum reported effluent chronic WET concentration is greater than the 74th percentile.
The RPM is the ratio of the 95th percentile concentration (at the 95% confidence level) to the maximum reported effluent concentration. This is calculated as follows:
(Equation C-9)
Where,
. (Equation C-10)
Where,
ln 1 (Equation C-11)
z = the inverse of the normal cumulative distribution function at a given percentile
In the case of chronic WET:
CV = coefficient of variation = 0.261
σ2 ln CV2 1 0.066
0.26
Z95 1.64forthe95thpercentile
Z74 0.647forthe74percentile fromz‐table C95 exp 1.64 0.26‐0.5 0.066 1.48
C74 exp 0.647 0.26‐0.5 0.066 1.14RPM C95/C74 1.48/1.14RPM = 1.29
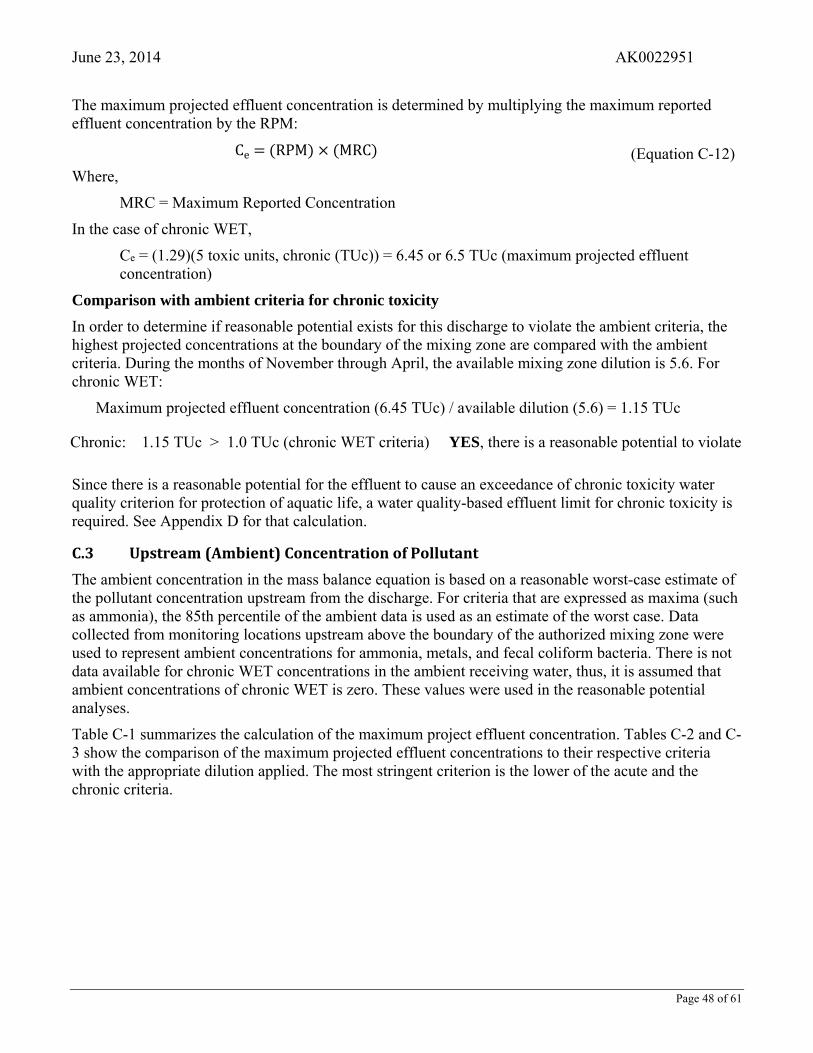
June 23, 2014 AK0022951
Page 48 of 61
The maximum projected effluent concentration is determined by multiplying the maximum reported effluent concentration by the RPM:
Ce RPM MRC (Equation C-12)
Where,
MRC = Maximum Reported Concentration
In the case of chronic WET,
Ce = (1.29)(5 toxic units, chronic (TUc)) = 6.45 or 6.5 TUc (maximum projected effluent concentration)
Comparison with ambient criteria for chronic toxicity
In order to determine if reasonable potential exists for this discharge to violate the ambient criteria, the highest projected concentrations at the boundary of the mixing zone are compared with the ambient criteria. During the months of November through April, the available mixing zone dilution is 5.6. For chronic WET:
Maximum projected effluent concentration (6.45 TUc) / available dilution (5.6) = 1.15 TUc
Chronic: 1.15 TUc > 1.0 TUc (chronic WET criteria) YES, there is a reasonable potential to violate
Since there is a reasonable potential for the effluent to cause an exceedance of chronic toxicity water quality criterion for protection of aquatic life, a water quality-based effluent limit for chronic toxicity is required. See Appendix D for that calculation.
C.3 Upstream(Ambient)ConcentrationofPollutant
The ambient concentration in the mass balance equation is based on a reasonable worst-case estimate of the pollutant concentration upstream from the discharge. For criteria that are expressed as maxima (such as ammonia), the 85th percentile of the ambient data is used as an estimate of the worst case. Data collected from monitoring locations upstream above the boundary of the authorized mixing zone were used to represent ambient concentrations for ammonia, metals, and fecal coliform bacteria. There is not data available for chronic WET concentrations in the ambient receiving water, thus, it is assumed that ambient concentrations of chronic WET is zero. These values were used in the reasonable potential analyses.
Table C-1 summarizes the calculation of the maximum project effluent concentration. Tables C-2 and C-3 show the comparison of the maximum projected effluent concentrations to their respective criteria with the appropriate dilution applied. The most stringent criterion is the lower of the acute and the chronic criteria.
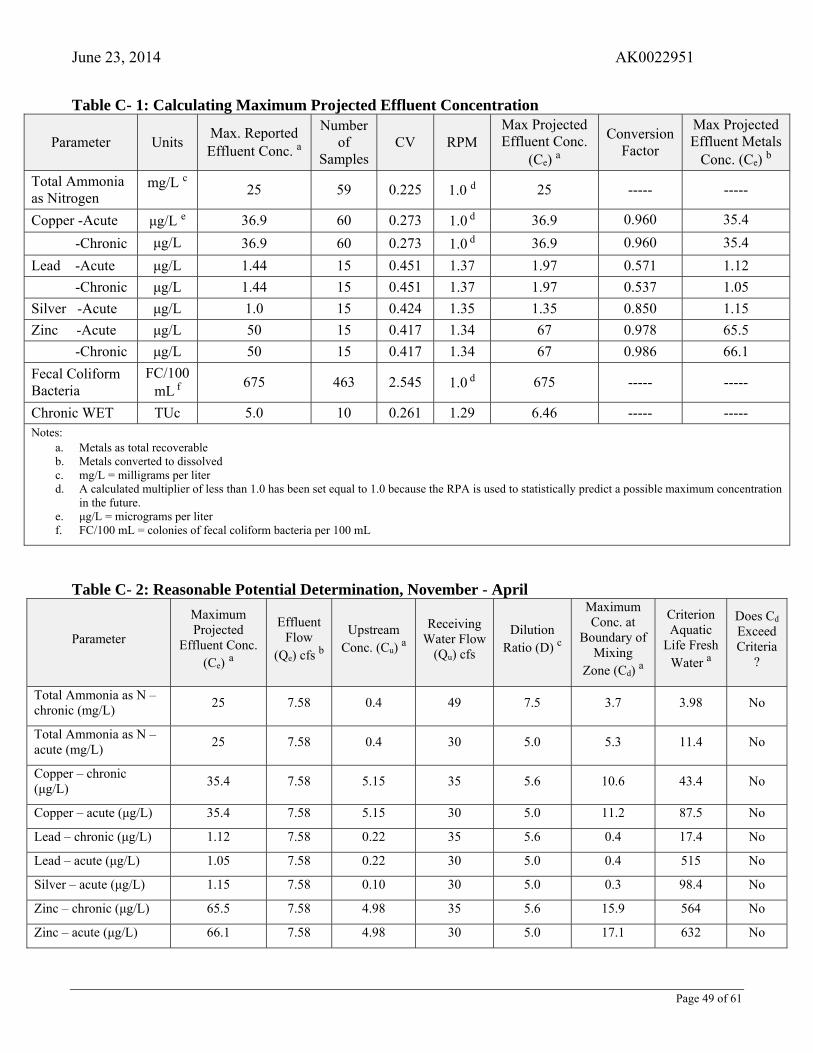
June 23, 2014 AK0022951
Page 49 of 61
Table C- 1: Calculating Maximum Projected Effluent Concentration
Parameter Units Max. Reported Effluent Conc. a
Number of
Samples CV RPM
Max Projected Effluent Conc.
(Ce) a
Conversion Factor
Max Projected Effluent Metals
Conc. (Ce) b
Total Ammonia as Nitrogen
mg/L c 25 59 0.225 1.0 d 25 ----- -----
Copper -Acute μg/L e 36.9 60 0.273 1.0 d 36.9 0.960 35.4
-Chronic μg/L 36.9 60 0.273 1.0 d 36.9 0.960 35.4
Lead -Acute μg/L 1.44 15 0.451 1.37 1.97 0.571 1.12
-Chronic μg/L 1.44 15 0.451 1.37 1.97 0.537 1.05
Silver -Acute μg/L 1.0 15 0.424 1.35 1.35 0.850 1.15
Zinc -Acute μg/L 50 15 0.417 1.34 67 0.978 65.5
-Chronic μg/L 50 15 0.417 1.34 67 0.986 66.1
Fecal Coliform Bacteria
FC/100mL f
675 463 2.545 1.0 d 675 ----- -----
Chronic WET TUc 5.0 10 0.261 1.29 6.46 ----- ----- Notes:
a. Metals as total recoverable b. Metals converted to dissolved c. mg/L = milligrams per liter d. A calculated multiplier of less than 1.0 has been set equal to 1.0 because the RPA is used to statistically predict a possible maximum concentration
in the future. e. μg/L = micrograms per liter f. FC/100 mL = colonies of fecal coliform bacteria per 100 mL
Table C- 2: Reasonable Potential Determination, November - April
Parameter
Maximum Projected
Effluent Conc. (Ce) a
Effluent Flow
(Qe) cfs b
Upstream Conc. (Cu) a
Receiving Water Flow
(Qu) cfs
Dilution Ratio (D) c
Maximum Conc. at
Boundary of Mixing
Zone (Cd) a
Criterion Aquatic
Life Fresh Water a
Does Cd Exceed Criteria
?
Total Ammonia as N – chronic (mg/L)
25 7.58 0.4 49 7.5 3.7 3.98 No
Total Ammonia as N – acute (mg/L)
25 7.58 0.4 30 5.0 5.3 11.4 No
Copper – chronic (μg/L)
35.4 7.58 5.15 35 5.6 10.6 43.4 No
Copper – acute (μg/L) 35.4 7.58 5.15 30 5.0 11.2 87.5 No
Lead – chronic (μg/L) 1.12 7.58 0.22 35 5.6 0.4 17.4 No
Lead – acute (μg/L) 1.05 7.58 0.22 30 5.0 0.4 515 No
Silver – acute (μg/L) 1.15 7.58 0.10 30 5.0 0.3 98.4 No
Zinc – chronic (μg/L) 65.5 7.58 4.98 35 5.6 15.9 564 No
Zinc – acute (μg/L) 66.1 7.58 4.98 30 5.0 17.1 632 No
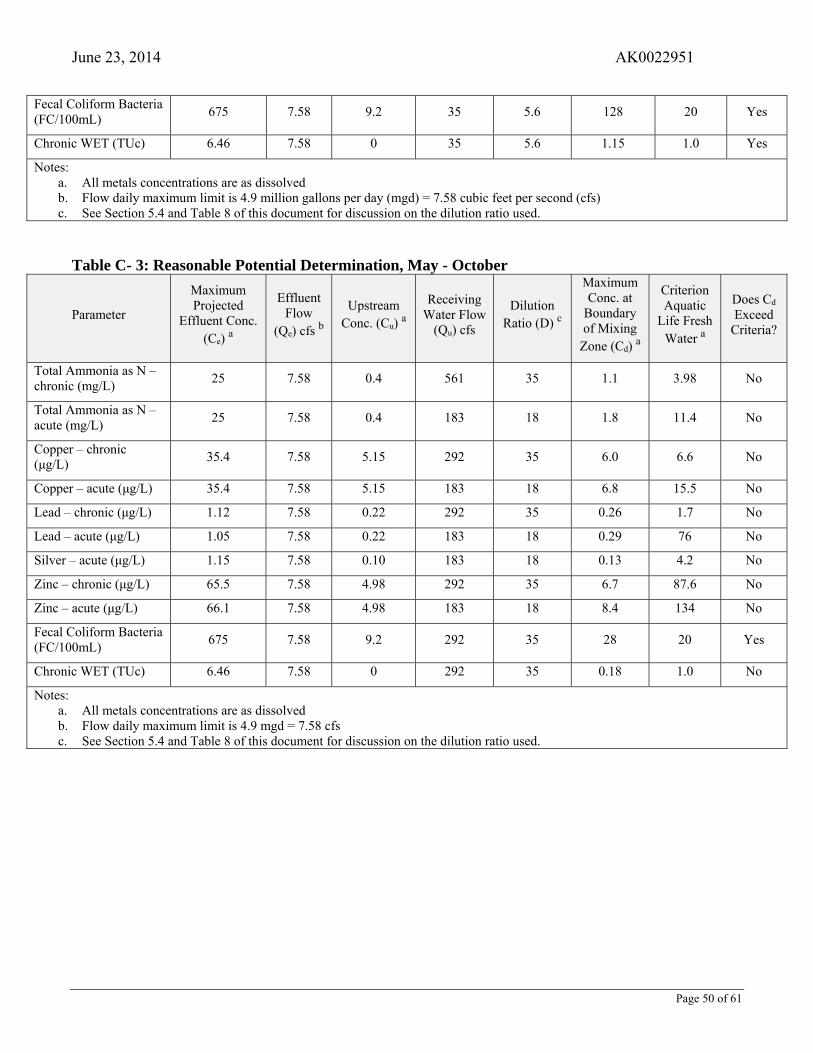
June 23, 2014 AK0022951
Page 50 of 61
Fecal Coliform Bacteria (FC/100mL)
675 7.58 9.2 35 5.6 128 20 Yes
Chronic WET (TUc) 6.46 7.58 0 35 5.6 1.15 1.0 Yes
Notes: a. All metals concentrations are as dissolved b. Flow daily maximum limit is 4.9 million gallons per day (mgd) = 7.58 cubic feet per second (cfs) c. See Section 5.4 and Table 8 of this document for discussion on the dilution ratio used.
Table C- 3: Reasonable Potential Determination, May - October
Parameter
Maximum Projected
Effluent Conc. (Ce) a
Effluent Flow
(Qe) cfs b
Upstream Conc. (Cu) a
Receiving Water Flow
(Qu) cfs
Dilution Ratio (D) c
Maximum Conc. at
Boundary of Mixing
Zone (Cd) a
Criterion Aquatic
Life Fresh Water a
Does Cd Exceed
Criteria?
Total Ammonia as N – chronic (mg/L)
25 7.58 0.4 561 35 1.1 3.98 No
Total Ammonia as N – acute (mg/L)
25 7.58 0.4 183 18 1.8 11.4 No
Copper – chronic (μg/L)
35.4 7.58 5.15 292 35 6.0 6.6 No
Copper – acute (μg/L) 35.4 7.58 5.15 183 18 6.8 15.5 No
Lead – chronic (μg/L) 1.12 7.58 0.22 292 35 0.26 1.7 No
Lead – acute (μg/L) 1.05 7.58 0.22 183 18 0.29 76 No
Silver – acute (μg/L) 1.15 7.58 0.10 183 18 0.13 4.2 No
Zinc – chronic (μg/L) 65.5 7.58 4.98 292 35 6.7 87.6 No
Zinc – acute (μg/L) 66.1 7.58 4.98 183 18 8.4 134 No
Fecal Coliform Bacteria (FC/100mL)
675 7.58 9.2 292 35 28 20 Yes
Chronic WET (TUc) 6.46 7.58 0 292 35 0.18 1.0 No
Notes: a. All metals concentrations are as dissolved b. Flow daily maximum limit is 4.9 mgd = 7.58 cfs c. See Section 5.4 and Table 8 of this document for discussion on the dilution ratio used.
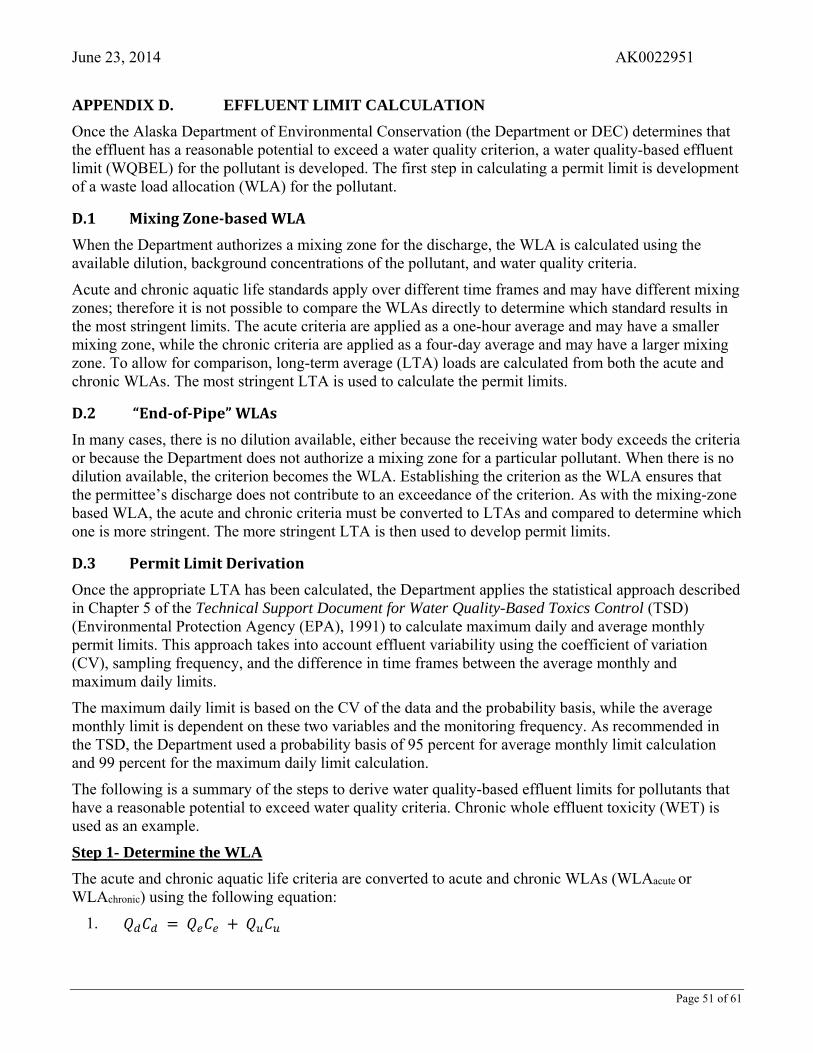
June 23, 2014 AK0022951
Page 51 of 61
APPENDIX D. EFFLUENT LIMIT CALCULATION
Once the Alaska Department of Environmental Conservation (the Department or DEC) determines that the effluent has a reasonable potential to exceed a water quality criterion, a water quality-based effluent limit (WQBEL) for the pollutant is developed. The first step in calculating a permit limit is development of a waste load allocation (WLA) for the pollutant.
D.1 MixingZone‐basedWLA
When the Department authorizes a mixing zone for the discharge, the WLA is calculated using the available dilution, background concentrations of the pollutant, and water quality criteria.
Acute and chronic aquatic life standards apply over different time frames and may have different mixing zones; therefore it is not possible to compare the WLAs directly to determine which standard results in the most stringent limits. The acute criteria are applied as a one-hour average and may have a smaller mixing zone, while the chronic criteria are applied as a four-day average and may have a larger mixing zone. To allow for comparison, long-term average (LTA) loads are calculated from both the acute and chronic WLAs. The most stringent LTA is used to calculate the permit limits.
D.2 “End‐of‐Pipe”WLAs
In many cases, there is no dilution available, either because the receiving water body exceeds the criteria or because the Department does not authorize a mixing zone for a particular pollutant. When there is no dilution available, the criterion becomes the WLA. Establishing the criterion as the WLA ensures that the permittee’s discharge does not contribute to an exceedance of the criterion. As with the mixing-zone based WLA, the acute and chronic criteria must be converted to LTAs and compared to determine which one is more stringent. The more stringent LTA is then used to develop permit limits.
D.3 PermitLimitDerivation
Once the appropriate LTA has been calculated, the Department applies the statistical approach described in Chapter 5 of the Technical Support Document for Water Quality-Based Toxics Control (TSD) (Environmental Protection Agency (EPA), 1991) to calculate maximum daily and average monthly permit limits. This approach takes into account effluent variability using the coefficient of variation (CV), sampling frequency, and the difference in time frames between the average monthly and maximum daily limits.
The maximum daily limit is based on the CV of the data and the probability basis, while the average monthly limit is dependent on these two variables and the monitoring frequency. As recommended in the TSD, the Department used a probability basis of 95 percent for average monthly limit calculation and 99 percent for the maximum daily limit calculation.
The following is a summary of the steps to derive water quality-based effluent limits for pollutants that have a reasonable potential to exceed water quality criteria. Chronic whole effluent toxicity (WET) is used as an example.
Step 1- Determine the WLA
The acute and chronic aquatic life criteria are converted to acute and chronic WLAs (WLAacute or WLAchronic) using the following equation:
1.

June 23, 2014 AK0022951
Page 52 of 61
Qd = downstream flow = Qu + Qe Cd = aquatic life criteria that cannot be exceeded downstream Qe = effluent flow Ce = concentration of pollutant in effluent = WLAacute or WLAchronic Qu = upstream flow Cu = upstream background concentration of pollutant
Rearranging the above equation to determine the effluent concentration (Ce) or WLA results in the following:
2.
when Cu is zero, this equation becomes:
3.
With a dilution factor of 5.6, the equation becomes
4. WLA = 5.6 * Cd
For example, for chronic WET for the chronic WLA, the calculation is:
Ce = WLAchronic = 5.6 * 1.0 =5.6
Only chronic WET is being calculated so there is no acute WLA:
Ce = WLAacute =
Step 2 - Determine the Long-Term Average (LTA)
LTAacute and LTAchronic concentrations are calculated from the acute and chronic WLAs using the following equations:
∗ .
where,
ln 1
z = 2.326 for 99th percentile probability basis
∗ .
where,
ln4
1
z = 2.326 for 99th percentile probability basis
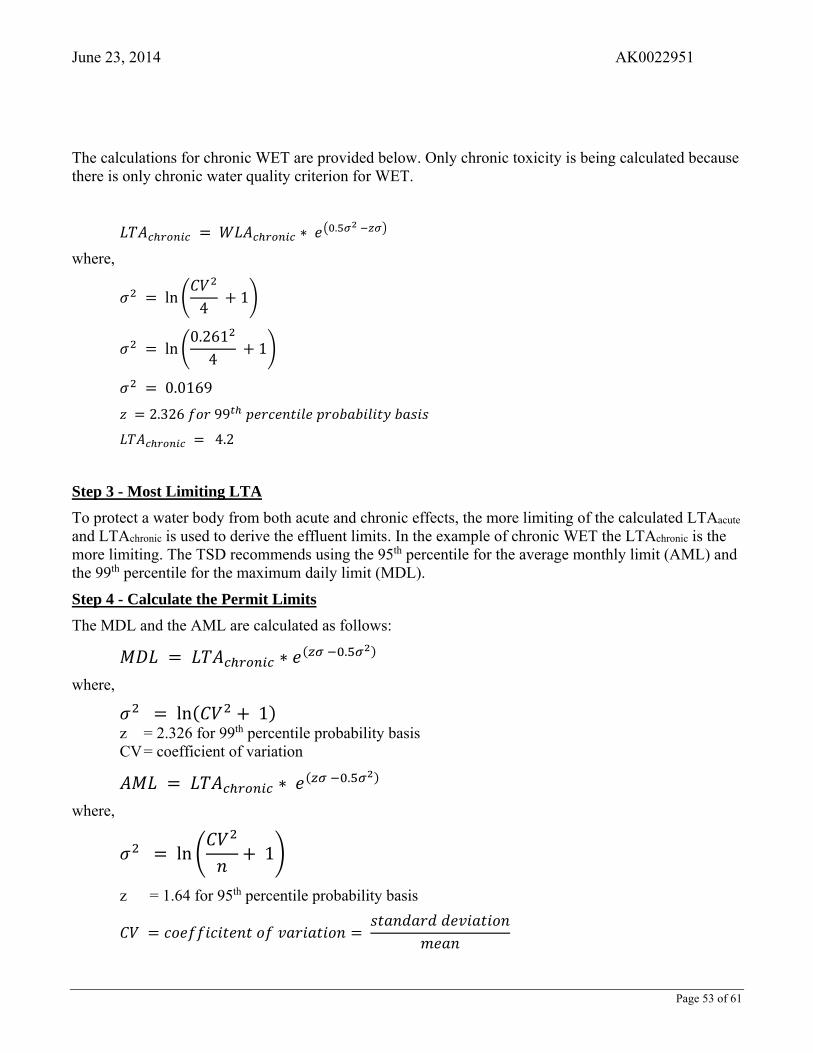
June 23, 2014 AK0022951
Page 53 of 61
The calculations for chronic WET are provided below. Only chronic toxicity is being calculated because there is only chronic water quality criterion for WET.
∗ .
where,
ln4
1
ln0.2614
1
0.0169
2.326 99
4.2
Step 3 - Most Limiting LTA
To protect a water body from both acute and chronic effects, the more limiting of the calculated LTAacute and LTAchronic is used to derive the effluent limits. In the example of chronic WET the LTAchronic is the more limiting. The TSD recommends using the 95th percentile for the average monthly limit (AML) and the 99th percentile for the maximum daily limit (MDL).
Step 4 - Calculate the Permit Limits
The MDL and the AML are calculated as follows:
∗ .
where,
ln 1 z = 2.326 for 99th percentile probability basis CV = coefficient of variation
∗ .
where,
ln 1
z = 1.64 for 95th percentile probability basis

June 23, 2014 AK0022951
Page 54 of 61
n = number of sampling events required per month
The MDL and the AML for chronic WET are calculated as follows:
∗ .
where,
ln 1
ln 0.261 1
0.066
2.326 99
CV = coefficient of variation
MDL = 7.4 TUc
∗ .
where,
ln 1
ln0.2614
1
0.0169
1.645 95
n = number of sampling events required per month for chronic toxicity is the default of 4.
AML = 5.1 TUc
Table D- 1: Summary of Effluent Limit Calculations
Parameter Season Units Most
Stringent WQS
Dilution CV WLAchronic LTA limiting MDL AML
Chronic WET
November – April
TUc 1.0 5.6 0.261 5.6 4.2 ----- 5.1
Ammonia November –
April mg/L 3.98 7.5 0.225 27 25 40.5 29.5
June 23, 2014 AK0022951
Page 55 of 61
Calculated ammonia WQBELs for the months of November through April were compared to limits imposed in the 2006 permit and the more stringent limits were applied in the 2014 permit. See Table B-8 of the fact sheet for the comparison and selection of ammonia limits.
A reasonable potential analysis of effluent copper concentrations resulted in a determination that though applicable water quality criteria for copper was exceeded at the point of discharge, there is no reasonable potential for copper to exceed or contribute to an exceedance of water quality criteria at the boundary of the authorized mixing zone. WQBELs for copper, based on data collected during the 2006 permit cycle, were not applied in this permit because calculated limits were less stringent than those imposed in the 2006 permit. Copper limits from the 2006 permit are applied in the 2014 permit.
Fecal coliform bacteria limits for the months of November through April were calculated using the water quality criterion as a geometric mean, 20 FC/100 mL, and the critical dilution factor for this time period of 5.6. 18 AAC 83.530 states that discharge permit effluent limits must, unless impracticable, be stated as an average weekly and average monthly discharge limitations for a POTW. Due to the lack of guidance available for calculating weekly geometric mean limits for bacteria, the weekly geometric mean for fecal coliform bacteria in this permit follows the precedent set by the secondary treatment standards at 18 AAC 83.605 for BOD5 and TSS. The weekly average limit equals 1.5 times the calculated monthly average limit. For this permit:
Fecal coliform bacteria weekly geometric mean limit = 1.5 X 112 FC/100 mL = 168 FC/100 mL.
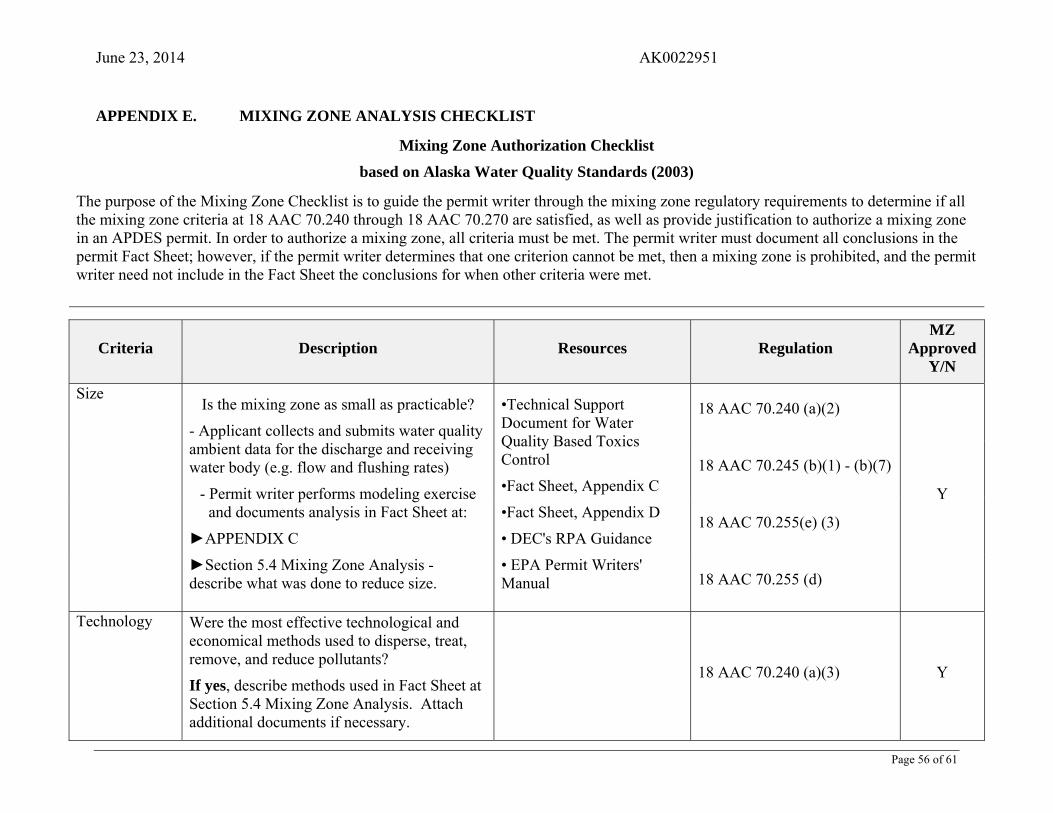
June 23, 2014 AK0022951
Page 56 of 61
APPENDIX E. MIXING ZONE ANALYSIS CHECKLIST
Mixing Zone Authorization Checklist
based on Alaska Water Quality Standards (2003)
The purpose of the Mixing Zone Checklist is to guide the permit writer through the mixing zone regulatory requirements to determine if all the mixing zone criteria at 18 AAC 70.240 through 18 AAC 70.270 are satisfied, as well as provide justification to authorize a mixing zone in an APDES permit. In order to authorize a mixing zone, all criteria must be met. The permit writer must document all conclusions in the permit Fact Sheet; however, if the permit writer determines that one criterion cannot be met, then a mixing zone is prohibited, and the permit writer need not include in the Fact Sheet the conclusions for when other criteria were met.
Criteria Description Resources Regulation MZ
ApprovedY/N
Size Is the mixing zone as small as practicable?
- Applicant collects and submits water quality ambient data for the discharge and receiving water body (e.g. flow and flushing rates)
- Permit writer performs modeling exercise and documents analysis in Fact Sheet at:
►APPENDIX C
►Section 5.4 Mixing Zone Analysis - describe what was done to reduce size.
•Technical Support Document for Water Quality Based Toxics Control
•Fact Sheet, Appendix C
•Fact Sheet, Appendix D
• DEC's RPA Guidance
• EPA Permit Writers' Manual
18 AAC 70.240 (a)(2)
Y
18 AAC 70.245 (b)(1) - (b)(7)
18 AAC 70.255(e) (3)
18 AAC 70.255 (d)
Technology Were the most effective technological and economical methods used to disperse, treat, remove, and reduce pollutants?
If yes, describe methods used in Fact Sheet at Section 5.4 Mixing Zone Analysis. Attach additional documents if necessary.
18 AAC 70.240 (a)(3) Y
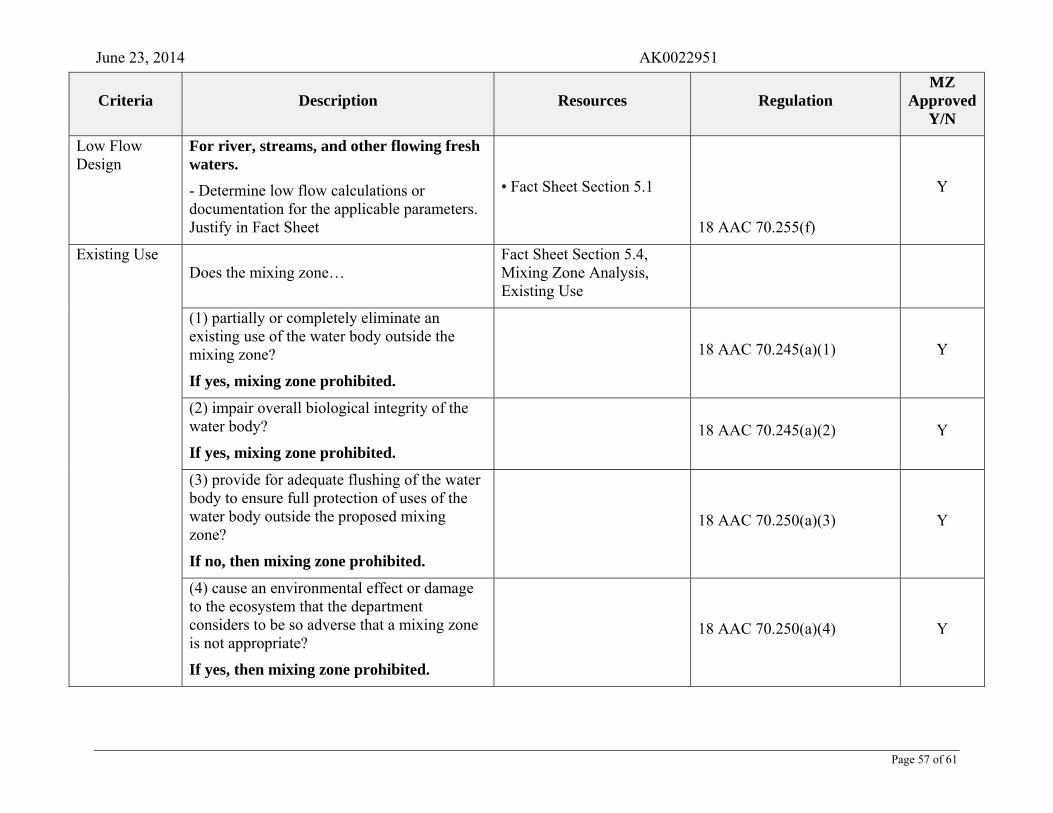
June 23, 2014 AK0022951
Page 57 of 61
Criteria Description Resources Regulation MZ
ApprovedY/N
Low Flow Design
For river, streams, and other flowing fresh waters.
- Determine low flow calculations or documentation for the applicable parameters. Justify in Fact Sheet
• Fact Sheet Section 5.1
18 AAC 70.255(f)
Y
Existing Use Does the mixing zone…
Fact Sheet Section 5.4, Mixing Zone Analysis, Existing Use
(1) partially or completely eliminate an existing use of the water body outside the mixing zone?
If yes, mixing zone prohibited.
18 AAC 70.245(a)(1) Y
(2) impair overall biological integrity of the water body?
If yes, mixing zone prohibited.
18 AAC 70.245(a)(2) Y
(3) provide for adequate flushing of the water body to ensure full protection of uses of the water body outside the proposed mixing zone?
If no, then mixing zone prohibited.
18 AAC 70.250(a)(3) Y
(4) cause an environmental effect or damage to the ecosystem that the department considers to be so adverse that a mixing zone is not appropriate?
If yes, then mixing zone prohibited.
18 AAC 70.250(a)(4) Y
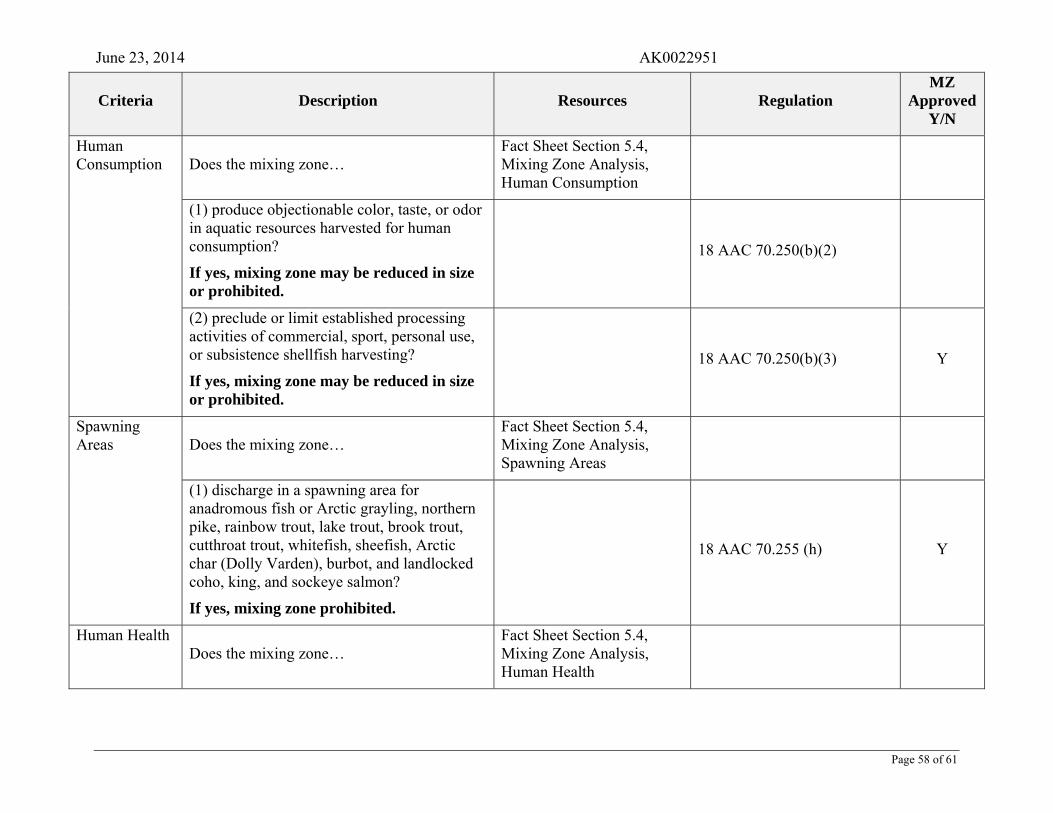
June 23, 2014 AK0022951
Page 58 of 61
Criteria Description Resources Regulation MZ
ApprovedY/N
Human Consumption Does the mixing zone…
Fact Sheet Section 5.4, Mixing Zone Analysis, Human Consumption
(1) produce objectionable color, taste, or odor in aquatic resources harvested for human consumption?
If yes, mixing zone may be reduced in size or prohibited.
18 AAC 70.250(b)(2)
(2) preclude or limit established processing activities of commercial, sport, personal use, or subsistence shellfish harvesting?
If yes, mixing zone may be reduced in size or prohibited.
18 AAC 70.250(b)(3) Y
Spawning Areas Does the mixing zone…
Fact Sheet Section 5.4, Mixing Zone Analysis, Spawning Areas
(1) discharge in a spawning area for anadromous fish or Arctic grayling, northern pike, rainbow trout, lake trout, brook trout, cutthroat trout, whitefish, sheefish, Arctic char (Dolly Varden), burbot, and landlocked coho, king, and sockeye salmon?
If yes, mixing zone prohibited.
18 AAC 70.255 (h) Y
Human Health Does the mixing zone…
Fact Sheet Section 5.4, Mixing Zone Analysis, Human Health
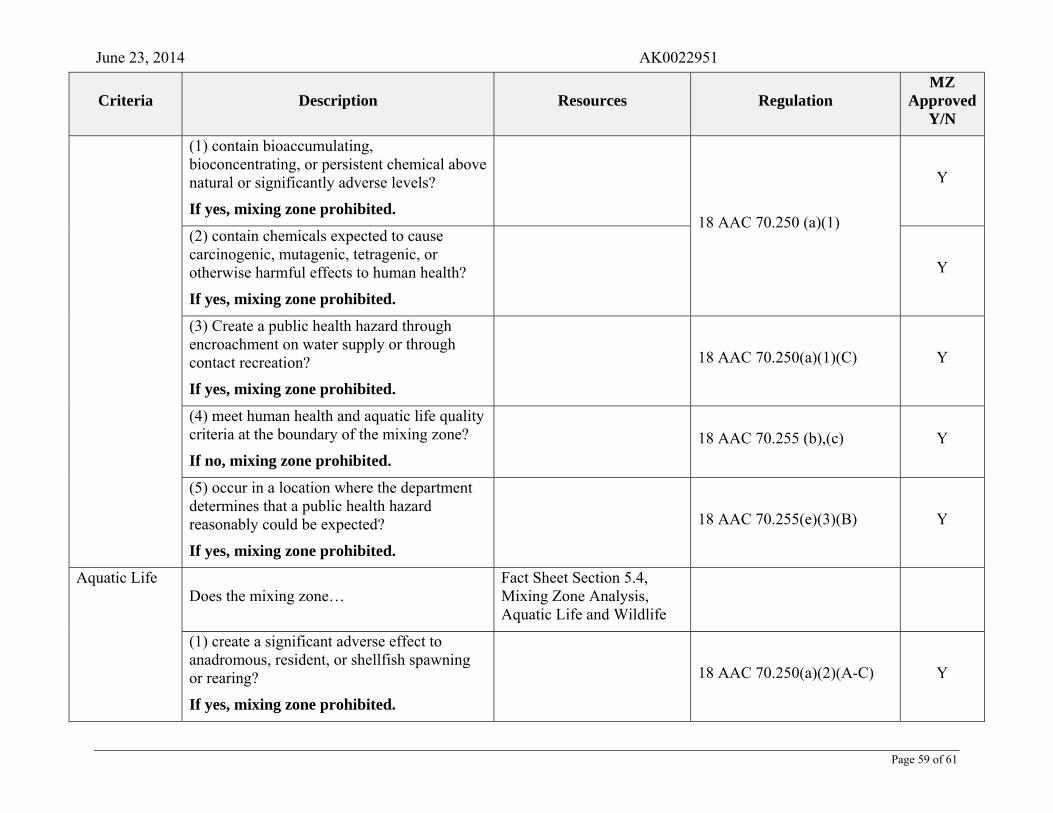
June 23, 2014 AK0022951
Page 59 of 61
Criteria Description Resources Regulation MZ
ApprovedY/N
(1) contain bioaccumulating, bioconcentrating, or persistent chemical above natural or significantly adverse levels?
If yes, mixing zone prohibited. 18 AAC 70.250 (a)(1)
Y
(2) contain chemicals expected to cause carcinogenic, mutagenic, tetragenic, or otherwise harmful effects to human health?
If yes, mixing zone prohibited.
Y
(3) Create a public health hazard through encroachment on water supply or through contact recreation?
If yes, mixing zone prohibited.
18 AAC 70.250(a)(1)(C) Y
(4) meet human health and aquatic life quality criteria at the boundary of the mixing zone?
If no, mixing zone prohibited.
18 AAC 70.255 (b),(c) Y
(5) occur in a location where the department determines that a public health hazard reasonably could be expected?
If yes, mixing zone prohibited.
18 AAC 70.255(e)(3)(B) Y
Aquatic Life Does the mixing zone…
Fact Sheet Section 5.4, Mixing Zone Analysis, Aquatic Life and Wildlife
(1) create a significant adverse effect to anadromous, resident, or shellfish spawning or rearing?
If yes, mixing zone prohibited.
18 AAC 70.250(a)(2)(A-C) Y
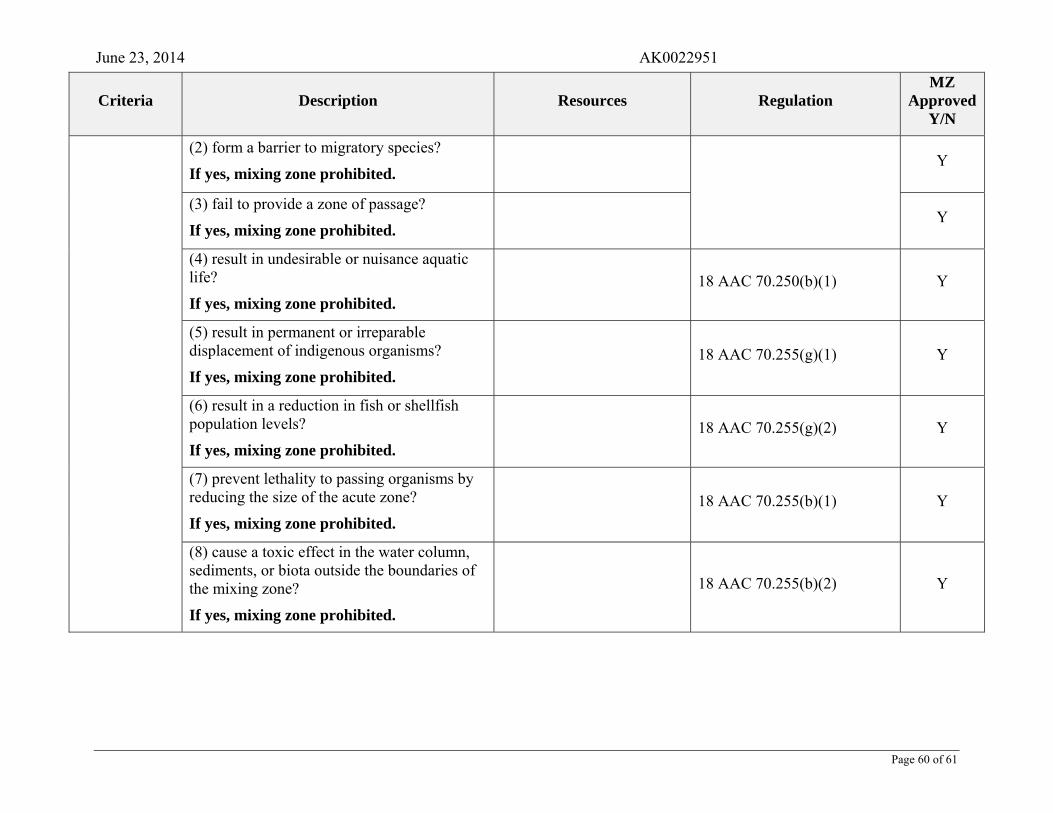
June 23, 2014 AK0022951
Page 60 of 61
Criteria Description Resources Regulation MZ
ApprovedY/N
(2) form a barrier to migratory species?
If yes, mixing zone prohibited. Y
(3) fail to provide a zone of passage?
If yes, mixing zone prohibited. Y
(4) result in undesirable or nuisance aquatic life?
If yes, mixing zone prohibited.
18 AAC 70.250(b)(1) Y
(5) result in permanent or irreparable displacement of indigenous organisms?
If yes, mixing zone prohibited.
18 AAC 70.255(g)(1) Y
(6) result in a reduction in fish or shellfish population levels?
If yes, mixing zone prohibited.
18 AAC 70.255(g)(2) Y
(7) prevent lethality to passing organisms by reducing the size of the acute zone?
If yes, mixing zone prohibited.
18 AAC 70.255(b)(1) Y
(8) cause a toxic effect in the water column, sediments, or biota outside the boundaries of the mixing zone?
If yes, mixing zone prohibited.
18 AAC 70.255(b)(2) Y
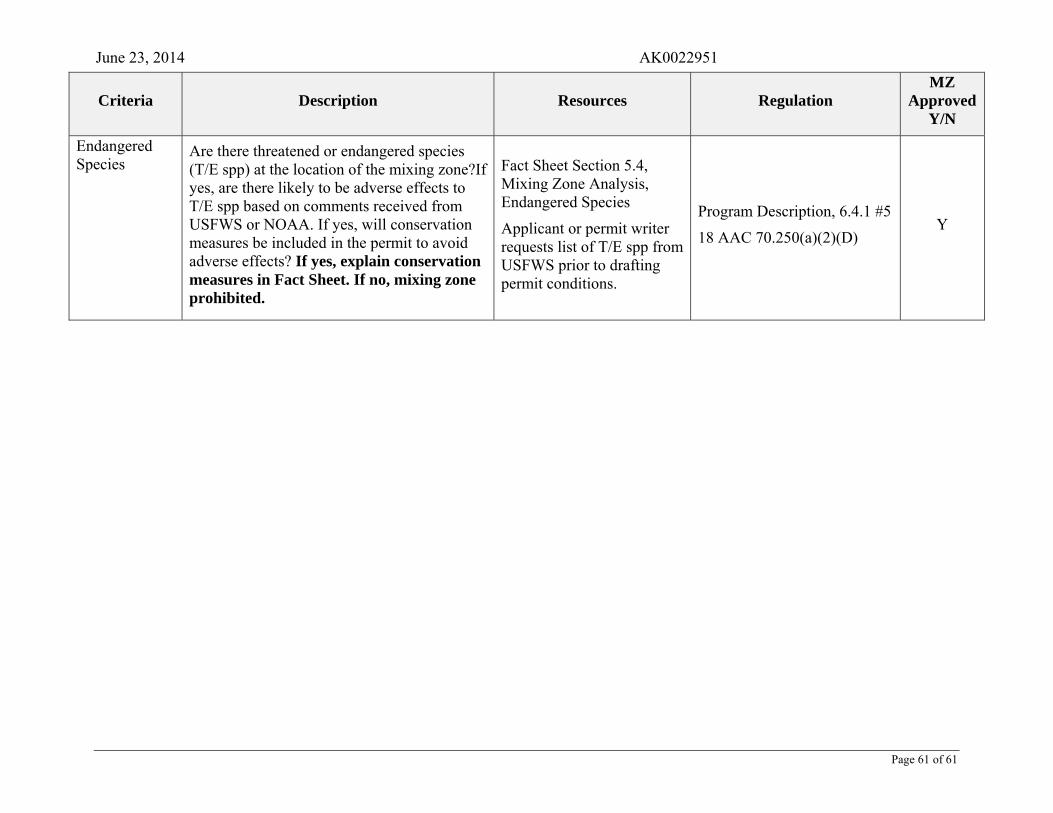
June 23, 2014 AK0022951
Page 61 of 61
Criteria Description Resources Regulation MZ
ApprovedY/N
Endangered Species
Are there threatened or endangered species (T/E spp) at the location of the mixing zone?If yes, are there likely to be adverse effects to T/E spp based on comments received from USFWS or NOAA. If yes, will conservation measures be included in the permit to avoid adverse effects? If yes, explain conservation measures in Fact Sheet. If no, mixing zone prohibited.
Fact Sheet Section 5.4, Mixing Zone Analysis, Endangered Species
Applicant or permit writer requests list of T/E spp from USFWS prior to drafting permit conditions.
Program Description, 6.4.1 #5
18 AAC 70.250(a)(2)(D) Y
MWWTP Operations and Maintenance Plan
Appendix BUPCPs
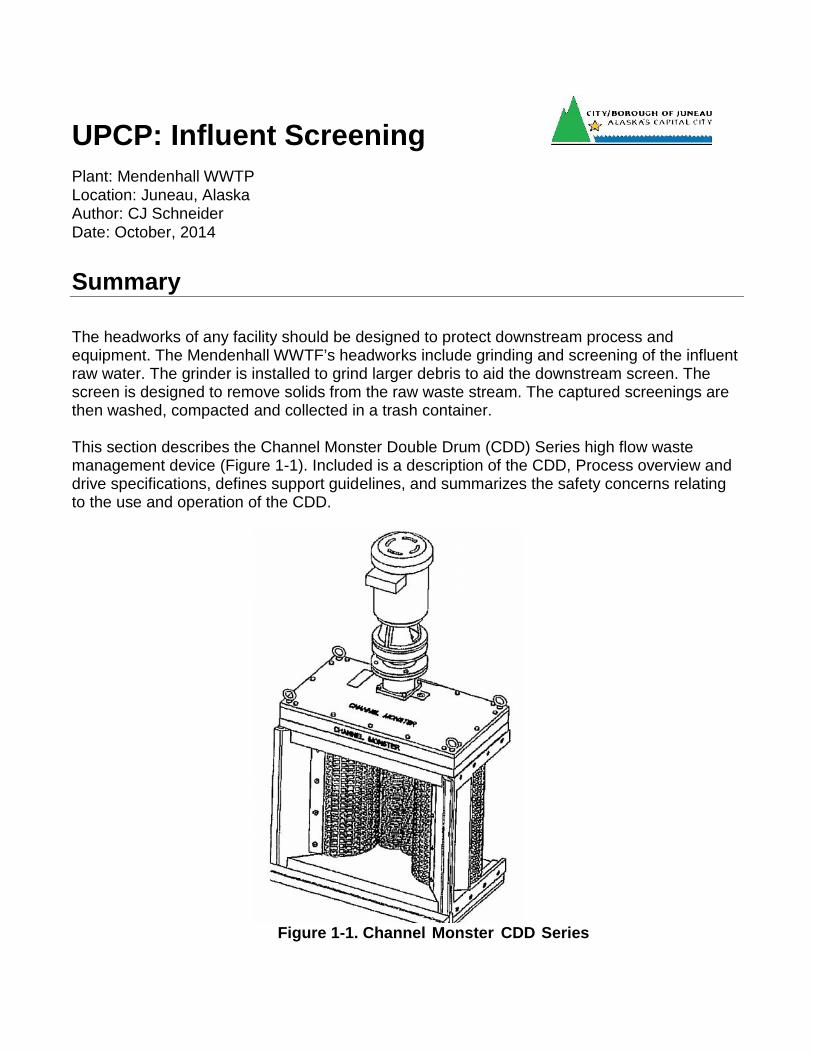
UPCP: Influent ScreeningPlant: Mendenhall WWTPLocation: Juneau, AlaskaAuthor: CJ SchneiderDate: October, 2014
Summary
The headworks of any facility should be designed to protect downstream process andequipment. The Mendenhall WWTF’s headworks include grinding and screening of the influentraw water. The grinder is installed to grind larger debris to aid the downstream screen. Thescreen is designed to remove solids from the raw waste stream. The captured screenings arethen washed, compacted and collected in a trash container.
This section describes the Channel Monster Double Drum (CDD) Series high flow wastemanagement device (Figure 1-1). Included is a description of the CDD, Process overview anddrive specifications, defines support guidelines, and summarizes the safety concerns relatingto the use and operation of the CDD.
Figure 1-1. Channel Monster CDD Series
Process Overview
Influent flows by gravity from the sewer line through to the control manhole. It then flowsthrough the grinder/screener (Auger Monster) into the influent wet well. From the wet well it ispumped into the head-box of the grit removal system, where the pretreatment process isinitiated.
The control manhole contains one 36" diameter inlet line, two (2) valved 36" diameterdischarge lines to the SBR plant. By opening and/ or closing the appropriate discharge lines,the mechanical Auger Monster and manual bar rack can be used independently or bothsimultaneously.
Flows through the individual screening devices are controlled by opening or closing slide gatevalves that control flow from the control manhole. The valves are located in separate channels,ahead of the Auger Monster and bar rack. The slide gates valves are controlled by crankmechanisms at the main floor level.
First, a grinder shreds clumps of rags, sticks, plastics, fecal matter and inorganic/organicmaterial. Next, solids are captured by a perforated plate screen and removed by a rotatingauger. As solids are removed, dual wash water zones clean-off fecal material. The rotatingauger then conveys solids to the discharge point.
1.0 Influent Screening
The CDD cutter cartridge is an integrated, electrically driven horizontal screen and cutterassembly that screens and reduces raw sewage and solids and serves as an alternative fortreatment plant bar screens, rakes, etc. It was specifically designed to fit the existing influentchannel width and sit across channel (perpendicular to the influent flow) in the MWWTPInfluent Pump Station.
Functionally, when power is applied, the screens rotate horizontally in synchronization withdual counter rotating cutter stacks. The rotating screens directs solids toward and into thecutters where the influent solids are ground into fine particles (to an approx. diameter of .33”x up to 2.5” varying lengths and acceptable to all process pumps) to facilitate free flow andeasy disposal of sludge.
1.1 EQUIPMENT SPECIFICATIONS
The following paragraphs define the specifications of the CDD. See the Controller and DriveAssembly manuals for the specifications and details related to the Controller and driveassembly. Maximum design flow 8.5 MGD.

Physically the CDD consists of the following:
A. Cutter Assembly - Two (2) parallel shafts alternately stacked with individual intermeshingcutters and spacers positioned on the shaft to form a helical pattern. The shafts counter-rotatewith the driven shaft rotating approximately two-thirds the speed of the drive shaft.
The cutter assembly is a 32” (813mm) cutter chamber configuration. The cutters consist ofstandard 7 tooth cam cutters and spacers stacked on the drive and driven shaft.
B. Screen Drum Assembly - Dual single shaft horizontally rotating screen drums that divertwaste stream solids towards and into the cutter assembly. The assemblies utilize stainlesssteel perforated screening drums with 1/4” (6mm) circular openings for high capture efficiency.
C. Side Rails - Baffle drum side rails are installed on each screen side of the CDD. The siderails deflect solids into the cutting chamber. The side rails are concave, follow the curvature ofthe screens, and extend the full length of the screen assembly.This design provides a rigidstructure between end housings to allow the screen and cutter assembly seal cartridges tofloat, which reduces shaft fatigue. Clearance between the side rails and screen assemblies isset to maintain fineness of grind, uniform particle size, and consistent flow through the CDD.
D. End Housings - Top and bottom end housing protect the screen and cutter assemblyseals and bearings while guiding particles directly into the cutting chamber. The top endhousing provides access to the stack tightening nut to enable cutter stack tighteningwithout removing the CDD from the channel.
E. Seals and Bearings - Sealed ball bearings bear the radial and axial loads of the cutterassembly drive and driven shafts and the screen assembly driven shaft. Each end-housingcontains seal cartridge assemblies which, in turn, contain the seals and bearings. Each sealis: independent of the cutter stack and screen, functioning even if the cutter stack or screenbecomes loose and remains an integral part of the end housing during almost all maintenanceactions.
F. Cutter Stack Tightening - An access cover on the discharge side of the top housing andan access opening in the top cover allows maintenance personnel to adjust the cutter stackcompression for maximum cutting efficiency without having to remove the CDD from thechannel or performing any unit disassembly. The adjustment requires power lock out,removal of the access cover and opening, locking the cutter assembly drive shaft nut throughthe top housing access cover and torqueing a stack screw through the access opening in thetop cover.
G. Frame - An adjustable channel frame and Controller complete the CDD systemInstallation. The frame is the enclosure for the CDD assembly. It is lowered into thechannel, bolted into place, and the CDD assembly is lowered into and secured in the frame.
H. Controller - The Controller is a power panel, designed to control and protect the CDD.
I. Drive Assemblies - An electric motor and gear reducers drive the CDD.
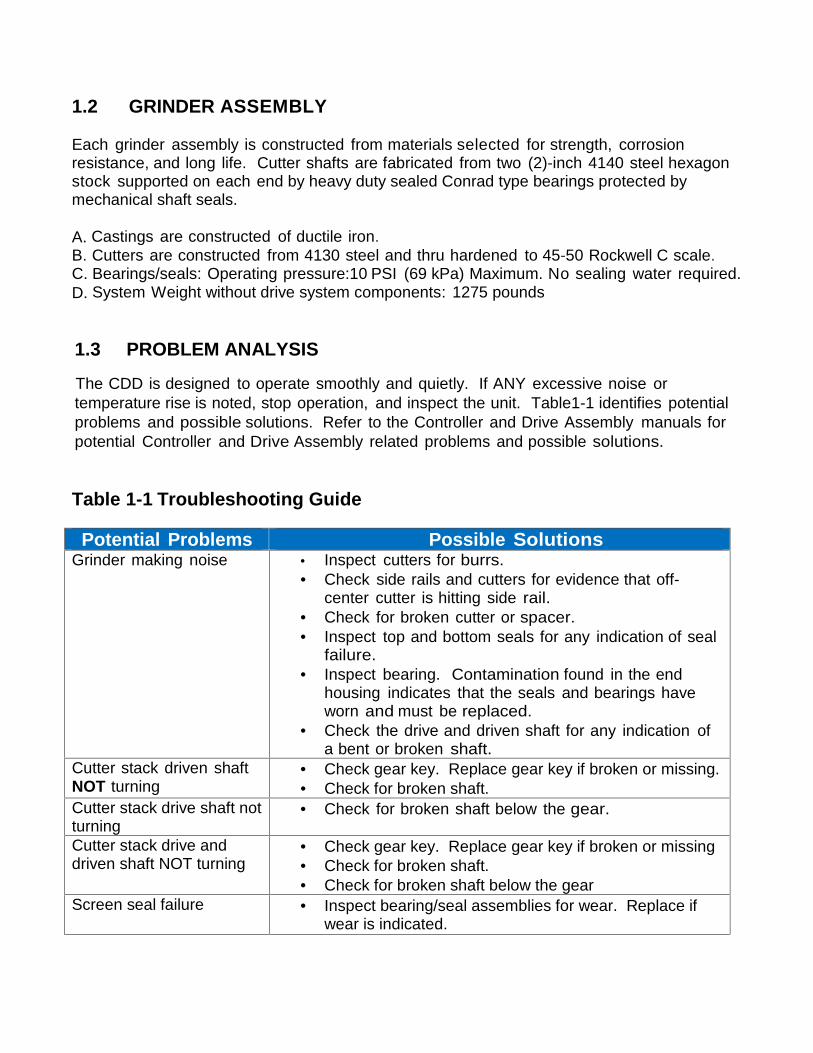
1.2 GRINDER ASSEMBLY
Each grinder assembly is constructed from materials selected for strength, corrosionresistance, and long life. Cutter shafts are fabricated from two (2)-inch 4140 steel hexagonstock supported on each end by heavy duty sealed Conrad type bearings protected bymechanical shaft seals.
A. Castings are constructed of ductile iron.B. Cutters are constructed from 4130 steel and thru hardened to 45-50 Rockwell C scale.C. Bearings/seals: Operating pressure:10 PSI (69 kPa) Maximum. No sealing water required.D. System Weight without drive system components: 1275 pounds
1.3 PROBLEM ANALYSIS
The CDD is designed to operate smoothly and quietly. If ANY excessive noise ortemperature rise is noted, stop operation, and inspect the unit. Table1-1 identifies potentialproblems and possible solutions. Refer to the Controller and Drive Assembly manuals forpotential Controller and Drive Assembly related problems and possible solutions.
Table 1-1 Troubleshooting Guide
Potential Problems Possible SolutionsGrinder making noise Inspect cutters for burrs.
Check side rails and cutters for evidence that off-center cutter is hitting side rail.
Check for broken cutter or spacer. Inspect top and bottom seals for any indication of seal
failure. Inspect bearing. Contamination found in the end
housing indicates that the seals and bearings haveworn and must be replaced.
Check the drive and driven shaft for any indication ofa bent or broken shaft.
Cutter stack driven shaftNOT turning
Check gear key. Replace gear key if broken or missing. Check for broken shaft.
Cutter stack drive shaft notturning
Check for broken shaft below the gear.
Cutter stack drive anddriven shaft NOT turning
Check gear key. Replace gear key if broken or missing Check for broken shaft. Check for broken shaft below the gear
Screen seal failure Inspect bearing/seal assemblies for wear. Replace ifwear is indicated.
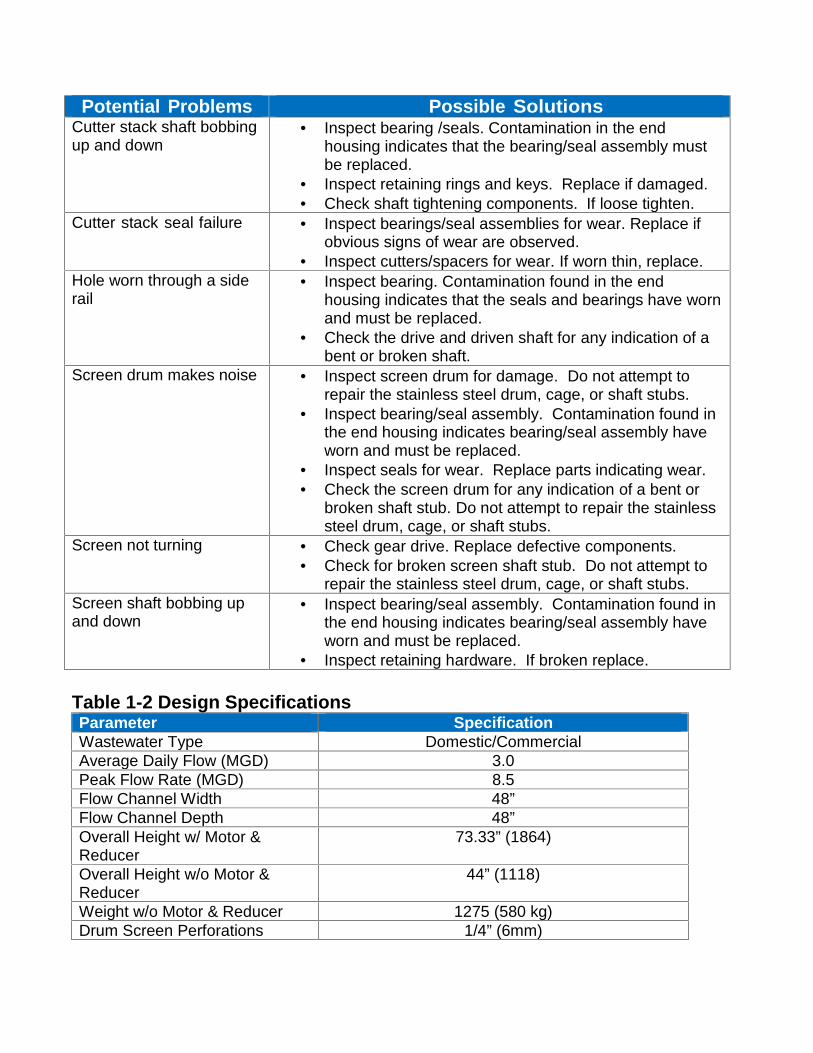
Potential Problems Possible SolutionsCutter stack shaft bobbingup and down
Inspect bearing /seals. Contamination in the endhousing indicates that the bearing/seal assembly mustbe replaced.
Inspect retaining rings and keys. Replace if damaged. Check shaft tightening components. If loose tighten.
Cutter stack seal failure Inspect bearings/seal assemblies for wear. Replace ifobvious signs of wear are observed.
Inspect cutters/spacers for wear. If worn thin, replace.Hole worn through a siderail
Inspect bearing. Contamination found in the endhousing indicates that the seals and bearings have wornand must be replaced.
Check the drive and driven shaft for any indication of abent or broken shaft.
Screen drum makes noise Inspect screen drum for damage. Do not attempt torepair the stainless steel drum, cage, or shaft stubs.
Inspect bearing/seal assembly. Contamination found inthe end housing indicates bearing/seal assembly haveworn and must be replaced.
Inspect seals for wear. Replace parts indicating wear. Check the screen drum for any indication of a bent or
broken shaft stub. Do not attempt to repair the stainlesssteel drum, cage, or shaft stubs.
Screen not turning Check gear drive. Replace defective components. Check for broken screen shaft stub. Do not attempt to
repair the stainless steel drum, cage, or shaft stubs.Screen shaft bobbing upand down
Inspect bearing/seal assembly. Contamination found inthe end housing indicates bearing/seal assembly haveworn and must be replaced.
Inspect retaining hardware. If broken replace.
Table 1-2 Design SpecificationsParameter SpecificationWastewater Type Domestic/CommercialAverage Daily Flow (MGD) 3.0Peak Flow Rate (MGD) 8.5Flow Channel Width 48”Flow Channel Depth 48”Overall Height w/ Motor &Reducer
73.33” (1864)
Overall Height w/o Motor &Reducer
44” (1118)
Weight w/o Motor & Reducer 1275 (580 kg)Drum Screen Perforations 1/4” (6mm)
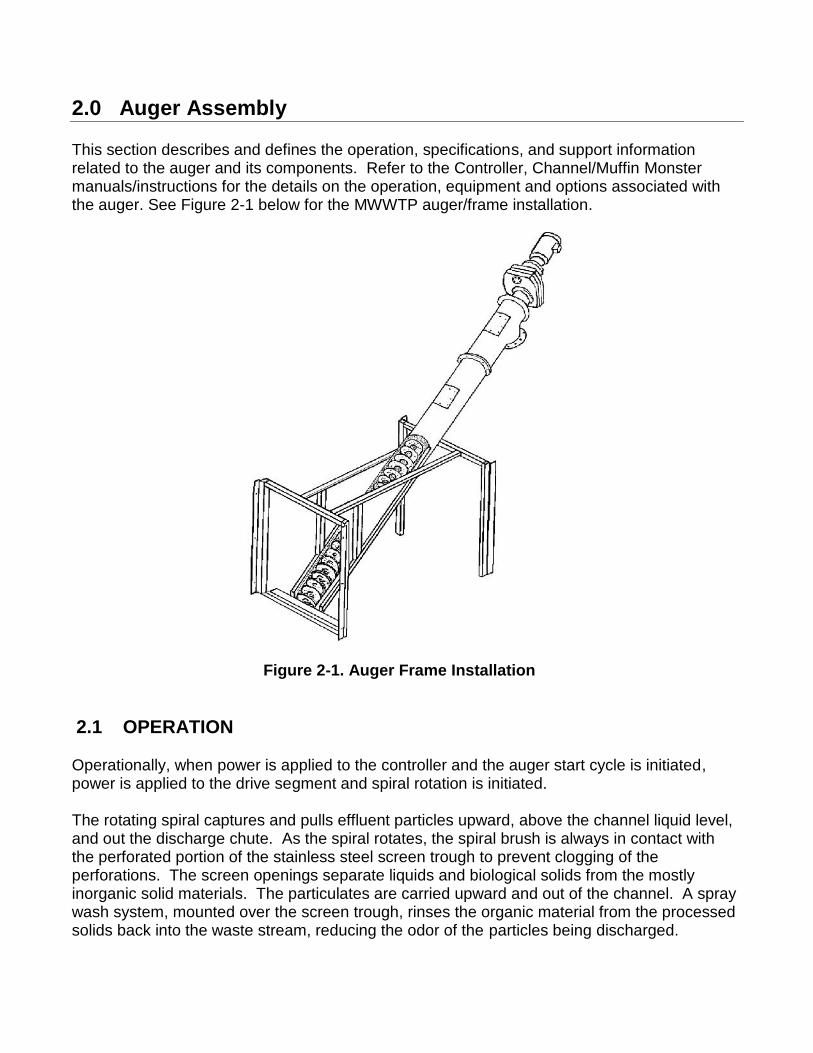
2.0 Auger Assembly
This section describes and defines the operation, specifications, and support informationrelated to the auger and its components. Refer to the Controller, Channel/Muffin Monstermanuals/instructions for the details on the operation, equipment and options associated withthe auger. See Figure 2-1 below for the MWWTP auger/frame installation.
Figure 2-1. Auger Frame Installation
2.1 OPERATION
Operationally, when power is applied to the controller and the auger start cycle is initiated,power is applied to the drive segment and spiral rotation is initiated.
The rotating spiral captures and pulls effluent particles upward, above the channel liquid level,and out the discharge chute. As the spiral rotates, the spiral brush is always in contact withthe perforated portion of the stainless steel screen trough to prevent clogging of theperforations. The screen openings separate liquids and biological solids from the mostlyinorganic solid materials. The particulates are carried upward and out of the channel. A spraywash system, mounted over the screen trough, rinses the organic material from the processedsolids back into the waste stream, reducing the odor of the particles being discharged.
The Auger is integrated with the CDD Channel Monster grinder. The auger is installed at a 45°angle to the influent flow at the output of the grinder cutting chamber. The Muffin/ChannelMonster grinds the waste stream solids and the auger conveys the resulting particles abovethe liquid level of the channel. This allows the channel flow to continue downstream whilegrinding the influent solids into smaller particle sizes. The biological materials enter the augersection and pass through a perforated screen trough, while the inorganic particulates aredewatered, and discharged from the auger discharge segment.
The auger spiral is programmed to rotate through forward and reverse cycles based on thetime of day and operating conditions in the channel. The reverse function has been disableddue to the spirals violent shuddering reaction and excessive brush wear. A float signals thecontroller to operate the spiral continuously during periods of high-level channel flow and,when the channel level returns to a normal level, it returns the auger to the normal operationalmode.
2.2 DESCRIPTION
The Auger consists of the following assemblies:
A. Drive Segment - The drive segment is electrically driven and provides the rotary force forthe auger.
B. Screen Segment - The screen is a one piece, perforated stainless steel trough thatpartially encloses the spiral from the non-drive end to the transport segment. The screenopenings are ¼” (6mm).
C. Transport Segment - The transport segment encloses the spiral and provides a controlledsolids flow path to the discharge segment. The transport segment is a one-piece cylindricalstainless steel casing with mating flanges permanently affixed to each end and a removableinspection port cover.
D. Discharge Segment - The discharge segment provides a controlled discharge flowpath out of the auger to the trash receptacle. The discharge segment is a one-piece cylindricalstainless steel casing with mating flanges permanently affixed to each end and side dischargeoutlet. A removable inspection port cover is located opposite the discharge outlet forinspection.
E. Spiral - The spiral assembly is a one-piece center-less spiral with brushes attached alongthe outside edge of the spiral. The spiral captures and pulls effluent particles upward, abovethe channel, and out the discharge chute. As the spiral rotates, the spiral brush is always incontact with the screen trough to prevent clogging of the perforated openings. The spiral isconnected to the drive assembly through a drive plate on the discharge end of the auger.
P. Spray Wash - The spray wash assembly is constructed of stainless steel and consists ofmanifold pipes, basket strainer, manual valve and solenoid valve. The manually valve is
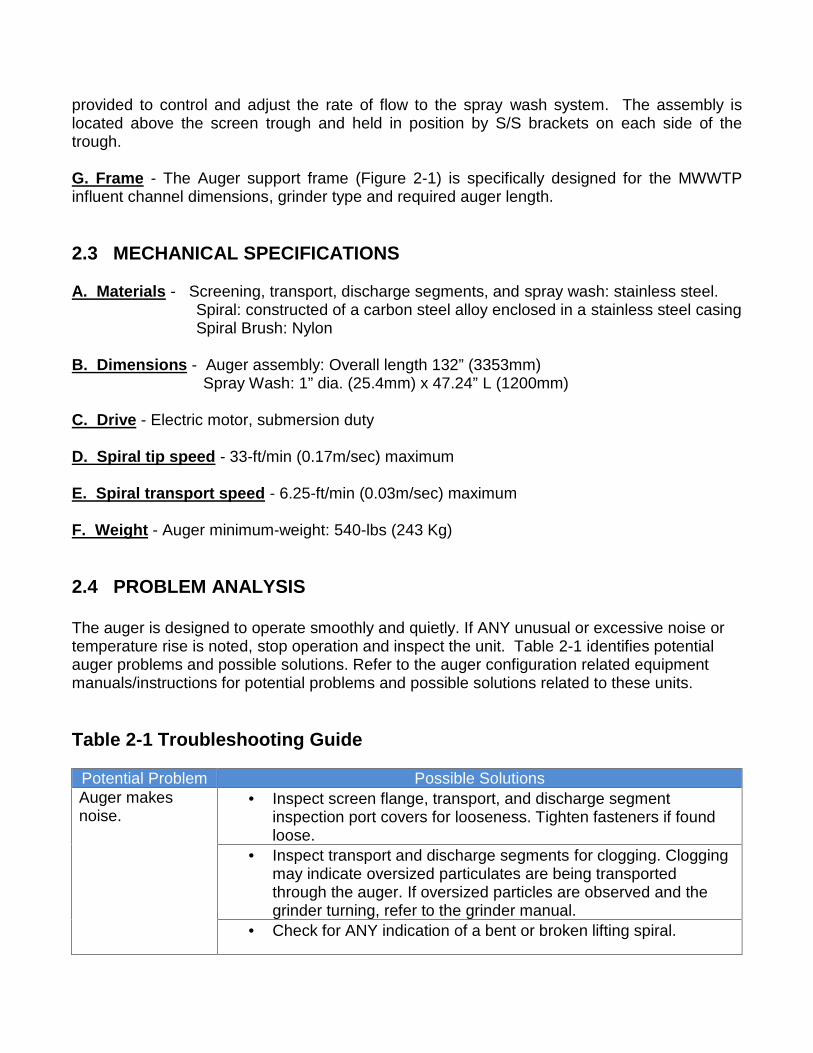
provided to control and adjust the rate of flow to the spray wash system. The assembly islocated above the screen trough and held in position by S/S brackets on each side of thetrough.
G. Frame - The Auger support frame (Figure 2-1) is specifically designed for the MWWTPinfluent channel dimensions, grinder type and required auger length.
2.3 MECHANICAL SPECIFICATIONS
A. Materials - Screening, transport, discharge segments, and spray wash: stainless steel.Spiral: constructed of a carbon steel alloy enclosed in a stainless steel casingSpiral Brush: Nylon
B. Dimensions - Auger assembly: Overall length 132” (3353mm)Spray Wash: 1” dia. (25.4mm) x 47.24” L (1200mm)
C. Drive - Electric motor, submersion duty
D. Spiral tip speed - 33-ft/min (0.17m/sec) maximum
E. Spiral transport speed - 6.25-ft/min (0.03m/sec) maximum
F. Weight - Auger minimum-weight: 540-lbs (243 Kg)
2.4 PROBLEM ANALYSIS
The auger is designed to operate smoothly and quietly. If ANY unusual or excessive noise ortemperature rise is noted, stop operation and inspect the unit. Table 2-1 identifies potentialauger problems and possible solutions. Refer to the auger configuration related equipmentmanuals/instructions for potential problems and possible solutions related to these units.
Table 2-1 Troubleshooting Guide
Potential Problem Possible SolutionsAuger makesnoise.
Inspect screen flange, transport, and discharge segmentinspection port covers for looseness. Tighten fasteners if foundloose.
Inspect transport and discharge segments for clogging. Cloggingmay indicate oversized particulates are being transportedthrough the auger. If oversized particles are observed and thegrinder turning, refer to the grinder manual.
Check for ANY indication of a bent or broken lifting spiral.
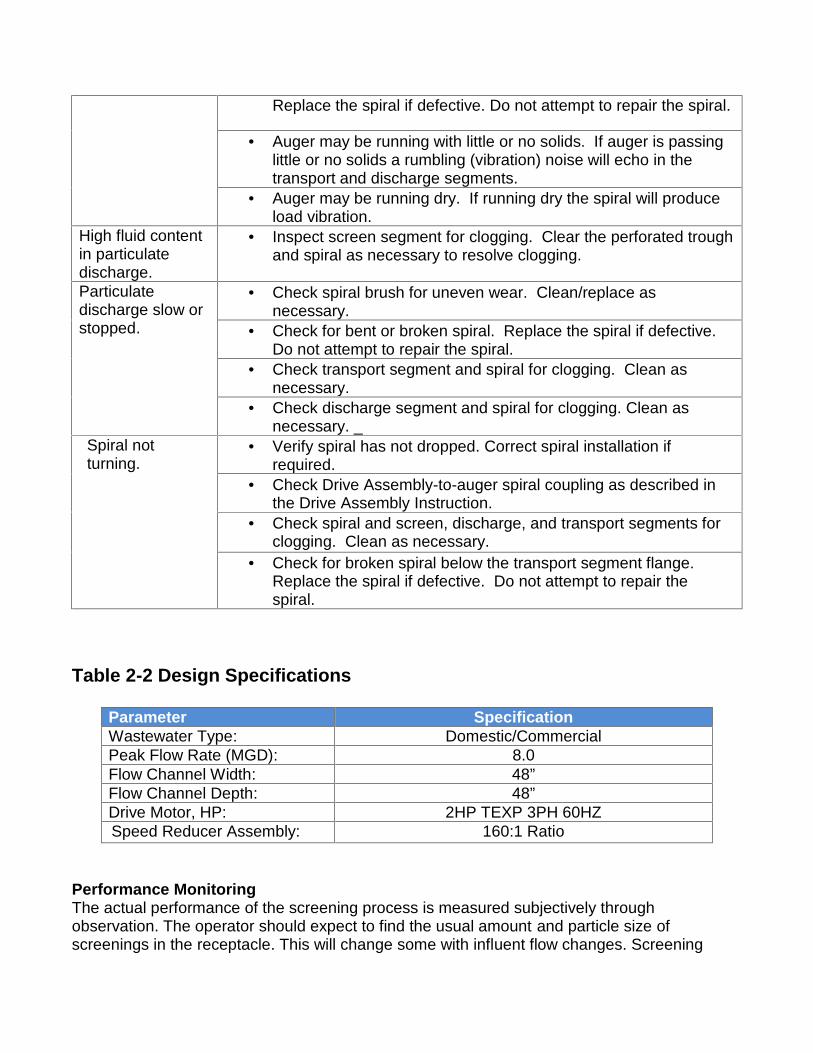
Replace the spiral if defective. Do not attempt to repair the spiral.
Auger may be running with little or no solids. If auger is passinglittle or no solids a rumbling (vibration) noise will echo in thetransport and discharge segments.
Auger may be running dry. If running dry the spiral will produceload vibration.
High fluid contentin particulatedischarge.
Inspect screen segment for clogging. Clear the perforated troughand spiral as necessary to resolve clogging.
Particulatedischarge slow orstopped.
Check spiral brush for uneven wear. Clean/replace asnecessary.
Check for bent or broken spiral. Replace the spiral if defective.Do not attempt to repair the spiral.
Check transport segment and spiral for clogging. Clean asnecessary.
Check discharge segment and spiral for clogging. Clean asnecessary. _
Spiral notturning.
Verify spiral has not dropped. Correct spiral installation ifrequired.
Check Drive Assembly-to-auger spiral coupling as described inthe Drive Assembly Instruction.
Check spiral and screen, discharge, and transport segments forclogging. Clean as necessary.
Check for broken spiral below the transport segment flange.Replace the spiral if defective. Do not attempt to repair thespiral.
Table 2-2 Design Specifications
Parameter SpecificationWastewater Type: Domestic/CommercialPeak Flow Rate (MGD): 8.0Flow Channel Width: 48”Flow Channel Depth: 48”Drive Motor, HP: 2HP TEXP 3PH 60HZSpeed Reducer Assembly: 160:1 Ratio
Performance MonitoringThe actual performance of the screening process is measured subjectively throughobservation. The operator should expect to find the usual amount and particle size ofscreenings in the receptacle. This will change some with influent flow changes. Screening
performance can also be inferred by looking for the presence of objects in other parts of theplant that should have been captured by the Auger Monster.
Control ParametersThe CDD screen/grinder assembly runs continuously. The signal for activation of thescreen/auger assembly comes from a programmable 24 hour timer or the high level float, or acombination of both.
When the control unit receives a RUN signal, the spiral starts a complete working cycleand stops again when the timer times out.
If the channel water level does not decrease after this working cycle and the water level in frontof the screen/auger assembly continues to increase, the spiral starts a continuous run modeuntil the water level in front of the screen/auger assembly is below the high float set point.
For protection from high current conditions (auger jam) the control unit has an electroniccurrent overload sensor that stops the spiral forward rotation and then reverses rotation for halfa revolution. It then returns to normal forward operation if jam is cleared. If the jam conditiondoes not clear the controller goes into stop mode, the auger run relay is de-energized and afail indicator light is energized and an alarm is generated.
Alternate Modes of OperationManual operation, in the event of failure or major maintenance the screen may be by-passedand flow diverted to the manual bar rack channel.
Relation to Other Process UnitsFailure to provide proper screening will have a detrimental effect on downstream mechanicalequipment. Ragging of cables, impellers and other equipment will increase maintenanceactivities and could affect mixing and oxygen transfer.
SafetyBefore performing any maintenance or repairs to the equipment, personnel should review allgoverning Safety policies in effect. Note that the material handled by the equipment may comeunder the classification "Bio-hazardous material ". Additionally, the equipment can becontrolled by remote controls, and can start automatically at any time. Follow the established“Lock out Tag out” procedures to isolate the equipment and prevent automatic starts, prior toperforming any work on the equipment.
In general, the following safety precautions must be observed:
Ensure that persons cannot be put at risk when working on or in the machine. Before performing any maintenance, the power must be locked out to the main control
panel.
Follow the local “lock out – tag out” procedure to make sure there is no possibility of theequipment starting, or being connected back to power until all necessary work isperformed.
Only trained personnel should be allowed to make adjustments or repairs on any part ofthe electrical system.
Protective covers and guards may be removed only after the power has beendisconnected. All protective covers and guards must be in place before operating theequipment.
Do not attempt any repairs or adjustments while the machine is in operation.
UPCP: Influent ScreeningPlant: Mendenhall WWTPAuthor: CJ SchneiderDate: November 2014
Summary- Grit RemovalInfluent grit removal is provided at the head-works of the facility with the purpose ofremoving grit and other inorganic debris that may travel through the sewer system. Afterscreenings removal, the grit is separated, dewatered and conveyed into a roll off bin fordisposal.
The main objective of grit removal is to:
Protect moving and mechanical equipment from abrasion and accompanying
abnormal wear.
Reduce clogging in pipes.
Prevent grit accumulations in SBR and sludge basins.
Process Overview – TeacupsTM and Grit SnailTM
Flows from the raw wastewater pump station wet well are pumped into the grit removalsystem head box where the pretreatment process is initiated. From the head box, liquidflows by gravity through the grit removal system and then into the secondary treatmentprocess.
The pretreatment system consists of:
Grit separation
Grit dewatering
Grit collection and disposal
The grit system head box provides hydraulic head and distributes flow to the three gritremoval units (Fluidyne TeaCupsTM). The units operate simultaneously during all flowconditions.
To separate grit from the wastewater, inflow is introduced into the units upper chambercausing the fluid mass to rotate. This rotation induces a centrifugal force which propelsdiscrete particles away from the center, towards the tank wall. At the tank wall, particlessettle towards the bottom (grit discharge area) where they are discharged to the gritdewatering unit (Eutek Grit SnailTM) where it is conveyed to a hopper and disposed of.
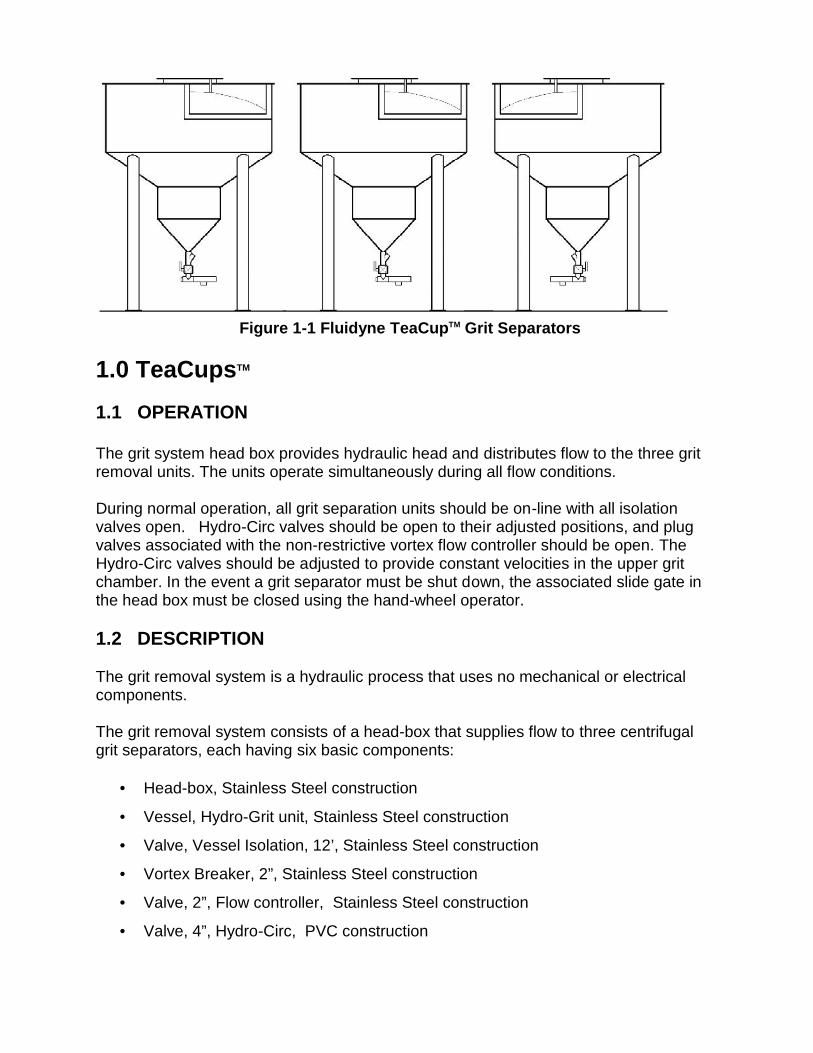
Figure 1-1 Fluidyne TeaCupTM Grit Separators
1.0 TeaCupsTM
1.1 OPERATION
The grit system head box provides hydraulic head and distributes flow to the three gritremoval units. The units operate simultaneously during all flow conditions.
During normal operation, all grit separation units should be on-line with all isolationvalves open. Hydro-Circ valves should be open to their adjusted positions, and plugvalves associated with the non-restrictive vortex flow controller should be open. TheHydro-Circ valves should be adjusted to provide constant velocities in the upper gritchamber. In the event a grit separator must be shut down, the associated slide gate inthe head box must be closed using the hand-wheel operator.
1.2 DESCRIPTION
The grit removal system is a hydraulic process that uses no mechanical or electricalcomponents.
The grit removal system consists of a head-box that supplies flow to three centrifugalgrit separators, each having six basic components:
Head-box, Stainless Steel construction
Vessel, Hydro-Grit unit, Stainless Steel construction
Valve, Vessel Isolation, 12’, Stainless Steel construction
Vortex Breaker, 2”, Stainless Steel construction
Valve, 2”, Flow controller, Stainless Steel construction
Valve, 4”, Hydro-Circ, PVC construction
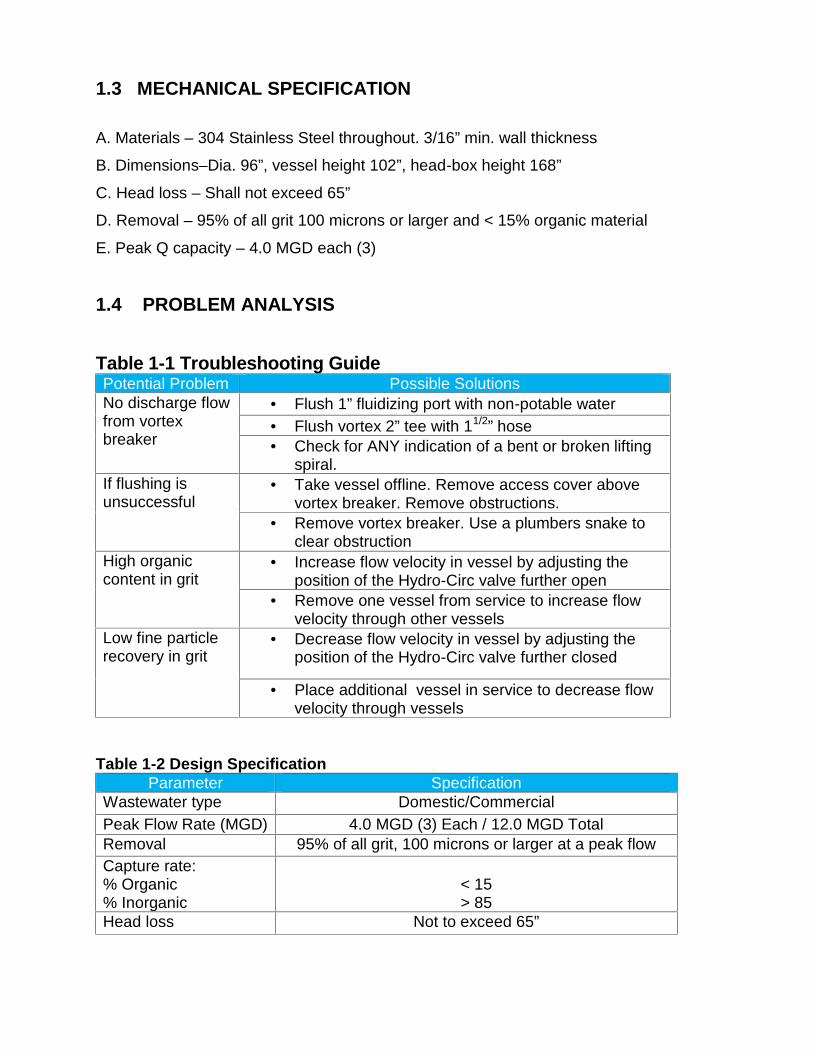
1.3 MECHANICAL SPECIFICATION
A. Materials – 304 Stainless Steel throughout. 3/16” min. wall thickness
B. Dimensions–Dia. 96”, vessel height 102”, head-box height 168”
C. Head loss – Shall not exceed 65”
D. Removal – 95% of all grit 100 microns or larger and < 15% organic material
E. Peak Q capacity – 4.0 MGD each (3)
1.4 PROBLEM ANALYSIS
Table 1-1 Troubleshooting GuidePotential Problem Possible SolutionsNo discharge flowfrom vortexbreaker
Flush 1” fluidizing port with non-potable water Flush vortex 2” tee with 11/2” hose Check for ANY indication of a bent or broken lifting
spiral.If flushing isunsuccessful
Take vessel offline. Remove access cover abovevortex breaker. Remove obstructions.
Remove vortex breaker. Use a plumbers snake toclear obstruction
High organiccontent in grit
Increase flow velocity in vessel by adjusting theposition of the Hydro-Circ valve further open
Remove one vessel from service to increase flowvelocity through other vessels
Low fine particlerecovery in grit
Decrease flow velocity in vessel by adjusting theposition of the Hydro-Circ valve further closed
Place additional vessel in service to decrease flowvelocity through vessels
Table 1-2 Design SpecificationParameter Specification
Wastewater type Domestic/CommercialPeak Flow Rate (MGD) 4.0 MGD (3) Each / 12.0 MGD TotalRemoval 95% of all grit, 100 microns or larger at a peak flowCapture rate:% Organic% Inorganic
< 15> 85
Head loss Not to exceed 65”
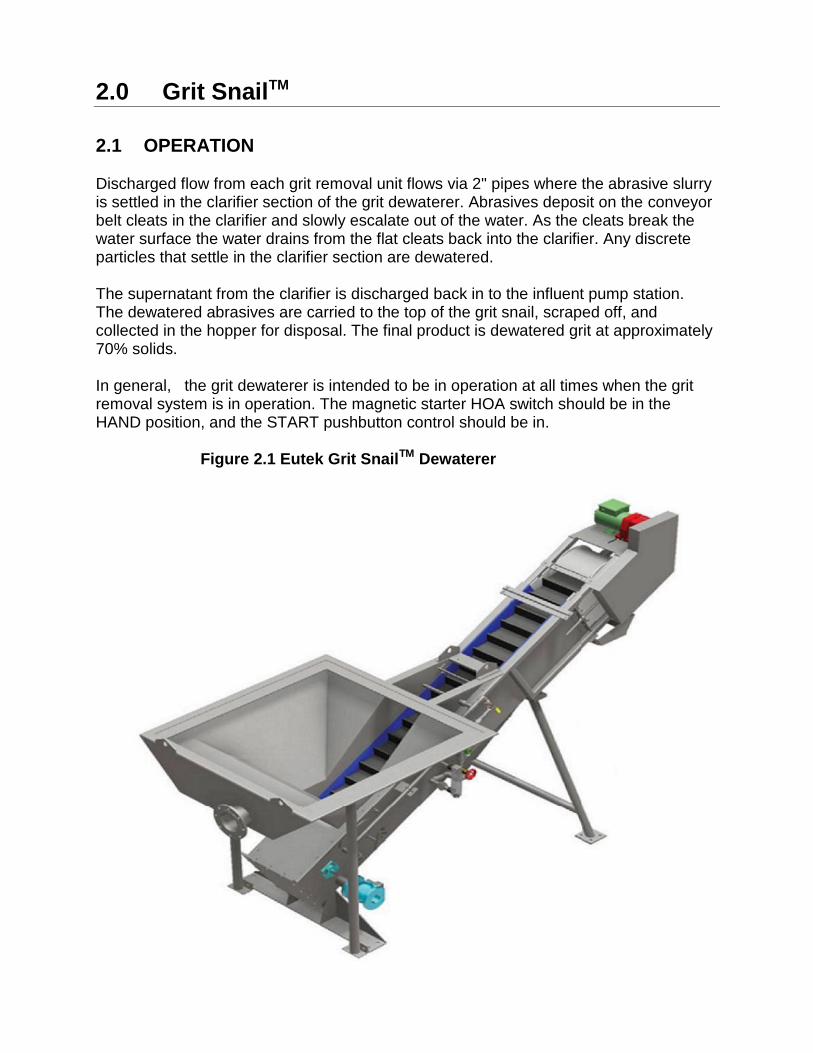
2.0 Grit SnailTM
2.1 OPERATION
Discharged flow from each grit removal unit flows via 2" pipes where the abrasive slurryis settled in the clarifier section of the grit dewaterer. Abrasives deposit on the conveyorbelt cleats in the clarifier and slowly escalate out of the water. As the cleats break thewater surface the water drains from the flat cleats back into the clarifier. Any discreteparticles that settle in the clarifier section are dewatered.
The supernatant from the clarifier is discharged back in to the influent pump station.The dewatered abrasives are carried to the top of the grit snail, scraped off, andcollected in the hopper for disposal. The final product is dewatered grit at approximately70% solids.
In general, the grit dewaterer is intended to be in operation at all times when the gritremoval system is in operation. The magnetic starter HOA switch should be in theHAND position, and the START pushbutton control should be in.
Figure 2.1 Eutek Grit SnailTM Dewaterer
2.2 MECHANICAL SPECIFICATION
GRIT DEWATERING ESCALATOR BELT
The grit dewatering belt is 12” wide, aluminum reinforced neoprene, hinged type, with 3-3/8” x 4-9/16" cleats vulcanized on 3/16" two-ply polyester reinforced continuousconductor belting. Head and tail rolls are of 304 stainless steel. The 1/4" lagged headroll is designed for adjustable take-up without affecting the head roll retainer plate,scraper, or drive unit adjustment. The tail roll mounts internally to the Grit DewateringEscalator belt housing with external sealed bearings. The belt clears is made of molded60 Durometer neoprene construction, aluminum reinforced, with minimum 5/32" thickneoprene hinge.
HEAD ROLL, RETAINER PLATE AND SCRAPER
The Grit Dewatering Escalator is provided with a head roll scraper having 1/4" thickHDPE contact surfaces and a 1/4" thick HDPE retainer plate. Both retainer plate andscraper is loaded to keep cleats closed tight around head roll during operation.
SELF-CLEANING TAIL ROLL MECHANISM
The belt cleats are neoprene hinged with fulcrums to provide at least 1" cleat openingwhen rotated about the tail roll. 2" openings are provided in the Grit DewateringEscalator belt to allow transfer of fine solids internal to the belt to the underside of eachcleat. The tail roll is fitted with a scraper which also functions as an internal belt scraper.
GRIT DEWATERING ESCALATOR BELT HOUSING AND CLARIFIER
The belt housing is constructed of .135" thick 304 stainless steel. The housing has acleanout plate and drain in the tail roll end and discharge at the head end. The housingis fitted with a 48” square clarifier with walls sloping 45 degrees from the horizontal. Theclarifier has 3" of free board at design flow. The clarifier is fitted with an 42” overflowweir with a 6” (40) discharge pipe opposite the belt discharge. Surfaces are beadblasted.
DRIVE UNIT
The drive is a helical gear reducer with hardened alloy steel gears accurately cut toshape. The housing is steel or case iron and is oil tight. Bearings is ball or roller typeanti-friction throughout.
The motor is 1/3 HP, 460 VAC 60 Hz. 3-Phase NEMA Design B, TEFC with a 1.15 S.F.which in turn is mounted integrally with the helical reducer above. The motor speed isselectable by adjusting a VFD output. Complete unit is treated for severe outdoor dutyand shall have epoxy treated windings.
CONTROLS
The operating controls provides for manual operation. They consist of a magneticstarter with a HAND-OFF automatic selector switch with cover and a separate STOP-START push-pull button station. All controls are in NEMA type 4 cases. The belt is ONwhenever grit slurry is being transported to it.
BOLTS
All assembly and anchor bolts are 304 stainless steel.
2.3 PROBLEM ANALYSIS
GRIT SNAIL™ TROUBLESHOOTING G U I D E
To ensure trouble-free operation, the EUTEK SYSTEMS GRIT SNAIL™ requires aregular maintenance program. The following step-by-step guide should be used f o r( a) routinely troubleshooting GRIT SNAIL™ as part of a regular maintenanceprogram, (b) pinpointing the cause of a slipping belt, or (c) pinpointing the cause ofa cleat or belt failure. See the attached drawings to identify components referencedby bold numbers in parentheses.
1. Investigate the normal operation of the GRIT SNAIL™. Does it run continuously? If not,how long does it run before and after each grit blowdown? THE GRIT SNAIL™
MUST BE RUNNING BEFORE GRIT ENTERS THE CLARIFIER (1). Otherwise, thebelt will be under a tremendous load if the GRIT SNAILTM tries to start with gritpacked in the clarifier. After flow to the GRIT SNAILTM stops, the belt must rununtil there is no more grit on the cleats (approximately 15-30 minutes). If grit isnot removed, the belt will be under excess tension the next time it is started.
2. If the belt stops or the GRIT SNAILTM must be shut down during operation, manuallyremove as much grit as possible from the GRIT SNAILTM belt and clarifier first. DONOT MAKE ANY ADJUSTMENTS WITH GRIT IN THE CLARIFIER. .
3. Next, check the wall-to-wall clearance in the belt housing FIGURE 2-2 (2) from thehead roll to the tail roll. You should be able to lift up each cleat slightly. If youcannot, the belt may be operating under too much tension. Make sure that thehead roll is square with the head roll take-up frame and with the belt housing. Ifnot, the head roll could pull the belt to one side and cause excess tension. Adjustthe head roll bearings and shaft as necessary.
4. The grit leveler FIGURE 2-2(3) is the piece of HDPE that levels the grit off to the topof each cleat. Is the grit leveler adjusted so that it just clears the tops of thecleats? If there is more clearance than this, it will leave too much grit on the cleats,which can overload the belt. If the leveler pulls on the cleats excessively, it coulddamage them after a long period of time. Adjust the grit leveler as necessary.

5. To check the head roll retainer adjustment FIGURE 2-2 (4), remove thecircular HDPE head roll skirts and inspect the full travel of each cleat aroundthe head roll with the belt running.
a. When the cleats enter the retainer, are the cleats compressed between theretainer and the head roll? If so, use stainless steel washers to shim the screwsthat bolt the retainer to the take-up frame until the retainer gently closes thecleats FIGURE 2-2(4). To prevent from springing out of position, only loosen one sideof the retainer at a time.
b. Make sure the cleats cannot flop open away from the belt. If so, the cleatscould flop open as they go around the head roll, allowing grit to accumulate underthem. This condition would also cause grit to build up inside the GRIT SNAILTM infront of the internal scraper. Adjust the 4 ea. 1/2” threaded rods as necessaryFIGURE 2-3 (4B).
c. Make sure that the retainer does not hold the cleats against the belt too tightly.This could rip cleats off as they enter the retainer or compress cleats between theretainer and the head roll. Adjust the 4 ea. 1/2" threaded rods as necessaryFIGURE 2-3 (4C).
6. If cleats are still compressed as they enter the retainer, check the location of the pillowblock bearings FIGURE 2-3 (5) that support the head roll. If the bolts holding thebearings are loose, the bearings could shift out of place. If necessary, relocate thebearings evenly until the retainer gently closes the cleats. For reference, this dimensionis nominally 8- 3/16" to the center of the bearings.
7. Check the head roll scraper FIGURE 2-2 (6) to see if it has been catching cleats. Cleanthe grit off the scraper. Does it hit the cleats violently? Is its HDPE bent toward the tailroll? If either of these are true, the scraper may have too many counterweightsattached. This could cause the belt to slip or the scraper to "hook" the cleats andeventually rip them off the belt. There should be only enough counterweights to scrapethe cleats clean. Remove or add counterweights as necessary.
8. To inspect the internal scraper, drain the clarifier and remove both access coverplates FIGURE 2-2(7). A reversed cleat would cause a hump in the belt that couldget jammed under the internal scraper. Grit building up under the cleats (visiblethrough the 2"Ø holes in the belt) could also cause cleats to jam under the internalscraper FIGURE 2-4. Check for any humps in the belt all the way up the belt housing.Also, make sure there are no large pieces of debris that could jam the belt. If there are,maintenance and inspection schedules should be increased to deal with this potentiallyserious problem.
9. Check the clearance between the internal scraper and the tail roll inside the FIGURE 2-2(8A). There should be about 1/16" clearance between the top edge of the internalscraper and the tail roll FIGURE 2-4 (8B). If the tail roll rubs on the internal scraper, theextra tension could cause the belt to slip. Loosen the (6) bolts holding the internalscraper in place and try to move it slightly. If this does not help, remove the flangebearings holding the tail roll shaft. Replace the HDPE press fit bushings FIGURE 2-4(8C) if they are worn to properly relocate the tail roll.
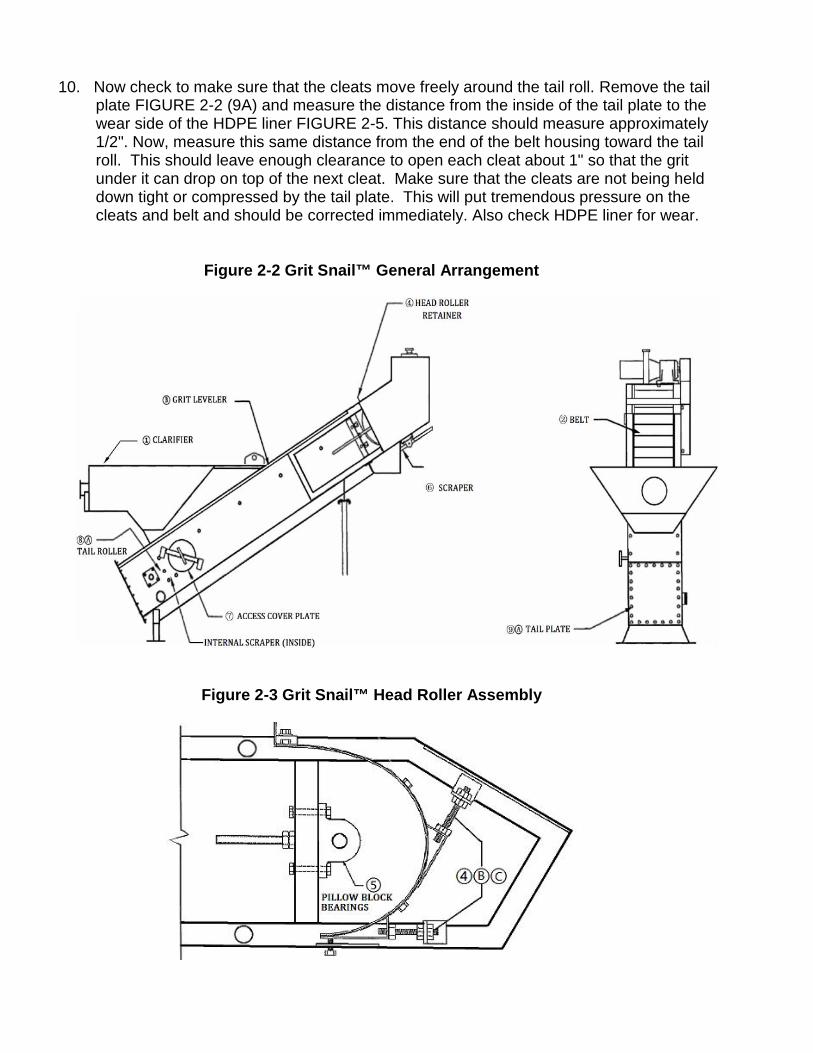
10. Now check to make sure that the cleats move freely around the tail roll. Remove the tailplate FIGURE 2-2 (9A) and measure the distance from the inside of the tail plate to thewear side of the HDPE liner FIGURE 2-5. This distance should measure approximately1/2". Now, measure this same distance from the end of the belt housing toward the tailroll. This should leave enough clearance to open each cleat about 1" so that the gritunder it can drop on top of the next cleat. Make sure that the cleats are not being helddown tight or compressed by the tail plate. This will put tremendous pressure on thecleats and belt and should be corrected immediately. Also check HDPE liner for wear.
Figure 2-2 Grit Snail™ General Arrangement
Figure 2-3 Grit Snail™ Head Roller Assembly

Figure 2-4 Grit Snail™ Tail Roller
Figure 2-5 Grit Snail™ Tail Plate

Performance Monitoring
The actual performance of the Grit Removal process is measured subjectively throughobservation. The operator should expect to find the usual amount of grit in the hopper.This will change some with influent flow changes. Grit removal performance can also beinferred by looking for the presence of heavy inorganics in other parts of the plant thatshould have been captured by the TeaCupsTM.
Control Parameters
The TeaCupsTM are designed to be operated continuously and should only need to beremoved from service for repair or to remove oversized obstruction. One of three unitsmay be taken off-line at a time and still accommodate normal influent flows. If theTeaCupTM needs to be serviced for any extended period of time it should be isolated atthe headbox inlet valve, to prevent excessive accumulations from plugging thedischarge end of the unit.
The Grit SnailTM unit is designed for continuous operation. Flow to the unit should beisolated or rerouted from the clarifier portion to prevent excessive accumulations of gritover loading the unit when re-energized. The best practice for bypassing the clarifier isto route the discharge hoses back to the Influent Pump Station wet well using a 6”collapsible hose.
Safety
Before performing any maintenance or repairs to the equipment, personnel shouldreview all governing Safety policies in effect. Note that the material handled by theequipment may come under the classification "Bio-hazardous material ". Additionally,the equipment are be controlled by remote controls, and can start automatically at anytime. Follow the established “Lock out Tag out” procedures to isolate the equipment andprevent automatic starts, prior to performing any work on the equipment.
Caution, the Grit SnailTM can start automatically and have multiple sources of hazardousenergy!
In general, the following safety precautions must be observed:
Ensure that persons cannot be put at risk when working on or in the machine.
Before performing any maintenance, the power must be turned off to the maincontrol panel.
Follow your local “lock out – tag out” procedure to make sure there is nopossibility of the equipment starting, or being connected back to power until allnecessary work is performed.
Only trained electricians should be allowed to make adjustments or repairs onany part of the electrical system.
Protective covers and guards may be removed only after the power has beendisconnected.
All protective covers and guards must be in place before operating theequipment.
Do not attempt any repairs or adjustments while the machine is in operation.
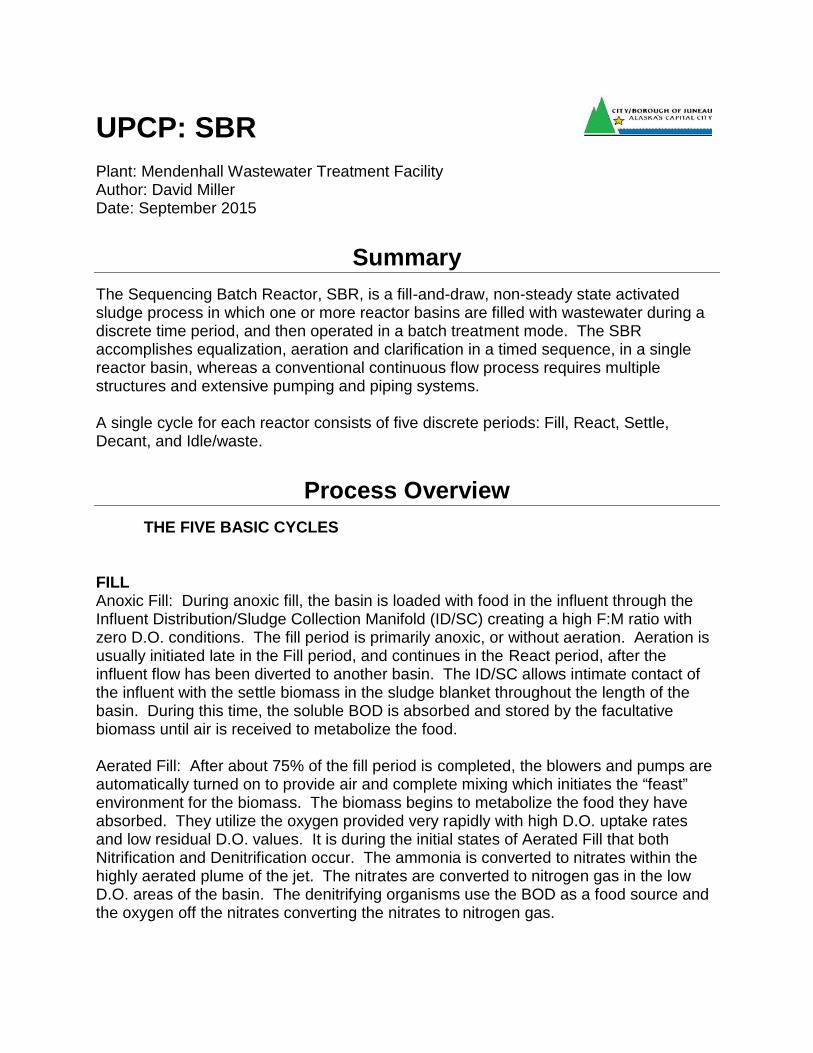
UPCP: SBRPlant: Mendenhall Wastewater Treatment FacilityAuthor: David MillerDate: September 2015
SummaryThe Sequencing Batch Reactor, SBR, is a fill-and-draw, non-steady state activatedsludge process in which one or more reactor basins are filled with wastewater during adiscrete time period, and then operated in a batch treatment mode. The SBRaccomplishes equalization, aeration and clarification in a timed sequence, in a singlereactor basin, whereas a conventional continuous flow process requires multiplestructures and extensive pumping and piping systems.
A single cycle for each reactor consists of five discrete periods: Fill, React, Settle,Decant, and Idle/waste.
Process OverviewTHE FIVE BASIC CYCLES
FILLAnoxic Fill: During anoxic fill, the basin is loaded with food in the influent through theInfluent Distribution/Sludge Collection Manifold (ID/SC) creating a high F:M ratio withzero D.O. conditions. The fill period is primarily anoxic, or without aeration. Aeration isusually initiated late in the Fill period, and continues in the React period, after theinfluent flow has been diverted to another basin. The ID/SC allows intimate contact ofthe influent with the settle biomass in the sludge blanket throughout the length of thebasin. During this time, the soluble BOD is absorbed and stored by the facultativebiomass until air is received to metabolize the food.
Aerated Fill: After about 75% of the fill period is completed, the blowers and pumps areautomatically turned on to provide air and complete mixing which initiates the “feast”environment for the biomass. The biomass begins to metabolize the food they haveabsorbed. They utilize the oxygen provided very rapidly with high D.O. uptake ratesand low residual D.O. values. It is during the initial states of Aerated Fill that bothNitrification and Denitrification occur. The ammonia is converted to nitrates within thehighly aerated plume of the jet. The nitrates are converted to nitrogen gas in the lowD.O. areas of the basin. The denitrifying organisms use the BOD as a food source andthe oxygen off the nitrates converting the nitrates to nitrogen gas.
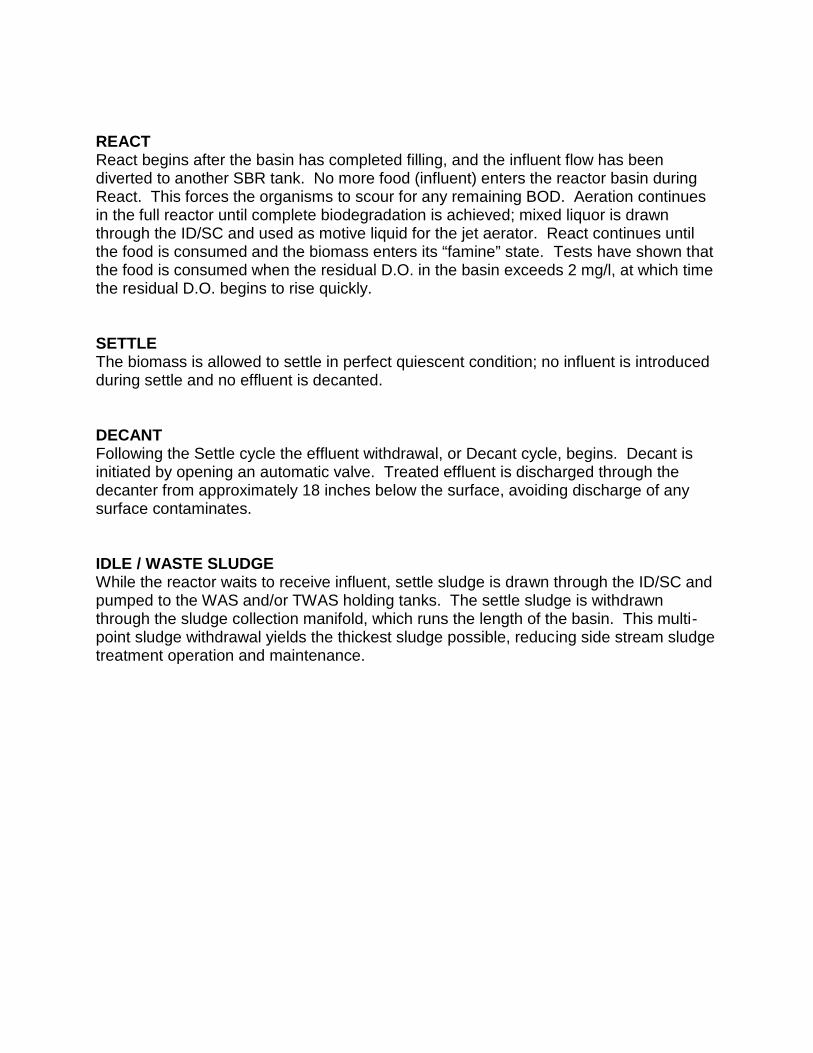
REACTReact begins after the basin has completed filling, and the influent flow has beendiverted to another SBR tank. No more food (influent) enters the reactor basin duringReact. This forces the organisms to scour for any remaining BOD. Aeration continuesin the full reactor until complete biodegradation is achieved; mixed liquor is drawnthrough the ID/SC and used as motive liquid for the jet aerator. React continues untilthe food is consumed and the biomass enters its “famine” state. Tests have shown thatthe food is consumed when the residual D.O. in the basin exceeds 2 mg/l, at which timethe residual D.O. begins to rise quickly.
SETTLEThe biomass is allowed to settle in perfect quiescent condition; no influent is introducedduring settle and no effluent is decanted.
DECANTFollowing the Settle cycle the effluent withdrawal, or Decant cycle, begins. Decant isinitiated by opening an automatic valve. Treated effluent is discharged through thedecanter from approximately 18 inches below the surface, avoiding discharge of anysurface contaminates.
IDLE / WASTE SLUDGEWhile the reactor waits to receive influent, settle sludge is drawn through the ID/SC andpumped to the WAS and/or TWAS holding tanks. The settle sludge is withdrawnthrough the sludge collection manifold, which runs the length of the basin. This multi-point sludge withdrawal yields the thickest sludge possible, reducing side stream sludgetreatment operation and maintenance.
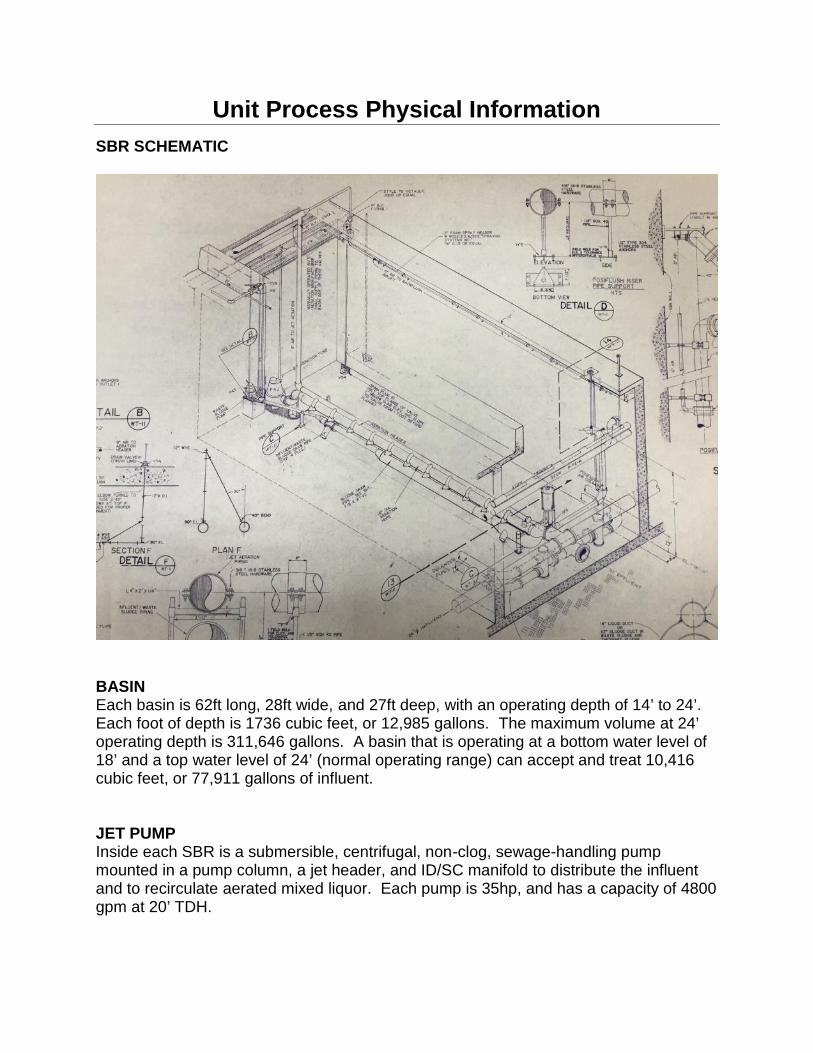
Unit Process Physical InformationSBR SCHEMATIC
BASINEach basin is 62ft long, 28ft wide, and 27ft deep, with an operating depth of 14’ to 24’.Each foot of depth is 1736 cubic feet, or 12,985 gallons. The maximum volume at 24’operating depth is 311,646 gallons. A basin that is operating at a bottom water level of18’ and a top water level of 24’ (normal operating range) can accept and treat 10,416cubic feet, or 77,911 gallons of influent.
JET PUMPInside each SBR is a submersible, centrifugal, non-clog, sewage-handling pumpmounted in a pump column, a jet header, and ID/SC manifold to distribute the influentand to recirculate aerated mixed liquor. Each pump is 35hp, and has a capacity of 4800gpm at 20’ TDH.
WASTE PUMPLocated on a concrete pedestal next to the jet pump is a dedicated waste sludge pumpconnected to a PVC manifold to collect and waste sludge. Each waste pump is a 15 hpsubmersible, centrifugal, non-clog, sewage-handing pump with a capacity of 900 gpm at40’ TDH.
DECANTERSEach basin has one decanter with an average capacity of 4800 gpm. The draw tube onthe decanter is suspended approximately 18” beneath the surface by a foam filled floatassembly to avoid entraining floating objects, scum or foam in the effluent. Eachdecanter uses 28 spring loaded solids excluding valves which are actuated by statichead differential upon the opening of a valve located outside the basin. The decanter isable to pivot according to the water level by use of a hinged knee brace assembly andby a ductile iron elbow and spool. There is a floor mounted decanter rest whichsupports the decanter when a basin is empty.
DEPTH OF BLANKET POLES (DOB Poles)A DOB pole is a sludge measuring device used to keep track of the depth of the settledsludge within an SBR basin. The sludge should never be closer than 4’ to the bottomwater level at the end of the decant cycle. This insures that solids will not be withdrawnwith the clarified supernatant.
WATER LEVEL RADARAt each basin a VEGA PULS, model 51K water level radar is mounted on the air headerabove the tank approx. 4 ½ feet above grading. A signal is sent to the SCADA and athe water level in each basin is displayed in real time on a monitor in the Control Room.
D.O. PROBESEach basin utilizes a Membrane Electrode DO probe mounted on the safety railing at adepth of 16’ in the basin. The electrode is attached to display interface next to the basinwhich also shows the temperature in centigrade. The DO is displayed in real time onthe SCADA, both in a current reading and in a profile.
BLOWERSEach basin has a dedicated Gardner-Denver brand blower capable of delivering 1260cfm and each blower is housed in a room between the East and West basin rooms.

SCADASupervisory Control And Data Acquisition, or SCADA is a means by which the Operatorcan set parameters such as Top and Bottom water levels, Aeration, Settle, and Wastingtimes; place valve actuators and blowers in hand or auto mode, and basically monitormost all functions of the basins.
The MWWTF utilizes a SCADA application call InTouch. This is a Graphical UserInterface with many screens that shows a wide variety of data. Below are screen shotsof the most commonly viewed screens used for Process Control.

Operational and Control ParametersExperience has shown that there are standard parameters for various set points undernormal loading and operational conditions that seem to work best for consistent andhigh quality treatment. These standard set points are as follows:
Parameter Min Max UnitTop Water Level N/A 24 FeetBottom Water Level N/A 19 FeetReact Time 90 100 MinutesSettle Time 80 100 MinutesTarget MLSS – Summer 1800 2000 mg/LTarget MLSS – Winter 2000 2200 mg/LOdd/Even Effluent Valves 3600 4500 gpmD.O. Profile 0 100 PercentageMaximum Fill time N/A 180 MinutesMaximum Decant N/A 30 MinutesSettle Prep 2 15 Minutes
Intouch is a user interface computer application by which the Operator can manipulatethe parameters described above. However, during high flow events, the SCADAapplication may reduce React times to keep up with the flow. The Operator may needto adjust parameters to balance time and space within each basin to prevent or reducethe SCADA from sending each basin directly into Settle mode after filling with rawinfluent.
Top Water Level, TWLThe TWL is the level at which the basin is filled with influent before going into React.This Level can be set anywhere between 0 and 25 feet but under normal operatingconditions is set at 24 feet. The TWL is rarely set below 21 feet; and usually only toprevent foaming overflows.
Bottom Water Level, BWLThe BWL can be set anywhere between 0 and 25 feet but under normal operation is setat 19 feet. Under no circumstance should the BWL be set below 14ft as the decanterrest is at 12ft and any set point below 14 feet will cause scum to be discharged toreceiving waters.
React TimeReact times are set predicated on flow to the plant. A minimum and maximum Reacttime is set in the user interface, usually with a difference of 10 minutes and undernormal operating flows the SCADA will not allow the React time to fall below theminimum set point. However, under high flow conditions the SCADA will override this
minimum React set point if necessary to keep up with the flows. The maximum setpoint is there to allow additional React time when flows are low. This is to allowadditional treatment of the wastewater.
Settle TimeUnder normal operational flows the settle time should be set to provide a good, compactsettled sludge and so that a DOB pole reading is 10+ feet near the end of the settletime. Less time cause a washout of solids in the effluent creating a possible permitviolation, and too low a settle time can create a less compact waste sludge making itnecessary to waste more volume to achieve the same poundage.
Target MLSS for Summer and WinterKeeping a constant ML concentration, along with a constant sludge age is ideal formaintaining a steady state environment for the microbial bacteria. Summer MLSSconcentrations are typically set 200 to 400 mg/L lower than Winter MLSSconcentrations due to the higher activity of the “bugs” during warmer weather.
Odd/Even Effluent ValvesThis parameter is set with two factors to consider: (1) contact time of the effluent withthe UV Lamps for effective disinfection, and (2) the time it takes to decant the effluent.For obvious reasons, factor one is most important. Factor two is also important in thatspace and time are both critical for good treatment. In essence, Decant time takesaway from time that could be spent in React and Settle.
D.O. ProfilesD.O. Profiles can be set in stages of time throughout the React cycle based on apercentage of blower output -OR- Set to maintain a DO of predefined set point. Ideallyyou want to maintain a DO no higher than one mg/L once the demand has beensatisfied.
Maximum Fill TimeA maximum fill time is set in the SCADA which allows the basin in Fill mode to move tothe next cycle (React) should this setting be reached. This setting allows the plant tocontinue operation should there be a malfunction within the basin that is currently in Fillcycle.
Maximum Decant timeA maximum decant time is set in the SCADA which allows the basin in Decant to moveto the next cycle (Idle/Waste) should this setting be reached. This setting allows theplant to continue operation should there be a malfunction within a decanting basin.

Settle PrepSettle Prep is an intermediate stage between React and Settle whereby the blowersupplying air to the basin is turned off while the jet pump remains on. The theory forthis being to release any entrained air in the floc so that during the Settle stage thesludge will settle and not “pop”. Settle Prep can be set between 2 and 15 minutes.
Process Monitoring and Responsibilities
The Process Control Bench Sheet is used daily for documenting information such as MLconcentrations in mg/L; 30 minute SSVs; SVIs; Spins; pH; Temp; DOB readings; andNTUs, on all active basins.
Other information such as that day’s TWL; BWL; Settle and React times; Target MLSS;Target SRT; the previous day’s waste amount; Effluent composite sampler set point;Influent/Effluent in MGD; max NTU’s; and treatment cycles are also logged.
The information collected and documented on the Process Control Bench Sheet islogged into a spreadsheet for which graphs can be created for comparison andinvestigation.

WASTING RATES
Wasting rate is an essential control in every activated sludge plant. It affects sludgeage, ratio of loading to biology, and biology characteristics. The Mendenhall plant’sdesign information indicates that at design loading, the intended f/m is 0.15, the designSRT would be 7.67 days, and the MLSS will be 2,200mg/L. When not at full loading, wecan run with a higher SRT to reduce “yield” and provide greater stabilization of solids.
To determine WAS rates we can use a modified version of SRT. To establish wastingwe start with calculation of inventory. If we select say, a 10 day target SRT, we need towaste 1/10th of the inventory each day. The calculation looks like this:
Pounds per day to waste = (7cells)(0.311650 MG/cell)(average MLSS)(8.34)Desired SRT
Gallons per day to waste = (Pounds per day to waste)(1000000)(WASSS)(8.34)
Minutes per cycle to waste = ___________Gallons per day to waste__________(number of SBR cycles per daily wasting period)(1200 gal/min)
Common Problems and TroubleshootingE-STOPSWaste and/or Jet pump fails to turn on.Most likely cause is accidentally bumping the e-stop which will disrupt power to thepump. Should this happen and a pump be called into service after hours it will trigger acall-out.
MERCURY HIGH FLOAT SWITCHESThese switches are located in each basin near one corner. The switch is used toprevent the tank from overfilling and flooding the catwalk and other basins with rawinfluent.The switches can and do fail, mostly due to worn wires and failure of the internalmercury switch housed within the float.A preventative maintenance work order to test each individual switch is printed andperformed once a month. To test the switch, manually lift the float above high waterlevel during static fill. This should cause the influent gate to close. If not, the switch willhave to be replaced.
WATER LEVEL RADARErroneous water level detection; can be caused by radar locking in on an object such asa ball of rags or on foam. A quick fix to radar lock is to hose the water directly under theradar. This will break the lock and allow the reading to return to normal.
DEBRIS CAUGHT IN DECANTER POCKET VALVESCausing mixed liquor to escape during react; could cause high NTUs and a possibleviolation. Pocket valves must be inspected at least yearly during the regularlyscheduled basin entry for cleaning and repair.
AIR LEAKSThe influent gate in each basin is controlled by an actuator valve. Air is suppliedallowing the gate to open or close. These air lines are subject to corrosion andaccidental damage caused when cleaning rags and debris from them. Air lines shouldbe inspected at least yearly during the regularly scheduled basin entry for cleaning andrepairs, or when an air leak is detected.
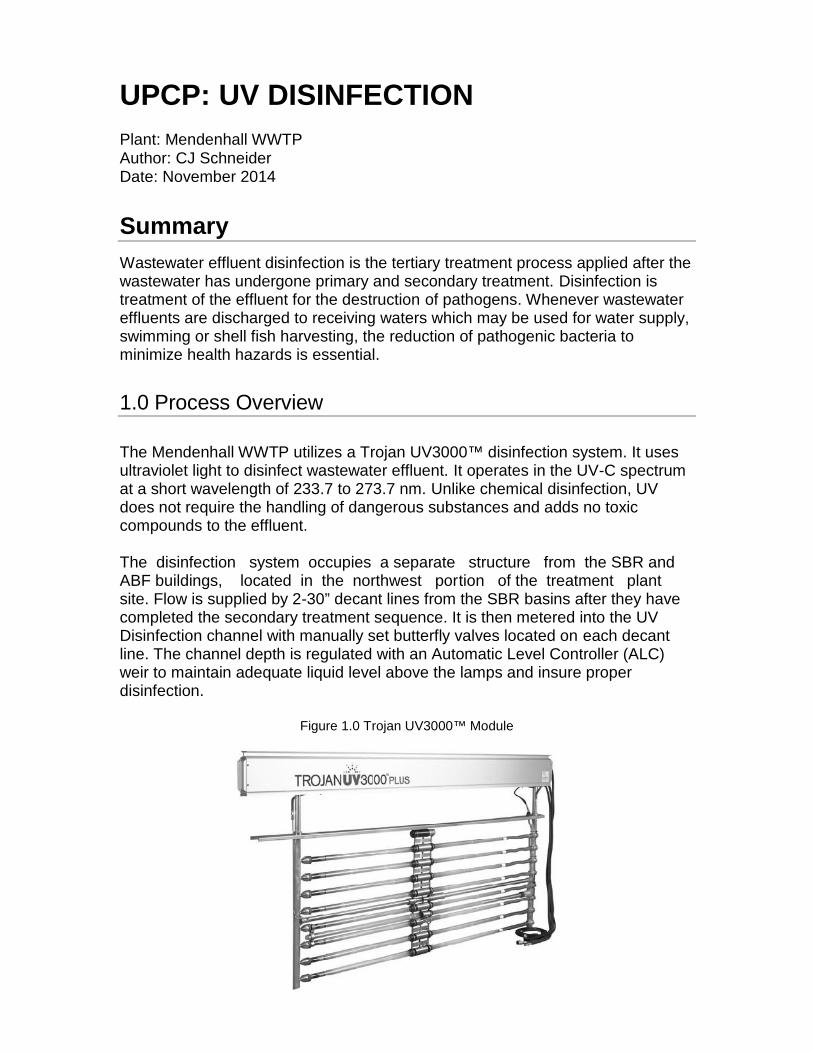
UPCP: UV DISINFECTIONPlant: Mendenhall WWTPAuthor: CJ SchneiderDate: November 2014
SummaryWastewater effluent disinfection is the tertiary treatment process applied after thewastewater has undergone primary and secondary treatment. Disinfection istreatment of the effluent for the destruction of pathogens. Whenever wastewatereffluents are discharged to receiving waters which may be used for water supply,swimming or shell fish harvesting, the reduction of pathogenic bacteria tominimize health hazards is essential.
1.0 Process Overview
The Mendenhall WWTP utilizes a Trojan UV3000™ disinfection system. It usesultraviolet light to disinfect wastewater effluent. It operates in the UV-C spectrumat a short wavelength of 233.7 to 273.7 nm. Unlike chemical disinfection, UVdoes not require the handling of dangerous substances and adds no toxiccompounds to the effluent.
The disinfection system occupies a separate structure from the SBR andABF buildings, located in the northwest portion of the treatment plantsite. Flow is supplied by 2-30” decant lines from the SBR basins after they havecompleted the secondary treatment sequence. It is then metered into the UVDisinfection channel with manually set butterfly valves located on each decantline. The channel depth is regulated with an Automatic Level Controller (ALC)weir to maintain adequate liquid level above the lamps and insure properdisinfection.
Figure 1.0 Trojan UV3000™ Module
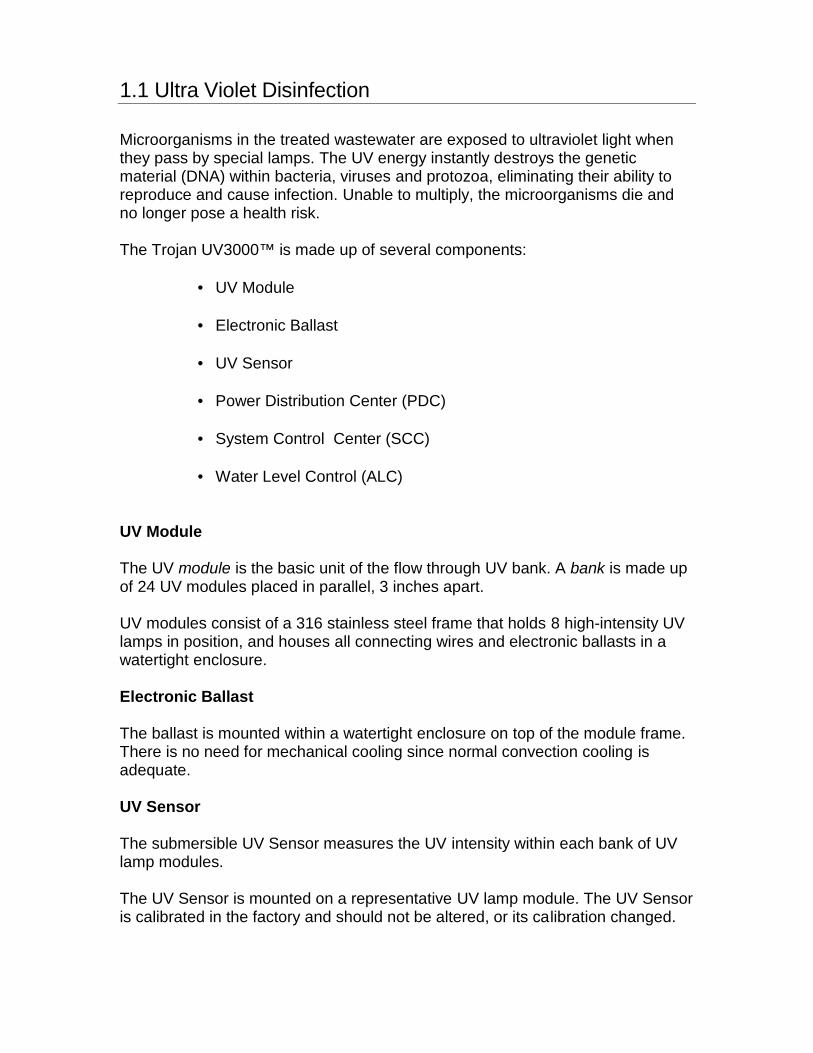
1.1 Ultra Violet Disinfection
Microorganisms in the treated wastewater are exposed to ultraviolet light whenthey pass by special lamps. The UV energy instantly destroys the geneticmaterial (DNA) within bacteria, viruses and protozoa, eliminating their ability toreproduce and cause infection. Unable to multiply, the microorganisms die andno longer pose a health risk.
The Trojan UV3000™ is made up of several components:
UV Module
Electronic Ballast
UV Sensor
Power Distribution Center (PDC)
System Control Center (SCC)
Water Level Control (ALC)
UV Module
The UV module is the basic unit of the flow through UV bank. A bank is made upof 24 UV modules placed in parallel, 3 inches apart.
UV modules consist of a 316 stainless steel frame that holds 8 high-intensity UVlamps in position, and houses all connecting wires and electronic ballasts in awatertight enclosure.
Electronic Ballast
The ballast is mounted within a watertight enclosure on top of the module frame.There is no need for mechanical cooling since normal convection cooling isadequate.
UV Sensor
The submersible UV Sensor measures the UV intensity within each bank of UVlamp modules.
The UV Sensor is mounted on a representative UV lamp module. The UV Sensoris calibrated in the factory and should not be altered, or its calibration changed.

Power Distribution Center (PDC)
The Power Distribution Center spans the width of the effluent channel anddistributes power from the main electrical service to the UV modules in the UVbanks.
Molded connectors connect the UV modules to the PDC by plugging them intothe stainless steel receptacles on the PDC's front panel. The PDC is a stainlesssteel enclosure that is weather resistant. It houses the power distribution bus bar,relay board for each module, and the communication controller board.
The main power service is connected through the electric service entrance powerand distributed through the bus bar. Communications between the PDC andSystem Control Center is via an RS422 Serial Communication Link.
System Control Center (SCC)
The operation of the Trojan UV3000™ is managed by the System Control Center(SCC).
The SCC is a menu-driven workstation that supplies the operator interface to thedisinfection system. It allows the operator to monitor and control all UV systemfunctions.
An alarm reporting system provides the operator with the tools needed foraccurate diagnosis of various system processes and failures.
Water Level Control
An Automatic Level Controller (ALC) device controls the effluent level within theUV channel.
1.2 Operations Overview
The modular design makes it versatile and permits easy access to the equipmentfor routine maintenance and repair.
The system is sized and programmed to meet the MWWTP objectives and permitrequirements. Operation of the system is managed at the System Control Center(SCC) which continuously monitors, controls system functions and sends basicdata to the SCADA control system. The SCC is the brain of UV Disinfectioncontrol system and communicates with the operator interface and UV modules.Meters, switches, and sensors provide the SCC with the necessary systemparameters.
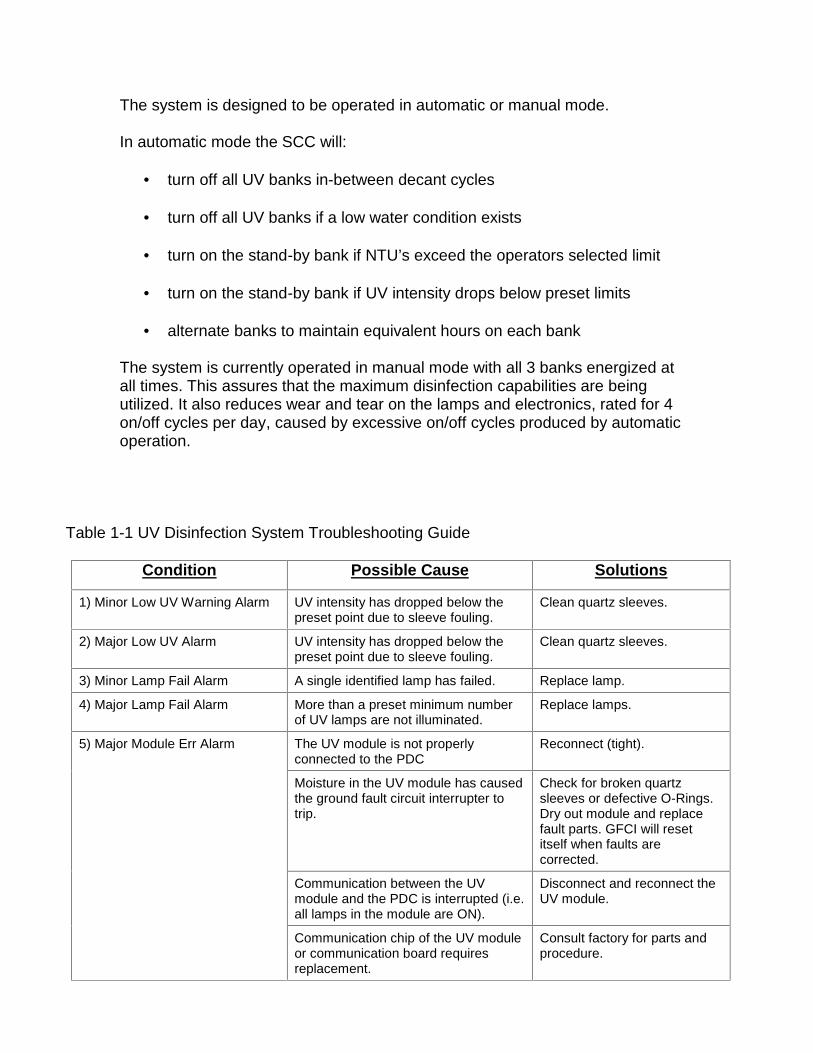
The system is designed to be operated in automatic or manual mode.
In automatic mode the SCC will:
turn off all UV banks in-between decant cycles
turn off all UV banks if a low water condition exists
turn on the stand-by bank if NTU’s exceed the operators selected limit
turn on the stand-by bank if UV intensity drops below preset limits
alternate banks to maintain equivalent hours on each bank
The system is currently operated in manual mode with all 3 banks energized atall times. This assures that the maximum disinfection capabilities are beingutilized. It also reduces wear and tear on the lamps and electronics, rated for 4on/off cycles per day, caused by excessive on/off cycles produced by automaticoperation.
Table 1-1 UV Disinfection System Troubleshooting Guide
Condition Possible Cause Solutions
1) Minor Low UV Warning Alarm UV intensity has dropped below thepreset point due to sleeve fouling.
Clean quartz sleeves.
2) Major Low UV Alarm UV intensity has dropped below thepreset point due to sleeve fouling.
Clean quartz sleeves.
3) Minor Lamp Fail Alarm A single identified lamp has failed. Replace lamp.
4) Major Lamp Fail Alarm More than a preset minimum numberof UV lamps are not illuminated.
Replace lamps.
5) Major Module Err Alarm The UV module is not properlyconnected to the PDC
Reconnect (tight).
Moisture in the UV module has causedthe ground fault circuit interrupter totrip.
Check for broken quartzsleeves or defective O-Rings.Dry out module and replacefault parts. GFCI will resetitself when faults arecorrected.
Communication between the UVmodule and the PDC is interrupted (i.e.all lamps in the module are ON).
Disconnect and reconnect theUV module.
Communication chip of the UV moduleor communication board requiresreplacement.
Consult factory for parts andprocedure.
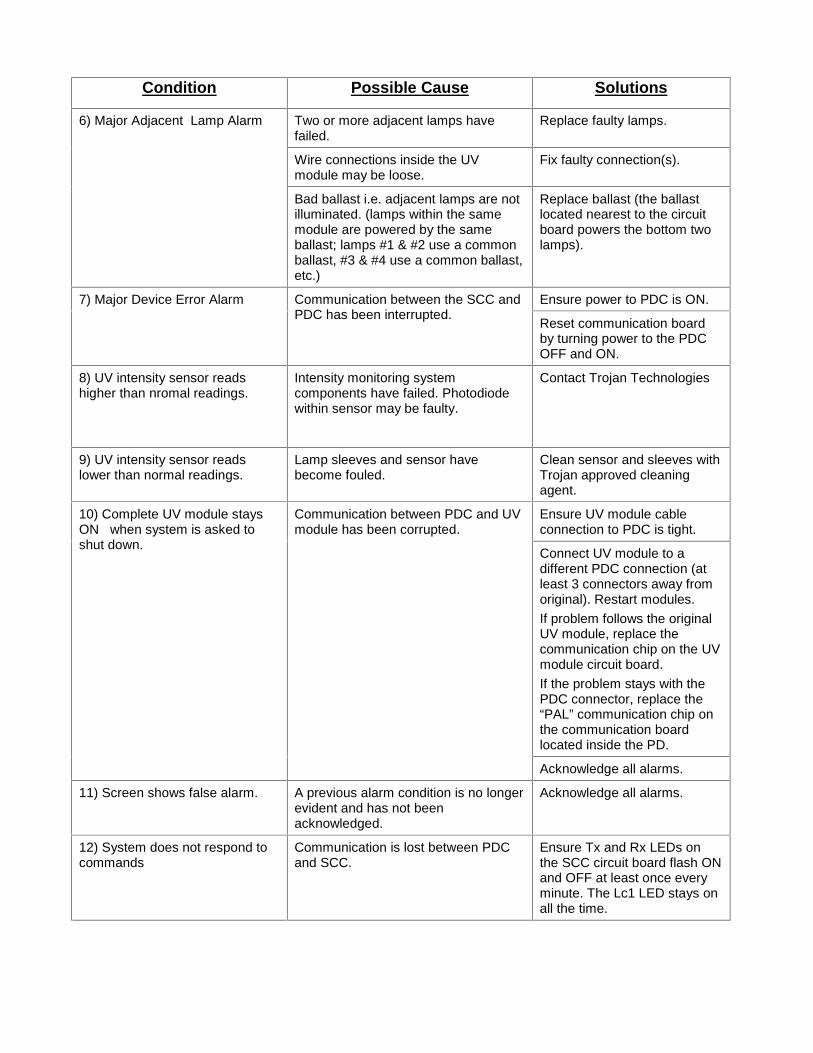
Condition Possible Cause Solutions
6) Major Adjacent Lamp Alarm Two or more adjacent lamps havefailed.
Replace faulty lamps.
Wire connections inside the UVmodule may be loose.
Fix faulty connection(s).
Bad ballast i.e. adjacent lamps are notilluminated. (lamps within the samemodule are powered by the sameballast; lamps #1 & #2 use a commonballast, #3 & #4 use a common ballast,etc.)
Replace ballast (the ballastlocated nearest to the circuitboard powers the bottom twolamps).
7) Major Device Error Alarm Communication between the SCC andPDC has been interrupted.
Ensure power to PDC is ON.
Reset communication boardby turning power to the PDCOFF and ON.
8) UV intensity sensor readshigher than nromal readings.
Intensity monitoring systemcomponents have failed. Photodiodewithin sensor may be faulty.
Contact Trojan Technologies
9) UV intensity sensor readslower than normal readings.
Lamp sleeves and sensor havebecome fouled.
Clean sensor and sleeves withTrojan approved cleaningagent.
10) Complete UV module staysON when system is asked toshut down.
Communication between PDC and UVmodule has been corrupted.
Ensure UV module cableconnection to PDC is tight.
Connect UV module to adifferent PDC connection (atleast 3 connectors away fromoriginal). Restart modules.If problem follows the originalUV module, replace thecommunication chip on the UVmodule circuit board.If the problem stays with thePDC connector, replace the“PAL” communication chip onthe communication boardlocated inside the PD.
Acknowledge all alarms.
11) Screen shows false alarm. A previous alarm condition is no longerevident and has not beenacknowledged.
Acknowledge all alarms.
12) System does not respond tocommands
Communication is lost between PDCand SCC.
Ensure Tx and Rx LEDs onthe SCC circuit board flash ONand OFF at least once everyminute. The Lc1 LED stays onall the time.

Condition Possible Cause Solutions
13) Disinfection not being met Sleeves are fouled. Clean sleeves with Trojanapproved cleaning agent.
Peak flow is higher than system designthus affecting head loss through UVsystem and level control device. (Seeperformance guarantee for sitesspecified limits)
Return flow rates todisinfection levels.
Level control device is not functioningproperly causing effluent levels to riseto levels to high above top modulelamp. This is referred to as shortcircuiting as effluent passes over thetop lamp without being disinfected.
- If ALC is being used checkfor debris may be caught inALC.- If weir is in use debris maybe built up on weir crest.
TSS levels higher than design limits.(See performance guarantee for sitesspecified limits)
Plant process needs to bereviewed.
UVT lower than design limits. (Seeperformance guarantee for sitesspecified limits)
Plant process needs to bereviewed.
Table 1-2 Design SpecificationsParameter SpecificationWastewater Type DomesticAverage Daily Flow (MGD) 10.0Peak Flow Rate (MGD) 15.0Min Flow Rate (MGD) 1.0TSS 30 mg/lTemp Range 40 to 70 deg. F5-Day B.O.D. 30 mg/l30 Day FC Geometric Means 200 / 100 mlUV Transmittance @253.7 nm: 55%No of Lamps 576Mean Particle Size < 30 micronsFlow Channel Width 6 feetFlow Channel Depth 4 feetFlow Channel Length 36 feet
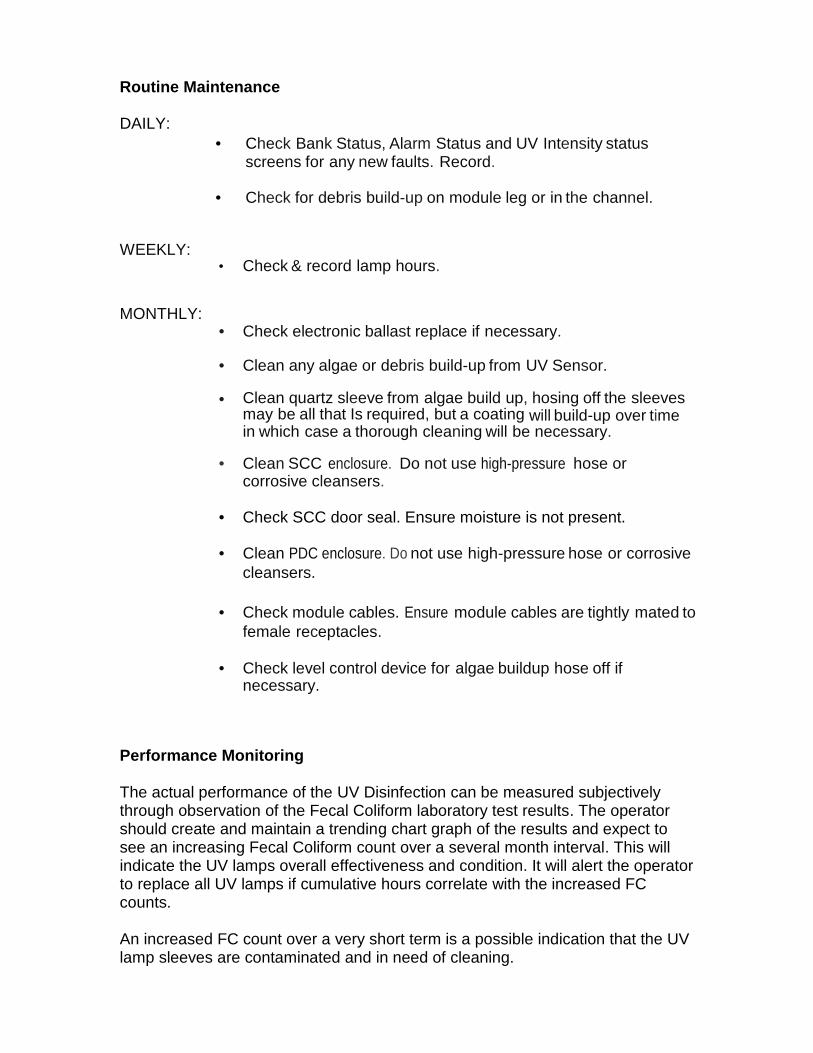
Routine Maintenance
DAILY: Check Bank Status, Alarm Status and UV Intensity status
screens for any new faults. Record.
Check for debris build-up on module leg or in the channel.
WEEKLY: Check & record lamp hours.
MONTHLY: Check electronic ballast replace if necessary.
Clean any algae or debris build-up from UV Sensor.
Clean quartz sleeve from algae build up, hosing off the sleevesmay be all that Is required, but a coating will build-up over timein which case a thorough cleaning will be necessary.
Clean SCC enclosure. Do not use high-pressure hose orcorrosive cleansers.
Check SCC door seal. Ensure moisture is not present.
Clean PDC enclosure. Do not use high-pressure hose or corrosivecleansers.
Check module cables. Ensure module cables are tightly mated tofemale receptacles.
Check level control device for algae buildup hose off ifnecessary.
Performance Monitoring
The actual performance of the UV Disinfection can be measured subjectivelythrough observation of the Fecal Coliform laboratory test results. The operatorshould create and maintain a trending chart graph of the results and expect tosee an increasing Fecal Coliform count over a several month interval. This willindicate the UV lamps overall effectiveness and condition. It will alert the operatorto replace all UV lamps if cumulative hours correlate with the increased FCcounts.
An increased FC count over a very short term is a possible indication that the UVlamp sleeves are contaminated and in need of cleaning.
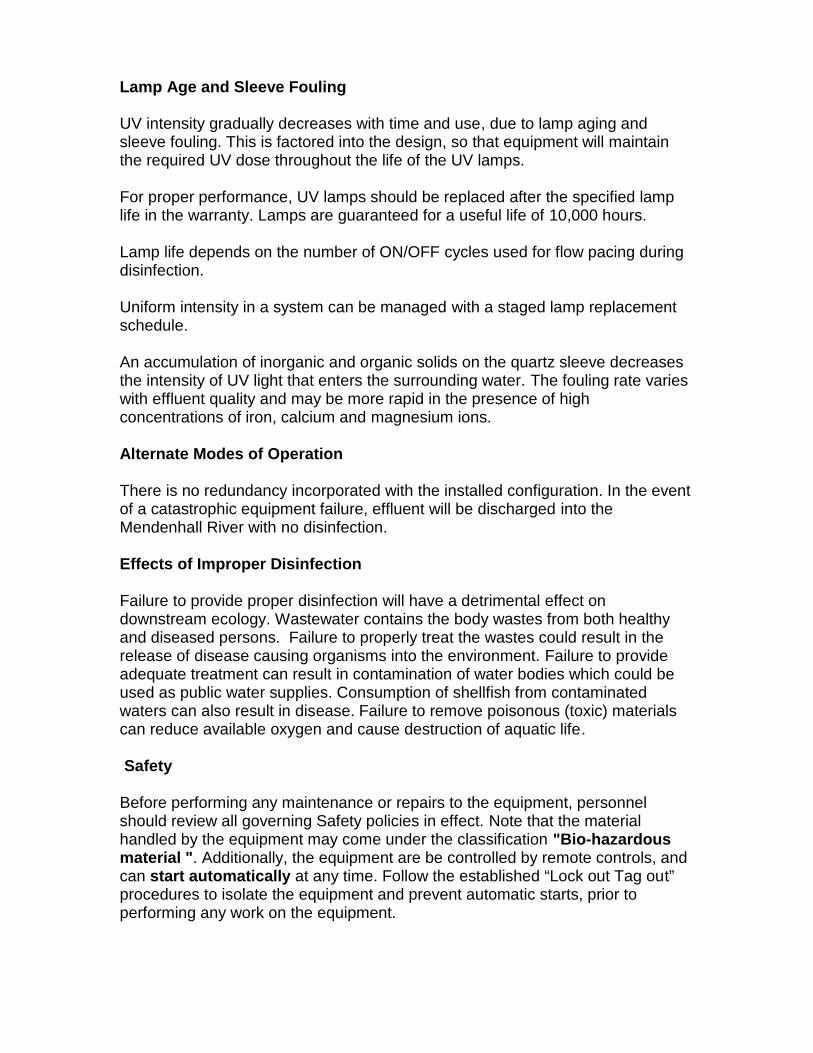
Lamp Age and Sleeve Fouling
UV intensity gradually decreases with time and use, due to lamp aging andsleeve fouling. This is factored into the design, so that equipment will maintainthe required UV dose throughout the life of the UV lamps.
For proper performance, UV lamps should be replaced after the specified lamplife in the warranty. Lamps are guaranteed for a useful life of 10,000 hours.
Lamp life depends on the number of ON/OFF cycles used for flow pacing duringdisinfection.
Uniform intensity in a system can be managed with a staged lamp replacementschedule.
An accumulation of inorganic and organic solids on the quartz sleeve decreasesthe intensity of UV light that enters the surrounding water. The fouling rate varieswith effluent quality and may be more rapid in the presence of highconcentrations of iron, calcium and magnesium ions.
Alternate Modes of Operation
There is no redundancy incorporated with the installed configuration. In the eventof a catastrophic equipment failure, effluent will be discharged into theMendenhall River with no disinfection.
Effects of Improper Disinfection
Failure to provide proper disinfection will have a detrimental effect ondownstream ecology. Wastewater contains the body wastes from both healthyand diseased persons. Failure to properly treat the wastes could result in therelease of disease causing organisms into the environment. Failure to provideadequate treatment can result in contamination of water bodies which could beused as public water supplies. Consumption of shellfish from contaminatedwaters can also result in disease. Failure to remove poisonous (toxic) materialscan reduce available oxygen and cause destruction of aquatic life.
Safety
Before performing any maintenance or repairs to the equipment, personnelshould review all governing Safety policies in effect. Note that the materialhandled by the equipment may come under the classification "Bio-hazardousmaterial ". Additionally, the equipment are be controlled by remote controls, andcan start automatically at any time. Follow the established “Lock out Tag out”procedures to isolate the equipment and prevent automatic starts, prior toperforming any work on the equipment.
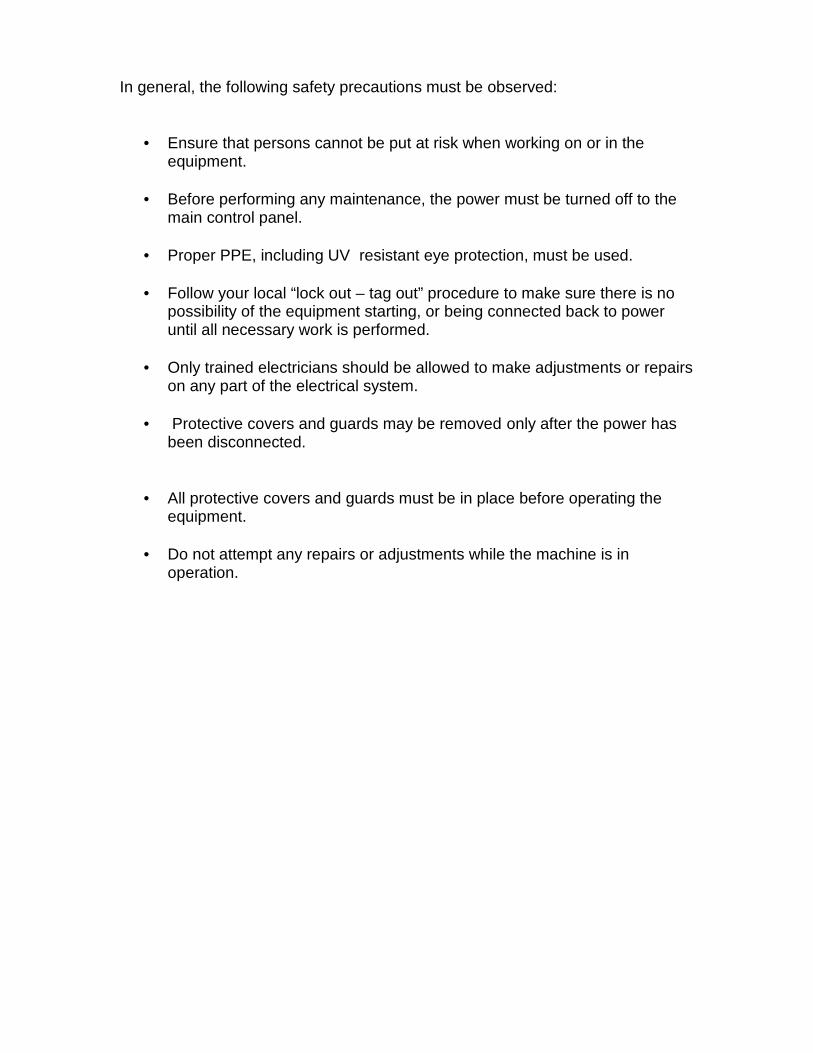
In general, the following safety precautions must be observed:
Ensure that persons cannot be put at risk when working on or in theequipment.
Before performing any maintenance, the power must be turned off to themain control panel.
Proper PPE, including UV resistant eye protection, must be used.
Follow your local “lock out – tag out” procedure to make sure there is nopossibility of the equipment starting, or being connected back to poweruntil all necessary work is performed.
Only trained electricians should be allowed to make adjustments or repairson any part of the electrical system.
Protective covers and guards may be removed only after the power hasbeen disconnected.
All protective covers and guards must be in place before operating theequipment.
Do not attempt any repairs or adjustments while the machine is inoperation.
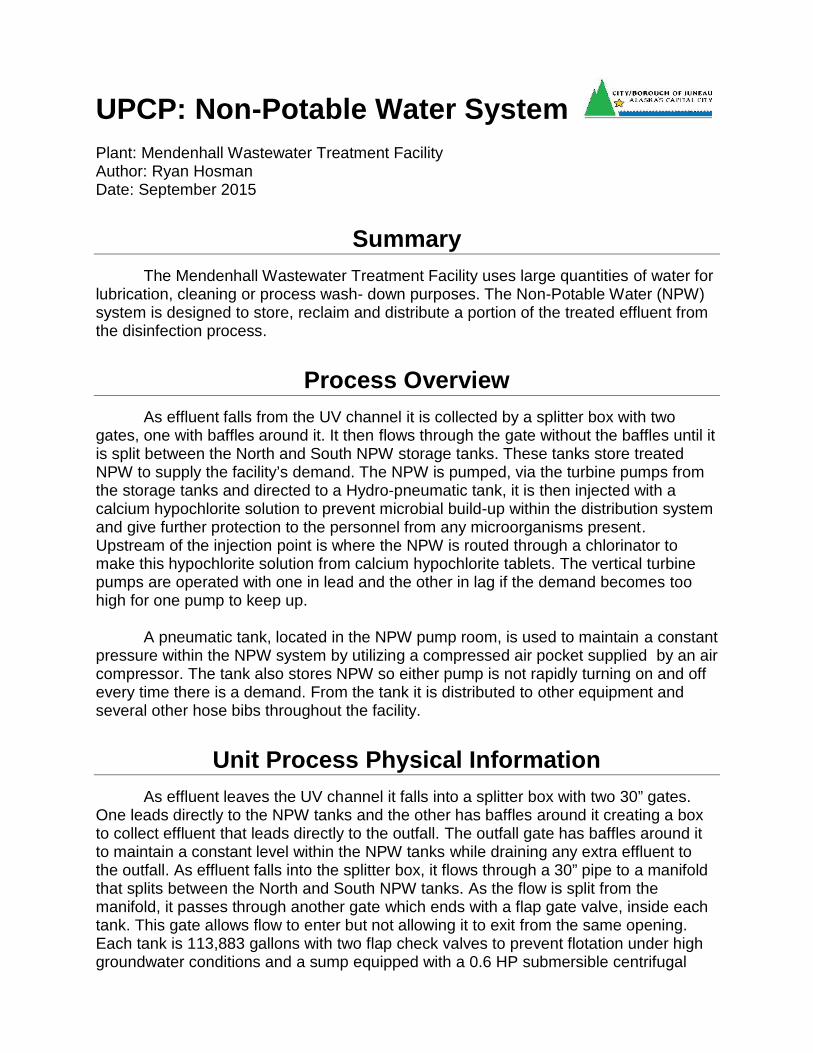
UPCP: Non-Potable Water SystemPlant: Mendenhall Wastewater Treatment FacilityAuthor: Ryan HosmanDate: September 2015
SummaryThe Mendenhall Wastewater Treatment Facility uses large quantities of water for
lubrication, cleaning or process wash- down purposes. The Non-Potable Water (NPW)system is designed to store, reclaim and distribute a portion of the treated effluent fromthe disinfection process.
Process OverviewAs effluent falls from the UV channel it is collected by a splitter box with two
gates, one with baffles around it. It then flows through the gate without the baffles until itis split between the North and South NPW storage tanks. These tanks store treatedNPW to supply the facility’s demand. The NPW is pumped, via the turbine pumps fromthe storage tanks and directed to a Hydro-pneumatic tank, it is then injected with acalcium hypochlorite solution to prevent microbial build-up within the distribution systemand give further protection to the personnel from any microorganisms present.Upstream of the injection point is where the NPW is routed through a chlorinator tomake this hypochlorite solution from calcium hypochlorite tablets. The vertical turbinepumps are operated with one in lead and the other in lag if the demand becomes toohigh for one pump to keep up.
A pneumatic tank, located in the NPW pump room, is used to maintain a constantpressure within the NPW system by utilizing a compressed air pocket supplied by an aircompressor. The tank also stores NPW so either pump is not rapidly turning on and offevery time there is a demand. From the tank it is distributed to other equipment andseveral other hose bibs throughout the facility.
Unit Process Physical InformationAs effluent leaves the UV channel it falls into a splitter box with two 30” gates.
One leads directly to the NPW tanks and the other has baffles around it creating a boxto collect effluent that leads directly to the outfall. The outfall gate has baffles around itto maintain a constant level within the NPW tanks while draining any extra effluent tothe outfall. As effluent falls into the splitter box, it flows through a 30” pipe to a manifoldthat splits between the North and South NPW tanks. As the flow is split from themanifold, it passes through another gate which ends with a flap gate valve, inside eachtank. This gate allows flow to enter but not allowing it to exit from the same opening.Each tank is 113,883 gallons with two flap check valves to prevent flotation under highgroundwater conditions and a sump equipped with a 0.6 HP submersible centrifugal
pump and float sensor. Along the wall, furthest from each adjacent tank are four portsfor draining the tank to a wet well with a submersible centrifugal pump located adjacentto the North NPW tank. There are two 20 HP Flow Serve Vertical Turbine Pumps andelectrode sensors that are mounted on the NPW room floor and extend through the floorinto each tank. The discharge from each pump flows through 6” piping, a check valve tokeep the pump from losing prime, and a gate valve for isolation before it enters theHydro-pneumatic tank.
The Hydro-pneumatic tank has a capacity of 2,422 gallons with an electrode typewater level sensor, a sight glass, a pressurized air pocket supplied by a Quincycompressor, and a pressure relief valve. The seal water is also supplied by this tankwhich passes through a dual basket strainer then branches off to each pump, filtered bya wye strainer.
Just upstream of the Hydro-pneumatic tank, branching off from the dischargepiping is 2“ PVC piping that routes flow through an Accutab Chlorinator. Through thispiping, the NPW passes through a 30 mesh strainer and a solenoid. Then it is splitbetween the calcium hypochlorite tablet hopper which holds 110 lbs of tablets and a 90gallon mixing tank. This solution is removed from the tank by a centrifugal pump throughwhich the dosage is controlled by a blue- white rotameter, injected downstream wherethe NPW is collected. The chlorinator can be used as a continuous process or on apredetermined schedule to shock and kill off any microbial growth within the system.
Operational Parameters and Process TheoryThe BFP requires large quantities of wash-down water continually in order to
maintain optimum dewater-ability while the Auger Monster uses it to rinse accumulatedsolids from the screenings. NPW is used in the SBR’s to knock down any foam build- upand to flush out the sludge collection lines and equipment. There are also several hosebibs around the facility that are utilized by the personnel throughout the day. Because ofthis large water usage, it is cost effective to utilize the effluent as a water source.
The chlorinator used for the NPW is for disinfection. Disinfection is thedestruction of pathogens as to where sterilization is the destruction of allmicroorganisms. The disinfection process within any treatment facility is not designed todestroy all of the microorganisms within the effluent because it is not cost effective.Therefore the microorganisms contribute to the buildup of a zoogleal bio-mass withinthe NPW distribution system. So Cl2 is highly favorable because it reacts with anythingorganic in the water and diminishes/ prevents any build-up from even occurring.
Within the Hydro-pneumatic tank, there is a pocket of air because air can becompressed whereas water can’t. Therefore filling the tank with water compresses thisair pocket. Compressing this air pocket contributes to the buildup of pressure, forcingthe contents of the tank throughout the distribution system at a much higher pressurethan is supplied by the pumps. The tank will also hold the NPW at a desired pressurewhenever the NPW is not in use.

NPW tank storage: The NPW tank water level will fluctuate between decant intervalsas it is needed throughout the facility and remains constant when there is a decant.There are two tanks, the North and South, with each having their own dedicated pump.
Air pressure: The compressor maintains an air pocket within the pneumatic tank whichcan bleed out under high pressure from the pressure reducing valve or when the waterlevel drops too low.
Pumps: There are two pumps, North and South. Each pump is to be rotated to put anequal amount of stress and run time on each one. The pumps fill the pneumatic tankwith water which compresses the air pocket.
Chlorinator solution level: The solution level within the mixing tank fluctuates becauseit is constantly removed per dosage demand and filled when more solution is needed.
Chlorine Solution: The solution needs to be potent enough in order for the NPWdosage to meet its demand but not so much that it is not cost effective and puts thepersonnel’s safety at risk.
NPW dosage: Within the distribution system, there is a demand that needs to be met inorder to prevent buildup of microbial attachment and potential odors.
Hydro-pneumatic tank level: The water level within the pneumatic tank will fluctuate tomeet the demand for NPW and will rise when more water is needed.
NPW pressure: An adequate and reliable amount of pressure is necessary to satisfyequipment and tasks performed by personnel.
Process Monitoring and ResponsibilitiesOperators must perform visual checks on the NPW equipment daily at least once at thebeginning and end of each shift to ensure proper operation.
Table 1-1: NPW equipment monitoringParameter Units Frequency Type Source Target
NPW pressure psi Daily Record Gauge 70-90Hydro-pneumatictank water level inches Daily Record Gauge >1/2Tablet hopper Q gpm Daily Record Digital display 4-8Mixing tank Q gpm Daily Record Rotameter 10NPW dosage Q gpm Daily Record Rotameter 32
These tasks need to be performed daily to ensure optimum performance.
Compressor: Verify the switch on the bucket is in the on position and the breaker is not tripped. Visually check the integrity of the tank.
Visually check the belts for proper tightness and sheave alignment. Check to ensure there are no leaks. Check oil level. Drain any moisture from the tank.
NPW Pumps: Verify the switch on the bucket is in the on position and the breaker is not tripped. Visually check the control panel to verify that the pump is in operation. Verify that the failure and low level lights are not lit. Verify which pump is in operation. Check for leaks. Check motor and drive assembly for vibration, heat, abnormal sounds, and
smells. Alternate the pumps between lead and lag if both NPW Tanks are on line.
Hydro-pneumatic Tank: Visually check the integrity of the tank. Check the water level within the tank. Record the psi on the NPW pump’s control panel. Drain the water level sensor chamber.
Chlorinator: Verify the switch on the bucket is in the on position and the breaker is not tripped. Visually check the control panel and verify that the unit is in operation. Clean the influent strainer. Verify the floats are working properly. Check the hopper for calcium hypochlorite tablets. Adjust the flow through the hopper, mixing tank, and rotameter if necessary. Verify the pump is in operation when the green LED is lit on the control panel. Visually check the integrity of the tank for leaks and ensure the drain is closed. Fill the hopper with calcium hypochlorite tablets if necessary.
Piping and strainers: Check for air or water leaks. Clean the pump’s seal water wye strainers. Clean seal water’s basket strainers. Verify that both seal water valves are open. Drain any moisture from the compressor’s condensate trap.
Control ParametersNPW tank storage: The water supplied to the storage tanks are automaticallycontrolled by hydraulics when an SBR is decanting.
Air pressure: The air pressure within the tank is automatically controlled by a pressuresensor within the compressor. When the pressure drops too low the compressor turnson and shuts off when the pressure is too high.
Pumps: One pump is operated in lead while the other is in lag and both are rotatedmanually by the switches on the control panel. When the pressure drops too low it turnson the pumps while a pressure that is too high shuts them off. When one pump cannotkeep up with the demand, the pump in lag is automatically started.
Chlorinator solution level: The solution level within the mixing tank is automaticallymaintained by float sensors which controls the operation of the pump and solenoid.
Chlorine solution: The concentration of the solution is controlled manually byoperating the red PVC valves and adjusting the flow through the hopper/ mixing tank.
NPW dosage: The dosage is controlled manually by operating a red PVC valve toadjust the flow through the rotameter.
Hydro-pneumatic tank level: The water level within the tank is controlled automaticallyby an electrode water level sensor. This sensor starts the NPW pump that is in leadwhen the level drops too low and shuts it off when the tank is too full. It also starts thepump in lag if the water level reaches the sensor while the pump in lead is in operation
NPW pressure: The pressure is controlled automatically when there is an adequatesupply of NPW and air going through the tank when the pumps and compressor areoperating at optimum performance.
Calculations and Record Keeping Head Pressure = (Ft. of Head) (.433) Hydraulic capacity = (Volume, ft3) (7.48 gal/ft3) Dosage = (MGD) (Cl2, mg/l) (8.34, lbs./gal) Velocity = (distance traveled, ft)
(time, sec.) Detention Time = (Volume, gal)
(Flow, gpd)
Impact on Other Process UnitsThe NPW is vital to the BFP and Auger Monster operations which will strongly
impact the dewatering and screenings process if the NPW system fails. It will alsoimpact its’ own process by not being able to supply seal water to the pumps.

Common Problems and Troubleshooting
Table 2-1: Troubleshooting GuidePotential Problem Probable Cause SolutionLow water level in
storage tanksWater demand is too high Refer to water demand is too highDecanting interval is too long Isolate all sources of NPW demand
Water demand istoo high
Other source is using such ademand
Isolate sources using such largedemand
Broken NPW pipe Isolate broken pipe and repair
Low air pressure
Faulty pressure relief valve Replace or repair pressure reliefvalve
Compressor not operatingproperly
Refer to compressor not operatingproperly
Pneumatic tank ran dry Refer to the pneumatic tank ran dryWater in the air lines Drain air lines
Compressor notoperating properly
Switch in the off position Push the on switchMechanical issue Locate and fix the problemElectrical issue Locate and fix the problemPower outage Reset power supply
NPW pump notoperating properly
Switch in off position Turn switch to the lead positionMechanical issue Locate and fix the problemElectrical issue Locate and fix the problemPower outage Reset power supply
No NPW Not enough NPW available Refer to low water level in storageNPW pump is
running dryLost prime Prime pumpStorage water level is too low Shut down pump
Flow from theNPW pump is not
adequate
Gate valve is closed Open gate valve full bore
Pump not operating properly Refer to NPW pump not operatingproperly
Faulty check valve Fix and repair check valveNot an adequate
supply of sealwater
Basket strainer is plugged Switch strainers and clean basketWye strainer is plugged Clean wye strainerNo NPW Shut down pump
Chlorine solutionnot strong enough
Hopper is empty Fill hopper with hypochlorite tabletsValve to hopper is not allowingenough flow Adjust valve
Valve to mixing tank is opentoo far Adjust valve
Solenoid is notoperating properly
Switch is in the off position Turn switch to the on positionFloats are stuck Free sticking floatsMechanical issue Locate and fix the problemElectrical issue Locate and fix the problem
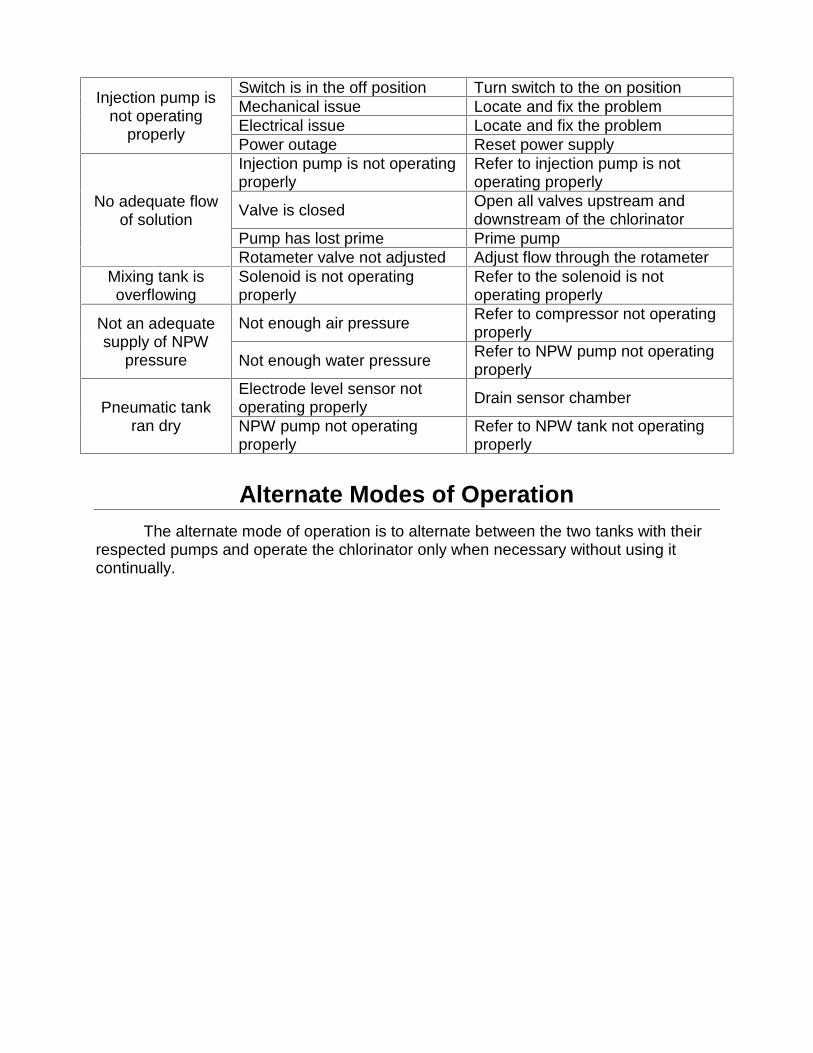
Injection pump isnot operating
properly
Switch is in the off position Turn switch to the on positionMechanical issue Locate and fix the problemElectrical issue Locate and fix the problemPower outage Reset power supply
No adequate flowof solution
Injection pump is not operatingproperly
Refer to injection pump is notoperating properly
Valve is closed Open all valves upstream anddownstream of the chlorinator
Pump has lost prime Prime pumpRotameter valve not adjusted Adjust flow through the rotameter
Mixing tank isoverflowing
Solenoid is not operatingproperly
Refer to the solenoid is notoperating properly
Not an adequatesupply of NPW
pressure
Not enough air pressure Refer to compressor not operatingproperly
Not enough water pressure Refer to NPW pump not operatingproperly
Pneumatic tankran dry
Electrode level sensor notoperating properly Drain sensor chamber
NPW pump not operatingproperly
Refer to NPW tank not operatingproperly
Alternate Modes of OperationThe alternate mode of operation is to alternate between the two tanks with their
respected pumps and operate the chlorinator only when necessary without using itcontinually.
UPCP: WAS-TWAS TanksPlant: Mendenhall Wastewater Treatment FacilityAuthor: Ryan HosmanDate Revised: November 2015
SummaryThe Waste Activated Sludge (WAS) and Thickened Waste Activate Sludge
(TWAS) tanks are an intermediate solids holding process to store wasted solids fromthe SBRs. They are intended to provide primary thickening through gravity anddecanting prior to mechanical thickening and dewatering. Thickening the sludge is aphysical process through sedimentation within the WAS tank while the TWAS tankprovides potential for some digestion under biological and aerated conditions.
Process OverviewAs settled sludge is pumped from each Sequential Batch Reactor (SBR), it flows
through a series of valves and piping. This network of valves can be set to control theflow if the desired operation of the WAS and TWAS tanks are to be parallel, series orjust as one tank alone. The waste piping network can also be arranged to transfersludge back to the Influent Pump Station (IPS) if reseeding an SBR is necessary foroperations.
A portion of the settled sludge from the SBRs are sent to an aerated WAS tankfor further thickening. Periodically, the WAS tank air is shut off to allow further settlingand decanting any clear water remaining above the sludge blanket (supernatant).Decanting is performed by pumping out the supernatant from the WAS tank. A pump islowered with a mechanical stationary hoist until it just meets the settled slugged portionthen raised to capture only the clear water. The result is a thicker sludge for solidscontent. The remaining thickened solids are then transferred to the TWAS tank. TheTWAS tank is considered a storage tank for the thickened sludge and can be used as adigester because the thicker sludge takes less room, permitting a longer detention timeand potentially providing a volatile reduction of solids through biological and mechanicaldigestion.
A dedicated blower and jet pump are used for both the WAS and TWAS tanks tomaintain an adequate dissolved oxygen level, usually between .5 and 2.0 mg/L. Theblower provides ambient oxygen to keep the solids from going anoxic and assists withmaintaining a stable environment for aerobic biological activity. The jet pumps are usedto provide sufficient diffusion of the ambient oxygen and additional mixing. In the eventof a blower malfunction, the route of air flow can be directed through the network ofpiping to either tank or switched intermittently by a three way valve.
The WAS and TWAS tanks are also equipped with a transfer pump to transferthe sludge between the two tanks.
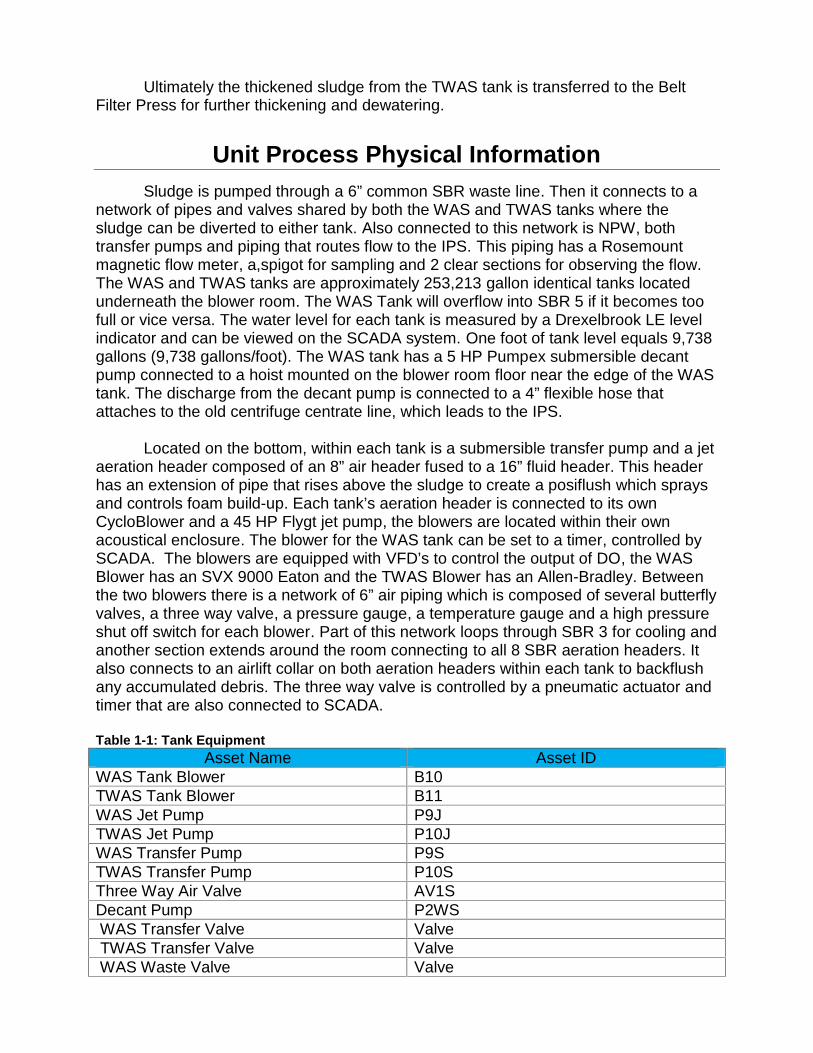
Ultimately the thickened sludge from the TWAS tank is transferred to the BeltFilter Press for further thickening and dewatering.
Unit Process Physical InformationSludge is pumped through a 6” common SBR waste line. Then it connects to a
network of pipes and valves shared by both the WAS and TWAS tanks where thesludge can be diverted to either tank. Also connected to this network is NPW, bothtransfer pumps and piping that routes flow to the IPS. This piping has a Rosemountmagnetic flow meter, a,spigot for sampling and 2 clear sections for observing the flow.The WAS and TWAS tanks are approximately 253,213 gallon identical tanks locatedunderneath the blower room. The WAS Tank will overflow into SBR 5 if it becomes toofull or vice versa. The water level for each tank is measured by a Drexelbrook LE levelindicator and can be viewed on the SCADA system. One foot of tank level equals 9,738gallons (9,738 gallons/foot). The WAS tank has a 5 HP Pumpex submersible decantpump connected to a hoist mounted on the blower room floor near the edge of the WAStank. The discharge from the decant pump is connected to a 4” flexible hose thatattaches to the old centrifuge centrate line, which leads to the IPS.
Located on the bottom, within each tank is a submersible transfer pump and a jetaeration header composed of an 8” air header fused to a 16” fluid header. This headerhas an extension of pipe that rises above the sludge to create a posiflush which spraysand controls foam build-up. Each tank’s aeration header is connected to its ownCycloBlower and a 45 HP Flygt jet pump, the blowers are located within their ownacoustical enclosure. The blower for the WAS tank can be set to a timer, controlled bySCADA. The blowers are equipped with VFD’s to control the output of DO, the WASBlower has an SVX 9000 Eaton and the TWAS Blower has an Allen-Bradley. Betweenthe two blowers there is a network of 6” air piping which is composed of several butterflyvalves, a three way valve, a pressure gauge, a temperature gauge and a high pressureshut off switch for each blower. Part of this network loops through SBR 3 for cooling andanother section extends around the room connecting to all 8 SBR aeration headers. Italso connects to an airlift collar on both aeration headers within each tank to backflushany accumulated debris. The three way valve is controlled by a pneumatic actuator andtimer that are also connected to SCADA.
Table 1-1: Tank EquipmentAsset Name Asset ID
WAS Tank Blower B10TWAS Tank Blower B11WAS Jet Pump P9JTWAS Jet Pump P10JWAS Transfer Pump P9STWAS Transfer Pump P10SThree Way Air Valve AV1SDecant Pump P2WSWAS Transfer Valve ValveTWAS Transfer Valve ValveWAS Waste Valve Valve
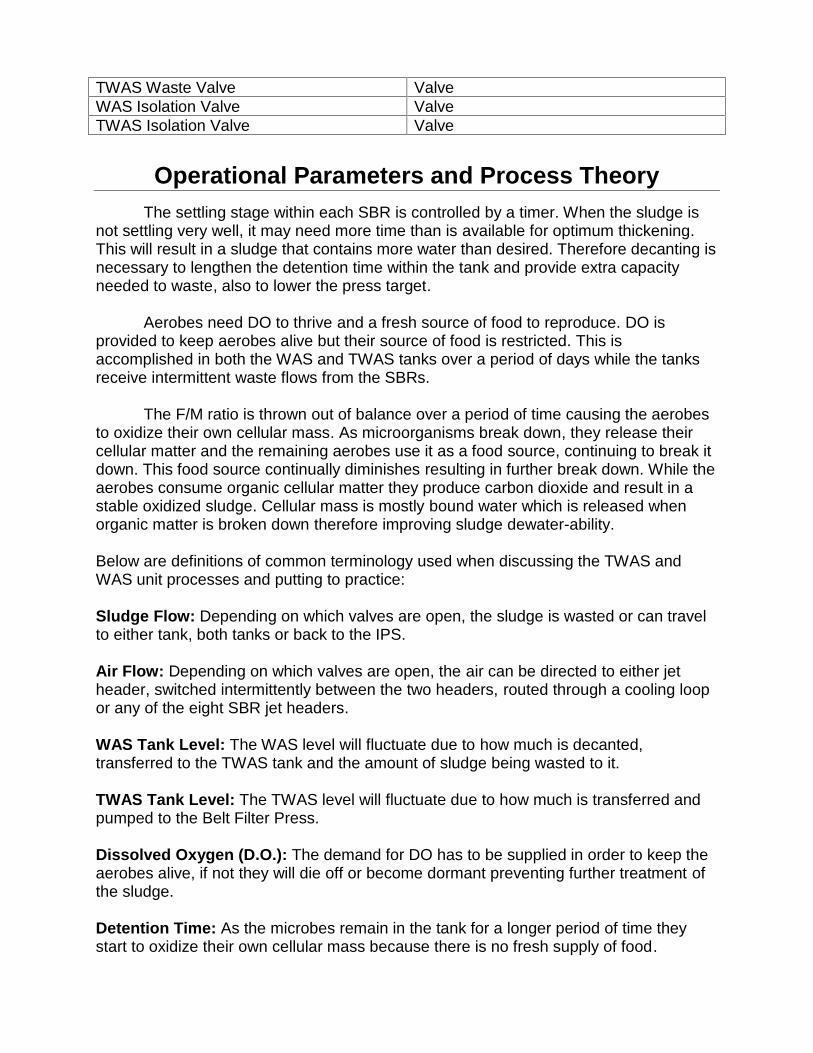
TWAS Waste Valve ValveWAS Isolation Valve ValveTWAS Isolation Valve Valve
Operational Parameters and Process TheoryThe settling stage within each SBR is controlled by a timer. When the sludge is
not settling very well, it may need more time than is available for optimum thickening.This will result in a sludge that contains more water than desired. Therefore decanting isnecessary to lengthen the detention time within the tank and provide extra capacityneeded to waste, also to lower the press target.
Aerobes need DO to thrive and a fresh source of food to reproduce. DO isprovided to keep aerobes alive but their source of food is restricted. This isaccomplished in both the WAS and TWAS tanks over a period of days while the tanksreceive intermittent waste flows from the SBRs.
The F/M ratio is thrown out of balance over a period of time causing the aerobesto oxidize their own cellular mass. As microorganisms break down, they release theircellular matter and the remaining aerobes use it as a food source, continuing to break itdown. This food source continually diminishes resulting in further break down. While theaerobes consume organic cellular matter they produce carbon dioxide and result in astable oxidized sludge. Cellular mass is mostly bound water which is released whenorganic matter is broken down therefore improving sludge dewater-ability.
Below are definitions of common terminology used when discussing the TWAS andWAS unit processes and putting to practice:
Sludge Flow: Depending on which valves are open, the sludge is wasted or can travelto either tank, both tanks or back to the IPS.
Air Flow: Depending on which valves are open, the air can be directed to either jetheader, switched intermittently between the two headers, routed through a cooling loopor any of the eight SBR jet headers.
WAS Tank Level: The WAS level will fluctuate due to how much is decanted,transferred to the TWAS tank and the amount of sludge being wasted to it.
TWAS Tank Level: The TWAS level will fluctuate due to how much is transferred andpumped to the Belt Filter Press.
Dissolved Oxygen (D.O.): The demand for DO has to be supplied in order to keep theaerobes alive, if not they will die off or become dormant preventing further treatment ofthe sludge.
Detention Time: As the microbes remain in the tank for a longer period of time theystart to oxidize their own cellular mass because there is no fresh supply of food.
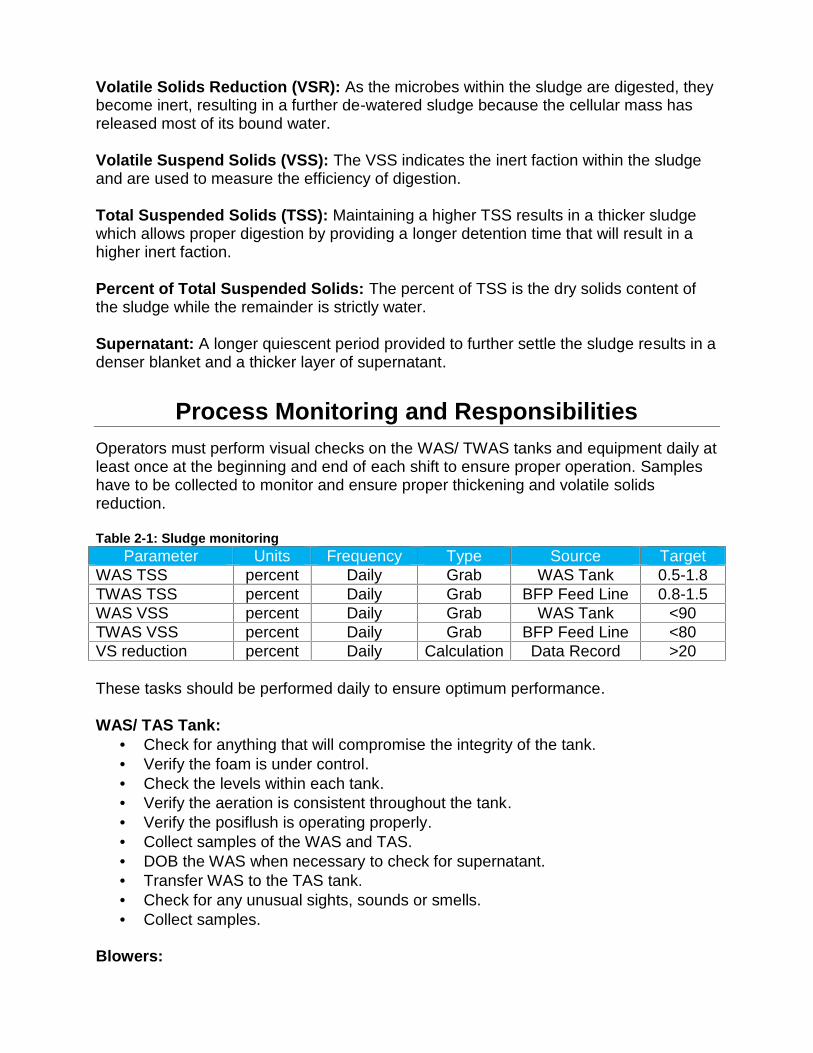
Volatile Solids Reduction (VSR): As the microbes within the sludge are digested, theybecome inert, resulting in a further de-watered sludge because the cellular mass hasreleased most of its bound water.
Volatile Suspend Solids (VSS): The VSS indicates the inert faction within the sludgeand are used to measure the efficiency of digestion.
Total Suspended Solids (TSS): Maintaining a higher TSS results in a thicker sludgewhich allows proper digestion by providing a longer detention time that will result in ahigher inert faction.
Percent of Total Suspended Solids: The percent of TSS is the dry solids content ofthe sludge while the remainder is strictly water.
Supernatant: A longer quiescent period provided to further settle the sludge results in adenser blanket and a thicker layer of supernatant.
Process Monitoring and ResponsibilitiesOperators must perform visual checks on the WAS/ TWAS tanks and equipment daily atleast once at the beginning and end of each shift to ensure proper operation. Sampleshave to be collected to monitor and ensure proper thickening and volatile solidsreduction.
Table 2-1: Sludge monitoringParameter Units Frequency Type Source Target
WAS TSS percent Daily Grab WAS Tank 0.5-1.8TWAS TSS percent Daily Grab BFP Feed Line 0.8-1.5WAS VSS percent Daily Grab WAS Tank <90TWAS VSS percent Daily Grab BFP Feed Line <80VS reduction percent Daily Calculation Data Record >20
These tasks should be performed daily to ensure optimum performance.
WAS/ TAS Tank: Check for anything that will compromise the integrity of the tank. Verify the foam is under control. Check the levels within each tank. Verify the aeration is consistent throughout the tank. Verify the posiflush is operating properly. Collect samples of the WAS and TAS. DOB the WAS when necessary to check for supernatant. Transfer WAS to the TAS tank. Check for any unusual sights, sounds or smells. Collect samples.
Blowers:
Verify the switch on the bucket is in the on position and the breaker is not tripped. Check motor and drive assembly for vibration, heat, unusual sounds and smells. Check SCADA and verify that each blower is in operation. Check SCADA for any alarms or malfunctions. Visually check the oil level within the sight glass.
Pertinent Equipment: Verify the switch on each bucket is in the on position and the breaker is not
tripped. Check SCADA and verify that the equipment is in operation. Check SCADA for any alarms or malfunctions.
Piping: Check SCADA to verify that the three way valve is in the correct position. Check for air or water leaks. Check the psi on the air lines to ensure there is no high pressure. Verify valves are set correctly for the action needed to be performed. Verify flow is routed to the desired location. Verify that the WAS flow meter is operating properly.
Control ParametersSludge Flow: The route of sludge flow is controlled manually by operating a series ofvalves along the piping network. Also the transfer pumps are controlled manually
Air Flow: The route of air flow is controlled in combination with manual and automaticoperation of air valves within the piping network. Most valves are operated manuallywhile AV1S is operated automatically by the SCADA system, programmed with a timerfor optional use. Through the SCADA system, B10 is also programmed with a timer so itcan be operated
WAS Tank Level: Filling the WAS tank is controlled by manually operating valves toroute the sludge flow to it. How much waste that is actually collected is not controlled inthis process. Emptying the tank is controlled manually by a submersible pump operatedlocally and by removing the layer of supernatant by manually lowering and operating asubmersible pump.
TWAS Tank Level: There is little control on the level fluctuation of this tank. The levelwill rise from how much sludge is transferred to it, dependent on how much is remainingafter thickening/ decanting. Emptying the tank is not controlled in this process unless itis transferred to the WAS tank.
Dissolved Oxygen (D.O.): The DO is controlled manually by a VFD. The WAS VFD isoperated locally within the acoustical enclosure, while the TWAS VFD is operatedlocally in the upstairs MCC room.
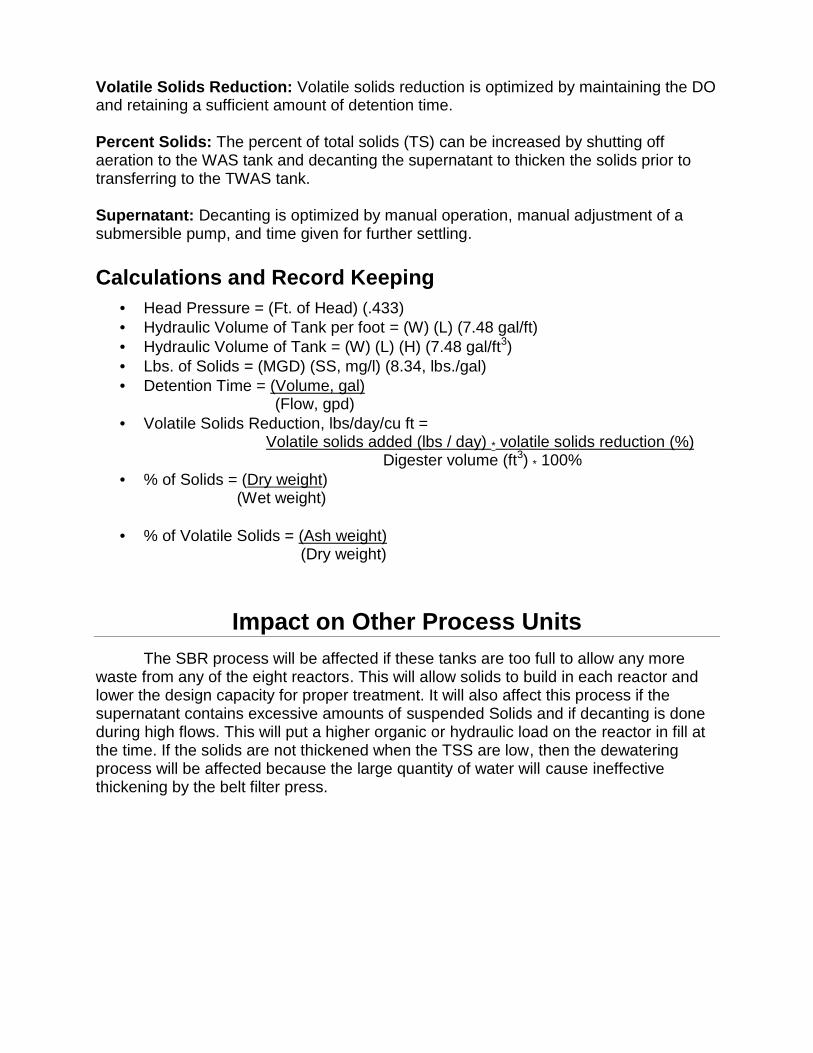
Volatile Solids Reduction: Volatile solids reduction is optimized by maintaining the DOand retaining a sufficient amount of detention time.
Percent Solids: The percent of total solids (TS) can be increased by shutting offaeration to the WAS tank and decanting the supernatant to thicken the solids prior totransferring to the TWAS tank.
Supernatant: Decanting is optimized by manual operation, manual adjustment of asubmersible pump, and time given for further settling.
Calculations and Record Keeping Head Pressure = (Ft. of Head) (.433) Hydraulic Volume of Tank per foot = (W) (L) (7.48 gal/ft) Hydraulic Volume of Tank = (W) (L) (H) (7.48 gal/ft3) Lbs. of Solids = (MGD) (SS, mg/l) (8.34, lbs./gal) Detention Time = (Volume, gal)
(Flow, gpd) Volatile Solids Reduction, lbs/day/cu ft =
Volatile solids added (lbs / day) * volatile solids reduction (%)Digester volume (ft3) * 100%
% of Solids = (Dry weight)(Wet weight)
% of Volatile Solids = (Ash weight)(Dry weight)
Impact on Other Process UnitsThe SBR process will be affected if these tanks are too full to allow any more
waste from any of the eight reactors. This will allow solids to build in each reactor andlower the design capacity for proper treatment. It will also affect this process if thesupernatant contains excessive amounts of suspended Solids and if decanting is doneduring high flows. This will put a higher organic or hydraulic load on the reactor in fill atthe time. If the solids are not thickened when the TSS are low, then the dewateringprocess will be affected because the large quantity of water will cause ineffectivethickening by the belt filter press.
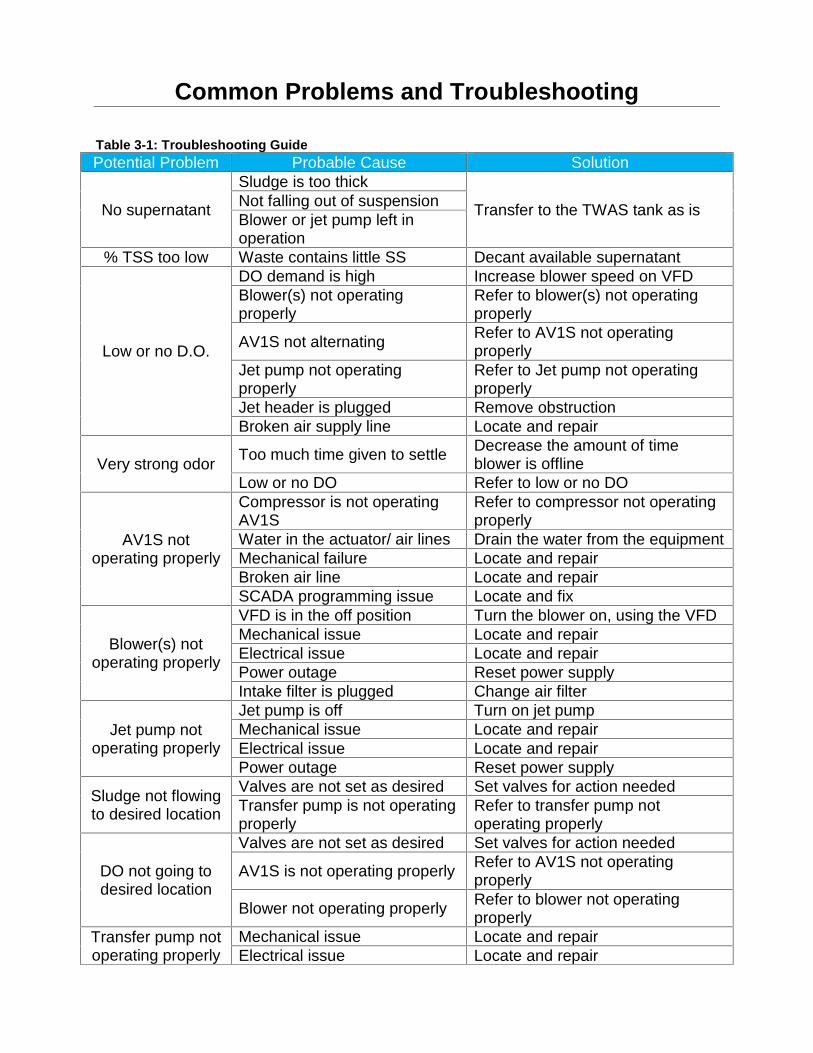
Common Problems and Troubleshooting
Table 3-1: Troubleshooting GuidePotential Problem Probable Cause Solution
No supernatant
Sludge is too thick
Transfer to the TWAS tank as isNot falling out of suspensionBlower or jet pump left inoperation
% TSS too low Waste contains little SS Decant available supernatant
Low or no D.O.
DO demand is high Increase blower speed on VFDBlower(s) not operatingproperly
Refer to blower(s) not operatingproperly
AV1S not alternating Refer to AV1S not operatingproperly
Jet pump not operatingproperly
Refer to Jet pump not operatingproperly
Jet header is plugged Remove obstructionBroken air supply line Locate and repair
Very strong odor Too much time given to settle Decrease the amount of timeblower is offline
Low or no DO Refer to low or no DO
AV1S notoperating properly
Compressor is not operatingAV1S
Refer to compressor not operatingproperly
Water in the actuator/ air lines Drain the water from the equipmentMechanical failure Locate and repairBroken air line Locate and repairSCADA programming issue Locate and fix
Blower(s) notoperating properly
VFD is in the off position Turn the blower on, using the VFDMechanical issue Locate and repairElectrical issue Locate and repairPower outage Reset power supplyIntake filter is plugged Change air filter
Jet pump notoperating properly
Jet pump is off Turn on jet pumpMechanical issue Locate and repairElectrical issue Locate and repairPower outage Reset power supply
Sludge not flowingto desired location
Valves are not set as desired Set valves for action neededTransfer pump is not operatingproperly
Refer to transfer pump notoperating properly
DO not going todesired location
Valves are not set as desired Set valves for action needed
AV1S is not operating properly Refer to AV1S not operatingproperly
Blower not operating properly Refer to blower not operatingproperly
Transfer pump notoperating properly
Mechanical issue Locate and repairElectrical issue Locate and repair
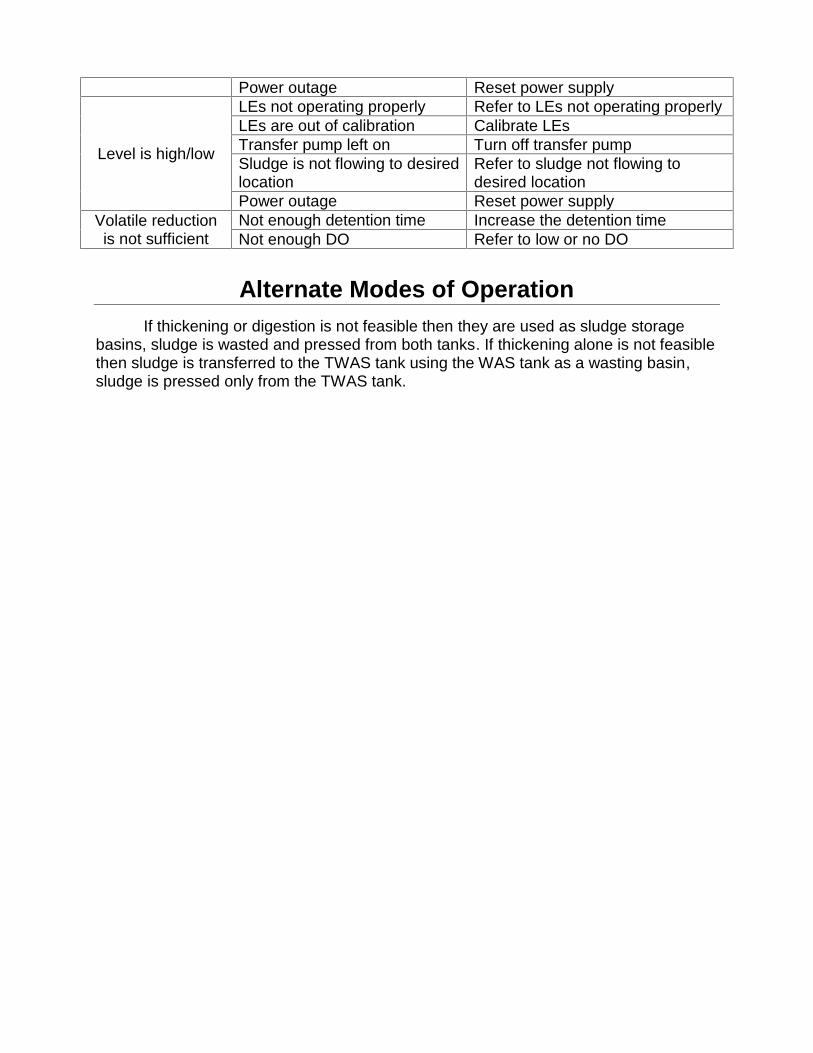
Power outage Reset power supply
Level is high/low
LEs not operating properly Refer to LEs not operating properlyLEs are out of calibration Calibrate LEsTransfer pump left on Turn off transfer pumpSludge is not flowing to desiredlocation
Refer to sludge not flowing todesired location
Power outage Reset power supplyVolatile reductionis not sufficient
Not enough detention time Increase the detention timeNot enough DO Refer to low or no DO
Alternate Modes of OperationIf thickening or digestion is not feasible then they are used as sludge storage
basins, sludge is wasted and pressed from both tanks. If thickening alone is not feasiblethen sludge is transferred to the TWAS tank using the WAS tank as a wasting basin,sludge is pressed only from the TWAS tank.