Waverley & Guildford Local Plan
62
S WAVERLEY & GUILDFORD LOCAL PLANS Model Development Validation Report
Transcript of Waverley & Guildford Local Plan

S
WAVERLEY & GUILDFORD LOCAL PLANS
Model Development Validation Report

Issue No. 02 Page 2 Document No. 53613T45\02
Project Title: Waverley & Guildford Local Plan Document Title: Model Development Validation Report Client Reference: Date: 3 June 2016 Prepared By: Print Emma Brundle Authorised By: Print Gemma Joyner All maps contained in this document are licensed © Crown copyright and database rights
2016 Ordnance Survey 100019613
Amendment List
Iss. / Rev. Iss. / Rev Date Remove Insert
Page Iss. / Rev. Page Iss. / Rev.
2 03/06/2016 7 Corrected spelling
11
Para 4.2.9 updated
15
Updated key
22
Corrected values
0201SF10 07/08/02
Filename: H:\Modelling\Project\GBC LP_2016\Doc02_Waverley And Guildford LMVR_V2.Doc

Waverley & Guildford Local Plan Model Development Validation Report
Issue No. 02 Page 3 Document No. 53613T45\02
CONTENTS
1 INTRODUCTION 4
2 SCOPE 4
2.1 SINTRAM 4
2.2 Base Year 4
2.3 Modes of Transport 4
2.4 Time Periods 4
3 MODEL COVERAGE AND STUDY AREA 4
3.1 Model Coverage 4
3.2 Study Area 5
3.3 Zones 7
4 MODEL VALIDATION 8
4.1 Assignment 8
4.2 Link Flow Validation 8
4.3 Journey Time Validation 14
5 CONCLUSION 18
APPENDIX A – LINK FLOW VALIDATION 19
APPENDIX B – JOURNEY TIME VALIDATION 49

Waverley & Guildford Local Plan Model Development Validation Report
Issue No. 02 Page 4 Document No. 53613T45\02
1 INTRODUCTION
1.1.1 This report sets out the development and validation of Surrey County Council’s strategic transport model, SINTRAM, in the vicinity of the boroughs of Waverley and Guildford for the Local Plan strategic assessment work.
2 SCOPE
2.1 SINTRAM
2.1.1 Surrey County Council’s transport model, SINTRAM version 6 (S6022_GBCWBC_LP_110516) was the outcome of the development and validation process outlined in this report. It has been used for the assessment of both Waverley and Guildford’s Local Plans. The model is run in conjunction with OmniTRANS modelling program, version 6.022.5874.
2.1.2 Strategic models such as SINTRAM use aggregate descriptions of traffic such as flow, density, speed and the relationships between them. The model is unable to answer detailed questions regarding traffic interactions, such as queuing and individual driver behaviour. It can however, provide approximate answers to transport problems across a vast geographical area including the level of vehicle demand, junctions and stretches of road which will be operating above their theoretical capacity, and highlighting areas where some form of mitigation is likely to be required.
2.2 Base Year
2.2.1 The model base year is 2009.
2.3 Modes of Transport
2.3.1 Vehicle classes that are represented in the model are: car; light good vehicles (LGV); and heavy good vehicles (HGV).
2.3.2 Public transport and active modes are not modelled.
2.4 Time Periods
2.4.1 The model represents a twelve-hour weekday (0700 – 1900), broken down into the following time periods:
Weekday average AM peak hour (0700 – 1000);
Weekday average inter peak hour (1000 – 1600); and
Weekday average PM peak hour (1600 – 1900).
2.4.2 Since the majority of the future large scale developments are focused on residential land uses, the majority of trips will take place during the weekday peak hours. As a result only the weekday average AM and PM peak hours have been reported.
3 MODEL COVERAGE AND STUDY AREA
3.1 Model Coverage
3.1.1 SINTRAM is a strategic highway model for the county of Surrey. The model encapsulates the road network of Surrey and surrounding local authorities. The detail included in the model network becomes less refined as the distance increases from the county of Surrey. Consequently a skeleton network of strategic
Waverley & Guildford Local Plan Model Development Validation Report
Issue No. 02 Page 5 Document No. 53613T45\02
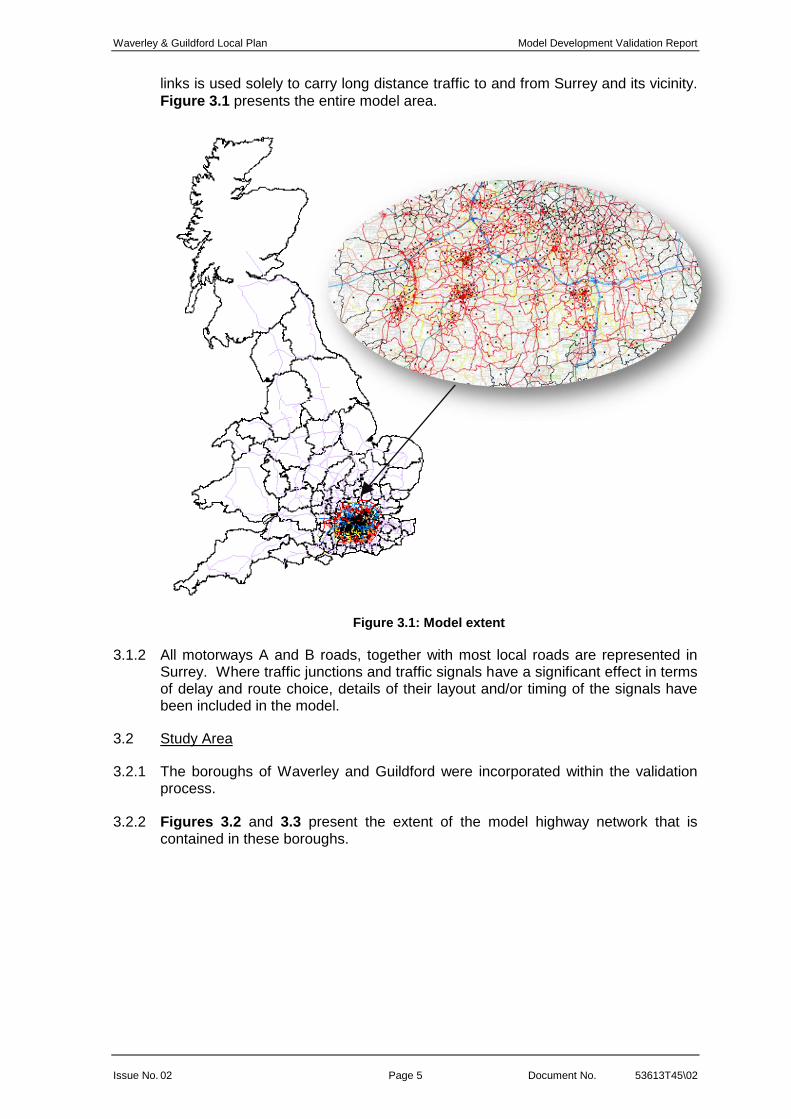
links is used solely to carry long distance traffic to and from Surrey and its vicinity.
Figure 3.1 presents the entire model area.
Figure 3.1: Model extent
3.1.2 All motorways A and B roads, together with most local roads are represented in Surrey. Where traffic junctions and traffic signals have a significant effect in terms of delay and route choice, details of their layout and/or timing of the signals have been included in the model.
3.2 Study Area
3.2.1 The boroughs of Waverley and Guildford were incorporated within the validation process.
3.2.2 Figures 3.2 and 3.3 present the extent of the model highway network that is contained in these boroughs.

Waverley & Guildford Local Plan Model Development Validation Report
Issue No. 02 Page 6 Document No. 53613T45\02
Figure 3.2: Study area of Waverley
Figure 3.3: Study area of Guildford
N
N

Waverley & Guildford Local Plan Model Development Validation Report
Issue No. 02 Page 7 Document No. 53613T45\02
3.3 Zones
3.3.1 There are 43 model zones in the borough of Waverley and 67 in the borough of Guildford.
3.3.2 The zones were reviewed to ensure that they were suitable for the assessment of the development sites. New zones were added to both boroughs, shown in blue, to contain the largest development sites and to ensure that the vehicle trips generated would access the highway network at a relevant point. This ensured that their impacts on the highway network could be captured more accurately.
Guildford Zones
72: Artington 502: Horsley - West Horsley 73: Ash & Normandy 519: Worplesdon 80: Guildford - Bellfields 526: Artington Park & Ride 94: Guildford - Burpham 528: Shalford Park Car Park 95: Guildford - Merrow 529: York Road Car Park 99: Guildford - Charlotteville 530: Manor Park Park & Ride 104: Clandon 531: Merrow Park & Ride 107: Compton 532: Tormead 119: Horsley - East Horsley & Effingham 533: Spectrum Park & Ride 133: Eastgate North 534: Stoke Park North 134: Guildford - Millmead & The Mount 535: Guildford - Merrow Common 135: Millmead 536: Boxgrove 136: Guildford Town Centre 538: Abbotswood 137: London Road 539: The Bars 162: Hogsback 540: Leapale Road 172: Guildford - RSCH & Research Park 541: Drummond Road 260: Stoke Park South 542: Eastgate South 265: Guildford - Merrow Downs 543: Tunsgate 278: Guildford - Onslow Village 544: Millbrook 279: Guildford - Park Barn 545: University of Surrey 281: Chilworth & Gomshall 546: Guildford Business Park 282: Pirbright 547: Guildford Bus Station 291: Ockham & Wisley 548: Bedford Road 294: Send 549: Guildford Rail Station 295: Ripley 550: Farnham Road Car Park 296: Shackleford / Eashing 551: Farnham Road Hospital 297: Shalford 552: Slyfield Residential 298: Guildford - Rydes Hill 574: Committed & Strategic Ash Development 306: Slyfield Industrial 575: Guildford NE Urban Extension 310: Guildford - Pewley Hill 576: Guildford SW Urban Extension 314: Guildford - St Marthas Hill 577: Wisley Development 317: Guildford - Woodbridge & Walnut Tree Close 578: Flexford & Normandy Development 318: Guildford - Stoughton 579: Waitrose 477: Guildford Park

Waverley & Guildford Local Plan Model Development Validation Report
Issue No. 02 Page 8 Document No. 53613T45\02
Waverley Zones
71: Alice Holt 330: Milford 75: Badshot Lea 331: Wrecclesham 98: Farnham - West Street 332: Farnham - Hale 108: Farnham - Compton 333: Cranleigh - Cranleigh East 109: Runfold 334: Shamley Green 124: Farnham Hospitals 335: Wonersh 125: Farnham Park 336: Farnham - Weybourne West 126: Farnham Station 337: Godalmng - Busbridge 127: Farnham Town Centre East 338: Godalmng - Godalming Town Centre 300: Farnham - Weydon Lane & Shortheath 339: Godalmng - Charterhouse 309: Farnham - Firgrove Hill 340: Farncombe - Farncombe 319: Frensham & Tilford 341: Binscombe 320: Elstead & Thursley 468: Farnham - Dippenhall 321: Bramley & Winkworth Arboretum 471: Farnham - The Bournes 322: Chiddingfold & Dunsfold 503: Farnham - Weybourne East 323: Witley 564: Farnham Town Centre West 324: Alfold 569: Amlets Lane Development 325: Cranleigh - Cranleigh Town Centre 570: Dunsfold Development 326: Ewhurst 571: Coxbridge Farm Development 327: Haslemere - Shottermill 572: Littlemead Industrial Estate Development 328: Haslemere 573: West Cranleigh Nurseries Development 329: Hindhead
4 MODEL VALIDATION
4.1 Assignment
4.1.1 The base matrices were assigned to the network using a fixed trip equilibrium assignment. This was performed using the method of successive averages (MSA) for 100 assignment iterations.
4.2 Link Flow Validation
4.2.1 Validation simply compares modelled and observed data. The observed and modelled link flows have been compared for each model and time period, in accordance with the Department for Transport’s (DfT) validation acceptability
guidelines1, presented in Table 4.1.
1 Department for Transport (2014) Transport Appraisal Guidance Unit M3.1, Highway Assignment Modelling

Waverley & Guildford Local Plan Model Development Validation Report
Issue No. 02 Page 9 Document No. 53613T45\02
Criteria Acceptability
Guidelines
Link Flows
Individual flows within 100 vph of counts for flows less than 700 vph
> 85% of cases Individual flows within 15% of counts for flows from 700 to 2,700 vph
Individual flows within 400 vph of counts for flows more than 2,700 vph
GEH < 5 for individual flows
Table 4.1: Flow validation acceptability guidelines
4.2.2 Link flow validation compares the absolute difference between modelled flows and observed counts, together with the presentation of the GEH statistic. The GEH statistic is a form of chi-squared statistic that incorporates both relative and absolute errors, defined as:
GEH is the GEH statistic M is the modelled flow C is the observed flow
4.2.3 Tables 4.2 and 4.3 presents the summary of the validation of the weekday average AM and PM peak hours in terms of the DfT’s acceptability guidelines.
4.2.4 Both the flow and GEH criteria have been met in the borough of Waverley. The flow criteria is met in the borough of Guildford but narrowly misses the GEH criteria, by 1 - 2% during both the average AM and PM peak hours.
Average weekday AM peak hour
(0700 – 1000)
Average weekday PM peak hour
(1600 – 1900)
Values % met
criteria
Counts
met
criteria
Values % met
criteria
Counts
met
criteria
No. of counts 87 - - 86 - -
Average GEH 1.20 - - 1.55 - -
GEH > 10 0 - - 1 - -
GEH < 5 87 97% Yes 86 96% Yes
Flow criteria 89 99% Yes 86 96% Yes
Table 4.2: Link flow validation results for the borough of Waverley
Average weekday AM peak hour
(0700 – 1000)
Average weekday PM peak hour
(1600 – 1900)
Values % met
criteria
Counts
met
criteria
Values % met
criteria
Counts
met
criteria
No. of counts 409 - - 409 - -
Average GEH 2.94 - - 3.00 - -
GEH > 10 14 - - 14 - -
GEH < 5 340 83% No 345 84% No
Flow criteria 357 87% Yes 358 88% Yes
Table 4.3: Link flow validation results for the borough of Guildford
4.2.5 Figures 4.1 to 4.4 show the modelled flows plotted against the observed with the best-fit regression line and correlation coefficient (R²), for the average weekday AM and PM peak hours. This helps visualise the goodness of fit. An R² value
Waverley & Guildford Local Plan Model Development Validation Report
Issue No. 02 Page 10 Document No. 53613T45\02
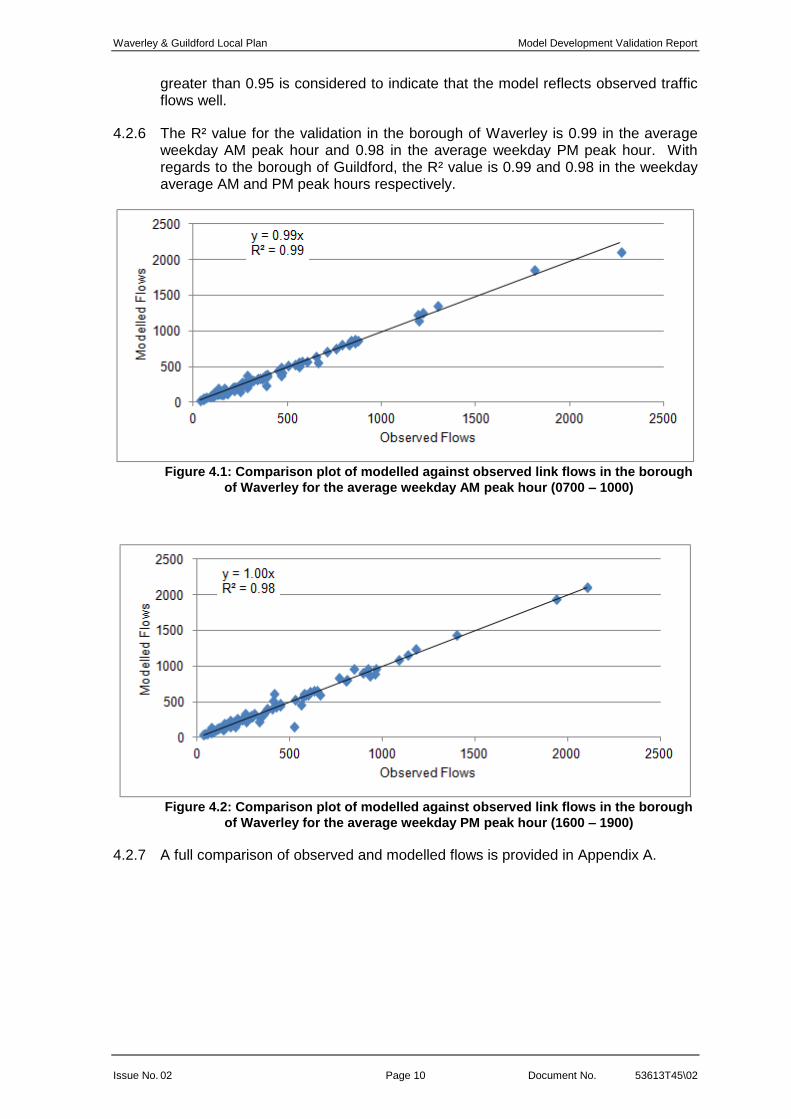
greater than 0.95 is considered to indicate that the model reflects observed traffic flows well.
4.2.6 The R² value for the validation in the borough of Waverley is 0.99 in the average weekday AM peak hour and 0.98 in the average weekday PM peak hour. With regards to the borough of Guildford, the R² value is 0.99 and 0.98 in the weekday average AM and PM peak hours respectively.
Figure 4.1: Comparison plot of modelled against observed link flows in the borough
of Waverley for the average weekday AM peak hour (0700 – 1000)
Figure 4.2: Comparison plot of modelled against observed link flows in the borough
of Waverley for the average weekday PM peak hour (1600 – 1900)
4.2.7 A full comparison of observed and modelled flows is provided in Appendix A.

Waverley & Guildford Local Plan Model Development Validation Report
Issue No. 02 Page 11 Document No. 53613T45\02
Figure 4.3: Comparison plot of modelled against observed link flows in the borough
of Guildford for the average weekday AM peak hour (0700 – 1000)
Figure 4.4: Comparison plot of modelled against observed link flows in the borough
of Guildford for the average weekday PM peak hour (1600 – 1900)
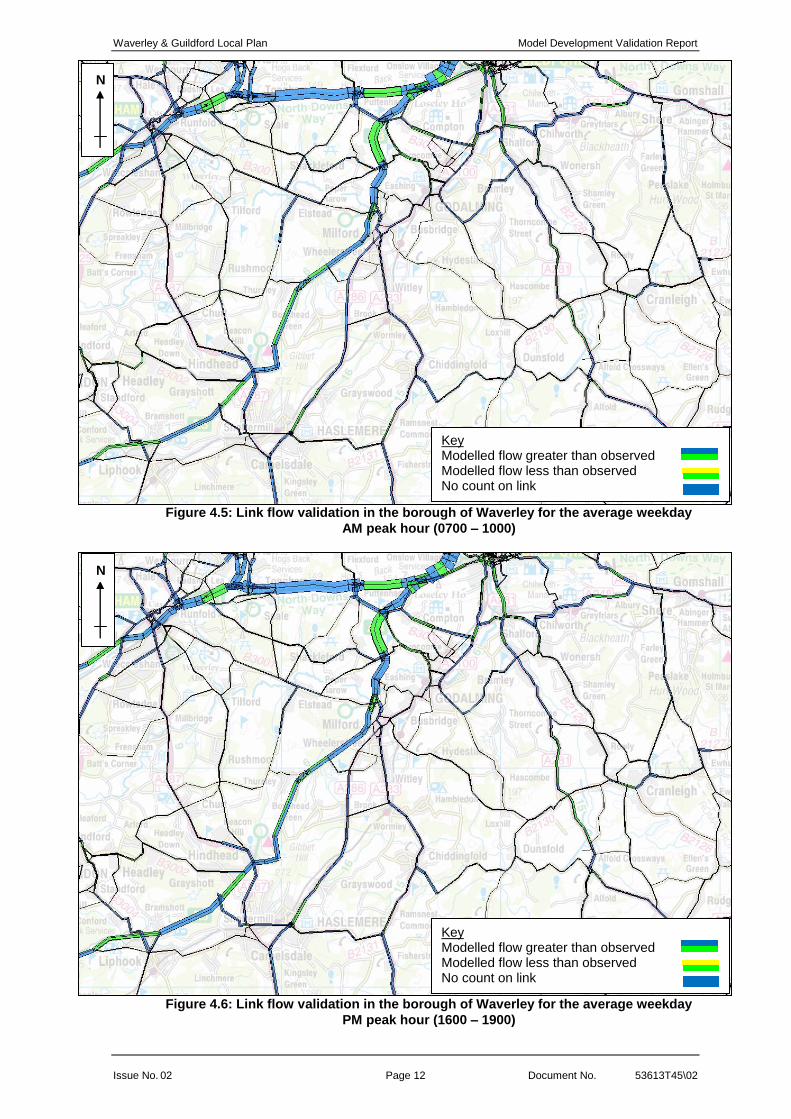
4.2.8 Figures 4.5 to 4.8 display the observed versus model flow bandwidth plots for both Waverley and Guildford boroughs and for each model time period.
4.2.9 The bandwidths are proportional to the level of flow. A bandwidth coloured green indicates that an observed count is present on the link. Where the green bands are showing a yellow edge, the model flow is less than the observed flow. Where the green bands show a blue edge, the model flow is greater than the observed flow. Neither Waverley or Guildford are presenting model links with large yellow or blue edges to the green bands, this infers that the link flows are validating well in the model with minimal flows being over or under estimated by the model.
Waverley & Guildford Local Plan Model Development Validation Report
Issue No. 02 Page 12 Document No. 53613T45\02
Figure 4.5: Link flow validation in the borough of Waverley for the average weekday
AM peak hour (0700 – 1000)
Figure 4.6: Link flow validation in the borough of Waverley for the average weekday
PM peak hour (1600 – 1900)
Key Modelled flow greater than observed Modelled flow less than observed No count on link
Key Modelled flow greater than observed Modelled flow less than observed No count on link
N
Key Modelled flow greater than observed Modelled flow less than observed No count on link
N

Waverley & Guildford Local Plan Model Development Validation Report
Issue No. 02 Page 13 Document No. 53613T45\02
Key Modelled flow greater than observed Modelled flow less than observed No count on link
N
Figure 4.7: Link flow validation in the borough of Guildford for the average weekday
AM peak hour (0700 – 1000)
Figure 4.8: Link flow validation in the borough of Guildford for the average weekday
PM peak hour (1600 – 1900)
Key Modelled flow greater than observed Modelled flow less than observed No count on link
N
Waverley & Guildford Local Plan Model Development Validation Report
Issue No. 02 Page 14 Document No. 53613T45\02
4.3 Journey Time Validation
4.3.1 Journey time validation was not undertaken in the borough of Waverley. This was due to the very restricted timescales of the joint Waverley and Guildford Local Plan strategic transport assessment project, not allowing journey time routes to be extracted for Waverley.
4.3.2 However, it was possible to undertake journey time validation for the borough of Guildford as data was already available from previous assessment work.
4.3.3 Observed and model journey times have been compared for each model time period, in accordance with the DfT’s validation acceptability guidelines
2, presented
in Table 4.4.
Criteria Acceptability
Guidelines
Journey Times
Modelled journey times along routes should be within 15% of surveyed times, or 1 minute if higher
> 85% of routes
Table 4.4: Journey time validation acceptability guidelines
4.3.4 Observed journey times were acquired from Strat-e-gis Congestion, developed by Mott MacDonald. Strat-e-gis Congestion utilises congestion data supplied by Trafficmaster plc that is mapped to the Ordnance Survey (OS) Integrated Transport Network (ITN) in order to calculate journey time by ITN link. The Trafficmaster data is obtained from GPS-equipped vehicles traversing the highway.
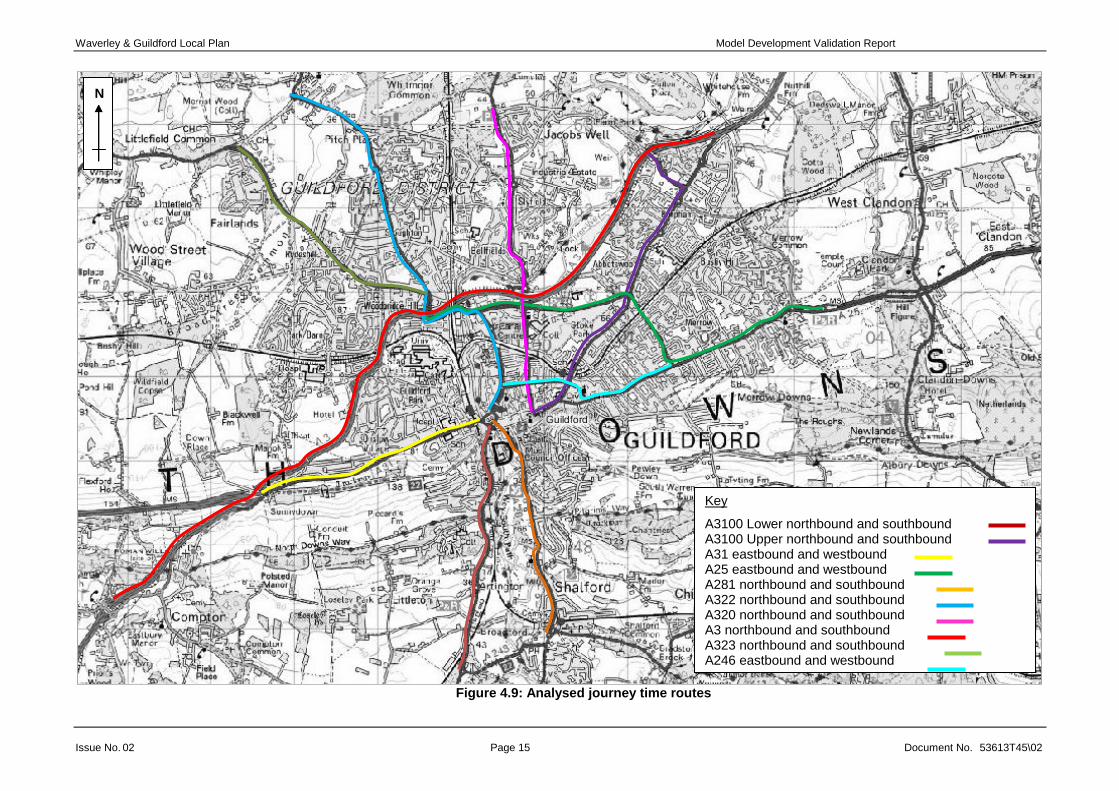
4.3.5 Observed journey times were compared with those from the model across twenty
key routes in the study area, as shown by Figure 4.9.
4.3.6 Tables 4.5 and 4.6 present the journey time validation results by time period for the borough of Guildford. Both weekday average AM and PM peak journey times
achieve the criteria set out in Table 4.4
4.3.7 Presentation of each analysed journey time route by distance is provided in
Appendix B.
2 Department for Transport (2014) Transport Appraisal Guidance Unit M3.1, Highway Assignment Modelling.
Key Modelled flow greater than observed Modelled flow less than observed No count on link
Key Modelled flow greater than observed Modelled flow less than observed No count on link
Key Modelled flow greater than observed Modelled flow less than observed No count on link
Waverley & Guildford Local Plan Model Development Validation Report
Issue No. 02 Page 15 Document No. 53613T45\02
Figure 4.9: Analysed journey time routes
N
Key
A3100 Lower northbound and southbound A3100 Upper northbound and southbound A31 eastbound and westbound A25 eastbound and westbound A281 northbound and southbound A322 northbound and southbound A320 northbound and southbound A3 northbound and southbound A323 northbound and southbound A246 eastbound and westbound

Waverley & Guildford Local Plan Model Development Validation Report
Issue No. 02 Page 16 Document No. 53613T45\02
Route Description Length
(km)
Observed
Time (secs)
Modelled
Time (secs)
Observed 95%
Confidence Interval Difference %
Difference Met Criteria
Lower Upper
1: A3100 northbound lower 3.05 333 310 307 360 -23 -7%
2: A3100 northbound upper 4.01 505 478 438 572 -27 -5%
3. A3100 southbound upper 4.03 577 474 491 664 -104 -18%
4: A3100 southbound lower 3.05 277 261 258 296 -16 -6%
5: A31 eastbound 2.73 418 398 386 449 -19 -5%
6: A3 westbound 2.76 197 214 191 203 18 9%
7: A25 eastbound 6.65 713 742 662 764 29 4%
8: A25 westbound 6.66 870 750 769 972 -120 -14%
9: A281 northbound 2.68 356 346 327 386 -11 -3%
10: A281 southbound 2.71 261 295 239 283 33 13%
11: A322 northbound 5.37 615 790 568 661 176 29%
12: A322 southbound 5.31 880 751 781 980 -130 -15%
13: A320 northbound 3.76 547 548 483 611 2 0%
14: A320 southbound 3.77 740 626 633 847 -114 -15%
15: A3 northbound 9.11 456 515 443 468 59 13%
16: A3 southbound 10.33 450 418 437 462 -32 -7%
17: A323 northbound 2.99 228 227 210 245 -1 0%
18: A323 southbound 2.99 335 294 304 366 -41 -12%
19: A246 eastbound 2.25 350 356 314 386 6 2%
20: A246 westbound 2.27 383 313 334 431 -69 -18%
Total number of routes that meet the criteria 17
Percentage of routes that meet the criteria 85%
Within DfT acceptability guidelines Yes
Table 4.5: Journey time validation results in Guildford borough for the average weekday AM peak hour (0700 – 1000)

Waverley & Guildford Local Plan Model Development Validation Report
Issue No. 02 Page 17 Document No. 53613T45\02
Route Description Length
(km)
Observed
Time (secs)
Modelled
Time (secs)
Observed 95%
Confidence Interval Difference %
Difference Met Criteria
Lower Upper
1: A3100 northbound lower 3.05 313 282 280 346 -31 -10% 2: A3100 northbound upper 4.01 574 523 508 639 -51 -9% 3. A3100 southbound upper 4.03 540 479 454 627 -62 -11% 4: A3100 southbound lower 3.05 287 277 257 318 -10 -4% 5: A31 eastbound 2.73 335 283 289 381 -52 -16% 6: A3 westbound 2.76 206 237 201 212 31 15% 7: A25 eastbound 6.65 787 776 725 849 -11 -1% 8: A25 westbound 6.66 781 738 716 846 -43 -5% 9: A281 northbound 2.68 308 284 277 338 -24 -8% 10: A281 southbound 2.71 311 331 279 343 20 6% 11: A322 northbound 5.37 782 854 708 855 72 9% 12: A322 southbound 5.31 826 717 727 926 -109 -13% 13: A320 northbound 3.76 747 597 610 883 -150 -20%
14: A320 southbound 3.77 608 633 526 690 25 4% 15: A3 northbound 9.11 367 357 357 377 -11 -3% 16: A3 southbound 10.33 533 534 517 548 1 0% 17: A323 northbound 2.99 225 243 216 233 19 8% 18: A323 southbound 2.99 229 295 216 243 66 29%
19: A246 eastbound 2.25 393 424 350 436 31 8% 20: A246 westbound 2.27 372 331 323 421 -41 -11%
Total number of routes that meet the criteria 18
Percentage of routes that meet the criteria 90%
Within DfT acceptability guidelines Yes
Table 4.6: Journey time validation results in Guildford borough for the average weekday PM peak hour (1600 – 1900)

Waverley & Guildford Local Plan Model Development Validation Report
Issue No. 02 Page 18 Document No. 53613T45\02
5 CONCLUSION
5.1.1 This document sets out the development and validation of Surrey County Council’s strategic transport model, SINTRAM, in the boroughs of Waverley and Guildford for their strategic Local Plan transport assessments
5.1.2 Observed and modelled traffic flows have been presented and compared. Similarly observed journey times along key corridors in Guildford borough have been compared with output from the model.
5.1.3 It is considered that the model is suitable for the assessment of both Waverley and Guildford Local Plan.
Waverley & Guildford Local Plan Model Development Validation Report
Issue No. 02 Page 19 Document No. 53613T45\02
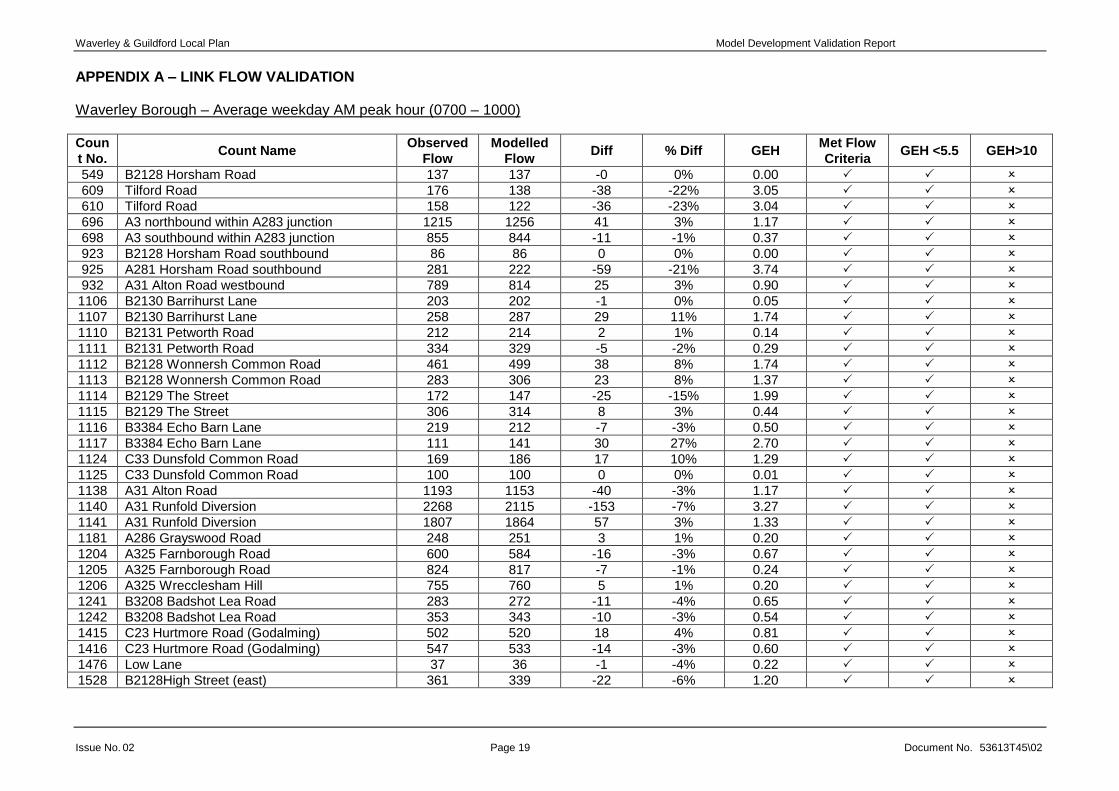
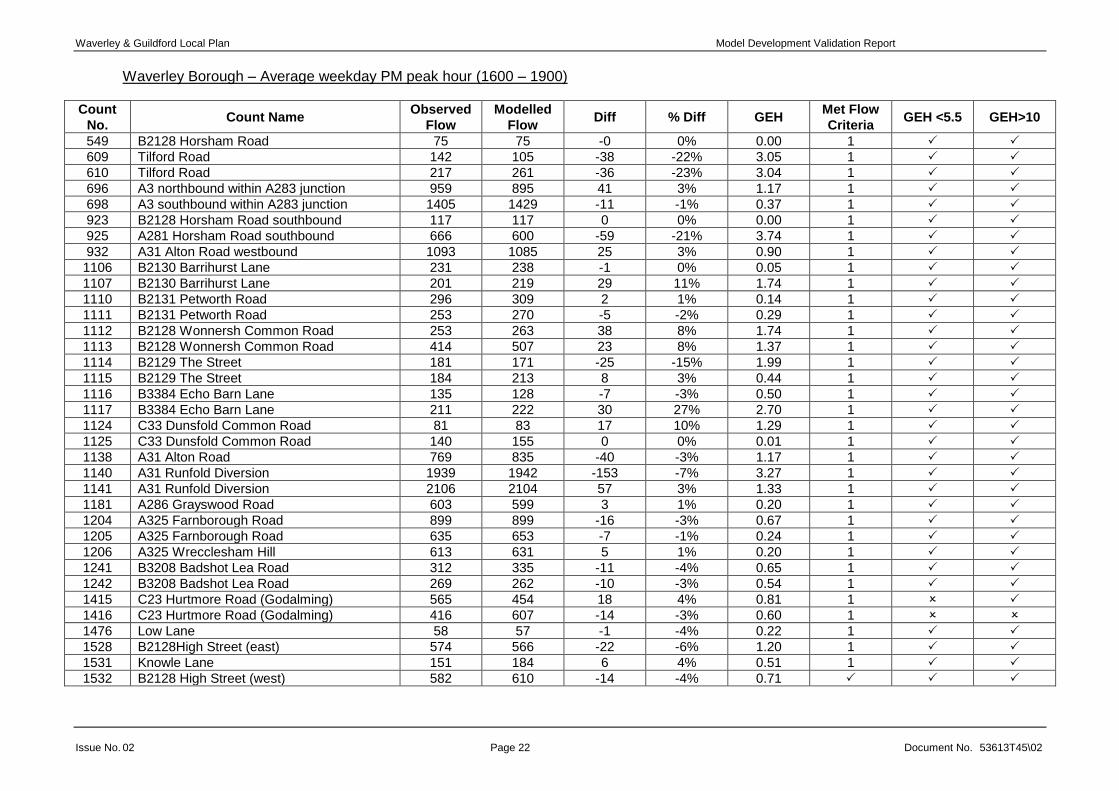
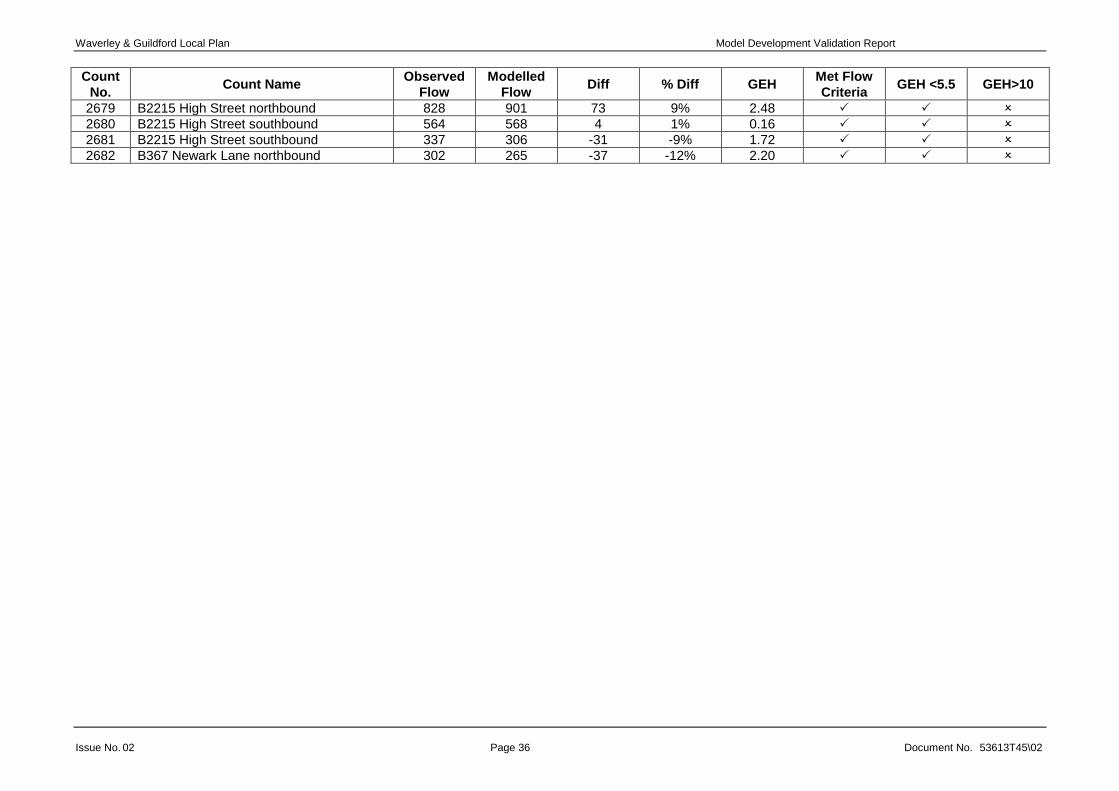
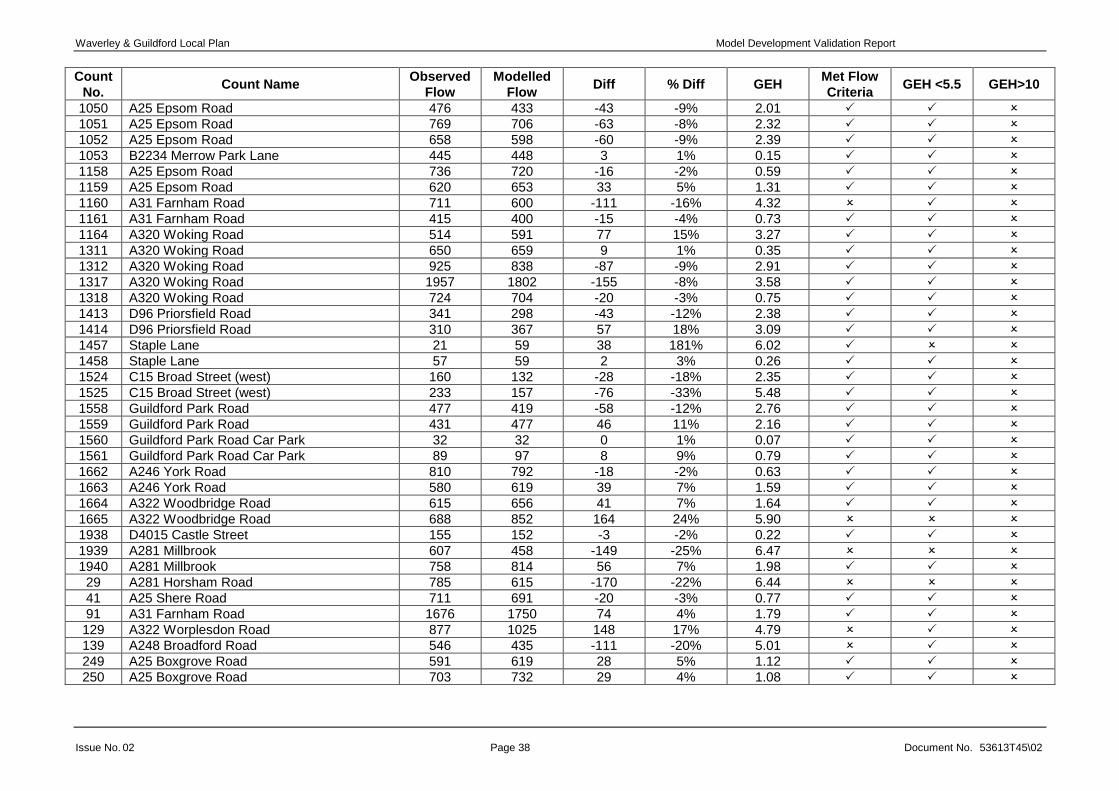
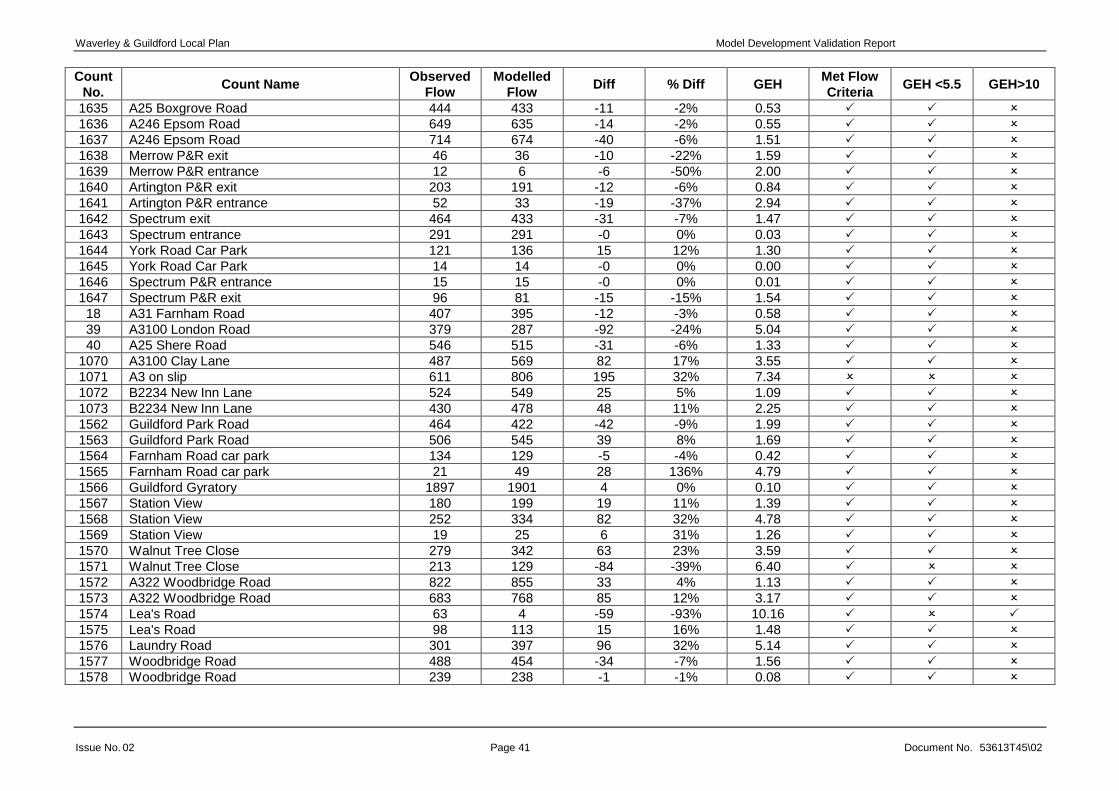
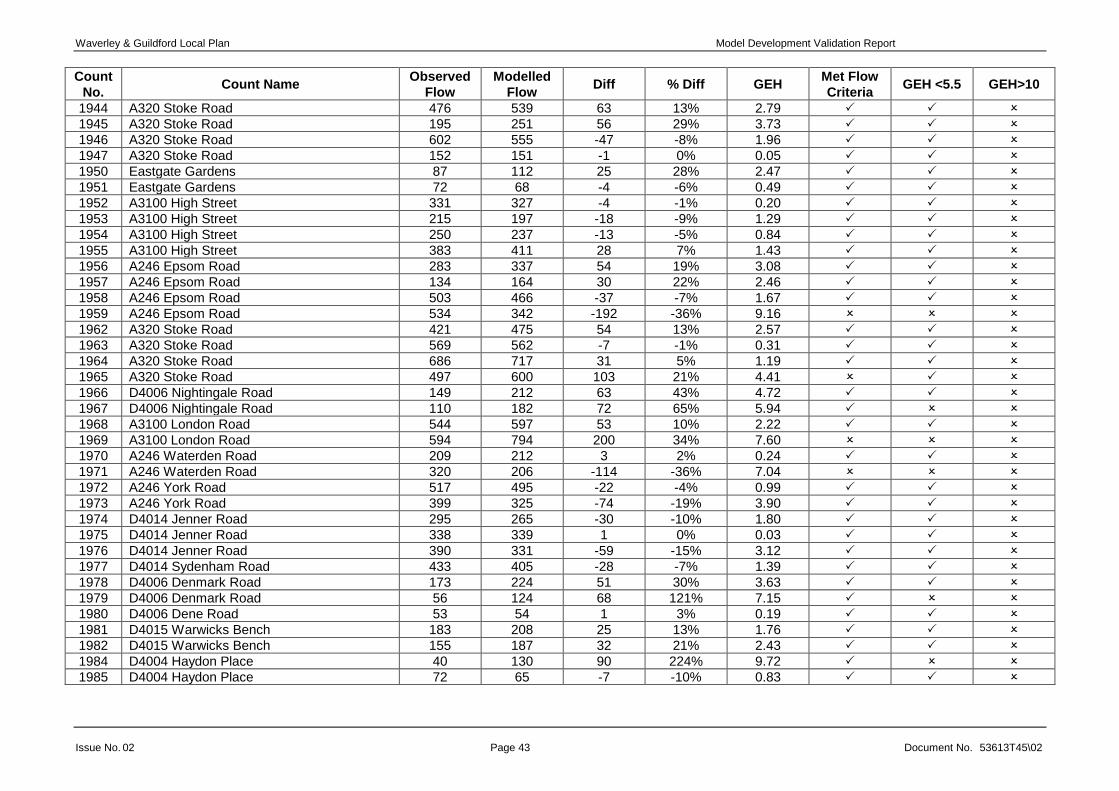
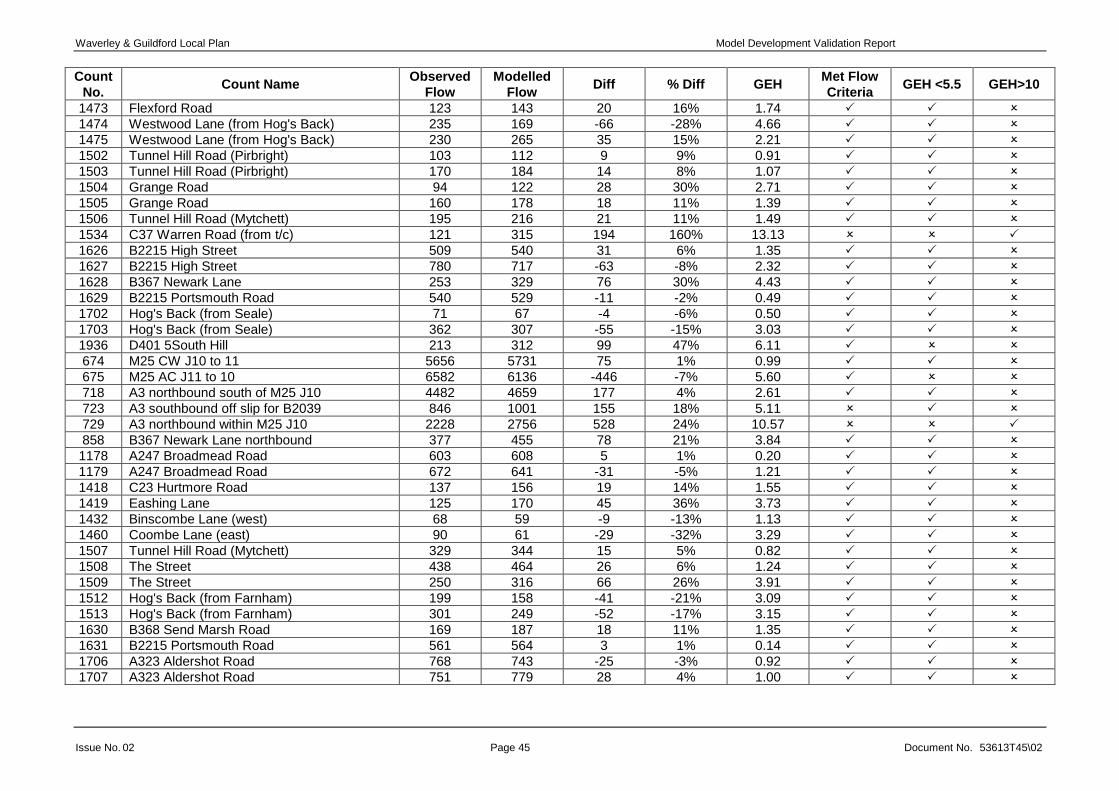
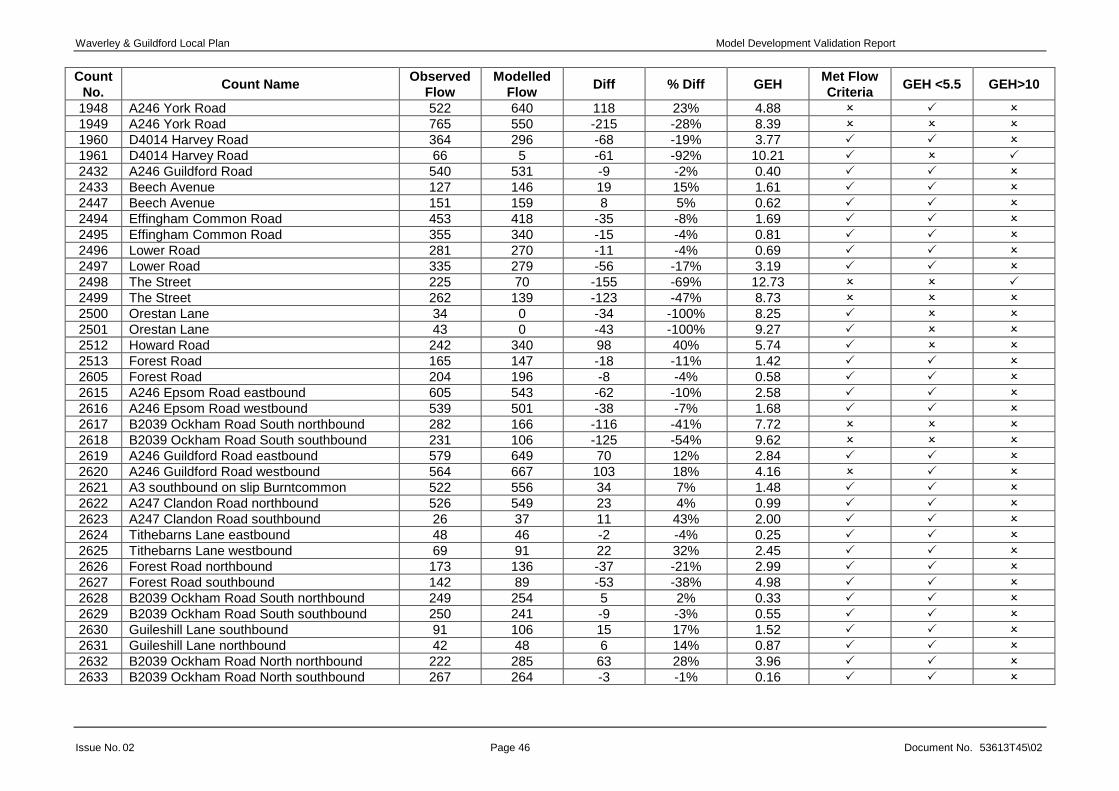
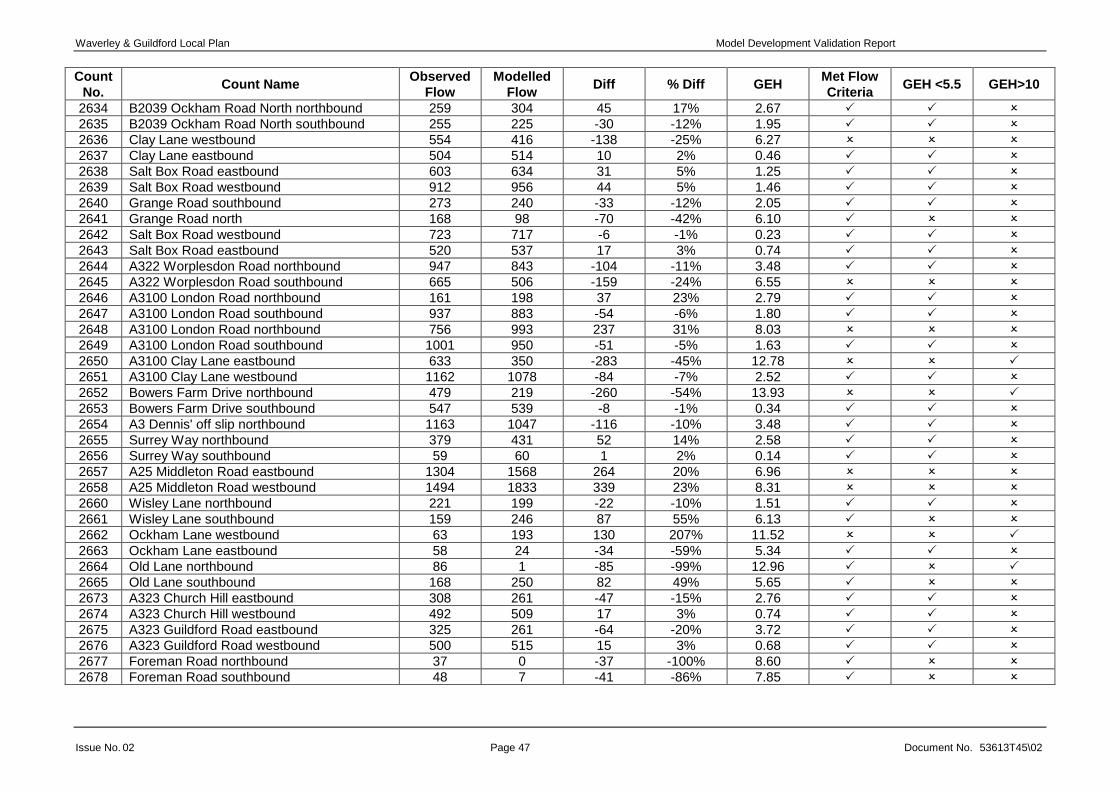
APPENDIX A – LINK FLOW VALIDATION
Waverley Borough – Average weekday AM peak hour (0700 – 1000)
Coun
t No. Count Name
Observed
Flow
Modelled
Flow Diff % Diff GEH
Met Flow
Criteria GEH <5.5 GEH>10
549 B2128 Horsham Road 137 137 -0 0% 0.00
609 Tilford Road 176 138 -38 -22% 3.05
610 Tilford Road 158 122 -36 -23% 3.04
696 A3 northbound within A283 junction 1215 1256 41 3% 1.17
698 A3 southbound within A283 junction 855 844 -11 -1% 0.37
923 B2128 Horsham Road southbound 86 86 0 0% 0.00
925 A281 Horsham Road southbound 281 222 -59 -21% 3.74
932 A31 Alton Road westbound 789 814 25 3% 0.90
1106 B2130 Barrihurst Lane 203 202 -1 0% 0.05
1107 B2130 Barrihurst Lane 258 287 29 11% 1.74
1110 B2131 Petworth Road 212 214 2 1% 0.14
1111 B2131 Petworth Road 334 329 -5 -2% 0.29
1112 B2128 Wonnersh Common Road 461 499 38 8% 1.74
1113 B2128 Wonnersh Common Road 283 306 23 8% 1.37
1114 B2129 The Street 172 147 -25 -15% 1.99
1115 B2129 The Street 306 314 8 3% 0.44
1116 B3384 Echo Barn Lane 219 212 -7 -3% 0.50
1117 B3384 Echo Barn Lane 111 141 30 27% 2.70
1124 C33 Dunsfold Common Road 169 186 17 10% 1.29
1125 C33 Dunsfold Common Road 100 100 0 0% 0.01
1138 A31 Alton Road 1193 1153 -40 -3% 1.17
1140 A31 Runfold Diversion 2268 2115 -153 -7% 3.27
1141 A31 Runfold Diversion 1807 1864 57 3% 1.33
1181 A286 Grayswood Road 248 251 3 1% 0.20
1204 A325 Farnborough Road 600 584 -16 -3% 0.67
1205 A325 Farnborough Road 824 817 -7 -1% 0.24
1206 A325 Wrecclesham Hill 755 760 5 1% 0.20
1241 B3208 Badshot Lea Road 283 272 -11 -4% 0.65
1242 B3208 Badshot Lea Road 353 343 -10 -3% 0.54
1415 C23 Hurtmore Road (Godalming) 502 520 18 4% 0.81
1416 C23 Hurtmore Road (Godalming) 547 533 -14 -3% 0.60
1476 Low Lane 37 36 -1 -4% 0.22
1528 B2128High Street (east) 361 339 -22 -6% 1.20

Waverley & Guildford Local Plan Model Development Validation Report
Issue No. 02 Page 20 Document No. 53613T45\02
Coun
t No. Count Name
Observed
Flow
Modelled
Flow Diff % Diff GEH
Met Flow
Criteria GEH <5.5 GEH>10
1531 Knowle Lane 135 141 6 4% 0.51
1532 B2128 High Street (west) 369 355 -14 -4% 0.71
1533 B2128 High Street (west) 559 564 5 1% 0.20
1542 Menin Way 161 201 40 25% 2.98
1543 Menin Way 90 104 14 15% 1.40
1544 C28 Tilford Road (Tilford) 130 202 72 55% 5.58
1545 C28 Tilford Road (Tilford) 104 111 7 7% 0.70
1546 Great Austins 244 154 -90 -37% 6.36
1547 Great Austins 180 132 -48 -27% 3.85
1556 B2127 Bookhurst Road (from Ewhurst) 241 238 -3 -1% 0.22
1557 B2127 Bookhurst Road (from Ewhurst) 289 281 -8 -3% 0.46
1731 A0283 Cripplecrutch Hill 450 446 -4 -1% 0.19
1732 A0283 Cripplecrutch Hill 211 211 -0 0% 0.01
1735 A3 southbound off slip for A283 467 418 -49 -11% 2.35
1736 A3 northbound B2171 to A287 828 841 13 2% 0.46
1737 A3 southbound A287 to B2171 853 887 34 4% 1.15
1743 A287 Hindhead Road 391 393 2 0% 0.08
1744 A287 Hindhead Road 391 374 -17 -4% 0.85
1747 A3 Portsmouth Road 1295 1358 63 5% 1.74
1750 Borough Road 279 277 -2 -1% 0.12
1751 Borough Road 303 303 0 0% 0.02
1754 C23 Chalk Road 283 377 94 33% 5.16
1755 C23 Chalk Road 226 208 -18 -8% 1.20
1756 Hare Lane 127 123 -4 -3% 0.38
1757 Hare Lane 128 136 8 6% 0.71
1760 B2130 Elmbridge Road 214 178 -36 -17% 2.61
1761 B2130 Elmbridge Road 203 198 -5 -3% 0.37
1762 A281 Horsham Road 649 646 -3 0% 0.10
1763 A281 Horsham Road 256 237 -19 -7% 1.20
1764 B2133 Loxwood Road 381 382 1 0% 0.05
1765 B2133 Loxwood Road 133 129 -4 -3% 0.35
1766 A281 Horsham Road 536 532 -4 -1% 0.18
1767 A281 Horsham Road 272 251 -21 -8% 1.33
1794 A3 southbound within Thursley junction 836 870 34 4% 1.16
1912 A3 northbound exit for A283 102 102 0 0% 0.02
1913 A3 A287 to Thursley 1188 1231 43 4% 1.24
1918 Thursley Road 68 76 8 11% 0.91

Waverley & Guildford Local Plan Model Development Validation Report
Issue No. 02 Page 21 Document No. 53613T45\02
Coun
t No. Count Name
Observed
Flow
Modelled
Flow Diff % Diff GEH
Met Flow
Criteria GEH <5.5 GEH>10
1919 Thursley Road 51 57 6 11% 0.77
1920 A287 Frensham Road 313 311 -2 -1% 0.10
1921 A287 Frensham Road 229 220 -9 -4% 0.63
222 A286 Grayswood Road 869 874 5 1% 0.18
223 A286 Grayswood Road 340 339 -1 0% 0.05
1180 A286 Grayswood Road 706 715 9 1% 0.35
1207 A325 Wrecclesham Hill 559 512 -47 -8% 2.04
1435 Farncombe Street (Level Crossing) 139 149 10 7% 0.81
1436 Farncombe Street (Level Crossing) 153 156 3 2% 0.22
1470 C23 Charterhouse Road 383 243 -140 -36% 7.89
1471 C23 Charterhouse Road 466 380 -86 -18% 4.18
1477 Low Lane 144 113 -31 -21% 2.70
1529 B2128 High Street (east) 577 579 2 0% 0.10
1530 Knowle Lane 108 108 0 0% 0.04
1710 B3007 Weybourne Road 48 48 -0 -1% 0.07
2668 Horseshoe Lane eastbound 91 90 -1 -1% 0.12
2669 Horseshoe Lane westbound 56 62 6 12% 0.84
2670 A281 Horsham Road northbound 657 567 -90 -14% 3.65
2671 A281 Horsham Road northbound 559 567 8 1% 0.33
2672 A281 Horsham Road southbound 233 222 -11 -5% 0.75
Waverley & Guildford Local Plan Model Development Validation Report
Issue No. 02 Page 22 Document No. 53613T45\02
Waverley Borough – Average weekday PM peak hour (1600 – 1900)
Count
No. Count Name
Observed
Flow
Modelled
Flow Diff % Diff GEH
Met Flow
Criteria GEH <5.5 GEH>10
549 B2128 Horsham Road 75 75 -0 0% 0.00 1
609 Tilford Road 142 105 -38 -22% 3.05 1
610 Tilford Road 217 261 -36 -23% 3.04 1
696 A3 northbound within A283 junction 959 895 41 3% 1.17 1
698 A3 southbound within A283 junction 1405 1429 -11 -1% 0.37 1
923 B2128 Horsham Road southbound 117 117 0 0% 0.00 1
925 A281 Horsham Road southbound 666 600 -59 -21% 3.74 1
932 A31 Alton Road westbound 1093 1085 25 3% 0.90 1
1106 B2130 Barrihurst Lane 231 238 -1 0% 0.05 1
1107 B2130 Barrihurst Lane 201 219 29 11% 1.74 1
1110 B2131 Petworth Road 296 309 2 1% 0.14 1
1111 B2131 Petworth Road 253 270 -5 -2% 0.29 1
1112 B2128 Wonnersh Common Road 253 263 38 8% 1.74 1
1113 B2128 Wonnersh Common Road 414 507 23 8% 1.37 1
1114 B2129 The Street 181 171 -25 -15% 1.99 1
1115 B2129 The Street 184 213 8 3% 0.44 1
1116 B3384 Echo Barn Lane 135 128 -7 -3% 0.50 1
1117 B3384 Echo Barn Lane 211 222 30 27% 2.70 1
1124 C33 Dunsfold Common Road 81 83 17 10% 1.29 1
1125 C33 Dunsfold Common Road 140 155 0 0% 0.01 1
1138 A31 Alton Road 769 835 -40 -3% 1.17 1
1140 A31 Runfold Diversion 1939 1942 -153 -7% 3.27 1
1141 A31 Runfold Diversion 2106 2104 57 3% 1.33 1
1181 A286 Grayswood Road 603 599 3 1% 0.20 1
1204 A325 Farnborough Road 899 899 -16 -3% 0.67 1
1205 A325 Farnborough Road 635 653 -7 -1% 0.24 1
1206 A325 Wrecclesham Hill 613 631 5 1% 0.20 1
1241 B3208 Badshot Lea Road 312 335 -11 -4% 0.65 1
1242 B3208 Badshot Lea Road 269 262 -10 -3% 0.54 1
1415 C23 Hurtmore Road (Godalming) 565 454 18 4% 0.81 1
1416 C23 Hurtmore Road (Godalming) 416 607 -14 -3% 0.60 1
1476 Low Lane 58 57 -1 -4% 0.22 1
1528 B2128High Street (east) 574 566 -22 -6% 1.20 1
1531 Knowle Lane 151 184 6 4% 0.51 1
1532 B2128 High Street (west) 582 610 -14 -4% 0.71

Waverley & Guildford Local Plan Model Development Validation Report
Issue No. 02 Page 23 Document No. 53613T45\02
Count
No. Count Name
Observed
Flow
Modelled
Flow Diff % Diff GEH
Met Flow
Criteria GEH <5.5 GEH>10
1533 B2128 High Street (west) 380 381 5 1% 0.20
1542 Menin Way 77 136 40 25% 2.98
1543 Menin Way 136 119 14 15% 1.40
1544 C28 Tilford Road (Tilford) 105 110 72 55% 5.58
1545 C28 Tilford Road (Tilford) 97 94 7 7% 0.70
1546 Great Austins 156 132 -90 -37% 6.36
1547 Great Austins 296 287 -48 -27% 3.85
1556 B2127 Bookhurst Road (from Ewhurst) 270 272 -3 -1% 0.22
1557 B2127 Bookhurst Road (from Ewhurst) 248 246 -8 -3% 0.46
1731 A0283 Cripplecrutch Hill 225 224 -4 -1% 0.19
1732 A0283 Cripplecrutch Hill 450 464 -0 0% 0.01
1735 A3 southbound off slip for A283 933 861 -49 -11% 2.35
1736 A3 northbound B2171 to A287 965 965 13 2% 0.46
1737 A3 southbound A287 to B2171 1183 1234 34 4% 1.15
1743 A287 Hindhead Road 430 446 2 0% 0.08
1744 A287 Hindhead Road 430 426 -17 -4% 0.85
1747 A3 Portsmouth Road 851 961 63 5% 1.74
1750 Borough Road 341 276 -2 -1% 0.12
1751 Borough Road 274 293 0 0% 0.02
1754 C23 Chalk Road 262 329 94 33% 5.16
1755 C23 Chalk Road 357 320 -18 -8% 1.20
1756 Hare Lane 145 136 -4 -3% 0.38
1757 Hare Lane 124 129 8 6% 0.71
1760 B2130 Elmbridge Road 209 181 -36 -17% 2.61
1761 B2130 Elmbridge Road 210 143 -5 -3% 0.37
1762 A281 Horsham Road 295 289 -3 0% 0.10
1763 A281 Horsham Road 652 655 -19 -7% 1.20
1764 B2133 Loxwood Road 183 154 1 0% 0.05
1765 B2133 Loxwood Road 365 340 -4 -3% 0.35
1766 A281 Horsham Road 295 288 -4 -1% 0.18
1767 A281 Horsham Road 533 523 -21 -8% 1.33
1794 A3 southbound within Thursley junction 1139 1160 34 4% 1.16
1912 A3 northbound exit for A283 78 66 0 0% 0.02
1913 A3 A287 to Thursley 922 957 43 4% 1.24
1918 Thursley Road 46 51 8 11% 0.91
1919 Thursley Road 71 74 6 11% 0.77
1920 A287 Frensham Road 207 210 -2 -1% 0.10

Waverley & Guildford Local Plan Model Development Validation Report
Issue No. 02 Page 24 Document No. 53613T45\02
Count
No. Count Name
Observed
Flow
Modelled
Flow Diff % Diff GEH
Met Flow
Criteria GEH <5.5 GEH>10
1921 A287 Frensham Road 291 292 -9 -4% 0.63
222 A286 Grayswood Road 450 439 5 1% 0.18
223 A286 Grayswood Road 804 798 -1 0% 0.05
1180 A286 Grayswood Road 299 293 9 1% 0.35
1207 A325 Wrecclesham Hill 809 803 -47 -8% 2.04
1435 Farncombe Street (Level Crossing) 184 234 10 7% 0.81
1436 Farncombe Street (Level Crossing) 163 197 3 2% 0.22
1470 C23 Charterhouse Road 526 153 -140 -36% 7.89
1471 C23 Charterhouse Road 379 395 -86 -18% 4.18
1477 Low Lane 89 85 -31 -21% 2.70
1529 B2128 High Street (east) 408 406 2 0% 0.10
1530 Knowle Lane 113 117 0 0% 0.04
1710 B3007 Weybourne Road 39 40 -0 -1% 0.07
2668 Horseshoe Lane eastbound 87 81 -1 -1% 0.12
2669 Horseshoe Lane westbound 84 82 6 12% 0.84
2670 A281 Horsham Road northbound 338 215 -90 -14% 3.65
2671 A281 Horsham Road northbound 269 215 8 1% 0.33
2672 A281 Horsham Road southbound 591 600 -11 -5% 0.75

Waverley & Guildford Local Plan Model Development Validation Report
Issue No. 02 Page 25 Document No. 53613T45\02
Guildford Borough – Average weekday AM peak hour (0700 – 1000)
Count
No. Count Name
Observed
Flow
Modelled
Flow Diff % Diff GEH
Met Flow
Criteria GEH <5.5 GEH>10
28 A281 Horsham Road 863 821 -42 -5% 1.46
38 A3100 London Road 262 236 -26 -10% 1.62
90 A31 Farnham Road 1611 1822 211 13% 5.08
128 A322 Worplesdon Road 823 878 55 7% 1.90
138 A248 Broadford Road 452 455 3 1% 0.16
392 A25 Woodbridge Road 2303 2279 -24 -1% 0.51
393 A25 Woodbridge Road 1489 1345 -144 -10% 3.83
513 A248 The Street 506 531 25 5% 1.10
514 A248 The Street 723 704 -19 -3% 0.71
527 A320 Woking Road 590 526 -64 -11% 2.72
528 A320 Woking Road 808 813 5 1% 0.19
575 A25 Parkway 731 965 234 32% 8.03
576 A25 Parkway 803 764 -39 -5% 1.38
621 Mangles Road 221 212 -9 -4% 0.64
622 Mangles Road 131 121 -10 -8% 0.89
623 Stoughton Road 330 292 -38 -12% 2.16
624 Stoughton Road 251 288 37 15% 2.25
643 A320 Woking Road 794 786 -8 -1% 0.27
646 A25 Epsom Road 473 469 -4 -1% 0.20
648 A281 Shalford Road 997 1055 58 6% 1.80
700 A3 northbound B3000 to A31 2350 2455 105 4% 2.14
701 A3 southbound off slip for A31 1285 1400 115 9% 3.13
702 A3 northbound off slip for Dennisville 673 639 -34 -5% 1.34
703 A3 northbound on slip at Dennisville 468 483 15 3% 0.70
757 A3 Guildford & Godalming By-pass 3690 3907 217 6% 3.52
771 A3 Godalming By-pass 2415 2521 106 4% 2.14
843 A3 Guildford By-pass 3472 3284 -188 -5% 3.24
862 A323 Aldershot Road westbound 433 332 -101 -23% 5.18
976 A320 Woking Road southbound 842 968 126 15% 4.18
977 A25 Epsom Road westbound 446 366 -80 -18% 3.96
978 A281 The Street southbound 592 670 78 13% 3.12
979 A3100 Portsmouth Road northbound 645 654 9 1% 0.36
1031 A25 Epsom Road 446 444 -2 0% 0.09
1032 A25 Epsom Road 473 451 -22 -5% 1.03
1049 A25 Epsom Road 330 325 -5 -1% 0.27

Waverley & Guildford Local Plan Model Development Validation Report
Issue No. 02 Page 26 Document No. 53613T45\02
Count
No. Count Name
Observed
Flow
Modelled
Flow Diff % Diff GEH
Met Flow
Criteria GEH <5.5 GEH>10
1050 A25 Epsom Road 490 471 -19 -4% 0.88
1051 A25 Epsom Road 572 576 4 1% 0.16
1052 A25 Epsom Road 580 533 -47 -8% 1.98
1053 B2234 Merrow Park Lane 455 466 11 2% 0.52
1158 A25 Epsom Road 524 586 62 12% 2.65
1159 A25 Epsom Road 633 667 34 5% 1.34
1160 A31 Farnham Road 321 299 -22 -7% 1.24
1161 A31 Farnham Road 694 671 -23 -3% 0.88
1164 A320 Woking Road 650 841 191 29% 6.99
1311 A320 Woking Road 849 943 94 11% 3.15
1312 A320 Woking Road 650 596 -54 -8% 2.16
1317 A320 Woking Road 1363 1351 -12 -1% 0.32
1318 A320 Woking Road 755 809 54 7% 1.94
1413 D96 Priorsfield Road 351 301 -50 -14% 2.78
1414 D96 Priorsfield Road 356 404 48 13% 2.45
1457 Staple Lane 53 29 -24 -45% 3.71
1458 Staple Lane 23 22 -1 -6% 0.29
1524 C15 Broad Street (west) 367 165 -202 -55% 12.40
1525 C15 Broad Street (west) 163 126 -37 -23% 3.10
1558 Guildford Park Road 384 367 -17 -4% 0.86
1559 Guildford Park Road 493 540 47 9% 2.06
1560 Guildford Park Road Car Park 122 125 3 2% 0.26
1561 Guildford Park Road Car Park 19 17 -2 -10% 0.45
1662 A246 York Road 692 558 -134 -19% 5.36
1663 A246 York Road 445 411 -34 -8% 1.66
1664 A322 Woodbridge Road 531 651 120 23% 4.95
1665 A322 Woodbridge Road 543 723 180 33% 7.17
1938 D4015 Castle Street 135 144 9 7% 0.76
1939 A281 Millbrook 794 753 -41 -5% 1.48
1940 A281 Millbrook 585 639 54 9% 2.19
29 A281 Horsham Road 590 387 -203 -34% 9.18
41 A25 Shere Road 494 494 0 0% 0.01
91 A31 Farnham Road 2196 2360 164 7% 3.43
129 A322 Worplesdon Road 1603 1828 225 14% 5.44
139 A248 Broadford Road 263 70 -193 -73% 14.92
249 A25 Boxgrove Road 701 655 -46 -7% 1.75
250 A25 Boxgrove Road 603 750 147 24% 5.66

Waverley & Guildford Local Plan Model Development Validation Report
Issue No. 02 Page 27 Document No. 53613T45\02
Count
No. Count Name
Observed
Flow
Modelled
Flow Diff % Diff GEH
Met Flow
Criteria GEH <5.5 GEH>10
394 A25 Ladymead 1290 1357 67 5% 1.83
395 A25 Ladymead 1365 1344 -21 -2% 0.57
529 A320 Guildford Road 1038 755 -283 -27% 9.44
530 A320 Guildford Road 938 801 -137 -15% 4.65
577 A320 Woking Road 633 519 -114 -18% 4.76
578 A320 Woking Road 670 606 -64 -10% 2.55
579 A320 Woking Road 875 778 -97 -11% 3.38
580 A320 Woking Road 690 722 32 5% 1.20
581 Hazel Avenue 167 142 -25 -15% 2.02
582 Hazel Avenue 374 289 -85 -23% 4.65
585 Woodlands Road 47 65 18 38% 2.38
586 Woodlands Road 66 60 -6 -9% 0.72
589 Clay Lane 1007 915 -92 -9% 2.97
590 Clay Lane 686 805 119 17% 4.35
591 Blanchards Hill 193 228 35 18% 2.42
592 Blanchards Hill 235 229 -6 -3% 0.42
593 Moorfield Road 682 675 -7 -1% 0.28
594 Moorfield Road 301 272 -29 -10% 1.73
595 Jacobs Well Road 155 83 -72 -46% 6.61
596 Jacobs Well Road 201 191 -10 -5% 0.74
625 A320 Woking Road 1546 1565 19 1% 0.49
626 A320 Woking Road 1209 1212 3 0% 0.08
627 A320 Stoke Road 532 642 110 21% 4.53
628 A320 Stoke Road 867 807 -60 -7% 2.07
650 A3100 Portsmouth Road 404 395 -9 -2% 0.47
704 A3 southbound off slip at Cathedral 947 952 5 1% 0.17
705 A3 southbound on slip from B3000 235 242 7 3% 0.44
707 A3 southbound A31 to B3000 1588 1475 -113 -7% 2.88
708 A3 southbound within A31 junction 1492 1382 -110 -7% 2.89
709 A3 northbound on slip from A31 1334 1519 185 14% 4.90
710 A3 on slip 694 723 29 4% 1.10
711 A3 southbound at Dennisville junction 2706 2845 139 5% 2.64
713 A3 northbound A320 to A3100 3108 3343 235 8% 4.13
714 A3 southbound A247 to A3100 3832 3894 62 2% 1.00
715 A3 southbound A320 to A322 2440 2388 -52 -2% 1.05
716 A3 northbound A322 to A320 2502 2619 117 5% 2.32
717 A3 southbound A322 to A31 2913 2782 -131 -4% 2.45

Waverley & Guildford Local Plan Model Development Validation Report
Issue No. 02 Page 28 Document No. 53613T45\02
Count
No. Count Name
Observed
Flow
Modelled
Flow Diff % Diff GEH
Met Flow
Criteria GEH <5.5 GEH>10
719 A3 northbound A31 to A322 3689 3974 285 8% 4.60
772 A3 Godalming By-pass 1426 1330 -96 -7% 2.59
863 A3 northbound off slip Puttenham 391 367 -24 -6% 1.21
980 A3 on slip Dennis' southbound 1067 1134 67 6% 2.03
981 A3 southbound off slip Burpham 593 611 18 3% 0.73
983 A3 southbound off slip Stoke Crossroads 984 895 -89 -9% 2.89
1054 B2234 Merrow Park Lane 358 396 38 11% 1.98
1057 A248 Kings Road 661 668 7 1% 0.26
1058 A248 Kings Road 343 332 -11 -3% 0.60
1059 A3100 London Road 587 671 84 14% 3.36
1060 A3100 London Road 859 774 -85 -10% 2.98
1061 A3100 London Road 374 447 73 20% 3.62
1063 D4009 Trodds Lane 263 261 -2 -1% 0.10
1064 D4009 Trodds Lane 199 188 -11 -5% 0.77
1065 C146 Guildford Park Road 535 497 -38 -7% 1.69
1066 C146 Guildford Park Road 423 417 -6 -1% 0.30
1067 A31 Farnham Road 893 914 21 2% 0.71
1068 A31 Farnham Road 830 800 -30 -4% 1.05
1069 A3100 Clay Lane 1022 1391 369 36% 10.63
1074 A3100 London Road 600 661 61 10% 2.41
1075 A3100 London Road 644 663 19 3% 0.74
1076 B3000 The Street 736 509 -227 -31% 9.10
1077 B3000 The Street 550 541 -9 -2% 0.37
1078 B3000 New Pond Lane 718 554 -164 -23% 6.49
1079 B3000 New Pond Lane 454 458 4 1% 0.19
1080 A3100 Old Portsmouth Road 779 621 -158 -20% 5.98
1081 A3100 Old Portsmouth Road 586 565 -21 -4% 0.89
1082 D4003 Walnut Tree Close 493 482 -11 -2% 0.51
1083 D4003 Walnut Tree Close 300 206 -94 -31% 5.93
1165 A320 Woking Road 515 602 87 17% 3.67
1166 A322 Worplesdon Road 498 571 73 15% 3.15
1167 A322 Worplesdon Road 488 478 -10 -2% 0.47
1169 A323 Aldershot Road 303 273 -30 -10% 1.76
1461 Coombe Lane (from Shere) 102 65 -37 -36% 4.01
1462 Coombe Lane (from Shere) 53 52 -1 -3% 0.20
1633 A322 Woodbridge Road 869 856 -13 -2% 0.45
1634 A25 Boxgrove Road 457 506 49 11% 2.23

Waverley & Guildford Local Plan Model Development Validation Report
Issue No. 02 Page 29 Document No. 53613T45\02
Count
No. Count Name
Observed
Flow
Modelled
Flow Diff % Diff GEH
Met Flow
Criteria GEH <5.5 GEH>10
1635 A25 Boxgrove Road 497 473 -24 -5% 1.11
1636 A246 Epsom Road 504 543 39 8% 1.69
1637 A246 Epsom Road 882 805 -77 -9% 2.65
1638 Merrow P&R exit 7 3 -4 -54% 1.69
1639 Merrow P&R entrance 56 46 -10 -18% 1.38
1640 Artington P&R exit 21 9 -12 -57% 3.10
1641 Artington P&R entrance 244 208 -36 -15% 2.37
1642 Spectrum exit 103 98 -5 -5% 0.50
1643 Spectrum entrance 298 301 3 1% 0.15
1644 York Road Car Park 5 5 -0 -1% 0.02
1645 York Road Car Park 125 124 -1 -1% 0.09
1646 Spectrum P&R entrance 97 89 -8 -8% 0.85
1647 Spectrum P&R exit 6 5 -1 -12% 0.30
18 A31 Farnham Road 574 578 4 1% 0.17
39 A3100 London Road 278 246 -32 -12% 1.99
40 A25 Shere Road 705 680 -25 -4% 0.96
1070 A3100 Clay Lane 482 497 15 3% 0.69
1071 A3 on slip 918 1004 86 9% 2.79
1072 B2234 New Inn Lane 464 439 -25 -5% 1.19
1073 B2234 New Inn Lane 522 545 23 4% 0.98
1562 Guildford Park Road 449 412 -37 -8% 1.76
1563 Guildford Park Road 456 477 21 5% 0.98
1564 Farnham Road car park 17 16 -1 -6% 0.26
1565 Farnham Road car park 163 160 -3 -2% 0.21
1566 Guildford Gyratory 2112 2182 70 3% 1.51
1567 Station View 253 262 9 4% 0.57
1568 Station View 235 280 45 19% 2.80
1569 Station View 87 99 12 14% 1.23
1570 Walnut Tree Close 322 345 23 7% 1.27
1571 Walnut Tree Close 237 150 -87 -37% 6.23
1572 A322 Woodbridge Road 799 719 -80 -10% 2.92
1573 A322 Woodbridge Road 857 875 18 2% 0.60
1574 Lea's Road 42 1 -41 -97% 8.70
1575 Lea's Road 229 230 1 0% 0.03
1576 Laundry Road 67 77 10 14% 1.13
1577 Woodbridge Road 309 250 -59 -19% 3.56
1578 Woodbridge Road 257 181 -76 -30% 5.13

Waverley & Guildford Local Plan Model Development Validation Report
Issue No. 02 Page 30 Document No. 53613T45\02
Count
No. Count Name
Observed
Flow
Modelled
Flow Diff % Diff GEH
Met Flow
Criteria GEH <5.5 GEH>10
1579 A322 Onslow Street 1193 1219 26 2% 0.76
1580 A322 Onslow Street 1337 1129 -208 -16% 5.94
1581 Guildford Gyratory 1919 1906 -13 -1% 0.30
1582 Guildford Gyratory 2063 1815 -248 -12% 5.63
1583 Guildford Gyratory 1971 1723 -248 -13% 5.78
1584 Guildford Gyratory 1980 1848 -132 -7% 3.02
1585 Guildford Gyratory 2076 2068 -8 0% 0.18
1586 A3100 Portsmouth Road 699 787 88 13% 3.23
1587 A3100 Portsmouth Road 604 567 -37 -6% 1.51
1588 Millmead 65 62 -3 -5% 0.40
1589 Millmead 20 22 2 8% 0.35
1590 A281 Millbrook 892 994 102 11% 3.33
1591 A281 Millbrook 882 869 -13 -1% 0.44
1592 North Street 92 92 0 1% 0.05
1593 Leapale Road 209 175 -34 -16% 2.43
1594 Woodbridge Road 163 86 -77 -47% 6.90
1595 Old Police Station car park entrance & Leapale
49 175 126 257% 11.91
1596 Old Police Station car park exit 23 59 36 156% 5.62
1597 Commercial Road car park entrance 14 52 38 270% 6.59
1598 Commercial Road car park exit 5 6 1 11% 0.25
1599 A320 Chertsey Street 146 212 66 45% 4.91
1600 A320 Chertsey Street 61 116 55 89% 5.81
1601 North Street 246 173 -73 -30% 5.02
1602 North Street 179 81 -98 -55% 8.61
1603 A320 High Street 274 298 24 9% 1.42
1604 A320 High Street 123 110 -13 -11% 1.25
1605 Leapale Road 170 52 -118 -69% 11.15
1606 North Street 235 180 -55 -24% 3.84
1607 Leapale Car Park Exit 1 52 51 5121% 9.93
1608 Millbrook car park exit 3 15 12 394% 3.96
1609 Millbrook car park entrance 12 33 21 171% 4.35
1666 A322 Onslow Street 866 1011 145 17% 4.75
1667 A322 Onslow Street 1102 1087 -15 -1% 0.46
1941 A281 Millbrook 900 1012 112 12% 3.62
1942 A281 Millbrook 713 639 -74 -10% 2.84
1943 Quarry Street 233 259 26 11% 1.67

Waverley & Guildford Local Plan Model Development Validation Report
Issue No. 02 Page 31 Document No. 53613T45\02
Count
No. Count Name
Observed
Flow
Modelled
Flow Diff % Diff GEH
Met Flow
Criteria GEH <5.5 GEH>10
1944 A320 Stoke Road 486 520 34 7% 1.50
1945 A320 Stoke Road 114 136 22 19% 1.98
1946 A320 Stoke Road 465 365 -100 -22% 4.92
1947 A320 Stoke Road 106 79 -27 -25% 2.80
1950 Eastgate Gardens 54 54 0 1% 0.06
1951 Eastgate Gardens 83 77 -6 -7% 0.70
1952 A3100 High Street 176 110 -66 -38% 5.56
1953 A3100 High Street 296 298 2 1% 0.12
1954 A3100 High Street 341 344 3 1% 0.19
1955 A3100 High Street 192 134 -58 -30% 4.57
1956 A246 Epsom Road 164 167 3 2% 0.26
1957 A246 Epsom Road 171 182 11 6% 0.80
1958 A246 Epsom Road 609 543 -66 -11% 2.76
1959 A246 Epsom Road 315 169 -146 -46% 9.37
1962 A320 Stoke Road 410 394 -16 -4% 0.80
1963 A320 Stoke Road 547 670 123 23% 4.99
1964 A320 Stoke Road 653 724 71 11% 2.69
1965 A320 Stoke Road 503 489 -14 -3% 0.62
1966 D4006 Nightingale Road 130 139 9 7% 0.79
1967 D4006 Nightingale Road 117 181 64 55% 5.24
1968 A3100 London Road 484 429 -55 -11% 2.55
1969 A3100 London Road 358 425 67 19% 3.41
1970 A246 Waterden Road 279 244 -35 -13% 2.16
1971 A246 Waterden Road 249 184 -65 -26% 4.44
1972 A246 York Road 382 366 -16 -4% 0.85
1973 A246 York Road 523 420 -103 -20% 4.72
1974 D4014 Jenner Road 166 95 -71 -43% 6.26
1975 D4014 Jenner Road 296 337 41 14% 2.31
1976 D4014 Jenner Road 239 97 -142 -59% 10.93
1977 D4014 Sydenham Road 369 340 -29 -8% 1.55
1978 D4006 Denmark Road 69 65 -4 -6% 0.52
1979 D4006 Denmark Road 175 193 18 10% 1.34
1980 D4006 Dene Road 60 55 -5 -8% 0.61
1981 D4015 Warwicks Bench 276 302 26 10% 1.55
1982 D4015 Warwicks Bench 72 139 67 93% 6.52
1984 D4004 Haydon Place 53 45 -8 -16% 1.20
1985 D4004 Haydon Place 39 38 -1 -2% 0.13

Waverley & Guildford Local Plan Model Development Validation Report
Issue No. 02 Page 32 Document No. 53613T45\02
Count
No. Count Name
Observed
Flow
Modelled
Flow Diff % Diff GEH
Met Flow
Criteria GEH <5.5 GEH>10
1986 D4004 Martyr Road 55 45 -10 -19% 1.47
1987 D4004 Martyr Road 37 45 8 22% 1.25
1988 D4004 Martyr Road 40 17 -23 -59% 4.41
1989 D4004 Martyr Road 25 37 12 50% 2.22
1990 D4015 South Hill 27 36 9 32% 1.54
192 Westwood Lane 116 86 -30 -26% 3.00
247 A246 Guildford Road 368 335 -33 -9% 1.74
248 A246 Guildford Road 457 276 -181 -40% 9.43
303 B3012 Gapemouth Road 247 267 20 8% 1.27
304 B3012 Gapemouth Road 349 222 -127 -36% 7.52
339 Horsley Road 546 521 -25 -5% 1.09
340 Horsley Road 279 274 -5 -2% 0.30
468 B367 Newark Lane 367 356 -11 -3% 0.57
608 A331 Blackwater Valley Route 2337 2361 24 1% 0.49
670 M25 CW J10 on slip 2218 2496 278 13% 5.73
671 M25 AC J10 off slip 2025 2087 62 3% 1.37
672 M25 CW J10 after off slip 4135 4290 155 4% 2.39
673 M25 AC J10 after off slip 3831 4177 346 9% 5.46
724 A3 southbound within M25 J10 1940 2003 63 3% 1.41
854 Effingham Common Road southbound 292 256 -36 -12% 2.16
855 A246 Guildford Road Eastbound 69 70 1 2% 0.15
914 A3 southbound off slip to M25 1338 1330 -8 -1% 0.21
1202 A324 Aldershot Road 467 554 87 19% 3.85
1203 A324 Aldershot Road 304 202 -102 -34% 6.44
1243 B3411 Vale Road 360 389 29 8% 1.51
1244 B3411 Vale Road 494 372 -122 -25% 5.87
1417 C2 3Hurtmore Road 177 129 -48 -27% 3.87
1420 Eashing Lane 105 100 -5 -4% 0.46
1427 Binscombe Lane (east) 111 146 35 32% 3.12
1428 Binscombe Lane (east) 85 89 4 5% 0.42
1429 Green Lane 88 102 14 16% 1.45
1430 Green Lane 61 53 -8 -14% 1.09
1431 Binscombe Lane (west) 42 44 2 5% 0.34
1455 Middle Street 252 236 -16 -6% 1.00
1456 Middle Street 94 110 16 17% 1.61
1459 Coombe Lane (east) 56 36 -20 -36% 2.93
1472 Flexford Road 100 180 80 80% 6.76
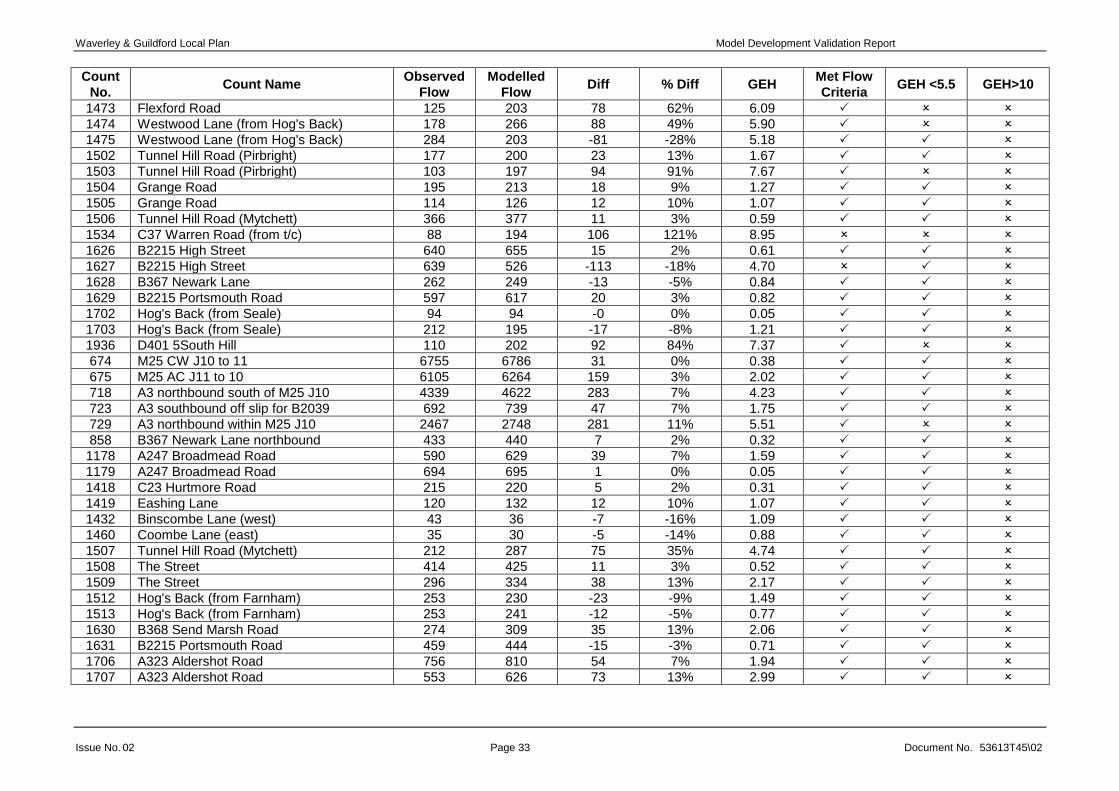
Waverley & Guildford Local Plan Model Development Validation Report
Issue No. 02 Page 33 Document No. 53613T45\02
Count
No. Count Name
Observed
Flow
Modelled
Flow Diff % Diff GEH
Met Flow
Criteria GEH <5.5 GEH>10
1473 Flexford Road 125 203 78 62% 6.09
1474 Westwood Lane (from Hog's Back) 178 266 88 49% 5.90
1475 Westwood Lane (from Hog's Back) 284 203 -81 -28% 5.18
1502 Tunnel Hill Road (Pirbright) 177 200 23 13% 1.67
1503 Tunnel Hill Road (Pirbright) 103 197 94 91% 7.67
1504 Grange Road 195 213 18 9% 1.27
1505 Grange Road 114 126 12 10% 1.07
1506 Tunnel Hill Road (Mytchett) 366 377 11 3% 0.59
1534 C37 Warren Road (from t/c) 88 194 106 121% 8.95
1626 B2215 High Street 640 655 15 2% 0.61
1627 B2215 High Street 639 526 -113 -18% 4.70
1628 B367 Newark Lane 262 249 -13 -5% 0.84
1629 B2215 Portsmouth Road 597 617 20 3% 0.82
1702 Hog's Back (from Seale) 94 94 -0 0% 0.05
1703 Hog's Back (from Seale) 212 195 -17 -8% 1.21
1936 D401 5South Hill 110 202 92 84% 7.37
674 M25 CW J10 to 11 6755 6786 31 0% 0.38
675 M25 AC J11 to 10 6105 6264 159 3% 2.02
718 A3 northbound south of M25 J10 4339 4622 283 7% 4.23
723 A3 southbound off slip for B2039 692 739 47 7% 1.75
729 A3 northbound within M25 J10 2467 2748 281 11% 5.51
858 B367 Newark Lane northbound 433 440 7 2% 0.32
1178 A247 Broadmead Road 590 629 39 7% 1.59
1179 A247 Broadmead Road 694 695 1 0% 0.05
1418 C23 Hurtmore Road 215 220 5 2% 0.31
1419 Eashing Lane 120 132 12 10% 1.07
1432 Binscombe Lane (west) 43 36 -7 -16% 1.09
1460 Coombe Lane (east) 35 30 -5 -14% 0.88
1507 Tunnel Hill Road (Mytchett) 212 287 75 35% 4.74
1508 The Street 414 425 11 3% 0.52
1509 The Street 296 334 38 13% 2.17
1512 Hog's Back (from Farnham) 253 230 -23 -9% 1.49
1513 Hog's Back (from Farnham) 253 241 -12 -5% 0.77
1630 B368 Send Marsh Road 274 309 35 13% 2.06
1631 B2215 Portsmouth Road 459 444 -15 -3% 0.71
1706 A323 Aldershot Road 756 810 54 7% 1.94
1707 A323 Aldershot Road 553 626 73 13% 2.99

Waverley & Guildford Local Plan Model Development Validation Report
Issue No. 02 Page 34 Document No. 53613T45\02
Count
No. Count Name
Observed
Flow
Modelled
Flow Diff % Diff GEH
Met Flow
Criteria GEH <5.5 GEH>10
1948 A246 York Road 570 480 -90 -16% 3.95
1949 A246 York Road 663 544 -119 -18% 4.84
1960 D4014 Harvey Road 312 300 -12 -4% 0.67
1961 D4014 Harvey Road 67 1 -66 -98% 11.25
2432 A246 Guildford Road 643 589 -54 -8% 2.19
2433 Beech Avenue 146 149 3 2% 0.28
2447 Beech Avenue 137 162 25 18% 2.04
2494 Effingham Common Road 269 256 -13 -5% 0.78
2495 Effingham Common Road 455 638 183 40% 7.84
2496 Lower Road 387 438 51 13% 2.50
2497 Lower Road 237 130 -107 -45% 7.90
2498 The Street 232 200 -32 -14% 2.14
2499 The Street 225 126 -99 -44% 7.45
2500 Orestan Lane 53 0 -53 -100% 10.30
2501 Orestan Lane 24 0 -24 -100% 6.93
2512 Howard Road 423 638 215 51% 9.34
2513 Forest Road 278 141 -137 -49% 9.49
2605 Forest Road 142 126 -16 -12% 1.42
2615 A246 Epsom Road eastbound 546 478 -68 -12% 3.00
2616 A246 Epsom Road westbound 574 508 -66 -12% 2.85
2617 B2039 Ockham Road South northbound 373 204 -169 -45% 9.95
2618 B2039 Ockham Road South southbound 206 109 -97 -47% 7.77
2619 A246 Guildford Road eastbound 491 585 94 19% 4.06
2620 A246 Guildford Road westbound 686 710 24 4% 0.92
2621 A3 southbound on slip Burntcommon 717 736 19 3% 0.69
2622 A247 Clandon Road northbound 731 727 -4 -1% 0.15
2623 A247 Clandon Road southbound 23 22 -1 -3% 0.17
2624 Tithebarns Lane eastbound 92 90 -2 -2% 0.22
2625 Tithebarns Lane westbound 100 121 21 21% 1.97
2626 Forest Road northbound 168 107 -61 -36% 5.17
2627 Forest Road southbound 146 195 49 34% 3.76
2628 B2039 Ockham Road South northbound 313 368 55 18% 2.98
2629 B2039 Ockham Road South southbound 191 185 -6 -3% 0.46
2630 Guileshill Lane southbound 39 40 1 3% 0.18
2631 Guileshill Lane northbound 49 56 7 15% 0.98
2632 B2039 Ockham Road North northbound 365 491 126 34% 6.08
2633 B2039 Ockham Road North southbound 231 210 -21 -9% 1.43
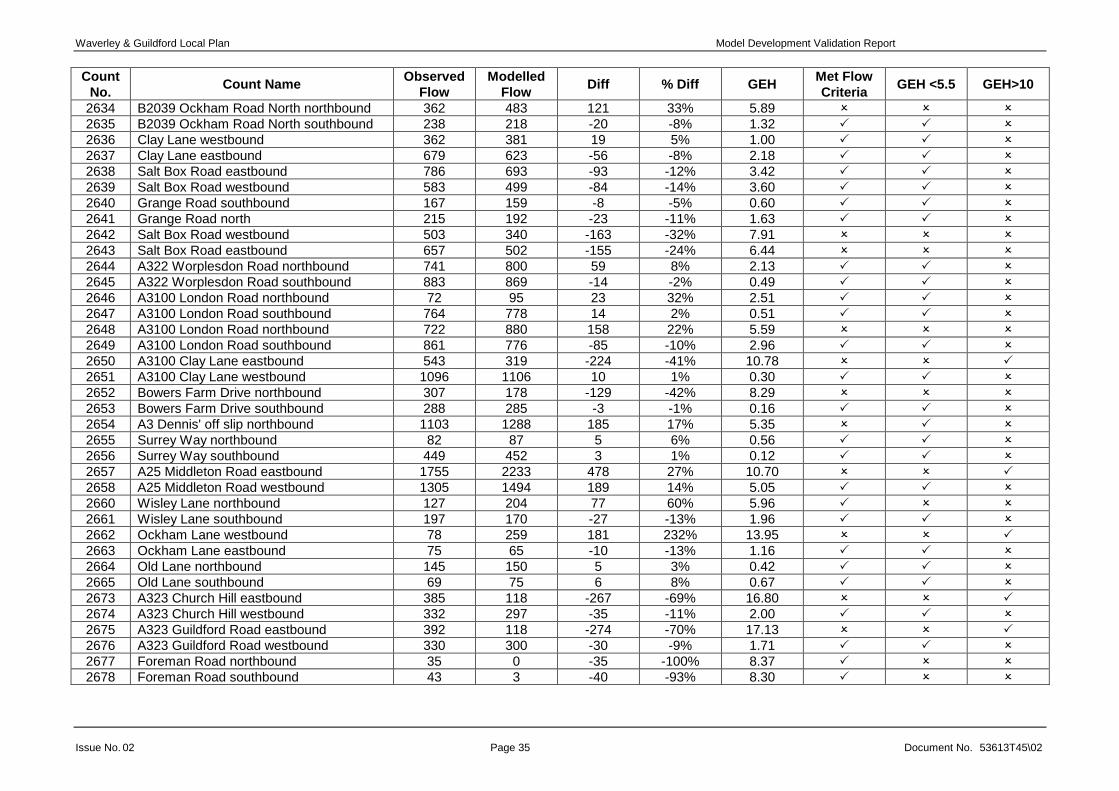
Waverley & Guildford Local Plan Model Development Validation Report
Issue No. 02 Page 35 Document No. 53613T45\02
Count
No. Count Name
Observed
Flow
Modelled
Flow Diff % Diff GEH
Met Flow
Criteria GEH <5.5 GEH>10
2634 B2039 Ockham Road North northbound 362 483 121 33% 5.89
2635 B2039 Ockham Road North southbound 238 218 -20 -8% 1.32
2636 Clay Lane westbound 362 381 19 5% 1.00
2637 Clay Lane eastbound 679 623 -56 -8% 2.18
2638 Salt Box Road eastbound 786 693 -93 -12% 3.42
2639 Salt Box Road westbound 583 499 -84 -14% 3.60
2640 Grange Road southbound 167 159 -8 -5% 0.60
2641 Grange Road north 215 192 -23 -11% 1.63
2642 Salt Box Road westbound 503 340 -163 -32% 7.91
2643 Salt Box Road eastbound 657 502 -155 -24% 6.44
2644 A322 Worplesdon Road northbound 741 800 59 8% 2.13
2645 A322 Worplesdon Road southbound 883 869 -14 -2% 0.49
2646 A3100 London Road northbound 72 95 23 32% 2.51
2647 A3100 London Road southbound 764 778 14 2% 0.51
2648 A3100 London Road northbound 722 880 158 22% 5.59
2649 A3100 London Road southbound 861 776 -85 -10% 2.96
2650 A3100 Clay Lane eastbound 543 319 -224 -41% 10.78
2651 A3100 Clay Lane westbound 1096 1106 10 1% 0.30
2652 Bowers Farm Drive northbound 307 178 -129 -42% 8.29
2653 Bowers Farm Drive southbound 288 285 -3 -1% 0.16
2654 A3 Dennis' off slip northbound 1103 1288 185 17% 5.35
2655 Surrey Way northbound 82 87 5 6% 0.56
2656 Surrey Way southbound 449 452 3 1% 0.12
2657 A25 Middleton Road eastbound 1755 2233 478 27% 10.70
2658 A25 Middleton Road westbound 1305 1494 189 14% 5.05
2660 Wisley Lane northbound 127 204 77 60% 5.96
2661 Wisley Lane southbound 197 170 -27 -13% 1.96
2662 Ockham Lane westbound 78 259 181 232% 13.95
2663 Ockham Lane eastbound 75 65 -10 -13% 1.16
2664 Old Lane northbound 145 150 5 3% 0.42
2665 Old Lane southbound 69 75 6 8% 0.67
2673 A323 Church Hill eastbound 385 118 -267 -69% 16.80
2674 A323 Church Hill westbound 332 297 -35 -11% 2.00
2675 A323 Guildford Road eastbound 392 118 -274 -70% 17.13
2676 A323 Guildford Road westbound 330 300 -30 -9% 1.71
2677 Foreman Road northbound 35 0 -35 -100% 8.37
2678 Foreman Road southbound 43 3 -40 -93% 8.30
Waverley & Guildford Local Plan Model Development Validation Report
Issue No. 02 Page 36 Document No. 53613T45\02
Count
No. Count Name
Observed
Flow
Modelled
Flow Diff % Diff GEH
Met Flow
Criteria GEH <5.5 GEH>10
2679 B2215 High Street northbound 828 901 73 9% 2.48
2680 B2215 High Street southbound 564 568 4 1% 0.16
2681 B2215 High Street southbound 337 306 -31 -9% 1.72
2682 B367 Newark Lane northbound 302 265 -37 -12% 2.20

Waverley & Guildford Local Plan Model Development Validation Report
Issue No. 02 Page 37 Document No. 53613T45\02
Guildford Borough – Average weekday PM peak hour (1600 – 1900)
Count
No. Count Name
Observed
Flow
Modelled
Flow Diff % Diff GEH
Met Flow
Criteria GEH <5.5 GEH>10
28 A281 Horsham Road 565 483 -82 -15% 3.60
38 A3100 London Road 421 308 -113 -27% 5.93
90 A31 Farnham Road 2269 2379 110 5% 2.29
128 A322 Worplesdon Road 1511 1447 -64 -4% 1.66
138 A248 Broadford Road 439 430 -9 -2% 0.42
392 A25 Woodbridge Road 1537 1549 12 1% 0.32
393 A25 Woodbridge Road 1562 1602 40 3% 1.00
513 A248 The Street 546 588 42 8% 1.75
514 A248 The Street 624 598 -26 -4% 1.04
527 A320 Woking Road 661 624 -37 -6% 1.46
528 A320 Woking Road 775 767 -8 -1% 0.27
575 A25 Parkway 896 1008 112 13% 3.64
576 A25 Parkway 831 839 8 1% 0.27
621 Mangles Road 135 127 -8 -6% 0.74
622 Mangles Road 169 167 -2 -1% 0.12
623 Stoughton Road 276 248 -28 -10% 1.75
624 Stoughton Road 500 470 -30 -6% 1.37
643 A320 Woking Road 1058 976 -82 -8% 2.57
646 A25 Epsom Road 490 461 -29 -6% 1.32
648 A281 Shalford Road 652 616 -36 -5% 1.41
700 A3 northbound B3000 to A31 1703 1649 -54 -3% 1.32
701 A3 southbound off slip for A31 1511 1636 125 8% 3.16
702 A3 northbound off slip for Dennisville 334 356 22 7% 1.21
703 A3 northbound on slip at Dennisville 848 884 36 4% 1.23
757 A3 Guildford & Godalming By-pass 2901 3416 515 18% 9.16
771 A3 Godalming By-pass 1765 1687 -78 -4% 1.89
843 A3 Guildford By-pass 2875 3213 338 12% 6.13
862 A323 Aldershot Road westbound 317 349 32 10% 1.78
976 A320 Woking Road southbound 829 909 80 10% 2.70
977 A25 Epsom Road westbound 451 469 18 4% 0.83
978 A281 The Street southbound 893 904 11 1% 0.38
979 A3100 Portsmouth Road northbound 463 407 -56 -12% 2.69
1031 A25 Epsom Road 451 442 -9 -2% 0.45
1032 A25 Epsom Road 490 509 19 4% 0.87
1049 A25 Epsom Road 451 471 20 4% 0.92
Waverley & Guildford Local Plan Model Development Validation Report
Issue No. 02 Page 38 Document No. 53613T45\02
Count
No. Count Name
Observed
Flow
Modelled
Flow Diff % Diff GEH
Met Flow
Criteria GEH <5.5 GEH>10
1050 A25 Epsom Road 476 433 -43 -9% 2.01
1051 A25 Epsom Road 769 706 -63 -8% 2.32
1052 A25 Epsom Road 658 598 -60 -9% 2.39
1053 B2234 Merrow Park Lane 445 448 3 1% 0.15
1158 A25 Epsom Road 736 720 -16 -2% 0.59
1159 A25 Epsom Road 620 653 33 5% 1.31
1160 A31 Farnham Road 711 600 -111 -16% 4.32
1161 A31 Farnham Road 415 400 -15 -4% 0.73
1164 A320 Woking Road 514 591 77 15% 3.27
1311 A320 Woking Road 650 659 9 1% 0.35
1312 A320 Woking Road 925 838 -87 -9% 2.91
1317 A320 Woking Road 1957 1802 -155 -8% 3.58
1318 A320 Woking Road 724 704 -20 -3% 0.75
1413 D96 Priorsfield Road 341 298 -43 -12% 2.38
1414 D96 Priorsfield Road 310 367 57 18% 3.09
1457 Staple Lane 21 59 38 181% 6.02
1458 Staple Lane 57 59 2 3% 0.26
1524 C15 Broad Street (west) 160 132 -28 -18% 2.35
1525 C15 Broad Street (west) 233 157 -76 -33% 5.48
1558 Guildford Park Road 477 419 -58 -12% 2.76
1559 Guildford Park Road 431 477 46 11% 2.16
1560 Guildford Park Road Car Park 32 32 0 1% 0.07
1561 Guildford Park Road Car Park 89 97 8 9% 0.79
1662 A246 York Road 810 792 -18 -2% 0.63
1663 A246 York Road 580 619 39 7% 1.59
1664 A322 Woodbridge Road 615 656 41 7% 1.64
1665 A322 Woodbridge Road 688 852 164 24% 5.90
1938 D4015 Castle Street 155 152 -3 -2% 0.22
1939 A281 Millbrook 607 458 -149 -25% 6.47
1940 A281 Millbrook 758 814 56 7% 1.98
29 A281 Horsham Road 785 615 -170 -22% 6.44
41 A25 Shere Road 711 691 -20 -3% 0.77
91 A31 Farnham Road 1676 1750 74 4% 1.79
129 A322 Worplesdon Road 877 1025 148 17% 4.79
139 A248 Broadford Road 546 435 -111 -20% 5.01
249 A25 Boxgrove Road 591 619 28 5% 1.12
250 A25 Boxgrove Road 703 732 29 4% 1.08

Waverley & Guildford Local Plan Model Development Validation Report
Issue No. 02 Page 39 Document No. 53613T45\02
Count
No. Count Name
Observed
Flow
Modelled
Flow Diff % Diff GEH
Met Flow
Criteria GEH <5.5 GEH>10
394 A25 Ladymead 1644 1270 -374 -23% 9.79
395 A25 Ladymead 1055 1028 -27 -3% 0.82
529 A320 Guildford Road 990 1058 68 7% 2.14
530 A320 Guildford Road 1153 1104 -49 -4% 1.47
577 A320 Woking Road 583 470 -113 -19% 4.95
578 A320 Woking Road 735 665 -70 -9% 2.63
579 A320 Woking Road 723 695 -28 -4% 1.03
580 A320 Woking Road 854 884 30 3% 1.01
581 Hazel Avenue 253 245 -8 -3% 0.48
582 Hazel Avenue 259 225 -34 -13% 2.18
585 Woodlands Road 54 53 -1 -1% 0.08
586 Woodlands Road 70 81 11 16% 1.29
589 Clay Lane 772 817 45 6% 1.59
590 Clay Lane 916 1058 142 16% 4.53
591 Blanchards Hill 285 318 33 12% 1.92
592 Blanchards Hill 165 141 -24 -14% 1.93
593 Moorfield Road 219 248 29 13% 1.87
594 Moorfield Road 627 615 -12 -2% 0.46
595 Jacobs Well Road 216 90 -126 -59% 10.23
596 Jacobs Well Road 151 187 36 24% 2.79
625 A320 Woking Road 1216 1211 -5 0% 0.15
626 A320 Woking Road 1650 1517 -133 -8% 3.33
627 A320 Stoke Road 622 1025 403 65% 14.05
628 A320 Stoke Road 713 791 78 11% 2.84
650 A3100 Portsmouth Road 516 538 22 4% 0.98
704 A3 southbound off slip at Cathedral 470 546 76 16% 3.36
705 A3 southbound on slip from B3000 408 424 16 4% 0.76
707 A3 southbound A31 to B3000 2431 2573 142 6% 2.84
708 A3 southbound within A31 junction 2213 2214 1 0% 0.03
709 A3 northbound on slip from A31 1286 1249 -37 -3% 1.05
710 A3 on slip 968 1030 62 6% 1.97
711 A3 southbound at Dennisville junction 3678 3850 172 5% 2.80
713 A3 northbound A320 to A3100 3459 3399 -60 -2% 1.03
714 A3 southbound A247 to A3100 4088 4072 -16 0% 0.25
715 A3 southbound A320 to A322 2506 2422 -84 -3% 1.69
716 A3 northbound A322 to A320 2538 2368 -170 -7% 3.42
717 A3 southbound A322 to A31 3615 3851 236 7% 3.86

Waverley & Guildford Local Plan Model Development Validation Report
Issue No. 02 Page 40 Document No. 53613T45\02
Count
No. Count Name
Observed
Flow
Modelled
Flow Diff % Diff GEH
Met Flow
Criteria GEH <5.5 GEH>10
719 A3 northbound A31 to A322 2901 2898 -3 0% 0.06
772 A3 Godalming By-pass 2543 2291 -252 -10% 5.13
863 A3 northbound off slip Puttenham 272 289 17 6% 1.01
980 A3 on slip Dennis' southbound 1037 1261 224 22% 6.61
981 A3 southbound off slip Burpham 920 859 -61 -7% 2.05
983 A3 southbound off slip Stoke Crossroads 822 791 -31 -4% 1.09
1054 B2234 Merrow Park Lane 462 522 60 13% 2.72
1057 A248 Kings Road 496 486 -10 -2% 0.43
1058 A248 Kings Road 579 647 68 12% 2.74
1059 A3100 London Road 782 907 125 16% 4.31
1060 A3100 London Road 800 742 -58 -7% 2.10
1061 A3100 London Road 534 598 64 12% 2.70
1063 D4009 Trodds Lane 236 259 23 10% 1.46
1064 D4009 Trodds Lane 249 222 -27 -11% 1.73
1065 C146 Guildford Park Road 426 362 -64 -15% 3.21
1066 C146 Guildford Park Road 524 565 41 8% 1.74
1067 A31 Farnham Road 751 766 15 2% 0.54
1068 A31 Farnham Road 1016 892 -124 -12% 4.01
1069 A3100 Clay Lane 1077 1617 540 50% 14.70
1074 A3100 London Road 698 791 93 13% 3.42
1075 A3100 London Road 704 676 -28 -4% 1.05
1076 B3000 The Street 716 594 -122 -17% 4.78
1077 B3000 The Street 661 640 -21 -3% 0.84
1078 B3000 New Pond Lane 554 462 -92 -17% 4.10
1079 B3000 New Pond Lane 682 642 -40 -6% 1.54
1080 A3100 Old Portsmouth Road 639 524 -115 -18% 4.77
1081 A3100 Old Portsmouth Road 772 743 -29 -4% 1.07
1082 D4003 Walnut Tree Close 322 370 48 15% 2.56
1083 D4003 Walnut Tree Close 312 266 -46 -15% 2.68
1165 A320 Woking Road 707 868 161 23% 5.73
1166 A322 Worplesdon Road 543 663 120 22% 4.90
1167 A322 Worplesdon Road 474 507 33 7% 1.48
1169 A323 Aldershot Road 473 453 -20 -4% 0.94
1461 Coombe Lane (from Shere) 45 42 -3 -7% 0.45
1462 Coombe Lane (from Shere) 21 61 40 190% 6.23
1633 A322 Woodbridge Road 732 671 -61 -8% 2.30
1634 A25 Boxgrove Road 532 496 -36 -7% 1.58
Waverley & Guildford Local Plan Model Development Validation Report
Issue No. 02 Page 41 Document No. 53613T45\02
Count
No. Count Name
Observed
Flow
Modelled
Flow Diff % Diff GEH
Met Flow
Criteria GEH <5.5 GEH>10
1635 A25 Boxgrove Road 444 433 -11 -2% 0.53
1636 A246 Epsom Road 649 635 -14 -2% 0.55
1637 A246 Epsom Road 714 674 -40 -6% 1.51
1638 Merrow P&R exit 46 36 -10 -22% 1.59
1639 Merrow P&R entrance 12 6 -6 -50% 2.00
1640 Artington P&R exit 203 191 -12 -6% 0.84
1641 Artington P&R entrance 52 33 -19 -37% 2.94
1642 Spectrum exit 464 433 -31 -7% 1.47
1643 Spectrum entrance 291 291 -0 0% 0.03
1644 York Road Car Park 121 136 15 12% 1.30
1645 York Road Car Park 14 14 -0 0% 0.00
1646 Spectrum P&R entrance 15 15 -0 0% 0.01
1647 Spectrum P&R exit 96 81 -15 -15% 1.54
18 A31 Farnham Road 407 395 -12 -3% 0.58
39 A3100 London Road 379 287 -92 -24% 5.04
40 A25 Shere Road 546 515 -31 -6% 1.33
1070 A3100 Clay Lane 487 569 82 17% 3.55
1071 A3 on slip 611 806 195 32% 7.34
1072 B2234 New Inn Lane 524 549 25 5% 1.09
1073 B2234 New Inn Lane 430 478 48 11% 2.25
1562 Guildford Park Road 464 422 -42 -9% 1.99
1563 Guildford Park Road 506 545 39 8% 1.69
1564 Farnham Road car park 134 129 -5 -4% 0.42
1565 Farnham Road car park 21 49 28 136% 4.79
1566 Guildford Gyratory 1897 1901 4 0% 0.10
1567 Station View 180 199 19 11% 1.39
1568 Station View 252 334 82 32% 4.78
1569 Station View 19 25 6 31% 1.26
1570 Walnut Tree Close 279 342 63 23% 3.59
1571 Walnut Tree Close 213 129 -84 -39% 6.40
1572 A322 Woodbridge Road 822 855 33 4% 1.13
1573 A322 Woodbridge Road 683 768 85 12% 3.17
1574 Lea's Road 63 4 -59 -93% 10.16
1575 Lea's Road 98 113 15 16% 1.48
1576 Laundry Road 301 397 96 32% 5.14
1577 Woodbridge Road 488 454 -34 -7% 1.56
1578 Woodbridge Road 239 238 -1 -1% 0.08

Waverley & Guildford Local Plan Model Development Validation Report
Issue No. 02 Page 42 Document No. 53613T45\02
Count
No. Count Name
Observed
Flow
Modelled
Flow Diff % Diff GEH
Met Flow
Criteria GEH <5.5 GEH>10
1579 A322 Onslow Street 1132 1056 -76 -7% 2.30
1580 A322 Onslow Street 1483 1396 -87 -6% 2.28
1581 Guildford Gyratory 1846 1798 -48 -3% 1.12
1582 Guildford Gyratory 2197 2139 -58 -3% 1.26
1583 Guildford Gyratory 2114 2032 -82 -4% 1.81
1584 Guildford Gyratory 1897 1759 -138 -7% 3.22
1585 Guildford Gyratory 2162 2028 -134 -6% 2.93
1586 A3100 Portsmouth Road 753 809 56 7% 1.99
1587 A3100 Portsmouth Road 489 540 51 10% 2.26
1588 Millmead 66 72 6 8% 0.67
1589 Millmead 35 43 8 23% 1.27
1590 A281 Millbrook 795 815 20 3% 0.71
1591 A281 Millbrook 1012 1087 75 7% 2.32
1592 North Street 83 107 24 29% 2.46
1593 Leapale Road 267 178 -89 -33% 5.94
1594 Woodbridge Road 230 163 -67 -29% 4.76
1595 Old Police Station car park entrance & Leapale
106 178 72 68% 6.06
1596 Old Police Station car park exit 66 99 33 50% 3.61
1597 Commercial Road car park entrance 13 67 54 415% 8.53
1598 Commercial Road car park exit 22 25 3 15% 0.69
1599 A320 Chertsey Street 137 135 -2 -1% 0.14
1600 A320 Chertsey Street 131 175 44 34% 3.58
1601 North Street 232 222 -10 -4% 0.69
1602 North Street 247 313 66 27% 3.92
1603 A320 High Street 265 197 -68 -26% 4.51
1604 A320 High Street 251 327 76 30% 4.49
1605 Leapale Road 272 205 -67 -25% 4.36
1606 North Street 341 226 -115 -34% 6.82
1607 Leapale Car Park Exit 103 205 102 99% 8.20
1608 Millbrook car park exit 68 93 25 37% 2.80
1609 Millbrook car park entrance 34 72 38 111% 5.21
1666 A322 Onslow Street 1150 1264 114 10% 3.28
1667 A322 Onslow Street 1259 1242 -17 -1% 0.49
1941 A281 Millbrook 788 794 6 1% 0.21
1942 A281 Millbrook 996 814 -182 -18% 6.03
1943 Quarry Street 421 337 -84 -20% 4.31
Waverley & Guildford Local Plan Model Development Validation Report
Issue No. 02 Page 43 Document No. 53613T45\02
Count
No. Count Name
Observed
Flow
Modelled
Flow Diff % Diff GEH
Met Flow
Criteria GEH <5.5 GEH>10
1944 A320 Stoke Road 476 539 63 13% 2.79
1945 A320 Stoke Road 195 251 56 29% 3.73
1946 A320 Stoke Road 602 555 -47 -8% 1.96
1947 A320 Stoke Road 152 151 -1 0% 0.05
1950 Eastgate Gardens 87 112 25 28% 2.47
1951 Eastgate Gardens 72 68 -4 -6% 0.49
1952 A3100 High Street 331 327 -4 -1% 0.20
1953 A3100 High Street 215 197 -18 -9% 1.29
1954 A3100 High Street 250 237 -13 -5% 0.84
1955 A3100 High Street 383 411 28 7% 1.43
1956 A246 Epsom Road 283 337 54 19% 3.08
1957 A246 Epsom Road 134 164 30 22% 2.46
1958 A246 Epsom Road 503 466 -37 -7% 1.67
1959 A246 Epsom Road 534 342 -192 -36% 9.16
1962 A320 Stoke Road 421 475 54 13% 2.57
1963 A320 Stoke Road 569 562 -7 -1% 0.31
1964 A320 Stoke Road 686 717 31 5% 1.19
1965 A320 Stoke Road 497 600 103 21% 4.41
1966 D4006 Nightingale Road 149 212 63 43% 4.72
1967 D4006 Nightingale Road 110 182 72 65% 5.94
1968 A3100 London Road 544 597 53 10% 2.22
1969 A3100 London Road 594 794 200 34% 7.60
1970 A246 Waterden Road 209 212 3 2% 0.24
1971 A246 Waterden Road 320 206 -114 -36% 7.04
1972 A246 York Road 517 495 -22 -4% 0.99
1973 A246 York Road 399 325 -74 -19% 3.90
1974 D4014 Jenner Road 295 265 -30 -10% 1.80
1975 D4014 Jenner Road 338 339 1 0% 0.03
1976 D4014 Jenner Road 390 331 -59 -15% 3.12
1977 D4014 Sydenham Road 433 405 -28 -7% 1.39
1978 D4006 Denmark Road 173 224 51 30% 3.63
1979 D4006 Denmark Road 56 124 68 121% 7.15
1980 D4006 Dene Road 53 54 1 3% 0.19
1981 D4015 Warwicks Bench 183 208 25 13% 1.76
1982 D4015 Warwicks Bench 155 187 32 21% 2.43
1984 D4004 Haydon Place 40 130 90 224% 9.72
1985 D4004 Haydon Place 72 65 -7 -10% 0.83

Waverley & Guildford Local Plan Model Development Validation Report
Issue No. 02 Page 44 Document No. 53613T45\02
Count
No. Count Name
Observed
Flow
Modelled
Flow Diff % Diff GEH
Met Flow
Criteria GEH <5.5 GEH>10
1986 D4004 Martyr Road 94 130 36 38% 3.36
1987 D4004 Martyr Road 59 70 11 18% 1.34
1988 D4004 Martyr Road 58 22 -36 -62% 5.70
1989 D4004 Martyr Road 28 64 36 130% 5.35
1990 D4015 South Hill 67 113 46 69% 4.85
192 Westwood Lane 153 30 -123 -80% 12.83
247 A246 Guildford Road 421 414 -7 -2% 0.34
248 A246 Guildford Road 410 382 -28 -7% 1.40
303 B3012 Gapemouth Road 362 350 -12 -3% 0.65
304 B3012 Gapemouth Road 242 235 -7 -3% 0.47
339 Horsley Road 283 312 29 10% 1.68
340 Horsley Road 430 352 -78 -18% 3.96
468 B367 Newark Lane 394 492 98 25% 4.65
608 A331 Blackwater Valley Route 2902 2870 -32 -1% 0.60
670 M25 CW J10 on slip 1862 2228 366 20% 8.10
671 M25 AC J10 off slip 2159 2081 -78 -4% 1.69
672 M25 CW J10 after off slip 3702 3502 -200 -5% 3.33
673 M25 AC J10 after off slip 4449 4055 -394 -9% 6.05
724 A3 southbound within M25 J10 2291 2457 166 7% 3.41
854 Effingham Common Road southbound 350 418 68 19% 3.45
855 A246 Guildford Road Eastbound 62 86 24 39% 2.83
914 A3 southbound off slip to M25 1308 1509 201 15% 5.36
1202 A324 Aldershot Road 291 273 -18 -6% 1.08
1203 A324 Aldershot Road 417 288 -129 -31% 6.90
1243 B3411 Vale Road 534 407 -127 -24% 5.83
1244 B3411 Vale Road 420 337 -83 -20% 4.28
1417 C2 3Hurtmore Road 255 240 -15 -6% 0.94
1420 Eashing Lane 63 76 13 21% 1.60
1427 Binscombe Lane (east) 62 72 10 16% 1.21
1428 Binscombe Lane (east) 150 152 2 2% 0.19
1429 Green Lane 54 42 -12 -23% 1.76
1430 Green Lane 105 93 -12 -11% 1.17
1431 Binscombe Lane (west) 32 30 -2 -6% 0.34
1455 Middle Street 108 111 3 3% 0.32
1456 Middle Street 228 225 -3 -1% 0.19
1459 Coombe Lane (east) 32 42 10 32% 1.70
1472 Flexford Road 107 139 32 29% 2.85
Waverley & Guildford Local Plan Model Development Validation Report
Issue No. 02 Page 45 Document No. 53613T45\02
Count
No. Count Name
Observed
Flow
Modelled
Flow Diff % Diff GEH
Met Flow
Criteria GEH <5.5 GEH>10
1473 Flexford Road 123 143 20 16% 1.74
1474 Westwood Lane (from Hog's Back) 235 169 -66 -28% 4.66
1475 Westwood Lane (from Hog's Back) 230 265 35 15% 2.21
1502 Tunnel Hill Road (Pirbright) 103 112 9 9% 0.91
1503 Tunnel Hill Road (Pirbright) 170 184 14 8% 1.07
1504 Grange Road 94 122 28 30% 2.71
1505 Grange Road 160 178 18 11% 1.39
1506 Tunnel Hill Road (Mytchett) 195 216 21 11% 1.49
1534 C37 Warren Road (from t/c) 121 315 194 160% 13.13
1626 B2215 High Street 509 540 31 6% 1.35
1627 B2215 High Street 780 717 -63 -8% 2.32
1628 B367 Newark Lane 253 329 76 30% 4.43
1629 B2215 Portsmouth Road 540 529 -11 -2% 0.49
1702 Hog's Back (from Seale) 71 67 -4 -6% 0.50
1703 Hog's Back (from Seale) 362 307 -55 -15% 3.03
1936 D401 5South Hill 213 312 99 47% 6.11
674 M25 CW J10 to 11 5656 5731 75 1% 0.99
675 M25 AC J11 to 10 6582 6136 -446 -7% 5.60
718 A3 northbound south of M25 J10 4482 4659 177 4% 2.61
723 A3 southbound off slip for B2039 846 1001 155 18% 5.11
729 A3 northbound within M25 J10 2228 2756 528 24% 10.57
858 B367 Newark Lane northbound 377 455 78 21% 3.84
1178 A247 Broadmead Road 603 608 5 1% 0.20
1179 A247 Broadmead Road 672 641 -31 -5% 1.21
1418 C23 Hurtmore Road 137 156 19 14% 1.55
1419 Eashing Lane 125 170 45 36% 3.73
1432 Binscombe Lane (west) 68 59 -9 -13% 1.13
1460 Coombe Lane (east) 90 61 -29 -32% 3.29
1507 Tunnel Hill Road (Mytchett) 329 344 15 5% 0.82
1508 The Street 438 464 26 6% 1.24
1509 The Street 250 316 66 26% 3.91
1512 Hog's Back (from Farnham) 199 158 -41 -21% 3.09
1513 Hog's Back (from Farnham) 301 249 -52 -17% 3.15
1630 B368 Send Marsh Road 169 187 18 11% 1.35
1631 B2215 Portsmouth Road 561 564 3 1% 0.14
1706 A323 Aldershot Road 768 743 -25 -3% 0.92
1707 A323 Aldershot Road 751 779 28 4% 1.00
Waverley & Guildford Local Plan Model Development Validation Report
Issue No. 02 Page 46 Document No. 53613T45\02
Count
No. Count Name
Observed
Flow
Modelled
Flow Diff % Diff GEH
Met Flow
Criteria GEH <5.5 GEH>10
1948 A246 York Road 522 640 118 23% 4.88
1949 A246 York Road 765 550 -215 -28% 8.39
1960 D4014 Harvey Road 364 296 -68 -19% 3.77
1961 D4014 Harvey Road 66 5 -61 -92% 10.21
2432 A246 Guildford Road 540 531 -9 -2% 0.40
2433 Beech Avenue 127 146 19 15% 1.61
2447 Beech Avenue 151 159 8 5% 0.62
2494 Effingham Common Road 453 418 -35 -8% 1.69
2495 Effingham Common Road 355 340 -15 -4% 0.81
2496 Lower Road 281 270 -11 -4% 0.69
2497 Lower Road 335 279 -56 -17% 3.19
2498 The Street 225 70 -155 -69% 12.73
2499 The Street 262 139 -123 -47% 8.73
2500 Orestan Lane 34 0 -34 -100% 8.25
2501 Orestan Lane 43 0 -43 -100% 9.27
2512 Howard Road 242 340 98 40% 5.74
2513 Forest Road 165 147 -18 -11% 1.42
2605 Forest Road 204 196 -8 -4% 0.58
2615 A246 Epsom Road eastbound 605 543 -62 -10% 2.58
2616 A246 Epsom Road westbound 539 501 -38 -7% 1.68
2617 B2039 Ockham Road South northbound 282 166 -116 -41% 7.72
2618 B2039 Ockham Road South southbound 231 106 -125 -54% 9.62
2619 A246 Guildford Road eastbound 579 649 70 12% 2.84
2620 A246 Guildford Road westbound 564 667 103 18% 4.16
2621 A3 southbound on slip Burntcommon 522 556 34 7% 1.48
2622 A247 Clandon Road northbound 526 549 23 4% 0.99
2623 A247 Clandon Road southbound 26 37 11 43% 2.00
2624 Tithebarns Lane eastbound 48 46 -2 -4% 0.25
2625 Tithebarns Lane westbound 69 91 22 32% 2.45
2626 Forest Road northbound 173 136 -37 -21% 2.99
2627 Forest Road southbound 142 89 -53 -38% 4.98
2628 B2039 Ockham Road South northbound 249 254 5 2% 0.33
2629 B2039 Ockham Road South southbound 250 241 -9 -3% 0.55
2630 Guileshill Lane southbound 91 106 15 17% 1.52
2631 Guileshill Lane northbound 42 48 6 14% 0.87
2632 B2039 Ockham Road North northbound 222 285 63 28% 3.96
2633 B2039 Ockham Road North southbound 267 264 -3 -1% 0.16
Waverley & Guildford Local Plan Model Development Validation Report
Issue No. 02 Page 47 Document No. 53613T45\02
Count
No. Count Name
Observed
Flow
Modelled
Flow Diff % Diff GEH
Met Flow
Criteria GEH <5.5 GEH>10
2634 B2039 Ockham Road North northbound 259 304 45 17% 2.67
2635 B2039 Ockham Road North southbound 255 225 -30 -12% 1.95
2636 Clay Lane westbound 554 416 -138 -25% 6.27
2637 Clay Lane eastbound 504 514 10 2% 0.46
2638 Salt Box Road eastbound 603 634 31 5% 1.25
2639 Salt Box Road westbound 912 956 44 5% 1.46
2640 Grange Road southbound 273 240 -33 -12% 2.05
2641 Grange Road north 168 98 -70 -42% 6.10
2642 Salt Box Road westbound 723 717 -6 -1% 0.23
2643 Salt Box Road eastbound 520 537 17 3% 0.74
2644 A322 Worplesdon Road northbound 947 843 -104 -11% 3.48
2645 A322 Worplesdon Road southbound 665 506 -159 -24% 6.55
2646 A3100 London Road northbound 161 198 37 23% 2.79
2647 A3100 London Road southbound 937 883 -54 -6% 1.80
2648 A3100 London Road northbound 756 993 237 31% 8.03
2649 A3100 London Road southbound 1001 950 -51 -5% 1.63
2650 A3100 Clay Lane eastbound 633 350 -283 -45% 12.78
2651 A3100 Clay Lane westbound 1162 1078 -84 -7% 2.52
2652 Bowers Farm Drive northbound 479 219 -260 -54% 13.93
2653 Bowers Farm Drive southbound 547 539 -8 -1% 0.34
2654 A3 Dennis' off slip northbound 1163 1047 -116 -10% 3.48
2655 Surrey Way northbound 379 431 52 14% 2.58
2656 Surrey Way southbound 59 60 1 2% 0.14
2657 A25 Middleton Road eastbound 1304 1568 264 20% 6.96
2658 A25 Middleton Road westbound 1494 1833 339 23% 8.31
2660 Wisley Lane northbound 221 199 -22 -10% 1.51
2661 Wisley Lane southbound 159 246 87 55% 6.13
2662 Ockham Lane westbound 63 193 130 207% 11.52
2663 Ockham Lane eastbound 58 24 -34 -59% 5.34
2664 Old Lane northbound 86 1 -85 -99% 12.96
2665 Old Lane southbound 168 250 82 49% 5.65
2673 A323 Church Hill eastbound 308 261 -47 -15% 2.76
2674 A323 Church Hill westbound 492 509 17 3% 0.74
2675 A323 Guildford Road eastbound 325 261 -64 -20% 3.72
2676 A323 Guildford Road westbound 500 515 15 3% 0.68
2677 Foreman Road northbound 37 0 -37 -100% 8.60
2678 Foreman Road southbound 48 7 -41 -86% 7.85
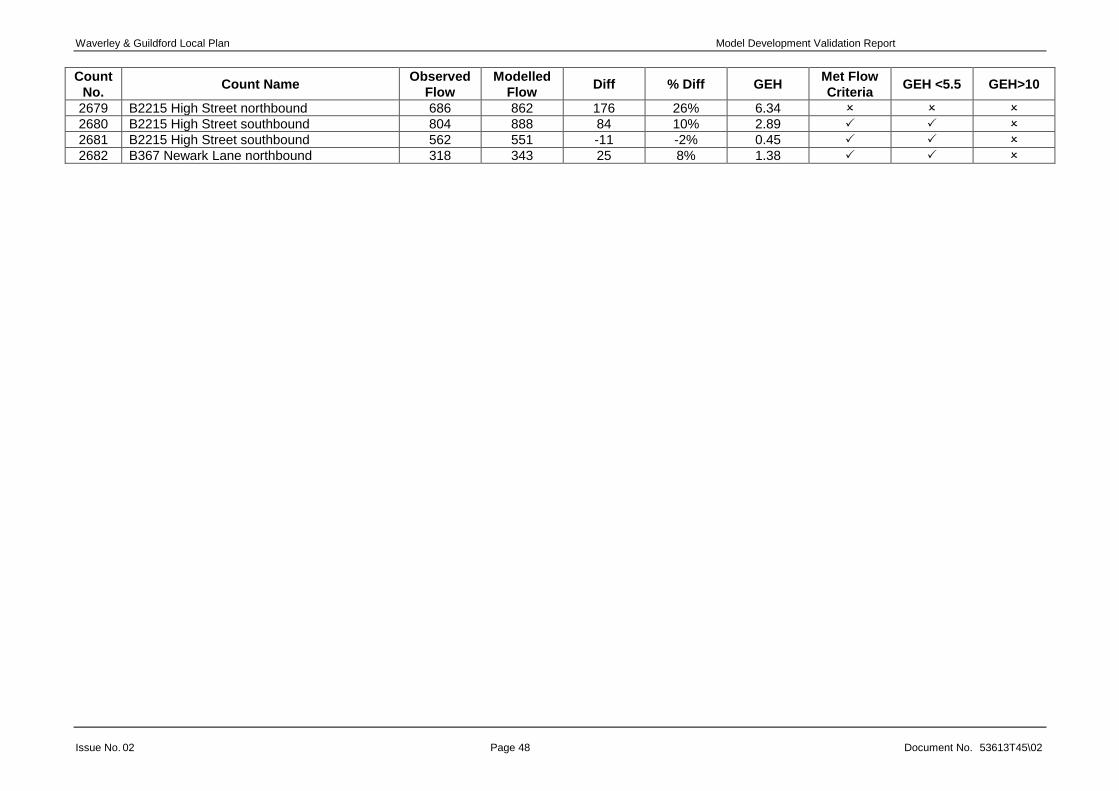
Waverley & Guildford Local Plan Model Development Validation Report
Issue No. 02 Page 48 Document No. 53613T45\02
Count
No. Count Name
Observed
Flow
Modelled
Flow Diff % Diff GEH
Met Flow
Criteria GEH <5.5 GEH>10
2679 B2215 High Street northbound 686 862 176 26% 6.34
2680 B2215 High Street southbound 804 888 84 10% 2.89
2681 B2215 High Street southbound 562 551 -11 -2% 0.45
2682 B367 Newark Lane northbound 318 343 25 8% 1.38

Waverley & Guildford Local Plan Model Development Validation Report
Issue No. 01 Page 49 Document No.53613T45\02
APPENDIX B – JOURNEY TIME VALIDATION
Guildford Borough – Average weekday AM peak hour (0700 – 1000)

Waverley & Guildford Local Plan Model Development Validation Report
Issue No. 01 Page 50 Document No.53613T45\02
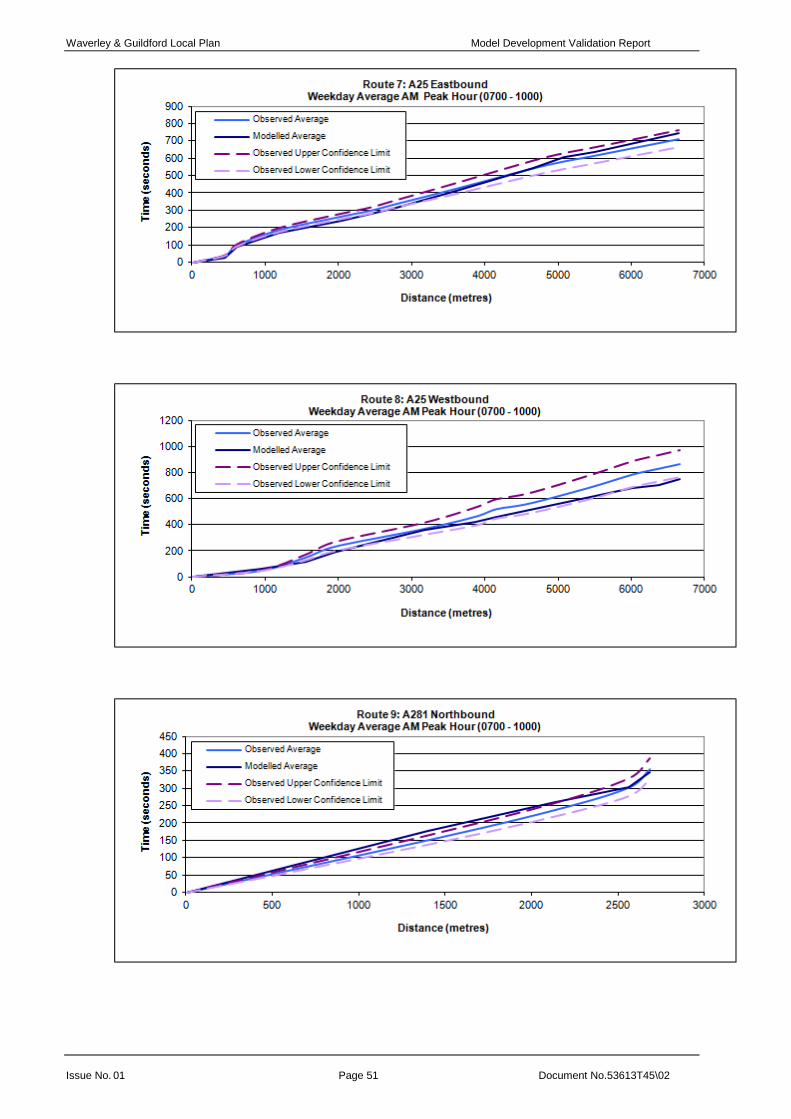
Waverley & Guildford Local Plan Model Development Validation Report
Issue No. 01 Page 51 Document No.53613T45\02

Waverley & Guildford Local Plan Model Development Validation Report
Issue No. 01 Page 52 Document No.53613T45\02
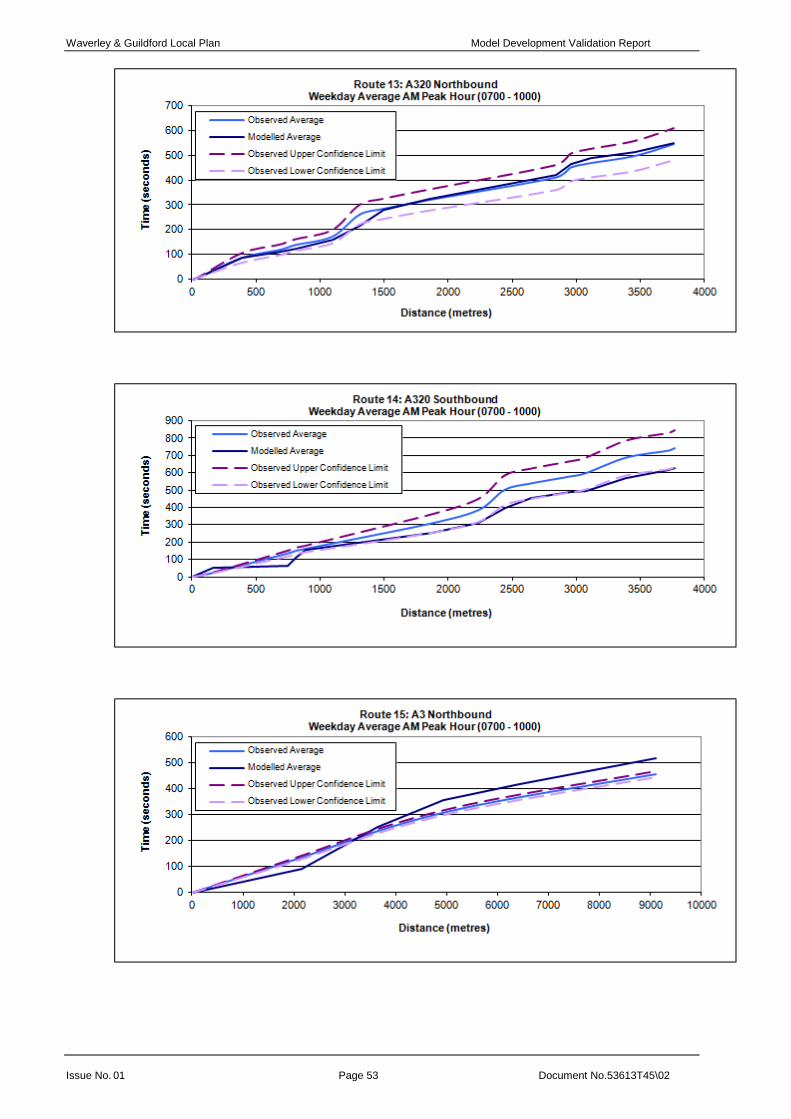
Waverley & Guildford Local Plan Model Development Validation Report
Issue No. 01 Page 53 Document No.53613T45\02

Waverley & Guildford Local Plan Model Development Validation Report
Issue No. 01 Page 54 Document No.53613T45\02

Waverley & Guildford Local Plan Model Development Validation Report
Issue No. 01 Page 55 Document No.53613T45\02

Waverley & Guildford Local Plan Model Development Validation Report
Issue No. 01 Page 56 Document No.53613T45\02
Guildford Borough – Average weekday PM peak hour (1600 – 1900)
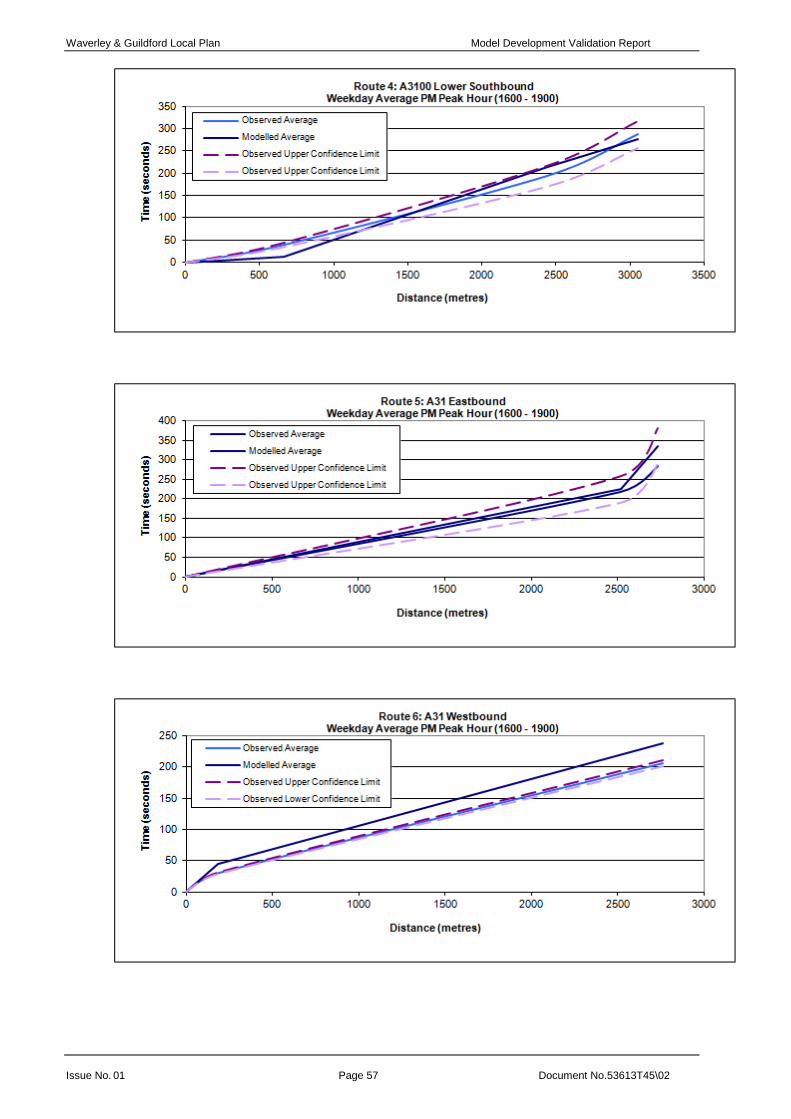
Waverley & Guildford Local Plan Model Development Validation Report
Issue No. 01 Page 57 Document No.53613T45\02
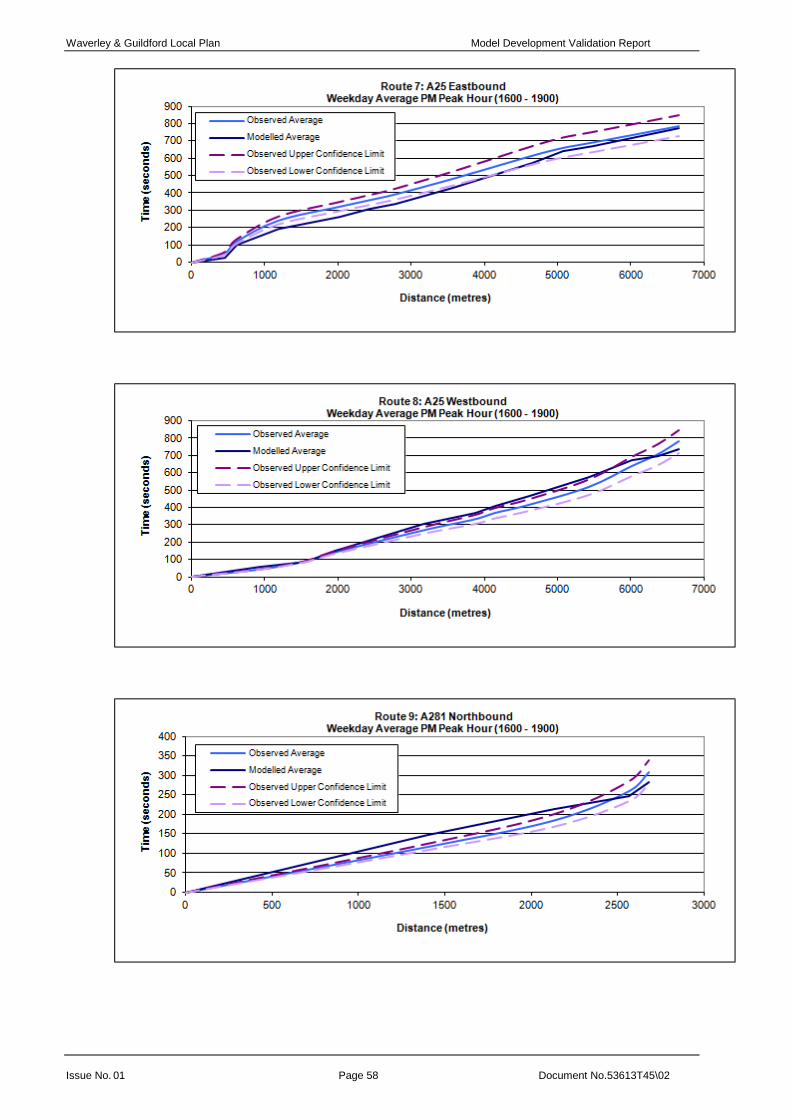
Waverley & Guildford Local Plan Model Development Validation Report
Issue No. 01 Page 58 Document No.53613T45\02
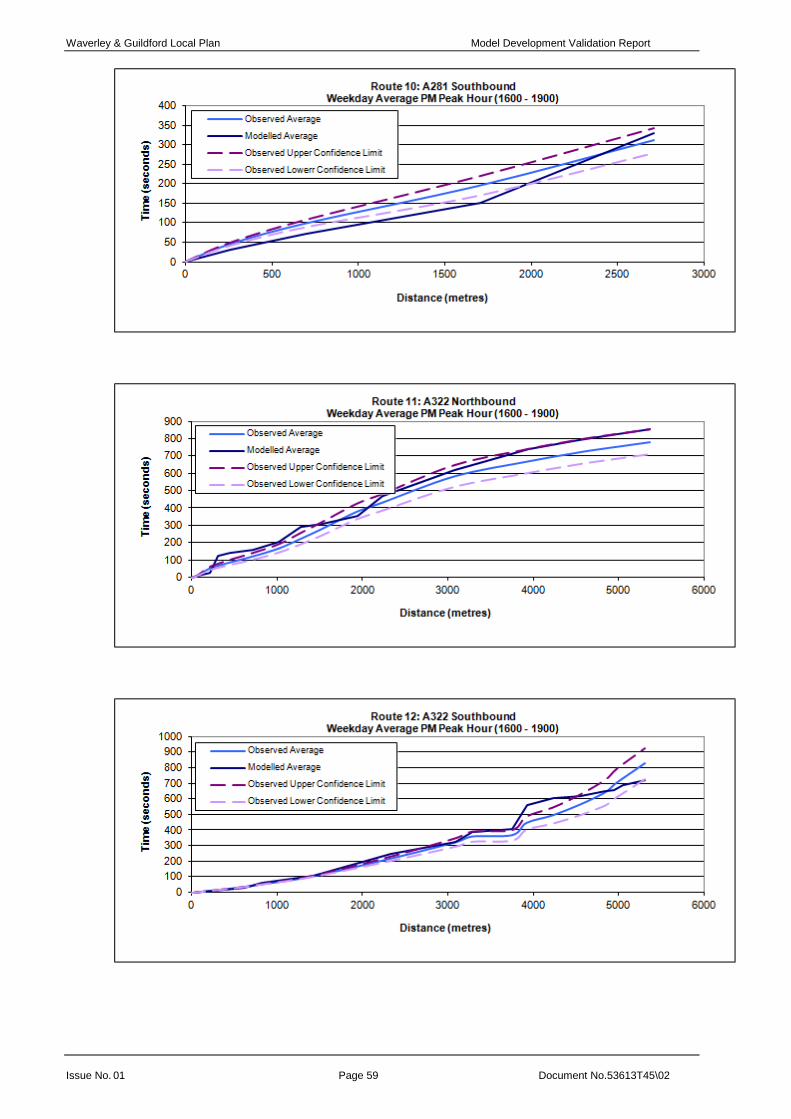
Waverley & Guildford Local Plan Model Development Validation Report
Issue No. 01 Page 59 Document No.53613T45\02
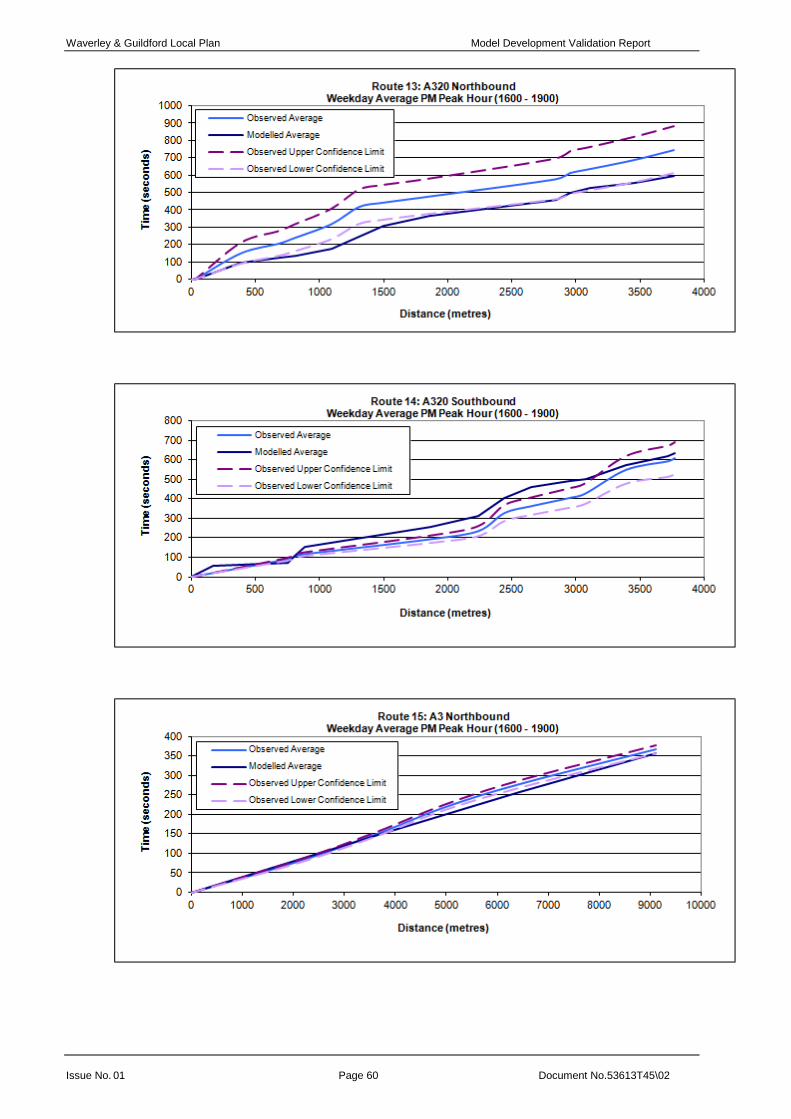
Waverley & Guildford Local Plan Model Development Validation Report
Issue No. 01 Page 60 Document No.53613T45\02

Waverley & Guildford Local Plan Model Development Validation Report
Issue No. 01 Page 61 Document No.53613T45\02
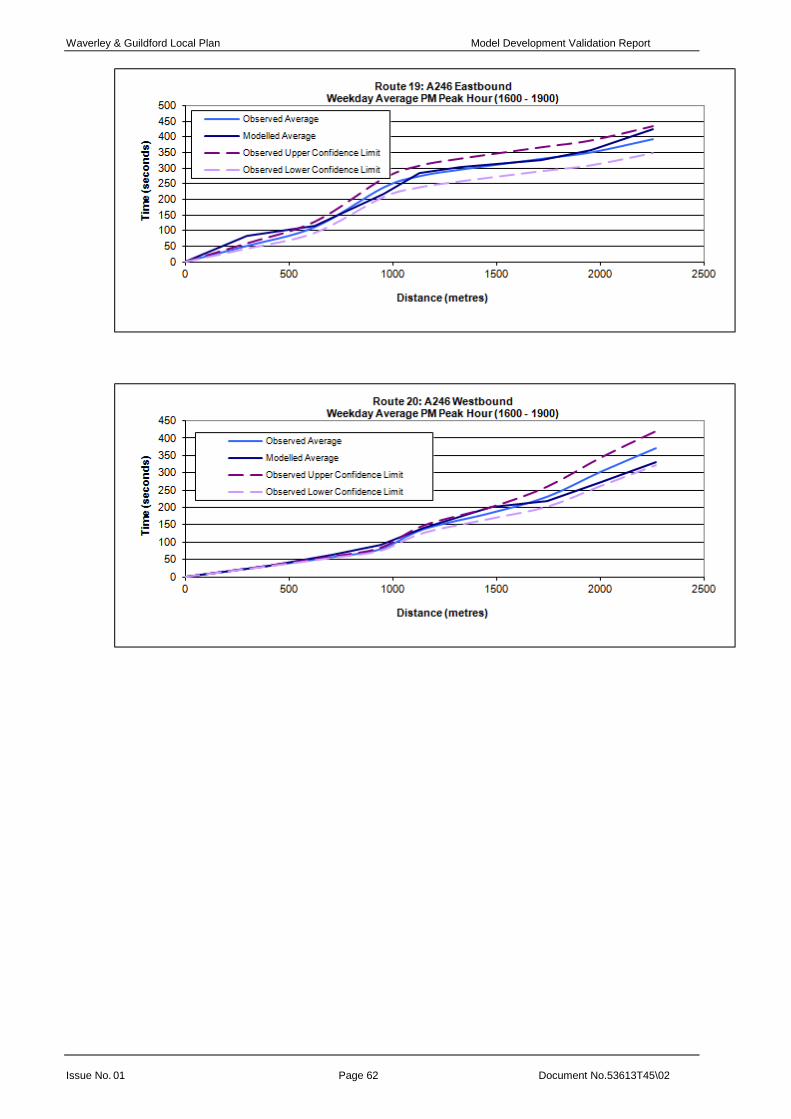
Waverley & Guildford Local Plan Model Development Validation Report
Issue No. 01 Page 62 Document No.53613T45\02