
“Waterway Transportation as a Logistic and Environmental...
55
“Waterway Transportation as a Logistic and Environmental Solution Meeting of the Permanent Brazil-Netherlands Workgroup for Cooperation in the Port Sector Fernando Fialho Director-General of ANTAQ Date: 04/09/2010 Venue: Palácio do Itamaraty
Transcript of “Waterway Transportation as a Logistic and Environmental...
“Waterway Transportation as a Logistic and Environmental Solution
Meeting of the Permanent Brazil-Netherlands Workgroup for Cooperation in the Port Sector
Fernando FialhoDirector-General of ANTAQ
Date: 04/09/2010Venue: Palácio do Itamaraty

A brief Brazil’s overview

General facts about Brazil
Total Area : 8.514.876 Km²(The largest country in Latin America)States: 27 StatesCoast: 8.511KmPopulation: 191,480,630 millionGDP 2009 – US$ 1.995 trillion (PPC Basis)
*Source: IBGE - Wikipédia
10th largest world economy
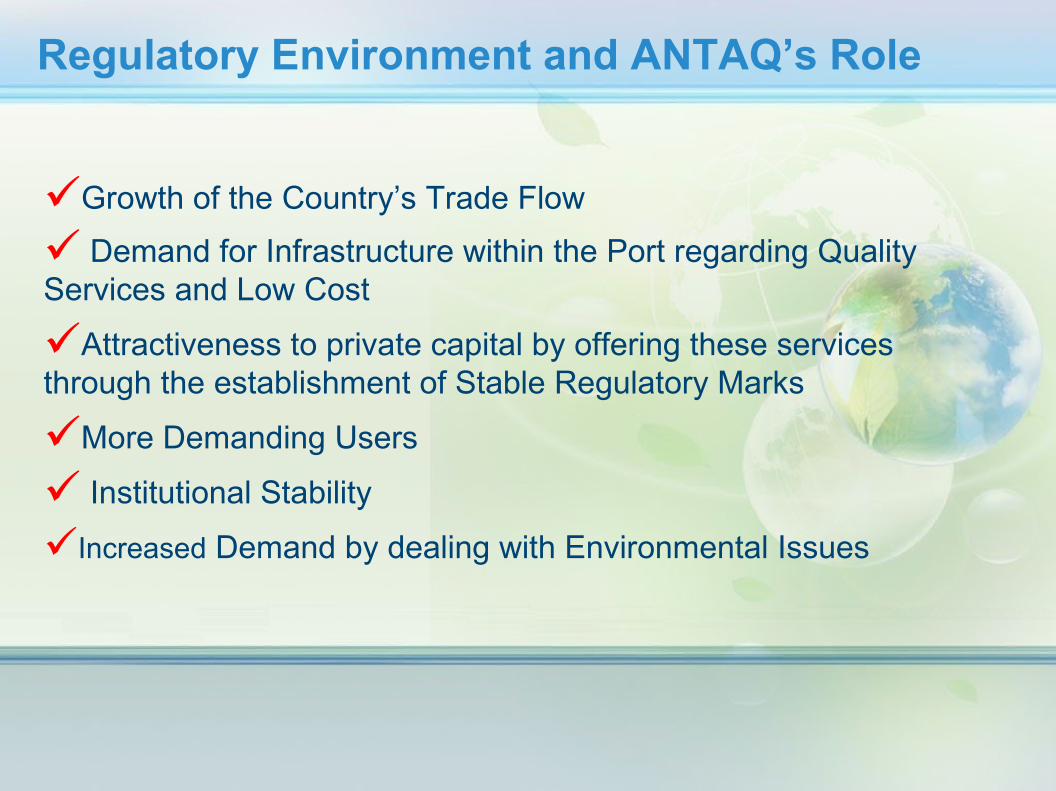
Regulatory Environment and ANTAQ’s Role
Growth of the Country’s Trade Flow
Demand for Infrastructure within the Port regarding Quality Services and Low Cost
Attractiveness to private capital by offering these services through the establishment of Stable Regulatory Marks
More Demanding Users
Institutional Stability
Increased Demand by dealing with Environmental Issues
What is required of the Regulatory entity
Establishing a Clear Regulation
Stock’s Predictability
Balance on the Disputes Settlement
Ensure the Investors Rights
Ensure Appropriate Services to the Users
Strict compliance with the legal precepts
Encouraging Competition
A More Effective Supervision
Commitment to the Waterway sector
Main Challenges for The Waterway Sector
Adding value to Planning:General Concession Plan for PortsGeneral Concession Plan for WaterwaysDevelopment and Zoning PlansLeasing Ports ProgramsFocus on Public Port as a Public Service Provider Port Encouraging Barging and fleet renewal Strengthening Support to the Maritime Sector Valuing Multimodal Integration Defend the Multiple Use of Water as an action in favor of economic, social and environmental development

2005
*source: Emission Inventory, CAIT
17.43 %
16.83 %
12.45 %
5.51 %
4.90 %
3.83 %
3.75 %
2.51 %
1.92 %
Carbon emissions by country - with forest fires
6.62%4th Place
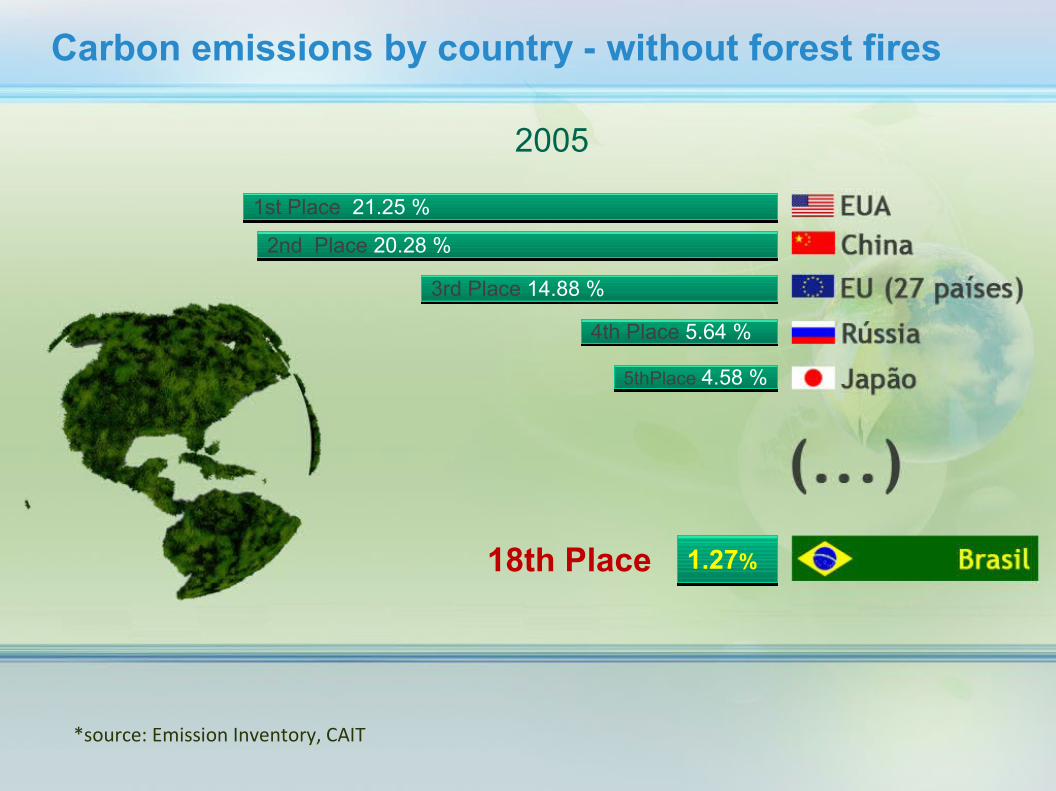
2005
1st Place 21.25 %
2nd Place 20.28 %
3rd Place 14.88 %
4th Place 5.64 %
5thPlace 4.58 %
1.27%18th Place
Carbon emissions by country - without forest fires
*source: Emission Inventory, CAIT

37.4%
15.9%16.3%
9.9%
0.6%
3.6%
16.3%Eletricidade & calor
Fabricação & ConstruçãoTransporte
Outros Combustíveis
Emissão Transitória
Processo Industrial
Mudança no Uso da terra e silvicultura
*source: CAIT
Carbon Emissions In the World
Electricity & Heat
Manufacturing & Construction
Transport
Transitory Emission
Industrial Process
Changes in land and forestry usage
Another Fuels
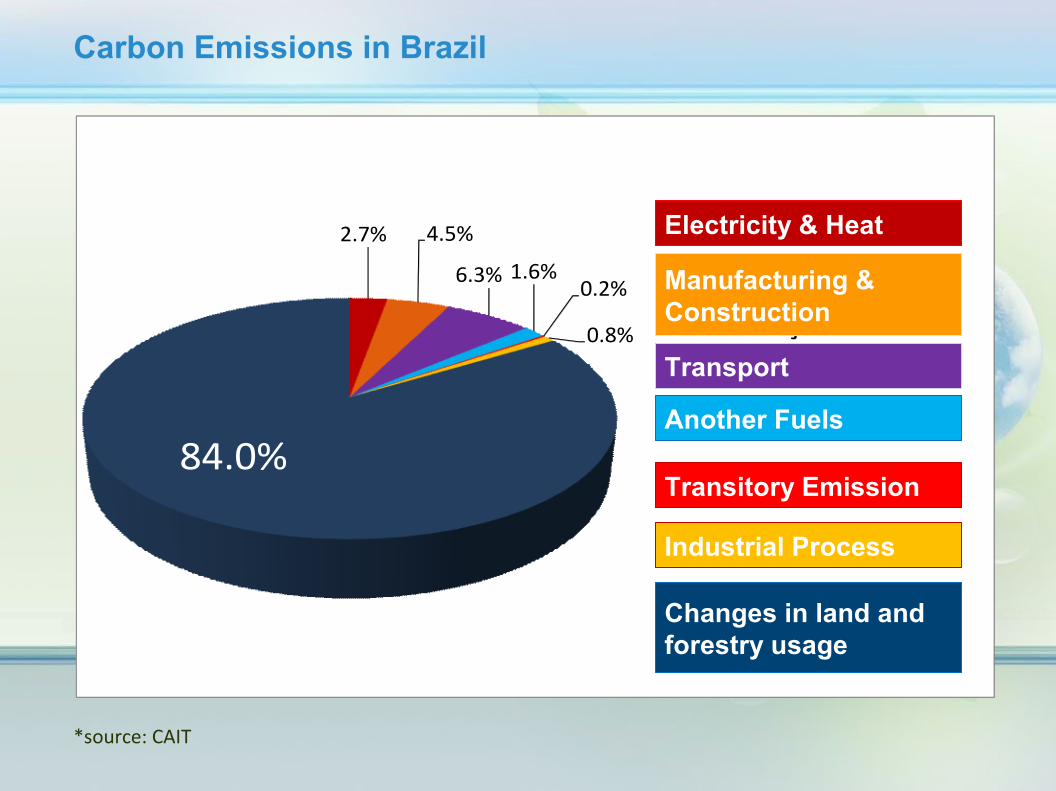
2.7% 4.5%
6.3% 1.6%0.2%
0.8%
84.0%
Eletricidade & calor
Fabricação & ConstruçãoTransporte
Outros Combustíveis
Emissão Transitória
Processo Industrial
Mudança no Uso da terra e silvicultura
Carbon Emissions in Brazil
*source: CAIT
Electricity & Heat
Manufacturing & Construction
Transport
Another Fuels
Transitory Emission
Industrial Process
Changes in land and forestry usage

*source: Ribeiro / IPEA
Brazil
Forest Cover Statistics
Brazil28.3%
Europe(without Russia)AfricaAsiaSouth America (without Brazil)
Rest of the WorldRest of the World49.6% Europe
(without Russia)0.1%
Africa3.4%
Asia5,5%
South America(without Brazil)
13.1%
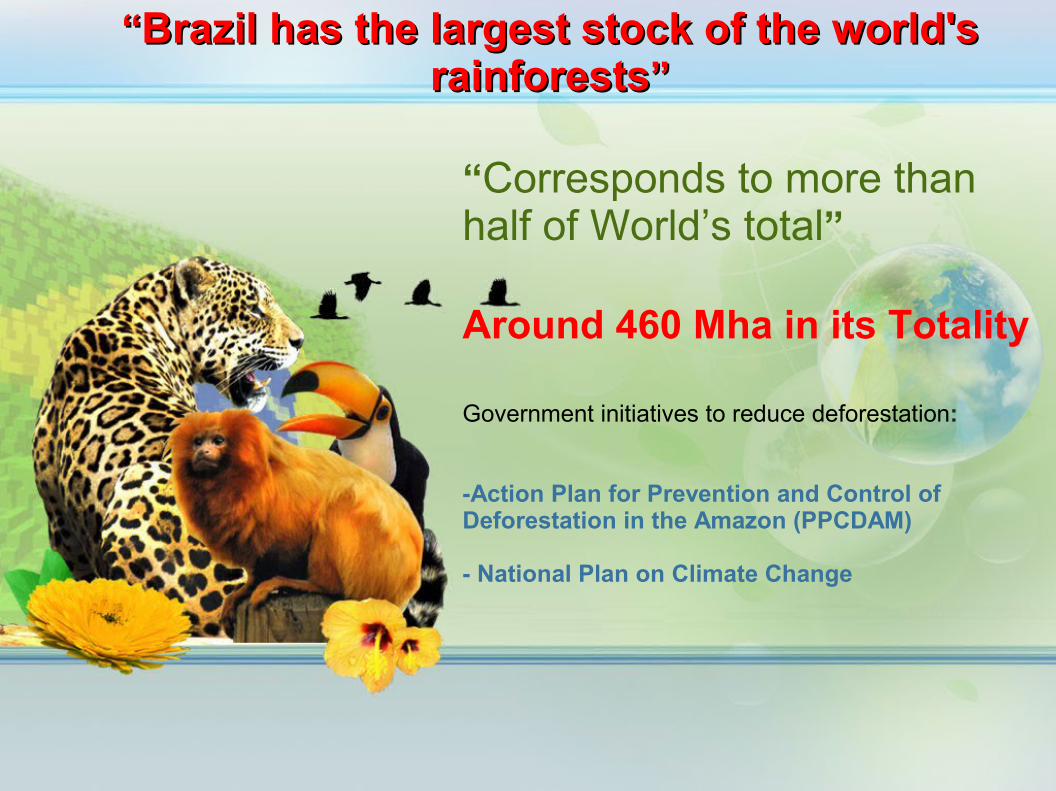
““Brazil has the largest stock of the world's Brazil has the largest stock of the world's rainforestsrainforests””
“Corresponds to more than half of World’s total”
Around 460 Mha in its Totality
Government initiatives to reduce deforestation:
-Action Plan for Prevention and Control of Deforestation in the Amazon (PPCDAM)
- National Plan on Climate Change
“Brazil is the largest supplier of Oxygen on
the planet”
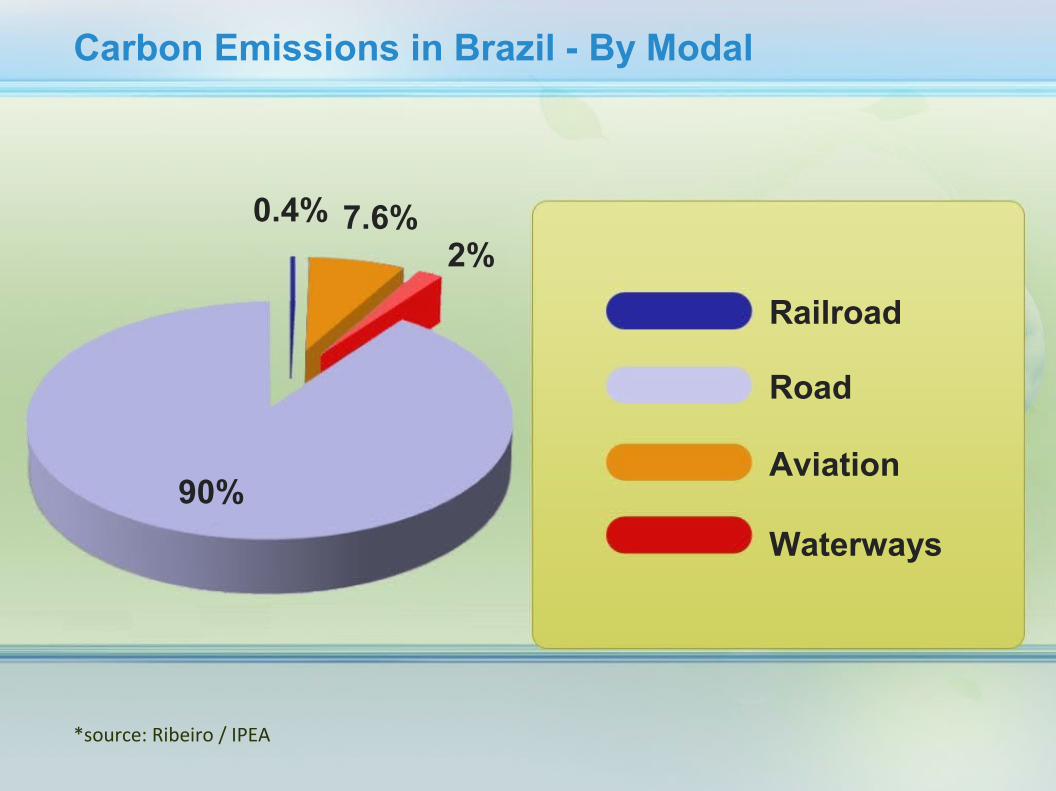
*source: Ribeiro / IPEA
Railroad
Carbon Emissions in Brazil - By Modal
0.4% 7.6%2%
90%
Road
Aviation
Waterways
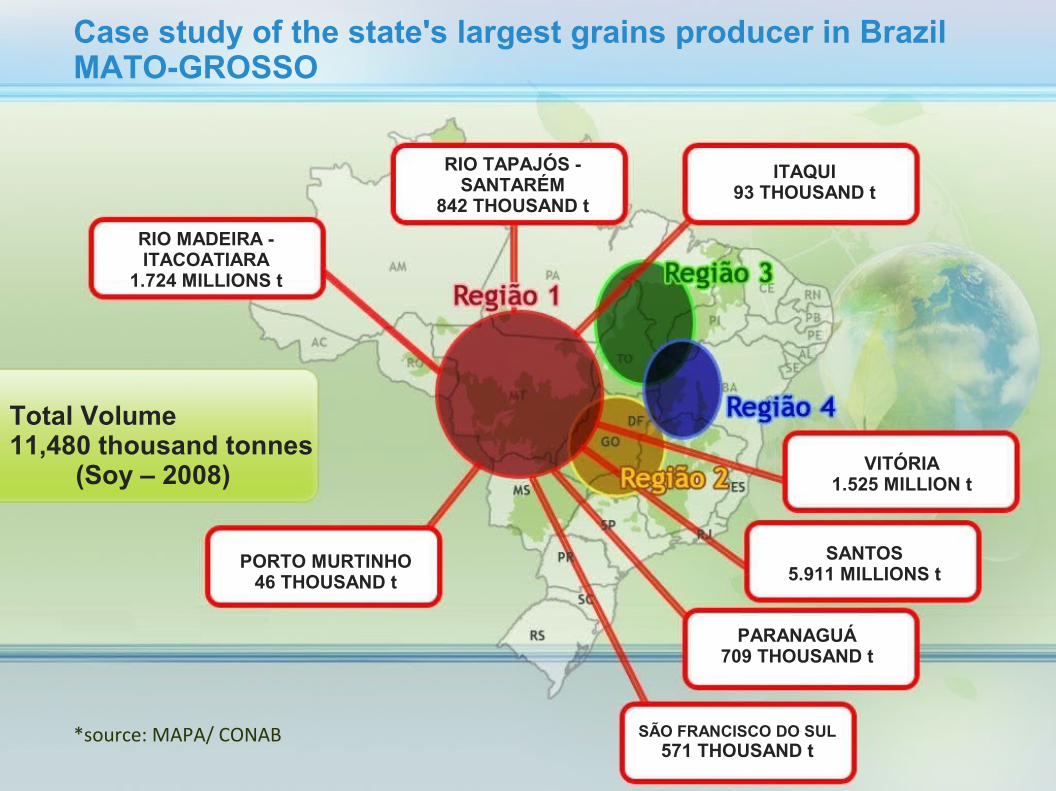
Case study of the state's largest grains producer in BrazilMATO-GROSSO
Total Volume11,480 thousand tonnes (Soy – 2008)
PORTO MURTINHO46 THOUSAND t
SÃO FRANCISCO DO SUL571 THOUSAND t
PARANAGUÁ709 THOUSAND t
SANTOS5.911 MILLIONS t
VITÓRIA1.525 MILLION t
ITAQUI93 THOUSAND t
RIO TAPAJÓS - SANTARÉM
842 THOUSAND t
RIO MADEIRA - ITACOATIARA
1.724 MILLIONS t
*source: MAPA/ CONAB

1 source: Brazil’s Agribusiness projections 2008/2009 to 2018/19 – AGE / MAPA
Current and Potential Grains’ moving in Mato Grosso
Grains Production in Mato Grosso
MATO-GROSSO
Production taken by the waterway system
Grains Moving in the Waterways
27.5 millions t
14.9 %
4.1 millions t
40,3 40,3 Millions tMillions t
(2010/19 crop)(2010/19 crop)
60%60%24,2 24,2 Millions tMillions t
Current Potential
*source: Projeções do Agronegócio Brasil 2008/2009 to 2018/19 – AGE / MAPA
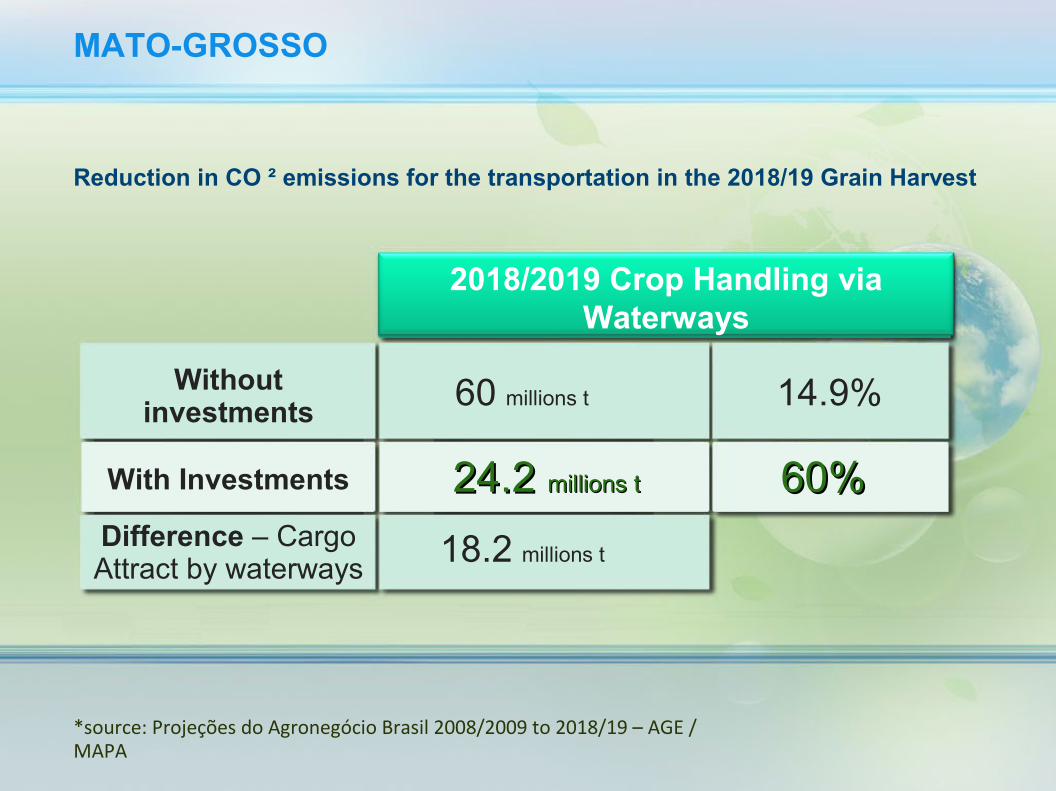
Reduction in CO ² emissions for the transportation in the 2018/19 Grain Harvest
Without investments
MATO-GROSSO
60 millions t
60%60%With Investments
Difference – CargoAttract by waterways 18.2 millions t
14.9%
24.2 24.2 millions tmillions t
2018/2019 Crop Handling via Waterways
*source: Brazil’s Agribusiness projections 2008/2009 to 2018/19 – AGE / MAPA
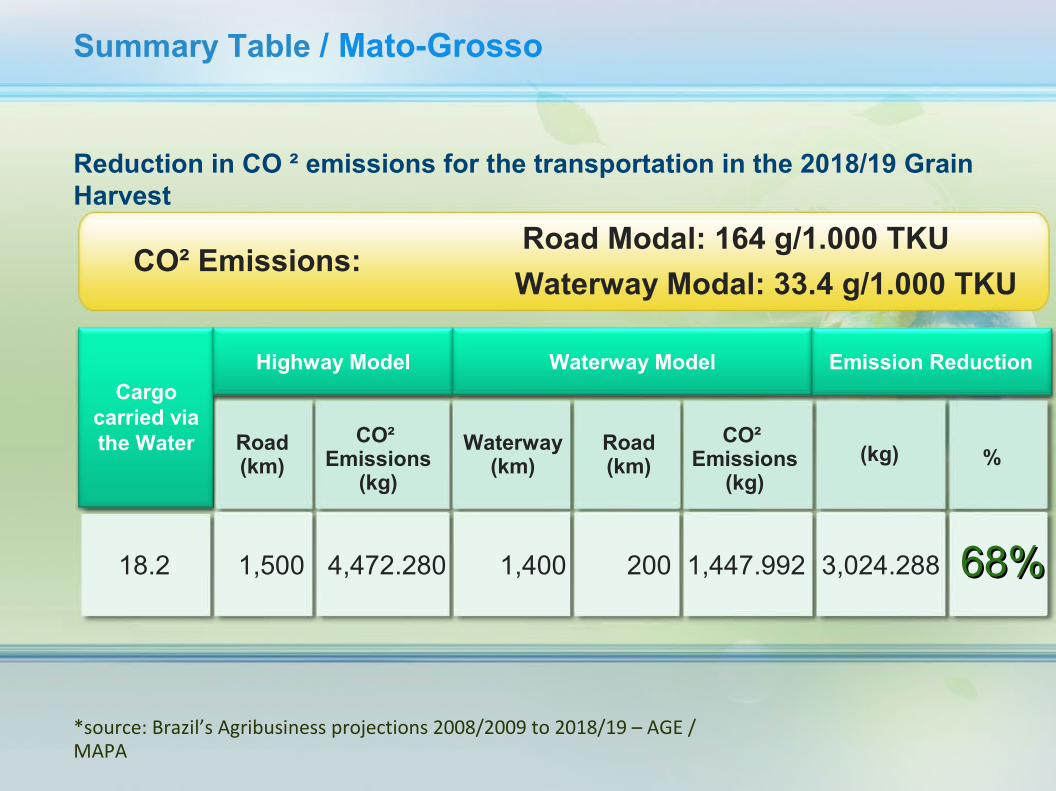
Road(km)
Summary Table / Mato-Grosso
1,400 68%68%
Reduction in CO ² emissions for the transportation in the 2018/19 Grain Harvest
CO² Emissions:Road Modal: 164 g/1.000 TKUWaterway Modal: 33.4 g/1.000 TKU
CO² Emissions
(kg)
Road(km)
Waterway(km)
CO² Emissions
(kg)(kg) %
4,472.2801,50018.2 200 1,447.992 3,024.288
Cargo carried via the Water
Highway Model Waterway Model Emission Reduction
Environmental Challenges as an Opportunity
THE FUEL SHIFTBrazil succeed in the biofuels
program implementation

Pioneer in a biofuel production: BRAZIL
*source: MARA – Ministério da Agricultura, do Abastecimento e da Reforma Agrária
Ethanol (Ethyl Alcohol)Feedstock: Sugar Cane
Proálcool- On 14/11/1975 Decree nº 76.593 creates proálcool
- The Largest Program for utilization of Renewable Fuel in the World
- It allowed the addition of 25% ethanol to gasoline, allowing the lead removal, generating great benefits for the environment and society.
- Projecting to export 4.75 billion liters of ethanol, considering Japan as the main market for exportation

*source: MARA – Ministério da Agricultura, do Abastecimento e da Reforma Agrária
Gasoline demand for light vehiclesGasoline ProductionGasoline Consumption
GASOLINE
The economy due to the ethanol usage in Brazil
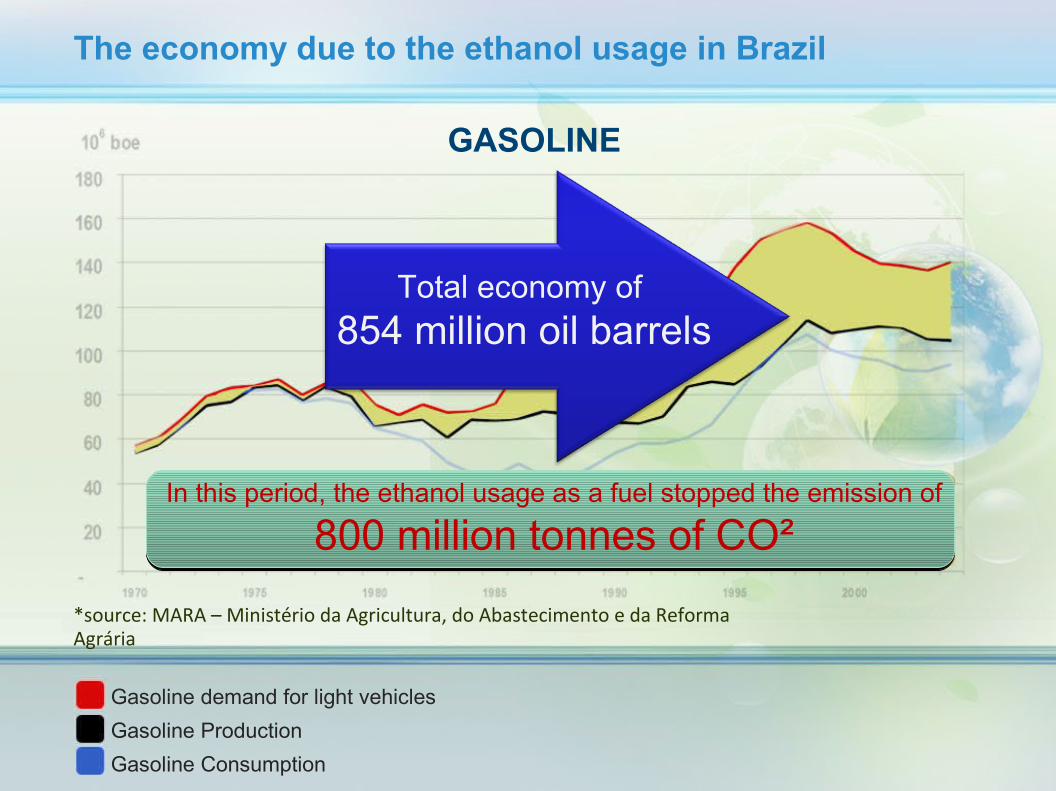
The economy due to the ethanol usage in Brazil
*source: MARA – Ministério da Agricultura, do Abastecimento e da Reforma Agrária
Gasoline demand for light vehiclesGasoline ProductionGasoline Consumption
GASOLINE
In this period, the ethanol usage as a fuel stopped the emission of
800 million tonnes of CO²
Total economy of 854 million oil barrels

THE MODAL SHIFTThe shift to a waterway modal will reduce the CO² emissions on the
transport sector.
BRAZIL
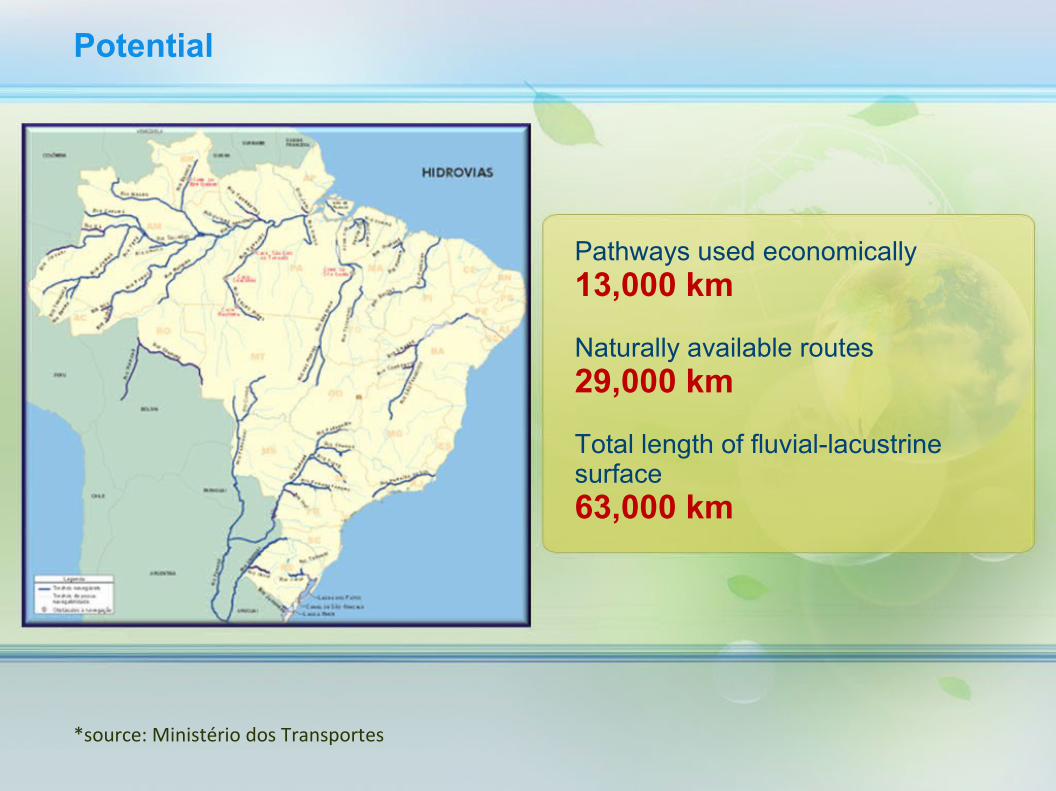
Potential
Pathways used economically13,000 km
Naturally available routes 29,000 km
Total length of fluvial-lacustrine surface 63,000 km
*source: Ministério dos Transportes
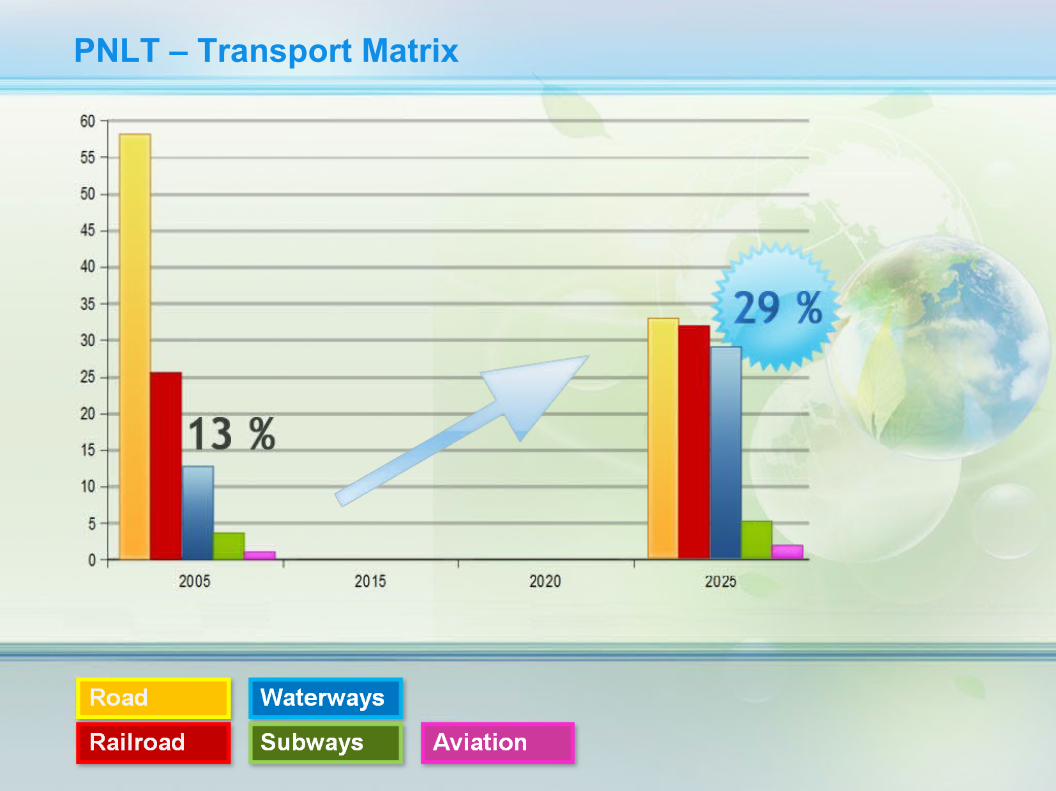
PNLT – Transport Matrix

Waterway Corridors – PAC II
Fonte: Ministério dos Transportes
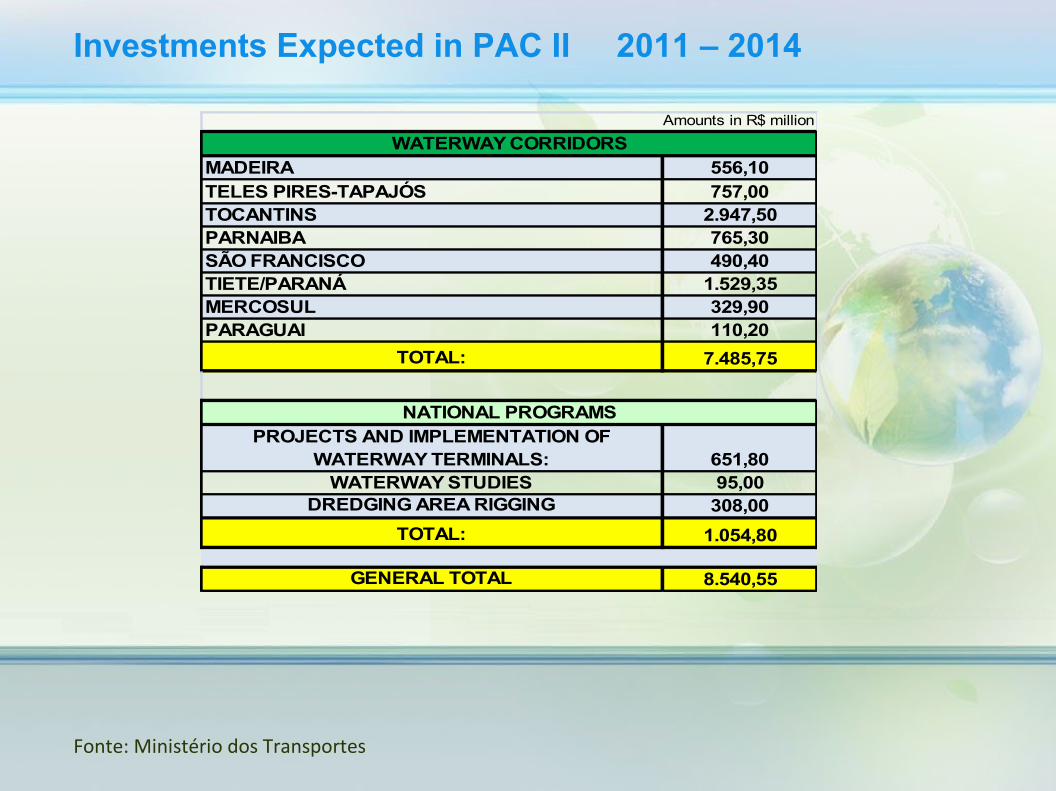
MADEIRA 556,10TELES PIRES-TAPAJÓS 757,00TOCANTINS 2.947,50PARNAIBA 765,30SÃO FRANCISCO 490,40TIETE/PARANÁ 1.529,35MERCOSUL 329,90PARAGUAI 110,20
TOTAL: 7.485,75
PROJECTS AND IMPLEMENTATION OF WATERWAY TERMINALS: 651,80
WATERWAY STUDIES 95,00DREDGING AREA RIGGING 308,00
TOTAL: 1.054,80
GENERAL TOTAL 8.540,55
Amounts in R$ million
WATERWAY CORRIDORS
NATIONAL PROGRAMS
Investments Expected in PAC II 2011 – 2014
Fonte: Ministério dos Transportes
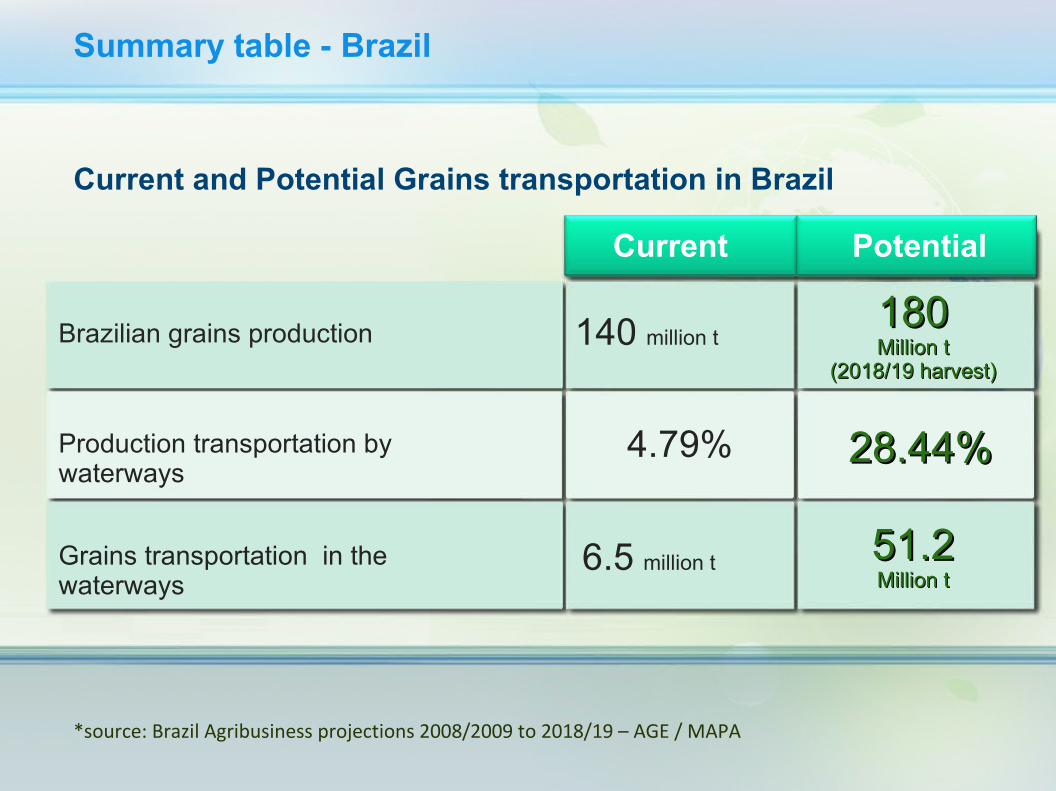
*source: Brazil Agribusiness projections 2008/2009 to 2018/19 – AGE / MAPA
Current and Potential Grains transportation in Brazil
Brazilian grains production
Summary table - Brazil
140 million t180180Million tMillion t
(2018/19 harvest)(2018/19 harvest)
Production transportation by waterways
Grains transportation in the waterways
6.5 million t
4.79% 28.44%28.44%
51.251.2Million tMillion t
Current Potential
*source: Brazil Agribusiness projections 2008/2009 to 2018/19 – AGE / MAPA
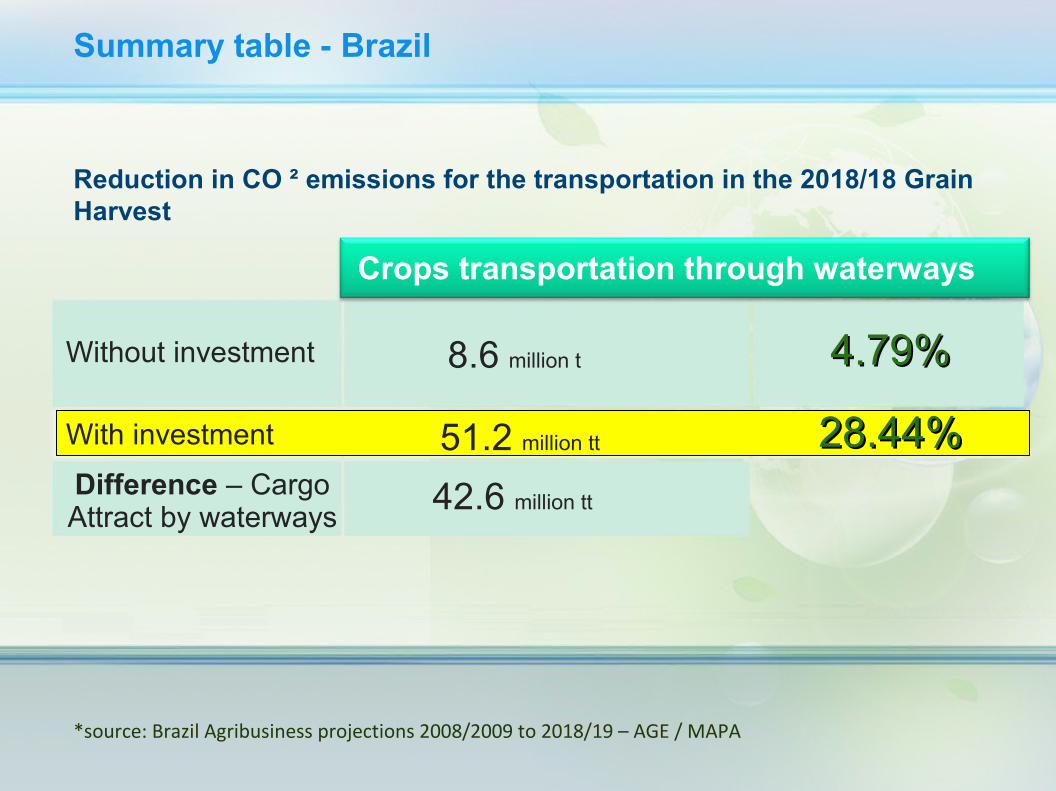
Reduction in CO ² emissions for the transportation in the 2018/18 Grain Harvest
Without investment
Summary table - Brazil
8.6 million t
28.44%28.44%With investment
Difference – CargoAttract by waterways
51.2 million tt
42.6 million tt
4.79%4.79%
Crops transportation through waterways

* source: Brazil Agribusiness projections 2008/2009 to 2018/19 – AGE / MAPA
68%68%6.986.4001.00024,6milhões de t
1.200 200 3.104.688 3.881.712
Cargo carried via the Water
Highway Model Waterway Model Emission Reduction
Reduction in CO ² emissions for the transportation in the 2018/18 Grain Harvest
CO² Emissions:Road Modal: 164 g/1.000 TKUWaterway Modal: 33.4 g/1.000 TKU
Road(km)
CO² Emissions
(kg)
Road(km)
Waterway(km)
CO² Emissions
(kg)(kg) %
Summary Table / Brazil
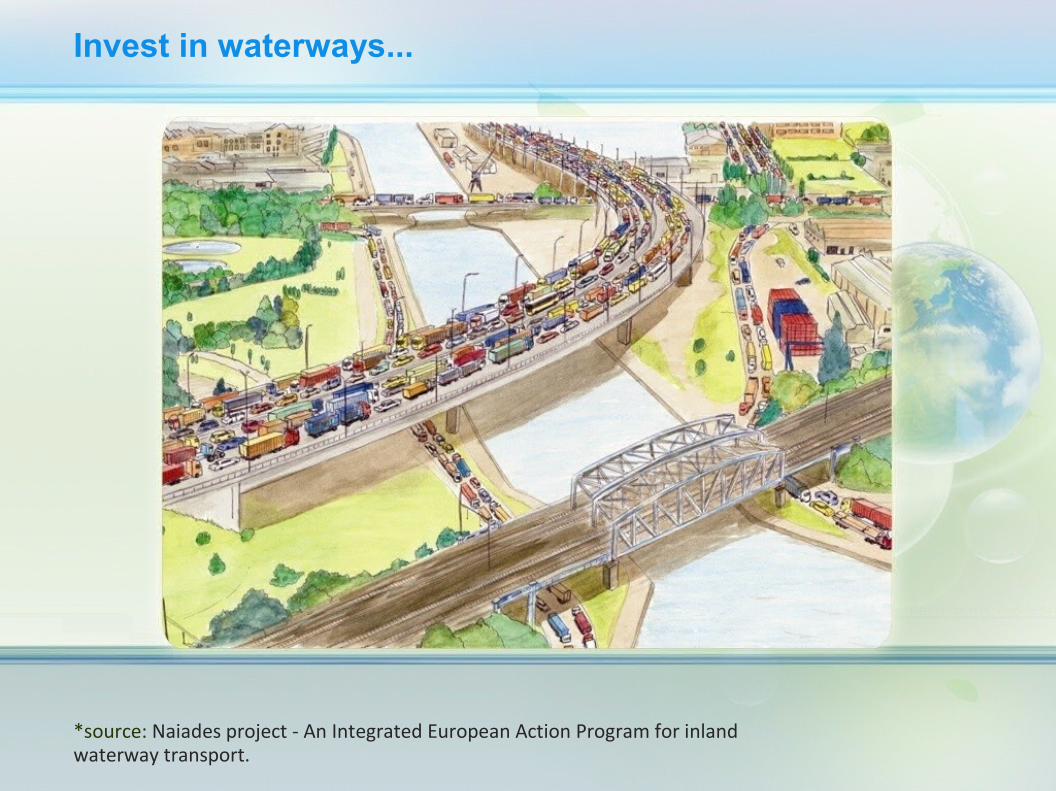
*source: Naiades project - An Integrated European Action Program for inland waterway transport.
Invest in waterways...

*source: Naiades project - An Integrated European Action Program for inland waterway transport.
... Is to invest in the environment

Investment Opportunities at the Brazilian Ports
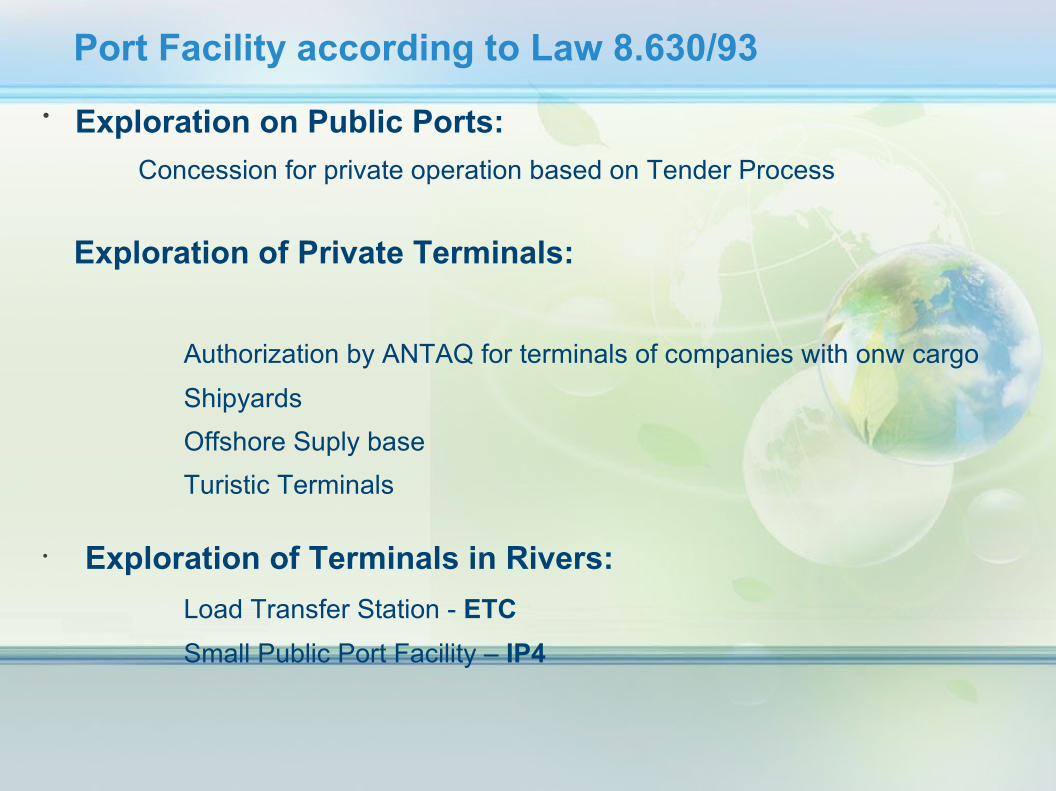
Port Facility according to Law 8.630/93• Exploration on Public Ports: Concession for private operation based on Tender Process
Exploration of Private Terminals:
Authorization by ANTAQ for terminals of companies with onw cargo
ShipyardsOffshore Suply baseTuristic Terminals
• Exploration of Terminals in Rivers: Load Transfer Station - ETCSmall Public Port Facility – IP4

Identification of Areas, which areresults from the applicationof the criteria matrix that guided the work
Results of the PGO
*source: ANTAQ
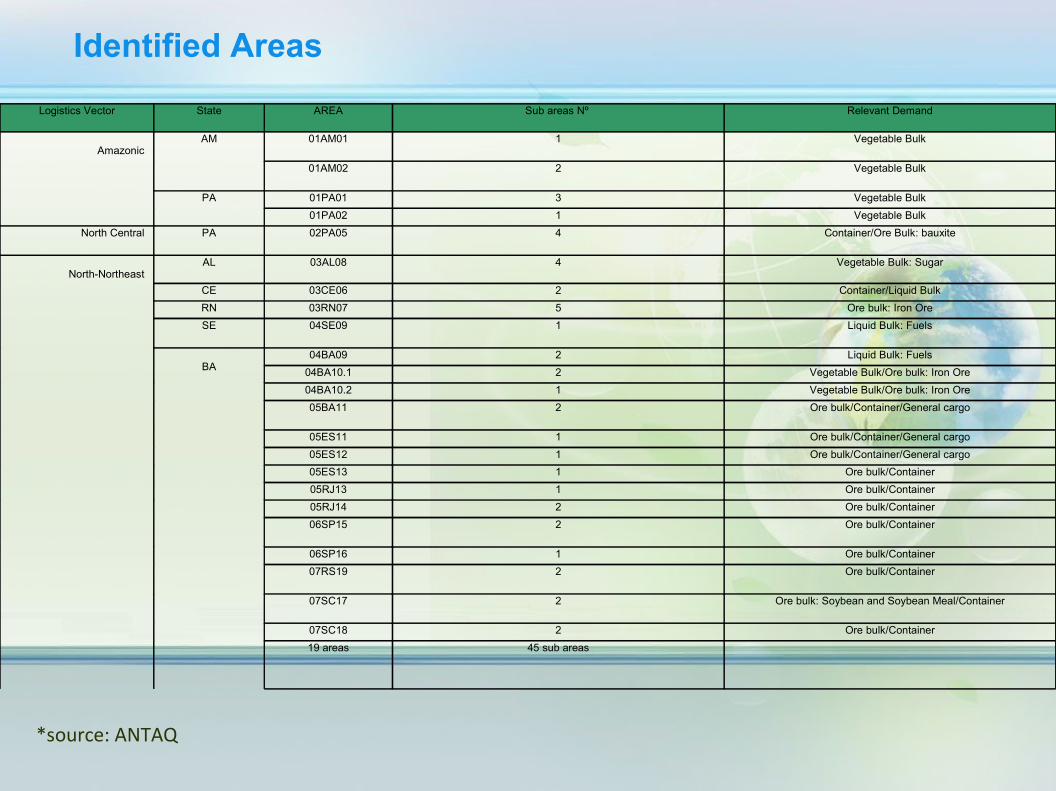
Identified Areas
*source: ANTAQ
Logistics Vector State AREA Sub areas Nº Relevant Demand
AmazonicAM 01AM01 1 Vegetable Bulk
01AM02 2 Vegetable Bulk
PA 01PA01 3 Vegetable Bulk01PA02 1 Vegetable Bulk
North Central PA 02PA05 4 Container/Ore Bulk: bauxite
North-NortheastAL 03AL08 4 Vegetable Bulk: Sugar
CE 03CE06 2 Container/Liquid BulkRN 03RN07 5 Ore bulk: Iron OreSE 04SE09 1 Liquid Bulk: Fuels
BA04BA09 2 Liquid Bulk: Fuels
04BA10.1 2 Vegetable Bulk/Ore bulk: Iron Ore04BA10.2 1 Vegetable Bulk/Ore bulk: Iron Ore05BA11 2 Ore bulk/Container/General cargo
05ES11 1 Ore bulk/Container/General cargo05ES12 1 Ore bulk/Container/General cargo05ES13 1 Ore bulk/Container05RJ13 1 Ore bulk/Container05RJ14 2 Ore bulk/Container06SP15 2 Ore bulk/Container
06SP16 1 Ore bulk/Container07RS19 2 Ore bulk/Container
07SC17 2 Ore bulk: Soybean and Soybean Meal/Container
07SC18 2 Ore bulk/Container19 areas 45 sub areas

Macro areas Identification
*source: ANTAQ

Sub-priority areas Characterization
*source: ANTAQ

Sub-priority areas Characterization
*source: ANTAQ
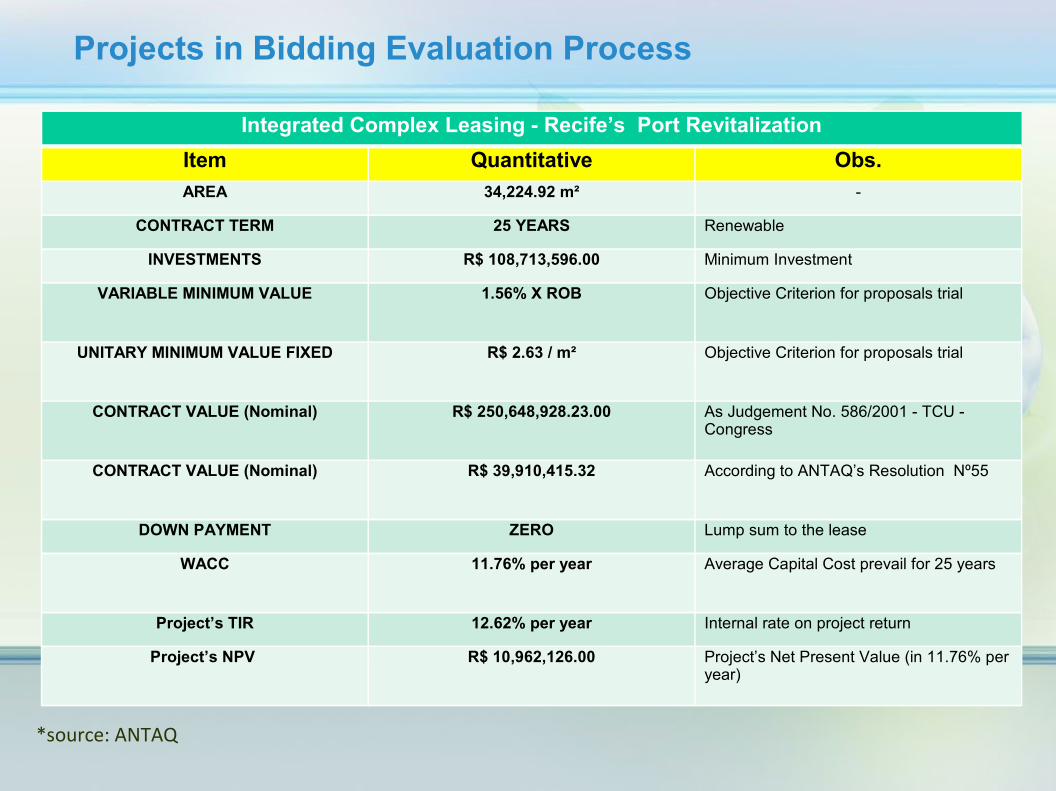
Projects in Bidding Evaluation Process
*source: ANTAQ
Integrated Complex Leasing - Recife’s Port RevitalizationItem Quantitative Obs.AREA 34,224.92 m² -
CONTRACT TERM 25 YEARS Renewable
INVESTMENTS R$ 108,713,596.00 Minimum Investment
VARIABLE MINIMUM VALUE 1.56% X ROB Objective Criterion for proposals trial
UNITARY MINIMUM VALUE FIXED R$ 2.63 / m² Objective Criterion for proposals trial
CONTRACT VALUE (Nominal) R$ 250,648,928.23.00 As Judgement No. 586/2001 - TCU - Congress
CONTRACT VALUE (Nominal) R$ 39,910,415.32 According to ANTAQ’s Resolution Nº55
DOWN PAYMENT ZERO Lump sum to the lease
WACC 11.76% per year Average Capital Cost prevail for 25 years
Project’s TIR 12.62% per year Internal rate on project return
Project’s NPV R$ 10,962,126.00 Project’s Net Present Value (in 11.76% per year)

QUADRO RESUMO DO ARRENDAMENTO
Arrendamento do Terminal de Fertilizantes e Ração Animal do Porto de Imbituba
Item Quantitativo Observação
Área 59.263 m²Prazo Contratual 25 anos -
Investimentos Mínimos R$ 17.842.824,00R$12.986.618,00 a vista; R$ 1.026.703,18 no 1º ano
e o restante R$ 3.829.503,43 até o 5ºanoValor Unitário Mínimo Variável R$ 2,52 / ton Conforme modelagem da ANTAQ (Tabela 11)
Valor Unitário Mínimo Fixo R$ 0,844 / m² / mês R$ 0,127 / m² / mês (área de expansão) até o 5º anoDown Payment R$ 3.482.810,90 Valor pago a vista – adiandamento do arrendamento
WACC 8,30 % aa Custo Médio Ponderado de CapitaisTIR do Projeto 19,20% Taxa Interna de Retorno do Projeto
VPL do Projeto R$ 17.414.054,51 Valor Presente Líquido – VPL do Projeto ( descontado à taxa de 8,30% aa – WACC)
Valor do Contrato 1 R$ 40.601.486,39Conforme inciso VI do Art. 2º - Res. Nº 55 – ANTAQ
(Valor Nominal durante os 25 anos do contrato)
Valor do Contrato 2 R$ 410.886.510,00 Conforme acórdão 1028/2007 – Plenário - TCU (Valor Nominal da receita do arrendatário durante os 25 anos)
Incluso Área de Expansão c/ 14.196 m² (área 134A do PDZ)
Projects in Bidding Evaluation Process
*source: ANTAQ
Leasing Summary TableLease for the Fertilizer and Feed Imbituba’s Terminal Port
Item Quantitative Obs.AREA 34,224.92 m² Including expansion area w/ 14,196 m² (13 PDZ
area)
CONTRACT TERM 25 YEARS -
INVESTMENTS R$ 17,842,824.00 R$ 12,986,618.00 paid in cash and, R$ 1,026,703,18.00 in the 1st Year and the others R$ 3,829,503.43 until the 5th year
UNITARY MINIMUM VALUE VARIABLE R$ 2.52/ tonne According to ANTAQ model (11 table)
UNITARY MINIMUM VALUE FIXED R$ 0.844 / m²/ monthly R$ 0.127/ m²/ monthly (expansion area) until the 5th year
DOWN PAYMENT R$ 3,482,810.90 Amount paid in cash - the lease advance
WACC 8.30% per year Estimated Capital Average Cost
Project’s TIR 19.20% Internal rate on project return
Project’s NPV R$ 17,414,054.51 Net Present Value – Project’s NPV (with discounted interest rate of 8.30% per year - WACC)
CONTRACT VALUE 1 R$ 40,601,486.39 As the item VI Atr 2- ANTAQ - Res No. 55 -(nominal value during the 25 years contract)
CONTRACT VALUE 2 R$ 410,886,510.00 As above 1028/2007 - TCU – Congress- ANTAQ Res No. 55 - (nominal value of the revenue of the tenant during the 25 years contract)

Projects in Bidding Evaluation Process
*source: ANTAQ
SUMMARY TABLE OF BIDDING LIQUID BULK TERMINAL - SANTOS PORTLease Area 38,398.27 m² (Art. 4º § 4º from the law 8.630/93)
Minimum Contract Investment R$ 10,817,892.00 (Art. 4º § 6º from the law 8.630/93)Lease Terms 25 anos (Art. 30 from 055-ANTAQ Res.)
Monthly Rental Value R$ 217,995.00 (Art. 2º from 055-ANTAQ Res.)
Min. Payment of theFixed lease Portion
R$ 2.50 /m²/monthly (Art. 13 from 055-ANTAQ Res.)
Min. payment of Variable lease Portion
R$ 2.50/tonnes (Art. 13 from 055-ANTAQ Res.)
Site Default Value R$ 33,829,947.00
Downpayment R$ 4,297,058.00Minimum cargo handling in
contract585,600 tonnes/yr

Investment Opportunities in Maritime Navigation Support
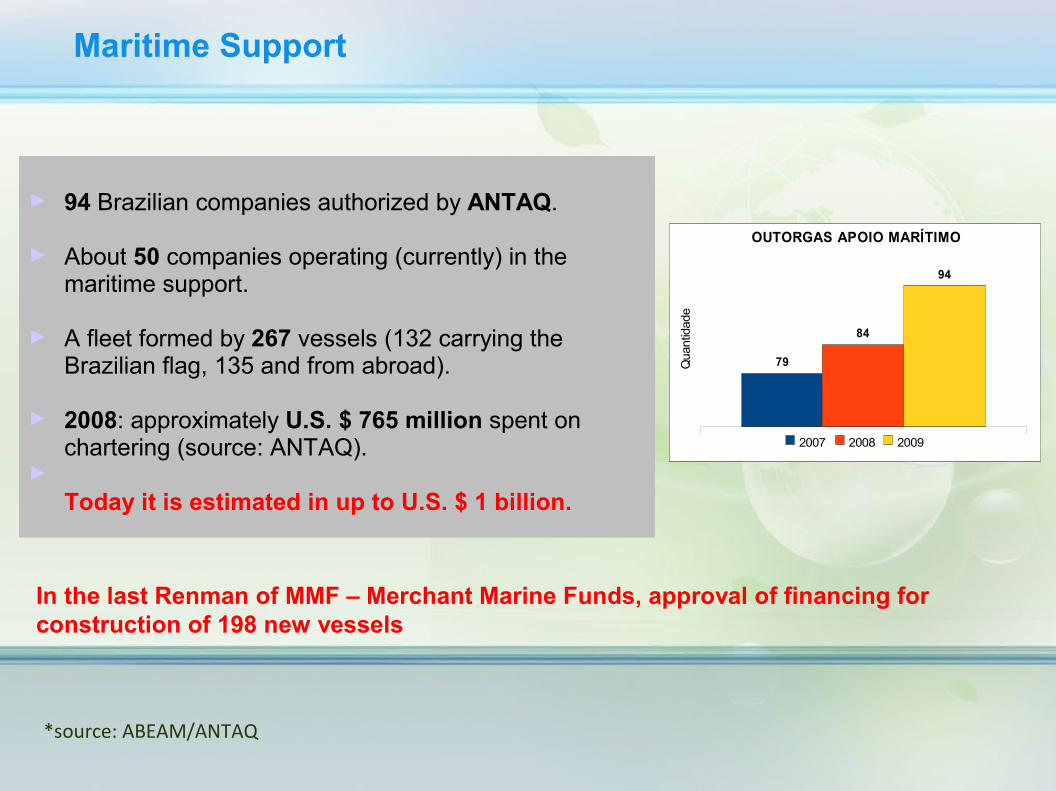
79
84
94
OUTORGAS APOIO MARÍTIMO
2007 2008 2009
Qua
ntid
ade
Maritime Support
► 94 Brazilian companies authorized by ANTAQ.
► About 50 companies operating (currently) in the maritime support.
► A fleet formed by 267 vessels (132 carrying the Brazilian flag, 135 and from abroad).
► 2008: approximately U.S. $ 765 million spent on chartering (source: ANTAQ).
►Today it is estimated in up to U.S. $ 1 billion.
*source: ABEAM/ANTAQ
In the last Renman of MMF – Merchant Marine Funds, approval of financing for construction of 198 new vessels
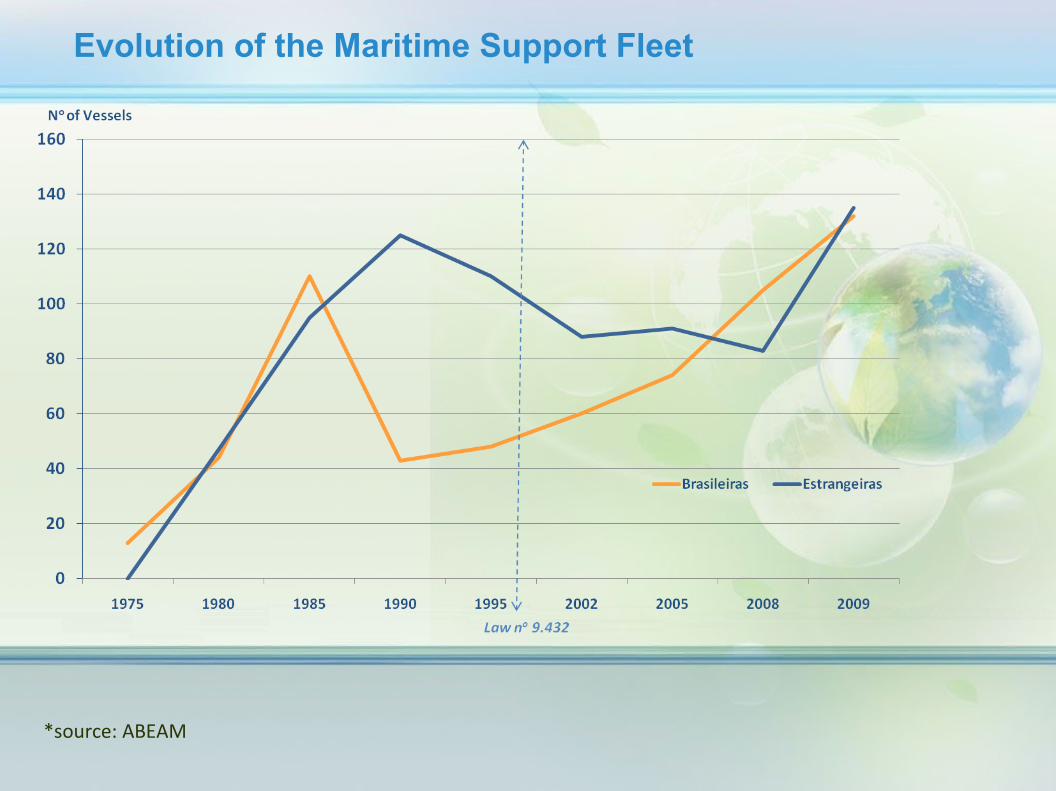
Evolution of the Maritime Support Fleet
*source: ABEAM
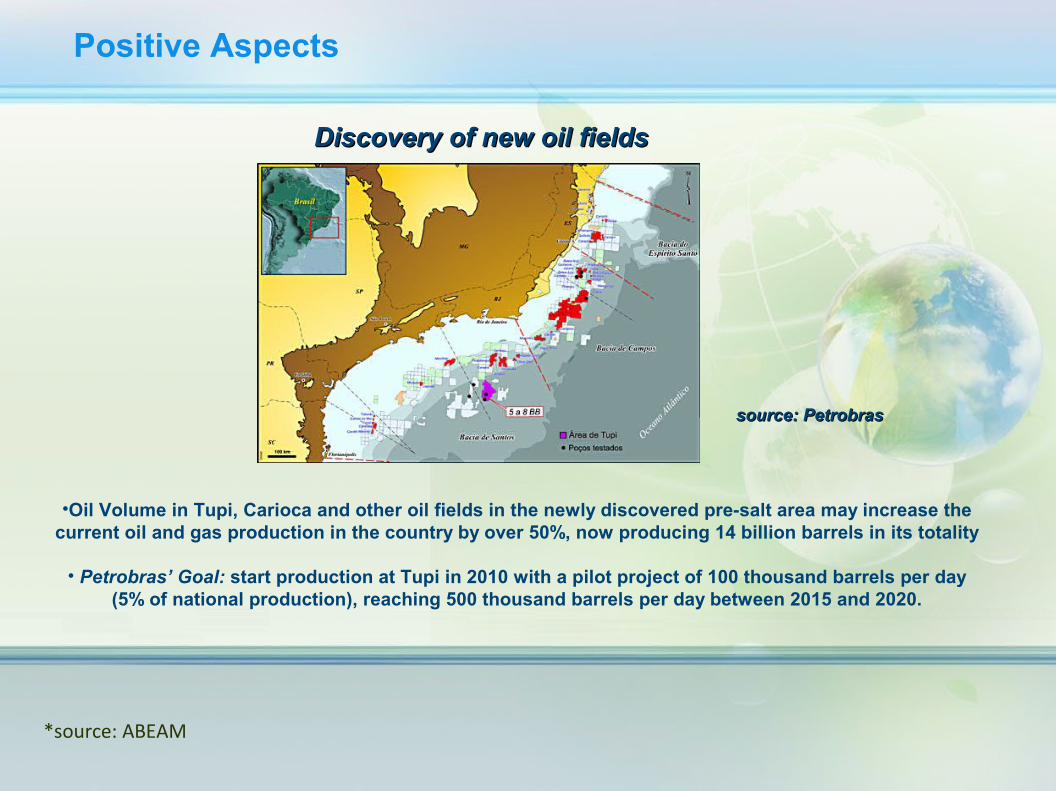
•Oil Volume in Tupi, Carioca and other oil fields in the newly discovered pre-salt area may increase the current oil and gas production in the country by over 50%, now producing 14 billion barrels in its totality
• Petrobras’ Goal: start production at Tupi in 2010 with a pilot project of 100 thousand barrels per day (5% of national production), reaching 500 thousand barrels per day between 2015 and 2020.
Discovery of new oil fieldsDiscovery of new oil fields
source: Petrobrassource: Petrobras
Positive Aspects
*source: ABEAM
• Brazilian market for shipping support activity continues booming, creating jobs both in shipbuilding and in offshore activities;
• The option to build ships in Brazil is the focus of public policy for the sector, increasing the participation of the Brazilian flag and thus the currency economy;
• Increased demand for offshore support vessels with the Pre-Salt discovery;
•On the world scene the oil high prices, encourages the exploration and production fields in the high seas.
Relevant Aspects

Cooperation Agreement Brazil - Netherlands
Cooperation Agreement Brazil – NetherlandsResults
1. Masterplan Rio Grande do Sul2. Federal Master Plan Seaports3. Federal Blue Print Inland Water Transport4. Holland Marine House Brasil5. Exchange of Knowledge6. Feasibility Study Training Center7. Trade Missions & Trade Fairs
International Seminar on Waterways Brazil – Netherlands
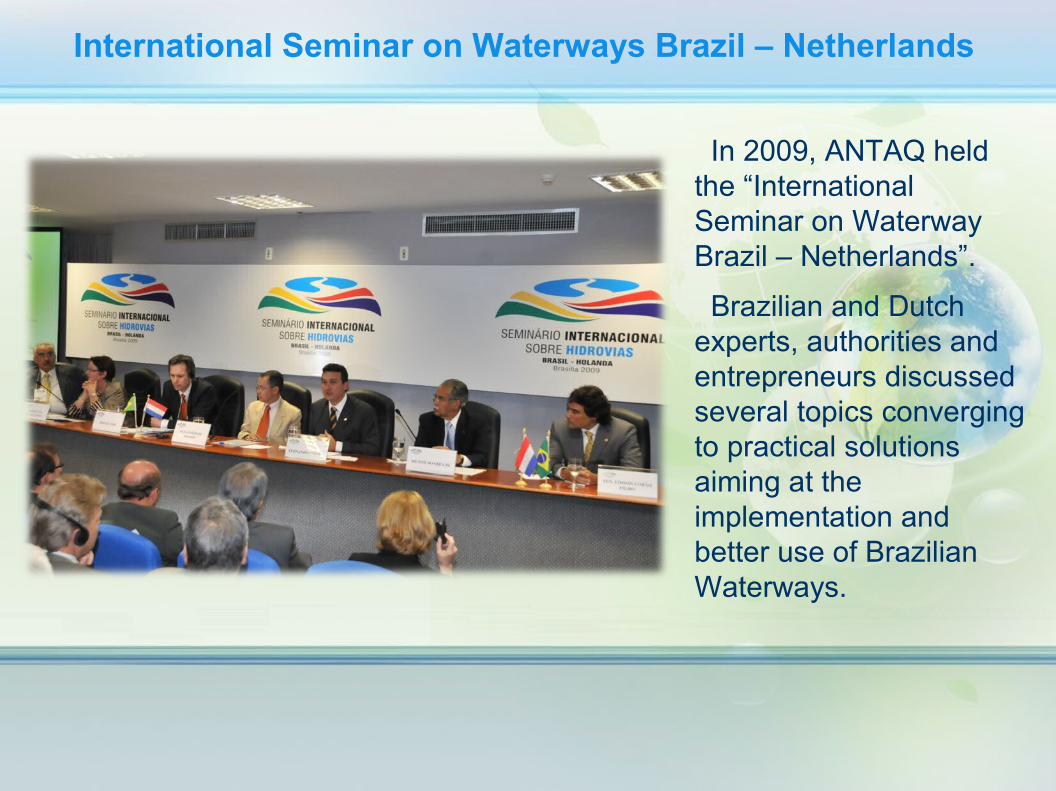
In 2009, ANTAQ held the “International Seminar on Waterway Brazil – Netherlands”.
Brazilian and Dutch experts, authorities and entrepreneurs discussed several topics converging to practical solutions aiming at the implementation and better use of Brazilian Waterways.
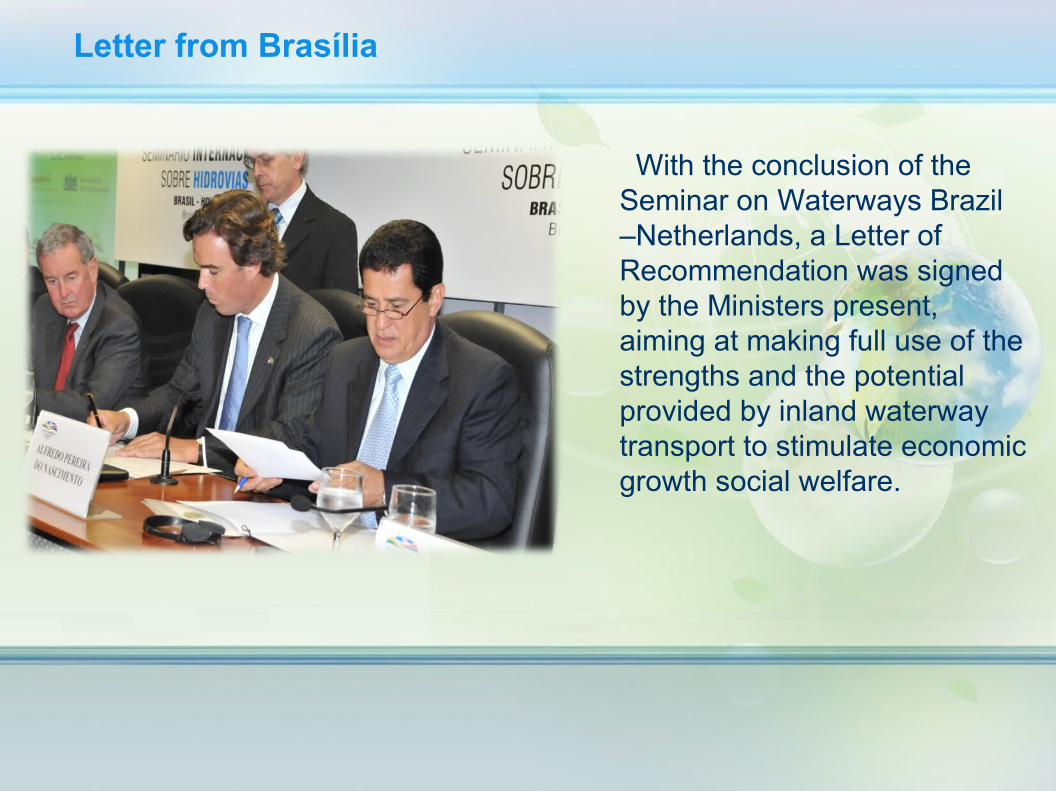
With the conclusion of the Seminar on Waterways Brazil –Netherlands, a Letter of Recommendation was signed by the Ministers present, aiming at making full use of the strengths and the potential provided by inland waterway transport to stimulate economic growth social welfare.
Letter from Brasília

A tribute from the Dutch Embassy
The Director-General of ANTAQ, Fernando Fialho, received a tribute from the Dutch Embassy in March, 2010.
Fialho was awarded a certificate for the relevant services provided to the cooperation between both countries in the waterway transportation area.
Actions for furthers Integration Between the countries
1. Port Sector:
- Support the activities of management in relation to the port activities- Definition of management tools for monitoring the effect of Environmental Management in Brazilian Ports
- Developing indicators of the Performance Evaluation Performance Brazilian Port, using the European experience
- Setting Parameters from the perspective of the European Common Market Competition, and may help in the competitive analysis of Brazilian ports
- Training of personnel in administration, planning and operation of ports, among others.
2. Sector Waterways :- Promote, together with the groups involved in inland navigation, the growth of the cooperation (together with the Public Administration and Private Sector), aiming the system’s improvement
- Holland Groups Formation: Experts and Managers, aiming the exchange of experiences and to be more familiarized with Brazilian Waterways
- Cooperation Agreement between countries for a qualification better of experts in the area, in order to face the logistics challengesin Brazil, amongst other
- Attraction operators for Dutch inland waterways in Brazil, among others.
Actions for furthers Integration Between the countries