WaterTech 2015 Joe Riddell and Christian Nägeli · grid surfaces individually grid math to create...
39
WaterTech 2015 Joe Riddell and Christian Nägeli April 20 th – 22 nd 2015
-
Upload
nguyenliem -
Category
Documents
-
view
213 -
download
0
Transcript of WaterTech 2015 Joe Riddell and Christian Nägeli · grid surfaces individually grid math to create...

WaterTech 2015
Joe Riddell and Christian Nägeli
April 20th – 22nd 2015
Agenda
1 Introduction
2CSM Overview and Workflow
3 Scale Independence
4Case Studies
5Conclusions

Introduction1

• Generation of a 3D CSM is the first thing we do on
all hydrogeology projects
• Even proposals benefit from leveraging available
data to refine scope and costs
• Field Program Planning & Execution

CSM Overview2

CSM – What is it?
Compilation of existing site information
• Collection of previously collected geological,
geotechnical, hydrogeological, and analytical
data for soil/groundwater
• Compiled and entered into a 3D Geomodel
• Geological structure and hydrogeologic regimes
are characterized
Tells the story of what we know
• Presents our current understanding of site
conditions, implications for contaminant
distribution
• Powerful for inferring geological features, data
gap analysis and field program planning

Data Compilation and Normalization

CSM – Why build a CSM?
Evaluate Multiple Hypotheses
• Data gaps can be systematically filled (a priori)
• Helpful in stakeholder communication with
client/regulators for approvals or scope changes
• Very useful for long-term sites and monitoring
Valuable reconnaissance for field staff
• Field staff start with a schematic of salient
geological features and understands the setting
• Drilling prognoses (if existing site data exists)
• Iterative, on-the-fly improvements to CSM can be
made during drilling program

CSM Development & Challenges
Data Normalization
• Difficult to normalize data (different sources/scale)
• Different data types
• Incomplete data sets (i.e., lacking well attributes)
Requires Experienced Analyst
• Requires earth scientist with understanding of
sedimentary processes, correlations &
hydrogeological processes
• Requires advanced supporting software tools

• Similar initial steps
• Development is
cumbersome and time
consuming
• No reinterpretation on the fly
• Many iterations of the
process
Traditional CSM Development
grid surfaces individually
grid math to create isopachs
cut cross sections and fence diagrams for pseudo 3D analysis
grid potentiometric surfaces and iso-concentration contours
create blanking files

CSM Development Workflow
Data Gathering
CSM Development
Field Program Numerical Model
Statement of problem and objectives
Data Formatting
Interpretation
Data Gap Analysis
• Work with capability
of 3-D software
• Use of other geo-
spatial platforms
• Tidy file management
• More efficient
iteration (on-the-fly)

Scale independence3
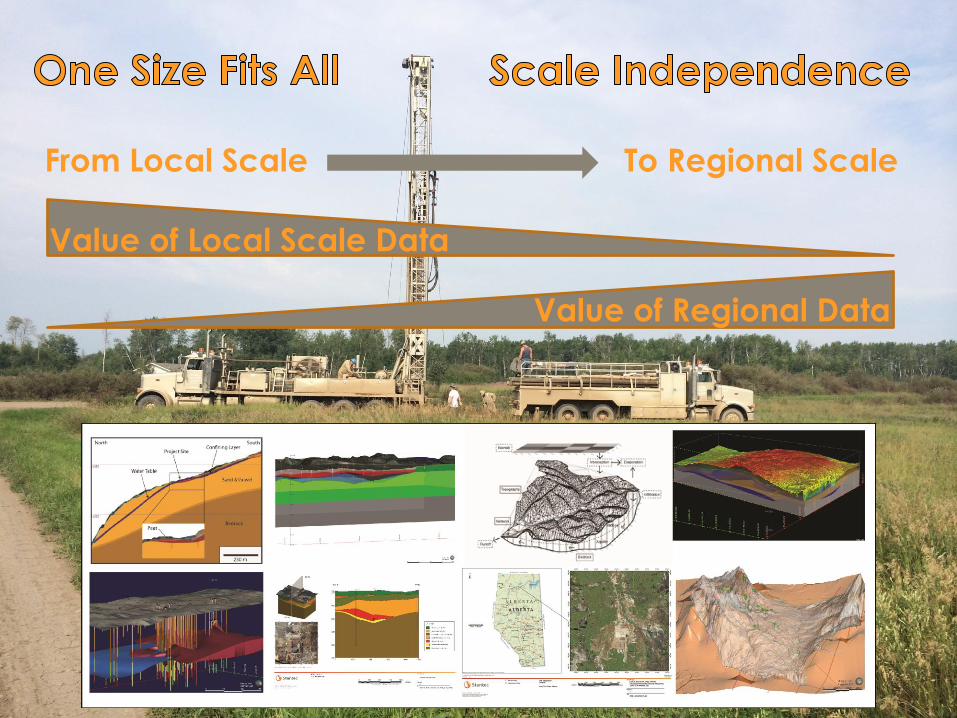
From Local Scale To Regional Scale
Value of Local Scale Data
Value of Regional Data

Case Studies4

4.1 Use of CSM for Hydrocarbon delineation
• Site with HC impacts
• Capitol Region
Bring in readily available information:
• Site topography
• Borehole coordinates and elevations (information gap requiring assumptions)
• Digital air photo of site
• AESRD & AGS information (raster, vector & even tabular mapping data)
• Data from historical reports (ESAR borehole logs)
• Analytical data for soil and groundwater
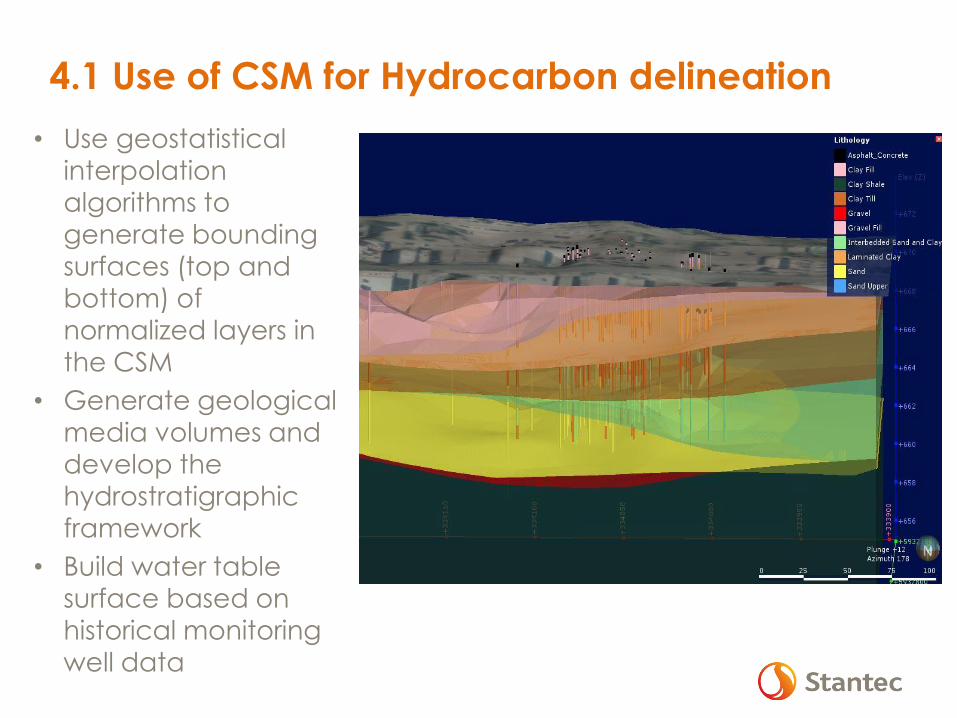
• Use geostatistical
interpolation
algorithms to
generate bounding
surfaces (top and
bottom) of
normalized layers in the CSM
• Generate geological
media volumes and
develop the hydrostratigraphic
framework
• Build water table
surface based on
historical monitoring
well data
4.1 Use of CSM for Hydrocarbon delineation

4.1 Data Gap Program
a) Based initially on soil
vapour screening to
produce a conservative
contaminated soil volume
b) View proposed
boreholes within context of
geology,
hydrostratigraphy, and
conservative
contaminated Soil volume
b) Refine contaminated
soil volume with analytical
borehole samples for remediation scoping
a)
b)

4.2 ¼ Section Hydrogeological Exploration
Desktop StudyProduction Well Installation/Optimization
• Concrete Plant / too expensive municipal
water supply
• Possible buried channel deposits
• Possible productive bedrock intervals (Horseshoe Canyon Fm).
• Preliminary model with public water well
data
• Identification of potential drilling targets,
static WLs, surrounding pump intake and
screened interval analysis
• Ongoing model updates during drilling
• Successful production well installation and stakeholder engagement

Promising channelized deposits
4.2 ¼ Section Hydrogeological Exploration
Project Site
Bedrock
Topography

4.2 ¼ Section Hydrogeological Exploration
• Most wells in the area installed in bedrock (2-5
igpm); target 50-75 igpm
• CSM identified gap (not recognized semi-
channelized pre-glacial deposits)
• Hydrogeologic exploration expanded to
overburden potential aquifer
Field drilling information improving CSM
• Bedrock borehole (BH) confirmed low yield
• Four additional BHs in pre-glacial sand and gravel
deposits delineated successful location for
Production Well
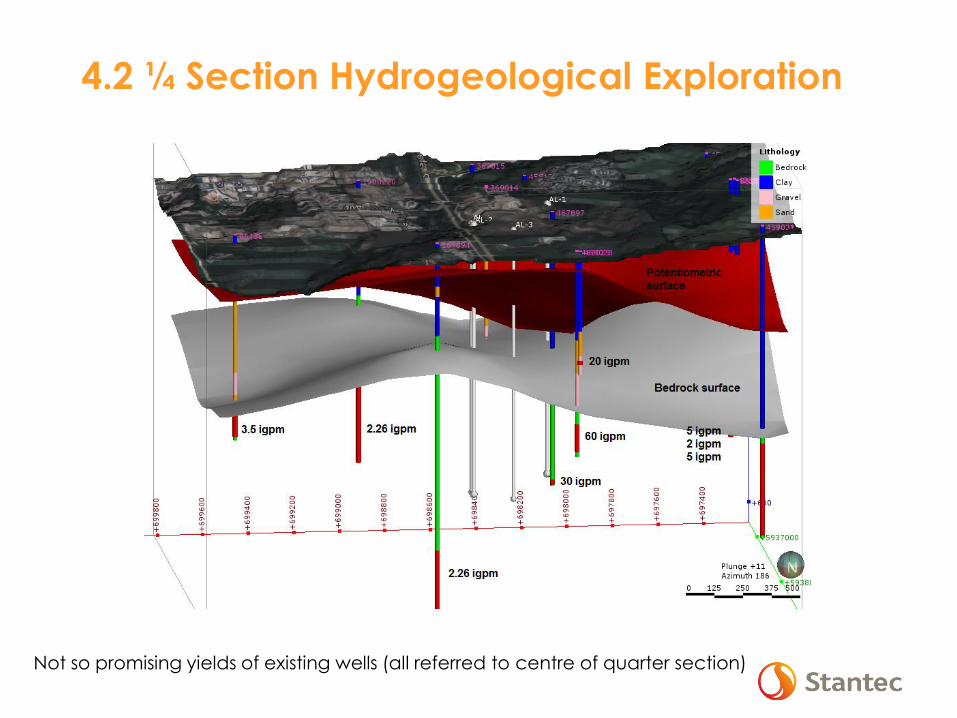
Not so promising yields of existing wells (all referred to centre of quarter section)
4.2 ¼ Section Hydrogeological Exploration

Pre-glacial gravel / sand potential aquifer “missed” by nearby wells
4.2 ¼ Section Hydrogeological Exploration
Pre-glacial sand
& gravel

Final result showing slightly channelized sheet-flood deposits of pre-glacial sand and gravel
4.2 ¼ Section Hydrogeological Exploration

• Isolated northern community relying on surface water
• Little to no existing site-scale data at project outset
• Used regional geology data to develop preliminary model
• Preliminary model used to identify potential aquifer targets
• 23 boreholes over 20 km2 area
• 6 Completed as Pumping wells installed within a well field
• Secured current and future water demand for Community

2 Public water well records (only 6 – 7 m BGS)
No depth to bedrock information
Limited subsurface data => Preliminary CSM
Test the Preliminary CSM
• Drilled to bedrock on nearly all test holes
• Establish bedrock topography (channel?)
• Collect down-hole geophysical data
• Drilled into bedrock on two deep test holes
• Evaluation of bedrock aquifer
Field activities guided by initial CSM, concurrent
field data collection, and 3D CSM updates
4.3 Community Scale Water Supply (20 km2)
Test Hole
Glaciofluvial
Channel
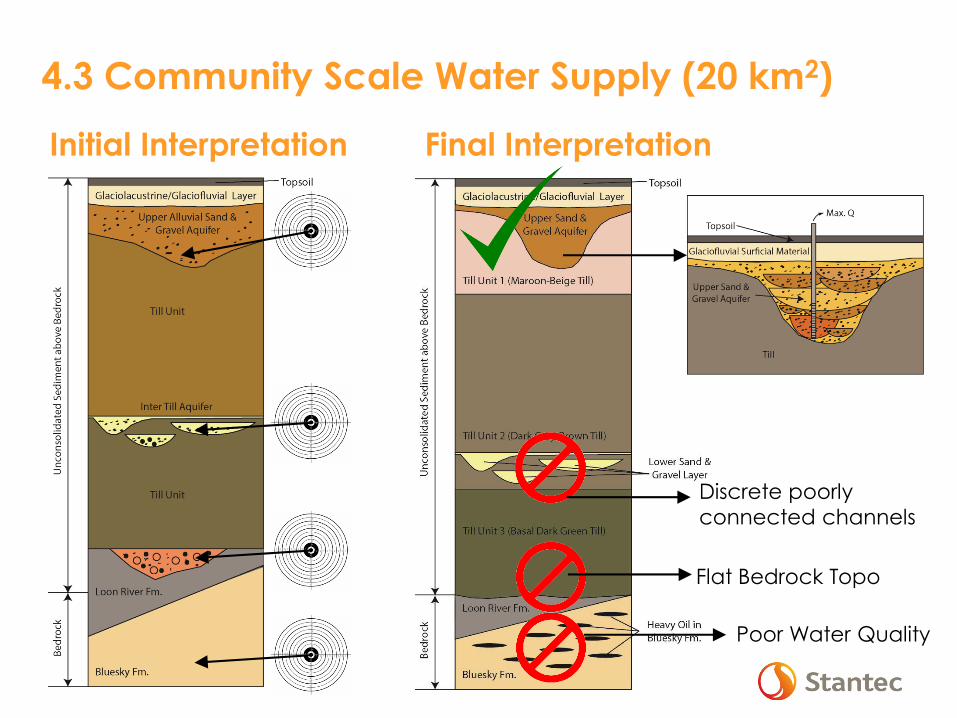
Initial Interpretation
4.3 Community Scale Water Supply (20 km2)
Final Interpretation
Discrete poorly
connected channels
Flat Bedrock Topo
Poor Water Quality

3D Geomodel used to define channel thalweg and optimize well placement within well field
4.3 Community Scale Water Supply (20 km2)

Conclusions
• Preliminary conceptual model was critical to
communicate with client and explain our approach
• CSM promoted effective decisions to continue the
drilling program and develop the appropriate aquifer
• CSM allowed effective interpretation of depositional
environment and aquifer geometries
• Aquifer response analysis benefited from CSM
• Geomodel serves as a platform for aquifer
management/monitoring and future exploration
activities
4.3 Community Scale Water Supply (20 km2)

Proposed projects include major site infrastructure,
dewatering/production/injection wells, tailings management
areas, open pit construction etc.
Assessment objectives were to:
1. Increase understanding
2. Evaluate risk
3. Mitigate risk
3D Conceptual Site Modeling was used to synthesize available
data to evaluate and mitigate potential project interactions to groundwater quantity and quality

4.4 Dissolution Mining Project
Data gathering,
review and synthesis.
186 - water well records
with e-logs to determine
lithologies
8 - regional
groundwater studies
9 - Shallow groundwater
wells in the TMA

4.4 Development in 3D Software Environment
• Add additional e-log interpretation to fill gaps and reinterpret
on-the-fly
• Make manual adjustments to surfaces based on depositional
interpretation and stratigraphic principles until satisfied with
model
• Add aquifer parameters, hydrochemical & potentiometric data

4.4 Numerical Model
• Export of 3D CSM directly to
FEFLOW or MODFLOW
• Detail groundwater flow and
simulate contaminant
transport scenarios
• Collaboration and
communication between project Hydrogeologist and
modeler
• Design meaningful
monitoring and mitigation
5 10 25
50 100 200
300 400 500
5 years 10 years 25 years
50 years 100 years 200 years
300 years 400 years 500 years

• Proposed development includes two open pit areas, waste
rock disposal area
• CSM forms framework for the baseline assessment of
groundwater flow patterns, quantity and quality
• Numerical model to evaluate interactions between the
project and groundwater resources
• CSM used to develop effective monitoring and mitigation
measures to limit potential impact

• Large domain required for
EA domain (limit BC effects)• Geo-referenced structural
/bedrock geology maps
• Literature
• Coal exploration picks (x’s)
• Stantec boreholes ( ) K-testing
• DEM (LiDAR & Mine progression
plan
Key Aquifer

4.5 Building Hydrostratigraphy
• Gridded surfaces outside of 3-D environment
• Build depositional surfaces with hydrostratigraphic column & True Vertical
Thickness offset calculations
• Grid math to add the vertically offset surfaces to Key Aquifer (Blue)
• Erosional deposits specified based on drift thickness and surface
mapping of till and alluvium/colluvium

Conclusions5

• Scale Independent
• Communication (Clarity & Rationale Scope of Work)
• Efficient Workflow
• Value Added Field Programs
A sound understanding of the geological framework
leads to improved project understanding & deliverables
• Physical Hydrogeological characterization
• Aquifer response characterization & GW Exploration
• Contaminant delineation


Questions?