Watershed Inventory Tool for Indiana - Purdue
49
Watershed Inventory Tool for Indiana A guide for watershed partnerships Do you know what activities or land uses in your watershed could be affecting your river or stream? A watershed inventory can help you determine: •= Major land uses in your watershed •= Management practices that are being followed for each activity •= Possible impacts on water quality This guide is designed for volunteers with little technical knowledge. All you need is a willingness to explore, time, persistence, and organization to keep track of what you discover. Developed by Alyson Faulkenburg and Jane Frankenberger, Department of Agricultural and Biological Engineering, Purdue University Purdue Extension …Knowledge to go Purdue Extension …Knowledge to go Purdue Extension …Knowledge to go Purdue Extension …Knowledge to go
Transcript of Watershed Inventory Tool for Indiana - Purdue

Watershed Inventory Tool for Indiana A guide for watershed partnerships
Do you know what activities or land uses in your watershed could be affecting your river or stream? A watershed inventory can help you determine: • = Major land uses in your watershed • = Management practices that are being followed for
each activity • = Possible impacts on water quality
This guide is designed for volunteers with little technical knowledge. All you need is a willingness to explore, time, persistence, and organization to keep track of what you discover.
Developed by Alyson Faulkenburg and Jane Frankenberger,
Department of Agricultural and Biological Engineering, Purdue University
Purdue Extension …Knowledge to goPurdue Extension …Knowledge to goPurdue Extension …Knowledge to goPurdue Extension …Knowledge to go

2
Table of ContentsTable of ContentsTable of ContentsTable of Contents Introduction _____________________________ 3
Sources of Information______________________ 3
Inventory Data Maps _______________________ 4
Acknowledgements _________________________ 6 Contributors and Reviewers ___________________ 6 Publications ________________________________ 6
Determining Your Watershed _______________ 7 Option 1: Use Hydrologic Unit Area Codes _____ 7
Option 2: Delineate the Watershed Using a Topographic Map __________________________ 7
Watershed Area ___________________________ 8
Assessment 1: Streams and Ditches__________ 10 Tier 1 ___________________________________ 10
Stream Locations___________________________ 10 Legal Drains ______________________________ 10 Impaired Streams___________________________ 10 Fish Consumption Advisory __________________ 11 Beach Closings ____________________________ 11 Other Monitoring Information_________________ 11
Tier 2 ___________________________________ 12 Stream Observations ________________________ 12
Assessment 2: Wetlands ___________________ 14 Tier 1 ___________________________________ 15
Wetland Locations__________________________ 15
Tier 2 ___________________________________ 16 Wetland Observations _______________________ 16
Assessment 3: Land Use Overview __________ 17 Actual Land Uses _________________________ 17
Zoned Land Uses__________________________ 18
Assessment 4: Residential and Urban ________ 20 Tier 1 ___________________________________ 20
Impervious Areas __________________________ 20
Tier 2 ___________________________________ 21 Subdivisions and Other Residential Areas _______ 21 Construction Sites __________________________ 22 Large Impervious Areas _____________________ 24 Golf Courses and Other Grass (Turf) Areas ______ 26
Assessment 5: Regulated Pollutant Sources ___ 29 Tier 1 ___________________________________ 29
NPDES __________________________________ 29 Superfund ________________________________ 30 Landfills _________________________________ 30 Combined Sewer Overflows __________________ 31
Tier 2 ____________________________________31 Unpermitted or Unknown Pipes ________________31
Assessment 6: Agriculture _________________ 32 Tier 1 ____________________________________32
Pesticides Applied in the Watershed_____________32 Fertilizers Applied in the Watershed_____________33 Livestock Numbers __________________________35 Amount of Manure and Nutrients _______________35 Watershed Projects or Other Conservation Programs 36 Tillage Practices ____________________________37 Information from Soil Surveys _________________38
Tier 2 ____________________________________40 Windshield Survey __________________________40 Cropland Management _______________________40 Pasture____________________________________42 Other Uses_________________________________43 Stream ____________________________________43
Assessment 7: Forest _____________________ 45 Tier 1 ____________________________________45
Tier 2 ____________________________________45
Assessment 8: Mining ____________________ 47 Tier 1 ____________________________________47
Active Mines_______________________________47 Abandoned and Unreclaimed Mines _____________47 Reclaimed Mines____________________________47
Tier 2 ____________________________________48 Observations _______________________________48
What’s Next? ___________________________ 49

3
IntroductionIntroductionIntroductionIntroduction
This assessment tool is designed for watershed groups who are beginning to develop watershed management plans. Steps that are often recommended in developing a plan include (1) build a project team, (2) inventory the watershed, (3) define the problem based on the inventory, (4) set goals and implement solutions, and (5) measure successes and make adjustments. This tool was developed to help with step (2), inventorying the watershed. During this survey you will observe and evaluate how the various land uses can affect your watershed. You will be asked to contact various state, county, and city government agencies to learn how they are involved in the current and future planning of your watershed. You will also be asked to go out and drive around the watershed to gain firsthand knowledge of the watershed. The main purpose of this tool is to educate you about activities in the watershed that could be affecting the overall water quality of your streams and lakes. All you will need is a willingness and desire to explore and record your observations. There are two levels or tiers to most sections of the assessment tool. No formal training is required. Your use of the tiers will depend on how much information you need. The first tier will represent questions that can be answered by using published sources, the World Wide
Web, or by asking local governments. The second tier will require more effort to obtain the needed answers to the questions and usually involves traveling around the watershed making direct observations. You can complete the assessments one at a time or all at once. It will take approximately 3-4 days to complete the entire tool. Since many useful sources of environmental data are available on the Web, many assessments suggest that you use it to answer the questions. If you do not have Internet access, check with your local library for access. Geographic Information Systems (GIS) can be used to make many of the analyses easier. However, instructions are also provided for doing the assessments without the use of GIS. To help your watershed group, take pictures of the various sites you observe. Also remember to mark which pictures will go with which sites. Aerial photographs are another excellent source of information for your site. You can often obtain aerial photos from local government offices or the Natural Resources Conservation Service. Digital photos are available for use in GIS for most of Indiana. Some can be viewed on the Web at http://www.terraserver.com.
Sources of Information Table 1 includes some of the sources of information that you will need throughout the assessment tool. Some sections may list more sources that may help you to answer the questions about the watersheTable 1: Sources of Information Title of Publication or Government Agency
How to Obtain/Contact Information Available
Indiana Agricultural Statistics publication
Call 1-800-363-0469 or view at your Purdue Extension county office or on the Web at http://www.aes.purdue.edu/agstat/nass.html
Crop acres, forest acres, animal numbers, county area, pesticide and fertilizer usage
Indiana State Department of Health (ISDH)
http://www.state.in.us/isdh/dataandstats/fish/fish_99/fish_cvr.htm Fish consumption advisory
Purdue Extension Service Look under your local government offices in the phone book or http://www.admin.ces.purdue.edu/field/fs/countyoffices.html
Pesticide and fertilizer usage
Natural Resources Conservation Service (NRCS)
Find your county’s office under “U.S. Dept. of Agriculture” in the phone book or http://offices.usda.gov
Conservation programs, technical assistance, soil information, aerial photos
Soil and Water Conservation Districts (SWCD)
Find your county’s office under the local government offices in the phone book or go to http://www.ai.org/dnr/soilcons/swcd.htm
Conservation programs, soil maps and information, and aerial photographs
4
Indiana Fertilizer Tonnage Report Office of the Indiana State Chemist (765) 494-1192 Fertilizer sales information Indiana Department of Environmental Management (IDEM)
Call 317-232-8476 or go to http://www.state.in.us/idem/owm NPDES permits and 303(d) lists
U.S. Geological Survey http://in.water.usgs.gov HUA’s (watershed boundaries), National Water Quality (NAWQA)
Purdue Extension “Safe Water for the Future” Web site
http://www.ecn.purdue.edu/safewater Landfills and general watershed information
Planning departments Look under your local government offices in the phone book Zoning maps, subdivision
info. and aerial photographs U.S. EPA “Envirofacts” Database http://www.epa.gov/enviro
Superfund and water discharge (NPDES) permits,
U.S. Fish and Wildlife Service http://www.nwi.fws.gov Wetlands Indiana Department of Natural Resources (IDNR)
http://www.state.in.us/dnr/ Div. of Reclamation: Active and abandoned mines Div. of Recreation: Outstanding Resource Waters Div. of Soil Conservation: LARE information Div. of Natural Preserves: Critical Biological Resources
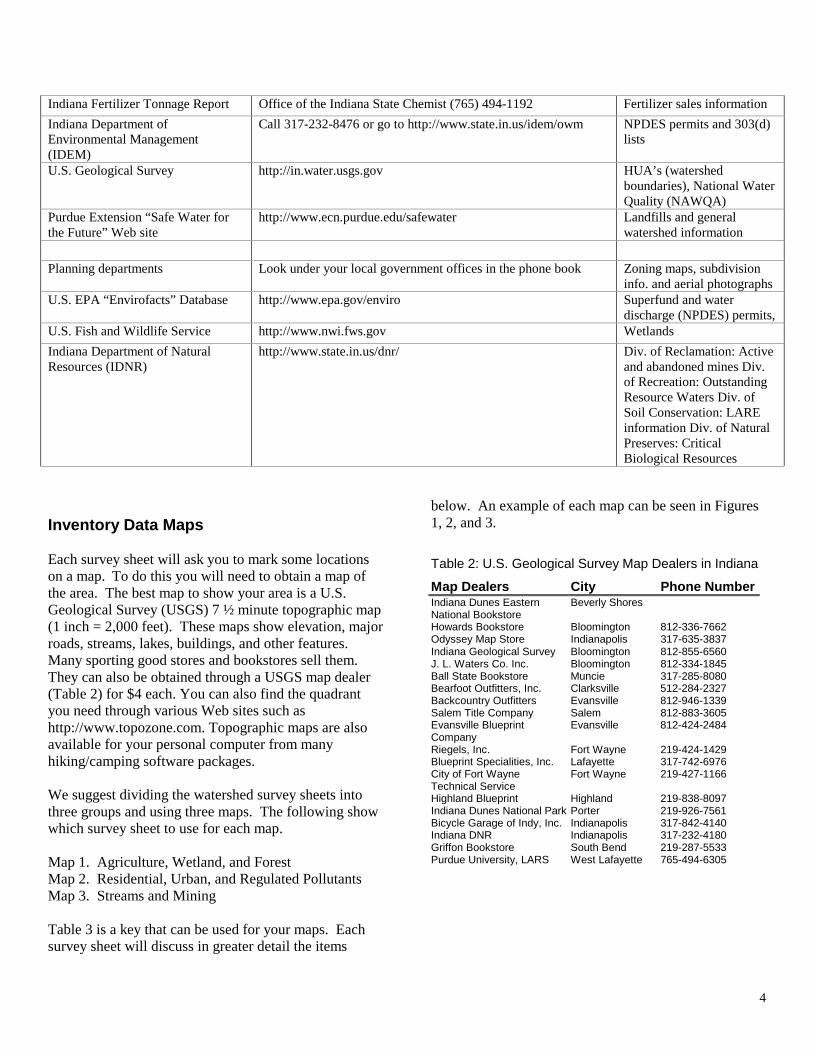
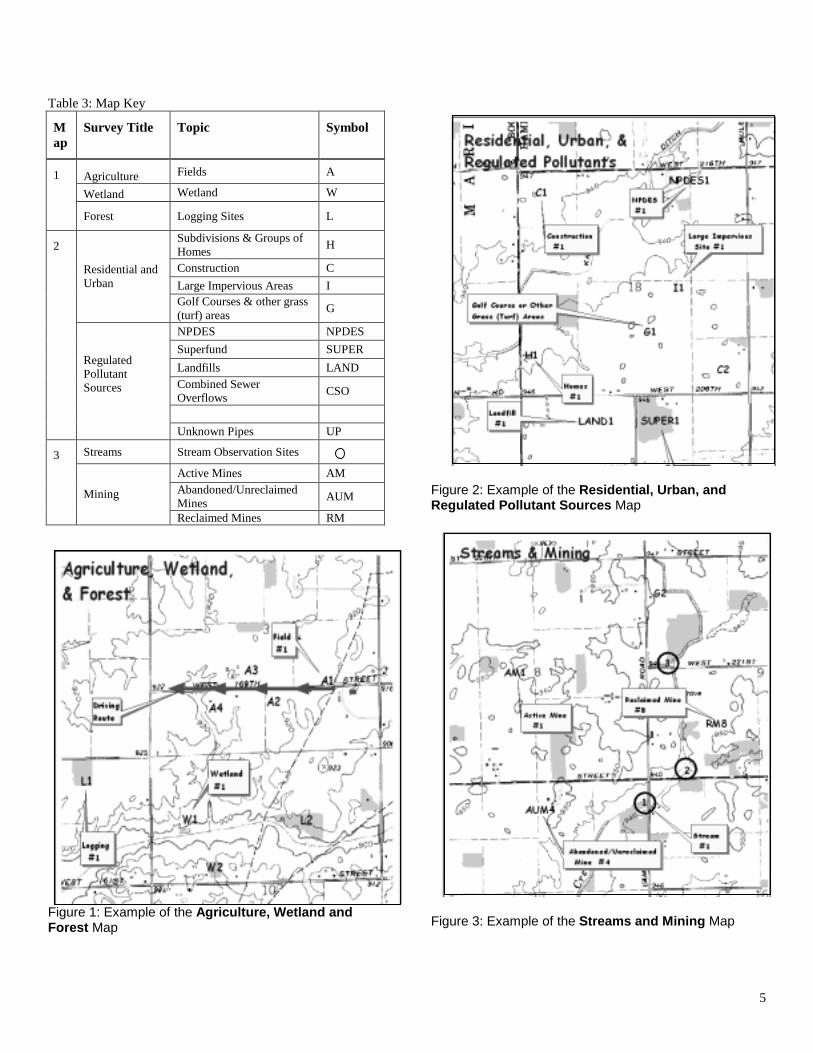
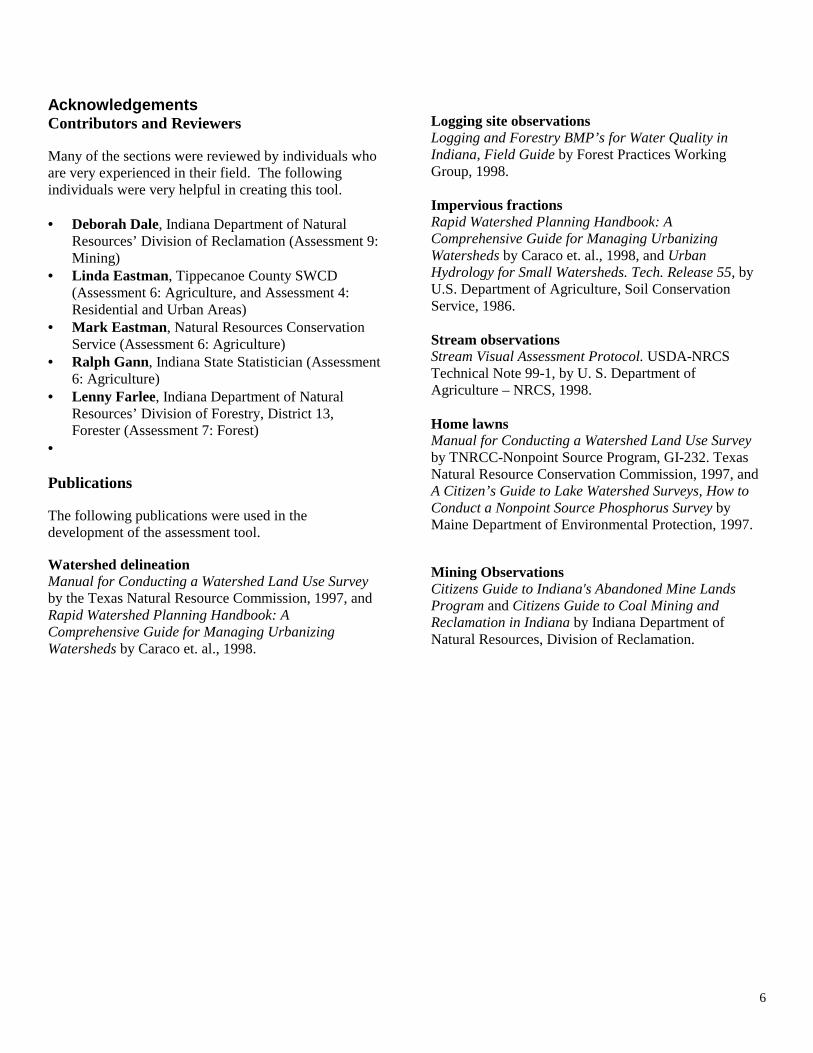
Inventory Data Maps Each survey sheet will ask you to mark some locations on a map. To do this you will need to obtain a map of the area. The best map to show your area is a U.S. Geological Survey (USGS) 7 ½ minute topographic map (1 inch = 2,000 feet). These maps show elevation, major roads, streams, lakes, buildings, and other features. Many sporting good stores and bookstores sell them. They can also be obtained through a USGS map dealer (Table 2) for $4 each. You can also find the quadrant you need through various Web sites such as http://www.topozone.com. Topographic maps are also available for your personal computer from many hiking/camping software packages. We suggest dividing the watershed survey sheets into three groups and using three maps. The following show which survey sheet to use for each map. Map 1. Agriculture, Wetland, and Forest Map 2. Residential, Urban, and Regulated Pollutants Map 3. Streams and Mining Table 3 is a key that can be used for your maps. Each survey sheet will discuss in greater detail the items
below. An example of each map can be seen in Figures 1, 2, and 3. Table 2: U.S. Geological Survey Map Dealers in Indiana
Map Dealers City Phone NumberIndiana Dunes Eastern National Bookstore
Beverly Shores
Howards Bookstore Bloomington 812-336-7662 Odyssey Map Store Indianapolis 317-635-3837 Indiana Geological Survey Bloomington 812-855-6560 J. L. Waters Co. Inc. Bloomington 812-334-1845 Ball State Bookstore Muncie 317-285-8080 Bearfoot Outfitters, Inc. Clarksville 512-284-2327 Backcountry Outfitters Evansville 812-946-1339 Salem Title Company Salem 812-883-3605 Evansville Blueprint Company
Evansville 812-424-2484
Riegels, Inc. Fort Wayne 219-424-1429 Blueprint Specialities, Inc. Lafayette 317-742-6976 City of Fort Wayne Technical Service
Fort Wayne 219-427-1166
Highland Blueprint Highland 219-838-8097 Indiana Dunes National Park Porter 219-926-7561 Bicycle Garage of Indy, Inc. Indianapolis 317-842-4140 Indiana DNR Indianapolis 317-232-4180 Griffon Bookstore South Bend 219-287-5533 Purdue University, LARS West Lafayette 765-494-6305
5
Table 3: Map Key
Map
Survey Title Topic Symbol
Agriculture Fields A
Wetland Wetland W 1
Forest Logging Sites L
Subdivisions & Groups of Homes H
Construction C Large Impervious Areas I
Residential and Urban
Golf Courses & other grass (turf) areas G
NPDES NPDES Superfund SUPER Landfills LAND Combined Sewer Overflows CSO
2
Regulated Pollutant Sources
Unknown Pipes UP
Streams Stream Observation Sites
Active Mines AM Abandoned/Unreclaimed Mines AUM
3
Mining
Reclaimed Mines RM
Figure 1: Example of the Agriculture, Wetland and Forest Map
Figure 2: Example of the Residential, Urban, and Regulated Pollutant Sources Map
Figure 3: Example of the Streams and Mining Map
6
Acknowledgements Contributors and Reviewers Many of the sections were reviewed by individuals who are very experienced in their field. The following individuals were very helpful in creating this tool. • = Deborah Dale, Indiana Department of Natural
Resources’ Division of Reclamation (Assessment 9: Mining)
• = Linda Eastman, Tippecanoe County SWCD (Assessment 6: Agriculture, and Assessment 4: Residential and Urban Areas)
• = Mark Eastman, Natural Resources Conservation Service (Assessment 6: Agriculture)
• = Ralph Gann, Indiana State Statistician (Assessment 6: Agriculture)
• = Lenny Farlee, Indiana Department of Natural Resources’ Division of Forestry, District 13, Forester (Assessment 7: Forest)
• = Publications The following publications were used in the development of the assessment tool. Watershed delineation Manual for Conducting a Watershed Land Use Survey by the Texas Natural Resource Commission, 1997, and Rapid Watershed Planning Handbook: A Comprehensive Guide for Managing Urbanizing Watersheds by Caraco et. al., 1998.
Logging site observations Logging and Forestry BMP’s for Water Quality in Indiana, Field Guide by Forest Practices Working Group, 1998.
Impervious fractions Rapid Watershed Planning Handbook: A Comprehensive Guide for Managing Urbanizing Watersheds by Caraco et. al., 1998, and Urban Hydrology for Small Watersheds. Tech. Release 55, by U.S. Department of Agriculture, Soil Conservation Service, 1986.
Stream observations Stream Visual Assessment Protocol. USDA-NRCS Technical Note 99-1, by U. S. Department of Agriculture – NRCS, 1998.
Home lawns Manual for Conducting a Watershed Land Use Survey by TNRCC-Nonpoint Source Program, GI-232. Texas Natural Resource Conservation Commission, 1997, and A Citizen’s Guide to Lake Watershed Surveys, How to Conduct a Nonpoint Source Phosphorus Survey by Maine Department of Environmental Protection, 1997. Mining Observations Citizens Guide to Indiana's Abandoned Mine Lands Program and Citizens Guide to Coal Mining and Reclamation in Indiana by Indiana Department of Natural Resources, Division of Reclamation.

7
Determining Your WatershedDetermining Your WatershedDetermining Your WatershedDetermining Your Watershed A watershed is an area of land where all the water drains to a common outlet. Before you can learn what is happening in a watershed, you will need to know where the boundaries are. If you already know your watershed boundaries, you can skip this section and go directly to the survey sheets. If not, this section will help you determine the location and size of your watershed.
There are two options for determining your watershed boundaries. You can use the watershed boundaries that have been developed by the U.S. Geological Survey (USGS) or you can determine them yourself using a topographic map
Option 1: Use Hydrologic Unit Area Codes
Hydrologic unit codes are “addresses” for all watersheds in Indiana. The three codes that you may hear quite often are 8, 11, or 14-digit. The smaller the code, the larger the watershed. For example, the 8-digit code 05120201 is for the Upper White River (2720 mi2), while the 11-digit code 05120201120 is for Eagle Creek (164 mi2) which is in the Upper White River basin. The Mounts Run basin (19 mi2) which is inside the Eagle Creek basin has a 14-digit address of 05120201120040.
Figure 4: Example of an 8, 11, and 14-Digit Watershed
Because watershed protection efforts are usually most effective on smaller watersheds, we recommend that you use a 14-digit watershed due to its smaller size. Your local NRCS office may be able to supply you with a map of the 14 or 11-digit watershed. Draw the boundaries of
the watershed onto a USGS topographic map (see “Inventory data maps”) and make several copies of the map to use with the inventory sheets. If you have GIS, the 8-, 11-, and 14-digit hydrologic unit areas are available as a GIS layer. Option 2: Delineate the Watershed Using a Topographic Map The second option is to delineate the watershed boundaries yourself. Once you’ve obtained the topographic maps for your area, the following steps will help you delineate the watershed.
1. Locate and mark the downstream outlet of your
watershed (marked with an X in Figure 5). The farther downstream from the headwaters of the river your outlet is, the larger your watershed will be. The smaller your watershed is, the easier it will be to obtain the information for the inventory.
Figure 5: Outlet Location and Flow Arrows

8
2. Locate all water features that flow to the outlet. Trace the water from its source to the outlet. Use arrows to mark the directions of the streams (Figure 5). To determine which direction a stream is flowing, compare the elevations of the land around the stream to the stream. [The brown lines on the topographic map are contour lines. These lines connect all points of equal elevation. The thick dark lines will have a number associated with them showing the elevation. The thin lines change in 10 ft increments and the dark lines change in 50 ft increments.]
3. Find and mark the highpoints on the map
surrounding the streams you’ve marked (Figure 6). The high points will often appear on the map as circles.
Figure 6: High Points and Flow Direction
4. Connect the highpoints and your outlet to form the
boundaries (Figure 7). You should not cross any water features except at the outlet. Follow ridges and cross slopes at right angles to the contour lines.
Figure 7: Delineated Watershed 5. Once the boundaries are drawn, imagine a drop of
rain falling on the surface. Make sure it flows from the boundary to the outlet.
Once you’ve determined the boundaries of the watershed, make several copies of the map. You will use these maps to determine the area, mark important features, and have as back up copies. Five or six copies should suffice. Watershed Area The watershed area is needed throughout the assessment. If you have the watershed boundaries in GIS, determining the area is simple. You can estimate the areas using your topographic map; one method to find the area is to count squares using a grid. Use graph paper or draw a grid of equally spaced lines in both directions (for example, each grid line could be ¼ inch apart). Photocopy this onto a transparency. Then overlay the transparency on the watershed map and count the number of squares that are in the watershed within each county. Using the scale of the map you can get the area of the watershed. For example, if the scale is 1 inch = 2,000 ft, you can

9
convert the number of squares into feet by taking the side length, 1/4 inch, times 2,000 ft which equals 500 ft. Each square represents 250,000 sq. ft. To convert the area to acres use the conversion 1 acre = 43,560 ft2. This area will only be an estimate due to the irregularities of the watershed boundary. You can also use a tool called a “planimeter” to trace the boundary of the watershed. If you do not have a planimeter, check with your local NRCS or SWCD office. What is the area of your watershed? ______________ Since watersheds can vary in size from a few acres to several hundred thousand acres, your watershed may lie in one or more counties. Many of the topics in this tool can only be assessed at the county level. To determine values for your watershed you will be asked to estimate the value from county numbers. Therefore, you will need to know the area of the watershed in each county. Record the areas in Table 4 below.
Table 4: Watershed Area
County Watershed area in county (acres)
The following table will ask you to divide the watershed area in each county by the county’s area. This will give you the fraction of the county that is in the watershed. In this and all following tables, the first line in italics is an example. The rows in grey only need to be filled out if your watershed lies in more than one county.
Table 5: Fraction of Each County in the Watershed
County name
Area of the watershed in the county
ΥΥΥΥ
County area
=
Fraction of the county in the watershed
Tippecanoe 9,852 321,704 0.031
(C1)
(C2)
ΥΥΥΥ
=
(C3)

10
Assessment 1: Streams and DitchesAssessment 1: Streams and DitchesAssessment 1: Streams and DitchesAssessment 1: Streams and Ditches
The first step in understanding your watershed is to understand the streams and/or ditches that drain it. Streams are the central focus of any watershed. By observing the landscape around the streams, you can learn what could potentially affect their ecosystems. By observing the stream itself, you can learn its current condition.
In Tier 1, you will locate the streams and ditches in the watershed and use published sources to identify known problems in these streams. In Tier 2, you will observe the streams to see how the adjacent land uses may be affecting the stream.
Tier 1 Stream Locations Using the copy of your watershed map labeled “Streams, Golf Courses, Mining, and Forest” locate the streams in the watershed. Write the name of each stream in the following table.
Table 6: Streams in Your Watershed
Stream/river name Upstream rivers
Downstream rivers
White Creek None Red River
Legal Drains
In Indiana, many of our streams are considered legal drains. Legal drains were established to drain agricultural land to allow for more productive farming. These drains are cleaned periodically to make sure the flow of water is unobstructed. By visiting your county surveyor’s office you can determine which streams in your watershed are also legal drains and their maintenance schedules. The surveyors are very familiar with these and are a good source of information. Table 7: Legal Drains in Your Watershed
Name of legal drain
Maintenance schedule or other information
White Creek Cleaned every 10 years or as needed.
Impaired Streams Section 303(d) of the Clean Water Act requires Indiana to identify waters that do not meet water quality standards. The 303(d) list identifies streams that do not meet the standards, where they are located, contaminants of concern, and how severe their impairment. This information is determined by Indiana Department of Environmental Management (IDEM) and can be accessed at their Website (http://www.ai.org/idem/owm/planbr/wqs/303dlst.htm). Streams that are not on the list may also be impaired but were not monitored by IDEM.
Using this Website, complete the table below. Determine if any of your streams are on the list, what contaminants are of concern, and the severity ranking.
11
Table 8: Impaired Streams (on the 303(d) List)
Stream Contaminants of concern
Severity ranking
White Creek PCB, E. Coli Medium
Fish Consumption Advisory Each year the Indiana State Department of Health (ISDH), in cooperation with IDNR and IDEM develops a Fish Consumption Advisory list for the state. The advisory is based on levels of polychlorinated biphenyls (PCBs) and mercury found in fish tissue. This list can be accessed at ISDH Website (http://www.state.in.us/isdh/dataandstats/fish/fish_99 /fish_cvr.htm). Determine if any fish consumption advisories are in effect for the streams you identified in Table 6. Also determine for which fish and which size the advisory is in effect. Some streams have several fish on the list, so the table has extra room to write down more than one fish per stream. Table 9: Fish Consumption Advisory
Stream Species Size (inches)
Group
White Creek Carp 15-20 20-25 25 +
3 4 5
Beach Closings Beaches are sometimes closed due to high levels of E. Coli. E. Coli are usually harmless; however, they can be indicators of other pathogens.
If any beaches are located in your watershed, determine if they have been closed during the most recent operating season. Your county health department should be able to help you determine this.
Table 10: Beach Closings
Beach name or location
Water source Number of times closed
Northside Beach Sunny Lake 2
Other Monitoring Information In addition to IDEM, many communities, schools, or governments have done stream quality monitoring. Your local SWCD should be able to help you determine if any other water quality information exists for the streams in your watershed.
12
Table 11: Other Monitoring Information
Stream Sources & date What was monitored
White Creek USGS, Summer 1996
Flow, E. Coli
Tier 2 These questions must be answered b using information obtained in the field. Observing the streams in your watershed at different locations, will show the different types of land uses along them. Stream Observations Choose sites on the streams that have easy access without trespassing on someone’s property. Good locations are usually bridges where you can gain access to the stream from the road. Mark the location of the site on the copy of your map labeled “Streams and Mining.” For each site, write the number that corresponds to Table 12 and then circle the number. For example site number 2 would be marked 2” Describe each site using Table 12. If you cannot measure the dimensions of the stream, try to estimate them. Next, fill in Table 13 using the following descriptions. Table 14 may be used to record any additional observations that you make. Look for erosion or scouring around bridges, culverts, or any other engineering structure you see. Erosion could indicate increased streamflow due to human influences in the watershed. Structures that need to be replaced because of erosion or scour represent a potential economic impact on the community. All three tables are on one page for easy use in the field. Photocopy the page several times before going to the field.
Table 13 contains characteristics of the streambank, riparian area, and in-stream habitat that you should be able to observe. A streambank is defined as the area of the bank from the waters edge to bank full stage. Bank full stage is the point of highest flow before the water spills into the floodplain. The riparian area is the land alongside the stream. The following list describes the topics covered in the table. • = Modified: Modification can consist of vegetation being
removed, very straight channels, rip rap on the banks, or concrete banks (urban areas).
• = Pipe: If you see a pipe at the site, indicate yes. Pipes can
be tile drains from agricultural fields, industrial discharge, or stormwater runoff.
• = Erosion: Streambanks can sometimes erode into a
stream. Indicate if the streambanks look stable or not. • = Vegetated: Streambank vegetation should be a dense
combination of trees, shrubs, or grasses (not field crops). Observe the vegetation and indicate whether or not good dense vegetation is present.
• = Trash: Indicate if you see a lot of trash at the site. Trash
often accumulates in or near the stream.
• = Riparian: A good vegetated riparian area is one that consists of trees and/or grasses. Lawns, crops, and bare soil are not well suited for riparian areas.
• = Riparian buffer width: The more the riparian area is
vegetated, the better for the stream habitat. Trees or grasses in the riparian area form a “riparian buffer.” If there is such an area, indicate its width.
• = Fish habitat: Good fish habitat includes areas where
trees have fallen into the water, and the presence of deep pools, root wads, dense plant beds and overhanging vegetation. Indicate if you see any of these areas.
• = Insect habitat: Insects (macroinvertebrates) prefer areas
of fine woody debris, submerged logs, leaf packs, undercut banks, cobbles, boulders, and coarse gravel. Indicate if you see any of these areas.

13
Stream Observations (Photocopy as needed.)
Table 12: Site Locations Site Stream name Location description Date and weather Depth (ft) Width (ft)
1 White Creek At crossing on S.R. 45 E 3/24/00, rainy 2 5
Table 13: Stream Characteristics
Modified Pipes Erosion Vegetated Trash Riparian Riparian buffer width
Fish habitat Insect habitat Site
Yes
No
Yes
No
Yes
No
Yes
No
Yes
No
Tree
s
Gra
ss
Cro
ps
Bare
0 ft
1-30
ft
30-1
00 ft
> 10
0 ft
Yes
No
Yes
No
1
Table 14: Stream Comments
Site Comments
1 Dredging upstream of observation site.

14
Once you have completed Tables 12-14 answer the following questions. These questions will help you to compile the results that you have obtained. How many of the observation sites had stream modification? _____________________________ At how many of the sites did you see pipes present? ____________________________________ How many sites showed signs of erosion? ______________________________________________ How many sites had no vegetation on the streambank? __________________________ How many of the sites had a riparian area with trees? _________________________________ How many had grass? _____________________________________________ How many had crops? ____________________________________________ How many were bare? _____________________________________________ How many sites had a riparian width of 0 ft? _________________________________________ How many had 1-30 ft? ____________________________________________ How many had 30-100 ft? ___________________________________________ How many had 100 ft or wider? _______________________________________
15
Assessment 2: WetlandsAssessment 2: WetlandsAssessment 2: WetlandsAssessment 2: Wetlands “Wetlands” is a collective term for marshes, swamps, and bogs. They are areas of land that lie in flat vegetated areas and sometimes are hard to identify because some are wet all the time, while some are dry much of the year. In Indiana, the most common types are forested wetlands and small temporarily flooded wetlands in farm fields. Wetlands are valuable because they help to regulate water levels, can reduce flooding, provide wildlife habitat, and can improve water quality.
This assessment helps you identify wetlands in your watershed and determine whether human activities may be impacting them. Tier 1 asks you to determine the location of wetlands in your watershed, while Tier 2 asks you to observe the wetlands to see if anything is impacting them. Tier 1 Wetland Locations The U.S. Fish and Wildlife Service developed the National Wetlands Inventory (NWI) in the 1980s to provide information on characteristics, size, and status of the nation’s wetlands. Information on wetlands in your watershed can be obtained on the Web by using an interactive mapping tool. You can access this site at http://www.nwi.fws.gov. Choose the “Wetlands Interactive Mapper” to determine the wetlands in your watershed and their size. This data can also be downloaded and used with GIS. Additional sources of information about wetlands are the Farm Service Agency and the Natural Resources Conservation Service. The Farm Service Agency may have available, for public use, aerial photographs with USDA “certified” wetlands outlined. The NRCS may have copies of the US Fish and Wildlife Service National Wetlands Inventory maps. Wetlands are also shown on the topographic map that you are using to mark locations and the Soil Survey map used in the agricultural assessment. Your local NRCS office may also know of other wetlands in the watershed.
• = USGS map symbol for wetlands
• = Soil Survey map symbol for wetlands
Once you have determined the wetlands, mark them on the copy of your map labeled “Agriculture, Forest, and Wetlands.” Label each site with a W and the site number.
Table 15: Wetland Locations
Site Location Area (acres)
W1 East of 350 E at 500 N 5
16
Tier 2 Wetland Observations While driving around your watershed, observe the wetlands. Determine if any type of construction or farming has taken place near the wetland. Also document other activities that may affect the wetland. You may also see smaller wetlands that were not determined previously. If you are unable to see the wetlands when observing the watershed, you might use aerial photographs. Aerial photographs can be obtained from the sources in Table 1 or on the Web at http://www.terraserver.com. Table 16: Wetland Observations
Construction Farming Site
Yes No Yes No
Other comments
W1 Away from road, but appeared to be farmed all around
How many wetlands did you identify? What percentage of the wetlands you observed have construction occurring nearby? How many have farming occurring nearby?
17
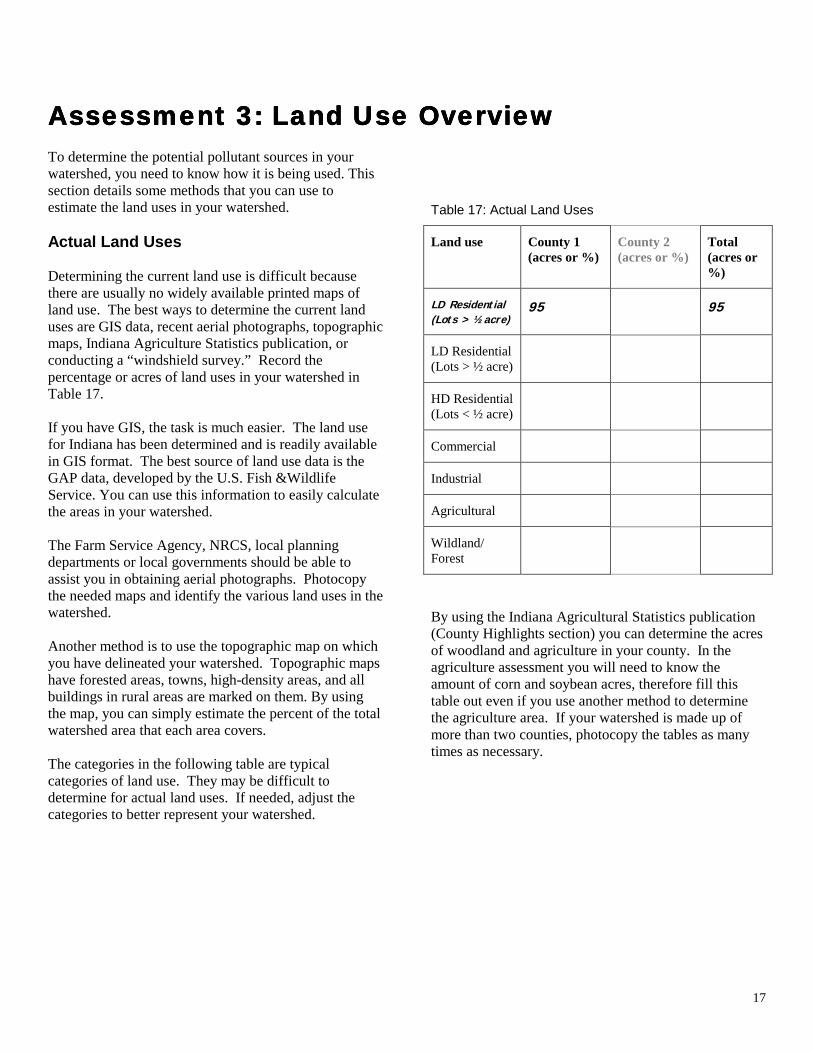
Assessment 3: Land Use OverviewAssessment 3: Land Use OverviewAssessment 3: Land Use OverviewAssessment 3: Land Use Overview To determine the potential pollutant sources in your watershed, you need to know how it is being used. This section details some methods that you can use to estimate the land uses in your watershed. Actual Land Uses Determining the current land use is difficult because there are usually no widely available printed maps of land use. The best ways to determine the current land uses are GIS data, recent aerial photographs, topographic maps, Indiana Agriculture Statistics publication, or conducting a “windshield survey.” Record the percentage or acres of land uses in your watershed in Table 17. If you have GIS, the task is much easier. The land use for Indiana has been determined and is readily available in GIS format. The best source of land use data is the GAP data, developed by the U.S. Fish &Wildlife Service. You can use this information to easily calculate the areas in your watershed. The Farm Service Agency, NRCS, local planning departments or local governments should be able to assist you in obtaining aerial photographs. Photocopy the needed maps and identify the various land uses in the watershed. Another method is to use the topographic map on which you have delineated your watershed. Topographic maps have forested areas, towns, high-density areas, and all buildings in rural areas are marked on them. By using the map, you can simply estimate the percent of the total watershed area that each area covers. The categories in the following table are typical categories of land use. They may be difficult to determine for actual land uses. If needed, adjust the categories to better represent your watershed.
Table 17: Actual Land Uses
Land use County 1 (acres or %)
County 2 (acres or %)
Total (acres or %)
LD Residential (Lots > ½ acre)
95 95
LD Residential (Lots > ½ acre)
HD Residential (Lots < ½ acre)
Commercial
Industrial
Agricultural
Wildland/ Forest
By using the Indiana Agricultural Statistics publication (County Highlights section) you can determine the acres of woodland and agriculture in your county. In the agriculture assessment you will need to know the amount of corn and soybean acres, therefore fill this table out even if you use another method to determine the agriculture area. If your watershed is made up of more than two counties, photocopy the tables as many times as necessary.

18
Figure 8: Land Uses in the Indian Creek Watershed in Tippecanoe County Table 18: Acres of Land from Indiana Agriculture Statistics
County: ____________________
Land Use
Acres in the county (from Ag. Statistics)
X
Fraction of the county in the watershed
=
Acres in the watershed
Corn 101,500 0.031 3,147
Corn
Soybean
Wheat
Pasture
Forest
(C1)
X
=
County: ____________________
Crop Acres in the county (from Ag. Statistics)
X
Fraction of the county in the watershed
=
Crop acres in the watershed
Corn
Soybean
Wheat
Pasture
Forest
X
(C3)
=
A windshield survey consists of driving through the watershed and observing what is there. It is a good idea to have at least three people participate. One person will drive, another will observe the landscape, and the third will record the observations. Zoned Land Uses Most county governments have planning departments that create maps to show how each parcel is zoned. Although zoning maps are not usually representative of current land uses, they do show what potentially could be built in each area. You should be aware of these to plan for future impacts on your watershed. These maps vary in size, scale, and detail from county to county and possibly from township to township within a county. You can usually look at these maps at the planning department. Many of the maps can be photocopied, but some planning departments may charge you a small fee to copy them. You will first need to draw the boundaries of the watershed on the zoning map. Then observe the different types of zoned land uses within the watershed. To make it easier to distinguish each, you may want to color code corresponding land uses.
19
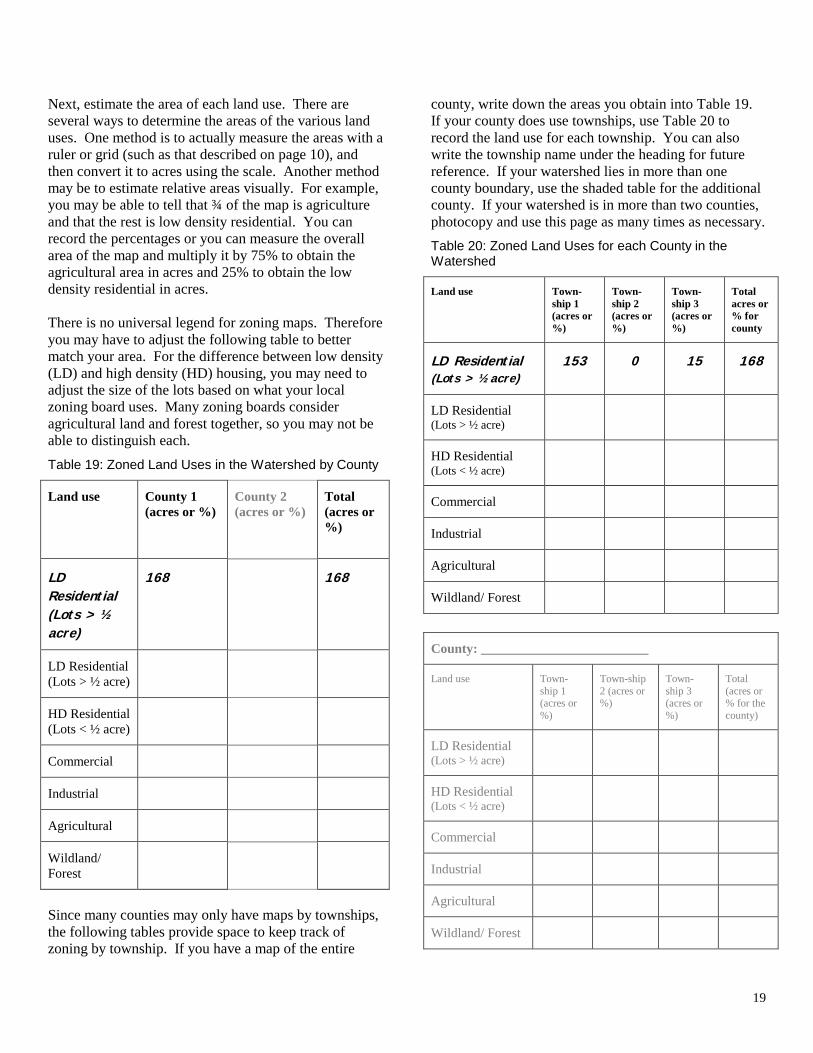
Next, estimate the area of each land use. There are several ways to determine the areas of the various land uses. One method is to actually measure the areas with a ruler or grid (such as that described on page 10), and then convert it to acres using the scale. Another method may be to estimate relative areas visually. For example, you may be able to tell that ¾ of the map is agriculture and that the rest is low density residential. You can record the percentages or you can measure the overall area of the map and multiply it by 75% to obtain the agricultural area in acres and 25% to obtain the low density residential in acres. There is no universal legend for zoning maps. Therefore you may have to adjust the following table to better match your area. For the difference between low density (LD) and high density (HD) housing, you may need to adjust the size of the lots based on what your local zoning board uses. Many zoning boards consider agricultural land and forest together, so you may not be able to distinguish each. Table 19: Zoned Land Uses in the Watershed by County
Land use County 1 (acres or %)
County 2 (acres or %)
Total (acres or %)
LD Residential (Lots > ½ acre)
168 168
LD Residential (Lots > ½ acre)
HD Residential (Lots < ½ acre)
Commercial
Industrial
Agricultural
Wildland/ Forest
Since many counties may only have maps by townships, the following tables provide space to keep track of zoning by township. If you have a map of the entire
county, write down the areas you obtain into Table 19. If your county does use townships, use Table 20 to record the land use for each township. You can also write the township name under the heading for future reference. If your watershed lies in more than one county boundary, use the shaded table for the additional county. If your watershed is in more than two counties, photocopy and use this page as many times as necessary. Table 20: Zoned Land Uses for each County in the Watershed
Land use Town-ship 1 (acres or %)
Town-ship 2 (acres or %)
Town- ship 3 (acres or %)
Total acres or % for county
LD Residential (Lots > ½ acre)
153 0 15 168
LD Residential (Lots > ½ acre)
HD Residential (Lots < ½ acre)
Commercial
Industrial
Agricultural
Wildland/ Forest
County: _________________________
Land use Town-ship 1 (acres or %)
Town-ship 2 (acres or %)
Town- ship 3 (acres or %)
Total (acres or % for the county)
LD Residential (Lots > ½ acre)
HD Residential (Lots < ½ acre)
Commercial
Industrial
Agricultural
Wildland/ Forest
20
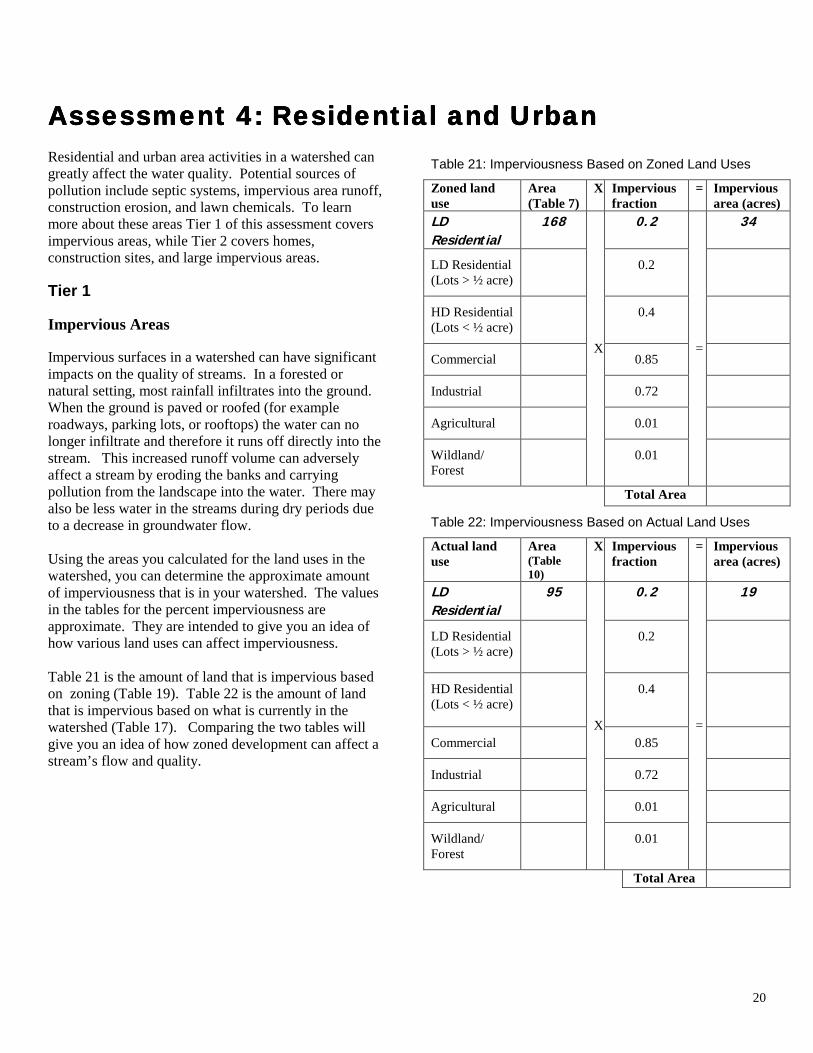
Assessment 4: Residential and Urban Assessment 4: Residential and Urban Assessment 4: Residential and Urban Assessment 4: Residential and Urban Residential and urban area activities in a watershed can greatly affect the water quality. Potential sources of pollution include septic systems, impervious area runoff, construction erosion, and lawn chemicals. To learn more about these areas Tier 1 of this assessment covers impervious areas, while Tier 2 covers homes, construction sites, and large impervious areas. Tier 1 Impervious Areas Impervious surfaces in a watershed can have significant impacts on the quality of streams. In a forested or natural setting, most rainfall infiltrates into the ground. When the ground is paved or roofed (for example roadways, parking lots, or rooftops) the water can no longer infiltrate and therefore it runs off directly into the stream. This increased runoff volume can adversely affect a stream by eroding the banks and carrying pollution from the landscape into the water. There may also be less water in the streams during dry periods due to a decrease in groundwater flow.
Using the areas you calculated for the land uses in the watershed, you can determine the approximate amount of imperviousness that is in your watershed. The values in the tables for the percent imperviousness are approximate. They are intended to give you an idea of how various land uses can affect imperviousness.
Table 21 is the amount of land that is impervious based on zoning (Table 19). Table 22 is the amount of land that is impervious based on what is currently in the watershed (Table 17). Comparing the two tables will give you an idea of how zoned development can affect a stream’s flow and quality.
Table 21: Imperviousness Based on Zoned Land Uses
Zoned land use
Area (Table 7)
X Impervious fraction
= Impervious area (acres)
LD Residential
168 0.2 34
LD Residential (Lots > ½ acre)
0.2
HD Residential (Lots < ½ acre)
0.4
Commercial 0.85
Industrial 0.72
Agricultural 0.01
Wildland/ Forest
X
0.01
=
Total Area
Table 22: Imperviousness Based on Actual Land Uses
Actual land use
Area (Table 10)
X Impervious fraction
= Impervious area (acres)
LD Residential
95 0.2 19
LD Residential (Lots > ½ acre)
0.2
HD Residential (Lots < ½ acre)
0.4
Commercial 0.85
Industrial 0.72
Agricultural 0.01
Wildland/ Forest
X
0.01
=
Total Area
21
Tier 2 The topics in this section need more sources of information to successfully answer them. You will need to observe the sites to answer part of the questions and you may need to contact someone to answer the rest of the questions. Subdivisions and Other Residential Areas Major water quality concerns in residential areas are septic systems, lawn chemicals, runoff from impervious areas, and erosion. In this section, questions related to these areas can be answered through observations (a windshield survey), talking with residents, and maps.
Many counties mark subdivisions on their zoning maps. You may also know of subdivisions because of signs indicating them along roadways. To answer the questions about other residences in the watershed, it may be easiest to group them and then answer the questions for each grouping. An example of a grouping would be “all homes on Klondike Rd. between U.S. Hwy. 52 and Lindberg Rd.” Using the copy of the watershed map that you marked “Residential, Urban and Regulated Pollutants,” mark your subdivisions or groupings of homes. For each one, mark H and the site number; for example the first group of homes would be labeled “H1.” Talking to the homeowners would be the most direct method of obtaining answers to the various topics, however some may not feel comfortable answering the questions.
Area: The area can be estimated by using your maps (either zoning or topographic map).
Age: The age of the homes may be determined by contacting your planning department, local contractors, or realtors.
Sewage: The homes either have septic systems or are connected to a sewer system. Failing septic systems can release nutrients and pathogens into the watershed. Planning departments, local contractors, health departments, or realtors may now if the homes are on septic or sewer systems. The health department is probably the best source for information on failing septic systems. Another source of information would be to contact your local sewer company to determine where their pipelines are located. Check which system you believe the homes are using or, if unsure, check “don’t know.” (Sewer systems are included in the Regulated Pollutant Sources section.)
Ponds: Detention ponds slow down the flow of water off the landscape and allow sediment to settle out before the water flows into streams. Determine if a detention pond is present by using an aerial photograph or by observing the area. Your local planning department, contractors, or realtors may also be able to help you.
Buffers: Homes built along streams can also be of concern. Vegetated buffers help to reduce the potential for sediment, pesticide, or nutrient pollution. An adequate buffer would be one that is made up of trees, shrubs, or native grasses. Lawns would not be considered an adequate buffer. If the area is not along a stream, check “not applicable.”
Unusually green lawns: Many homeowners often believe the more fertilizers/pesticides they apply the better their yard will appear. However, the extra chemicals can run off the lawn into nearby waterways, harming the ecosystem. Indicate “yes” if the lawn seems to be exceptionally green compared to the neighboring yards.

22
Table 23: Residential Areas
Sewage Ponds Buffers Unusually green lawns
Site Name or Description
Location Area Age
Sept
ic
Sew
er
Don
’t k
now
Yes
No
Yes
No
Not
app
licab
le
Yes
No
H1 Red River Subdivision
On 600 N along Red River
25 0-10 ���� ���� ���� ����
Construction Sites Sediment from a construction site can be much greater than erosion from a farm field. The sediment reduces the stream size, chokes fish by clogging their gills, and can carry unwanted nutrients. In Indiana, a state rule
commonly called “Rule 5” (327 IAC 15-5) regulates construction sites. The purpose of Rule 5 is to reduce the sediment leaving the sites. It has only applied to areas that are 5 acres or larger in size, but will cover those down to 1 acre. However, if the land area being disturbed is less than 5 acres, but is part of a larger plan
23
of development (for example a subdivision or industrial park), it is still covered by the rule. The Soil and Water Conservation District (SWCD) office in each county is responsible for approving and maintaining erosion control plans for each site. The plans detail what measures the construction firm will use to prevent sediment laden water from running off the site, sediment from entering roadways, and sediment from entering on-site storm drains. However many counties have limited resources and are unable to make sure the construction firms are following the plans once they have been approved. Contact your SWCD to determine which construction sites in your watershed have “Rule 5” plans and the area of these sites. On your watershed map, labeled “Residential, Urban, and Regulated Pollutants,” mark the locations by using the notation “C” and the site number. Once you have determined the sites, drive by the sites and see if they are following the plan. You should see erosion control practices in place and not see any sediment leaving the site. Possible erosion control practices that you may see are straw bales, sediment fences, and sediment basins. Indicate whether or not these practices are in place and if they are working properly.
When you are observing the sites, watch for other sites in the watershed that do not fall under the “Rule 5” law. Mark them on your map and determine if these sites are using erosion control practices and if they are working. If the site seems to be larger than 5 acres and you believe
it should be a “Rule 5” site, notify the SWCD office in that county.
“Rule 5” Site: Answer “yes” if the SWCD office has a plan for it. “No” is for sites that you find while driving around the watershed that are less than 5 acres. “Unsure” is for sites found when observing the watershed that were not a “Rule 5” site, but you feel may be.
Runoff: Sediment-laden water should not flow from the site. It should be detained by erosion control structures. Observe the area and see if water is allowed to flow from the site. Answer “yes” if it is and “no” if not. Waste: Construction material should not be carried away from the site by runoff. This includes garbage, debris, or cleaning wastes. Answer “yes” if waste is leaving the site and “no” if not.
Buffers: It is good for contractors to leave a strip of existing vegetation around the site to help reduce off-site erosion and sedimentation. Indicate “yes” or “no” if you see this or not. This is especially important if the site is next to a stream.
Other Comments: Write down any observations that you feel may have an adverse impact on water quality. This could include sediment leaving a site, silt fence falling over due to too much sediment, or unprotected storm drain inlets. You should also record the types of erosion control practices that are seen. This could include a silt fence with its bottom buried surrounding the site, existing grass strip around the site, or runoff channeled into a sediment basin.
24
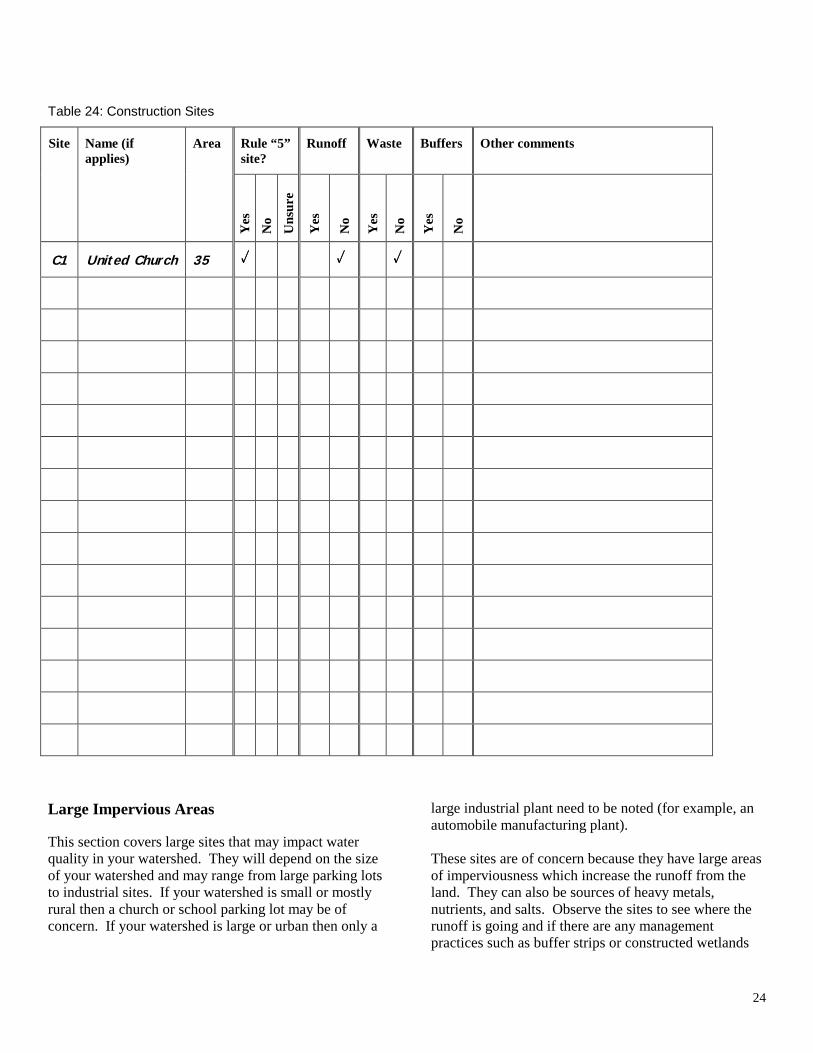
Table 24: Construction Sites
Rule “5” site?
Runoff Waste Buffers Other comments Site Name (if applies)
Area
Yes
N
o U
nsur
e
Yes
No
Yes
No
Yes
No
C1 United Church 35 ���� ���� ����
Large Impervious Areas This section covers large sites that may impact water quality in your watershed. They will depend on the size of your watershed and may range from large parking lots to industrial sites. If your watershed is small or mostly rural then a church or school parking lot may be of concern. If your watershed is large or urban then only a
large industrial plant need to be noted (for example, an automobile manufacturing plant). These sites are of concern because they have large areas of imperviousness which increase the runoff from the land. They can also be sources of heavy metals, nutrients, and salts. Observe the sites to see where the runoff is going and if there are any management practices such as buffer strips or constructed wetlands
25
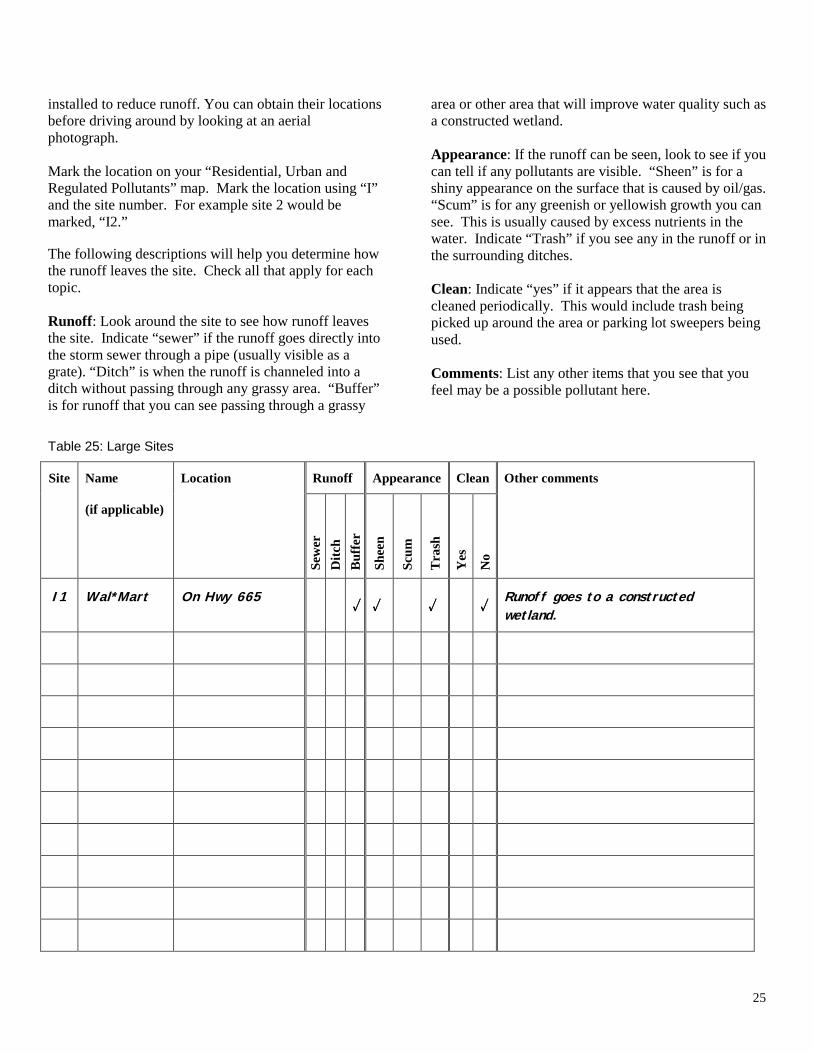
installed to reduce runoff. You can obtain their locations before driving around by looking at an aerial photograph. Mark the location on your “Residential, Urban and Regulated Pollutants” map. Mark the location using “I” and the site number. For example site 2 would be marked, “I2.” The following descriptions will help you determine how the runoff leaves the site. Check all that apply for each topic. Runoff: Look around the site to see how runoff leaves the site. Indicate “sewer” if the runoff goes directly into the storm sewer through a pipe (usually visible as a grate). “Ditch” is when the runoff is channeled into a ditch without passing through any grassy area. “Buffer” is for runoff that you can see passing through a grassy
area or other area that will improve water quality such as a constructed wetland.
Appearance: If the runoff can be seen, look to see if you can tell if any pollutants are visible. “Sheen” is for a shiny appearance on the surface that is caused by oil/gas. “Scum” is for any greenish or yellowish growth you can see. This is usually caused by excess nutrients in the water. Indicate “Trash” if you see any in the runoff or in the surrounding ditches.
Clean: Indicate “yes” if it appears that the area is cleaned periodically. This would include trash being picked up around the area or parking lot sweepers being used.
Comments: List any other items that you see that you feel may be a possible pollutant here.
Table 25: Large Sites
Runoff Appearance CleanSite Name
(if applicable)
Location
Sew
er
Ditc
h Bu
ffer
Shee
n
Scum
Tras
h
Yes
No
Other comments
I1 Wal*Mart On Hwy 665 ���� ���� ���� ���� Runoff goes to a constructed
wetland.

26
Golf Courses and Other Grass (Turf) Areas Golf courses, cemeteries, parks, and sports fields can benefit the environment by creating green space and providing wildlife habitat. However, they can damage the environment when not maintained properly. Aerial photographs, maps, or observations can be used to locate these areas in the watershed and to estimate their areas. Mark their locations on the copy of your delineated map labeled “Residential, Urban, and Regulated Pollutants” and describe the location in Table 26. Label the area G and add the site number; for example golf course 4 would be labeled “G4.” Table 26: Location of Golf Courses and other Grass (Turf) Areas
Grass Areas
Name Location Area (acres)
G1 The Masters 600 N and 350 W 100
Sensitive Areas Buffer zones are good when used between green areas and sensitive areas in a watershed. Sensitive areas include wetlands, streams, ponds, and lakes. Look around the area to see if any of these exist (or any other feature that you feel may be adversely affected). A good buffer usually consists of native vegetation like grasses or trees. Erosion can occur on over used or poorly maintained areas or while the course is under construction.
• = Note if a buffer zone exists between the sensitive
area and the green area. • = Look to see if any erosion is visible that could be of
concern to water quality. • = Note any other items of potential concern to the
water quality that you see. This could include dead fish/animals or debris in the sensitive area.
Table 27: Sensitive Areas
Buffers Erosion Other comments Golf course
Sensitive area type
Yes
N
o D
on’t
Kno
w
Yes
N
o D
on’t
Kno
w
G1 Stream ���� ���� Algae in water
The following topics can be answered by interviewing the area’s superintendent or maintenance workers. These in-depth questions address the maintenance practices of individual areas.
Integrated Pest Management One way that some intensively managed areas lessen their use of pesticides is through Integrated Pest Management or IPM. IPM relies on a combination of common sense practices of preventing and controlling pests such as weeds, diseases, and insects. Monitoring is used to identify the pests and the amount of damage they cause, then all possible management options are evaluated and the most environmentally-friendly control is implemented. Ask the superintendents if their courses use IPM and to what extent it is used. You could also ask them their thoughts of IPM. Example questions are:
• = If you don’t use IPM, why not? • = If you don’t use IPM, have you ever considered it? • = If you do use it, how much has it lessened your
pesticide use?

27
Table 28: Integrated Pest Management
IPM Golf course
Yes
No
Extent of use and other comments
G1 Never considered using
Chemical Storage If pesticides and nutrients are not stored properly they can also be a potential concern. The Office of the Indiana State Chemist can provide more information on chemical storage. The storage, use, and disposal of all pesticides must be in accordance with the EPA label, and OISC has established rules for application , storage, and record keeping that must be met by golf courses. Containers should not be leaking, stored near a waterbody, be out in the open, or stored in groups. Ask the superintendents how they store their chemicals and observe them if possible. Record this information in Table 31.
Table 29: Chemical Storage
Golf course
Chemical location and other comments
G1 Stored in a locked shed. Shed was rusting through, could see holes in it.
Rinsing of Equipment After applying chemicals, the machinery used is usually washed. This rinsate can contain small amounts of the chemicals used. It should not be discharged into any nearby streams or sensitive areas due to the possibility for water pollution. Even if a concrete pad is used, the water must still drain someplace. Ask the individual where the rinse water goes. Enter this information into Table 32. Table 30: Rinsate
Golf course
Where does the rinsate go?
G1 Drain goes directly into stream
Grass Clippings Golf courses cut their grass frequently. Many remove the clippings from the landscape instead of leaving them in place. The best way to dispose of these clippings is to compost them. The worst way is to dump them into streams or ponds. Ask the supervisor or maintenance worker what they do with the clippings. Table 31: Grass Clippings
Golf course
What do they do with the grass clippings?
G1 Compost pile behind hole number 3

28
Now that you have completed the “Residential and Urban” section. The following questions will help you to organize your answers. Subdivisions and Other Residential Areas How many of the homes were on septic systems? _______________________________________________ How many were on sewer systems? __________________________________________________________ How many of the homes did not have a buffer between them and the stream (if applicable)? ________________________________ Construction Sites How many of the sites allow sediment-laden water to flow away from the site? ______________________ At how many sites did you see construction waste leaving the site? ________________________________ How many of the sites had a vegetative buffer? _________________________________________ Large Impervious Areas How many of the areas had runoff flowing directly into a sewer? __________________________________ How many sites had runoff flowing directly into a ditch?________________________________________ How many sites had runoff flowing directly into a buffer? ________________________________________ How many of the sites had pollutants visible on the surface of the runoff? ___________________________
29
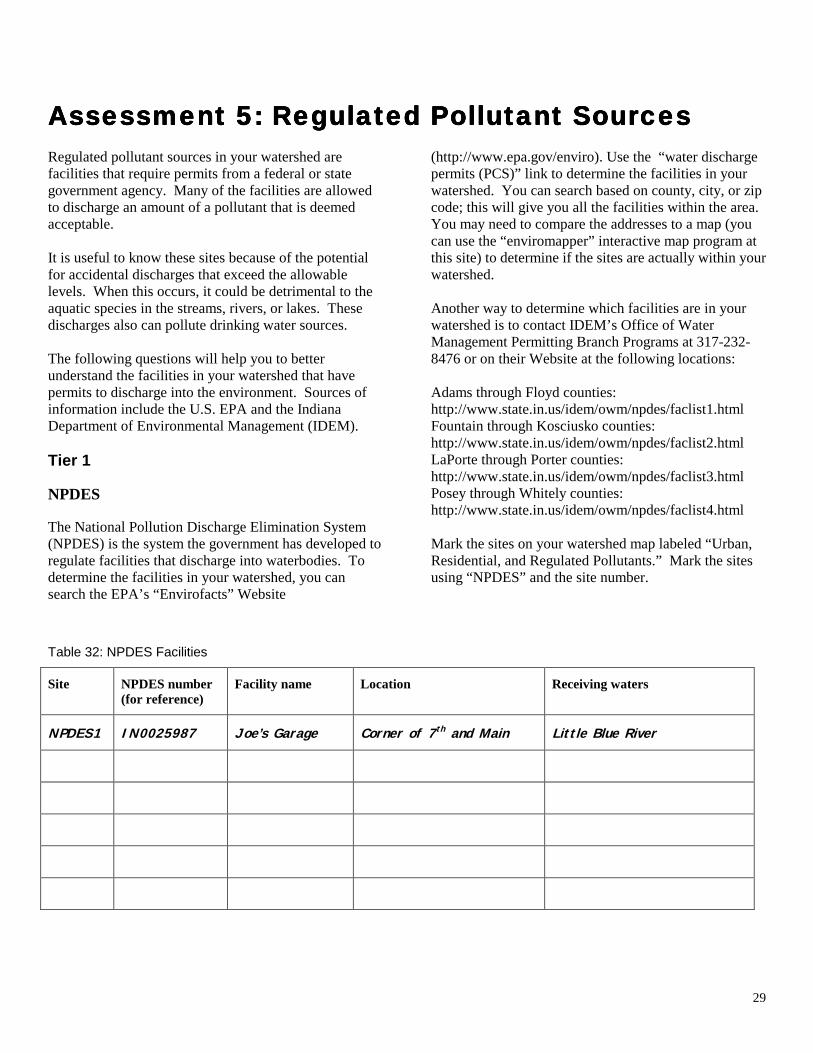
Assessment 5: Regulated Pollutant SourcesAssessment 5: Regulated Pollutant SourcesAssessment 5: Regulated Pollutant SourcesAssessment 5: Regulated Pollutant Sources Regulated pollutant sources in your watershed are facilities that require permits from a federal or state government agency. Many of the facilities are allowed to discharge an amount of a pollutant that is deemed acceptable.
It is useful to know these sites because of the potential for accidental discharges that exceed the allowable levels. When this occurs, it could be detrimental to the aquatic species in the streams, rivers, or lakes. These discharges also can pollute drinking water sources. The following questions will help you to better understand the facilities in your watershed that have permits to discharge into the environment. Sources of information include the U.S. EPA and the Indiana Department of Environmental Management (IDEM). Tier 1 NPDES The National Pollution Discharge Elimination System (NPDES) is the system the government has developed to regulate facilities that discharge into waterbodies. To determine the facilities in your watershed, you can search the EPA’s “Envirofacts” Website
(http://www.epa.gov/enviro). Use the “water discharge permits (PCS)” link to determine the facilities in your watershed. You can search based on county, city, or zip code; this will give you all the facilities within the area. You may need to compare the addresses to a map (you can use the “enviromapper” interactive map program at this site) to determine if the sites are actually within your watershed.
Another way to determine which facilities are in your watershed is to contact IDEM’s Office of Water Management Permitting Branch Programs at 317-232-8476 or on their Website at the following locations:
Adams through Floyd counties: http://www.state.in.us/idem/owm/npdes/faclist1.html Fountain through Kosciusko counties: http://www.state.in.us/idem/owm/npdes/faclist2.html LaPorte through Porter counties: http://www.state.in.us/idem/owm/npdes/faclist3.html Posey through Whitely counties: http://www.state.in.us/idem/owm/npdes/faclist4.html
Mark the sites on your watershed map labeled “Urban, Residential, and Regulated Pollutants.” Mark the sites using “NPDES” and the site number.
Table 32: NPDES Facilities
Site NPDES number (for reference)
Facility name Location Receiving waters
NPDES1 IN0025987 Joe’s Garage Corner of 7th and Main Little Blue River
30
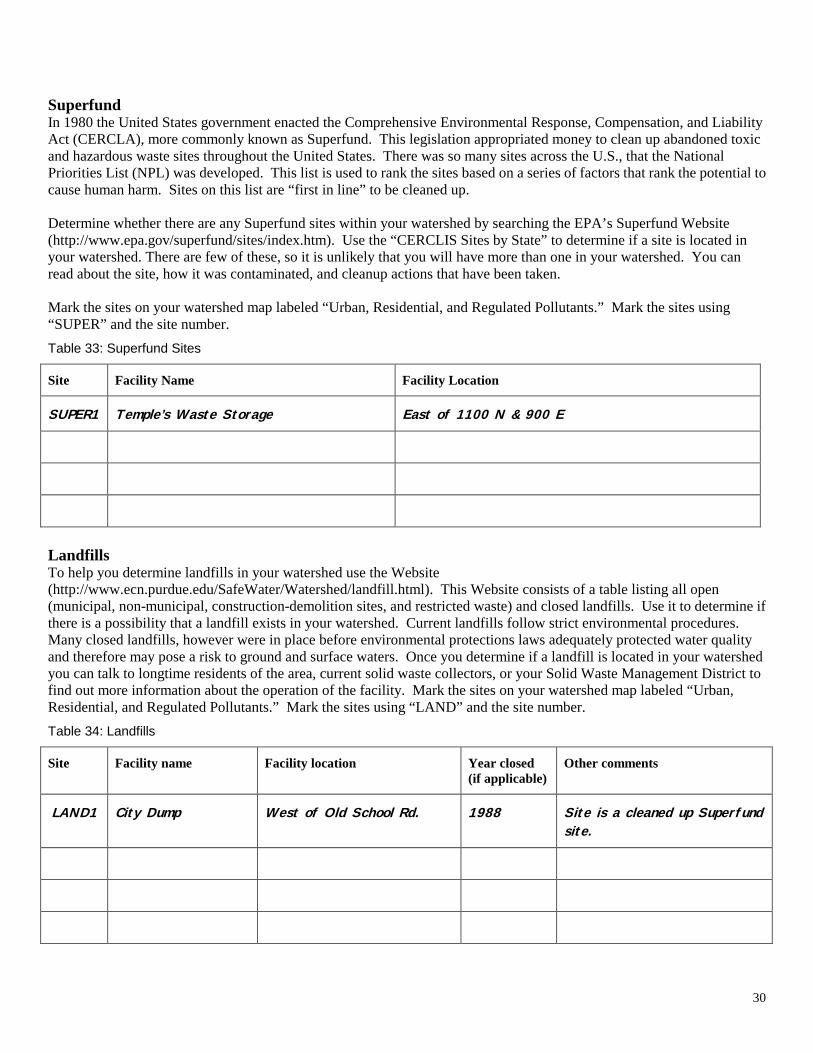
Superfund In 1980 the United States government enacted the Comprehensive Environmental Response, Compensation, and Liability Act (CERCLA), more commonly known as Superfund. This legislation appropriated money to clean up abandoned toxic and hazardous waste sites throughout the United States. There was so many sites across the U.S., that the National Priorities List (NPL) was developed. This list is used to rank the sites based on a series of factors that rank the potential to cause human harm. Sites on this list are “first in line” to be cleaned up.
Determine whether there are any Superfund sites within your watershed by searching the EPA’s Superfund Website (http://www.epa.gov/superfund/sites/index.htm). Use the “CERCLIS Sites by State” to determine if a site is located in your watershed. There are few of these, so it is unlikely that you will have more than one in your watershed. You can read about the site, how it was contaminated, and cleanup actions that have been taken.
Mark the sites on your watershed map labeled “Urban, Residential, and Regulated Pollutants.” Mark the sites using “SUPER” and the site number. Table 33: Superfund Sites
Site Facility Name Facility Location
SUPER1 Temple’s Waste Storage East of 1100 N & 900 E
Landfills To help you determine landfills in your watershed use the Website (http://www.ecn.purdue.edu/SafeWater/Watershed/landfill.html). This Website consists of a table listing all open (municipal, non-municipal, construction-demolition sites, and restricted waste) and closed landfills. Use it to determine if there is a possibility that a landfill exists in your watershed. Current landfills follow strict environmental procedures. Many closed landfills, however were in place before environmental protections laws adequately protected water quality and therefore may pose a risk to ground and surface waters. Once you determine if a landfill is located in your watershed you can talk to longtime residents of the area, current solid waste collectors, or your Solid Waste Management District to find out more information about the operation of the facility. Mark the sites on your watershed map labeled “Urban, Residential, and Regulated Pollutants.” Mark the sites using “LAND” and the site number. Table 34: Landfills
Site Facility name Facility location Year closed (if applicable)
Other comments
LAND1 City Dump West of Old School Rd. 1988 Site is a cleaned up Superfund site.

31
Combined Sewer Overflows A combined sewer system is a single pipe that conveys both wastewater (domestic, commercial, and industrial) and storm water to a sewage treatment plant. A combined sewer overflow (CSO) is the discharge from this system at a point prior to the sewage treatment plant. Overflows usually occur during or after large storm events, in which the volume of flow overloads the sewage treatment plant causing it to divert the flow directly (untreated) into the receiving water. Determine whether or not any of the communities in your watershed have CSOs. A list of towns with CSOs can be found at (http://www.ai.org/idem/owm/CSOTRACK.html). For any communities that have CSOs, contact the local sewage treatment plant to determine where the outlet is located. Mark the outlet locations on your watershed map labeled “Urban, Residential, and Regulated Pollutants.” Mark the sites using “CSO” and the site number. Table 35: CSOs
Site Outlet location Receiving waters
CSO1 Downstream of 10th St. bridge
Red River
Tier 2 Unpermitted or Unknown Pipes If you discover any pipes that were not covered above in the NPDES section, besides a field tile drain, while driving through the watershed, note its location on your watershed map labeled “Urban, Residential, and Regulated Pollutants.” Mark the sites using “UP” and the site number. For example for site 1, label the site “UP1.” This would include any pipes leading into a stream, river, or ditch, especially if they are flowing during dry weather. Table 36: Unknown Pipes
Site Name (if known) Location Receiving waters
UP1 Next to ACME Metals
On 45th Street Green River

32
Assessment 6: Agriculture Assessment 6: Agriculture Assessment 6: Agriculture Assessment 6: Agriculture Agriculture is the use for approximately two-thirds of the land in Indiana. If your watershed is typical, there are probably significant areas of agriculture in it. Although agriculture has many benefits for the environment, including providing habitat for wildlife and a general lack of impermeable areas, agricultural activities in a watershed can also have adverse impacts on water quality. Poor management of crops and livestock can cause manure, pesticides, fertilizers, and soil to enter streams and lakes, which can be harmful to aquatic and human health. The most common agricultural land uses in Indiana are field crops (corn, soybeans, and wheat), and pasture. The most common livestock are hogs, dairy cattle, beef cattle, swine, and poultry. This assessment helps you identify potential impacts from agricultural land use in your watershed. Tier 1 helps you estimate the livestock numbers, fertilizer, pesticides, and manure applied in the watershed. Tier 2 requires using more detailed information including Soil Surveys, interviews, and a “windshield survey” which helps you know your watershed better. The following sources of information may help you in this section: • = Natural Resources Conservation Service (NRCS):
Tillage practices, conservation programs • = Purdue Extension offices: Animal numbers, manure
amounts • = Soil and Water Conservation Districts (SWCD) • = Indiana Agricultural Statistics: Crop acres, animal
numbers, pesticides, fertilizers • = Office of Indiana State Chemist: Fertilizer
Tier 1 You can estimate the amounts of pesticides and fertilizers that are being applied in your watershed by using the crop acres determined in Table 18. These estimates can give you an idea of potential contaminants likely to be found in the streams. In the following sections, if you know the actual amounts of pesticides and fertilizers, then enter the data in the last column of the table. If you cannot get exact values use the tables to determine an approximate amount. The pesticide types shown are those applied most commonly in the state. The columns that have data in them already were determined from the 1998 Indiana Agricultural Statistics publication. Other values can be used if known. Pesticides Applied in the Watershed Pesticides stop or limit insects and weeds from damaging crops. Ideally, they remain in the environment long enough to control the pests and then break down into harmless compounds. However, in practice, pesticides are often transported into water supplies before they have enough time to break down. The following section only allows you to estimate the amount of pesticide applied in your watershed. As a rough estimate, about 1% of applied pesticides end up in Indiana’s surface water. These numbers only suggest what pesticides are probably used; monitoring the watershed or asking farmers and dealers is needed to give you more exact numbers. If you are conducting monitoring in your watershed, estimates of total amounts applied may be helpful in determining what fraction was transported into streams.

33
Table 37: Estimate of Pesticides Applied in the Watershed in Each County
Fraction of acres treated in the state
Average rate of application (lbs/acre)
Crop type
Crop acres in the watershed (Table 18)
X
Pesticide type
1998 Figures
Other, if known
X 1998 Figures
Other, if known
=
Estimated amount of pesticide applied (lbs)
Corn 3,147 Atrazine 0.89 1.36 3,809
Atrazine 0.89 1.36
Metolachlor 0.42 2.04
Acetochlor 0.32 1.97
Primisulfuron 0.14 0.03
Corn
Cyanazine 0.13 1.43
Glyphosate 0.55 0.85
Chlorimuron-ethyl
0.27 0.02
2,4-D 0.26 0.39
Imazethapyr 0.25 0.04
Soybean
X
Paraquat 0.19
X
0.89
=
Fertilizers Applied in the Watershed Fertilizers provide vital nutrients for crop growth. These nutrients, however, can also cause water quality problems when there is too much of them. The two nutrients that are of most concern are nitrogen (N) and phosphorus (P). Nitrogen breaks down into the nitrate form, which can cause health concerns in ground water and contributes to a low oxygen zone toxic to fish in the Gulf of Mexico. If the field is drained (like about half of all Indiana cropland), the nitrate can flow directly into ditches and streams through the field tiles. Phosphorus usually travels by attaching to soil particles. When soil erodes from fields it takes phosphorus with it. Too much phosphorus in lakes can cause overgrowth of algae and aquatic plants, which can suffocate the lake. Estimate the amount of fertilizer applied in the watershed by using one of the following. The first
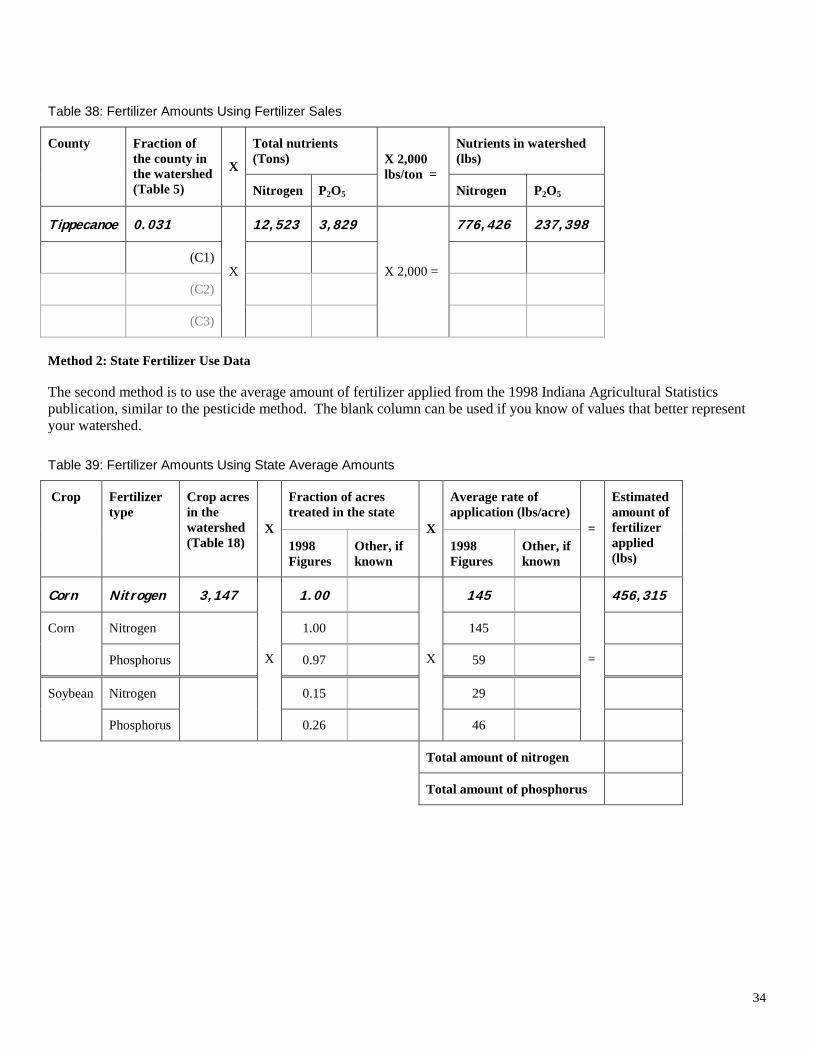
method is to use the fertilizer sales data collected for each county by the Office of Indiana State Chemist. However, fertilizer sold in a county may not have actually been applied to the crops in that county. A farmer may have driven across county lines to purchase their supplies. The second method is to use the average amount applied per acre for the entire state, reported by the Indiana Agriculture Statistics Service. However, your watershed may be very different than the state value. Method 1: Fertilizer Sales The first method is to use the Indiana Fertilizer Tonnage Report for the most recent year. It is a semi-annual report, so you will need to obtain both the Spring and Fall publications. Add the two values for Spring and Fall, then enter that value in Table 38 under the “Total nutrients” column.
34
Table 38: Fertilizer Amounts Using Fertilizer Sales
Total nutrients (Tons)
Nutrients in watershed (lbs)
County Fraction of the county in the watershed (Table 5)
X
Nitrogen P2O5
X 2,000 lbs/ton =
Nitrogen P2O5
Tippecanoe 0.031 12,523 3,829 776,426 237,398
(C1)
(C2)
(C3)
X
X 2,000 =
Method 2: State Fertilizer Use Data The second method is to use the average amount of fertilizer applied from the 1998 Indiana Agricultural Statistics publication, similar to the pesticide method. The blank column can be used if you know of values that better represent your watershed.
Table 39: Fertilizer Amounts Using State Average Amounts
Fraction of acres treated in the state
Average rate of application (lbs/acre)
Crop Fertilizer type
Crop acres in the watershed (Table 18)
X 1998 Figures
Other, if known
X 1998 Figures
Other, if known
=
Estimated amount of fertilizer applied (lbs)
Corn Nitrogen 3,147 1.00 145 456,315
Nitrogen 1.00 145 Corn
Phosphorus
0.97 59
Nitrogen 0.15 29 Soybean
Phosphorus
X
0.26
X
46
=
Total amount of nitrogen
Total amount of phosphorus

35
Livestock Numbers The best method to determine the number of livestock in your watershed is to ask people who are familiar with the area. If you cannot get exact numbers, use Table 35 and the Indiana Agriculture Statistics publication to estimate the number of livestock. The last row is left blank for you to fill in if you feel that another animal species is important in your area. If the number of animals is a fraction, round up the answer. If your watershed is made up of more than one county, photocopy Table 35 as many times as needed. Table 40: Estimate of the Number of Animals in the Watershed
Livestock Total number of animals in the watershed
Swine
Dairy Cattle
Beef Cattle
Poultry
Table 41: Number of Animals per County Based on Indiana Agriculture Statistics
County: ____________________
Livestock Number of animals in the county
X
Fraction of the county in the watershed
=
Number of animals in the watershed
Swine 90,874 0.031 2,817
Swine
Dairy Cattle
Beef Cattle
Poultry
X
(C1)
=
Amount of Manure and Nutrients Once you have determined the number of livestock in the counties, you can estimate the amount of manure and nutrients that are produced in your watershed. Manure is a source of nitrogen, phosphorus, and E. Coli, a bacteria that is used as an indicator that harmful pathogens may be present.
From Table 34 you can get the number of animals in the watershed. The values already filled in are from MWPS-18, Livestock Waste Facilities Handbook. If you would like to determine the manure for another animal, ask your local Purdue Extension Office for the needed numbers. Once you determine the amount of manure, determine the amount of nutrients in the manure. Take the amount of manure and multiply it by the nitrogen numbers to obtain the amount of nitrogen in the manure. Repeat the process for the phosphorus numbers. Finally total up the manure amount, N, and P columns to determine the total amounts for the watershed.

36
Table 42: Manure Produced by Animals in the Watershed
Fraction of nutrients in a pound of manure
Livestock Number of animals (Table 12) X
Avg. amount of manure produced =
Amount of manure produced (lb/day)
Xnitrogen phosphorus
=
Pounds of N in the manure
Pounds of P in the manure
Swine 2,817 11.7 lb/day 32,959 0.0045 0.004 148 132
Swine 11.7 lb/day 0.0045 0.004
Dairy Cattle
115 lb/day 0.0045 0.002
Beef Cattle 75 lb/day 0.008 0.0065
Poultry 0.18 lb/day 0.026 0.026
X
=
X
=
Total amount of manure produced
Total amount of nutrients in the manure
Watershed Projects or Other Conservation Programs Watershed projects throughout the State are developing strategies for protecting their watershed. Conservation programs by state and federal agencies play an important role in reducing pollution from agricultural land. Determine if any watershed projects or other conservation programs are going on in the watershed and find out what has gone on, what the goals were, and what was accomplished. Sources of information include the Center for Technology Information’s (CTIC) Know Your Watershed Website (http://www.ctic.purdue.edu/KYW/), Indiana’s Watershed Action Guide, which can be viewed at ‘ (http://www.state.in.us/idem/owm/planbr/wsm /watershed_action.html), the list of 319 projects at <http://www.state.in.us/idem/owm/planbr/wsm /All_Years.html> or your local NRCS and SWCD offices. The following list are types of programs that may be occurring in your watershed.
• = Lake and River Enhancement (LARE): This program is funded by the IDNR’s Division of Soil Conservation to provide funding of projects that reduce or prevent sedimentation from ending up in streams or lakes.
• = Environmental Quality Incentive Program (EQIP):
This program is funded by the U.S. Department of Agriculture to provide technical, financial, and educational assistance to farmers to address natural resource concerns.
• = Section 319 Grants: These grants are distributed by
IDEM’s Office of Water Management. They provide funding for implementing water quality improvement projects that address nonpoint source pollution.
37
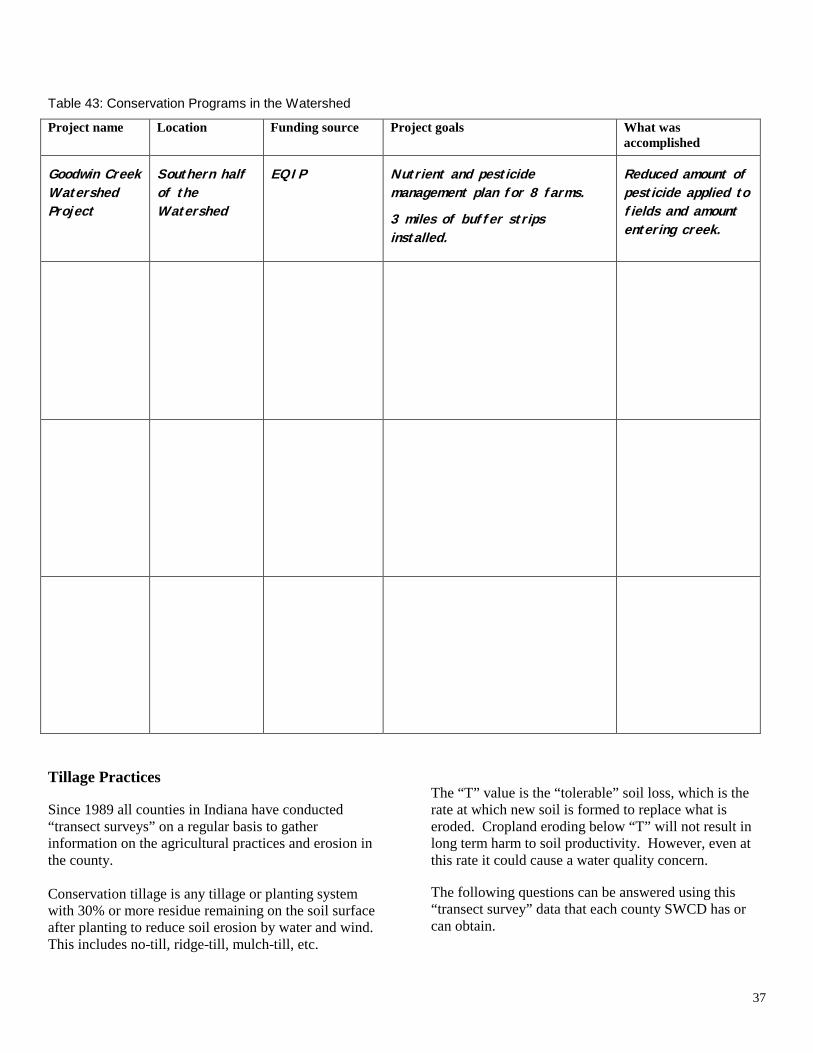
Table 43: Conservation Programs in the Watershed
Project name Location Funding source Project goals What was accomplished
Goodwin Creek Watershed Project
Southern half of the Watershed
EQIP Nutrient and pesticide management plan for 8 farms.
3 miles of buffer strips installed.
Reduced amount of pesticide applied to fields and amount entering creek.
Tillage Practices Since 1989 all counties in Indiana have conducted “transect surveys” on a regular basis to gather information on the agricultural practices and erosion in the county.
Conservation tillage is any tillage or planting system with 30% or more residue remaining on the soil surface after planting to reduce soil erosion by water and wind. This includes no-till, ridge-till, mulch-till, etc.
The “T” value is the “tolerable” soil loss, which is the rate at which new soil is formed to replace what is eroded. Cropland eroding below “T” will not result in long term harm to soil productivity. However, even at this rate it could cause a water quality concern. The following questions can be answered using this “transect survey” data that each county SWCD has or can obtain.

38
Figure 9: Soil Survey
Table 44: Transect Survey Data for the Watershed
County The amount of conservation tillage occurring in the watershed (percentage)
Amount of cropland eroding above “T” value (percentage)
Major type of tillage practices in watershed
Tippecanoe 65% About 6% No-till
Information from Soil Surveys
For each of Indiana’s 92 counties, a detailed soil survey has been developed (Figure 9). These Soil Surveys contain descriptions of each soil, the limitations that the soil may have, and various other properties. The Soil Survey can be viewed and often obtained at your local SWCD office. Soil
Surveys are one of the most important resources for anyone who uses or cares about
the land.
To determine what soils are in your watershed, photocopy the needed detailed soil maps out of the Soil Survey books (these are the folded maps found in the back of the book). Next, draw the boundary of the watershed onto the photocopied maps. Use landmarks such as roads to transfer the watershed boundaries from the topographic map to the soil map. Within your watershed you will see that there are many different soil types. To make it easier to distinguish them, you may want to color corresponding land uses. This can be a big job if your watershed is large. One double page in the soil survey contains about 3840 acres. A 12,000 acre watershed takes approximately 3-4 hours to complete . If you have access to GIS and county soil data, it will save a lot of time in determining the soil types in your watershed. Once you’ve determined the soil types, record them in the first column of Table 45. To determine the area of each soil type, you can approximate it by looking at the
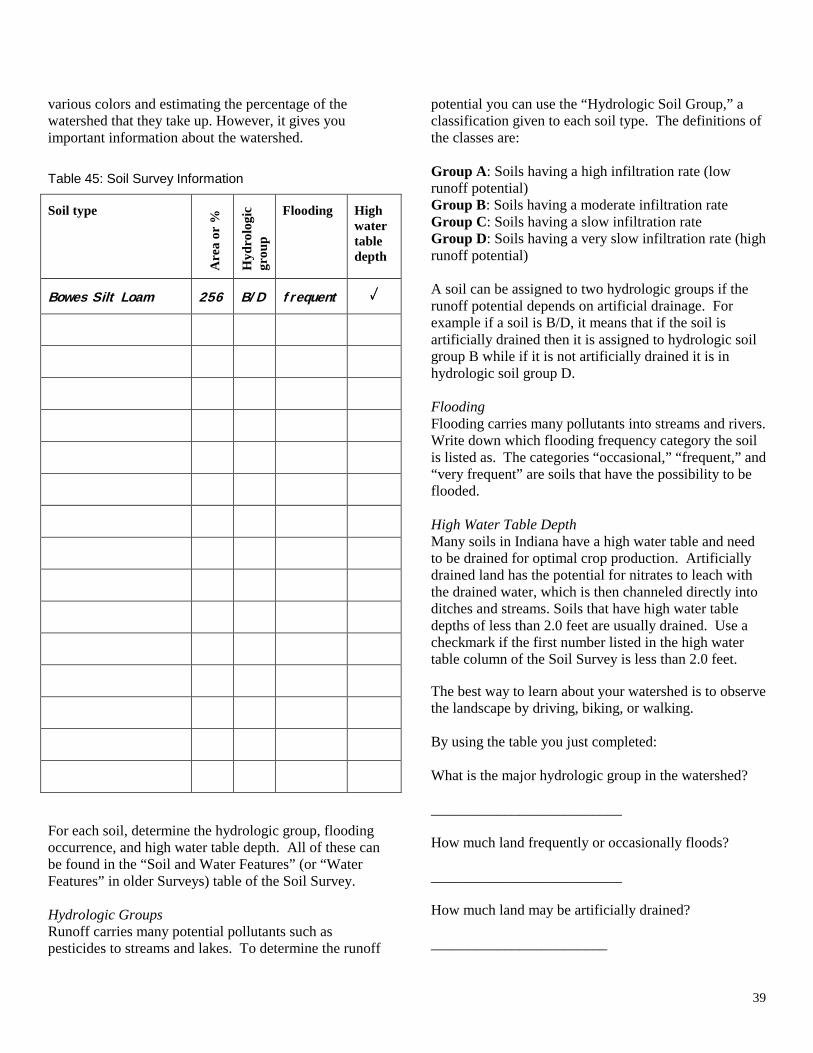
39
various colors and estimating the percentage of the watershed that they take up. However, it gives you important information about the watershed. Table 45: Soil Survey Information
Soil type A
rea
or %
Hyd
rolo
gic
grou
p
Flooding High water table depth
Bowes Silt Loam 256 B/D frequent ����
For each soil, determine the hydrologic group, flooding occurrence, and high water table depth. All of these can be found in the “Soil and Water Features” (or “Water Features” in older Surveys) table of the Soil Survey. Hydrologic Groups Runoff carries many potential pollutants such as pesticides to streams and lakes. To determine the runoff
potential you can use the “Hydrologic Soil Group,” a classification given to each soil type. The definitions of the classes are:
Group A: Soils having a high infiltration rate (low runoff potential) Group B: Soils having a moderate infiltration rate Group C: Soils having a slow infiltration rate Group D: Soils having a very slow infiltration rate (high runoff potential) A soil can be assigned to two hydrologic groups if the runoff potential depends on artificial drainage. For example if a soil is B/D, it means that if the soil is artificially drained then it is assigned to hydrologic soil group B while if it is not artificially drained it is in hydrologic soil group D.
Flooding Flooding carries many pollutants into streams and rivers. Write down which flooding frequency category the soil is listed as. The categories “occasional,” “frequent,” and “very frequent” are soils that have the possibility to be flooded. High Water Table Depth Many soils in Indiana have a high water table and need to be drained for optimal crop production. Artificially drained land has the potential for nitrates to leach with the drained water, which is then channeled directly into ditches and streams. Soils that have high water table depths of less than 2.0 feet are usually drained. Use a checkmark if the first number listed in the high water table column of the Soil Survey is less than 2.0 feet. The best way to learn about your watershed is to observe the landscape by driving, biking, or walking. By using the table you just completed: What is the major hydrologic group in the watershed?
__________________________
How much land frequently or occasionally floods?
__________________________
How much land may be artificially drained?
________________________
40
Tier 2 The following questions will give a more in-depth look at the agricultural activities that have potential water quality impacts in the watershed. Windshield Survey You can learn many things from looking at maps of the area, but there is no substitute for seeing it yourself. By driving around your watershed you will gain first hand knowledge of where resources are located and possible pollution sources.
On the map labeled “Agriculture, Wetlands, and Forest,” plan the routes you will take. You can then use this map while driving to mark locations. Avoid heavily traveled roads when possible, as you will frequently be slowing down or stopping. Depending on the age of the topographical map, some road names may have changed. The work will be much easier if at least two people drive together. One drives while the other observes and records observations.
The information used in the worksheets on the following pages can be gathered by driving around your watershed and viewing the fields. The following steps will help you to complete the sheets:
1. Describe your starting location. 2. Look at each field and determine whether it is crop
(Table 46), pasture (Table 47), or other (Table 48). Then answer the questions for the corresponding table. If a stream runs next to or through the field also complete Table 49.
3. Describe your end location.
Copy the sheets and use as many times as necessary. The more fields you analyze the better an understanding you will obtain.
Cropland Management What to look for: Field status: Indicate “crop growing” if you see any plants, including seedlings. Indicate “no crop, tilled” if you do not see any crops growing but you can tell that a tillage implement has passed over the ground. “No crop, no tillage” is for fields that do not fall into the previous two categories. This includes harvested fields that have not been plowed.
Most recent crop type: If a crop is growing, indicate which type you believe it to be, or if the crop is too short to tell, indicate other. If the crop was harvested but you can tell what was present, indicate this also. If you cannot tell what type of crop is present, indicate unknown.
Tillage: Conservation tillage is any tillage or planting system with 30% or more residue remaining on the soil surface after planting which reduces soil erosion by water. This includes no-till, ridge-till, mulch-till, etc. Conventional tillage leaves less residue on the surface and usually includes several passes with an implement.
Grassed waterways: Grassed waterways are shallow channels in a field that have grass growing in them. These are used to channel water off of the field. They slow the water and allow sediment to settle out of the runoff.
Signs of erosion: Signs of erosion include bare soil that is seen with rills or gullies forming in it. Rills are small channels that have been carved out by the water and gullies are larger versions of these.
Field slope: Try and describe the field using the descriptive terms given. The following values correspond to the descriptions: Nearly Level: 0-3% grade, Gently Sloping 4-8% grade, Rolling 8-16% grade, Hilly 16-30%, grade, Steep >30% grade.

41
Starting Point Location:
_____________________________________________
_____________________________________________
Ending Point Location:
_____________________________________________
_____________________________________________
Table 46: Cropland Management in the Watershed
Field status
Most recent crop type
Tillage Grassed waterways
Signs of erosion
Field slope Other comments
Fiel
d nu
mbe
r
Cro
p gr
owin
g
No
crop
, till
ed
No
crop
, no
tilla
ge
Cor
n
Soyb
ean
Oth
er
Unk
now
n
Con
serv
atio
n til
lage
Con
vent
iona
l till
age
Visi
ble
Not
vis
ible
Don
’t k
now
Yes
No
Don
’t k
now
Nea
rly
leve
l
Gen
tly sl
opin
g
Rol
ling
Hill
y
Stee
p
A1 ���� ���� ���� ���� ���� Flock of geese seen

42
Pasture What to look for: Animals present: Indicate if any of the listed livestock are present. If you see an animal that is not listed, indicate other and record the animal in the “Other comments” section.
Appearance of overgrazing: Overgrazing can cause severe erosion in a field. When you look at the field, look for trampled vegetation, bare spots, etc.
Signs of erosion: Signs of erosion are the same as for the cropland; however erosion can also be seen on the paths that livestock commonly travel.
Field slope: For the slope of the field try and describe it as best as possible. The same categories can be used as listed in the cropland management section above.
Table 47: Pasture Fields
Animals present Appearance of overgrazing
Signs of erosion
Field slope Other comments
Fiel
d nu
mbe
r
Swin
e D
airy
cat
tle
Beef
cat
tle
Hor
ses
Oth
er
Bare
soil
Tram
pled
veg
etat
ion
Oth
er
No
Yes
No
Don
’t k
now
Nea
rly
leve
l
Gen
tly sl
opin
g
Rol
ling
Hill
y
Stee
p
A2 ���� ���� ���� ���� Stream flowing through field

43
Other Uses Use the following table to write down what you see on the fields if they do not fall into the cropland or pasture categories.
Table 48: Other Fields
Field number Other comments
A3 3 large turkey barns seen
Stream What to look for: Buffer strips: Indicate if a buffer exists between the field and the stream. Buffers include trees, grasses, etc. They do not include crops.
Vegetation: If the buffer does exist, indicate of what type of vegetation it is composed.
Riparian buffer width: Also indicate the width of the buffer.
Animal access: Animals can cause streambank erosion, pollute streams, and damage streambeds. Fences can be used to restrict their access. Indicate if the animals have access to the stream.
Streambank erosion: Streambank erosion includes areas where the banks appear to be falling into the stream.
Table 49: Fields with Streams
Riparian buffer
Buffer vegeta-tion
Riparian buffer width Animal access
Stream-bank erosion
Other comments
Fiel
d nu
mbe
r
Yes
N
o D
on’t
kno
w
Tree
s
Shru
bs
Gra
sses
1-30
ft w
ide
30-1
00 ft
wid
e
> 10
0 ft
wid
e
Yes
No
Don
’t k
now
Not
app
licab
le
Yes
No
Don
’t k
now
A2 ���� ���� ���� ���� Buffer present, but cattle trampling

44
Now that you have completed the windshield survey questions, answer the following questions. Cropland Management in the Watershed
How many of the observed fields use conservation tillage? ___________________________ How many fields had signs of erosion? ____________________________________________
Pasture Fields How many of the fields had bare soil visible? __________________________ How many had trampled vegetation? ___________________________ How many had signs of erosion? ___________________________________ Fields with Streams How many of the fields did not have buffers? __________________________ How many had a buffer width of 30-100 ft? ____________________________ How many had a buffer width of over 100 ft? ___________________________ How many of the fields allowed animals direct access to the streams? _______________ How many sites had visible streambank erosion? ____________________________

45
Assessment 7: ForestAssessment 7: ForestAssessment 7: ForestAssessment 7: Forest Forested land in a watershed protects water quality in many ways. Tree canopies slow down raindrops, allowing more time for infiltration to occur. The roots of the trees help to hold soil in place, reducing erosion. Overall, areas that are forested usually have better water quality than areas that are not. Knowing the amount of forested land in a watershed will help you to determine how much land is protected by this low-impact land use. However, logging of forested land can be very detrimental to the water quality. Improperly-sited roads, large areas of bare soil, and machinery in streams can adversely impact a stream. Bare soil does not have any protection from the rain and therefore has a greater potential to erode. Roads too close to sensitive areas cause sedimentation due to frequent erosion. Heavy machinery in a stream can destroy the aquatic ecosystem. Tier 1 Tier 1 focuses on determining the amount of public and private forest land in your watershed. Public-owned forest land is less likely to be disturbed by practices such as logging than privately-owned land. Public land includes national and state forests, local parks, and recreation areas. In the Assessment 3: Land Use Overview you estimated the amount of forested land in the watershed. Now, try to determine how much of this is public land. The topographic map on which you have delineated your watershed should have public land marked.
Table 50: Public Land
Name of state/national forest, park, or recreational area
Acres
Happy City Park 185
Tier 2 Tier 2 addresses logging that may be occurring in your watershed.Because logging operators are not required to report their logging operations, the amount of logging occurring within your watershed can only be estimated by observing when driving around the watershed. Record any logging that you see and estimate the amount of land being harvested. Use the copy of your topographic map labeled “Agriculture, Wetlands, and Forest” and label the logging sites on the map. To label the sites use the L and the site number. For example label the first logging site you see “L1.”
Table 51: Logging Sites
Site Location Area
L1 Corner of 350 W and 600 N 15

46
The following questions will help you determine if the logging operation could be adversely affecting your watershed’s health. If the logging operation is on public land, you cannot go onto the site. If the land is privately owned, you must obtain the owner’s permission to view the site. Answer the questions as well as you can without trespassing. You may need to talk to the logging operators to answer all the questions.
Sensitive Areas: Are the roads impacting sensitive areas such as streams, lakes, ponds, wetlands, or gullies?
Steeply Sloped: Are the roads built on land that is steeply sloping for more than 300 feet? If this occurs the road is more susceptible to erosion.
Machinery in stream: Do you see any indication that machinery has been in the stream? Machinery should not be in the stream unless it is to construct a crossing over the stream. Even then, it should be kept to a minimum.
Riparian areas disturbed: Is the riparian area being disturbed? A riparian area is the land along side a sensitive area that should be left undisturbed.
Fuels stored and used properly: Are the fuels, lubricants, or other hazardous material being used or stored near any sensitive areas?
Table 52: Logging Observations
Sensitive areas?
Steeply sloped?
Machinery in stream?
Riparian areas disturbed?
Fuels stored and used properly?
Site
Yes
No
Don
’t
know
Y
es
No
Yes
No
Yes
No
Yes
No
Don
’t
know
Other comments
L1 ���� ���� ���� ���� ���� Could not see any fuel storage

47
Assessment 8: Mining Assessment 8: Mining Assessment 8: Mining Assessment 8: Mining Coal mining is a large part of the economy in southwest Indiana. Most abandoned and unreclaimed mines were in operation before laws were in effect to treat their runoff. Newer mines can also adversely affect water quality in a watershed if the operators do not follow the current state laws. Runoff from the bare soil can carry away the sediment, depositing it into streams and lakes. The water can also be very acidic which affects aquatic organisms. Tier 1 helps you determine the types of mines and where they are located in the watershed. Tier 2 requires observing the various mine sites to determine if they are adversely impacting your watershed. Tier 1 Active Mines If mining is common in your watershed your local SWCD or the IDNR’s Division of Reclamation can help you to determine the active mines in the watershed. Since there may be several hundred mines in your watershed, focus on the ones that have the most impact on the watershed. Using your map labeled “Streams & Mining” mark their locations. Label the sites using AM and the site number. For example for active mining site 3, label it “AM3.”
Table 53: Active Mines
Site Name Location Area (acres)
AM1 Blackheart Mine Along Hwy 335 300
Abandoned and Unreclaimed Mines Unfortunately, some mining practices of the past created conditions that can threaten the environment. The effects of these practices have existed for a long time and unless they are reclaimed, their effects will continue to be seen. Some problems associated with abandoned and unreclaimed mines that can affect your watershed are acidic drainage, sinkholes, and toxic materials. Using your map labeled “Streams & Mining” mark their locations. Label the sites using AUM and the site number.
Table 54: Abandoned and Unreclaimed Mines
Site Name Location Area (acres)
AUM1 Unknown Along 350 N 150
Reclaimed Mines The Indiana Department of Natural Resource’s Division of Reclamation is working to reclaim abandoned or unreclaimed sites in Indiana. However, while they are being reclaimed, they still have the possibility to affect the watershed. Also, the years of damage that they caused may still be seen in the watershed. Using your map labeled “Streams & Mining” mark their locations. Label the sites using RM and the site number.

48
Table 55: Reclaimed Mines
Site Name Location Area (acres)
RM1 Rock Coal Mine North of Happy Park
75
Tier 2 Observations The following questions will help you to gain a better understanding of the mining operations in your watershed. These questions should be answered by driving around and viewing the sites and talking to the operators. Abandoned/unreclaimed mines may be too
dangerous to observe, so you may need to contact the IDNR’s Division of Reclamation for more information about those sites. Ponds: Indicate whether or not you see a sedimentation pond on site. Active mines are required to direct surface water (drainage from a disturbed area), through a sediment pond prior to discharge. If it is an abandoned/unreclaimed mine the pond is probably not functioning as it should. Indicate “don’t know” if you cannot see the entire site and are unsure if there is a pond on another portion of the property. Outflow: If a pond exists, is the outflow from the pond fairly clear? The sediment should have settled in the pond and the water should appear sediment free. Pond Erosion: There should be no evidence of erosion on the banks of the pond. Indicate whether or not you see any. Erosion: There should be some form of erosion control measures in place to stop erosion. Indicate if you see any sediment leaving the site.
Table 56: Mine Observations
Ponds Outflow Pond erosion Erosion
Site
Yes
No
Don
’t
Kno
w
Yes
No
Yes
No
Yes
No
Other comments
AM1 ���� ���� ���� ����

49
What’s Next?What’s Next?What’s Next?What’s Next? Now that you have completed your assessment of the watershed, what should you do next? The next step would be to analyze your results to determine what problems are in the watershed. The questions below should be used to help you compile your results. From this, you should see any problems in the watersheds that will need to be addressed. What are the major land uses in your watershed?
Are there certain areas where you believe these land uses are adversely affecting water quality in your watershed?
Why or how are they impacting your watershed?
Do the streams have adequate riparian areas to help protect them?
Which streams do you feel need more riparian areas?
What can be done to address the concerns you have identified? Who can you contact for assistance in addressing the identified concerns?