WaterRF Webcast - Dec 13 2011 - Final€¢ Determination of acceptable sampling protocols for each...
25
12/13/2011 1 Evaluation of analytical methods for EDCs and PPCPs via interlaboratory comparison WaterRF webcast December 13, 2011 Jörg Drewes Christianne Hoppe-Jones Colorado School of Mines Andrew Eaton Ali Haghani MWH Laboratories Yingbo Guo Shane Snyder University of Arizona Thomas Ternes Michael Schluesener German Federal Institute of Hydrology Curtis Wood Brett Vanderford Southern Nevada Water Authority Yingbo Guo Metropolitan Water District of Southern California Curtis Wood Environmental Resource Associates Project description – WaterRF 4167 • Objective The objective of this project was to evaluate existing methods for the analysis of EDCs and PPCPs at low part-per-trillion (ppt) detection levels in water and provide analytical guidelines for future work. • Research approach • Literature review and laboratory questionnaire • Literature review and laboratory questionnaire • Determine acceptable sampling protocols for each compound • Sample bottle • Quenching agent • Preservation agent • Hold time • Perform blind interlaboratory comparisons to evaluate current “state of the union” and identify factors that lead to best results for each compound/method • Rigorously test final method in various matrices by multiple laboratories to validate and ensure id f li ti wide scope of application • Develop conclusions and final report
Transcript of WaterRF Webcast - Dec 13 2011 - Final€¢ Determination of acceptable sampling protocols for each...

12/13/2011
1
Evaluation of analytical methods for EDCs and PPCPs via interlaboratory comparison
WaterRF webcast
December 13, 2011
Jörg DrewesChristianne Hoppe-Jones
Colorado School of Mines
Andrew EatonAli Haghani
MWH Laboratories
Yingbo Guo
Shane SnyderUniversity of Arizona
Thomas TernesMichael Schluesener
German Federal Institute of Hydrology
Curtis Wood
Brett VanderfordSouthern Nevada Water Authority
Yingbo GuoMetropolitan Water District of Southern California
Curtis WoodEnvironmental Resource Associates
Project description – WaterRF 4167
• Objective
The objective of this project was to evaluate existing methods for the analysis of EDCs and PPCPs at low part-per-trillion (ppt) detection levels in water and provide analytical guidelines for future work.
• Research approach
• Literature review and laboratory questionnaire• Literature review and laboratory questionnaire
• Determine acceptable sampling protocols for each compound
• Sample bottle
• Quenching agent
• Preservation agent
• Hold time
• Perform blind interlaboratory comparisons to evaluate current “state of the union” and identify factors that lead to best results for each compound/method
• Rigorously test final method in various matrices by multiple laboratories to validate and ensure id f li tiwide scope of application
• Develop conclusions and final report

12/13/2011
2
Project team
• Principal laboratories (5)
• PI - SNWA (Brett Vanderford)
• co-PI laboratories
• MWH Laboratories (Andy Eaton, Ali Haghani)
• Metropolitan Water District of Southern California (Carrie Guo)
• Colorado School of Mines (Jörg Drewes, Christiane Hoppe-Jones)
• German Federal Institute of Hydrology (Thomas Ternes, Michael Schluesener)
• Participate in interlaboratory comparisons
• Involved in method validation later in project
• Data analysis
• Participating laboratories (20)
• Participate only in interlaboratory comparisons
• Environmental Resource Associates (co-PI)
• Disinterested third party (not participating in interlaboratory comparisons)
• Prepare test materials for interlaboratory comparisons
• Collect and interpret data from comparisons
Participating laboratories
• United States
• City of Scottsdale, Arizona
• Colorado School of Mines
• Columbia Analytical Services
Fl id I t ti l U i it
• Canada
• Axys Analytical
• Environment Canada
• Maxxam Analytics
T t U i it• Florida International University
• Illinois Waste Management Research Center
• Los Angeles County Sanitation District
• Metropolitan Water District of So. Cal.
• MWH Laboratories
• Orange County Sanitation District
• Orange County Water District
• Southern Nevada Water Authority
• Underwriters Laboratories
• Trent University
• Europe
• German Federal Institute of Hydrology
• Australia
• CSIRO
• Queensland HFSS
• University of New South Wales• University at Buffalo
• University of Arizona
• University of Colorado, Boulder
• University of Iowa Hygienic Laboratories
• Weck Laboratories
University of New South Wales

12/13/2011
3
Target compound list
• Reasons for selectionReasons for selection• Occurrence and fate (esp. drinking water)• Past studies (AwwaRF #2758, AwwaRF #3033, AwwaRF #3085, WRF 03-014)• Use/sales• Inclusion on other lists produced by various panels/authorities (GWRC)• Methods published by government agencies (EPA 1694 and 1698)• Unregulated, emerging contaminants with no standardized or rigorously validated methods• Capability of participating laboratories

12/13/2011
4
• Literature review and laboratory questionnaire
• Determination of acceptable sampling protocols for each compound
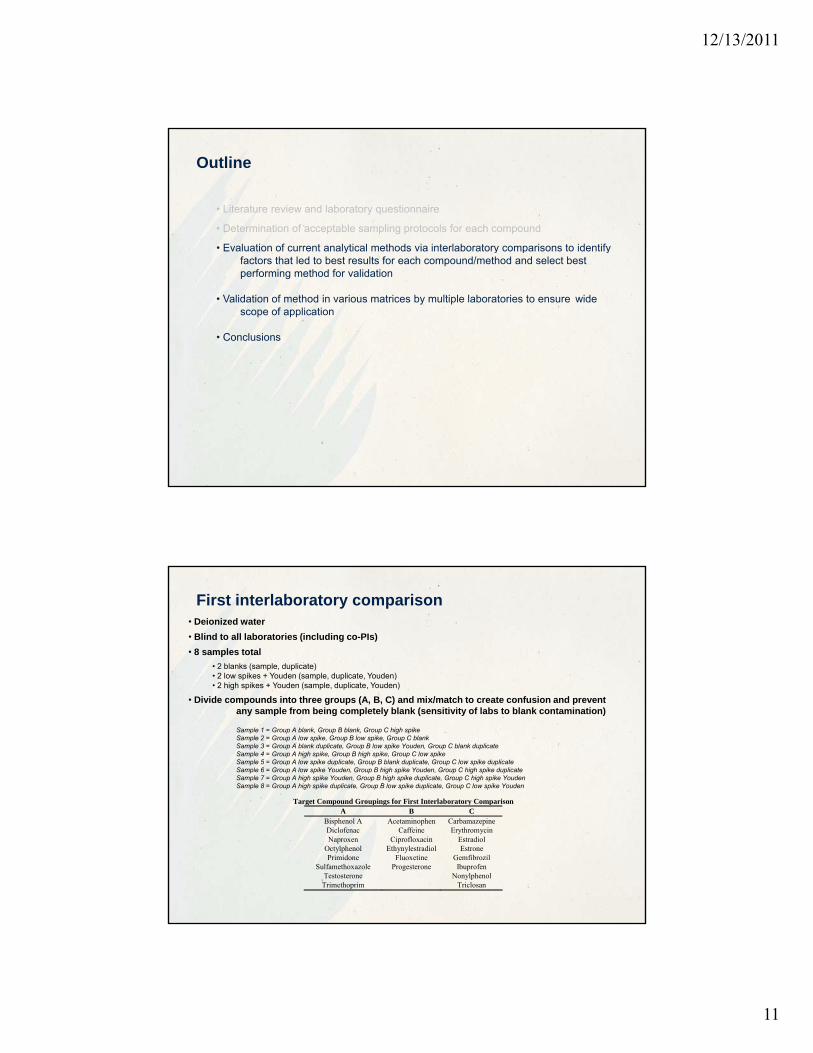
• Evaluation of current analytical methods via interlaboratory comparisons to identify
Outline
• Evaluation of current analytical methods via interlaboratory comparisons to identify factors that led to best results for each compound/method and select best performing method for validation
• Validation of method in various matrices by multiple laboratories to ensure wide scope of application
• Conclusions
Literature review and questionnaire
• Literature review• Focused on methods for aqueous matrices (WW effluent and
“cleaner”) with LOQs < 1 µg/L in peer-reviewed journals
• PPCPs (90 papers)
• Steroids (36 papers)
• Alkylphenols (13 papers)
• Questionnaire• Experience• Sample collection• Preservation• Standard preparation• Sample preparation
A l i• Analysis parameters• Compound parameters• LOD/LOQ• QA/QC• Other

12/13/2011
5
Participant summary
• Laboratory experience (at beginning of study)• <12 months – 14
• 12 – 24 months – 14
• >24 months – 21
• Analyst experience (at beginning of study)
• Extraction type• SPE – 46
• Resin
• Strata X – 3
• HLB – 37Analyst experience (at beginning of study)• <12 months – 13
• 12 – 24 months – 19
• >24 months – 17
• Method basis• In-house – 13
• EPA 1694 (w/ and w/o mods) – 3
• Other standardized methods (w/ and w/o mods) – 2
• Literature (w and w/o mods) – 30
• C18 – 3
• Bond Elut/MAX/MCX – 1
• Elution solvent
• Methanol – 9
• ACN – 2
• Acetone – 4
• DCM – 1
• EA – 2
• Combination – 28• Combination – 1
• Instrument type• GC-MS – 8
• LC-MS – 1
• LC-MS/MS – 39
• LC-TOF-MS – 1
Combination 28
• Liq/liq - 3
• Calibration type• External – 4
• Internal – 24
• Isotope dilution – 43
• Combinations – 22
• Literature review and laboratory questionnaire
• Determination of acceptable sampling protocols for each compound
• Evaluation of current analytical methods via interlaboratory comparisons to identify
Outline
• Evaluation of current analytical methods via interlaboratory comparisons to identify factors that led to best results for each compound/method and select best performing method for validation
• Validation of method in various matrices by multiple laboratories to ensure wide scope of application
• Conclusions

12/13/2011
6
Sample collection/preservation studies• Parameters
• Bottle type• Amber glass• Amber silanized glass• Clear glass• HDPE plastic (translucent)
• Quenching agent• Ascorbic acid• Sodium thiosulfate• Sodium sulfite
• Preservation agent• 25C• 4 C• -20 C• Sodium azide at 25 C• Sodium azide at 4 C• Sulfuric acid at 25 C• Sulfuric acid at 25 C• Sulfuric acid at 4 C• Sodium omadine
• Hold time study (28 day and 72 hour)• DI• Surface water• Drinking water
Sample collection/preservation studies
• Statistical analysis
• Normalized to control
• One-way ANOVA
• F-test (ratio of between-group variance to within-group variance)
• Higher the F ratio more likely the groups are different• Higher the F ratio, more likely the groups are different
• 95% confidence level
• Determines whether any means are significantly different from the rest
• Tukey’s HSD test
• Compares means of parameters at 95% confidence level (5% chance of calling means different when they are actually the same)
• Assigns parameters to homogenous groups
• If mean of homogenous group outside ±15% window, parameters in group not recommended for use
• Example: Fluoxetine bottles• Example: Fluoxetine – bottles
ANOVA Table for Recovery by Bottle Type Source Sum of Squares Df Mean Square F-Ratio P-Value Between groups 1068.13 3 356.044 17.14 0.0000 Within groups 415.451 20 20.7725 Total (Corr.) 1483.58 23
Method: 95.0 percent Tukey HSD Bottle Type Count Mean Homogeneous Groups Silanized 6 76.2463 X Plastic 6 87.5073 X Clear 6 88.8411 X Amber 6 94.6725 X

12/13/2011
7
Sample bottle studies
• Materials and methods
• Amber glass, silanized amber glass, clear glass, clear HDPE
• Deionized water
• 6 spiked replicates, 3 blanks
S ik t i d d di th d d• Spike amount varied depending on the compound and available method
• Ranged from 10 ng/L to 10 μg/L, most were 25 ng/L
• Analysis methods
• Isotope dilution LC-MS/MS
• Direct injection methods used for compounds that were not on SNWA target list
• Sample stored for 14 days at 4°C
• No control
• Results compared to contemporary DI spikes (LFBs)
Sample bottle studies
80
100
120
140
t recovery
Amber glass
Silanized amber glass
Clear glass
Clear HPDE
0
20
40
60
80
Normalized
percent
12/13/2011
8
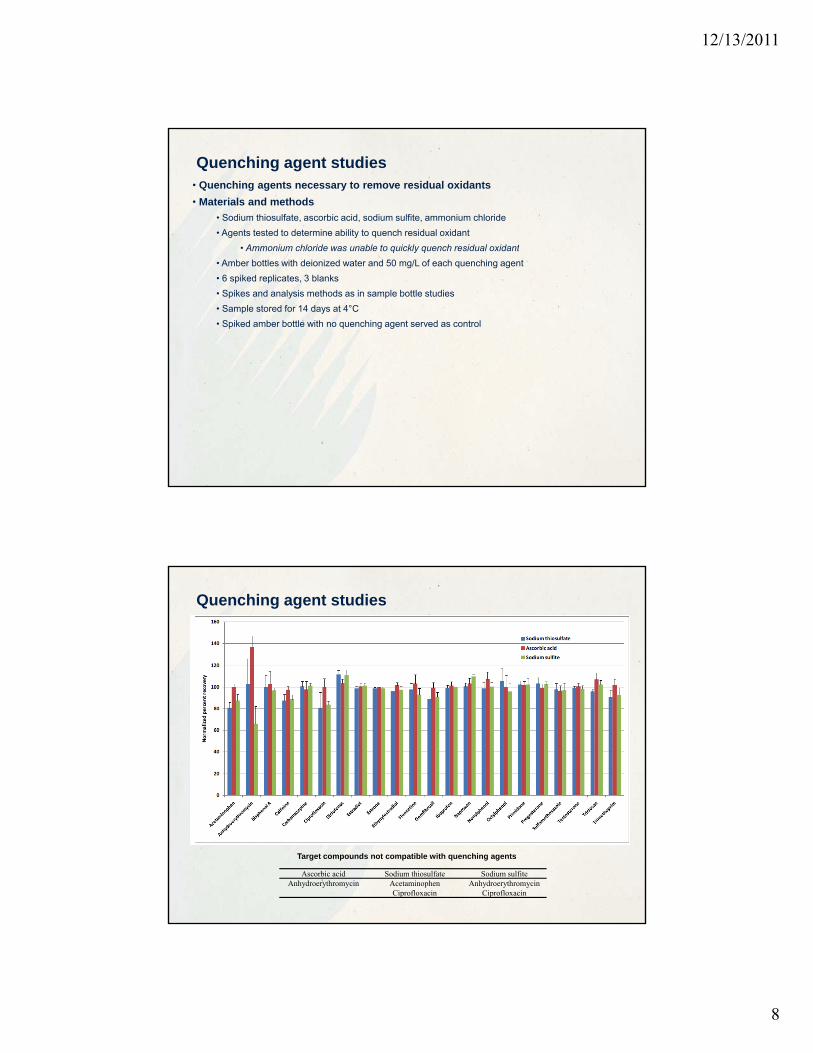
Quenching agent studies• Quenching agents necessary to remove residual oxidants
• Materials and methods
• Sodium thiosulfate, ascorbic acid, sodium sulfite, ammonium chloride
• Agents tested to determine ability to quench residual oxidant
• Ammonium chloride was unable to quickly quench residual oxidant• Ammonium chloride was unable to quickly quench residual oxidant
• Amber bottles with deionized water and 50 mg/L of each quenching agent
• 6 spiked replicates, 3 blanks
• Spikes and analysis methods as in sample bottle studies
• Sample stored for 14 days at 4°C
• Spiked amber bottle with no quenching agent served as control
Quenching agent studies
Ascorbic acid Sodium thiosulfate Sodium sulfiteAnhydroerythromycin Acetaminophen Anhydroerythromycin
Ciprofloxacin Ciprofloxacin
Target compounds not compatible with quenching agents

12/13/2011
9
Sample preservation studies
• Some target compounds have been shown to degrade in water samples
• Materials and methods
• 25°C, 4°C, -20°C, sodium azide 25°C, sodium azide 4°C, sulfuric acid 25°C, sulfuric acid 4°C
• Sodium azide at 1 g/L and sulfuric acid to pH <2
• Amber bottles with water from Lake Mead, NV (previously shown to degrade target compounds)
• 6 spiked replicates
• Spikes and analysis methods as in sample bottle studies
• Sample stored for 28+ days (28 – 35 days due to logistics of extracting so many samples)
• Spiked sample matrix that was extracted immediately served as t=0 control
• Observations
• For many compounds, 25°C was acceptable
• Estrone degraded into estradiol in 25°C
• Testosterone and progesterone completely degraded in 25°C and 4°C experiments
• Ciprofloxacin, nonylphenol, erythromycin were problematic
• Sodium azide at 4°C had least effect on target compounds
Storage test (28 day)
• Combined parameter hold time tests
• Materials and methods
• DI water, finished drinking water, surface water from Lake Mead (wastewater influence)
• 6 spiked replicates
• Samples quenched (DI, DW) and preserved (DI, DW, SW)
• Spikes and analysis methods as in sample bottle studies
• Sample stored for 28 days at 4°C
• Spiked sample matrix that was extracted immediately served as t=0 control
• Observations
• Most compounds showed excellent recoveries
• Ciprofloxacin and erythromycin had low recoveries
12/13/2011
10
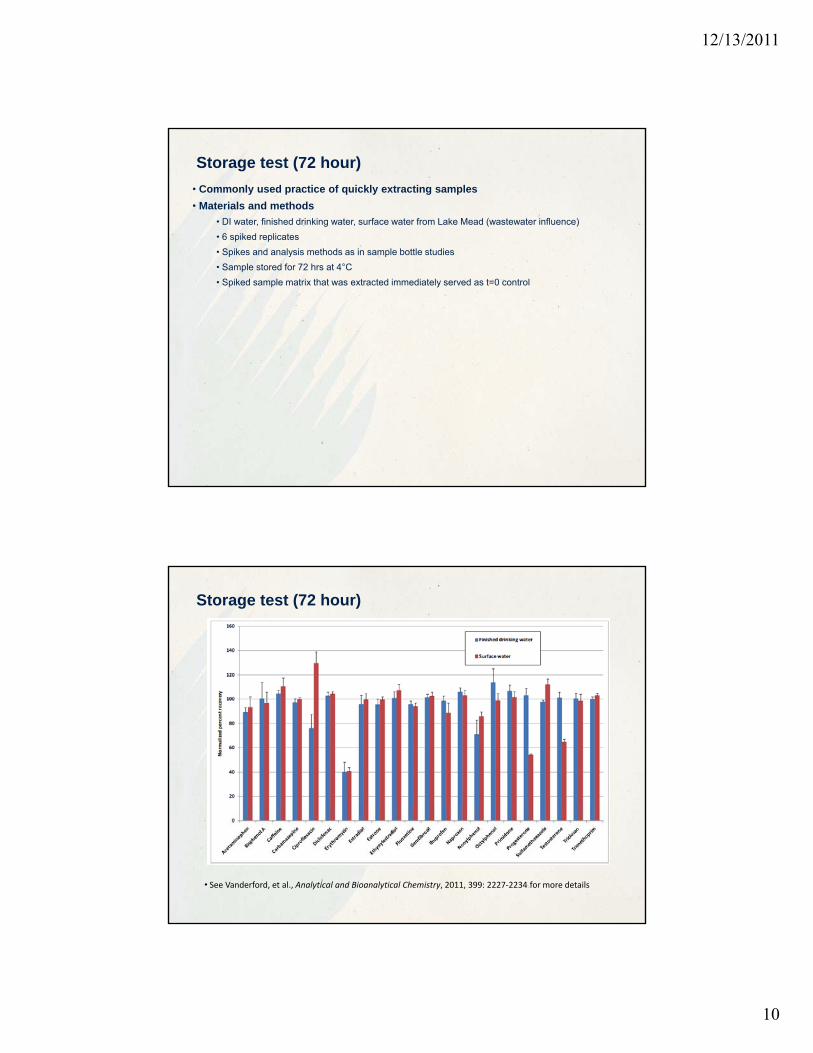
Storage test (72 hour)
• Commonly used practice of quickly extracting samples
• Materials and methods
• DI water, finished drinking water, surface water from Lake Mead (wastewater influence)
• 6 spiked replicates
• Spikes and analysis methods as in sample bottle studies
• Sample stored for 72 hrs at 4°C
• Spiked sample matrix that was extracted immediately served as t=0 control
Storage test (72 hour)
• See Vanderford, et al., Analytical and Bioanalytical Chemistry, 2011, 399: 2227‐2234 for more details
12/13/2011
11
• Literature review and laboratory questionnaire
• Determination of acceptable sampling protocols for each compound
• Evaluation of current analytical methods via interlaboratory comparisons to identify
Outline
• Evaluation of current analytical methods via interlaboratory comparisons to identify factors that led to best results for each compound/method and select best performing method for validation
• Validation of method in various matrices by multiple laboratories to ensure wide scope of application
• Conclusions
First interlaboratory comparison• Deionized water
• Blind to all laboratories (including co-PIs)
• 8 samples total
• 2 blanks (sample, duplicate)• 2 low spikes + Youden (sample, duplicate, Youden)• 2 high spikes + Youden (sample duplicate Youden)• 2 high spikes + Youden (sample, duplicate, Youden)
• Divide compounds into three groups (A, B, C) and mix/match to create confusion and prevent any sample from being completely blank (sensitivity of labs to blank contamination)
Sample 1 = Group A blank, Group B blank, Group C high spikeSample 2 = Group A low spike, Group B low spike, Group C blankSample 3 = Group A blank duplicate, Group B low spike Youden, Group C blank duplicateSample 4 = Group A high spike, Group B high spike, Group C low spikeSample 5 = Group A low spike duplicate, Group B blank duplicate, Group C low spike duplicateSample 6 = Group A low spike Youden, Group B high spike Youden, Group C high spike duplicateSample 7 = Group A high spike Youden, Group B high spike duplicate, Group C high spike YoudenSample 8 = Group A high spike duplicate, Group B low spike duplicate, Group C low spike Youden
Target Compound Groupings for First Interlaboratory Comparisong p p g y pA B C
Bisphenol A Acetaminophen Carbamazepine Diclofenac Caffeine Erythromycin Naproxen Ciprofloxacin Estradiol
Octylphenol Ethynylestradiol Estrone Primidone Fluoxetine Gemfibrozil
Sulfamethoxazole Progesterone Ibuprofen Testosterone Nonylphenol
Trimethoprim Triclosan

12/13/2011
12
First interlaboratory comparison• Low spike
• Environmentally relevant
• Sufficient number of methods able to analyze each
Spike amounts for first interlaboratory comparison (ng/L)
Target Compound LRBs Low LFB and Duplicate
Low Youden LFB
High LFB and Duplicate
High Youden LFB
Acetaminophen 0 38.3 34.4 110 98.8 Bisphenol A 0 29.4 26.4 752 677
• Arbitrary?• No standardized methods• No widely accepted levels
considered harmful to humans• No regulatory levels (MCL)
for guidance
• 75th percentile (n ≥ 7 for each compound)
• High Spike
pCaffeine 0 14.1 12.7 106 95.5
Carbamazepine 0 9.52 8.57 129 116 Ciprofloxacin 0 22.3 20.1 202 181
Diclofenac 0 13.4 12.1 160 144 Erythromycin 0 19.2 17.3 151 136 17β-Estradiol 0 7.96 7.16 130 117
Estrone 0 6.63 5.97 101 90.9 17α-Ethynylestradiol 0 9.98 8.98 71.3 64.2
Fluoxetine 0 10.5 9.49 89.1 80.2 Gemfibrozil 0 11.5 10.3 110 98.6
Ibuprofen 0 32.7 29.4 220 198 Naproxen 0 17.9 16.1 292 263
4-nonylphenol 0 79.2 71.3 594 535 4-tert-octylphenol 0 52.5 47.2 606 546
Primidone 0 7.19 6.47 58.9 53.0 Progesterone 0 9.75 8.78 54.6 49.1
• Set at ~ 5 – 25X the concentration of the low spike
• Included all methods except for a few extreme outliers
Sulfamethoxazole 0 11.6 10.4 159 144 Testosterone 0 10.5 9.45 55.0 49.5
Triclosan 0 26.0 23.4 210 189 Trimethoprim 0 9.48 8.53 49.7 44.7
Second interlaboratory comparison• Finished drinking water (pH 7.24, Alkalinity 130 mg/L, TOC 2.5 mg/L); collected in large containers,
shipped to ERA, quenched, homogenized, distributed and spiked
• Blind to all laboratories (including co-PIs)
• 8 samples total
• 1 DI blank and 1 unspiked DW• 1 low DI spike and 1 high DI spike• 2 low DW spikes (sample/duplicate) and 2 high DW spikes (sample/duplicate)• 2 low DW spikes (sample/duplicate) and 2 high DW spikes (sample/duplicate)
• Again divide samples into three groups
• Spikes similar to first round, but adjusted slightly
• Restek donated standards of all compounds to ERA/all laboratories
• Laboratories were asked not to change their methods, but notify if they did
Third interlaboratory comparison• Surface water (pH 8.50, Alkalinity 140 mg/L, TOC 2.9 mg/L) with WW influence (~5%)
• 8 samples total• 8 samples total
• 1 DI blank and 1 low spike DI• 2 Unspiked SW• 2 Low spike SW• 2 High spike SW
• Spiked at lower concentrations for most analytes to challenge methods
• Rest is same as second round
12/13/2011
13
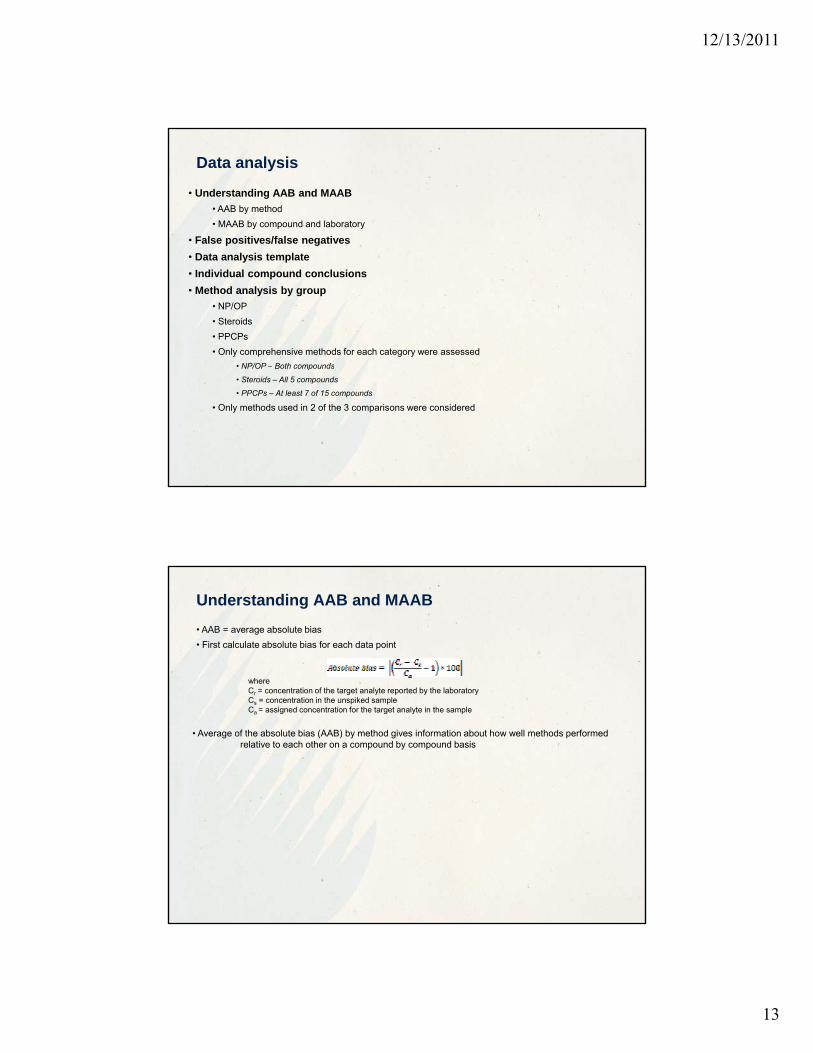
• Understanding AAB and MAAB
• AAB by method
• MAAB by compound and laboratory
• False positives/false negatives
Data analysis
• Data analysis template
• Individual compound conclusions
• Method analysis by group
• NP/OP
• Steroids
• PPCPs
• Only comprehensive methods for each category were assessed
• NP/OP – Both compoundsNP/OP Both compounds
• Steroids – All 5 compounds
• PPCPs – At least 7 of 15 compounds
• Only methods used in 2 of the 3 comparisons were considered
where
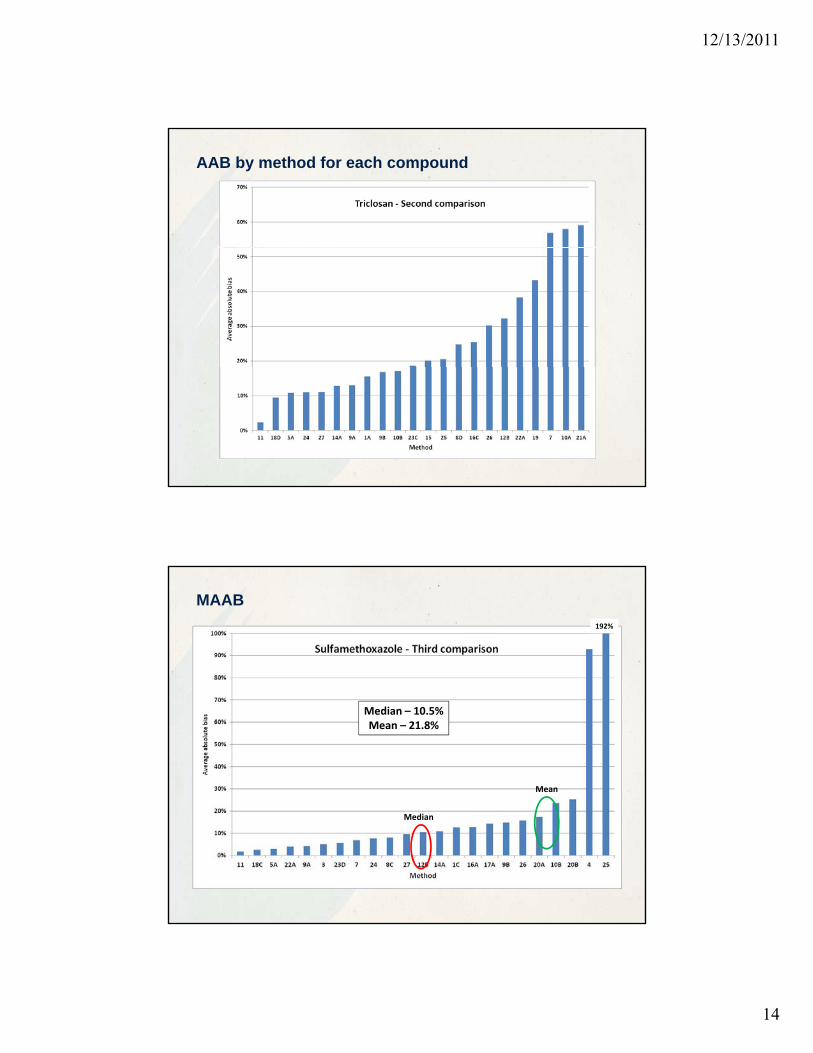
Understanding AAB and MAAB
• AAB = average absolute bias
• First calculate absolute bias for each data point
Cr = concentration of the target analyte reported by the laboratory Cs = concentration in the unspiked sampleCa = assigned concentration for the target analyte in the sample
• Average of the absolute bias (AAB) by method gives information about how well methods performed relative to each other on a compound by compound basis
12/13/2011
14
AAB by method for each compound
MAAB
192%
Median – 10.5%Mean – 21.8%
Mean
Median

12/13/2011
15
where
Understanding AAB and MAAB
• AAB = average absolute bias
• First calculate absolute bias for each data point
Cr = concentration of the target analyte reported by the laboratory Cs = concentration in the unspiked sampleCa = assigned concentration for the target analyte in the sample
• Average of the absolute bias (AAB) by method gives information about how well methods performed relative to each other on a compound by compound basis
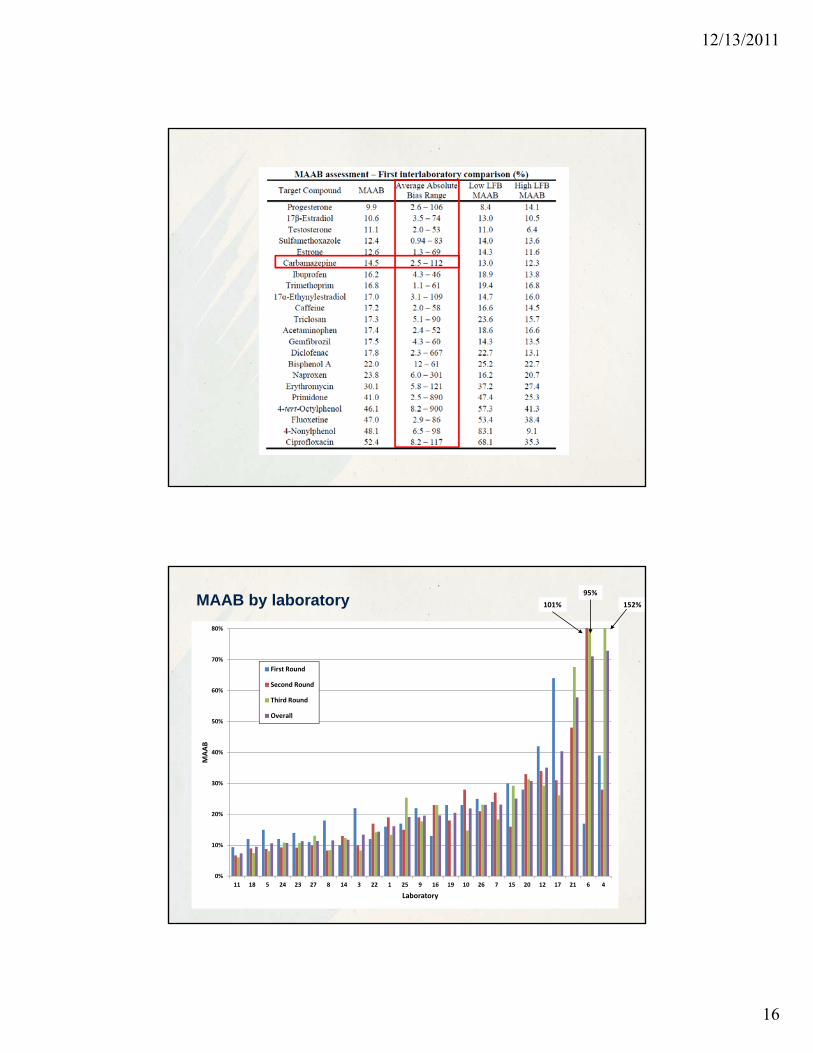
• Median of the average absolute bias (MAAB)
• By compound gives information on how difficult compounds were to analyze relative to each other
• By laboratory/method gives information on how well laboratories as a whole and individual• By laboratory/method gives information on how well laboratories, as a whole, and individual methods performed relative to each other
MAAB by compound
12/13/2011
16
70%
80%
First Round
Second Round
MAAB by laboratory 101%
95%
152%
30%
40%
50%
60%
MAAB
Second Round
Third Round
Overall
0%
10%
20%
11 18 5 24 23 27 8 14 3 22 1 25 9 16 19 10 26 7 15 20 12 17 21 6 4
Laboratory

12/13/2011
17
False positives and false negatives
Data analysis template
• Errors/omissions/discrepancies
• Non-detects
• Summary statistics by sample
Caffeine - Low LFBs
Sample 2
Sample 8• n, mean, median, mean and median
recovery, SD, %RSD
• Potential outlier identification
• Box-and-whiskers plots
• False positives
• Individual laboratory performance
• Determination of performance factors
• Experience, instrumental technique,
calibration ionization mode
Concentration (ng/L)
Sample 8
Sample 3
9 13 17 21 25 29
Caffeine - High LFBs
Sample 4calibration, ionization mode,
SPE parameters, etc.
• Recommendations for next round
Concentration (ng/L)
Sample 7
Sample 6
0 40 80 120 160 200 240

12/13/2011
18
• Understanding AAB and MAAB
• AAB by method
• MAAB by compound and laboratory
• False positives/false negatives
Data analysis
• Data analysis template
• Individual compound conclusions
• Method analysis by group
• NP/OP
• Steroids
• PPCPs
• Only comprehensive methods for each category were assessed
• NP/OP – Both compoundsNP/OP Both compounds
• Steroids – All 5 compounds
• PPCPs – At least 7 of 15 compounds
• Only methods used in 2 of the 3 comparisons were considered
12/13/2011
19
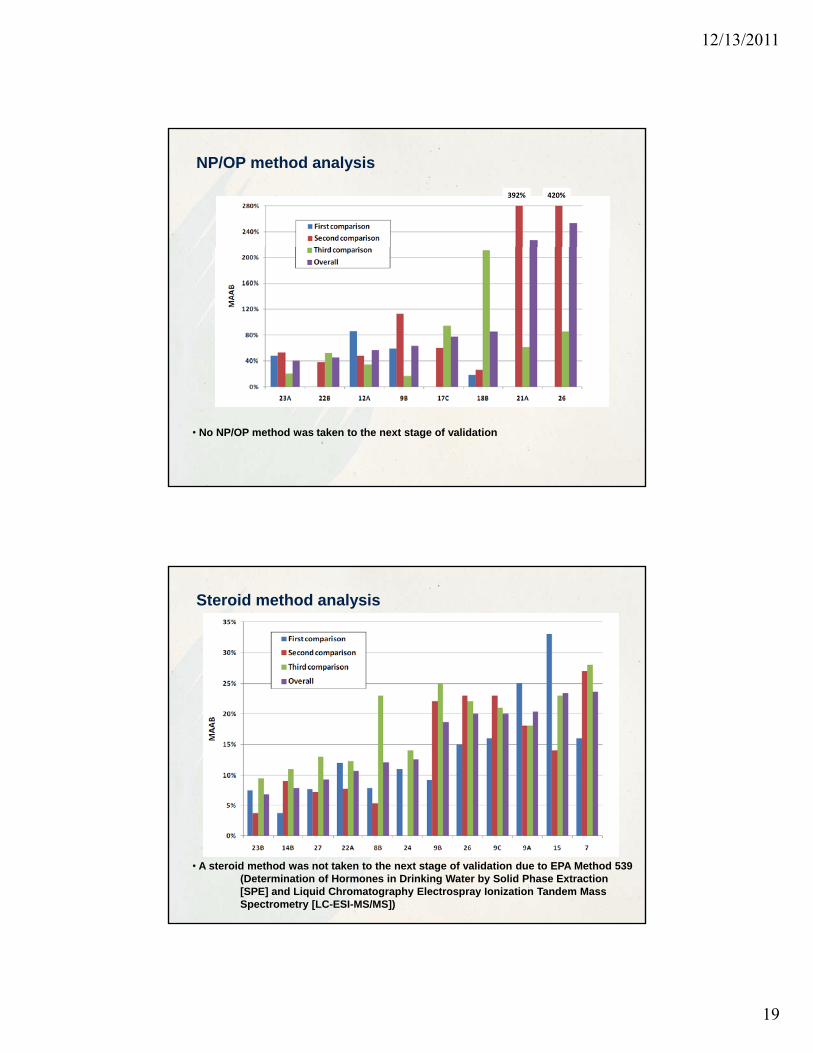
NP/OP method analysis
392% 420%
• No NP/OP method was taken to the next stage of validation
Steroid method analysis
• A steroid method was not taken to the next stage of validation due to EPA Method 539 (Determination of Hormones in Drinking Water by Solid Phase Extraction [SPE] and Liquid Chromatography Electrospray Ionization Tandem Mass Spectrometry [LC-ESI-MS/MS])

12/13/2011
20
PPCP method analysis
101% 152%
Method
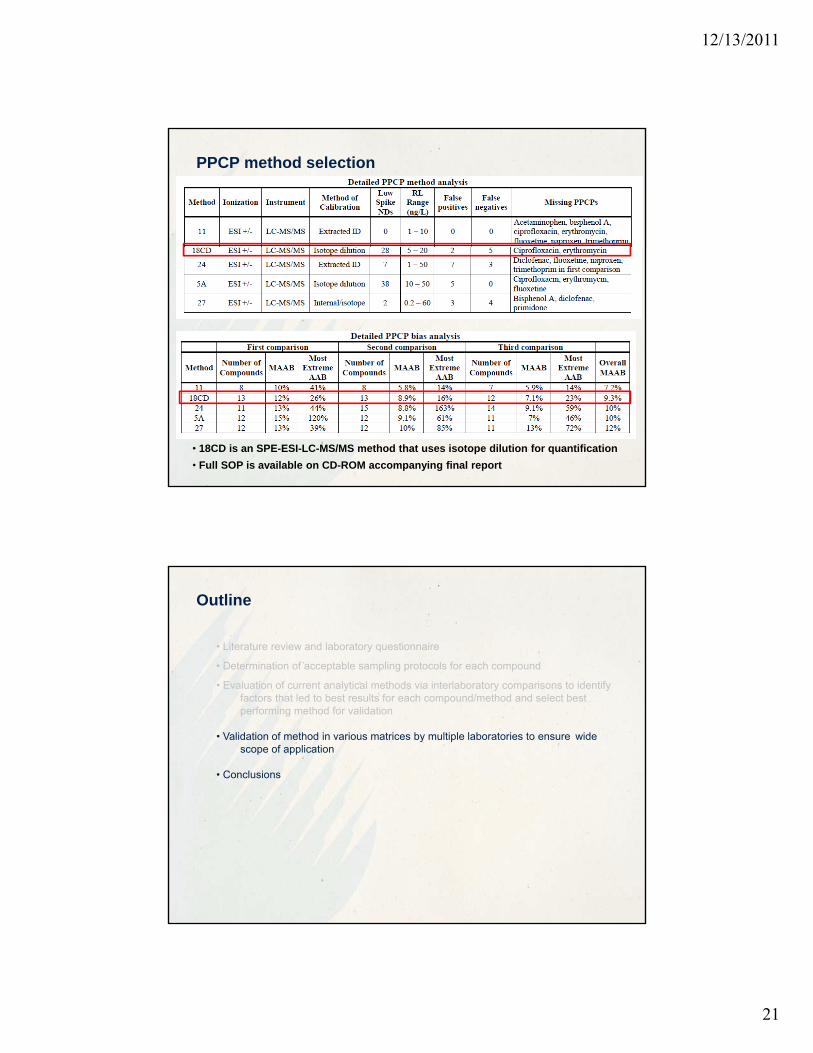
PPCP method selection
12/13/2011
21
PPCP method selection
• 18CD is an SPE-ESI-LC-MS/MS method that uses isotope dilution for quantification
• Full SOP is available on CD-ROM accompanying final report
• Literature review and laboratory questionnaire
• Determination of acceptable sampling protocols for each compound
• Evaluation of current analytical methods via interlaboratory comparisons to identify
Outline
• Evaluation of current analytical methods via interlaboratory comparisons to identify factors that led to best results for each compound/method and select best performing method for validation
• Validation of method in various matrices by multiple laboratories to ensure wide scope of application
• Conclusions

12/13/2011
22
• Method was implemented in six laboratories
• Followed validation of EPA Method 539
• Initial demonstration of capability
Method implementation and validation
• Initial demonstration of capability
• Low system background
• Acceptable accuracy and precision (6 laboratories)
• Tested 4 to 7 replicates of both DI water and DW from the local area
• Lowest concentration-minimum reporting level (LCMRL) determination (5 laboratories)
• Lowest true concentration for which future recovery is expected to fall between 50% and 150% with 99% confidence
• Four replicates in DI water at 7 different fortification levels plus blanks
• Fortification levels had to bracket the final LCMRL

12/13/2011
23

12/13/2011
24
Conclusions• Sample preservation
• Amber glass bottles, ascorbic acid, and sodium azide at 4°C worked well for this target list
• But other combinations may work depending on the compound
• HDPE not advisedHDPE not advised
• Compound of choice should be tested, difficult to predict
• Hold time of 72 hours at 4°C worked well for many compounds
• Interlaboratory comparisons
• Overall %RSDs for each compound were > 25% and half were > 40%
• Some compounds were more easily analyzed than others
• Nonylphenol, octylphenol, and ciprofloxacin were consistently difficult to analyze
• Ciprofloxacin was very difficult to analyze
• NP/OP need more refined methods and blank contamination was rampant
• As a group, steroids had the least bias
• Wide range of biases on every compound, even though MAAB may have been good
• Laboratories had wide range of performance, not dependent on # of compounds
• Standardized solutions improved performance at all levels (compound, method, laboratory) indicating standards play a role in performance for some compounds
• Interlaboratory comparisons (continued)
• False positive/negative rates were, in general, <10%
• Isotope dilution LC-MS/MS worked very well for most compounds on an individual basis
Conclusions (continued)
• Method analysis
• Satisfactory method could not be determined for NP/OP
• Steroid methods had the least bias
• LC-MS/MS with isotope dilution tended to give best results
• EPA Method 539 led to no method being validated for steroids
• Method 18CD, an SPE-LC-ESI-MS/MS was selected for validation
• Method validation
• IDCs met DQOsIDCs met DQOs
• <10% RSDs for nearly all laboratories/compounds
• 90 – 120% recoveries in DI water and drinking water
• LCMRLs were <10 ng/L for nearly all laboratories/compounds
• SOP will be included with WaterRF final report

12/13/2011
25
Acknowledgements• Water Research Foundation
• Dr. Hsiao-wen Chen, Research Manager• Michelle Suazo, Project Coordinator
• Project advisory committee
• Restek Corporation
• SNWA administrative and research staff
Thank youThank you!!