WATERFOWL BREEDING POPULATIONdnr.wi.gov/topic/WildlifeHabitat/documents/WaterfowlSurv.pdfMay 31,...
35
WATERFOWL BREEDING POPULATION SURVEY FOR WISCONSIN, 1973-2017 Wisconsin Department of Natural Resources Taylor Finger Bureau of Wildlife Management Trenton Rohrer Bureau of Wildlife Management Brian Dhuey Bureau of Wildlife Management June 2017
Transcript of WATERFOWL BREEDING POPULATIONdnr.wi.gov/topic/WildlifeHabitat/documents/WaterfowlSurv.pdfMay 31,...

WATERFOWL BREEDING POPULATION
SURVEY FOR WISCONSIN, 1973-2017
Wisconsin Department of Natural Resources
Taylor Finger
Bureau of Wildlife Management
Trenton Rohrer
Bureau of Wildlife Management
Brian Dhuey
Bureau of Wildlife Management
June 2017


TABLE OF CONTENTS
SURVEY INFORMATION ............................................................................................................ 1
ABSTRACT .................................................................................................................................. 2
INTRODUCTION and METHODS ................................................................................................ 4
RESULTS AND DISCUSSION ...................................................................................................... 6
Survey Timing/Weather ......................................................................................................... 6
Precipitation ........................................................................................................................... 5
Wetlands ................................................................................................................................ 7
Mallards ................................................................................................................................. 7
Blue-winged Teal ................................................................................................................... 8
Wood Ducks .......................................................................................................................... 9
Other Ducks ........................................................................................................................... 9
Total Ducks .......................................................................................................................... 10
Canada Geese ....................................................................................................................... 10
LITERATURE CITED .................................................................................................................. 12
Tables and Figures
Wisconsin Precipitation (Table 1) ................................................................................................. 13
Wetlands per Square Mile, 1973-2017 (Table 2) .......................................................................... 14
Breeding Waterfowl Population Estimates, 1973-2017 (Table 3) ................................................. 18
2017 Breeding Waterfowl Data (Table 4) ..................................................................................... 23
Transect Lines and Regions Surveyed (Figure 1) .......................................................................... 25
Climatology Divisions (Figure 2) .................................................................................................. 26
Mallard Population Estimates (Figure 3) ....................................................................................... 27
Blue-winged Teal Population Estimates (Figure 4) ....................................................................... 28
Wood Duck Populations Estimates (Figure 5) ............................................................................. 29
Total Breeding Duck Population Estimates (Figure 6).................................................................. 30
Canada Goose Population Estimates (Figure 7) ............................................................................ 31
1
TITLE: WATERFOWL BREEDING POPULATION SURVEY FOR WISCONSIN, 1973-2017.
STRATA SURVEYED: Southeast Central (SEC), Northern High Density (NHI), Northern Low
Density (NLO), and Southwest Driftless (SWD).
DATES: April 24 - May 7, 2017.
Air Survey: Completed in 11 days, spanning 12 days: April 24 – May 5.
Ground Survey: 11 days, spanning 13 days: Apr 25– May 7.
DATA SUPPLIED BY: Wisconsin Department of Natural Resources (WDNR) and U.S. Fish and
Wildlife Service (USFWS).
AERIAL CREWS:
North: Pilot – Larry Waskow
Observers – Natanya Hayden and Chris Cold
South: Pilot – Larry Waskow
Observers – Carrie Milestone and Taylor Finger
GROUND CREWS:
WDNR – Carlson, T., Carstens, J., Christel, N., Christopoulos, J, Dutack, N., Eilert, E., Grossman, E.,
Haffele, R., Hayden, N., Holcomb, A., Hopp, J., Huff, Jonas, S., Kelly, B., Matheys, D, McDonough,
R., Mogen, C., Morgan, K., Pritzl, J., Samerdyke, P., Samerdyke, R., Schrank, J., M., Soergel, M.,
Stefanski, B., Van Horn, K., Woodford, M.
USFWS – Engel, M., VanVreede, G.

2
ABSTRACT: The 2017 Waterfowl Breeding Population Survey for Wisconsin was conducted April
24- May 7 following methods of the North American waterfowl population survey. The information
from the survey is used as part of the overall survey of breeding waterfowl in North America as well as
in making state level waterfowl management decisions. This was the 44th consecutive year we have
conducted the survey. These data on Wisconsin waterfowl breeding populations are best interpreted as
trends viewed over several years rather than as year to year changes in waterfowl populations. Fall and
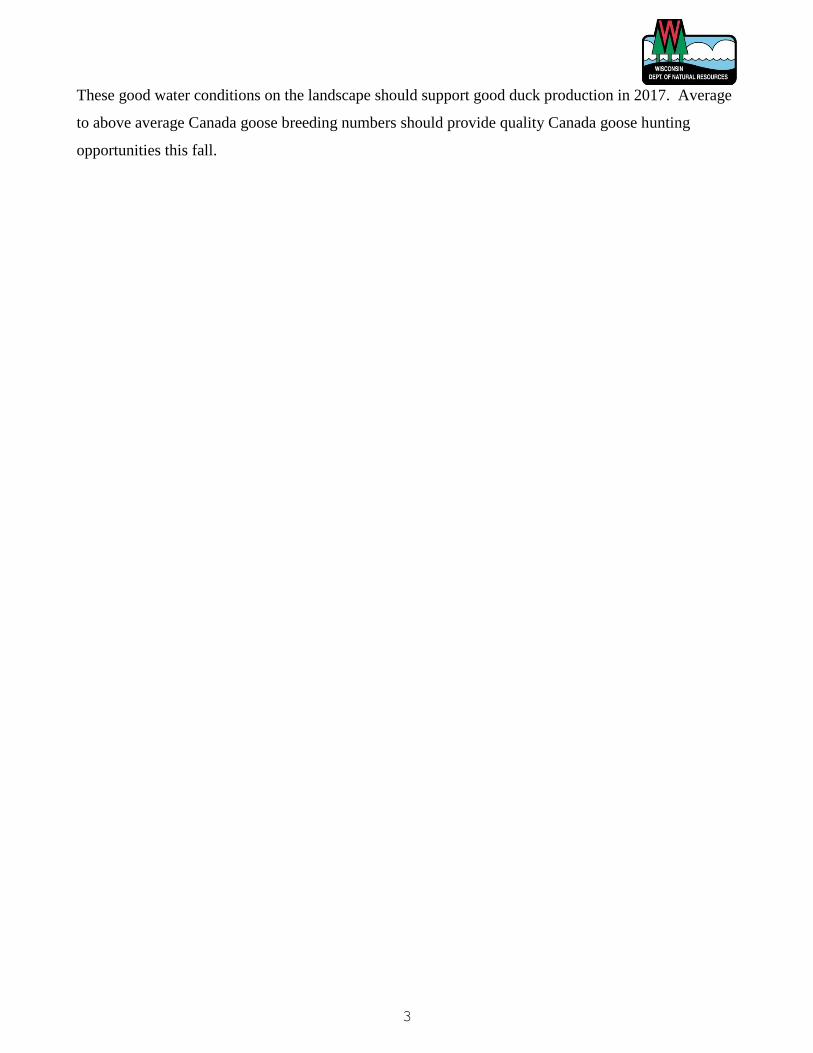
winter precipitation (Oct-Feb) was up throughout the state by 19% compared to the normal average
(1981-2010). Spring (March-May) precipitation ranged from normal to 56% above average in the
central and north to 22% above normal in the south. Overall, average statewide spring precipitation
was 39% above normal resulting in above average wetland conditions when considered in combination
with the 19% above average winter precipitation. Total non-linear wetland basins were: up 132% from
2016 in the SEC and 87% above the long-term (44-year) mean, up 40% from 2016 in the NHI and 16%
above the long-term mean, and up 80% from 2016 in the NLO and was 16% above the long-term
mean. In the SWD, which has less suitable waterfowl breeding habitat, non-linear basins were up
significantly this year, with 226% increase from 2016 and 100% above the 20 year (1997-2016) mean.
Total linear basins (streams and ditches) were: up 37% from 2016 and 22% above the long-term mean
in the SEC, up 9% from 2016 in the NHI and 3% above the long-term mean, up 19% in the NLO from
2016 and 1% above the long-term mean, and in the SWD were up 45% from 2016, and 28% above the
20-year mean. The total breeding duck population estimate of 479,099 is up 23% from the 2016
estimate of 390,498 and 9% above the long-term mean. Overall, the total duck population estimate for
2017 is higher than the last few years and similar to the total duck numbers experienced in the prior 10
years. The 2017 total mallard population estimate of 180,930 is up 10% from the 2016 estimate of
164,147 and is right at the long-term mean (44 years). The 2017 blue-winged teal breeding population
estimate of 85,526 is up 125% from 2016, but is still 20% below the long-term mean. At 102,397 the
2017 population estimate for wood ducks is up 14% from 2016 and 28% above the long-term mean.
We should always consider the continental perspective for migratory birds when interpreting local
surveys. Fortunately, in recent years the continental duck populations have been at all-time high
estimates. However, it is clear that our continued commitment to protecting wetland and grassland
habitat and regulating harvest impacts are both important to the future of Wisconsin breeding ducks.
The statewide breeding Canada goose population estimate of 158,023 is up 22% from 2016 and 64%
above the long-term (31-year) mean. The water conditions were above average prior to and during the
time of the survey, and we also experienced above average precipitation for the month of May
following the survey which improved wetland conditions even more for the brood-rearing period.
3
These good water conditions on the landscape should support good duck production in 2017. Average
to above average Canada goose breeding numbers should provide quality Canada goose hunting
opportunities this fall.

4
INTRODUCTION: Decisions regarding hunting season structure and harvest limits in waterfowl
management have a long history of being based in part upon spring breeding pair surveys. The US Fish
and Wildlife Service’s (USFWS) Waterfowl Breeding Population and Habitat Survey has been
conducted for 62 years across the traditional survey area of north-central United States, Canada and
Alaska. The Wisconsin Waterfowl Breeding Population Survey, which is modeled after the continental
survey, has been conducted for 44 years and provides a long-term measure of waterfowl breeding
trends in Wisconsin. These data are used at the national and state level for monitoring waterfowl
populations and making management decisions. Wisconsin’s breeding waterfowl survey data are
included in the Waterfowl Population Status Report published annually by the USFWS on continental
waterfowl populations. In addition, mallard data from Wisconsin, Minnesota, and Michigan are
combined with data from the traditional survey areas as a basis for the Adaptive Harvest Management
Report that is used to establish federal waterfowl season frameworks. At the state level, waterfowl
breeding survey data are used to establish annual hunting seasons, to identify long term changes in
species populations, and to evaluate the impact of habitat changes and management. This report
provides a summary and analysis of the 2017 survey data in support of these efforts.
METHODS: The breeding waterfowl survey in Wisconsin is a stratified double sampling scheme
patterned after the North American Waterfowl Breeding Population Survey developed by the USFWS
(Anon. 1977), but modified for local conditions (March et al. 1973). Fifty-five east-west aerial
transects, each 30 miles long and 1/4-mile-wide, were randomly selected in 1973 within 3 strata of
Wisconsin: SEC, NHI, and NLO, based on duck densities and habitat (Figure 1). These strata total
43,359 square miles. In 1997, we added eleven aerial transects within the unglaciated SWD stratum
(12,311 square miles) and included this stratum in our statewide population estimates. This area was
not surveyed prior to 1997 because of its low wetland density.
The 2017 aerial survey was conducted in 11 days, spanning 12 days (April 24-May 7) using a Cessna
182 aircraft, flying 80-85 mph at a maximum altitude of 200 feet. An observer recorded waterfowl data
from each side of the plane, with the observer on the north side of the plane recording the number and
type of wetland basins within a transect. Visibility correction factors (R) for waterfowl not seen by the
aerial crew were determined by counting waterfowl from the ground on segments (10-15 miles long)
of 26 transects. The aerial surveys are generally initiated in the southern part of Wisconsin with the
crews progressing to the northern transects. The ground surveys were done on 11 days that spanned

5
April 25-May 7. All but one of the ground counts were completed within 2 days of the air survey.
Thirty-two people from 2 agencies were involved in the planning and implementation of the survey.
Survey results separate mallards, blue-winged teal, wood ducks, and Canada geese. All other ducks are
pooled into a category of “other ducks”. By 2004, wood duck populations had increased to the point
where we were able to estimate them as a separate group rather than as part of "other ducks". This is
significant because it allows us to provide independent breeding population estimates for three of the
four duck species that constitute the majority of Wisconsin’s fall harvest. Visibility correction factors
(R) were calculated separately for each stratum-species group, but when the coefficient of variation
(CV) of R exceeded 20%, the estimate of R was considered unreliable and the data for R were pooled
for all strata (Bartelt and Gatti 1987). When the CV of R still exceeded 20% for the pooled strata, data
from prior years were iteratively added until the CV of R was below 20%.
This survey was not originally designed for surveying Wisconsin's resident Canada goose population.
If a survey were specifically designed for breeding Canada geese in Wisconsin, it would be conducted
earlier in the spring because of their earlier nesting chronology. Canada goose counts and population
estimates were not included in this report prior to 1986 because of the small sample size. However,
aerial counts of geese increased steadily from the mid-1980s through the early 2000’s, making survey
estimates useful indices to population trends of breeding Canada geese. Human-goose conflicts
resulting from a growing goose population increase the importance of tracking the population status of
breeding geese in Wisconsin.
The survey was designed to detect a 20% change in total ducks observed. The population estimates of
individual species groups have wider confidence intervals because of lower sample sizes and added
variability of R. Population estimates for waterfowl species in individual strata should be treated with
caution due to low sample sizes. Population estimates are most valuable when viewed over several
years as an indicator of population trends rather than viewing them as exact measures of population on
a year-to-year basis. Lesser scaup and bufflehead are not included in the state duck population
estimates because they rarely breed in Wisconsin and when counted are assumed to be in migration to
more northern breeding areas.
The determination of wetland type from the air is difficult to standardize when observers change over

6
years. Pooling data into linear (streams and ditches) and nonlinear (types I-VIII) wetland groups
resolves some of the typing problems. The same aerial observers are used for a minimum 5-year period
to limit problems with observer bias.
RESULTS AND DISCUSSION:
Survey Timing/Weather:
In 2017, warm weather arrived in March which was similar to last year. This triggered migration and
breeding activity by mallards and Canada geese. We continued to see average to above average
temperatures across most of the state in April and early May. We initiated the breeding waterfowl
survey on April 24 which appeared to be well timed with regards to mallards which is the priority
species in this survey. As in the past, the survey was initiated in the southern part of Wisconsin,
progressing northward to account for the differences in phenology from south to north. The timing of
the breeding waterfowl survey is always a challenge because variables such as weather, bird species
phenology, and tree leaf-out all impact the timing, visibility, and accuracy of the survey. Weather was
a slight issue due to several days of rain which is generally not conducive to completing the survey on
time and also likely influenced the number of temporary wetlands across the state, however, there was
little leaf-out so visibility issues from that variable were not a concern.
The crews encountered some problems with waterfowl in groups (of over 4) in 2016. We saw 20 flocks
of over 10 birds and 10 flocks of > 20 birds (one flock of 44 Mallards; two flocks of 20-30 BWT; and
flocks of 15, 25 and 60 ring-necked duck). Groups made up only 9% of the Wood ducks, 25% of the
Mallards, 20% of the Canada Geese, but 67% of the “other ducks” and 45% of the BWT. Flocks of
>19 birds are not included in BPOP estimates, though they can indicate the presence of migrants or
non-breeders, which can also be found in smaller groups which are included in BPOPs.
Precipitation: Fall and winter precipitation (Oct-Feb) was up throughout the state by 19% compared
to the normal average (1981-2010). Spring (March-May) precipitation ranged from 22% to 56% above
average across the state. Overall, average statewide spring precipitation was 39% above normal. When
migrating ducks arrived in Wisconsin this spring, the typical high density duck nesting areas in
southern and eastern Wisconsin had normal or above normal water conditions which likely contributed
to the observed increase in breeding populations across all species.

7
Wetlands: Although we had considerable rainfall throughout the fall and into the winter of 2016-17,
snowpack was low. Despite the lack of run off from the melting snow we continued to see very wet
conditions throughout March and April which caused it to be wet across the state during the time of the
survey. The wet conditions continued after the survey with roughly 25 days of rain in the month of
May in Wisconsin, this has created above average wetland conditions during the important brood-
rearing period. During the 2017 survey we observed considerably more wetlands than in 2016 in all
regions, with all above the mean for the last 10 years (Table 2). Total non-linear wetland basins were:
up 132% from 2016 in the SEC and 87% above the long-term (44-year) mean, up 40% from 2016 in
the NHI and 16% above the long-term mean, and up 80% from 2016 in the NLO and 16% above the
long-term mean. In the SWD, which has less suitable waterfowl breeding habitat, non-linear basins
were up 226% from 2016 and 100% above the 20 year (1997-2016) mean. Total linear basins (streams
and ditches) were: up 37% from 2016 and 22% above the long-term mean in the SEC, up 9% from
2016 in the NHI and 3% above the long-term mean, up 19% in the NLO from 2016 and 1% above the
long-term mean, and in the SWD were up 45% from 2016, and 28% above the 20-year mean. With the
increased precipitation in May, near or above average conditions for breeding and brood-rearing
habitat in Wisconsin is expected.
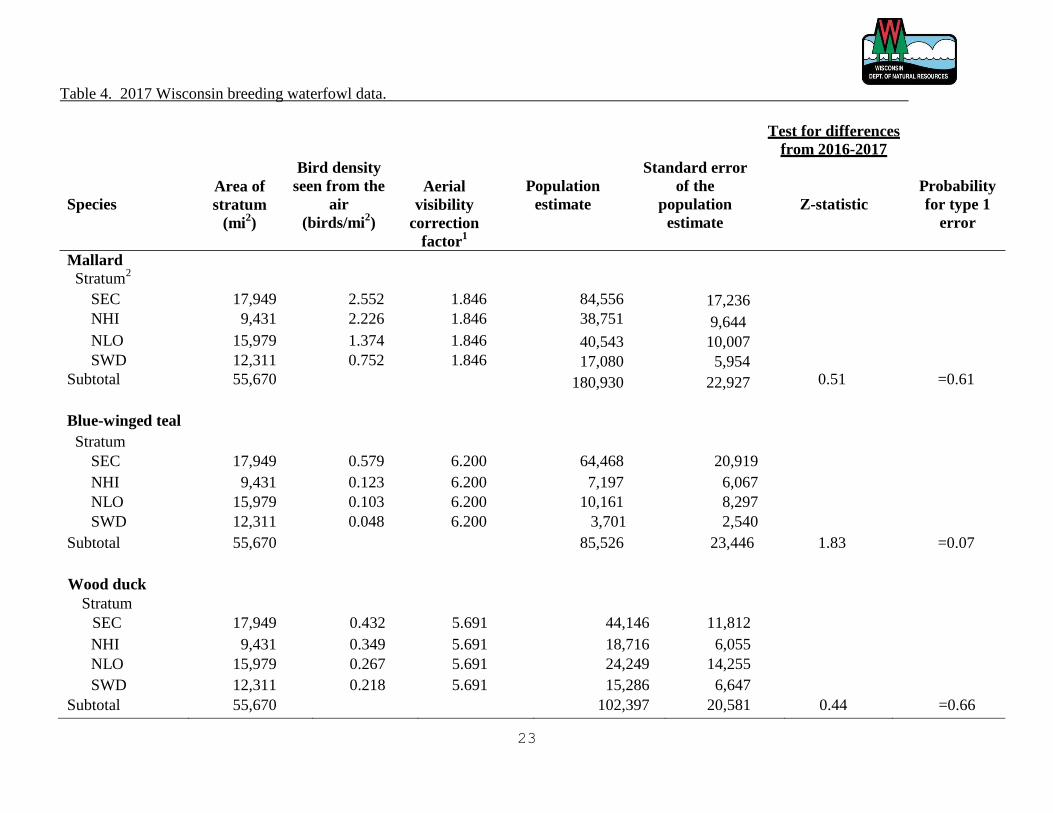
Mallards: The 2017 total mallard population estimate of 180,930 (+/- 22,927) is similar (up 10%) to
the 2016 level of 164,147 (Z=0.51 p=0.61) which is consistent with a stabilizing or slightly declining
trend observed over the last 15 years; Tables 3 and 4; Figure 3. Among duck species, mallards are
highly adaptable to annual weather variation and often begin nesting when conditions may not yet be
ideal. The early initiation of mallard nesting in 2017 will allow ample time for renesting efforts that
can make a considerable contribution to annual production. Breeding pair survey numbers combined
with above average wetland conditions in the key breeding areas suggest that we will have mallard
production similar to or higher than the last 10-year period. As in previous years, the SEC still
represented the largest portion of the breeding mallard population (47%) and was similar to 2016
(Tables 3 and 4, Figure 3). Because of the importance of the SEC region to mallard production and the
increasing land use pressures, a focus on land acquisition, habitat restoration and management as well
as private land management incentives such as those available through the federal farm bill programs
continue to be a priority for the SEC. Waterfowl breeding population estimates are best interpreted
from long term trends rather than year to year variation. For the last few years, we have been cautious
to avoid drawing broad conclusions because of this annual variation; however, it now appears that

8
there has clearly been a change in Wisconsin’s mallard breeding population over the last 20 years.
From 1995-2005, the average spring mallard breeding population estimate in Wisconsin was 272,417
while from 2008-2017 we observed a lower population averaging 183,407. During the period leading
up to the mid-1990’s there was clearly an increasing trend in mallard numbers in Wisconsin while
there has been a decrease since the early 2000’s. There are several potential reasons for this observed
decline but given the length of the trend, it does appear to be a real decline and not related to survey
effect. Good wetland and grassland nesting habitat are generally the key factors in driving mallard
numbers. Declining habitat conditions cause secondary impacts of increased mortality to hens and
broods from factors such as nest destruction from haying or predation. Fall mortality from hunting can
also be a factor although when habitat conditions are good this impact is relatively minor. Over the
last 50 years across the Wisconsin landscape, we have experienced a decline in grassland habitat and
an increase in developed and forested lands resulting from a variety of land use changes. However, in
the last 30 years we initially observed an increase in grassland habitat in agricultural areas of
Wisconsin primarily through the federal farm bill program known as CRP with a peak of over 700,000
acres in 1994 and over 600,000 acres remaining on the landscape through 2007. Since that peak we
have seen a steady decline to less than 250,000 acres of CRP grassland habitat in 2015. During the
same period, we went from 30-day duck seasons, to 40 and 50-day seasons and then 60-day duck
hunting seasons since 1997. In 2002, we shifted to opening our duck hunting seasons one week earlier.
Several studies conducted since the 1970’s have shown that about 70% of Wisconsin’s mallard harvest
is derived from mallards hatched in Wisconsin. As a result, maintaining and increasing nesting habitat
in Wisconsin while reducing sources of mortality on hen mallards are all important to a recovery of our
mallard breeding population and fall harvest opportunities.
Blue-winged Teal: Blue-winged teal survey results in Wisconsin are often difficult to interpret
because of challenging survey conditions, high variation in survey results, the propensity of teal to
shift breeding locations at the continental level, and the sometimes opposite population trends
experienced in Wisconsin versus the prairie region of the US and Canada. In 2017, warm March
temperatures triggered the mallard breeding cycle and stayed pretty consistent throughout April which
likely influenced blue-winged teal migration. As a result, the timing of the breeding waterfowl survey
early was in response to the mallards, the timing appeared slightly ahead of what would have been
ideal conditions to count teal and may have contributed to the substantial increase in their population
estimate. The 2017 blue-winged teal breeding population estimate is 85,526 (+/- 23,446) which is up
125% from 2016 but still 20% below the long-term mean (106,834) which excludes the migrant years

9
of 1981, 2004 and 2005. The best approach when evaluating the blue-winged teal survey data is to
look at long term trends and continental context. In the late 1970’s and 1980’s there was a clear
decline in Wisconsin breeding blue-winged teal numbers concurrent with declines at the continental
level. However, since then Wisconsin blue-winged teal breeding numbers have remained low
compared to historic levels while continental numbers have shown dramatic increases during the late
1990’s and in the last 10 years. We remain concerned about long term decreases in secure grassland
and nesting cover, particularly with less Conservation Reserve Program lands enrolled in Wisconsin.
However, blue-winged teal are also known for shifting breeding locations around the continent in
response to wetland habitat conditions. Continental blue-winged teal breeding populations have
reached record highs in 3 of the last 5 surveys with estimates of 6-8 million breeding blue-winged teal
reflecting good wetland conditions and good production in the prairies of Canada and the US. The
abundant blue-winged teal populations in the prairies provide large fall flights of teal, which
compensate for declines in Wisconsin. During the regular duck hunting season in Wisconsin, about
2/3 of our blue-winged teal harvest is supported by teal that breed outside of Wisconsin.
Wood Ducks: The breeding population of wood ducks in Wisconsin continues to be an important and
relatively stable part of our total breeding duck population. The 2017 breeding population estimate for
wood ducks of 102,397 (+/- 20,581) is up 14% from 2016 (Z=0.44, p= 0.66), and is 28% above the
long-term mean of 80,057 (1973-2016). The breeding wood duck population showed significant gains
in 1980’s and early 1990’s, and appears to be leveling off around 100,000 after peaking about 10 years
ago. Based on improved water conditions and our best interpretation of the survey results, we expect
wood duck production in 2017 to be good and similar to recent years.
Other Ducks: The 2017 population estimate for the “other duck” group of 110,246 (+/- 35,905) is up
12% from 2016, but this is within annual variation (Z=0.93, p=0.35), and is 72% above the long-term
mean. Observed duck species within the other duck group were typical of prior years with common
goldeneye, hooded and common merganser, green-winged teal, ruddy duck, pintail, hooded merganser,
common merganser and northern shoveler in the SEC, ring-necked ducks, hooded and common
mergansers and goldeneye were found in the NHI; ring-necked ducks, hooded and common
mergansers in the NLO. Black ducks were again absent from the survey.
Total Ducks: The total state breeding duck population estimate of 479,099 (+/- 52,803) is up 23%
compared to the 2016 estimate of 390,498 (Z=1.31, p=0.19) and 9% above the long-term mean (Tables

10
3 and 4; Figure 6).
As wetland and migratory wildlife species, ducks readily adjust behavior to weather and water
conditions. As a result, variations in population estimates and breeding behavior from year to year are
expected. While these annual variations draw considerable interest, particularly from duck hunters,
looking at the long range trends is most important for conservation purposes. Wisconsin is fortunate to
have a substantial breeding population of ducks supported by mallards, wood ducks, blue-winged teal,
and others which each take advantage of a unique composition of wetland and nesting habitats.
Overall, wood duck numbers appear stable, blue-winged teal numbers in Wisconsin are highly variable
and should be interpreted in the context of high continental populations while mallard numbers have
shown stabilizing to slight declines as described above. Current Wisconsin landscape conditions
combined with a good rain/snowfall year appear capable of supporting total breeding duck numbers
near 500,000. It appears that the Wisconsin landscape will provide good duck production in 2017.
Continentally, habitat conditions have been good and duck breeding populations high for several years.
In fact, the 2016 continental breeding duck estimate was at a near record high of 48.4 million ducks.
The thousands of lakes and abundant permanent water in Wisconsin help to moderate the impact of
drier wetland years by providing stable duck habitat here. The most significant change in current
habitat conditions is the ongoing loss of grassland nesting cover in Wisconsin and across the US
prairies as a result of changes in federal farm policy. Continued efforts to protect wetland and
grassland habitat will be needed to sustain current duck population levels.
Canada Geese: Based on the most recent harvest derivations, the proportion of the Wisconsin Canada
goose harvest that comes from giant Canada geese is about 50%, with most of those birds representing
Canada geese that breed in Wisconsin (J. Dooley, 2016 USFWS memo). This proportion indicates the
continued importance of in-state breeding Canada geese in our overall fall harvest. The statewide
breeding Canada goose population estimate of 158,023 (+/- 22,201) is up 22% from the 2016 estimate
of 129,562 (Z=0.94, p=0.35). It is above the most recent 10-year average of 141,613 and 64% above
the long-term (31-year) mean. The long-term trend in goose numbers suggests an end to their
population increase, and that the population has leveled off at ~140,000. Indications from field staff
are that Canada goose nesting was early and brood production good for 2017 so we expect numbers
similar to recent years going into the fall hunting season.
While the spring breeding waterfowl survey is designed primarily for ducks, it serves as a fairly

11
reliable index of change in the Canada goose population. Giant Canada geese represent a positive
resource for some Wisconsin residents but they also represent a problem for other residents in cities
and on farms where increasing populations have caused conflicts. Fortunately, there are solutions to
the problems that resident geese cause. In Wisconsin, the management strategy for these geese is two-
fold: 1) Manage the overall population through hunter harvest and 2) Address property or community
specific problems with professionally-guided integrated management. The early goose hunting season,
with a harvest of over 90% local birds during a two-week period, continues to be an important part of
our management strategy. The early season now comprises roughly 1/3 of the Canada geese harvested
statewide each fall. In addition, site specific Canada goose control measures are implemented in urban
and agricultural areas to mitigate nuisance goose problems. We continue to adapt harvest strategies,
banding plans, nuisance goose programs, and survey strategies as the breeding population of giant
Canada geese increases and expands across Wisconsin (Tables 3, and 4; Figure 7). A continued interest
in the Early September Canada goose hunting season is important to the overall management of this
population.

12
LITERATURE CITED:
Anonymous. 1977. Standard operating procedures for aerial waterfowl breeding ground population
and habitat surveys. U.S. Dep. of Inter., U.S. Fish & Wildl. Serv. and Dep. of Envir., Can.
Wildl. Serv. 78pp.
Bartelt, G.A. and R.C. Gatti. 1987. Analysis of air/ground ratios from Wisconsin breeding duck
survey, 1973-86. Wis. Dep. Nat. Resour., Bur. Research, 11pp.
Bowers, F.E., and F.W. Martin. 1975. Managing wood ducks by population unit. Trans. N. Am.
Wildl. Nat. Resour. Conf. 40:300-324.
Dooley, J. 2016. Canada goose derivations. US Fish and Wildlife Service unpublished memo. 6pp.
Hopkins, E. J. 2016. State of Wisconsin Climatology Office. Personal Communication.
March, J.R., G.F. Martz and R.A. Hunt. 1973. Breeding duck populations and habitat in
Wisconsin. Wis. Dep. Nat. Resour., Tech. Bull. No. 68. 36pp.
Smith, G. 1995. A critical review of the aerial and ground surveys of breeding waterfowl in North
America. Nat. Biol. Serv., Biol. Sci. Rep. 5.
13
Table 1. Wisconsin Precipitation
Prepared by Wisconsin State Climatology Office June 2017
Precipitation Data
Oct. 1, 2016-February 28, 2017
March 1, 2017- May 31, 2017
Division Total (inches)
Departure from
Normal* (inches)
Percent Change
from Normal*
Total (inches)
Departure from
Normal* (inches)
Percent Change
from Normal*
1 (NW) 8.37 .33 4.13% 10.07 2.42 31.67% 2 (NC) 10.19 1.60 18.65% 12.04 4.34 56.40% 3 (NE) 10.01 1.34 15.48% 11.23 3.71 49.34% 4 (WC) 9.94 2.26 29.39% 12.19 3.47 39.87% 5 (C) 10.40 2.39 29.91% 11.22 2.85 34.05% 6 (EC) 10.55 1.67 18.80% 10.37 2.47 31.33% 7 (SW) 10.65 1.98 22.87 11.73 2.15 22.46 8 (SC) 117.71 2.35 25.08% 12.45 3.34 36.72% 9 (SE) 12.06 2.03 20.26% 12.65 3.94 43.78%
Statewide Average 10.13 1.63 19.24% 11.46 3.22 39.01%
* 1981-2010 normals

14
Table 2. Numbers of wetlands per square mile observed, 1973-2017, SECSEC
Wetland Type 1973 1974 1975 1976 1977 1978 1979 1980 1981 1982 1983 1984 1985 1986 1987
I,II,VI 5.8 3.0 3.4 3.7 1.0 2.8 5.6 1.7 4.5 1.8 3.3 7.8 3.5 3.7 4.3
III 1.2 0.8 1.1 1.3 0.7 0.6 0.9 0.8 1.1 1.1 0.8 0.6 0.9 0.6 1.2
IV,V 1.6 2.0 1.8 1.6 1.4 2.1 2.5 2.4 2.7 2.6 2.0 2.0 2.4 2.5 3.0
VII,VIII 0.8 0.5 0.8 1.1 0.3 0.8 2.0 0.9 1.3 1.5 0.8 1.4 1.1 1.1 0.7
Tot.Nonlin. 9.5 6.4 7.1 7.7 3.3 6.3 11.1 5.8 9.7 7.0 6.9 11.8 7.8 7.9 9.1
Stream 1.4 1.2 1.3 1.5 0.9 1.5 1.7 1.4 1.7 1.7 2.0 2.2 2.0 1.5 2.2
Ditch 1.0 1.5 1.9 1.7 1.4 2.2 2.5 2.2 2.9 2.5 2.8 4.1 3.9 2.6 2.7
Tot.Linear 2.4 2.7 3.1 3.2 2.3 3.7 4.2 3.6 4.6 4.2 4.8 6.3 5.9 4.0 4.9
Wetland Type 1988 1989 1990 1991 1992 1993 1994 1995 1996 1997 1998 1999 2000 2001 2002
I,II,VI 2.4 3.8 2.7 6.1 6.9 10.5 4.6 4.4 4.9 6.6 3.5 3.5 1.6 3.2 4.9
III 0.8 1.2 1.1 1.1 1.2 1.5 1.9 1.3 1.0 1.5 0.8 0.8 0.1 1.0 0.6
IV,V 2.9 2.8 3.2 3.2 2.5 3.5 3.0 3.5 3.5 3.9 3.1 3.6 3.5 3.4 3.9
VII,VIII 0.9 1.4 1.1 2.2 1.3 2.0 1.1 0.8 1.5 0.9 0.9 0.8 0.6 0.8 1.0
Tot.Nonlin. 7.1 9.2 8.1 12.7 11.9 17.5 10.5 10.0 10.9 12.9 8.4 8.6 5.8 8.4 10.4
Stream 2.2 1.8 1.7 2.1 2.1 1.9 2.0 2.1 1.8 1.9 1.8 1.8 1.6 1.7 1.7
Ditch 2.4 3.3 2.3 3.5 2.8 3.2 2.8 2.7 2.5 3.1 2.5 1.3 1.5 2.0 2.4
Tot.Linear 4.7 5.1 4.0 5.6 4.9 5.1 4.8 4.8 4.3 5.0 4.2 3.0 3.1 3.7 4.1
Wetland Type 2003 2004 2005 2006 2007 2008 2009 2010 2011 2012 2013 2014 2015 2016 2017
% Change
from 2016
Long-term
mean
% Change
from Long-
term mean
10 year
mean
(2007-
2016)
I,II,VI 1.9 1.9 1.1 2.5 3.7 3.3 3.8 2.0 2.6 2.1 2.5 3.0 1.3 2.1 9.2 348.3% 3.6 153.6% 2.6
III 0.3 0.8 0.4 0.4 0.5 1.0 0.7 0.5 0.7 0.6 1.0 1.0 0.8 0.9 1.1 30.5% 0.9 26.8% 0.8
IV,V 3.5 3.2 3.6 3.6 3.1 3..5 3.3 3.8 3.8 3.1 3.2 3.1 2.7 3.0 3.6 22.7% 2.9 24.9% 3.2
VII,VIII 0.6 1.1 1.1 1.2 1.4 1.5 1.0 0.6 1.0 0.7 0.6 1.2 0.7 1.0 1.9 95.7% 1.1 75.7% 1.0
Tot.Nonlin. 6.4 7.0 6.2 7.7 8.6 9.2 8.8 6.5 8.1 6.4 7.3 8.3 5.6 6.8 15.8 131.8% 8.5 86.5% 7.6
Stream 1.6 1.8 1.8 1.8 1.8 1.9 1.9 1.7 2.0 1.6 1.8 1.7 1.8 1.5 1.9 25.5% 1.7 6.8% 1.8
Ditch 1.8 2.4 2.1 2.2 2.1 2.5 2.8 2.2 2.2 2.6 2.5 2.8 2.4 2.2 3.2 44.9% 2.4 33.3% 2.4
Tot.Linear 3.4 4.2 3.9 4.0 3.9 4.4 4.8 3.9 4.2 4.1 4.2 4.5 4.2 3.7 5.1 37.2% 4.2 22.3% 4.2* Wetland classification system from March et al.
1973.
15
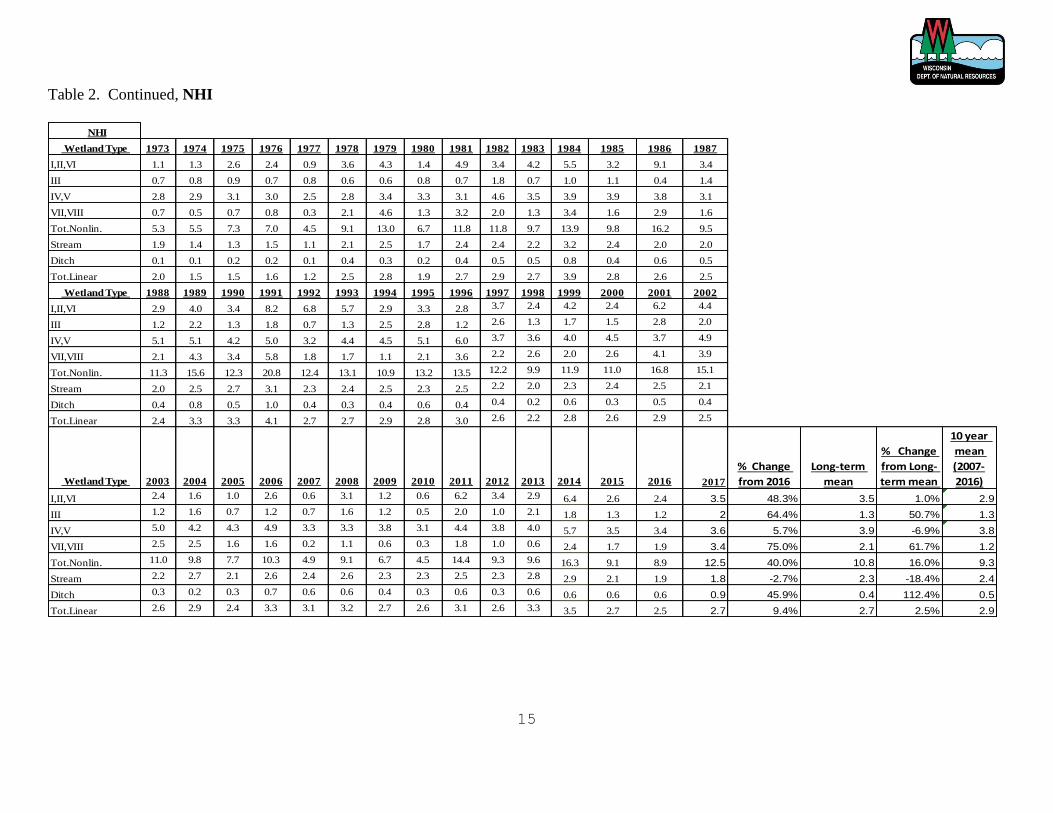
Table 2. Continued, NHI
NHI
Wetland Type 1973 1974 1975 1976 1977 1978 1979 1980 1981 1982 1983 1984 1985 1986 1987
I,II,VI 1.1 1.3 2.6 2.4 0.9 3.6 4.3 1.4 4.9 3.4 4.2 5.5 3.2 9.1 3.4
III 0.7 0.8 0.9 0.7 0.8 0.6 0.6 0.8 0.7 1.8 0.7 1.0 1.1 0.4 1.4
IV,V 2.8 2.9 3.1 3.0 2.5 2.8 3.4 3.3 3.1 4.6 3.5 3.9 3.9 3.8 3.1
VII,VIII 0.7 0.5 0.7 0.8 0.3 2.1 4.6 1.3 3.2 2.0 1.3 3.4 1.6 2.9 1.6
Tot.Nonlin. 5.3 5.5 7.3 7.0 4.5 9.1 13.0 6.7 11.8 11.8 9.7 13.9 9.8 16.2 9.5
Stream 1.9 1.4 1.3 1.5 1.1 2.1 2.5 1.7 2.4 2.4 2.2 3.2 2.4 2.0 2.0
Ditch 0.1 0.1 0.2 0.2 0.1 0.4 0.3 0.2 0.4 0.5 0.5 0.8 0.4 0.6 0.5
Tot.Linear 2.0 1.5 1.5 1.6 1.2 2.5 2.8 1.9 2.7 2.9 2.7 3.9 2.8 2.6 2.5
Wetland Type 1988 1989 1990 1991 1992 1993 1994 1995 1996 1997 1998 1999 2000 2001 2002
I,II,VI 2.9 4.0 3.4 8.2 6.8 5.7 2.9 3.3 2.8 3.7 2.4 4.2 2.4 6.2 4.4
III 1.2 2.2 1.3 1.8 0.7 1.3 2.5 2.8 1.2 2.6 1.3 1.7 1.5 2.8 2.0
IV,V 5.1 5.1 4.2 5.0 3.2 4.4 4.5 5.1 6.0 3.7 3.6 4.0 4.5 3.7 4.9
VII,VIII 2.1 4.3 3.4 5.8 1.8 1.7 1.1 2.1 3.6 2.2 2.6 2.0 2.6 4.1 3.9
Tot.Nonlin. 11.3 15.6 12.3 20.8 12.4 13.1 10.9 13.2 13.5 12.2 9.9 11.9 11.0 16.8 15.1
Stream 2.0 2.5 2.7 3.1 2.3 2.4 2.5 2.3 2.5 2.2 2.0 2.3 2.4 2.5 2.1
Ditch 0.4 0.8 0.5 1.0 0.4 0.3 0.4 0.6 0.4 0.4 0.2 0.6 0.3 0.5 0.4
Tot.Linear 2.4 3.3 3.3 4.1 2.7 2.7 2.9 2.8 3.0 2.6 2.2 2.8 2.6 2.9 2.5
Wetland Type 2003 2004 2005 2006 2007 2008 2009 2010 2011 2012 2013 2014 2015 2016 2017
% Change
from 2016
Long-term
mean
% Change
from Long-
term mean
10 year
mean
(2007-
2016)
I,II,VI 2.4 1.6 1.0 2.6 0.6 3.1 1.2 0.6 6.2 3.4 2.9 6.4 2.6 2.4 3.5 48.3% 3.5 1.0% 2.9
III 1.2 1.6 0.7 1.2 0.7 1.6 1.2 0.5 2.0 1.0 2.1 1.8 1.3 1.2 2 64.4% 1.3 50.7% 1.3
IV,V 5.0 4.2 4.3 4.9 3.3 3.3 3.8 3.1 4.4 3.8 4.0 5.7 3.5 3.4 3.6 5.7% 3.9 -6.9% 3.8
VII,VIII 2.5 2.5 1.6 1.6 0.2 1.1 0.6 0.3 1.8 1.0 0.6 2.4 1.7 1.9 3.4 75.0% 2.1 61.7% 1.2
Tot.Nonlin. 11.0 9.8 7.7 10.3 4.9 9.1 6.7 4.5 14.4 9.3 9.6 16.3 9.1 8.9 12.5 40.0% 10.8 16.0% 9.3
Stream 2.2 2.7 2.1 2.6 2.4 2.6 2.3 2.3 2.5 2.3 2.8 2.9 2.1 1.9 1.8 -2.7% 2.3 -18.4% 2.4
Ditch 0.3 0.2 0.3 0.7 0.6 0.6 0.4 0.3 0.6 0.3 0.6 0.6 0.6 0.6 0.9 45.9% 0.4 112.4% 0.5
Tot.Linear 2.6 2.9 2.4 3.3 3.1 3.2 2.7 2.6 3.1 2.6 3.3 3.5 2.7 2.5 2.7 9.4% 2.7 2.5% 2.9

16
Table 2. Continued, NLO
NLO
Wetland Type 1973 1974 1975 1976 1977 1978 1979 1980 1981 1982 1983 1984 1985 1986 1987
I,II,VI 2.1 1.0 1.0 1.6 0.5 2.1 3.5 0.9 3.9 1.8 2.3 5.7 2.8 6.1 4.0
III 0.7 0.5 0.6 0.4 0.4 0.5 0.4 0.6 0.5 1.0 0.3 0.5 0.4 0.3 0.7
IV,V 1.7 0.9 1.1 1.1 1.1 1.5 1.8 2.1 1.5 2.3 1.7 1.6 2.1 2.0 2.0
VII,VIII 1.0 0.5 0.7 0.8 0.1 2.0 4.6 1.1 3.0 3.7 1.5 2.8 1.3 2.3 1.1
Tot.Nonlin. 5.5 2.9 3.4 3.8 2.2 6.1 10.2 4.6 9.0 8.7 5.8 10.6 6.5 10.7 7.8
Stream 3.1 2.1 2.1 2.3 1.6 3.3 3.6 3.1 3.6 3.6 3.7 4.4 3.4 3.0 2.9
Ditch 0.3 0.4 0.4 0.4 0.2 0.6 0.6 0.4 0.5 0.5 0.6 1.1 0.8 0.6 0.5
Tot.Linear 3.3 2.5 2.5 2.7 1.8 3.9 4.2 3.5 4.2 4.1 4.3 5.5 4.2 3.6 3.3
Wetland Type 1988 1989 1990 1991 1992 1993 1994 1995 1996 1997 1998 1999 2000 2001 2002
I,II,VI 3.8 6.5 4.0 9.7 4.1 10.6 3.8 5.0 3.0 10.6 2.9 5.2 4.4 6.9 6.2
III 0.5 1.1 0.6 0.9 0.7 0.9 1.6 1.5 0.2 1.6 0.7 1.3 1.3 1.3 1.5
IV,V 2.8 3.0 2.7 3.0 1.9 2.8 2.5 3.1 2.3 3.1 2.1 2.2 2.1 2.1 3.0
VII,VIII 2.6 2.8 3.0 5.9 1.6 2.5 1.3 1.4 2.5 3.3 1.5 1.7 2.8 3.2 3.7
Tot.Nonlin. 9.6 13.5 10.3 19.6 8.3 16.8 9.3 11.0 8.0 18.6 7.1 10.5 10.7 13.5 14.4
Stream 2.9 3.4 4.1 3.9 3.6 3.2 3.6 3.8 3.2 3.5 3.6 3.9 3.5 3.4 2.9
Ditch 0.7 1.0 0.9 1.7 0.8 0.9 1.0 1.0 0.8 1.4 0.6 0.5 0.6 0.6 0.7
Tot.Linear 3.6 4.4 5.0 5.5 4.4 4.1 4.6 4.7 4.0 4.9 4.3 4.4 4.1 4.0 3.6
Wetland Type 2003 2004 2005 2006 2007 2008 2009 2010 2011 2012 2013 2014 2015 2016 2017
%
Change
from 2016
Long-term
mean
%
Change
from Long-
term mean
10 year
mean
(2006-
2016)
I,II,VI 3.8 2.3 2.7 6.4 1.3 6.0 0.8 2.3 3.4 5.0 3.4 8.8 1.7 1.8 4.7 158.7% 4.1 15.5% 3.5
III 0.8 1.3 0.5 0.8 0.5 1.2 1.2 0.3 0.6 0.5 1.0 0.5 0.6 0.8 0.8 0.0% 0.8 3.7% 0.7
IV,V 2.6 2.3 2.8 2.9 2.0 2.1 2.4 2.0 3.3 2.4 2.5 2.0 1.8 2.1 2.1 0.5% 2.2 -4.7% 2.3
VII,VIII 2.8 2.5 1.5 1.7 0.6 1.4 1.5 0.3 1.9 1.7 0.7 2.7 1.1 1.2 2.9 148.7% 2 44.2% 1.3
Tot.Nonlin. 10.0 8.4 7.5 11.8 4.4 10.7 7.8 4.9 9.2 9.5 7.6 14.1 5.2 5.9 10.6 79.6% 9.1 16.1% 7.9
Stream 3.0 4.1 3.6 3.9 3.4 3.9 4.8 3.3 4.4 4.8 3.8 4.6 3.0 2.8 2.9 3.3% 3.4 -17.3% 3.9
Ditch 0.7 0.7 0.8 1.2 0.7 1.3 0.9 0.9 0.6 0.8 0.8 1.7 0.9 0.8 1.4 70.9% 0.8 81.2% 0.9
Tot.Linear 3.7 4.8 4.4 5.1 4.0 5.1 5.7 4.2 5.0 5.7 4.6 6.2 3.9 3.6 4.2 18.7% 4.2 0.6% 4.8

17
Table 2. Continued, SWD
SWD
Wetland Type 1997 1998 1999 2000 2001 2002 2003 2004 2005 2006
I,II, VI 2.3 0.7 2.0 1.2 1.2 1.7 0.6 0.7 0.8 0.9
III 0.5 0.4 0.4 0.2 0.2 0.2 0.3 0.1 0.3 0.3
IV, V 2.0 1.2 1.8 1.4 1.4 2.0 1.2 1.3 1.9 1.7
VII, VIII 0.4 0.0 0.1 0.1 0.1 0.3 0.1 0.1 0.3 0.2
Tot. Nonlin. 5.1 2.3 4.2 2.9 2.9 4.2 2.2 2.2 3.3 3.1
Stream 3.7 2.9 4.0 3.4 3.4 2.7 2.7 2.7 3.4 2.7
Ditch 0.8 0.3 0.7 0.4 0.4 0.3 0.4 0.4 0.4 0.5
Tot. Linear 4.5 3.2 4.7 3.8 3.8 3.0 3.1 3.1 3.8 3.2
Wetland Type 2007 2008 2009 2010 2011 2012 2013 2014 2015 2016 2017
%
Change
from 2016 Long-term mean
% Change from
Long-term mean
10 year mean
(2007-2016)
I,II, VI 0.5 2.0 1.6 0.4 1.1 1.0 1.4 2.3 0.7 0.3 3.4 1036.0% 1.2 184.4% 1.1
III 0.3 0.2 0.2 0.1 0.2 0.2 0.5 0.6 0.2 0.3 0.5 40.7% 0.3 55.1% 0.3
IV, V 1.7 1.3 1.6 1.5 1.8 1.9 1.3 1.7 1.3 1.1 1.9 73.0% 1.5 23.6% 1.5
VII, VIII 0.1 0.2 0.2 0.0 0.6 0.0 0.4 0.5 0.3 0.3 0.7 152.2% 0.2 210.2% 0.3
Tot. Nonlin. 2.5 3.7 3.6 2.1 3.7 3.1 3.6 5.1 2.6 2.0 6.5 225.6% 3.2 99.6% 3.2
Stream 3.1 3.7 3.6 3.4 3.1 3.6 3.6 3.4 2.8 2.5 3.6 47.1% 3.1 15.8% 3.3
Ditch 0.4 0.7 0.5 0.4 0.5 1.0 0.8 1.3 0.7 0.8 1.2 39.7% 0.6 90.4% 0.7
Tot. Linear 3.5 4.4 4.1 3.9 3.6 4.5 4.4 4.7 3.5 3.3 4.8 45.2% 3.7 27.8% 4.0

18
Table 3. Breeding waterfowl population estimates in Wisconsin, 1973-2017.
Year Mallard BW Teal Wood Ducks Other Ducks Total Ducks Canada Geese
1973 56,632 147,748 807 105,245 310,432
1974 61,042 217,734 4,841 65,024 348,641
1975 67,247 193,932 11,297 36,199 308,675
1976 58,814 152,089 9,683 29,831 250,417
1977 41,816 126,116 15,331 9,385 192,648
1978 30,977 75,132 9,683 42,232 158,024
1979 35,125 71,549 12,104 19,440 138,218
1980 44,175 34,425 10,490 14,748 103,838
1981 65,784 131,567 12,910 40,891 251,152
1982 45,758 66,732 6,455 18,099 137,044
1983 56,863 48,414 6,455 6,033 117,765
1984 43,240 45,589 8,069 5,028 101,926
1985 38,906 43,985 12,910 4,357 100,158
1986 53,938 26,360 34,697 3,352 118,347 7,640
1987 66,657 75,001 20,771 16,759 179,188 9,277
1988 53,091 29,033 8,851 4,357 95,332 9,095
1989 63,795 60,409 27,799 25,808 177,811 39,109
1990 57,853 34,980 21,307 6,033 120,173 12,551
1991 69,114 36,814 24,009 34,523 164,460 16,917
1992 115,344 116,706 61,856 66,604 360,510 26,921
1993 90,471 62,642 33,271 9,152 195,536 21,101
1994 174,488 103,386 32,805 36,500 347,179 27,649
1995 137,757 90,305 80,564 28,223 336,849 45,475
1996 152,951 56,096 31,393 27,077 267,517 39,377
1997 90,397 48,711 66,816 5,952 211,876 56,116
1998 105,733 49,757 49,758 7,843 213,091 54,172
1999 110,406 57,220 45,931 8,975 222,532 54,502
2000 207,191 71,240 64,061 7,853 350,345 83,314
2001 83,621 35,675 51,034 3,875 174,205 56,241
2002 193,365 40,077 50,284 28,069 311,795 79,264
2003 140,726 28,042 48,643 39,703 257,114 165,303
2004 124,980 162,121 61,526 17,691 366,318 103,119
2005 158,797 151,774 50,286 27,371 388,228 82,849
2006 115,872 60,473 39,612 8,234 224,191 72,393
2007 102,568 86,772 33,684 16,108 239,132 63,445
2008 104,291 113,037 35,568 27,587 280,483 65,854
2009 94,490 45,270 44,893 7,818 192,471 77,590
2010 84,583 17,082 41,422 4,414 147,501 81,301
2011 101,288 37,061 58,680 21,333 218,362 93,005
2012 91,716 49,754 42,392 12,094 195,956 68,014
2013 61,916 42,117 36,666 23,724 164,423 74,478
2014 60,773 14,467 38,141 12,207 125,588 59,753
2015 73,096 47,131 35,983 27,670 183,880 55,439
2016 74,047 11,507 39,768 28,446 153,768 59,728
2017 84,556 64,468 44,146 47,639 240,809 82,972
MEAN (73-
2016): 88,085 74,524 32,413 22,405 217,426 56,806
Stratum: South-East Central (SEC)
19
Table 3. Continued.
Year Mallard BW Teal Wood Ducks Other Ducks Total Ducks Canada Geese
1973 13,602 9,594 0 3,929 27,125
1974 13,058 9,594 6,621 1,179 30,452
1975 26,376 19,346 4,729 3,143 53,594
1976 25,645 18,331 2,837 5,893 52,706
1977 19,138 29,483 2,837 3,536 54,994
1978 13,640 31,958 3,783 5,500 54,881
1979 20,942 21,412 1,892 11,393 55,639
1980 37,872 19,852 9,458 9,822 77,004
1981 34,822 43,776 10,404 5,107 94,109
1982 20,355 15,781 0 2,750 38,886
1983 27,950 3,547 946 1,571 34,014
1984 22,730 7,634 9,458 5,500 45,322
1985 15,391 23,795 5,675 3,143 48,004
1986 23,876 11,235 16,078 9,036 60,225 1,492
1987 32,271 15,552 36,032 9,429 93,284 4,051
1988 46,752 18,994 26,800 3,143 95,689 4,264
1989 47,015 31,428 7,965 52,251 138,659 5,970
1990 42,916 15,033 29,238 14,929 102,116 6,610
1991 41,472 9,530 13,727 55,787 120,516 4,691
1992 52,293 14,450 22,608 28,315 117,666 4,904
1993 32,308 9,607 6,658 10,727 59,300 9,381
1994 48,830 13,058 4,272 18,691 84,851 2,985
1995 43,596 4,975 35,910 31,825 116,306 7,462
1996 50,294 1,566 13,957 30,533 96,350 8,528
1997 27,716 7,664 17,762 15,115 68,257 14,713
1998 36,194 18,417 40,377 11,031 106,019 8,627
1999 60,939 9,863 23,927 13,353 108,082 21,844
2000 89,946 29,896 45,214 20,502 185,558 25,567
2001 44,191 21,722 46,359 21,349 133,621 16,183
2002 69,938 12,918 25,836 83,469 192,161 16,992
2003 40,188 5,716 20,608 13,815 80,327 35,596
2004 42,530 17,927 17,046 48,137 125,640 25,554
2005 56,253 19,471 47,440 12,222 135,386 17,415
2006 40,198 23,198 39,287 38,603 141,286 25,221
2007 30,056 10,485 18,049 18,881 77,471 31,185
2008 31,727 29,785 38,216 65,423 165,151 21,365
2009 39,900 28,189 24,022 35,824 127,935 30,487
2010 47,210 15,670 31,973 18,107 112,960 26,562
2011 29,163 21,720 32,611 48,285 131,779 20,651
2012 41,657 13,121 28,157 57,588 140,523 29,293
2013 56,209 12,342 29,010 102,235 199,796 25,653
2014 35,448 6,056 28,362 31,796 101,662 14,116
2015 49,031 2,351 8,652 14,270 74,304 19,363
2016 43,703 9,809 6,659 47,811 107,982 23,211
2017 38,751 7,197 18,716 56,199 120,863 31,054
MEAN (73-
16): 37,713 16,420 19,414 23,189 96,735 16,224
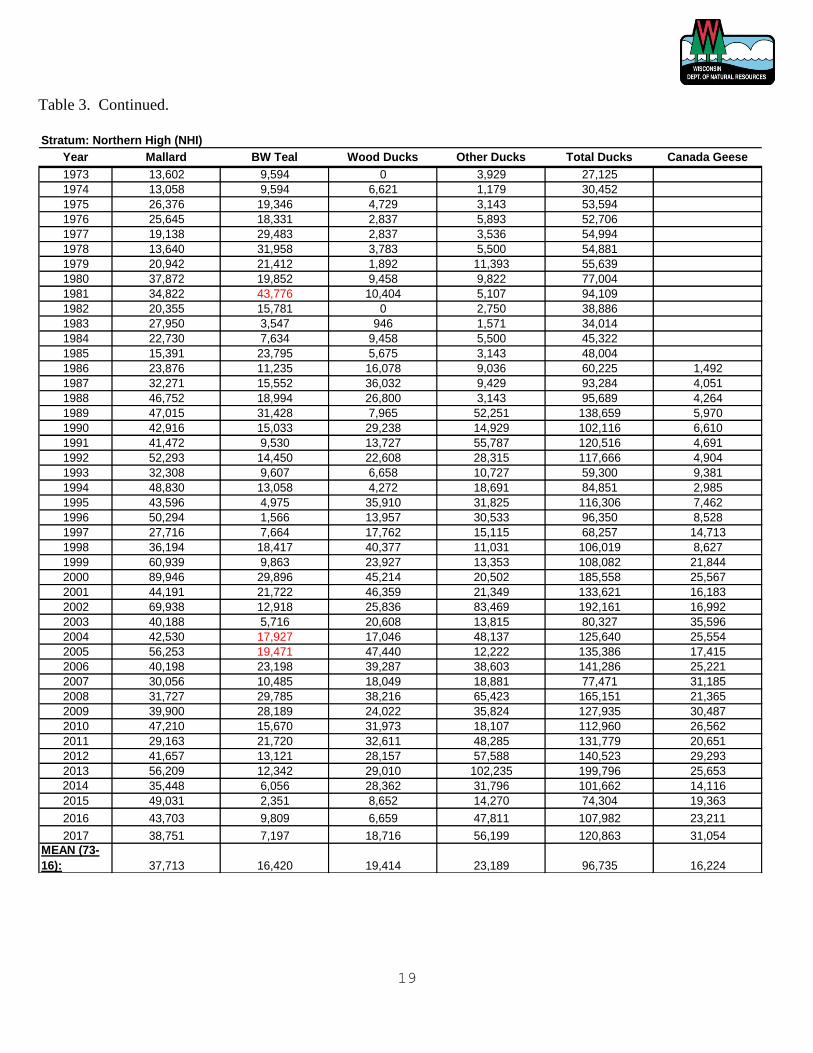
Stratum: Northern High (NHI)

20
Table 3. Continued.
Year Mallard BW Teal Wood Ducks Other Ducks Total Ducks Canada Geese
1973 25,812 13,005 4,807 3,328 46,952
1974 10,601 6,502 1,602 3,994 22,699
1975 14,550 4,917 6,410 2,663 28,540
1976 14,197 13,976 9,615 6,656 44,444
1977 21,354 24,283 0 1,331 46,968
1978 10,741 16,244 1,602 9,319 37,906
1979 14,516 18,139 12,820 3,328 48,803
1980 22,559 9,505 4,807 7,988 44,859
1981 27,656 61,809 11,217 16,641 117,323
1982 14,233 8,138 1,602 0 23,973
1983 22,464 3,606 1,602 3,994 31,666
1984 28,104 6,467 6,410 1,331 42,312
1985 12,073 9,599 3,205 1,331 26,208
1986 21,651 9,518 19,229 4,659 55,057 1,084
1987 24,050 23,422 26,400 3,994 77,866 0
1988 33,870 14,079 10,253 8,653 66,855 722
1989 51,437 23,095 14,722 17,972 107,226 3,612
1990 35,149 14,472 6,192 18,638 74,451 1,806
1991 44,250 15,250 20,933 35,279 115,712 361
1992 56,618 33,460 38,306 13,707 142,091 0
1993 33,950 18,602 22,562 11,883 86,997 1,084
1994 31,175 15,930 16,287 24,631 88,023 2,529
1995 36,112 13,111 13,521 17,737 80,481 1,445
1996 79,098 6,631 19,348 17,017 122,094 3,400
1997 38,910 2,597 27,359 17,073 85,939 4,399
1998 34,495 7,801 17,736 9,345 69,377 8,186
1999 55,975 6,684 15,202 7,541 85,402 14,664
2000 101,746 12,226 16,415 2,836 133,223 8,468
2001 35,757 16,562 15,202 23,088 90,609 12,096
2002 73,910 3,979 19,151 49,549 146,589 12,073
2003 49,759 38,741 30,261 17,248 136,009 19,190
2004 37,364 21,262 17,773 21,331 97,730 6,927
2005 57,933 23,993 26,793 31,061 139,780 15,395
2006 36,270 13,101 26,222 25,889 101,482 19,876
2007 44,184 10,659 34,402 10,663 99,908 17,612
2008 38,735 20,882 29,431 39,497 128,545 16,737
2009 46,708 39,333 25,196 26,819 138,056 6,265
2010 44,946 14,750 26,083 8,765 94,544 34,333
2011 38,254 20,853 44,203 18,992 122,302 49,904
2012 41,958 27,172 22,450 42,031 133,611 35,495
2013 42,494 9,957 10,922 52,658 116,031 27,571
2014 41,274 8,205 22,805 53,872 126,156 36,795
2015 33,919 5,974 10,994 27,475 78,362 26,690
2016 29,290 16,620 34,787 22,838 103,535 27,275
2017 40,543 10,161 24,249 4,589 79,542 23,629
MEAN (73-
2016): 36,763 16,011 16,559 16,786 86,120 12,957
Stratum: Northern Low (NLO)
21
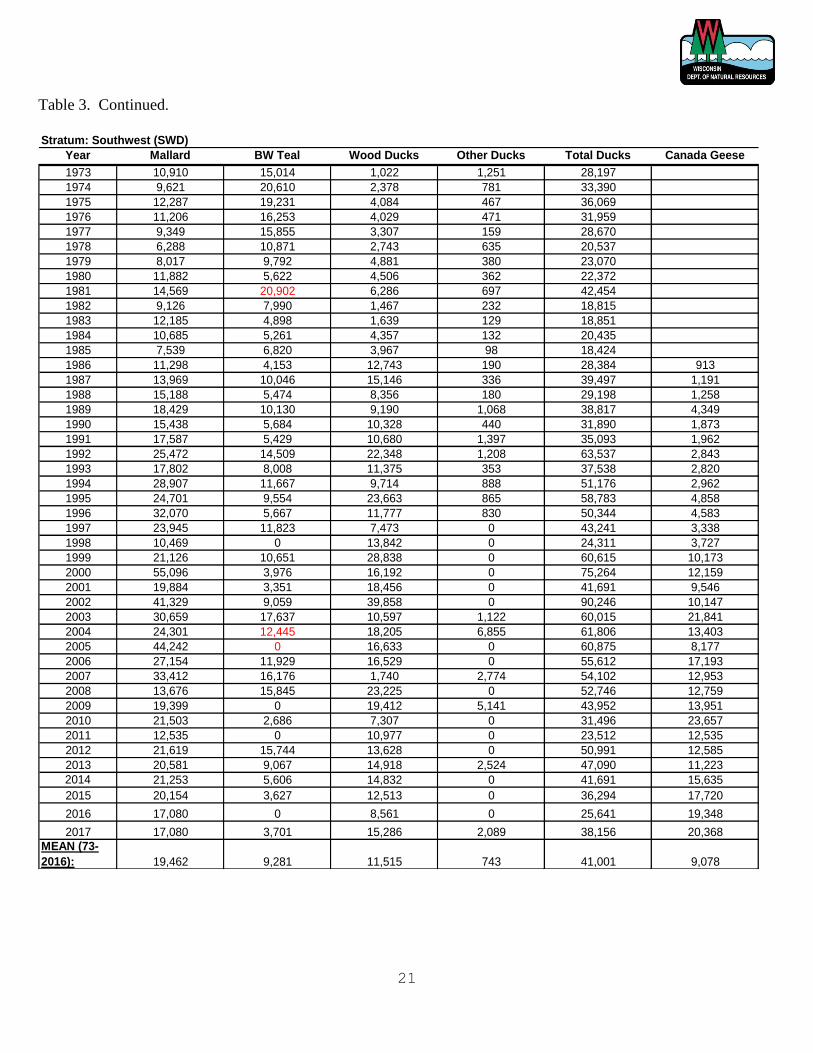
Table 3. Continued.
Year Mallard BW Teal Wood Ducks Other Ducks Total Ducks Canada Geese
1973 10,910 15,014 1,022 1,251 28,197
1974 9,621 20,610 2,378 781 33,390
1975 12,287 19,231 4,084 467 36,069
1976 11,206 16,253 4,029 471 31,959
1977 9,349 15,855 3,307 159 28,670
1978 6,288 10,871 2,743 635 20,537
1979 8,017 9,792 4,881 380 23,070
1980 11,882 5,622 4,506 362 22,372
1981 14,569 20,902 6,286 697 42,454
1982 9,126 7,990 1,467 232 18,815
1983 12,185 4,898 1,639 129 18,851
1984 10,685 5,261 4,357 132 20,435
1985 7,539 6,820 3,967 98 18,424
1986 11,298 4,153 12,743 190 28,384 913
1987 13,969 10,046 15,146 336 39,497 1,191
1988 15,188 5,474 8,356 180 29,198 1,258
1989 18,429 10,130 9,190 1,068 38,817 4,349
1990 15,438 5,684 10,328 440 31,890 1,873
1991 17,587 5,429 10,680 1,397 35,093 1,962
1992 25,472 14,509 22,348 1,208 63,537 2,843
1993 17,802 8,008 11,375 353 37,538 2,820
1994 28,907 11,667 9,714 888 51,176 2,962
1995 24,701 9,554 23,663 865 58,783 4,858
1996 32,070 5,667 11,777 830 50,344 4,583
1997 23,945 11,823 7,473 0 43,241 3,338
1998 10,469 0 13,842 0 24,311 3,727
1999 21,126 10,651 28,838 0 60,615 10,173
2000 55,096 3,976 16,192 0 75,264 12,159
2001 19,884 3,351 18,456 0 41,691 9,546
2002 41,329 9,059 39,858 0 90,246 10,147
2003 30,659 17,637 10,597 1,122 60,015 21,841
2004 24,301 12,445 18,205 6,855 61,806 13,403
2005 44,242 0 16,633 0 60,875 8,177
2006 27,154 11,929 16,529 0 55,612 17,193
2007 33,412 16,176 1,740 2,774 54,102 12,953
2008 13,676 15,845 23,225 0 52,746 12,759
2009 19,399 0 19,412 5,141 43,952 13,951
2010 21,503 2,686 7,307 0 31,496 23,657
2011 12,535 0 10,977 0 23,512 12,535
2012 21,619 15,744 13,628 0 50,991 12,585
2013 20,581 9,067 14,918 2,524 47,090 11,223
2014 21,253 5,606 14,832 0 41,691 15,635
2015 20,154 3,627 12,513 0 36,294 17,720
2016 17,080 0 8,561 0 25,641 19,348
2017 17,080 3,701 15,286 2,089 38,156 20,368
MEAN (73-
2016): 19,462 9,281 11,515 743 41,001 9,078
Stratum: Southwest (SWD)

22
Table 3. Continued,
Year Mallard BW Teal Wood Ducks Other Ducks Total Ducks Canada Geese
1973 106,956 185,361 6,636 113,753 412,706
1974 94,322 254,440 15,442 70,978 435,182
1975 120,460 237,426 26,520 42,472 426,878
1976 109,862 200,649 26,164 42,851 379,526
1977 91,657 195,737 21,475 14,411 323,280
1978 61,646 134,205 17,811 57,686 271,348
1979 78,600 120,892 31,697 34,541 265,730
1980 116,488 69,404 29,261 32,920 248,073
1981 142,831 258,054 40,817 63,336 505,038
1982 89,472 98,641 9,524 21,081 218,718
1983 119,462 60,465 10,642 11,727 202,296
1984 104,759 64,951 28,294 11,991 209,995
1985 73,909 84,199 25,757 8,929 192,794
1986 110,763 51,266 82,747 17,237 262,013 11,129
1987 136,947 124,021 98,349 30,518 389,835 14,519
1988 148,901 67,580 54,260 16,333 287,074 15,339
1989 180,676 125,062 59,676 97,099 462,513 53,040
1990 151,356 70,169 67,065 40,040 328,630 22,840
1991 172,423 67,023 69,349 126,986 435,781 23,931
1992 249,727 179,125 145,118 109,834 683,804 34,668
1993 174,531 98,859 73,866 32,115 379,371 34,386
1994 283,400 144,041 63,078 80,710 571,229 36,125
1995 242,166 117,945 153,658 78,650 592,419 59,240
1996 314,413 69,960 76,475 75,457 536,305 55,888
1997 180,968 70,795 119,410 38,140 409,313 78,566
1998 186,891 75,975 121,713 28,219 412,798 74,712
1999 248,446 84,418 113,898 29,869 476,631 101,183
2000 453,979 117,338 141,882 31,191 744,390 129,508
2001 183,453 77,310 131,051 48,312 440,126 94,066
2002 378,542 66,033 135,129 161,087 740,791 118,476
2003 261,332 90,136 110,109 71,888 533,465 241,930
2004 229,175 213,755 114,550 94,014 651,494 149,003
2005 317,224 195,239 141,152 70,655 724,270 123,836
2006 219,494 108,701 121,650 72,726 522,571 134,683
2007 210,219 124,093 87,875 48,427 470,614 125,195
2008 188,429 179,549 126,440 132,506 626,924 116,715
2009 200,497 112,793 113,523 75,602 502,416 148,293
2010 199,107 50,188 103,769 32,757 385,821 157,622
2011 187,862 90,803 146,471 88,610 513,746 176,095
2012 196,950 105,791 106,626 111,712 521,079 145,386
2013 181,200 73,483 91,516 181,141 527,340 138,925
2014 158,747 34,337 104,140 97,875 395,099 126,299
2015 176,200 59,083 68,142 69,415 372,840 119,212
2016 164,147 37,936 89,775 98,640 390,498 129,562
2017 180,930 85,526 102,397 110,246 479,099 158,023
MEAN (73-15): 181,786 106,834 80,057 63,965 440,517 96,464
MEAN (07-16): 183,407 82,949 105,280 99,850 471,486 141,613
Change from 2015 10% 125% 14% 12% 23% 22%
Change from 73-
2016 Mean 0% -20% 28% 72% 9% 64%
* Long term and 10-year means for Blue-winged Teal excludes migrant years (1981, 2004 and 2005)
All Stratum
23
Table 4. 2017 Wisconsin breeding waterfowl data.
Species
Mallard
Stratum2
Area of
stratum
(mi2)
Bird density
seen from the
air
(birds/mi2)
Aerial
visibility
correction
factor1
Population
estimate
Standard error
of the
population
estimate
Test for differences
from 2016-2017
Z-statistic
Probability
for type 1
error
SEC 17,949 2.552 1.846 84,556 17,236
NHI 9,431 2.226 1.846 38,751 9,644
NLO 15,979 1.374 1.846 40,543 10,007
SWD 12,311 0.752 1.846 17,080 5,954
Subtotal 55,670 180,930 22,927 0.51 =0.61
Blue-winged teal
Stratum
SEC 17,949 0.579 6.200 64,468 20,919
NHI 9,431 0.123 6.200 7,197 6,067
NLO 15,979 0.103 6.200 10,161 8,297
SWD 12,311 0.048 6.200 3,701 2,540
Subtotal 55,670 85,526 23,446 1.83 =0.07
Wood duck
Stratum
SEC
17,949
0.432
5.691
44,146
11,812
NHI 9,431 0.349 5.691 18,716 6,055
NLO 15,979 0.267 5.691 24,249 14,255
SWD 12,311 0.218 5.691 15,286 6,647
Subtotal 55,670 102,397 20,581 0.44 =0.66
24
Table 4. Continued
1 Aerial Visibility Correction Factor (R) = number of birds seen from the ground divided by the number seen from the air on air-ground segments.”.
The Coefficient of Variation (CV) of R (the visibility correction factor) was not precise enough (i.e., CV[R] > 20%) to use for individual species-
strata in 2016. When air-ground data from all strata were pooled by species in 2016 the R was still not precise enough for any species-group. We
then iteratively added in past years of air-ground data to achieve the desired precision for the remaining species. This was achieved for Mallard,
BWT, Wood Ducks, Geese, and “other ducks” by using 2, 11, 6, 2, and 16 years of air-ground data, respectively; this is similar precision to last year.
SEC = Southeast Central, NHI = Northern High, NLO = Northern Low, SWD = Southwest Driftless Strata. 3
As in other years Lesser Scaup, Buffleheads, and all non-duck/goose waterbirds were excluded in the summaries. The duck species included in
the “other ducks” (in decreasing abundance) were: SEC –Common Goldeneye, Green-winged Teal, Ruddy Duck, Hooded Merganser, Pintail,
Common Merganser, and Northern Shoveler; NHI – Common Goldeneye, Ring-necked Duck, Hooded Merganser, and Common Merganser;
NLO –Common Merganser, Ring-necked Duck, and Hooded Merganser; SWD – none. Mallards, BWT, Wood Ducks, Canada Geese and
Sandhill Cranes were seen in all 4 strata.
Test for differences
from 2016-2017
Bird density
Standard error
Area of seen from the Aerial Population of the Probability
Species stratum
(mi2)
air
(birds/mi2)
visibility
correction
factor1
estimate population
estimate
Z-statistic for type 1
error
Other duck
species3
Stratum
SEC 17,949 0.377 7.000 47,369 25,174
NHI 9,431 0.851 7.000 56,199 25,318
NLO 15,979 0.041 7.000 4,589 3,175
SWD 12,311 0.024 7.000 2,089 2,089
Subtotal 55,670 110,246 35,905 0.26 =0.79
Canada Geese
Stratum
SEC 17,949 2.405 1.922 82,972 16,312 NHI 9,431 1.713 1.922 31,054 9,642 NLO 15,979 0.769 1.922 23,629 7,523 SWD 12,311 0.861 1.922 20,368 8,788
Subtotal 55,670 158,023 22,201 0.94 =0.35
25
Figure 1. Transect Lines and Regions Surveyed

26
Figure 2. Climatology Divisions
1. Northwest
2. North Central
3. Northeast
4. West Central
5. Central
6. East Central
7. Southwest
8. South Central
9. Southeast

Figure 3.

Figure 4.

Figure 5.

Figure 6.

Figure 7.
The Wisconsin Department of Natural Resources provides equal opportunity in its employment, programs,
services, and functions under an Affirmative Action Plan. If you have any questions, please write to Equal
Opportunity Office, Department of Interior, Washington, D.C. 20240.
This publication can be made available in alternative formats (large print, Braille, audio tape,
etc.) upon request. Please call (608)266-8204 for more information.
WM-432