Waterford Public Schools K 12 Mathematics Curriculum
607
W W a a t t e e r r f f o o r r d d P P u u b b l l i i c c S S c c h h o o o o l l s s K K – – 1 1 2 2 M M a a t t h h e e m m a a t t i i c c s s C C u u r r r r i i c c u u l l u u m m
Transcript of Waterford Public Schools K 12 Mathematics Curriculum

WWaatteerrffoorrddPPuubblliiccSScchhoooollss
KK––1122MMaatthheemmaattiiccssCCuurrrriiccuulluumm
MATHEMATICS CURRICULUM TABLEOFCONTENTS
Position Statement ........................................................................................................................................................................................................ 1 Curriculum Revision Committee .................................................................................................................................................................................... 7 Kindergarten .................................................................................................................................................................................................................. 8 Grade 1 ......................................................................................................................................................................................................................... 31 Grade 2 ......................................................................................................................................................................................................................... 57 Grade 3 ......................................................................................................................................................................................................................... 83 Grade 4 ....................................................................................................................................................................................................................... 117 Grade 5 ....................................................................................................................................................................................................................... 156 Grade 6 ....................................................................................................................................................................................................................... 196 Grade 7 ....................................................................................................................................................................................................................... 242 Grade 8 ....................................................................................................................................................................................................................... 274 Grades 9‐12 Standards ............................................................................................................................................................................................... 304 Algebra I ‐ S ................................................................................................................................................................................................................ 409 Algebra I ‐ A ................................................................................................................................................................................................................ 424 Probability and Statistics ‐ S ....................................................................................................................................................................................... 444 Coastal Navigation ‐ S ................................................................................................................................................................................................ 451 Plane Geometry ‐ S .................................................................................................................................................................................................... 455 Plane Geometry ‐ A .................................................................................................................................................................................................... 470 Plane Geometry ‐ H .................................................................................................................................................................................................... 482 Algebra I ‐ S Part II ..................................................................................................................................................................................................... 494 Algebra II ‐ S ............................................................................................................................................................................................................... 508 Algebra II ‐ A ............................................................................................................................................................................................................... 522 Algebra II ‐ H ............................................................................................................................................................................................................... 537 Probability and Statistics ‐ A ...................................................................................................................................................................................... 552 Pre‐Calculus and Trigonometry ‐ A ............................................................................................................................................................................ 560 Pre‐Calculus and Trigonometry ‐ H ............................................................................................................................................................................ 576 Calculus ‐ A ................................................................................................................................................................................................................. 590 Calculus ‐ AP ............................................................................................................................................................................................................... 599
MATHEMATICS CURRICULUM CONNECTICUTSTATEDEPARTMENTOFEDUCATIONPOSITIONSTATEMENTONMATHEMATICSEDUCATION
1
The Connecticut State Board of Education believes that a high‐quality, comprehensive prekindergarten‐Grade 12 mathematics education is essential for students to become mathematically literate. To be mathematically literate, one must understand major mathematics concepts, possess computational facility and have the ability to apply these understandings to situations in daily life. Making connections between mathematics and other disciplines is a key to the appropriate application of mathematics skills and concepts to solve problems. The ability to read and write within the discipline of mathematics is an integral skill that supports mathematical understanding, reasoning and communication. Mathematically literate persons are able to make informed decisions about the world around them and have the interest and confidence to meet an increasingly quantitative, data‐rich global society’s needs and challenges. By the end of high school, students must be prepared to think critically, compute, reason, communicate and solve problems to ensure success in life. In addition, greater numbers of students need to be prepared to pursue careers in science, technology, engineering and mathematics (STEM) to help support the competitiveness and economic viability of their state and nation. The Board believes that a quality mathematics education must be part of the core curriculum for all Connecticut students to become mathematically literate. The core curriculum must be rigorous and focused on developing key mathematical concepts and skills as described in the state mathematics standards and curriculum documents. Highly qualified professionals must deliver the mathematics curriculum to the classroom’s diverse learners through effective instruction. Further, students need to be engaged in the mathematics curriculum and, as a result, view mathematics as a language that helps them to understand and organize their world. To accomplish these goals, the Board supports a balanced approach to mathematics education, which places equal importance on conceptual understanding, computational and procedural fluency and problem solving through a variety of strategies, tools and technologies. Adequate time and appropriate resources must be provided for this specialized instruction. To use time and resources effectively, administrators, teachers and other staff members must have opportunities to participate in ongoing, job‐embedded professional development to support instruction and student engagement. Meaningful partnerships among families, school districts, community organizations, businesses, industries and universities strengthen mathematics education. Each of these stakeholders is necessary to fulfill the Board’s vision of mathematics education as preparation for life, advanced studies and careers for all students. To sustain this collaborative effort, the Board developed “Guidelines for Policymakers,” a set of recommendations describing the roles and responsibilities for a high‐quality, comprehensive prekindergarten‐Grade 12 mathematics education program. These guidelines are outlined in a corresponding document. The Connecticut State Board of Education, in its 2009 Position Statement on Mathematics Education, calls for a systematic approach to ensure every Connecticut student receives a high‐quality, comprehensive, prekindergarten‐Grade 12 mathematics education. The Board provides the following guidelines to support this work and the collaboration among the state’s various stakeholders.

MATHEMATICS CURRICULUM CONNECTICUTSTATEDEPARTMENTOFEDUCATIONPOSITIONSTATEMENTONMATHEMATICSEDUCATION
2
DepartmentofEducationResponsibilities:1. Provide a vision for prekindergarten‐Grade 12 mathematics instruction aligned with national standards and the requirements for entry
into postsecondary study and careers. 2. Establish prekindergarten‐Grade 12 mathematics curriculum framework; standards; curriculum models; instructional strategies; sample
lesson plans; and formative and summative assessments, which clearly identify an aligned, coherent developmental progression of key mathematical concepts and skills for all Connecticut’s public school students.
3. Develop state assessments that are aligned with the learning expectations described in the mathematics curriculum framework. 4. Provide focused mathematics professional development opportunities for all Connecticut educators. 5. Recognize and disseminate research and best practices related to mathematics education. 6. Establish standards that ensure all Connecticut mathematics teachers are highly qualified. 7. Partner with the community, higher education institutions, businesses and industries to develop programs that support student interest
and mathematics learning in and beyond our schools. 8. Support families as partners to develop mathematical literacy.
SchoolDistrictResponsibilities:1. Implement high‐quality, comprehensive district prekindergarten–Grade 12 mathematics curriculum, instruction and assessments aligned
with state expectations. 2. Provide all students with the adequate time and support to learn mathematics. 3. Examine data to determine gaps in mathematics achievement and establish practices to eliminate these gaps in achievement. 4. Provide all teachers and all students with high‐quality instructional resources, including manipulatives, tools and technology. 5. Provide students technological access to mathematics coursework through online programs. 6. Ensure the integration of mathematics content within students’ learning experiences across content areas. 7. Provide administrators, teachers and staff members with ongoing, job‐embedded mathematics professional development opportunities
focused on content, pedagogy and cross‐content connections. 8. Employ highly qualified mathematics teachers and make appropriate use of teachers who have specialized mathematics training. 9. Provide mathematics teachers time to collaborate and develop high‐quality mathematics lessons and formative and summative
assessments. 10. Provide all teachers opportunities to meet, evaluate student work and analyze data to inform instruction and improve student
achievement. 11. Partner with the community, higher education institutions, businesses and industries to develop programs that support student interest
and learning of mathematics in and beyond our schools. 12. Support families as partners to develop mathematical literacy.

MATHEMATICS CURRICULUM CONNECTICUTSTATEDEPARTMENTOFEDUCATIONPOSITIONSTATEMENTONMATHEMATICSEDUCATION
3
EarlyChildhood1. Provide a high‐quality, comprehensive program to support a solid mathematical literacy foundation for all learners. 2. Provide personnel affiliated with early childhood programs opportunities to participate in high‐quality, job‐embedded professional
development. 3. Provide administrators, teachers and staff members opportunities to use scientifically based methods to gather and use information
about developing children’s understanding of mathematics. 4. Provide a learning environment rich in resources and materials that support the development of mathematics concepts and skills
according to students’ learning needs. 5. Ensure the integration of mathematics content within students’ learning experiences. 6. Support families as partners to develop mathematical literacy.
Elementary1. Ensure adequate daily instructional time for mathematics. 2. Provide a learning environment and experiences rich in resources and materials that support development of mathematical literacy. 3. Maintain class sizes to support instructional excellence. 4. Provide students developmentally appropriate opportunities to question, explore, observe, synthesize and draw conclusions based on
their mathematics understanding. 5. Provide students opportunities to develop literacy skills and read varied, culturally responsive fiction and nonfiction texts in the
mathematics classroom. 6. Ensure the integration of numeracy instruction within the context of students’ learning experiences in other disciplines. 7. Provide administrators, teachers and staff members opportunities to use scientifically based methods to gather and use information
about developing students’ understanding of mathematics. 8. Provide supplemental and intensive mathematics intervention and enrichment based on individual students’ learning needs. 9. Engage students in mathematics competitions and enrichment activities.
10. Support families and the community as partners to develop mathematical literacy. Secondary1. Provide adequate time and a positive environment to support student learning. 2. Maintain class sizes to support instructional excellence. 3. Ensure all students have access to a variety of advanced mathematics courses and opportunities to experience college‐level curriculum. 4. Provide students opportunities to develop literacy skills and read varied, culturally responsive fiction and nonfiction texts in the
mathematics classroom. 5. Provide students opportunities to explore science, technology, engineering and mathematics (STEM) careers (e.g., software analyst,
actuary, biostatistician, engineer, investment banker).

MATHEMATICS CURRICULUM CONNECTICUTSTATEDEPARTMENTOFEDUCATIONPOSITIONSTATEMENTONMATHEMATICSEDUCATION
4
6. Ensure the integration of mathematics content within the context of students’ learning experiences in other disciplines. 7. Provide administrators, teachers and staff members opportunities to use scientifically based methods to gather and use information
about developing students’ understanding of advanced mathematics. 8. Provide supplemental and intensive mathematics intervention and enrichment based on individual students’ learning needs. 9. Engage students in mathematics competitions and enrichment activities.
10. Support families and the community as partners to develop mathematical literacy. Administrators’ResponsibilitiesPrekindergarten–Grade12:1. Provide safe, effective learning environments at all levels. 2. Provide varied instructional materials and supporting technology at all levels. 3. Provide students technological access to mathematics instruction through online programs. 4. Remain current in mathematics content, pedagogy and cross‐content connections. 5. Provide teachers and staff members opportunities for ongoing, job‐embedded mathematics professional development focused on
content, pedagogy and cross‐content connections. 6. Implement a system of support for all students that includes supplemental and intensive mathematics intervention and enrichment. 7. Appropriately assign highly qualified mathematics teachers who are knowledgeable about content and pedagogy. 8. Recruit and train mathematics teacher leaders to coordinate and support mathematics instruction at all grade levels. 9. Provide mathematics teachers time to collaborate and develop high‐quality mathematics lessons and formative and summative
assessments. 10. Provide all teachers opportunities to meet, evaluate student work and analyze data to inform instruction and improve student
achievement. 11. Create and maintain partnerships with families, higher education, businesses and industries. 12. Encourage student interest and achievement in mathematics and other STEM‐related careers. Teachers’Responsibilities:1. Understand and use the mathematics curriculum, current research in mathematics instruction and the applications of mathematics. 2. Create supportive classrooms that enable students to meet rigorous standards and develop mathematical literacy. 3. Plan units and lessons to accommodate students with diverse needs, abilities and interests. 4. Use effective teaching strategies and appropriate materials, tools and technologies to engage students in learning mathematics. 5. Challenge students to think critically, communicate their understanding and problem solve. 6. Provide opportunities for students to explain their thinking verbally and in writing, examine the reasoning of others and give specific
feedback. 7. Use formative and summative assessments to monitor student achievement and adjust instruction. 8. Collaborate with peers to improve mathematics education for all students.

MATHEMATICS CURRICULUM CONNECTICUTSTATEDEPARTMENTOFEDUCATIONPOSITIONSTATEMENTONMATHEMATICSEDUCATION
5
9. Encourage students’ interest in mathematics and the investigation of STEM‐related careers. 10. Support families as partners to develop mathematical literacy. Students’Responsibilities(asdevelopmentallyappropriate):1. View mathematics as a language that helps them to organize and understand their world. 2. Build upon personal experiences and prior learning to understand mathematical concepts and apply them to real life. 3. Participate actively, think critically and communicate effectively about mathematical reasoning and solutions. 4. Use technology, literature and connections to other disciplines to better understand mathematics and support mathematical literacy. 5. Seek extra help, extracurricular activities and other assistance to ensure success in mathematics. 6. Pursue a course of study that includes high‐level mathematics. 7. Explore career options in STEM‐related fields.
HigherEducationResponsibilities:
1. Design programs that yield mathematically literate graduates. 2. Promote instructional practices supported by high‐quality research when available, and by accomplished instructors’ best professional
judgment and experience. 3. Attract and retain students in the pursuit of STEM‐related careers, including mathematics teaching. 4. Prepare educators with the content and pedagogy necessary to teach key concepts and skills to all learners. 5. Provide programs for mathematics specialists that focus on advancing their content knowledge, pedagogy and the leadership skills to
work with and support adult learners. 6. Ensure that educators learn assessment and statistical skills to measure, monitor and report student progress. 7. Provide future elementary and secondary teachers varied opportunities to work in schools and learn from veteran mathematics teachers
before earning certification. 8. Produce rigorous scientific research focused on mathematics instruction, learning, resources and assessment.
FamilyandCommunityResponsibilities:
1. Encourage students to talk about the mathematics they are learning at school and how it relates to daily life. 2. Engage children in mathematical activities related to daily routines such as counting, measurement, observing patterns and dealing with
money. 3. Provide for students opportunities to apply mathematics concepts and skills and participate in activities that foster the growth of
productive and mathematically literate members of society. 4. Encourage students to participate in high‐level mathematics courses. 5. Work with teachers and schools as partners to develop mathematical literacy.

MATHEMATICS CURRICULUM CONNECTICUTSTATEDEPARTMENTOFEDUCATIONPOSITIONSTATEMENTONMATHEMATICSEDUCATION
6
BusinessandIndustryResponsibilities:
1. Develop ongoing, systematic partnerships with schools to support and enhance mathematics programs. 2. Establish programs, activities and incentives to attract students in STEM‐related careers. 3. Provide teachers and students mentoring and internships. 4. Provide information about the importance of mathematical literacy to sustain the state’s economy. 5. Provide students, families and schools opportunities to participate in activities that foster the growth of productive and mathematically
literate members of society. References National Research Council. 2001. Adding It Up: Helping Children Learn Mathematics. Washington, D.C.: National Academy Press. National Council of Teachers of Mathematics (NCTM). 2000. Principles and Standards for School Mathematics. Reston, VA: NCTM. National Council of Teachers of Mathematics (NCTM). 2006. Curriculum Focal Points for Prekindergarten through Grade 8 Mathematics: A Quest
for Coherence. Reston, VA: NCTM. United States Department of Education. 2008. Foundations for Success: The Final Report of the National Mathematics Advisory Panel.
Washington, D.C.: U.S. Department of Education. Connecticut State Department of Education (CSDE). 2008. Connecticut’s Framework for RTI‐Using Scientific Research‐Based Interventions:
Improving Education for All Students. Hartford, CT: CSDE. Adopted: May 6, 2009

MATHEMATICS CURRICULUM CURRICULUMREVISIONCOMMITTEE
Waterford Public Schools 7
The following staff made significant contributions to the development of the K ‐ 12 Mathematics Curriculum:
William Bassett Mathematics Teacher, Waterford High School
Gloria Bradley Grade 3 Teacher, Quaker Hill Elementary School
Virginia Campbell Grade 1 Teacher, Oswegatchie Elementary School
Mark Capasso Mathematics Teacher, Clark Lane Middle School
Robert Cillino Grade 4 Teacher, Oswegatchie Elementary School
Katharine Cronin Mathematics Teacher, Waterford High School
Elissa DeVito Kindergarten Teacher, Quaker Hill Elementary School
Tracie Drabinski Mathematics Basic Skills Coordinator, All Elementary Schools
Michael Ellis Mathematics Department Chairperson, Waterford High School
Robert Jennings Mathematics Teacher, Waterford High School
Heather Joyner Mathematics Teacher, Clark Lane Middle School
Denise Lewis Grade 1 Teacher, Quaker Hill Elementary School
Patricia Lytle Mathematics Teacher, Waterford High School
Jeanne Morgan Special Education Teacher, Clark Lane Middle School
Emanuel Perry Mathematics Teacher, Waterford High School
Michelle Pyka Grade 2 Teacher, Great Neck Elementary School
Daniel Seltzer Mathematics Teacher, Clark Lane Middle School
Lisa Trott Grade 5 Teacher, Oswegatchie Elementary School
Jill Wile Mathematics Teacher, Waterford High School

KINDERGARTEN MATHEMATICS CURRICULUM OVERVIEW
Waterford Public Schools 8
CountingandCardinality(CC) Know number names and the count sequence. Count to tell the number of objects. Compare numbers.
OperationsandAlgebraicThinking(OA)
Understand addition as putting together and adding to, and understand subtraction as taking apart and taking from.
NumberandOperationsinBaseTen(NBT)
Work with numbers 11–19 to gain foundations for place value.
MeasurementandData(MD)
Describe and compare measurable attributes. Classify objects and count the number of objects in
categories.
Geometry(G) Identify and describe shapes. Analyze, compare, create, and compose shapes
MathematicalPractices(MP)
1. Make sense of problems and persevere in solving them. 2. Reason abstractly and quantitatively. 3. Construct viable arguments and critique the reasoning of
others. 4. Model with mathematics. 5. Use appropriate tools strategically. 6. Attend to precision. 7. Look for and make use of structure. 8. Look for and express regularity in repeated reasoning
Assessments:
Teacher‐Created C.F.A.’s and Benchmarks Resources:
My Math by McGraw‐Hill

KINDERGARTEN MATHEMATICS CURRICULUM COUNTINGANDCARDINALITY
Waterford Public Schools 9
Know number names and the count sequence
Common Core State Standard Unwrapped Standard Explanation and Examples
CC.K.CC.1 Count to 100 by ones and by tens.
A. Count to 100 by ones B. Count to 100 by tens
A. – B. The emphasis of this standard is on the counting sequence.
When counting by ones, students need to understand that the next number in the sequence is one more. When counting by tens, the next number in the sequence is “ten more” (or one more group of ten).
Instruction on the counting sequence should be scaffolded (e.g., 1‐10, then 1‐20, etc.). Counting should be reinforced throughout the day, not in isolation. Examples: Count the number of chairs of the students who are absent. Count the number of stairs, shoes, etc. Counting groups of ten such as “fingers in the classroom”
(ten fingers per student). When counting orally, students should recognize the patterns that exist from 1 to 100. They should also recognize the patterns that exist when counting by 10s.
CC.K.CC.2 Count forward beginning from a given number within the known sequence (instead of having to begin at 1).
A. Count forward beginning from a given number within the known sequence (instead of having to begin at 1).
A. The emphasis of this standard is on the counting sequence to 100. Students should be able to count forward from any number, 1‐99.

KINDERGARTEN MATHEMATICS CURRICULUM COUNTINGANDCARDINALITY
Waterford Public Schools 10
Common Core State Standard Unwrapped Standard Explanation and Examples CC.K.CC.3 Write numbers from 0 to 20. Represent a number of objects with a written numeral 0‐20 (with 0 representing a count of no objects).
A. Write numbers 0‐20. B. Represent a number of
objects with a written numeral 0‐20.
A. – B. Students should be given multiple opportunities to count objects and recognize that a number represents a specific quantity. Once this is established, students begin to read and write numerals (numerals are the symbols for the quantities). The emphasis should first be on quantity and then connecting quantities to the written symbols. A sample unit sequence might include: Counting up to 20 objects in many settings and situations
over several weeks. Beginning to recognize, identify, and read the written
numerals, and match the numerals to given sets of objects. Writing the numerals to represent counted objects.
Since the teen numbers are not written as they are said, teaching the teen numbers as one group of ten and extra ones is foundational to understanding both the concept and the symbol that represents each teen number. For example, when focusing on the number “14,” students should count out fourteen objects using one‐to‐one correspondence and then use those objects to make one group of ten and four extra ones. Students should connect the representation to the symbol “14.”

KINDERGARTEN MATHEMATICS CURRICULUM COUNTINGANDCARDINALITY
Waterford Public Schools 11
Count to tell the numbers of objects Understand the relationship between numbers and quantities
Connect counting to cardinality
Common Core State Standard Unwrapped Standard Explanation and Examples
CC.K.CC.4a When counting objects, say the number names in the standard order, pairing each object with one and only one number name and each number name with one and only one object.
A. Say the names of objects in standard order.
B. Pair each object with one and only one number name.
A. – B. This standard focuses on one‐to‐one correspondence and how cardinality connects with quantity. For example, when counting three bears, the student should
use the counting sequence, “1‐2‐3,” to count the bears and recognize that “three” represents the group of bears, not just the third bear. A student may use an interactive whiteboard to count objects, cluster the objects, and state, “This is three”.
CC.K.CC.4b Understand that the last number name said tells the number of objects counted. The number of objects is the same regardless of their arrangement or the order in which they were counted.
A. Understand that the last number name said tells the number of objects counted.
A. In order to understand that each successive number name refers to a quantity that is one larger, students should have experience counting objects, placing one more object in the group at a time. For example, using cubes, the student should count the existing group, and then place another cube in the set. Some students may need to re‐count from one, but the goal is that they would count on from the existing number of cubes. S/he should continue placing one more cube at a time and identify the total number in order to see that the counting sequence results in a quantity that is one larger each time one more cube is placed in the group.

KINDERGARTEN MATHEMATICS CURRICULUM COUNTINGANDCARDINALITY
Waterford Public Schools 12
Common Core State Standard Unwrapped Standard Explanation and Examples CC.K.CC.4c Understand that each successive number name refers to a quantity that is one larger.
A. Understand that each successive number name refers to a quantity that is one larger.
A. This standard focuses on one‐to‐one correspondence and how cardinality connects with quantity. For example, when counting three bears, the student should
use the counting sequence, “1‐2‐3,” to count the bears and recognize that “three” represents the group of bears, not just the third bear. A student may use an interactive whiteboard to count objects, cluster the objects, and state, “This is three”.
In order to understand that each successive number name refers to a quantity that is one larger, students should have experience counting objects, placing one more object in the group at a time. For example, using cubes, the student should count the
existing group, and then place another cube in the set. Some students may need to re‐count from one, but the goal is that they would count on from the existing number of cubes. S/he should continue placing one more cube at a time and identify the total number in order to see that the counting sequence results in a quantity that is one larger each time one more cube is placed in the group.

KINDERGARTEN MATHEMATICS CURRICULUM COUNTINGANDCARDINALITY
Waterford Public Schools 13
Common Core State Standard Unwrapped Standard Explanation and Examples CC.K.CC.5 Count to answer "how many?" questions about as many as 20 things arranged in a line, a rectangular array, or a circle; or as many as 10 things in a scattered configuration; given a number from 1‐20, count out that many objects.
A. Count to answer “how many?” questions about as many as 20 things arranged in a line, a rectangular array, or a circle.
B. Count to answer “how many?” questions about as many as 10 things in a scattered configuration.
C. Given a number from 1‐20, count out that many objects.
A. – C. Students should develop counting strategies to help them organize the counting process to avoid re‐counting or skipping objects. Examples: If items are placed in a circle, the student may mark or
identify the starting object. If items are in a scattered configuration, the student may
move the objects into an organized pattern. Some students may choose to use grouping strategies such as
placing objects in twos, fives, or tens (note: this is not a kindergarten expectation).
Counting up to 20 objects should be reinforced when collecting data to create charts and graphs.
A student may use a clicker (electronic response system) to communicate his/her count to the teacher.

KINDERGARTEN MATHEMATICS CURRICULUM COUNTINGANDCARDINALITY
Waterford Public Schools 14
Compare numbers
Common Core State Standard Unwrapped Standard Explanation and Examples
CC.K.CC.6 Identify whether the number of objects in one group is greater than, less than, or equal to the number of objects in another group, e.g., by using matching and counting strategies. (Include groups with up to ten objects.)
Identify whether the number of objects in one group is greater than, less than, or equal to the number of objects in another group up to 10.
A. Students should develop a strong sense of the relationship between quantities and numerals before they begin comparing numbers. Other strategies: Matching: Students use one‐to‐one correspondence,
repeatedly matching one object from one set with one object from the other set to determine which set has more objects.
Counting: Students count the objects in each set, and then identify which set has more, less, or an equal number of objects.
Observation: Students may use observation to compare two quantities (e.g., by looking at two sets of objects, they may be able to tell which set has more or less without counting).
Observations in comparing two quantities can be accomplished through daily routines of collecting and organizing data in displays. Students create object graphs and pictographs using data relevant to their lives (e.g., favorite ice cream, eye color, pets, etc.). Graphs may be constructed by groups of students as well as by individual students.
Benchmark Numbers: This would be the appropriate time to introduce the use of 0, 5 and 10 as benchmark numbers to help students further develop their sense of quantity as well as their ability to compare numbers.
Students state whether the number of objects in a set is more, less, or equal to a set that has 0, 5, or 10 objects.

KINDERGARTEN MATHEMATICS CURRICULUM COUNTINGANDCARDINALITY
Waterford Public Schools 15
Common Core State Standard Unwrapped Standard Explanation and Examples CC.K.CC.7 Compare two numbers between 1 and 10 presented as written numerals.
Compare two numbers between 1‐10 presented as written numerals.
A. Given two numerals, students should determine which is greater or less than the other.

KINDERGARTEN MATHEMATICS CURRICULUM OPERATIONSANDALGEBRAICTHINKING
Waterford Public Schools 16
Understand addition as putting together and adding to, and understanding subtraction as taking apart and taking from
Common Core State Standard Unwrapped Standard Explanation and Examples
CC.K.OA.1 Represent addition and subtraction with objects, fingers, mental images, drawings (drawings need not show details, but should show the mathematics in the problem), sounds (e.g., claps), acting out situations, verbal explanations, expressions, or equations.
A. Represent addition with objects, fingers, mental images, drawings, sounds, acting out situations, verbal explanations, expressions, or equations.
B. Represent subtraction with objects, fingers, mental images, drawings, sounds, acting out situations, verbal explanations, expressions, or equations.
A. – B. Using addition and subtraction in a word problem context allows students to develop their understanding of what it means to add and subtract. Students should use objects, fingers, mental images, drawing, sounds, acting out situations and verbal explanations in order to develop the concepts of addition and subtraction. Then, they should be introduced to writing expressions and equations using appropriate terminology and symbols which include “+,” “–,” and “=”. Addition terminology: add, join, put together, plus, combine,
total Subtraction terminology: minus, take away, separate,
difference, compare Students may use interactive whiteboards to represent the concept of addition or subtraction. This gives them the opportunity to communicate their thinking.
CC.K.OA.2 Solve addition and subtraction word problems, and add and subtract within 10, e.g., by using objects or drawings to represent the problem.
A. Solve addition word problems within 10.
B. Solve subtraction word problems within 10.
A. – B. Using a word problem context allows students to develop their understanding about what it means to add and subtract. Addition is putting together and adding to. Subtraction is taking apart and taking from. Kindergarteners develop the concept of addition/subtraction by modeling the actions in word problem using objects, fingers, mental images, drawings, sounds, acting out situations, and/or verbal explanations. Students may use different representations based on their experiences, preferences, etc. They may connect their conceptual representations of the situation using symbols, expressions, and/or equations. Students should

KINDERGARTEN MATHEMATICS CURRICULUM OPERATIONSANDALGEBRAICTHINKING
Waterford Public Schools 17
Common Core State Standard Unwrapped Standard Explanation and Examples experience the following addition and subtraction problem types Add To word problems, such as, “Mia had 3 apples. Her friend
gave her 2 more. How many does she have now?” o A student’s “think aloud” of this problem might be, “I
know that Mia has some apples and she’s getting some more. So she’s going to end up with more apples than she started with.”
Take From problems such as: o José had 8 markers and he gave 2 away. How many does
he have now? When modeled, a student would begin with 8 objects and remove two to get the result.
Put Together/Take Apart problems with Total Unknown gives students opportunities to work with addition in another context such as:
o There are 2 red apples on the counter and 3 green apples on the counter. How many apples are on the counter?
Solving Put Together/Take Apart problems with Both Addends Unknown provides students with experiences with finding all the decompositions of a number and investigating the patterns involved.
o There are 10 apples on the counter. Some are red and some are green. How many apples could be green? How many apples could be red?
Students may use interactive whiteboard to demonstrate addition or subtraction strategies. This gives them the opportunity to communicate and justify their thinking.
CC.K.OA.3 Decompose numbers less than or equal to 10 into pairs in more than one way, e.g., by using objects or drawings, and record each decomposition by a drawing or equation (e.g., 5 = 2 + 3 and 5 = 4 + 1).
A. Decompose numbers less than or equal to 10 into pairs in more than one way.
A. This standard focuses on number pairs which add to a specified total, 1‐10. These number pairs may be examined either in or out of context. Students may use objects such as cubes, two‐color counters,

KINDERGARTEN MATHEMATICS CURRICULUM OPERATIONSANDALGEBRAICTHINKING
Waterford Public Schools 18
Common Core State Standard Unwrapped Standard Explanation and Examples square tiles, etc. to show different number pairs for a given number. For example, for the number 5, students may split a set of 5 objects into 1 and 4, 2 and 3, etc. Students may also use drawings to show different number pairs for a given number. For example, students may draw 5 objects, showing how to decompose in several ways.
Sample unit sequence: A contextual problem (word problem) is presented to the
students such as, “Mia goes to Nan’s house. Nan tells her she may have 5 pieces of fruit to take home. There are lots of apples and bananas. How many of each can she take?”
Students find related number pairs using objects (such as cubes or two‐color counters), drawings, and/or equations. Students may use different representations based on their experiences, preferences, etc.
Students may write equations that equal 5 such as: o 5=4+1 o 3+2=5 o 2+3=4+1
This is a good opportunity for students to systematically list all the possible number pairs for a given number. For example, all the number pairs for 5 could be listed as 0+5, 1+4, 2+3, 3+2, 4+1, and 5+0. Students should describe the pattern that they see in the addends, e.g., each number is one less or one than the previous addend.
KINDERGARTEN MATHEMATICS CURRICULUM OPERATIONSANDALGEBRAICTHINKING
Waterford Public Schools 19
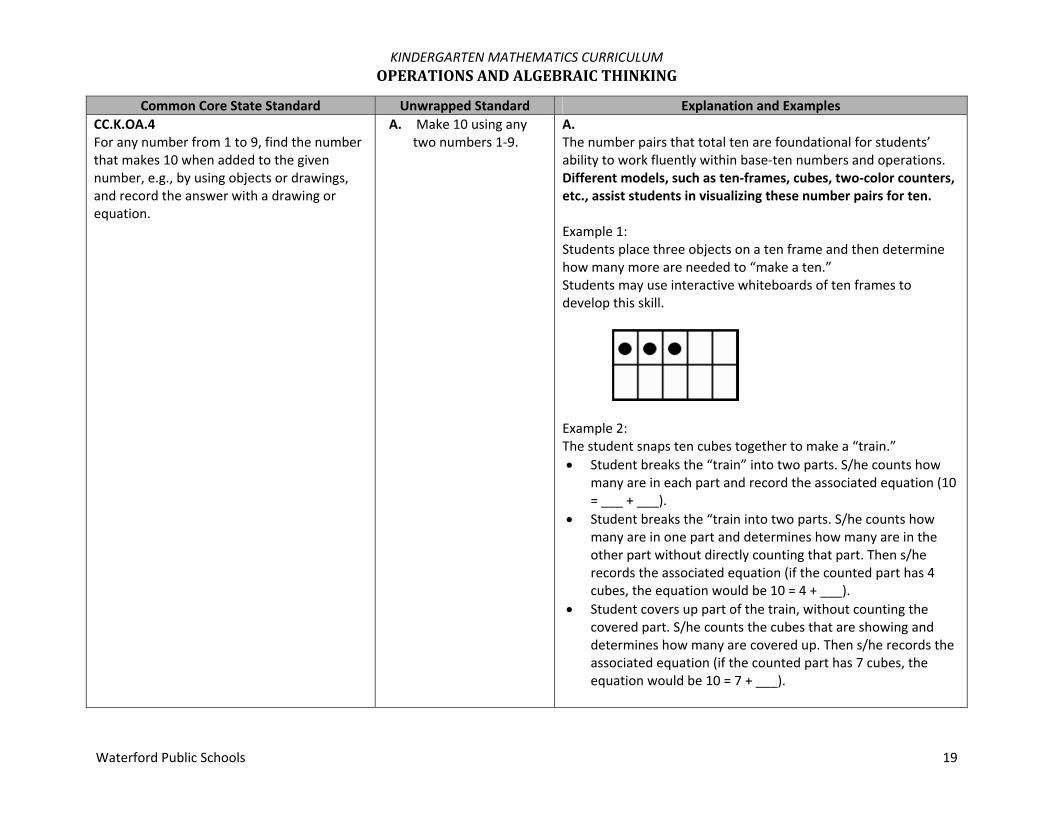
Common Core State Standard Unwrapped Standard Explanation and Examples CC.K.OA.4 For any number from 1 to 9, find the number that makes 10 when added to the given number, e.g., by using objects or drawings, and record the answer with a drawing or equation.
A. Make 10 using any two numbers 1‐9.
A. The number pairs that total ten are foundational for students’ ability to work fluently within base‐ten numbers and operations. Different models, such as ten‐frames, cubes, two‐color counters, etc., assist students in visualizing these number pairs for ten. Example 1: Students place three objects on a ten frame and then determine how many more are needed to “make a ten.” Students may use interactive whiteboards of ten frames to develop this skill.
Example 2: The student snaps ten cubes together to make a “train.” Student breaks the “train” into two parts. S/he counts how
many are in each part and record the associated equation (10 = ___ + ___).
Student breaks the “train into two parts. S/he counts how many are in one part and determines how many are in the other part without directly counting that part. Then s/he records the associated equation (if the counted part has 4 cubes, the equation would be 10 = 4 + ___).
Student covers up part of the train, without counting the covered part. S/he counts the cubes that are showing and determines how many are covered up. Then s/he records the associated equation (if the counted part has 7 cubes, the equation would be 10 = 7 + ___).
KINDERGARTEN MATHEMATICS CURRICULUM OPERATIONSANDALGEBRAICTHINKING
Waterford Public Schools 20
Common Core State Standard Unwrapped Standard Explanation and Examples Example 3: The student tosses ten two‐color counters on the table and records how many of each color are facing up.
CC.K.OA.5 Fluently add and subtract within 5.
A. Fluently add within 5. B. Fluently subtract
within 5.
A. – B. This standard focuses on students being able to add and subtract numbers within 5. Adding and subtracting fluently refers to knowledge of procedures, knowledge of when and how to use them appropriately, and skill in performing them flexibly, accurately, and efficiently. Strategies students may use to attain fluency include: Counting on (e.g., for 3+2, students will state, “3,” and then
count on two more, “4, 5,” and state the solution is “5”) Counting back (e.g., for 4‐3, students will state, “4,” and then
count back three, “3, 2, 1” and state the solution is “1”) Counting up to subtract (e.g., for 5‐3, students will say, “3,”
and then count up until they get to 5, keeping track of how many they counted up, stating that the solution is “2”)
Using doubles (e.g., for 2+3, students may say, “I know that 2+2 is 4, and 1 more is 5”)
Using commutative property (e.g., students may say, “I know that 2+1=3, so 1+2=3”)
Using fact families (e.g., students may say, “I know that 2+3=5, so 5‐3=2”)
Students may use interactive whiteboard of five frames to develop fluency of these facts.

KINDERGARTEN MATHEMATICS CURRICULUM NUMBERANDOPERATIONSINBASETEN
Waterford Public Schools 21
Work with numbers 11‐19 to gain foundations for place value
Common Core State Standard Unwrapped Standard Explanation and Examples
CC.K.NBT.1 Compose and decompose numbers from 11 to 19 into ten ones and some further ones, e.g., by using objects or drawings, and record each composition or decomposition by a drawing or equation (such as 18 = 10 + 8); understand that these numbers are composed of ten ones and one, two, three, four, five, six, seven, eight, or nine ones.
A. Compose numbers from 1‐19 into ten ones and some further ones.
B. Decompose numbers from 1‐19 into ten ones and some further ones.
C. Record each composition or decomposition by a drawing or equation.
D. Understand that these numbers are composed of ten ones and 1,2, 3, etc. ones.
A. – D. Special attention needs to be paid to this set of numbers as they do not follow a consistent pattern in the verbal counting sequence. Eleven and twelve are special number words. “Teen” means one “ten” plus ones. The verbal counting sequence for teen numbers is backwards
– we say the ones digit before the tens digit. For example “27” reads tens to ones (twenty‐seven), but 17 reads ones to tens (seven‐teen).
In order for students to interpret the meaning of written teen numbers, they should read the number as well as describe the quantity. For example, for 15, the students should read “fifteen” and state that it is one group of ten and five ones and record that 15 = 10 + 5.
Teaching the teen numbers as one group of ten and extra ones is foundational to understanding both the concept and the symbol that represent each teen number. For example, when focusing on the number “14,” students should count out fourteen objects using one‐to‐one correspondence and then use those objects to make one group of ten ones and four additional ones. Students should connect the representation to the symbol “14.” Students should recognize the pattern that exists in the teen numbers; every teen number is written with a 1 (representing one ten) and ends with the digit that is first stated.

KINDERGARTEN MATHEMATICS CURRICULUM MEASUREMENTANDDATA
Waterford Public Schools 22
Describe and compare measurable attributes
Common Core State Standard Unwrapped Standard Explanation and Examples
CC.K.MD.1 Describe measurable attributes of objects, such as length or weight. Describe several measurable attributes of a single object.
A. Describe measurable attributes of objects, such as length or weight.
B. Describe several measurable attributes of a single object, such as width, height, how much liquid can fit inside.
A. – B. In order to describe attributes such as length and weight, students must have many opportunities to informally explore these attributes. Students should compare objects verbally and then focus on
specific attributes when making verbal comparisons for K.MD.2. They may identify measurable attributes such as length, width, height, and weight. For example, when describing a soda can, a student may talk about how tall, how wide, how heavy, or how much liquid can fit inside. These are all measurable attributes. Non‐measurable attributes include: words on the object, colors, pictures, etc.
An interactive whiteboard may be used to model objects with measurable attributes.
CC.K.MD.2 Directly compare two objects with a measurable attribute in common, to see which object has “more of”/”less of” the attribute, and describe the difference. For example, directly compare the heights of two children and describe one child as taller/shorter.
A. Compare two objects with a measurable attribute in common.
A. When making direct comparisons for length, students must attend to the “starting point” of each object. For example, the ends need to be lined up at the same point, or students need to compensate when the starting points are not lined up (conservation of length includes understanding that if an object is moved, its length does not change; an important concept when comparing the lengths of two objects). Language plays an important role in this standard as students describe the similarities and differences of measurable attributes of objects (e.g., shorter than, taller than, lighter than, the same as, etc.). An interactive whiteboard may be used to compare objects with measurable attributes.

KINDERGARTEN MATHEMATICS CURRICULUM MEASUREMENTANDDATA
Waterford Public Schools 23
Classify objects and count the number of objects in each category
Common Core State Standard Unwrapped Standard Explanation and Examples
CC.K.MD.3 Classify objects into given categories; count the numbers of objects in each category and sort the categories by count. (Limit category counts to be less than or equal to 10.)
A. Classify objects into given categories
B. Count the number of objects in each category
C. Sort the categories by count (less than or equal to 10)
A. – C. Possible objects to sort include buttons, shells, shapes, beans, etc. After sorting and counting, it is important for students to: explain how they sorted the objects; label each set with a category; answer a variety of counting questions that ask, “How many
…”; and compare sorted groups using words such as, “most”, “least”,
“alike” and “different”. Students should be introduced to the use of tally marks to compare the size of groups.

KINDERGARTEN MATHEMATICS CURRICULUM GEOMETRY
Waterford Public Schools 24
Identify and describe shapes (such as squares, circles, triangles, rectangles, hexagons, cubes, cones, cylinders, & spheres)
Common Core State Standard Unwrapped Standard Explanation and Examples
CC.K.G.1 Describe objects in the environment using names of shapes, and describe the relative positions of these objects using terms such as above, below, beside, in front of, behind, and next to.
Describe objects in the environment using names of shapes.
Describe the relative positions of these objects using terms such as above, below, beside, in front of, behind, and next to.
A. – B. Examples of environments in which students would be encouraged to identify shapes would include nature, buildings, and the classroom using positional words in their descriptions. Teachers should work with children and pose four mathematical questions: Which way? How far? Where? And what objects? To answer these questions, children develop a variety of important skills contributing to their spatial thinking. Examples: Teacher holds up an object such as an ice cream cone, a
number cube, ball, etc. and asks students to identify the shape. Teacher holds up a can of soup and asks,” What shape is this can?” Students respond “cylinder!”
Teacher places an object next to, behind, above, below, beside, or in front of another object and asks positional questions. Where is the water bottle? (water bottle is placed behind a book) Students say “The water bottle is behind the book.”
Students should have multiple opportunities to identify shapes; these may be displayed as photographs, or pictures using the document camera or interactive whiteboard.

KINDERGARTEN MATHEMATICS CURRICULUM GEOMETRY
Waterford Public Schools 25
Common Core State Standard Unwrapped Standard Explanation and Examples CC.K.G.2 Correctly name shapes regardless of their orientations or overall size.
A. Name shapes regardless of their orientations or overall size.
A. Students should be exposed to many types of triangles in many different orientations in order to eliminate the misconception that a triangle is always right‐side‐up and equilateral. Students should also be exposed to many shapes in many different sizes. Examples: Teacher makes pairs of paper shapes that are different sizes.
Each student is given one shape and the objective is to find the partner who has the same shape.
Teacher brings in a variety of spheres (tennis ball, basketball, globe, ping pong ball, etc.) to demonstrate that size doesn’t change the name of a shape.
CC.K.G.3 Identify shapes as two‐dimensional (lying in a plane, "flat") or three‐dimensional ("solid").
A. Identify shapes as two‐dimensional (lying in a plane, "flat") or three‐dimensional ("solid").
A. Student should be able to differentiate between two dimensional and three dimensional shapes. Student names a picture of a shape as two dimensional
because it is flat and can be measured in only two ways (length and width).
Student names an object as three dimensional because it is not flat (it is a solid object/shape) and can be measured in three different ways (length, width, height/depth).

KINDERGARTEN MATHEMATICS CURRICULUM GEOMETRY
Waterford Public Schools 26
Analyze, compare, create, and compose shapes
Common Core State Standard Unwrapped Standard Explanation and Examples
CC.K.G.4 Analyze and compare a variety of two‐ and three‐dimensional shapes, in different sizes and orientations, using informal language to describe their similarities, differences, parts (e.g., number of sides and vertices/"corners") and other attributes (e.g., having sides of equal length).
Analyze a variety of 2‐and 3‐dimensional shapes
Compare a variety of 2‐and 3‐dimensional shapes
Use informal language to describe similarities, differences, parts (e.g., number of sides and vertices/"corners") & other attributes (e.g., having sides of equal length).
A. – C. Students analyze and compare two‐ and three‐dimensional shapes by observations. Their visual thinking enables them to determine if things are alike or different based on the appearance of the shape. Students sort objects based on appearance. Even in early explorations of geometric properties, they are introduced to how categories of shapes are subsumed within other categories. For instance, they will recognize that a square is a special type of rectangle. Students should be exposed to triangles, rectangles, and hexagons whose sides are not all congruent. They first begin to describe these shapes using everyday language and then refine their vocabulary to include sides and vertices/corners. Opportunities to work with pictorial representations, concrete objects, as well as technology helps student develop their understanding and descriptive vocabulary for both two‐ and three‐ dimensional shapes.
CC.K.G.5 Model shapes in the world by building shapes from components (e.g., sticks and clay balls) and drawing shapes.
Draw 2‐dimensional shapes.
Build 3‐dimensional shapes.
A. – B. Because two‐dimensional shapes are flat and three‐dimensional shapes are solid, students should draw two‐dimensional shapes and build three‐dimensional shapes. Shapes may be built using materials such as clay, toothpicks, marshmallows, gumdrops, straws, etc.

KINDERGARTEN MATHEMATICS CURRICULUM GEOMETRY
Waterford Public Schools 27
Common Core State Standard Unwrapped Standard Explanation and Examples CC.K.G.6 Compose simple shapes to form larger shapes. For example, “Can you join these two triangles with full sides touching to make a rectangle?”
A. Make new two‐ and three‐dimensional shapes
A. Students use pattern blocks, tiles, or paper shapes and technology to make new two‐ and three‐dimensional shapes. Their investigations allow them to determine what kinds of shapes they can join to create new shapes. They answer questions such as “What shapes can you use to make a square, rectangle, circle, triangle? …etc.” Students may use promethean board to copy shapes and compose new shapes. They should describe and name the new shape.

KINDERGARTEN MATHEMATICS CURRICULUM PACINGGUIDE
Waterford Public Schools 28
Trimester1
Unit Title Pacing Standards (Power Standards in Bold)
1. Counting and Matching Numerals 0‐5 with Comparing
Mathematical Practices: 1,2,4,6,7,8 4 weeks
K.CC.1 Count by ones and tens. K.CC.3 Write and represent numbers. K.CC.4 Counting objects in standard order. Last number names the whole group. Each number is one larger. K.CC.5 Count to answer “how many” questions. K.CC.6 Identify greater than, less that, or equal to. K.CC.7 Compare two numbers as written numerals. K.MD.3 Classify objects into given categories and sort by count.
2. Counting and Matching Numerals 6‐10 with Comparing
Mathematical Practices: 1,2,4,5,6,7,8
3 weeks
K.CC.1 Count by ones and tens. K.CC.3 Write and represent numbers. K.CC.4 Counting objects in standard order. Last number names the whole group. Each number is one larger. K.CC.5 Count to answer “how many” questions K.CC.6 Identify greater than, less that, or equal to. K.CC.7 Compare two numbers as written numerals. K.MD.3 Classify objects into given categories and sort by count.
3. Counting and Matching Numerals 11‐20
Mathematical Practices: 1,2,3,4,5,6,7,8 4 weeks
K.CC.1 Count by ones and tens. K.CC.2 Count forward from given number. K.CC.3 Write and represent numbers. K.CC.4 Counting objects in standard order. Last number names the whole group. Each number is one larger. K.CC.5 Count to answer “how many” questions

KINDERGARTEN MATHEMATICS CURRICULUM PACINGGUIDE
Waterford Public Schools 29
Trimester2
Unit Title Pacing Standards (Power Standards in Bold)
4. Identify and Describe 2‐D and 3‐D Shapes
Mathematical practices: 1,2,3,4,5,6,7 2 weeks
K.MD.3 Classify objects into given categories and sort by count. K.G.1 Describe objects using positional words. K.G.2 Name shapes regardless of size and orientation. K.G.3 Identify 2‐D and 3‐D shapes. K.G.4 Analyze and Compare 2‐D and 3‐D shapes by attributes. K.G.5 Model shapes in the world.
5. Addition and Subtraction within 0‐5
Mathematical practices: 1,2,3,4,5,6,7,8 4 weeks
K.CC.1 Count by ones and tens. K.CC.2 Count forward from given number. K.CC.3 Write and represent numbers. K.CC.4 Counting objects in standard order. Last number names the whole group. Each number is one larger. K.CC.5 Count to answer “how many” questions K.OA.1 Represent addition and subtraction with objects. K.OA.2 Solve addition and subtraction word problems. K.OA.3 Decompose numbers less than or equal to 10 in pairs in multiple
ways. K.OA.5 Fluently add and subtract within 5.
6. Addition and Subtraction within 10
Mathematical practices: 1,2,3,4,5,6,7,8 4 weeks
K.CC.1 Count by ones and tens. K.CC.2 Count forward from given number. K.CC.3 Write and represent numbers. K.CC.4 Counting objects in standard order. Last number names the whole group. Each number is one larger. K.CC.5 Count to answer “how many” questions K.OA.1 Represent addition and subtraction with objects. K.OA.2 Solve addition and subtraction word problems. K.OA.3 Decompose numbers less than or equal to 10 in pairs in multiple
ways. K.OA.4 Make 10 using any two numbers between 1‐9. K.OA.5 Fluently add and subtract within 5.
KINDERGARTEN MATHEMATICS CURRICULUM PACINGGUIDE
Waterford Public Schools 30
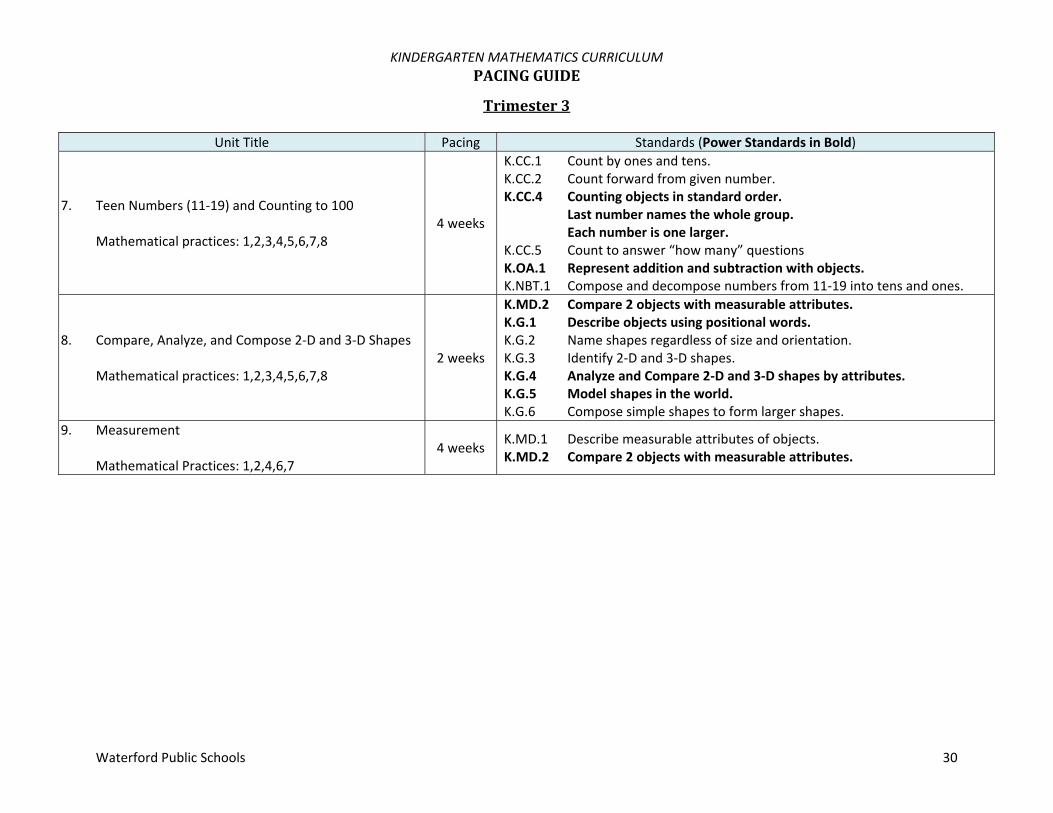
Trimester3
Unit Title Pacing Standards (Power Standards in Bold)
7. Teen Numbers (11‐19) and Counting to 100 Mathematical practices: 1,2,3,4,5,6,7,8
4 weeks
K.CC.1 Count by ones and tens. K.CC.2 Count forward from given number. K.CC.4 Counting objects in standard order. Last number names the whole group. Each number is one larger. K.CC.5 Count to answer “how many” questions K.OA.1 Represent addition and subtraction with objects. K.NBT.1 Compose and decompose numbers from 11‐19 into tens and ones.
8. Compare, Analyze, and Compose 2‐D and 3‐D Shapes Mathematical practices: 1,2,3,4,5,6,7,8
2 weeks
K.MD.2 Compare 2 objects with measurable attributes. K.G.1 Describe objects using positional words. K.G.2 Name shapes regardless of size and orientation. K.G.3 Identify 2‐D and 3‐D shapes. K.G.4 Analyze and Compare 2‐D and 3‐D shapes by attributes. K.G.5 Model shapes in the world. K.G.6 Compose simple shapes to form larger shapes.
9. Measurement Mathematical Practices: 1,2,4,6,7
4 weeks K.MD.1 Describe measurable attributes of objects. K.MD.2 Compare 2 objects with measurable attributes.
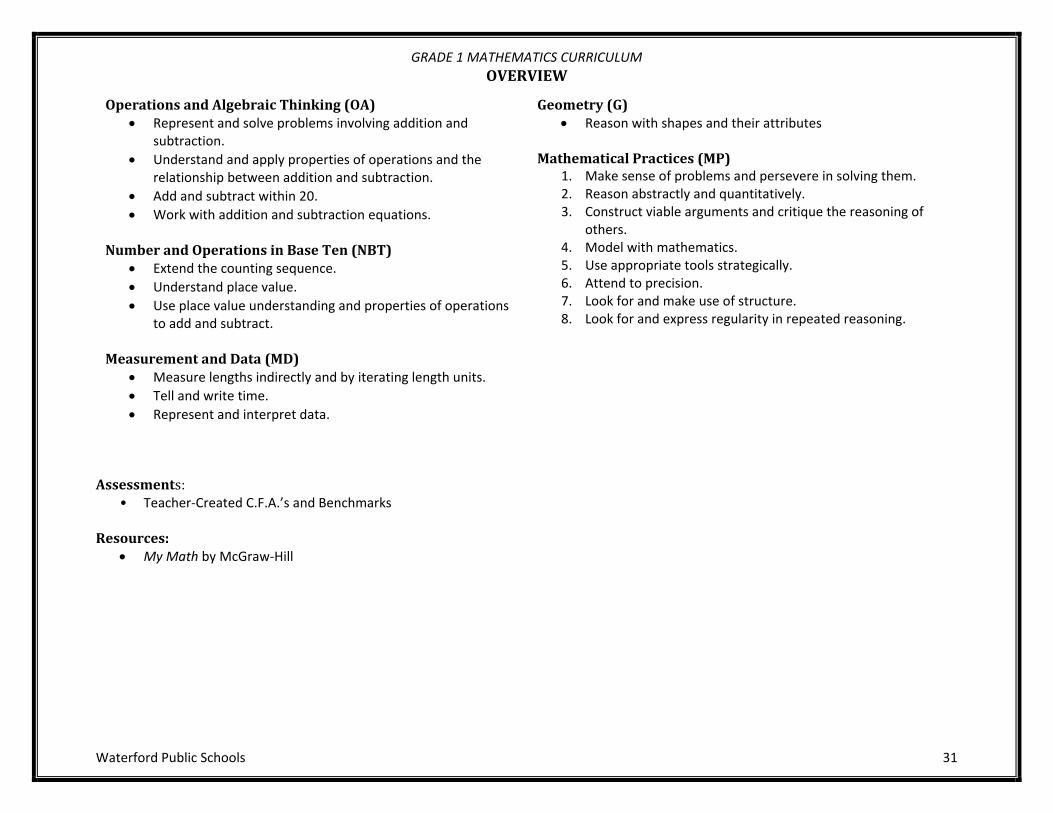
GRADE 1 MATHEMATICS CURRICULUM OVERVIEW
Waterford Public Schools 31
OperationsandAlgebraicThinking(OA) Represent and solve problems involving addition and
subtraction. Understand and apply properties of operations and the
relationship between addition and subtraction. Add and subtract within 20. Work with addition and subtraction equations.
NumberandOperationsinBaseTen(NBT)
Extend the counting sequence. Understand place value. Use place value understanding and properties of operations
to add and subtract. MeasurementandData(MD)
Measure lengths indirectly and by iterating length units. Tell and write time. Represent and interpret data.
Geometry(G) Reason with shapes and their attributes
MathematicalPractices(MP)
1. Make sense of problems and persevere in solving them. 2. Reason abstractly and quantitatively. 3. Construct viable arguments and critique the reasoning of
others. 4. Model with mathematics. 5. Use appropriate tools strategically. 6. Attend to precision. 7. Look for and make use of structure. 8. Look for and express regularity in repeated reasoning.
Assessments:
• Teacher‐Created C.F.A.’s and Benchmarks Resources:
My Math by McGraw‐Hill

GRADE 1 MATHEMATICS CURRICULUM OPERATIONSANDALGEBRAICTHINKING
Waterford Public Schools 32
Represent and solve problems involving addition and subtraction
Common Core State Standard Unwrapped Standard Explanation and Examples
CC.1.OA.1 Use addition and subtraction within 20 to solve word problems involving situations of adding to, taking from, putting together, taking apart, and comparing, with unknowns in all positions, e.g., by using objects, drawings, and equations with a symbol for the unknown number to represent the problem.
A. Use addition within 20 to solve word problems. (adding to, putting together, comparing)
B. Use subtraction within 20 to solve word problems. ( taking from, taking apart, comparing)
C. Solve problems (addition and subtraction within 20) with unknowns in all positions.
D. Use a symbol for the unknown number to represent the problem
A. – D. Contextual problems that are closely connected to students’ lives should be used to develop fluency with addition and subtraction. Four different addition and subtraction situations can be written in light of their relationship to the position of the unknown. Students use objects or drawings to represent the different situations. Take From example: Abel has 9 balls. He gave 3 to Susan.
How many balls does Abel have now?
Compare example: Abel has 9 balls. Susan has 3 balls. How many more balls does Abel have than Susan? A student will use 9 objects to represent Abel’s 9 balls and 3 objects to represent Susan’s 3 balls. Then they will compare the 2 sets of objects.
Note that even though the modeling of the two problems above is different, the equation, 9 ‐ 3 = ?, can represent both situations yet the compare example can also be represented by 3 + ? = 9 (How many more do I need to make 9?)
It is important to attend to the difficulty level of the problem

GRADE 1 MATHEMATICS CURRICULUM OPERATIONSANDALGEBRAICTHINKING
Waterford Public Schools 33
Common Core State Standard Unwrapped Standard Explanation and Examples situations in relation to the position of the unknown. Result Unknown, Total Unknown, and Both Addends
Unknown problems are the least complex for students. The next level of difficulty includes Change Unknown, Addend
Unknown, and Difference Unknown The most difficult are Start Unknown and versions of Bigger
and Smaller Unknown (compare problems). CC.1.OA.2 Solve word problems that call for addition of three whole numbers whose sum is less than or equal to 20, e.g., by using objects, drawings, and equations with a symbol for the unknown number to represent the problem.
A. Solve word problems involving addition for sums less than 20.
B. Use a symbol for the unknown number to represent the problem
A. – B. To further students’ understanding of the concept of addition, students create word problems with three addends. They can also increase their estimation skills by creating problems in which the sum is less than 5, 10 or 20. They use properties of operations and different strategies to find the sum of three whole numbers such as: Counting on and counting on again (e.g., to add 3 + 2 + 4 a
student writes 3 + 2 + 4 = ? and thinks, “3, 4, 5, that’s 2 more, 6, 7, 8, 9 that’s 4 more so 3 + 2 + 4 = 9.”
Making tens (e.g., 4 + 8 + 6 = 4 + 6 + 8 = 10 + 8 = 18) Using “plus 10, minus 1” to add 9 (e.g., 3 + 9 + 6 A student
thinks, “9 is close to 10 so I am going to add 10 plus 3 plus 6 which gives me 19. Since I added 1 too many, I need to take 1 away so the answer is 18.)
Decomposing numbers between 10 and 20 into 1 ten plus some ones to facilitate adding the ones

GRADE 1 MATHEMATICS CURRICULUM OPERATIONSANDALGEBRAICTHINKING
Waterford Public Schools 34
Common Core State Standard Unwrapped Standard Explanation and Examples Using doubles
Using near doubles (e.g.,5 + 6 + 3 = 5 + 5 + 1 + 3 = 10 + 4 =14)
Understand and apply properties of operations and the relationship between addition and subtraction
Common Core State Standard Unwrapped Standard Explanation and Examples
CC.1.OA.3 Apply properties of operations as strategies to add and subtract. Examples: If 8 + 3 = 11 is known, then 3 + 8 = 11 is also known. (Commutative property of addition.) To add 2 + 6 + 4, the second two numbers can be added to make a ten, so 2 + 6 + 4 = 2 + 10 = 12. (Associative property of addition.) (Students need not use formal terms for these properties.)
A. Understand and apply the idea that adding or subtracting “0” does not change the value of a number.
B. Understand and apply the communicative property of addition (turn‐around facts)
C. Understand and apply the concept of fact families.
D. Understand and apply the associative property of addition (grouping numbers of easier sums to help solve a problem with
A. – D. Students should understand the important ideas of the following properties: Identity property of addition (e.g., 6 = 6 + 0) Identity property of subtraction (e.g., 9 – 0 = 9) Commutative property of addition (e.g., 4 + 5 = 5 + 4) Associative property of addition (e.g., 3 + 9 + 1 = 3 + 10 = 13) Students need several experiences investigating whether the commutative property works with subtraction. The intent is not for students to experiment with negative numbers but only to recognize that taking 5 from 8 is not the same as taking 8 from 5. Students should recognize that they will be working with numbers later on that will allow them to subtract larger numbers from smaller numbers. However, in first grade we do not work with negative numbers. Students should work with, and understand, “fact families” to
Students will use different strategies to add the 6 and 8.
GRADE 1 MATHEMATICS CURRICULUM OPERATIONSANDALGEBRAICTHINKING
Waterford Public Schools 35
Common Core State Standard Unwrapped Standard Explanation and Examples more than 2 addends) reinforce the relationship between addition and subtraction.
For example: 2 + 1 = 3 1 + 2 = 3 3 – 1 = 2 3 – 2 = 1
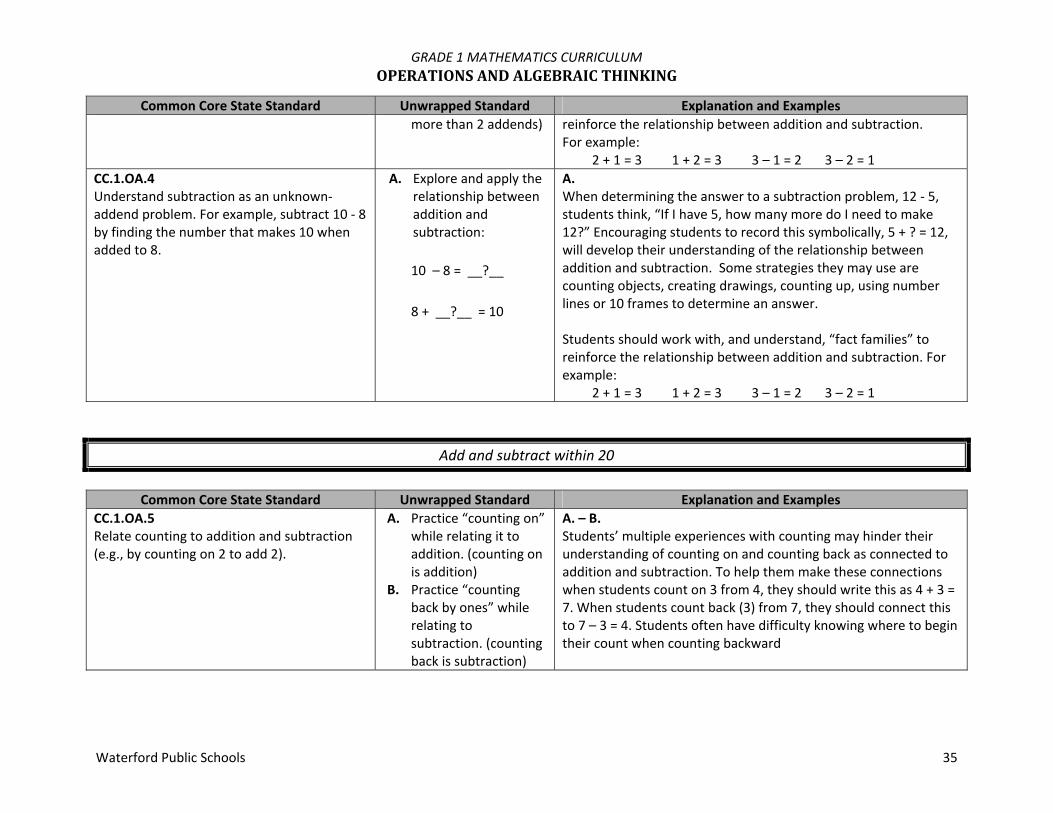
CC.1.OA.4 Understand subtraction as an unknown‐addend problem. For example, subtract 10 ‐ 8 by finding the number that makes 10 when added to 8.
A. Explore and apply the relationship between addition and subtraction: 10 – 8 = __?__ 8 + __?__ = 10
A. When determining the answer to a subtraction problem, 12 ‐ 5, students think, “If I have 5, how many more do I need to make 12?” Encouraging students to record this symbolically, 5 + ? = 12, will develop their understanding of the relationship between addition and subtraction. Some strategies they may use are counting objects, creating drawings, counting up, using number lines or 10 frames to determine an answer. Students should work with, and understand, “fact families” to reinforce the relationship between addition and subtraction. For example: 2 + 1 = 3 1 + 2 = 3 3 – 1 = 2 3 – 2 = 1
Add and subtract within 20
Common Core State Standard Unwrapped Standard Explanation and Examples
CC.1.OA.5 Relate counting to addition and subtraction (e.g., by counting on 2 to add 2).
A. Practice “counting on” while relating it to addition. (counting on is addition)
B. Practice “counting back by ones” while relating to subtraction. (counting back is subtraction)
A. – B. Students’ multiple experiences with counting may hinder their understanding of counting on and counting back as connected to addition and subtraction. To help them make these connections when students count on 3 from 4, they should write this as 4 + 3 = 7. When students count back (3) from 7, they should connect this to 7 – 3 = 4. Students often have difficulty knowing where to begin their count when counting backward
GRADE 1 MATHEMATICS CURRICULUM OPERATIONSANDALGEBRAICTHINKING
Waterford Public Schools 36
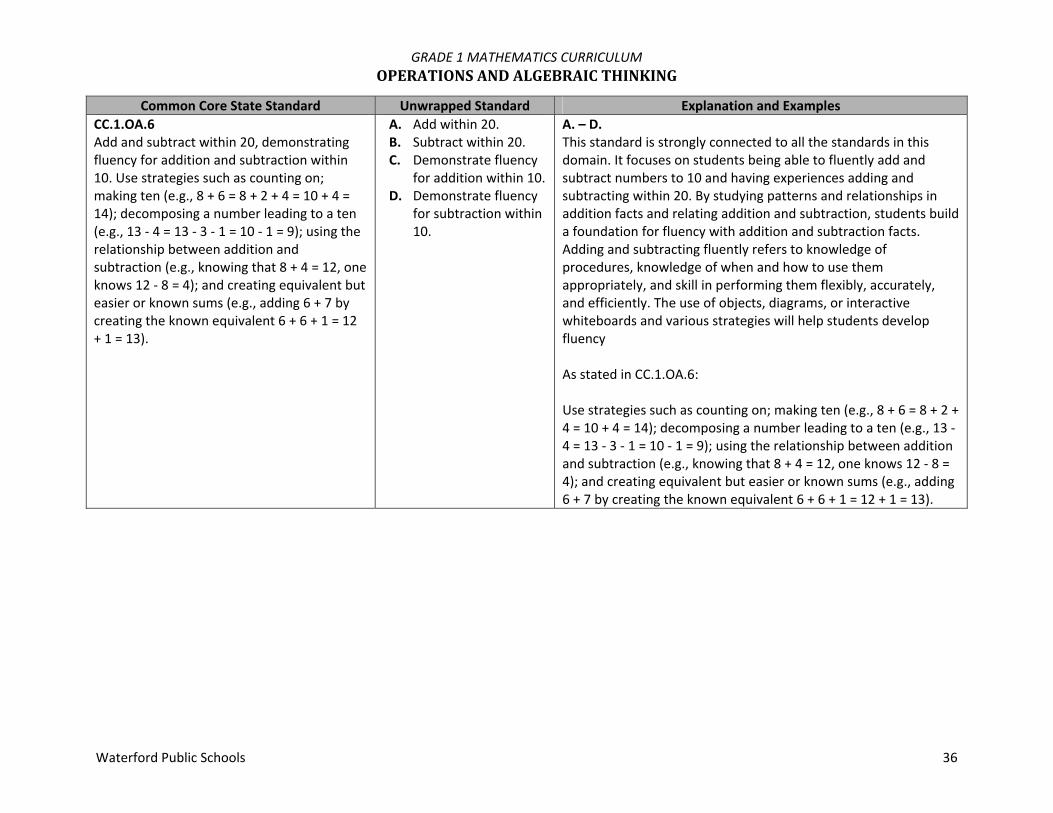
Common Core State Standard Unwrapped Standard Explanation and Examples CC.1.OA.6 Add and subtract within 20, demonstrating fluency for addition and subtraction within 10. Use strategies such as counting on; making ten (e.g., 8 + 6 = 8 + 2 + 4 = 10 + 4 = 14); decomposing a number leading to a ten (e.g., 13 ‐ 4 = 13 ‐ 3 ‐ 1 = 10 ‐ 1 = 9); using the relationship between addition and subtraction (e.g., knowing that 8 + 4 = 12, one knows 12 ‐ 8 = 4); and creating equivalent but easier or known sums (e.g., adding 6 + 7 by creating the known equivalent 6 + 6 + 1 = 12 + 1 = 13).
A. Add within 20. B. Subtract within 20. C. Demonstrate fluency
for addition within 10. D. Demonstrate fluency
for subtraction within 10.
A. – D. This standard is strongly connected to all the standards in this domain. It focuses on students being able to fluently add and subtract numbers to 10 and having experiences adding and subtracting within 20. By studying patterns and relationships in addition facts and relating addition and subtraction, students build a foundation for fluency with addition and subtraction facts. Adding and subtracting fluently refers to knowledge of procedures, knowledge of when and how to use them appropriately, and skill in performing them flexibly, accurately, and efficiently. The use of objects, diagrams, or interactive whiteboards and various strategies will help students develop fluency As stated in CC.1.OA.6: Use strategies such as counting on; making ten (e.g., 8 + 6 = 8 + 2 + 4 = 10 + 4 = 14); decomposing a number leading to a ten (e.g., 13 ‐ 4 = 13 ‐ 3 ‐ 1 = 10 ‐ 1 = 9); using the relationship between addition and subtraction (e.g., knowing that 8 + 4 = 12, one knows 12 ‐ 8 = 4); and creating equivalent but easier or known sums (e.g., adding 6 + 7 by creating the known equivalent 6 + 6 + 1 = 12 + 1 = 13).

GRADE 1 MATHEMATICS CURRICULUM OPERATIONSANDALGEBRAICTHINKING
Waterford Public Schools 37
Work with addition and subtraction equations
Common Core State Standard Unwrapped Standard Explanation and Examples
CC.1.OA.7 Understand the meaning of the equal sign, and determine if equations involving addition and subtraction are true or false. For example, which of the following equations are true and which are false? 6 = 6, 7 = 8 ‐ 1, 5 + 2 = 2 + 5, 4 + 1 = 5 + 2.
A. Understand the meaning of “=”.
B. Determine if a given addition problem is true or false.
C. Determine if a given subtraction problem is true or false.
A. – C. Students’ multiple experiences with counting may hinder their understanding of counting on and counting back as connected to addition and subtraction. To help them make these connections when students count on 3 from 4, they should write this as 4 + 3 = 7. When students count back (3) from 7, they should connect this to 7 – 3 = 4. Students often have difficulty knowing where to begin their count when counting backward As stated in CC.1.OA.7: For example, which of the following equations are true and which are false? 6 = 6, 7 = 8 ‐ 1, 5 + 2 = 2 + 5, 4 + 1 = 5 + 2.
CC.1.OA.8 Determine the unknown number in an addition or subtraction equation relating three whole numbers. For example, determine the unknown number that makes the equation true in each of the equations 8 + ? = 11, 5 = __ – 3, 6 + 6 = __.
A. Determine the unknown in an addition equation.
B. Determine the unknown in a subtraction equation.
C. Determine the unknown in any/all places of the equation.
A. – C. Students need to understand the meaning of the equal sign and know that the quantity on one side of the equal sign must be the same quantity on the other side of the equal sign. They should be exposed to problems with the unknown in different positions. Having students create word problems for given equations will help them make sense of the equation and develop strategic thinking. Examples of possible student “think‐throughs”: 8 + ? = 11: “8 and some number is the same as 11. 8 and 2 is
10 and 1 more makes 11. So the answer is 3.”

GRADE 1 MATHEMATICS CURRICULUM OPERATIONSANDALGEBRAICTHINKING
Waterford Public Schools 38
Common Core State Standard Unwrapped Standard Explanation and Examples 5 = – 3: “This equation means I had some cookies and I ate
3 of them. Now I have 5. How many cookies did I have to start with? Since I have 5 left and I ate 3, I know I started with 8 because I count on from 5. . . 6, 7, 8.”
Students may use the Promethean Board to display their combining or separating strategies for solving the equations. This gives them the opportunity to communicate and justify their thinking. As stated in CC.1.OA.8: For example, determine the unknown number that makes the equation true in each of the equations: 8 + ? = 11, 5 = __ – 3, 6 + 6 = __.

GRADE 1 MATHEMATICS CURRICULUM NUMBERANDOPERATIONSINBASETEN
Waterford Public Schools 39
Extend the Counting Sequence
Common Core State Standard Unwrapped Standard Explanation and Examples
CC.1.NBT.1 Count to 120, starting at any number less than 120. In this range, read and write numerals and represent a number of objects with a written numeral.
A. Count aloud to 120. B. Count to 120 starting
at any lesser number. C. Read random
numbers to 120. D. Write numerals to
120. E. Represent a set of
objects with a written numeral.
A. – E. Students use objects, words, and/or symbols to express their understanding of numbers. They extend their counting beyond 100 to count up to 120 by counting by 1s. Some students may begin to count in groups of 10 (while other students may use groups of 2s or 5s to count). Counting in groups of 10 as well as grouping objects into 10 groups of 10 will develop students understanding of place value concepts. Students extend reading and writing numerals beyond 20 to 120. After counting objects, students write the numeral or use numeral cards to represent the number. Given a numeral, students read the numeral, identify the quantity that each digit represents using numeral cards, and count out the given number of objects.
Students should experience counting from different starting points (e.g., start at 83; count to 120). To extend students’ understanding of counting, they should be given opportunities to count backwards by ones and tens. They should also investigate patterns in the base 10 system.

GRADE 1 MATHEMATICS CURRICULUM NUMBERANDOPERATIONSINBASETEN
Waterford Public Schools 40
Understanding place value
Common Core State Standard Unwrapped Standard Explanation and Examples
CC.1.NBT.2 Understand that the two digits of a two‐digit number represent amounts of tens and ones. Understand the following as special cases: a. 10 can be thought of as a bundle of ten
ones ‐ called a "ten." b. The numbers from 11 to 19 are
composed of a ten and one, two, three, four, five, six, seven, eight, or nine ones.
c. The numbers 10, 20, 30, 40, 50, 60, 70, 80, 90 refer to one, two, three, four, five, six, seven, eight, or nine tens (and 0 ones).
A. Understand the value of the digits in a two‐digit number.
B. Understand the “tens” digit.
C. Understand the “ones” digit.
D. 10 can thought of as bundle of “1s” called a “ten.”
E. 11‐19 are composed of one “10” and sets of “1”s.
F. Multiples of 10, 10‐90 refer to groups of “10” and zero “1”s.
A. – F. Understanding the concept of 10 is fundamental to children’s mathematical development. Students need multiple opportunities counting 10 objects and “bundling” them into one group of ten. They count between 10 and 20 objects and make a bundle of 10 with or without some left over (this will help students who find it difficult to write teen numbers). Finally, students count any number of objects up to 99, making bundles of 10s with or without leftovers. As students are representing the various amounts, it is important that an emphasis is placed on the language associated with the quantity. For example, 53 should be expressed in multiple ways such as 53 ones or 5 groups of ten with 3 ones leftover. When students read numbers, they read them in standard form as well as using place value concepts. For example, 53 should be read as “fifty‐three” as well as five tens, 3 ones. Reading 10, 20, 30, 40, 50 as “one ten, 2 tens, 3 tens, etc.” helps students see the patterns in the number system. Students may use the interactive whiteboard to demonstrate their “bundling” of objects. This gives them the opportunity to communicate their thinking.

GRADE 1 MATHEMATICS CURRICULUM NUMBERANDOPERATIONSINBASETEN
Waterford Public Schools 41
Common Core State Standard Unwrapped Standard Explanation and Examples CC.1.NBT.3 Compare two two‐digit numbers based on meanings of the tens and ones digits, recording the results of comparisons with the symbols >, =, and <.
A. Compare two‐digit numbers based on tens and ones digits.
B. Use symbols <, =, and > to record comparisons of two‐digit numbers.
A. – B. Students use models that represent two sets of numbers. To compare, students first attend to the number of tens, then, if necessary, to the number of ones. Students may also use pictures, number lines, and spoken or written words to compare two numbers. Comparative language includes but is not limited to more than, less than, greater than, most, greatest, least, same as, equal to and not equal to.
Use place value understanding and properties of operations to add and subtract
Common Core State Standard Unwrapped Standard Explanation and Examples
CC.1.NBT.4 Add within 100, including adding a two‐digit number and a one‐digit number, and adding a two‐digit number and a multiple of 10, using concrete models or drawings and strategies based on place value, properties of operations, and/or the relationship between addition and subtraction; relate the strategy to a written method and explain the reasoning used. Understand that in adding two‐digit numbers, one adds tens and tens, ones and ones; and sometimes it is necessary to compose a ten.
A. Add numbers within 100 1. 2‐digit + 1 digit 2. 2‐digit + a ”ten”
B. Relate concrete strategies (models or drawings) based on place value to a written method and explain the reasoning used.
C. Relate concrete strategies (models or drawings) based on properties of operations to a written method and explain the reasoning used.
A. – F. Students extend their number fact and place value strategies to add within 100. They represent a problem situation using any combination of words, numbers, pictures, physical objects, or symbols. It is important for students to understand if they are adding a number that has 10s to a number with 10s, they will have more tens than they started with; the same applies to the ones. Also, students should be able to apply their place value skills to decompose numbers. For example, 17 + 12 can be thought of 1 ten and 7 ones plus 1 ten and 2 ones. Numeral cards may help students decompose the numbers into 10s and 1s. Students should be exposed to problems both in and out of context and presented in horizontal and vertical forms. As students are solving problems, it is important that they use language associated with proper place value (see example). They should always explain and justify their mathematical thinking both verbally and in a written format. Estimating the solution prior to finding the answer focuses students on the meaning of the

GRADE 1 MATHEMATICS CURRICULUM NUMBERANDOPERATIONSINBASETEN
Waterford Public Schools 42
Common Core State Standard Unwrapped Standard Explanation and Examples D. Relate concrete
strategies (models or drawings) based on the relationship between addition and subtraction to a written method and explain the reasoning used.
E. In adding two‐digit numbers, understand the adding of the “ones”, then the “tens.”
F. In adding two‐digit numbers, understand that you may need to compose a “ten” if there are more than 9 ones.
operation and helps them attend to the actual quantities. This standard focuses on developing addition ‐ the intent is not to introduce traditional algorithms or rules. Examples: 43 + 36
Student counts the 10s (10, 20, 30…70 or 1, 2, 3…7 tens) and then the 1s.
28 +34
Student thinks: 2 tens plus 3 tens is 5 tens or 50. S/he counts the ones and notices there is another 10 plus 2 more. 50 and 10 is 60 plus 2 more or 62.

GRADE 1 MATHEMATICS CURRICULUM NUMBERANDOPERATIONSINBASETEN
Waterford Public Schools 43
Common Core State Standard Unwrapped Standard Explanation and Examples 45 + 18
Student thinks: Four 10s and one 10 are 5 tens or 50. Then 5 and 8 is 5 + 5 + 3 (or 8 + 2 + 3) or 13. 50 and 13 is 6 tens plus 3 more or 63.
29 +14
Student thinks: “29 is almost 30. I added one to 29 to get to 30. 30 and 14 is 44. Since I added one to 29, I have to subtract one so the answer is 43.”
CC.1.NBT.5 Given a two‐digit number, mentally find 10 more or 10 less than the number, without having to count; explain the reasoning used.
A. Mentally find 10 more than any 2‐digit number, without counting, explain.
B. Mentally find 10 less than any 2‐digit number, without counting, explain.
A. – B. This standard requires students to understand and apply the concept of 10 which leads to future place value concepts. It is critical for students to do this without counting. Prior use of models such as base ten blocks, number lines, and 100s charts helps facilitate this understanding. It also helps students see the pattern involved when adding or subtracting 10. Examples: 10 more than 43 is 53 because 53 is one more 10 than 43 10 less than 43 is 33 because 33 is one 10 less than 43 Students may use interactive versions of models (base ten blocks,100s charts, number lines, etc.) to develop prior understanding

GRADE 1 MATHEMATICS CURRICULUM NUMBERANDOPERATIONSINBASETEN
Waterford Public Schools 44
Common Core State Standard Unwrapped Standard Explanation and Examples CC.1.NBT.6 Subtract multiples of 10 in the range 10‐90 from multiples of 10 in the range 10‐90 (positive or zero differences), using concrete models or drawings and strategies based on place value, properties of operations, and/or the relationship between addition and subtraction; relate the strategy to a written method and explain the reasoning used.
A. Subtract multiples of 10 from larger multiples of 10 in the range of 10‐90.
B. Relate concrete strategies (models or drawings) based on place value for subtracting multiples of 10 to a written method and explain.
C. Relate concrete strategies (models or drawings) based on properties of operations for subtracting multiples of 10 to a written method and explain.
D. Relate concrete strategies (models or drawings) based on the relationship between addition and subtraction for subtracting multiples of 10 to a written method and explain.
A. – D. This standard is foundational for future work in subtraction with more complex numbers. Students should have multiple experiences representing numbers that are multiples of 10 (e.g. 90) with models or drawings. Then they subtract multiples of 10 (e.g. 20) using these representations or strategies based on place value. These opportunities develop fluency of addition and subtraction facts and reinforce counting up and back by 10s. Examples: 70 ‐ 30: Seven 10s take away three 10s is four 10s 80 ‐ 50: 80, 70 (one 10), 60 (two 10s), 50 (three 10s), 40 (four
10s), 30 (five 10s) 60 ‐ 40: I know that 4 + 2 is 6 so four 10s + two 10s is six 10s
so 60 ‐ 40 is 20 Students may use interactive versions of models (base ten blocks,100s charts, number lines, etc.) to demonstrate and justify their thinking.
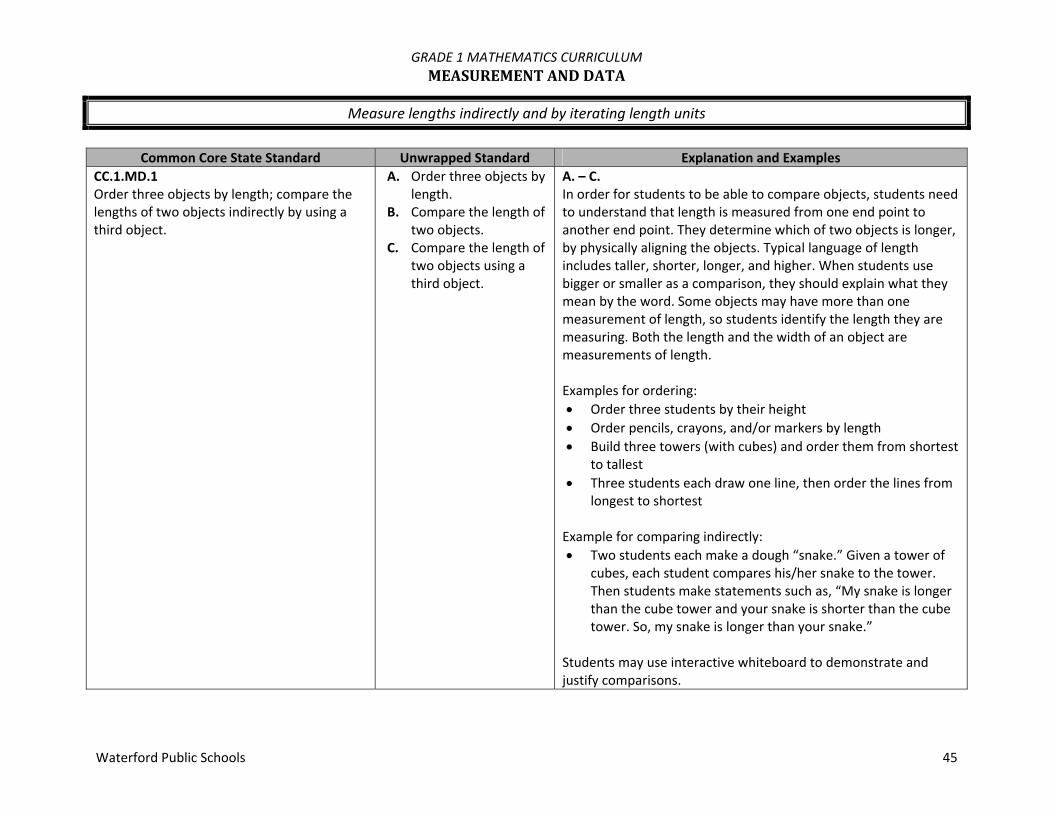
GRADE 1 MATHEMATICS CURRICULUM MEASUREMENTANDDATA
Waterford Public Schools 45
Measure lengths indirectly and by iterating length units
Common Core State Standard Unwrapped Standard Explanation and Examples
CC.1.MD.1 Order three objects by length; compare the lengths of two objects indirectly by using a third object.
A. Order three objects by length.
B. Compare the length of two objects.
C. Compare the length of two objects using a third object.
A. – C. In order for students to be able to compare objects, students need to understand that length is measured from one end point to another end point. They determine which of two objects is longer, by physically aligning the objects. Typical language of length includes taller, shorter, longer, and higher. When students use bigger or smaller as a comparison, they should explain what they mean by the word. Some objects may have more than one measurement of length, so students identify the length they are measuring. Both the length and the width of an object are measurements of length. Examples for ordering: Order three students by their height Order pencils, crayons, and/or markers by length Build three towers (with cubes) and order them from shortest
to tallest Three students each draw one line, then order the lines from
longest to shortest Example for comparing indirectly: Two students each make a dough “snake.” Given a tower of
cubes, each student compares his/her snake to the tower. Then students make statements such as, “My snake is longer than the cube tower and your snake is shorter than the cube tower. So, my snake is longer than your snake.”
Students may use interactive whiteboard to demonstrate and justify comparisons.

GRADE 1 MATHEMATICS CURRICULUM MEASUREMENTANDDATA
Waterford Public Schools 46
Common Core State Standard Unwrapped Standard Explanation and Examples CC.1.MD.2 Express the length of an object as a whole number of length units, by laying multiple copies of a shorter object (the length unit) end to end; understand that the length measurement of an object is the number of same‐size length units that span it with no gaps or overlaps. Limit to contexts where the object being measured is spanned by a whole number of length units with no gaps or overlaps.
A. Express the length of an object using whole number unit lengths.
B. Lay multiple shorter lengths end‐to‐end, with no gaps or overlaps, to measure.
C. Use shorter lengths to span the entire length of the object to measure with no gaps or overlays at either the beginning or ending edge of the measured object.
A. – C. Students use their counting skills while measuring with non‐standard units. While this standard limits measurement to whole numbers of length, in a natural environment, not all objects will measure to an exact whole unit. When students determine that the length of a pencil is six to seven paperclips long, they can state that it is about six paperclips long. Example: Ask students to use multiple units of the same object to
measure the length of a pencil. (How many paper clips will it take to measure how long the pencil is?)
Students may use interactive whiteboard to demonstrate their counting and measuring skills. Students may be introduced to the concept of standard units of measure. (Relate 1” tiles to the inch ruler)

GRADE 1 MATHEMATICS CURRICULUM MEASUREMENTANDDATA
Waterford Public Schools 47
Tell and write time
Common Core State Standard Unwrapped Standard Explanation and Examples
CC.1.MD.3 Tell and write time in hours and half‐hours using analog and digital clocks.
A. Tell time in hours using analog clocks.
B. Tell time in half‐hours using analog clocks.
C. Draw the hands on an analog clock to represent a given time to the hour.
D. Draw the hands on an analog clock to represent a given time to the half‐hour.
E. Distinguish between the hour hand and the minute hand on an analog clock in terms of length.
F. Tell time in hours using digital clocks.
G. Tell time in half‐hours using digital clocks.
H. Write digits on a model of a digital clock to represent a given time to the hour.
I. Write digits on a model of a digital clock to represent a given time to the half‐
A. – J. Ideas to support telling time: within a day, the hour hand goes around a clock twice (the
hand moves only in one direction) when the hour hand points exactly to a number, the time is
exactly on the hour time on the hour is written in the same manner as it appears
on a digital clock the hour hand moves as time passes, so when it is half way
between two numbers it is at the half hour there are 60 minutes in one hour; so halfway between an
hour, 30 minutes have passed half hour is written with “30” after the colon “It is 4 o’clock”

GRADE 1 MATHEMATICS CURRICULUM MEASUREMENTANDDATA
Waterford Public Schools 48
Common Core State Standard Unwrapped Standard Explanation and Examples hour.
J. Understand the correlation between a digital and analog clock. What represents “minutes after”? What represents “the hour”?
“It is halfway between 8 o’clock and 9 o’clock. It is 8:30.”
The idea of 30 being “halfway” is difficult for students to grasp. Students can write the numbers from 0 ‐ 60 counting by tens on a sentence strip. Fold the paper in half and determine that halfway between 0 and 60 is 30. A number line on an interactive whiteboard may also be used to demonstrate this.

GRADE 1 MATHEMATICS CURRICULUM MEASUREMENTANDDATA
Waterford Public Schools 49
Represent and interpret data
Common Core State (or Waterford) Standard Unwrapped Standard Explanation and Examples CC.1.MD.4 Organize, represent, and interpret data with up to three categories; ask and answer questions about the total number of data points, how many in each category, and how many more or less are in one category than in another.
A. Organize data with up to three categories and explain reasoning.
B. Represent up to three categories of data with tally marks. Understand how to group tally marks by fives.
C. Represent up to three categories of data on a given graph with objects or pictures and explain reasoning.
D. Compare data points: more or less in each category, combining totals of categories, finding differences between categories.
A. – D. Students create object graphs and tally charts using data relevant to their lives (e.g., favorite ice cream, eye color, pets, etc.). Graphs may be constructed by groups of students as well as by individual students. Counting objects should be reinforced when collecting, representing, and interpreting data. Students describe the object graphs and tally charts they create. They should also ask and answer questions based on these charts or graphs that reinforce other mathematics concepts such as sorting and comparing. The data chosen or questions asked give students opportunities to reinforce their understanding of place value, identifying ten more and ten less, relating counting to addition and subtraction and using comparative language and symbols. Students may use an interactive whiteboard to place objects onto a graph. This gives them the opportunity to communicate and justify their thinking.

GRADE 1 MATHEMATICS CURRICULUM GEOMETRY
Waterford Public Schools 50
Reason with shapes and their attributes
Common Core State Standard Unwrapped Standard Explanation and Examples
CC.1.G.1 Distinguish between defining attributes (e.g., triangles are closed and three‐sided) versus non‐defining attributes (e.g., color, orientation, overall size) for a wide variety of shapes; build and draw shapes to possess defining attributes.
A. Understand defining attributes of a given shape. (What makes it the shape it is?)
B. Understand defining vs. non‐defining attributes. (Does it matter what color it is?)
C. Build and or draw shapes with given defining attributes.
A. – C. Attributes refer to any characteristic of a shape. Students use attribute language to describe a given two‐dimensional shape: number of sides, number of vertices/points, straight sides, closed. A child might describe a triangle as “right side up” or “red.” These attributes are not defining because they are not relevant to whether a shape is a triangle or not. Students should articulate ideas such as, “A triangle is a triangle because it has three straight sides and is closed.” It is important that students are exposed to both regular and irregular shapes so that they can communicate defining attributes. Students should use attribute language to describe why these shapes are not triangles.
Students should also use appropriate language to describe a given three‐dimensional shape: number of faces, number of vertices/points, number of edges. Example: A cylinder may be described as a solid that has two circular faces connected by a curved surface (which is not considered a face). Students may say, “It looks like a can.” Students should compare and contrast two‐and three‐dimensional figures using defining attributes. Examples: List two things that are the same and two things that are
different between a triangle and a cube. Given a circle and a sphere, students identify the sphere as

GRADE 1 MATHEMATICS CURRICULUM GEOMETRY
Waterford Public Schools 51
Common Core State Standard Unwrapped Standard Explanation and Examples being three‐dimensional but both are round.
Given a trapezoid, find another two‐dimensional shape that has two things that are the same.
Students may use interactive whiteboards to move shapes into different orientations and to enlarge or decrease the size of a shape still keeping the same shape. They can also move a point/vertex of a triangle and identify that the new shape is still a triangle. When they move one point/vertex of a rectangle they should recognize that the resulting shape is no longer a rectangle.
CC.1.G.2 Compose two‐dimensional shapes (rectangles, squares, trapezoids, triangles, half‐circles, and quarter‐circles) or three‐dimensional shapes (cubes, right rectangular prisms, right circular cones, and right circular cylinders) to create a composite shape, and compose new shapes from the composite shape.
A. Compose two‐dimensional shapes: 1. rectangles 2. squares 3. triangles 4. hexagon 5. trapezoids 6. circles 7. half‐circles 8. quarter circles
B. Compose three‐dimensional shapes 1. Spheres 2. cubes 3. rectangular
prism(box) 4. circular cone 5. cylinder
C. Create a composite shape using previously composed 2‐dinensional shapes.
D. Create a composite
A. – E. The ability to describe, use and visualize the effect of composing and decomposing shapes is an important mathematical skill. It is not only relevant to geometry, but is related to children’s ability to compose and decompose numbers. Students may use pattern blocks, plastic shapes, tangrams, or computer environments to make new shapes. The teacher can provide students with cutouts of shapes and ask them to combine them to make a particular shape. Example:
What shapes can be made from four squares?
Students can make three‐dimensional shapes with clay or dough, slice into two pieces (not necessarily congruent) and describe the two resulting shapes. For example, slicing a cylinder will result in two smaller cylinders.

GRADE 1 MATHEMATICS CURRICULUM GEOMETRY
Waterford Public Schools 52
Common Core State Standard Unwrapped Standard Explanation and Examples shape using previously composed three‐dimensional shapes.
E. Compose new shapes from a newly‐composed composite shape.
CC.1.G.3 Partition circles and rectangles into two and four equal shares, describe the shares using the words halves, fourths, and quarters, and use the phrases half of, fourth of, and quarter of. Describe the whole as two of, or four of the shares. Understand for these examples that decomposing into more equal shares creates smaller shares.
A. Partition circles into two and four equal shares.
B. Partition rectangles into two and four equal shares.
C. Describe partitioned shapes using the words halves, fourths, quarters, half of, fourth of, and quarter of.
D. Describe a whole in terms of its shares: as two halves or four quarters.
E. Understand that decomposing a shape into shares makes smaller shares.
A. – E. Students need experiences with different sized circles and rectangles to recognize that when they cut something into two equal pieces, each piece will equal one half of its original whole. Children should recognize that halves of two different wholes are not necessarily the same size. Also they should reason that decomposing equal shares into more equal shares results in smaller equal shares. Examples: Student partitions a rectangular candy bar to share equally
with one friend and thinks “I cut the rectangle into two equal parts. When I put the two parts back together, they equal the whole candy bar. One half of the candy bar is smaller than the whole candy bar.”

GRADE 1 MATHEMATICS CURRICULUM GEOMETRY
Waterford Public Schools 53
Common Core State Standard Unwrapped Standard Explanation and Examples Student partitions an identical rectangular candy bar to share
equally with 3 friends and thinks “I cut the rectangle into four equal parts. Each piece is one fourth of or one quarter of the whole candy bar. When I put the four parts back together, they equal the whole candy bar. I can compare the pieces (one half and one fourth) by placing them side‐by‐side. One fourth of the candy bar is smaller than one half of the candy bar.
Students partition a pizza to share equally with three friends.
They recognize that they now have four equal pieces and each will receive a fourth or quarter of the whole pizza.

GRADE 1 MATHEMATICS CURRICULUM PACINGGUIDE
Waterford Public Schools 54
Trimester1
Unit Title Pacing Standards (Power standards in bold)
1. Addition and Subtraction within 10
Mathematical Practices 1, 2, 3, 4, 5, 6, 7, 8 5 weeks
1.OA.1 Use addition and subtraction to solve word problems 1.OA.2 Solve word problems calling for addition of 3 whole numbers 1.OA.3 Apply properties of operations as strategies to add and subtract 1.OA.4 Understand subtraction as an unknown addend problem 1.OA.5 Relate counting to addition and subtraction 1.OA.7 Understand the meaning of the “=” sign and determine if equations
are true or false 1.OA.8 Determine the unknown number in an addition or subtraction
equation relating to 3 whole numbers. 1.NBT.1 Count to 120 starting at any lesser number 1.MD.4 Organize, represent, and interpret data with up to 3 categories
2. Defining Attributes of 2‐D and 3‐D shapes
Mathematical Practices 1, 3, 4, 7, 2 weeks 1.G.1 Distinguish between defining and non‐defining attributes
1.G.2 Compose 2‐dimensional shapes to create a composite shape
3. Partitioning Circles and rectangles
Mathematical Practices 1, 2, 3, 4, 6, 7 2 weeks 1.G.3 Partition circles and rectangles into two and four equal shares

GRADE 1 MATHEMATICS CURRICULUM PACINGGUIDE
Waterford Public Schools 55
Trimester2
Unit Title Pacing Standards (Power standards in bold)
4. Addition and Subtraction within 20
Mathematical Practices ? 3 weeks
1.OA.1 Use addition and subtraction to solve word problems 1.OA.2 Solve word problems calling for addition of 3 whole numbers 1.OA.3 Apply properties of operations as strategies to add and subtract 1.OA.4 Understand subtraction as an unknown addend problem 1.OA.5 Relate counting to addition and subtraction 1.OA.7 Understand the meaning of the “=” sign and determine if
equations are true or false 1.OA.8 Determine the unknown number in an addition or subtraction
equation relating to 3 whole numbers. 1. NBT.1 Count to 120 starting at any lesser number 1.MD.4 Organize, represent, and interpret data with up to 3 categories
5. Counting and place value
Mathematical Practices 1, 2, 3, 4, 6, 7, 8 5 weeks
1.NBT.1 Count to 120 starting at any lesser number 1.NBT.2 Understand that the two digits of a two‐digit number represent
10’s and 1’s 1.NBT.3 Compare 2 two‐digit numbers based on the meaning of the 10’s and
1’s digits 1.NBT.5 Given a two‐digit number, mentally find 10 more or 10 less 1.MD.4 Organize, represent, and interpret data with up to 3 categories

GRADE 1 MATHEMATICS CURRICULUM PACINGGUIDE
Waterford Public Schools 56
Trimester3
Unit Title Pacing Standards (Power standards in bold)
6. Addition and Subtraction within 100
Mathematical Practices 1, 2, 3, 4, 5, 6, 7, 8 5 weeks
1.OA.3 Apply properties of operations as strategies to add and subtract 1.OA.5 Relate counting to addition and subtraction 1.OA.7 Understand the meaning of the “=” sign and determine if
equations are true or false 1.NBT.1 Count to 120 starting at any lesser number 1.NBT.2 Understand that the two digits of a two‐digit number represent
10’s and 1’s 1.NBT.4 Add within 100 using concrete models and relate to written
method 1.NBT.6 Subtract multiples of 10 within 10‐90
7. Measuring Length with Non‐standard units
Mathematical Practices 1, 3, 4, 5, 6, 7 2 weeks
1.MD.1 Order 3 objects by length 1.MD.2 Express the length of an object as a whole number of length units
using a length unit to measure 8. Time
Mathematical Practices 1, 5, 6, 7 2 weeks
1.MD.3 Tell and write time in hours and half‐hours using analog and digital clocks
1.G.3 Partition circles and rectangles into two and four equal shares

GRADE 2 MATHEMATICS CURRICULUM OVERVIEW
Waterford Public Schools 57
OperationsandAlgebraicThinking(OA) Represent and solve problems involving addition and
subtraction. Add and subtract within 20. Work with equal groups of objects to gain foundations for
multiplication. NumberandOperationsinBaseTen(NBT)
Understand place value. Use place value understanding and properties of operations
to add and subtract. MeasurementandData(MD)
Measure and estimate lengths in standard units. Relate addition and subtraction to length. Work with time and money. Represent and interpret data.
Geometry(G) Reason with shapes and their attributes
MathematicalPractices(MP)1. Make sense of problems and persevere in solving them. 2. Reason abstractly and quantitatively. 3. Construct viable arguments and critique the reasoning of
others. 4. Model with mathematics. 5. Use appropriate tools strategically. 6. Attend to precision. 7. Look for and make use of structure. 8. Look for and express regularity in repeated reasoning.
Assessments:
Teacher‐Created C.F.A.’s and Benchmarks Resources:
My Math by McGraw‐Hill

GRADE 2 MATHEMATICS CURRICULUM OPERATIONSANDALGEBRAICTHINKING
Waterford Public Schools 58
Represent and solve problems involving addition and subtraction
Common Core State Standard Unwrapped Standard Explanation and Examples
CC.2.OA.1 Use addition and subtraction within 100 to solve one‐ and two‐step word problems involving situations of adding to, taking from, putting together, taking apart, and comparing, with unknowns in all positions, e.g., by using drawings and equations with a symbol for the unknown number to represent the problem. (See Glossary, Table 1 – Common Core State Standards for Mathematics.)
A. Add and subtract within 100 to solve one step word problems.
B. Add and subtract within 100 to solve two step word problems.
C. Addition and subtraction with unknowns in all positions.
A. – C. Word problems that are connected to students’ lives can be used to develop fluency with addition and subtraction. The examples below describe the four different addition and subtraction situations and their relationship to the position of the unknown. Examples: Take From example: David had 63 stickers. He gave 37 to
Susan. How many stickers does David have now? 63 – 37 =
Add To example: David had $37. His grandpa gave him some money for his birthday. Now he has $63. How much money did David’s grandpa give him? $37 + = $63
Compare example: David has 63 stickers. Susan has 37 stickers. How many more stickers does David have than Susan? 63 – 37 =
o Even though the modeling of the two problems above is different, the equation, 63 ‐ 37 = ?, can represent both situations (How many more do I need to make 63?)
Take from (Start Unknown) David had some stickers. He gave 37 to Susan. Now he has 26 stickers. How many stickers did David have before? – 37 = 26
It is important to attend to the difficulty level of the problem situations in relation to the position of the unknown. Result Unknown, Total Unknown, and Both Addends
Unknown problems are the least complex for students. The next level of difficulty includes Change Unknown, Addend
Unknown, and Difference Unknown

GRADE 2 MATHEMATICS CURRICULUM OPERATIONSANDALGEBRAICTHINKING
Waterford Public Schools 59
Common Core State Standard Unwrapped Standard Explanation and Examples The most difficult are Start Unknown and versions of Bigger
and Smaller Unknown (compare problems). This standard focuses on developing an algebraic representation of a word problem through addition and subtraction ‐‐the intent is not to introduce traditional algorithms or rules.
Add and subtract within 20
Common Core State Standard Unwrapped Standard Explanation and Examples
CC.2.OA.2 Fluently add and subtract within 20 using mental strategies. (See standard 1.OA.6 for a list of mental strategies.) By end of Grade 2, know from memory all sums of two one‐digit numbers.
A. Add and subtract within 20 fluently
B. Reason each mental strategy to make sense of number relationships as they are adding and subtracting within 20.
A. This standard is strongly connected to all the standards in this domain. It focuses on students being able to fluently add and subtract numbers to 20. Adding and subtracting fluently refers to knowledge of procedures, knowledge of when and how to use them appropriately, and skill in performing them flexibly, accurately, and efficiently. B. Mental strategies help students make sense of number relationships as they are adding and subtracting within 20. The ability to calculate mentally with efficiency is very important for all students. Mental strategies may include the following: Counting on Making tens (9 + 7 = 10 + 6) Decomposing a number leading to a ten ( 14 – 6 = 14 – 4 – 2 =
10 – 2 = 8) Fact families (8 + 5 = 13 is the same as 13 ‐ 8 = 5) Doubles Doubles plus one (7 + 8 = 7 + 7 + 1)

GRADE 2 MATHEMATICS CURRICULUM OPERATIONSANDALGEBRAICTHINKING
Waterford Public Schools 60
Common Core State Standard Unwrapped Standard Explanation and Examples However, the use of objects, diagrams, or interactive whiteboards, and various strategies will help students develop fluency.
Work with equal groups of objects to gain foundations for multiplication
Common Core State Standard Unwrapped Standard Explanation and Examples
CC.2.OA.3 Determine whether a group of objects (up to 20) has an odd or even number of members, e.g., by pairing objects or counting them by 2s; write an equation to express an even number as a sum of two equal addends.
A. Determine whether a group of objects (up to 20) has an odd or even number of members.
A. Students explore odd and even numbers in a variety of ways including the following: students may investigate if a number is odd or even by determining if the number of objects can be divided into two equal sets, arranged into pairs or counted by twos. After the above experiences, students may derive that they only need to look at the digit in the ones place to determine if a number is odd or even since any number of tens will always split into two even groups. Example: Students need opportunities writing equations representing sums of two equal addends, such as: 2 + 2 = 4, 3 + 3 = 6, 5 + 5 = 10, 6 + 6 = 12, or 8 + 8 =16. This understanding will lay the foundation for multiplication and is closely connected to 2.OA.4. The use of objects and/or interactive whiteboards will help students develop and demonstrate various strategies to determine even and odd numbers.

GRADE 2 MATHEMATICS CURRICULUM OPERATIONSANDALGEBRAICTHINKING
Waterford Public Schools 61
Common Core State Standard Unwrapped Standard Explanation and Examples CC.2.OA.4 Use addition to find the total number of objects arranged in rectangular arrays with up to 5 rows and up to 5 columns; write an equation to express the total as a sum of equal addends.
A. Add to find the total number of objects in a rectangular array with up to 5 rows and 5 column
B. Write an equation to express the total as a sum of equal addends.
A. Students may arrange any set of objects into a rectangular array. Objects can be cubes, buttons, counters, etc. Objects do not have to be square to make an array. Geoboards can also be used to demonstrate rectangular arrays. Students then write equations that represent the total as the sum of equal addends as shown below. B. 4 + 4 + 4 = 12 5 + 5 + 5 + 5 = 20 Interactive whiteboards and document cameras may be used to help students visualize and create arrays.

GRADE 2 MATHEMATICS CURRICULUM NUMBERSANDOPERATIONSINBASETEN
Waterford Public Schools 62
Understand Place Value
Common Core State Standard Unwrapped Standard Explanation and Examples
CC.2.NBT.1 Understand that the three digits of a three‐digit number represent amounts of hundreds, tens, and ones; e.g., 706 equals 7 hundreds, 0 tens, and 6 ones. Understand the following as special cases: a. 100 can be thought of as a bundle of ten tens ‐ called a "hundred." b. The numbers 100, 200, 300, 400, 500, 600, 700, 800, 900 refer to one, two, three, four, five, six, seven, eight, or nine hundreds (and 0 tens and 0 ones).
A. Understand that the three digits of a three‐digit number represent amounts of hundreds, tens, and ones
A. Understanding that 10 ones make one ten and that 10 tens make one hundred is fundamental to students’ mathematical development. Students need multiple opportunities counting and “bundling” groups of tens in first grade. In second grade, students build on their understanding by making bundles of 100s with or without leftovers using base ten blocks, cubes in towers of 10, ten frames, etc. This emphasis on bundling hundreds will support students’ discovery of place value patterns. As students are representing the various amounts, it is important that emphasis is placed on the language associated with the quantity. For example, 243 can be expressed in multiple ways such as 2 groups of hundred, 4 groups of ten and 3 ones, as well as 24 tens and 3 ones. When students read numbers, they should read in standard form as well as using place value concepts. For example, 243 should be read as “two hundred forty‐three” as well as two hundreds, 4 tens, 3 ones. An interactive whiteboard can also be used to demonstrate “bundling” of objects. This gives students the opportunity to communicate their thinking.
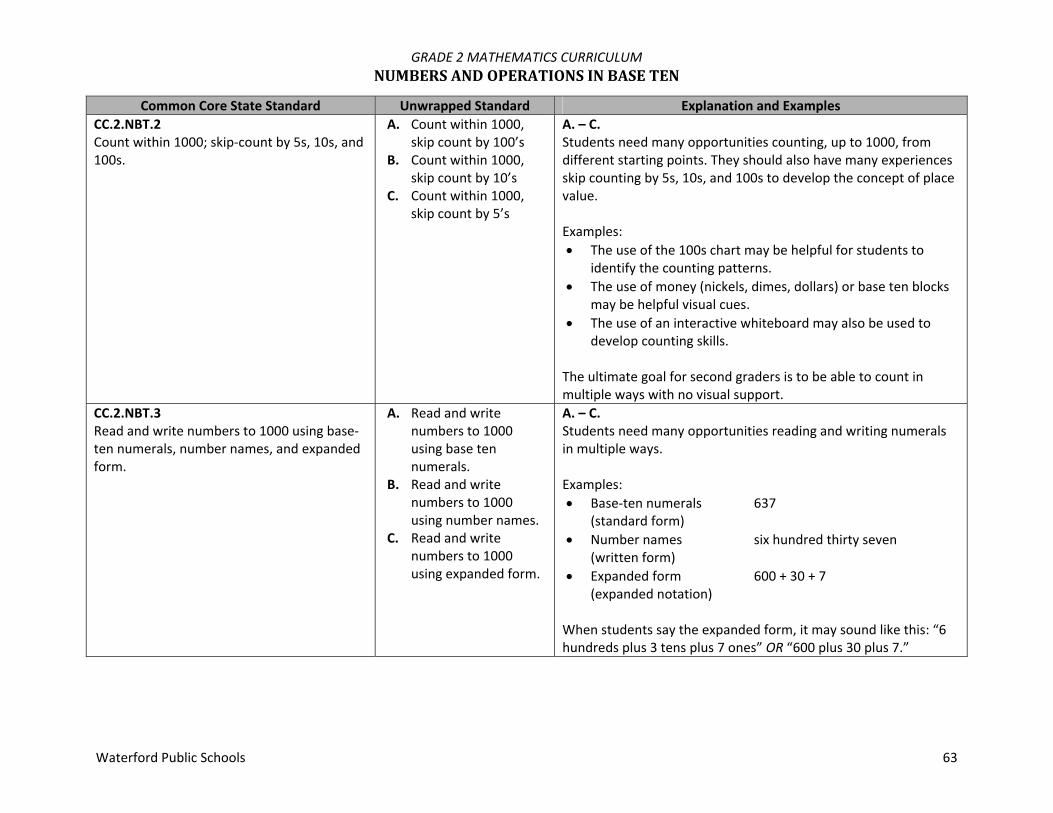
GRADE 2 MATHEMATICS CURRICULUM NUMBERSANDOPERATIONSINBASETEN
Waterford Public Schools 63
Common Core State Standard Unwrapped Standard Explanation and Examples CC.2.NBT.2 Count within 1000; skip‐count by 5s, 10s, and 100s.
A. Count within 1000, skip count by 100’s
B. Count within 1000, skip count by 10’s
C. Count within 1000, skip count by 5’s
A. – C. Students need many opportunities counting, up to 1000, from different starting points. They should also have many experiences skip counting by 5s, 10s, and 100s to develop the concept of place value. Examples: The use of the 100s chart may be helpful for students to
identify the counting patterns. The use of money (nickels, dimes, dollars) or base ten blocks
may be helpful visual cues. The use of an interactive whiteboard may also be used to
develop counting skills. The ultimate goal for second graders is to be able to count in multiple ways with no visual support.
CC.2.NBT.3 Read and write numbers to 1000 using base‐ten numerals, number names, and expanded form.
A. Read and write numbers to 1000 using base ten numerals.
B. Read and write numbers to 1000 using number names.
C. Read and write numbers to 1000 using expanded form.
A. – C. Students need many opportunities reading and writing numerals in multiple ways. Examples: Base‐ten numerals 637
(standard form) Number names six hundred thirty seven
(written form) Expanded form 600 + 30 + 7
(expanded notation) When students say the expanded form, it may sound like this: “6 hundreds plus 3 tens plus 7 ones” OR “600 plus 30 plus 7.”

GRADE 2 MATHEMATICS CURRICULUM NUMBERSANDOPERATIONSINBASETEN
Waterford Public Schools 64
Common Core State Standard Unwrapped Standard Explanation and Examples CC.2.NBT.4 Compare two three‐digit numbers based on meanings of the hundreds, tens, and ones digits, using >, =, and < symbols to record the results of comparisons.
A. Compare two three digit numbers based on meanings of the hundreds, tens, and ones. Use words greater than, less than and equal to.
B. Compare two three digit numbers, using >, <, and = symbols to record results of comparisons.
A. Students may use models, number lines, base ten blocks, interactive whiteboards, written words, and/or spoken words that represent two three‐digit numbers. To compare, students apply their understanding of place value. They first attend to the numeral in the hundreds place, then the numeral in tens place, then, if necessary, to the numeral in the ones place. Comparative language includes but is not limited to: more than, less than, greater than, most, greatest, least, same as, equal to and not equal to. B. Students use the appropriate symbols to record the comparisons.
Use place value understanding and properties of operations to add and subtract
Common Core State Standard Unwrapped Standard Explanation and Examples
CC.2.NBT.5 Fluently add and subtract within 100 using strategies based on place value, properties of operations, and/or the relationship between addition and subtraction.
A. Use addition strategies to fluently add within 100.
B. Use subtraction strategies to fluently subtract within 100.
C. Know the properties of operations, and/ or the relationship between addition and subtraction.
A. Adding and subtracting fluently refers to knowledge of procedures, knowledge of when and how to use them appropriately, and skill in performing them flexibly, accurately, and efficiently. Students should have experiences solving problems written both horizontally and vertically. They need to communicate their thinking and be able to justify their strategies both verbally and with paper and pencil. Addition strategies based on place value for 48 + 37 may include: Adding by place value: 40 + 30 = 70 and 8 + 7 = 15 and 70 + 15
= 85. Incremental adding (breaking one number into tens and

GRADE 2 MATHEMATICS CURRICULUM NUMBERSANDOPERATIONSINBASETEN
Waterford Public Schools 65
Common Core State Standard Unwrapped Standard Explanation and Examples ones); 48 + 10 = 58, 58 + 10 = 68, 68 + 10 = 78, 78 + 7 = 85
Compensation (making a friendly number): 48 + 2 = 50, 37 – 2 = 35, 50 + 35 = 85
B. Subtraction strategies based on place value for 81 ‐ 37 may include: Adding up (from smaller number to larger number): 37 + 3 =
40, 40 + 40 = 80, 80 + 1 = 81, and 3 + 40 + 1 = 44. Incremental subtracting: 81 ‐10 = 71, 71 – 10 = 61, 61 – 10 =
51, 51 – 7 = 44 Subtracting by place value: 81 – 30 = 51, 51 – 7 = 44
C. Properties that students should know and use are: Commutative property of addition (Example: 3 + 5 = 5 + 3) Associative property of addition (Example: (2 + 7) + 3 = 2 +
(7+3) ) Identity property of 0 (Example: 8 + 0 = 8)
Students in second grade need to communicate their understanding of why some properties work for some operations and not for others. Commutative Property: In first grade, students investigated
whether the commutative property works with subtraction. The intent was for students to recognize that taking 5 from 8 is not the same as taking 8 from 5. Students should also understand that they will be working with numbers in later grades that will allow them to subtract larger numbers from smaller numbers. This exploration of the commutative property continues in second grade.
Associative Property: Recognizing that the associative property

GRADE 2 MATHEMATICS CURRICULUM NUMBERSANDOPERATIONSINBASETEN
Waterford Public Schools 66
Common Core State Standard Unwrapped Standard Explanation and Examples does not work for subtraction is difficult for students to consider at this grade level as it is challenging to determine all the possibilities.
CC.2.NBT.6 Add up to four two‐digit numbers using strategies based on place value and properties of operations.
A. Add up to four two‐digit numbers without re‐grouping
B. Add up to four two‐digit numbers with re‐grouping.
A. – B. Students demonstrate addition strategies with up to four two‐digit numbers either with or without regrouping. Problems may be written in a story problem format to help develop a stronger understanding of larger numbers and their values. Interactive whiteboards and document cameras may also be used to model and justify student thinking.
CC.2.NBT.7 Add and subtract within 1000, using concrete models or drawings and strategies based on place value, properties of operations, and/or the relationship between addition and subtraction; relate the strategy to a written method. Understand that in adding or subtracting three‐digit numbers, one adds or subtracts hundreds and hundreds, tens and tens, ones and ones; and sometimes it is necessary to compose or decompose tens or hundreds.
A. Add within 1000. B. Subtract within 1000
A. – B. There is a strong connection between this standard and place value understanding with addition and subtraction of smaller numbers. Students may use concrete models or drawings to support their addition or subtraction of larger numbers. Strategies are similar to those stated in 2.NBT.5, as students extend their learning to include greater place values moving from tens to hundreds to thousands. Interactive whiteboards and document cameras may also be used to model and justify student thinking.
CC.2.NBT.8 Mentally add 10 or 100 to a given number 100‐900, and mentally subtract 10 or 100 from a given number 100‐900.
A. Mentally add 10 or 100 to a given number 100‐900
B. Mentally subtract 10 or 100 to a given number 100‐900.
A. Students need many opportunities to practice mental math by adding and subtracting multiples of 10 and 100 up to 900 using different starting points. B. They can practice this by counting and thinking aloud, finding missing numbers in a sequence, and finding missing numbers on a number line or hundreds chart. Explorations should include looking for relevant patterns.

GRADE 2 MATHEMATICS CURRICULUM NUMBERSANDOPERATIONSINBASETEN
Waterford Public Schools 67
Common Core State Standard Unwrapped Standard Explanation and Examples Mental math strategies may include: counting on; 300, 400, 500, etc. counting back; 550, 450, 350, etc. Examples: 100 more than 653 is _____ (753) 10 less than 87 is ______ (77) “Start at 248. Count up by 10s until I tell you to stop.” An interactive whiteboard may be used to help students develop these mental math skills.
CC.2.NBT.9 Explain why addition and subtraction strategies work, using place value and the properties of operations. (Explanations may be supported by drawings or objects.)
A. Explain why addition and subtracting strategies work using drawings or objects.
B. Explain using math language.
A. – B. Students need multiple opportunities explaining their addition and subtraction thinking. Operations embedded within a meaningful context promote development of reasoning and justification. Example: Mason read 473 pages in June. He read 227 pages in July. How many pages did Mason read altogether? Karla’s explanation: 473 + 227 = _____. I added the ones
together (3 + 7) and got 10. Then I added the tens together (70 + 20) and got 90. I knew that 400 + 200 was 600. So I added 10 + 90 for 100 and added 100 + 600 and found out that Mason had read 700 pages altogether.
Debbie’s explanation: 473 + 227 = ______. I started by adding 200 to 473 and got 673. Then I added 20 to 673 and I got 693 and finally I added 7 to 693 and I knew that Mason had read 700 pages altogether.
Becky’s explanation: I used base ten blocks on a base ten mat to help me solve this problem. I added 3 ones (units) plus 7 ones and got 10 ones which made one ten. I moved the 1 ten to the tens place. I then added 7 tens rods plus 2 tens rods plus 1 tens rod and got 10 tens or 100. I moved the 1 hundred

GRADE 2 MATHEMATICS CURRICULUM NUMBERSANDOPERATIONSINBASETEN
Waterford Public Schools 68
Common Core State Standard Unwrapped Standard Explanation and Examples to the hundreds place. Then I added 4 hundreds plus 2 hundreds plus 1 hundred and got 7 hundreds or 700. So Mason read 700 books.
Students should be able to connect different representations and explain the connections. Representations can include numbers, words (including mathematical language), pictures, number lines, and/or physical objects. Students should be able to use any/all of these representations as needed. An interactive whiteboard can be used to help students develop and explain their thinking.

GRADE 2 MATHEMATICS CURRICULUM MEASUREMENTANDDATA
Waterford Public Schools 69
Measure and estimate lengths in standard units
Common Core State Standard Unwrapped Standard Explanation and Examples
CC.2.MD.1 Measure the length of an object by selecting and using appropriate tools such as rulers, yardsticks, meter sticks, and measuring tapes.
A. Measure the length of objects within six inches with inches.
B. Measure the length of objects within 1 to 2 feet. Find the objects length in inches and translate to feet and inches.
C. Measure the length of objects using metric tools.
D. Translate the metric length to millimeters.
E. Choose appropriate measurement units for a given object, considering its size.
A. – E. Students in second grade will build upon what they learned in first grade from measuring length with non‐standard units to the new skill of measuring length in metric and U.S. Customary with standard units of measure. They should have many experiences measuring the length of objects with rulers, yardsticks, meter sticks, and tape measures. They will need to be taught how to actually use a ruler appropriately to measure the length of an object especially as to where to begin the measuring. Do you start at the end of the ruler or at the zero?
CC.2.MD.2 Measure the length of an object twice, using length units of different lengths for the two measurements; describe how the two measurements relate to the size of the unit chosen.
A. Measure the length of an object twice, using different units for the two measurements.
B. Describe the difference in amounts and how it relates to the size of the unit chosen.
A. – B. Students need multiple opportunities to measure using different units of measure. They should not be limited to measuring within the same standard unit. Students should have access to tools, both U.S. Customary and metric. The more students work with a specific unit of measure, the better they become at choosing the appropriate tool when measuring. Students measure the length of the same object using different tools (ruler with inches, ruler with centimeters, a yardstick, or meter stick). This will help students learn which tool is more appropriate for measuring a given object. They describe the

GRADE 2 MATHEMATICS CURRICULUM MEASUREMENTANDDATA
Waterford Public Schools 70
Common Core State Standard Unwrapped Standard Explanation and Examples relationship between the size of the measurement unit and the number of units needed to measure something. For instance, a student might say, “The longer the unit, the fewer I need.” Multiple opportunities to explore provide the foundation for relating metric units to customary units, as well as relating within customary (inches to feet to yards) and within metric (centimeters to meters).
CC.2.MD.3 Estimate lengths using units of inches, feet, centimeters, and meters.
A. Estimate lengths of objects in inches and centimeters.
B. Estimate the length of objects in feet and yards.
C. Estimate the length of objects in meters.
A. – C. Estimation helps develop familiarity with the specific unit of measure being used. To measure the length of a shoe, knowledge of an inch or a centimeter is important so that one can approximate the length in inches or centimeters. Students should begin practicing estimation with items which are familiar to them (length of desk, pencil, favorite book, etc.). Some useful benchmarks for measurement are: First joint to the tip of a thumb is about an inch Length from your elbow to your wrist is about a foot If your arm is held out perpendicular to your body, the length
from your nose to the tip of your fingers is about a yard
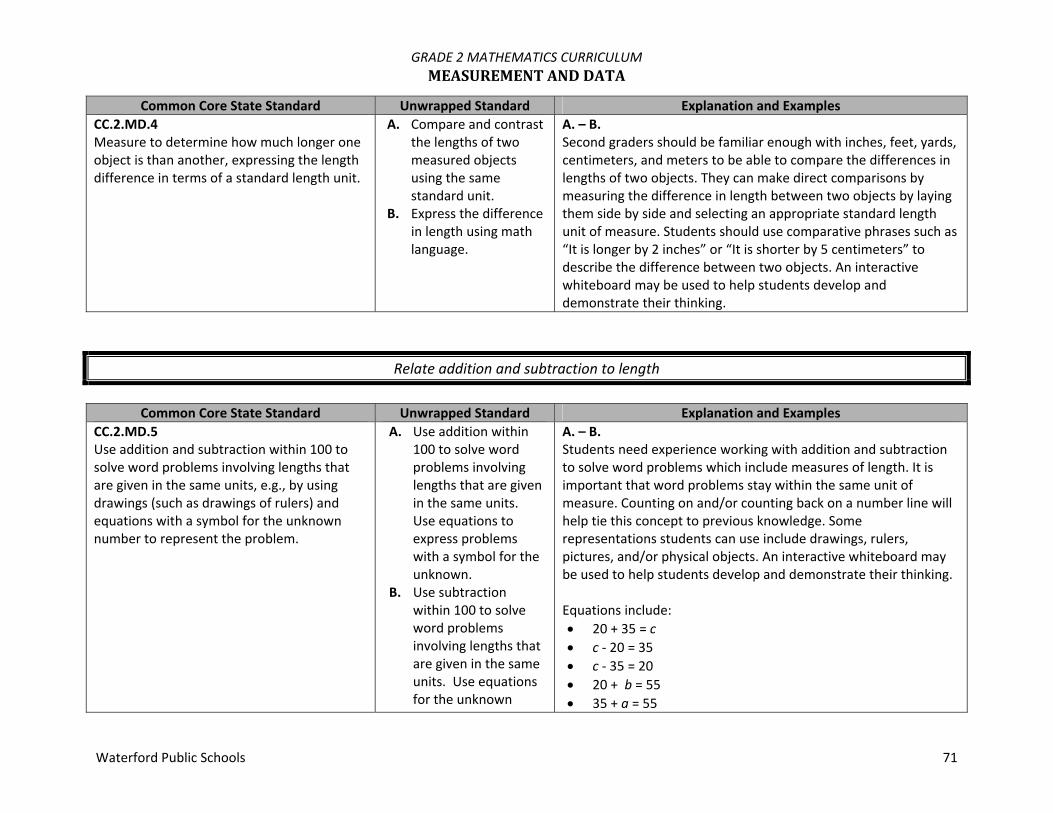
GRADE 2 MATHEMATICS CURRICULUM MEASUREMENTANDDATA
Waterford Public Schools 71
Common Core State Standard Unwrapped Standard Explanation and Examples CC.2.MD.4 Measure to determine how much longer one object is than another, expressing the length difference in terms of a standard length unit.
A. Compare and contrast the lengths of two measured objects using the same standard unit.
B. Express the difference in length using math language.
A. – B. Second graders should be familiar enough with inches, feet, yards, centimeters, and meters to be able to compare the differences in lengths of two objects. They can make direct comparisons by measuring the difference in length between two objects by laying them side by side and selecting an appropriate standard length unit of measure. Students should use comparative phrases such as “It is longer by 2 inches” or “It is shorter by 5 centimeters” to describe the difference between two objects. An interactive whiteboard may be used to help students develop and demonstrate their thinking.
Relate addition and subtraction to length
Common Core State Standard Unwrapped Standard Explanation and Examples
CC.2.MD.5 Use addition and subtraction within 100 to solve word problems involving lengths that are given in the same units, e.g., by using drawings (such as drawings of rulers) and equations with a symbol for the unknown number to represent the problem.
A. Use addition within 100 to solve word problems involving lengths that are given in the same units. Use equations to express problems with a symbol for the unknown.
B. Use subtraction within 100 to solve word problems involving lengths that are given in the same units. Use equations for the unknown
A. – B. Students need experience working with addition and subtraction to solve word problems which include measures of length. It is important that word problems stay within the same unit of measure. Counting on and/or counting back on a number line will help tie this concept to previous knowledge. Some representations students can use include drawings, rulers, pictures, and/or physical objects. An interactive whiteboard may be used to help students develop and demonstrate their thinking. Equations include: 20 + 35 = c c ‐ 20 = 35 c ‐ 35 = 20 20 + b = 55 35 + a = 55

GRADE 2 MATHEMATICS CURRICULUM MEASUREMENTANDDATA
Waterford Public Schools 72
Common Core State Standard Unwrapped Standard Explanation and Examples number to represent the problem.
55 = a + 35 55 = 20 + b Example: A word problem for 5 – n = 2 could be: Mary is making a
dress. She has 5 yards of fabric. She uses some of the fabric and has 2 yards left. How many yards did Mary use?
There is a strong connection between this standard and demonstrating fluency of addition and subtraction facts.
CC.2.MD.6 Represent whole numbers as lengths from 0 on a number line diagram with equally spaced points corresponding to the numbers 0, 1, 2, … , and represent whole‐number sums and differences within 100 on a number line diagram.
A. Represent whole numbers as lengths from 0 on a number line diagram and represent whole number sums within 100 on a number line.
B. Represent whole numbers as lengths from 0 on a number line diagram and represent whole number differences within 100 on a number line.
C. Identify a number pattern in a given set of numbers using the number line as a model. Explain the rule used to make the pattern.
A. – C. Students represent their thinking when adding and subtracting within 100 by using a number line. An interactive whiteboard can be used to help students demonstrate their thinking. Example: 10 – 6 = 4
Example: 4, 7, 10, 13, 16, 19 Rule for this set of numbers is Add 3. Example: 21, 19, 17, 15, 13, 11, 9 Rule for this set of numbers is Subtract 2

GRADE 2 MATHEMATICS CURRICULUM MEASUREMENTANDDATA
Waterford Public Schools 73
Work with time and money
Common Core State Standard Unwrapped Standard Explanation and Examples
CC.2.MD.7 Tell and write time from analog and digital clocks to the nearest five minutes, using a.m. and p.m.
A. Tell time and write to the nearest half hour using both analog and digital clock including both a.m. and p.m.
B. Tell and write time to the nearest quarter hour using analog and digital clocks including a.m. and p.m.
C. Tell and write time to the nearest five minutes with both analog and digital time including a.m. and p.m.
A. – C. In first grade, students learned to tell time to the nearest hour and half‐hour. Students build on this understanding in second grade by skip‐counting by 5 to recognize 5‐minute intervals on the clock. They need exposure to both digital and analog clocks. It is important that they can recognize time in both formats and communicate their understanding of time using both numbers and language. Common time phrases include the following: quarter till ___, quarter after ___, ten till ___, ten after ___, and half past ___. Students should understand that there are 2 cycles of 12 hours in a day ‐ a.m. and p.m. Recording their daily actions in a journal would be helpful for making real‐world connections and understanding the difference between these two cycles. An interactive whiteboard or document camera may be used to help students demonstrate their thinking.
CC.2.MD.8 Solve word problems involving dollar bills, quarters, dimes, nickels, and pennies, using $ (dollars) and ¢ (cents) symbols appropriately. Example: If you have 2 dimes and 3 pennies, how many cents do you have?
A. Identify coins and their value. Trade coins for equivalent amounts.
B. Solve word problems involving money amounts under one dollar.
C. Solve word problems involving money amounts greater than one dollar.
D. Solve word problems
A. – D. Since money is not specifically addressed in kindergarten, first grade, or third grade, students should have multiple opportunities to identify, count, recognize, and use coins and bills in and out of context. They should also experience making equivalent amounts using both coins and bills. “Dollar bills” should include denominations up to one hundred ($1.00, $5.00, $10.00, $20.00, $100.00). Students should solve story problems connecting the different representations. These representations may include objects, pictures, charts, tables, words, and/or numbers. Students should communicate their mathematical thinking and justify their

GRADE 2 MATHEMATICS CURRICULUM MEASUREMENTANDDATA
Waterford Public Schools 74
Common Core State Standard Unwrapped Standard Explanation and Examples involving dollar amounts with unknown amount in various positions.
answers. An interactive whiteboard or document camera may be used to help students demonstrate and justify their thinking. Example: Sandra went to the store and received $ 0.76 in change. What are three different sets of coins she could have received?
Represent and interpret data
Common Core State Standard Unwrapped Standard Explanation and Examples
CC.2.MD.9 Generate measurement data by measuring lengths of several objects to the nearest whole unit, or by making repeated measurements of the same object. Show the measurements by making a line plot, where the horizontal scale is marked off in whole‐number units.
A. Measure the length of several objects to the nearest whole unit, or make repeated measurements of the same object.
B. Create a line plot showing the measurements.
C. Compare and contrast the measurements.
A. – C. This standard emphasizes representing data using a line plot. Students will use the measurement skills learned in earlier standards to measure objects. Line plots are first introduced in this grade level. A line plot can be thought of as plotting data on a number line. An interactive whiteboard may be used to create and/or model line plots.

GRADE 2 MATHEMATICS CURRICULUM MEASUREMENTANDDATA
Waterford Public Schools 75
Common Core State Standard Unwrapped Standard Explanation and Examples CC.2.MD.10 Draw a picture graph and a bar graph (with single‐unit scale) to represent a data set with up to four categories. Solve simple put‐together, take‐apart, and compare problems using information presented in a bar graph. (See Glossary, Table 1 – Common Core State Standards for Mathematics.)
A. Create a picture graph to represent data set with up to four categories. Label all graph parts.
B. Create a bar graph in same manner.
C. Solve simple problems using the information in graph.
A. – C. Students should draw both picture and bar graphs representing data that can be sorted up to four categories using single unit scales (e.g., scales should count by ones). The data should be used to solve put together, take‐apart, and compare problems as listed in Table 1.
In second grade, picture graphs (pictographs) include symbols that represent single units. Pictographs should include a title, categories, category label, key, and data. Second graders should draw both horizontal and vertical bar graphs. Bar graphs include a title, scale, scale label, categories, category label, and data.

GRADE 2 MATHEMATICS CURRICULUM GEOMETRY
Waterford Public Schools 76
Reason with shapes and their attributes
Common Core State Standard Unwrapped Standard Explanation and Examples
CC.2.G.1 Recognize and draw shapes having specified attributes, such as a given number of angles or a given number of equal faces. Identify triangles, quadrilaterals, pentagons, hexagons, and cubes. (Sizes are compared directly or visually, not compared by measuring.)
A. Identify triangles, quadrilaterals, pentagons, hexagons, and cubes.
B. Recognize shapes as having specified attributes.
C. Draw shapes having specified attributes.
A. – C. Students identify, describe, and draw triangles, quadrilaterals, pentagons, and hexagons. Pentagons, triangles, and hexagons should appear as both regular (equal sides and equal angles) and irregular. Students recognize all four sided shapes as quadrilaterals. Students use the vocabulary word “angle” in place of “corner” but they do not need to name angle types. Interactive whiteboards and document cameras may be used to help identify shapes and their attributes. Shapes should be presented in a variety of orientations and configurations.
CC.2.G.2 Partition a rectangle into rows and columns of same‐size squares and count to find the total number of them.
A. Partition a rectangle into rows and columns of same‐size squares and count to find the total number of them.
B. Refer to the number of squares as the area of the rectangle.
A. – B. This standard is a precursor to learning about the area of a rectangle and using arrays for multiplication. An interactive whiteboard or manipulatives such as square tiles, cubes, or other square shaped objects can be used to help students partition rectangles.

GRADE 2 MATHEMATICS CURRICULUM GEOMETRY
Waterford Public Schools 77
Common Core State Standard Unwrapped Standard Explanation and Examples Rows are horizontal and columns are vertical.
CC.2.G.3 Partition circles and rectangles into two, three, or four equal shares, describe the shares using the words halves, thirds, half of, a third of, etc., and describe the whole as two halves, three thirds, four fourths. Recognize that equal shares of identical wholes need not have the same shape.
A. Divide circles and rectangles into equal shares (2,3 or 4). Describe whole as two halves, three thirds, four fourths.
B. Divide rectangles into equal shares that do not have the same shape. Describe the whole as mentioned above.
A. – B. This standard introduces fractions in an area model. Students need experiences with different sizes, circles, and rectangles. For example, students should recognize that when they cut a circle into three equal pieces, each piece will equal one third of its original whole. In this case, students should describe the whole as three thirds. If a circle is cut into four equal pieces, each piece will equal one fourth of its original whole and the whole is described as four fourths.
Students should see circles and rectangles partitioned in multiple ways so they learn to recognize that equal shares can be different shapes within the same whole. An interactive whiteboard may be used to show partitions of shapes.

GRADE 2 MATHEMATICS CURRICULUM GEOMETRY
Waterford Public Schools 78
Common Core State Standard Unwrapped Standard Explanation and Examples

GRADE 2 MATHEMATICS CURRICULUM PACINGGUIDE
Waterford Public Schools 79
Unit Title Pacing Standards
1. Fact Strategies (Addition and Subtraction) up to 20
Mathematical Practices 1, 2, 3, 4, 5, 7, 8 2 weeks
2.OA.1 Use addition and subtraction within 100 to solve one‐ and two‐step word problems involving situations of adding to, taking from, putting together, taking apart, and comparing, with unknowns in all positions, e.g., by using drawings and equations with a symbol for the unknown number to represent the problem.
2.OA.2 Fluently add and subtract within 20 using mental strategies. By end of Grade 2, know from memory all sums of two one‐digit numbers.
2.NBT.9 Explain why addition and subtraction strategies work, using place value and the properties of operations.
2. Reasoning with Shapes
Mathematical Practices 4, 7 2 weeks
2.G.1 Recognize and draw shapes having specified attributes, such as a given number of angles or a given number of equal faces. Identify triangles, quadrilaterals, pentagons, hexagons, and cubes.
2.G.3 Partition circles and rectangles into two, three, or four equal shares, describe the shares using the words halves, thirds, half of, a third of, etc., and describe the whole as two halves, three thirds, four fourths. Recognize that equal shares of identical wholes need not have the same shape.
3. Place Value
Mathematical Practices 2, 6, 7, 8 4 weeks
2.NBT.1 Understand that the three digits of a three‐digit number represent amounts of hundreds, tens, and ones; e.g., 706 equals 7 hundreds, 0 tens, and 6 ones.
2.NBT.2 Count within 1000; skip‐count by 5s, 10s, and 100s. 2.NBT.3 Read and write numbers to 1000 using base‐ten
numerals, number names, and expanded form. 2.NBT.4 Compare two three‐digit numbers based on meanings
of the hundreds, tens, and ones digits, using >, =, and < symbols to record the results of comparisons.

GRADE 2 MATHEMATICS CURRICULUM PACINGGUIDE
Waterford Public Schools 80
Unit Title Pacing Standards
4. Addition and Subtraction within 100
Mathematical Practices 2, 4, 5, 7, 8 3 weeks
2.OA.1 Use addition and subtraction within 100 to solve one‐ and two‐step word problems involving situations of adding to, taking from, putting together, taking apart, and comparing, with unknowns in all positions, e.g., by using drawings and equations with a symbol for the unknown number to represent the problem.
2.NBT.1 Understand that the three digits of a three‐digit number represent amounts of hundreds, tens, and ones; e.g., 706 equals 7 hundreds, 0 tens, and 6 ones.
2.NBT.5 Fluently add and subtract within 100 using strategies based on place value, properties of operations, and/or the relationship between addition and subtraction.
2.NBT.6 Add up to four two‐digit numbers using strategies based on place value and properties of operations.
2.NBT.9 Explain why addition and subtraction strategies work, using place value and the properties of operations.
2.MD.5 Use addition and subtraction within 100 to solve word problems involving lengths that are given in the same units, e.g., by using drawings (such as drawings of rulers) and equations with a symbol for the unknown number to represent the problem.
2.MD.6 Represent whole numbers as lengths from 0 on a number line diagram with equally spaced points corresponding to the numbers 0, 1, 2, ..., and represent whole‐number sums and differences within 100 on a number line diagram.
5. Money
Mathematical Practices 1, 2, 4, 5, 8 3 weeks
2.MD.8 Solve word problems involving dollar bills, quarters, dimes, nickels, and pennies, using $ and ¢ symbols appropriately. Example: If you have 2 dimes and 3 pennies, how many cents do you have?
6. Linear Measurement with Standard Units
Mathematical Practices 2, 3, 5, 6, 7 3 weeks
2.MD.1 Measure the length of an object by selecting and using appropriate tools such as rulers, yardsticks, meter sticks, and measuring tapes.

GRADE 2 MATHEMATICS CURRICULUM PACINGGUIDE
Waterford Public Schools 81
Unit Title Pacing Standards 2.MD.2 Measure the length of an object twice, using length
units of different lengths for the two measurements; describe how the two measurements relate to the size of the unit chosen.
2.MD.3 Estimate lengths using units of inches, feet, centimeters, and meters.
2.MD.4 Measure to determine how much longer one object is than another, expressing the length difference in terms of a standard length unit.
7. Time
Mathematical Practices 2, 5, 6, 7, 8 2 weeks
2.NBT.2 Count within 1000; skip‐count by 5s, 10s, and 100s. 2.MD.7 Tell and write time from analog and digital clocks to
the nearest five minutes, using a.m. and p.m. 2.G.3 Partition circles and rectangles into two, three, or four
equal shares, describe the shares using the words halves, thirds, half of, a third of, etc., and describe the whole as two halves, three thirds, four fourths. Recognize that equal shares of identical wholes need not have the same shape.
8. Addition and Subtraction within 1000
Mathematical Practices 1, 2, 3, 4, 5, 7, 8 3 weeks
2.NBT.1 Understand that the three digits of a three‐digit number represent amounts of hundreds, tens, and ones; e.g., 706 equals 7 hundreds, 0 tens, and 6 ones.
2.NBT.7 Add and subtract within 1000, using concrete models or drawings and strategies based on place value, properties of operations, and/or the relationship between addition and subtraction; relate the strategy to a written method. Understand that in adding or subtracting three‐digit numbers, one adds or subtracts hundreds and hundreds, tens and tens, ones and ones; and sometimes it is necessary to compose or decompose tens or hundreds.
2.NBT.8 Mentally add 10 or 100 to a given number 100–900, and mentally subtract 10 or 100 from a given number 100–900.
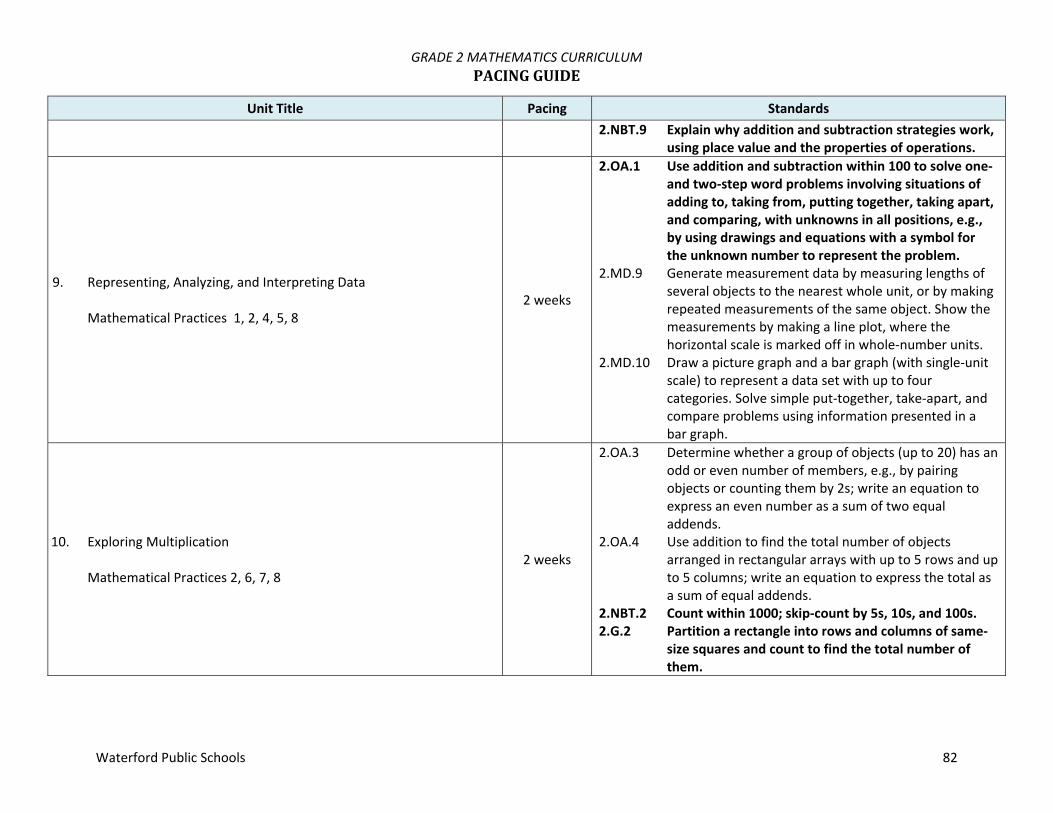
GRADE 2 MATHEMATICS CURRICULUM PACINGGUIDE
Waterford Public Schools 82
Unit Title Pacing Standards 2.NBT.9 Explain why addition and subtraction strategies work,
using place value and the properties of operations.
9. Representing, Analyzing, and Interpreting Data
Mathematical Practices 1, 2, 4, 5, 8 2 weeks
2.OA.1 Use addition and subtraction within 100 to solve one‐ and two‐step word problems involving situations of adding to, taking from, putting together, taking apart, and comparing, with unknowns in all positions, e.g., by using drawings and equations with a symbol for the unknown number to represent the problem.
2.MD.9 Generate measurement data by measuring lengths of several objects to the nearest whole unit, or by making repeated measurements of the same object. Show the measurements by making a line plot, where the horizontal scale is marked off in whole‐number units.
2.MD.10 Draw a picture graph and a bar graph (with single‐unit scale) to represent a data set with up to four categories. Solve simple put‐together, take‐apart, and compare problems using information presented in a bar graph.
10. Exploring Multiplication
Mathematical Practices 2, 6, 7, 8 2 weeks
2.OA.3 Determine whether a group of objects (up to 20) has an odd or even number of members, e.g., by pairing objects or counting them by 2s; write an equation to express an even number as a sum of two equal addends.
2.OA.4 Use addition to find the total number of objects arranged in rectangular arrays with up to 5 rows and up to 5 columns; write an equation to express the total as a sum of equal addends.
2.NBT.2 Count within 1000; skip‐count by 5s, 10s, and 100s. 2.G.2 Partition a rectangle into rows and columns of same‐
size squares and count to find the total number of them.

GRADE 3 MATHEMATICS CURRICULUM OVERVIEW
Waterford Public Schools 83
OperationsandAlgebraicThinking(OA) Represent and solve problems involving multiplication and
division. Understand properties of multiplication and the relationship
between multiplication and division. Multiply and divide within 100. Solve problems involving the four operations, and identify
and explain patterns in arithmetic. NumberandOperationsinBaseTen(NBT)
Use place value understanding and properties of operations to perform multi‐digit arithmetic.
NumberandOperations—Fractions(NF)
Develop understanding of fractions as numbers.
MeasurementandData(MD) Solve problems involving measurement and estimation of
intervals of time, liquid volumes, and masses of objects. Represent and interpret data. Geometric measurement: understand concepts of area and
relate area to multiplication and to addition. Geometric measurement: recognize perimeter as an attribute
of plane figures and distinguish between linear and area measures.
Geometry(G) Reason with shapes and their attributes.
MathematicalPractices(MP)1. Make sense of problems and persevere in solving them. 2. Reason abstractly and quantitatively. 3. Construct viable arguments and critique the reasoning of
others. 4. Model with mathematics. 5. Use appropriate tools strategically. 6. Attend to precision. 7. Look for and make use of structure.
Look for and express regularity in repeated reasoning. Assessments:
Teacher‐Created C.F.A.’s and Benchmarks Resources:
My Math by McGraw‐Hill Promethean Tiles and Base‐Ten blocks Tiles Base‐ten blocks Liquid measurement set

GRADE 3 MATHEMATICS CURRICULUM OPERATIONSANDALGEBRAICTHINKING
Waterford Public Schools 84
Represent and solve problems involving multiplication and division
Common Core State Standard Unwrapped Standard Explanation and Examples
CC.3.OA.1 Interpret products of whole numbers, e.g., interpret 5 × 7 as the total number of objects in 5 groups of 7 objects each. For example, describe a context in which a total number of objects can be expressed as 5 × 7.
A. Interpret products of whole numbers as the total number of objects in a certain number of groups of objects.
A. Students recognize multiplication as a means to determine the total number of objects when there are a specific number of groups with the same number of objects in each group. Multiplication requires students to think in terms of groups of things rather than individual things. Students learn that the multiplication symbol ‘x’ means “groups of” and problems such as 5 x 7 refer to 5 groups of 7. To further develop this understanding, students interpret a problem situation requiring multiplication using pictures, objects, words, numbers, and equations. Then, given a multiplication expression (e.g., 5 x 6) students interpret the expression using a multiplication context. They should begin to use the terms, factor and product, as they describe multiplication. Students may use interactive whiteboards to create digital models.
CC.3.OA.2. Interpret whole‐number quotients of whole numbers, e.g., interpret 56 ÷ 8 as the number of objects in each share when 56 objects are partitioned equally into 8 shares, or as a number of shares when 56 objects are partitioned into equal shares of 8 objects each. For example, describe a context in which a number of shares or a number of groups can be expressed as 56 ÷ 8.
A. Interpret division as sharing
B. Interpret division as grouping
A. – B. Students recognize the operation of division in two different types of situations. One situation requires determining how many groups and the other situation requires sharing (determining how many in each group). Students should be exposed to appropriate terminology (quotient, dividend, divisor, and factor). To develop this understanding, students interpret a problem situation requiring division using pictures, objects, words, numbers, and equations. Given a division expression (e.g., 24 ÷ 6) students interpret the expression in contexts that require both interpretations of division.

GRADE 3 MATHEMATICS CURRICULUM OPERATIONSANDALGEBRAICTHINKING
Waterford Public Schools 85
Common Core State Standard Unwrapped Standard Explanation and Examples Students may use interactive whiteboards to create digital models.
CC.3.OA.3. Use multiplication and division within 100 to solve word problems in situations involving equal groups, arrays, and measurement quantities, e.g., by using drawings and equations with a symbol for the unknown number to represent the problem.
A. Use multiplication within 100 to solve word problems involving: o Equal groups o Arrays o Measurement
quantities B. Use division within
100 to solve word problems involving: o Equal groups o Arrays o Measurement
quantities C. Use drawings to
represent the problem.
D. Use equations with a symbol for the unknown number to represent the problem.
A. – D. Students use a variety of representations for creating and solving one‐step word problems, i.e., numbers, words, pictures, physical objects, or equations. They use multiplication and division of whole numbers up to 10 x10. Students explain their thinking, show their work by using at least one representation, and verify that their answer is reasonable. Word problems may be represented in multiple ways: Equations: 3 x 4 = ?, 4 x 3 = ?, 12 ÷ 4 = ? and 12 ÷ 3 = ? Array: Equal groups Repeated addition: 4 + 4 + 4 or repeated subtraction Three equal jumps forward from 0 on the number line to 12
or three equal jumps backwards from 12 to 0

GRADE 3 MATHEMATICS CURRICULUM OPERATIONSANDALGEBRAICTHINKING
Waterford Public Schools 86
Common Core State Standard Unwrapped Standard Explanation and Examples Examples of division problems: Determining the number of objects in each share (partitive
division, where the size of the groups is unknown):
The bag has 92 hair clips, and Laura and her three friends want to share them equally. How many hair clips will each person receive?
Determining the number of shares (measurement division,
where the number of groups is unknown)
Max the monkey loves bananas. Molly, his trainer, has 24 bananas. If she gives Max 4 bananas each day, how many days will the bananas last?
Starting Day 1 Day 2 Day 3 Day 4 Day 5 Day 6
24 24‐4=20
20‐4=16
16‐4=12
12‐4=8
8‐4= 4
4‐4= 0
Solution: The bananas will last for 6 days. Students may use interactive whiteboards to show work and justify their thinking.
GRADE 3 MATHEMATICS CURRICULUM OPERATIONSANDALGEBRAICTHINKING
Waterford Public Schools 87
Common Core State Standard Unwrapped Standard Explanation and Examples CC.3.OA.4. Determine the unknown whole number in a multiplication or division equation relating three whole numbers. For example, determine the unknown number that makes the equation true in each of the equations 8 × ? = 48, 5 = ÷ 3, 6 × 6 = ?.
A. Determine unknown number in multiplication equations relating 3 whole numbers.
B. Determine unknown number in division equations relating 3 whole numbers
A. – B. This standard is strongly connected to 3.OA.3 when students solve problems and determine unknowns in equations. Students should also experience creating story problems for given equations. When crafting story problems, they should carefully consider the question(s) to be asked and answered to write an appropriate equation. Students may approach the same story problem differently and write either a multiplication equation or division equation. Students apply their understanding of the meaning of the equal sign as ”the same as” to interpret an equation with an unknown. When given 4 x ? = 40, they might think: 4 groups of some number is the same as 40 4 times some number is the same as 40 I know that 4 groups of 10 is 40 so the unknown number is 10 The missing factor is 10 because 4 times 10 equals 40. Equations in the form of a x b = c and c = a x b should be used interchangeably, with the unknown in different positions. Examples: Solve the equations below:
24 = ? x 6 9÷72
Rachel has 3 bags. There are 4 marbles in each bag. How
many marbles does Rachel have altogether? 3 x 4 = m Students may use interactive whiteboards to create digital models to explain and justify their thinking.

GRADE 3 MATHEMATICS CURRICULUM OPERATIONSANDALGEBRAICTHINKING
Waterford Public Schools 88
Understand Properties of Multiplication and relationship between multiplication and division
Common Core State Standard Unwrapped Standard Explanation and Examples
CC.3.OA.5 Apply properties of operations as strategies to multiply and divide. Examples: If 6 × 4 = 24 is known, then 4 × 6 = 24 is also known. (Commutative property of multiplication.) 3 × 5 × 2 can be found by multiplying 3 × 5 = 15 then multiplying 15 × 2 = 30, or by multiplying 5 × 2 = 10 then multiplying 3 × 10 = 30. (Associative property of multiplication.) Knowing that 8 × 5 = 40 and 8 × 2 = 16, one can find 8 × 7 as 8 × (5 + 2) = (8 × 5) + (8 × 2) = 40 + 16 = 56. (Distributive property.) (Students need not use formal terms for these properties.)
A. Apply commutative property of multiplication.
B. Apply associative property of multiplication.
C. Apply distributive property of multiplication.
D. Apply commutative property of division.
E. Apply associative property of division.
F. Apply distributive property of division.
G. Recognize which properties work for multiplication and division.
A. – G. Students represent expressions using various objects, pictures, words and symbols in order to develop their understanding of properties. They multiply by 1 and 0 and divide by 1. They change the order of numbers to determine that the order of numbers does not make a difference in multiplication (but does make a difference in division). Given three factors, they investigate changing the order of how they multiply the numbers to determine that changing the order does not change the product. They also decompose numbers to build fluency with multiplication. Models help build understanding of the commutative property: Example: 3 x 6 = 6 x 3 In the following diagram it may not be obvious that 3 groups of 6 is the same as 6 groups of 3. A student may need to count to verify this.
is the same quantity as Example: 4 x 3 = 3 x 4 An array explicitly demonstrates the concept of the commutative property. 4 rows of 3 or 4 x 3 3 rows of 4 or 3 x 4
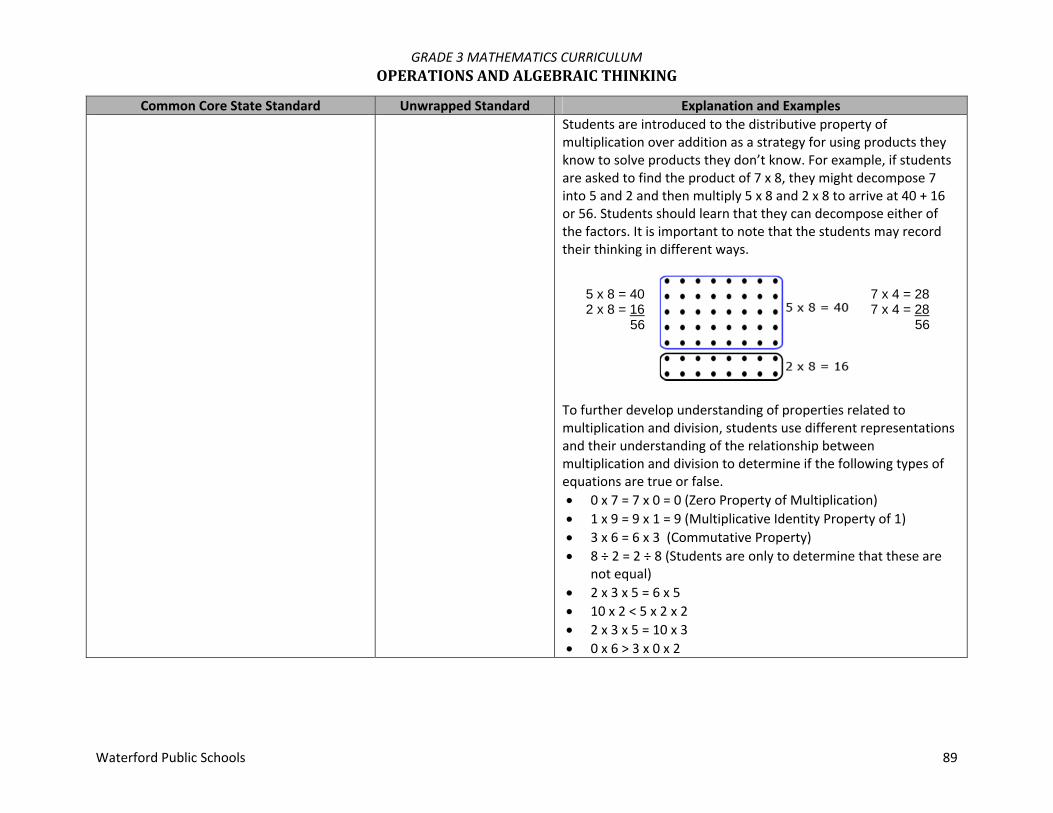
GRADE 3 MATHEMATICS CURRICULUM OPERATIONSANDALGEBRAICTHINKING
Waterford Public Schools 89
Common Core State Standard Unwrapped Standard Explanation and Examples Students are introduced to the distributive property of multiplication over addition as a strategy for using products they know to solve products they don’t know. For example, if students are asked to find the product of 7 x 8, they might decompose 7 into 5 and 2 and then multiply 5 x 8 and 2 x 8 to arrive at 40 + 16 or 56. Students should learn that they can decompose either of the factors. It is important to note that the students may record their thinking in different ways. To further develop understanding of properties related to multiplication and division, students use different representations and their understanding of the relationship between multiplication and division to determine if the following types of equations are true or false. 0 x 7 = 7 x 0 = 0 (Zero Property of Multiplication) 1 x 9 = 9 x 1 = 9 (Multiplicative Identity Property of 1) 3 x 6 = 6 x 3 (Commutative Property) 8 ÷ 2 = 2 ÷ 8 (Students are only to determine that these are
not equal) 2 x 3 x 5 = 6 x 5 10 x 2 < 5 x 2 x 2 2 x 3 x 5 = 10 x 3 0 x 6 > 3 x 0 x 2
5 x 8 = 40 2 x 8 = 16 56
7 x 4 = 28 7 x 4 = 28 56

GRADE 3 MATHEMATICS CURRICULUM OPERATIONSANDALGEBRAICTHINKING
Waterford Public Schools 90
Common Core State Standard Unwrapped Standard Explanation and Examples CC.3.OA.6 Understand division as an unknown‐factor problem. For example, divide 32 ÷ 8 by finding the number that makes 32 when multiplied by 8.
A. Recognize factors of whole numbers‐fact families.
A. Multiplication and division are inverse operations and that understanding can be used to find the unknown. Fact family triangles demonstrate the inverse operations of multiplication and division by showing the two factors and how those factors relate to the product and/or quotient. Examples: 3 x 5 = 15 5 x 3 = 15 15 ÷ 3 = 5 15 ÷ 5 = 3 Students use their understanding of the meaning of the equal sign as “the same as” to interpret an equation with an unknown. When given 32 ÷ = 4, students may think: 4 groups of some number is the same as 32 4 times some number is the same as 32 I know that 4 groups of 8 is 32 so the unknown number is 8 The missing factor is 8 because 4 times 8 is 32. Equations in the form of a ÷ b = c and c = a ÷ b need to be used interchangeably, with the unknown in different positions.
3 5
15
X or ÷

GRADE 3 MATHEMATICS CURRICULUM OPERATIONSANDALGEBRAICTHINKING
Waterford Public Schools 91
Multiply and Divide within 100
Common Core State Standard Unwrapped Standard Explanation and Examples
CC.3.OA.7 Fluently multiply and divide within 100, using strategies such as the relationship between multiplication and division (e.g., knowing that 8 × 5 = 40, one knows 40 ÷ 5 = 8) or properties of operations. By end of Grade 3, know from memory all products of one‐digit numbers.
A. Know from memory all products of one‐digit numbers.
B. Use turn around facts in multiplication and division.
C. Fluently multiply within 100.
D. Fluently divide within 100
A. – D. By studying patterns and relationships in multiplication facts and relating multiplication and division, students build a foundation for fluency with multiplication and division facts. Students demonstrate fluency with multiplication facts through 10 and the related division facts. Multiplying and dividing fluently refers to knowledge of procedures, knowledge of when and how to use them appropriately, and skill in performing them flexibly, accurately, and efficiently. Strategies students may use to attain fluency include: Multiplication by zeros and ones Doubles (2s facts), Doubling twice (4s), Doubling three times
(8s) Tens facts (relating to place value, 5 x 10 is 5 tens or 50) Five facts (half of tens) Skip counting (counting groups of __ and knowing how many
groups have been counted) Square numbers (ex: 3 x 3) Nines (10 groups less one group, e.g., 9 x 3 is 10 groups of 3
minus one group of 3) Decomposing into known facts (6 x 7 is 6 x 6 plus one more
group of 6) Turn‐around facts (Commutative Property) Fact families (Ex: 6 x 4 = 24; 24 ÷ 6 = 4; 24 ÷ 4 = 6; 4 x 6 = 24) Missing factors General Note: Students should have exposure to multiplication and division problems presented in both vertical and horizontal forms.

GRADE 3 MATHEMATICS CURRICULUM OPERATIONSANDALGEBRAICTHINKING
Waterford Public Schools 92
Solve problems involving the four operations and identify and explain patterns in arithmetic
Common Core State Standard Unwrapped Standard Explanation and Examples
CC.3.OA.8 Solve two‐step word problems using the four operations. Represent these problems using equations with a letter standing for the unknown quantity. Assess the reasonableness of answers using mental computation and estimation strategies including rounding. (This standard is limited to problems posed with whole numbers and having whole‐number answers; students should know how to perform operations in the conventional order when there are no parentheses to specify a particular order [Order of Operations]).
A. Solve two‐ step problems using addition.
B. Solve two‐step problems using subtraction.
C. Solve two‐step problems using multiplication.
D. Solve two‐step problems using division.
E. Use unknown quantities in all equations.
F. Assess reasonableness of answers using mental computation.
G. Assess reasonableness of answers using estimation such as rounding.
A. – G. Students should be exposed to multiple problem‐solving strategies (using any combination of words, numbers, diagrams, physical objects or symbols) and be able to choose which ones to use. Examples: Jerry earned 231 points at school last week. This week he
earned 79 points. If he uses 60 points to earn free time on a computer, how many points will he have left?
A student may use the number line above to describe his/her thinking, “231 + 9 = 240 so now I need to add 70 more. 240, 250 (10 more), 260 (20 more), 270, 280, 290, 300, 310 (70 more). Now I need to count back 60. 310, 300 (back 10), 290 (back 20), 280, 270, 260, 250 (back 60).” A student writes the equation, 231 + 79 – 60 = m and uses rounding (230 + 80 – 60) to estimate. A student writes the equation, 231 + 79 – 60 = m and calculates 79‐60 = 19 and then calculates 231 + 19 = m.

GRADE 3 MATHEMATICS CURRICULUM OPERATIONSANDALGEBRAICTHINKING
Waterford Public Schools 93
Common Core State Standard Unwrapped Standard Explanation and Examples The soccer club is going on a trip to the water park. The cost
of attending the trip is $63. Included in that price is $13 for lunch and the cost of 2 wristbands, one for the morning and one for the afternoon. Write an equation representing the cost of the field trip and determine the price of one wristband.
The above diagram helps the student write the equation, w + w + 13 = 63. Using the diagram, a student might think, “I know that the two wristbands cost $50 ($63‐$13) so one wristband costs $25.” To check for reasonableness, a student might use front end estimation and say 60‐10 = 50 and 50 ÷ 2 = 25.
When students solve word problems, they use various estimation skills which include identifying when estimation is appropriate, determining the level of accuracy needed, selecting the appropriate method of estimation, and verifying solutions or determining the reasonableness of solutions. Estimation strategies include, but are not limited to: using benchmark numbers that are easy to compute front‐end estimation with adjusting (using the highest place
value and estimating from the front end making adjustments to the estimate by taking into account the remaining amounts)
rounding and adjusting (students round down or round up and then adjust their estimate depending on how much the rounding changed the original values)
w w 13
63

GRADE 3 MATHEMATICS CURRICULUM OPERATIONSANDALGEBRAICTHINKING
Waterford Public Schools 94
Common Core State Standard Unwrapped Standard Explanation and Examples CC.3.OA.9 Identify arithmetic patterns (including patterns in the addition table or multiplication table), and explain them using properties of operations. For example, observe that 4 times a number is always even, and explain why 4 times a number can be decomposed into two equal addends
A. Identify patterns on addition and subtraction tables.
B. Identify patterns on multiplication tables.
C. Explain the patterns using properties of operations.
A. – C. Students need ample opportunities to observe and identify important numerical patterns related to operations. They should build on their previous experiences with properties related to addition and subtraction. Students investigate addition and multiplication tables in search of patterns and explain why these patterns make sense mathematically. For example: Any sum of two even numbers is even. Any sum of two odd numbers is even. Any sum of an even number and an odd number is odd. The multiples of 4, 6, 8, and 10 are all even because they can
all be decomposed into two equal groups. The doubles (2 addends the same) in an addition table fall on
a diagonal while the doubles (multiples of 2) in a multiplication table fall on horizontal and vertical lines.
The multiples of any number fall on a horizontal and a vertical line due to the commutative property.
All the multiples of 5 end in a 0 or 5 while all the multiples of 10 end with 0. Every other multiple of 5 is a multiple of 10.
Students also investigate a hundreds chart in search of addition and subtraction patterns. They record and organize all the different possible sums of a number and explain why the pattern makes sense.

GRADE 3 MATHEMATICS CURRICULUM NUMBERANDOPERATIONSINBASETEN
Waterford Public Schools 95
Use place value understanding and properties of operations to perform multi‐digit arithmetic
Common Core State Standard Unwrapped Standard Explanation and Examples
CC.3.NBT.1 Use place value understanding to round whole numbers to the nearest 10 or 100.
A. Round whole numbers to the nearest 10 or 100.
A. Students learn when and why to round numbers. They identify possible answers and halfway points. Then they narrow where the given number falls between the possible answers and halfway points. They also understand that by convention if a number is exactly at the halfway point of the two possible answers, the number is rounded up. Example: Round 178 to the nearest 10.
Step 1: The answer is either 170 or 180. Step 2: The halfway point is 175.
Step 3: 178 is between 175 and 180.
GRADE 3 MATHEMATICS CURRICULUM NUMBERANDOPERATIONSINBASETEN
Waterford Public Schools 96
Common Core State Standard Unwrapped Standard Explanation and Examples CC.3.NBT.2 Fluently add and subtract within 1000 using strategies and algorithms based on place value, properties of operations, and/or the relationship between addition and subtraction.
A. Fluently add within 1000 using strategies and algorithms based on place value and properties of operations.
B. Fluently subtract within 1000 using strategies and algorithms based on place value and properties of operations.
C. Recognize the relationship between addition and subtraction.
A. – C. Problems should include both vertical and horizontal forms, including opportunities for students to apply the commutative and associative properties. Adding and subtracting fluently refers to knowledge of procedures, knowledge of when and how to use them appropriately, and skill in performing them flexibly, accurately, and efficiently. Students explain their thinking and show their work by using strategies and algorithms, and verify that their answer is reasonable. An interactive whiteboard or document camera may be used to show and share student thinking. Example: Mary read 573 pages during her summer reading challenge.
She was only required to read 399 pages. How many extra pages did Mary read beyond the challenge requirements?

GRADE 3 MATHEMATICS CURRICULUM NUMBERANDOPERATIONSINBASETEN
Waterford Public Schools 97
Common Core State Standard Unwrapped Standard Explanation and Examples CC.3.NBT.3 Multiply one‐digit whole numbers by multiples of 10 in the range 10‐90 (e.g., 9 × 80, 5 × 60) using strategies based on place value and properties of operations
A. Multiply one‐digit whole numbers by multiples of 10 in the range 10‐90.
A. Students may use several approaches to solve the problem including the traditional algorithm. Examples of other methods students may use are listed below: 399 + 1 = 400, 400 + 100 = 500, 500 + 73 = 573, therefore 1+
100 + 73 = 174 pages (Adding up strategy) 400 + 100 is 500; 500 + 73 is 573; 100 + 73 is 173 plus 1 (for
399, to 400) is 174 (Compensating strategy) Take away 73 from 573 to get to 500, take away 100 to get to
400, and take away 1 to get to 399. Then 73 +100 + 1 = 174 (Subtracting to count down strategy)
399 + 1 is 400, 500 (that’s 100 more). 510, 520, 530, 540, 550, 560, 570, (that’s 70 more), 571, 572, 573 (that’s 3 more) so the total is 1 + 100 + 70 + 3 = 174 (Adding by tens or hundreds strategy
Students use base ten blocks, diagrams, or hundreds charts to multiply one‐digit numbers by multiples of 10 from 10‐90. They apply their understanding of multiplication and the meaning of the multiples of 10. For example, 30 is 3 tens and 70 is 7 tens. They can interpret 2 x 40 as 2 groups of 4 tens or 8 groups of ten. They understand that 5 x 60 is 5 groups of 6 tens or 30 tens and know that 30 tens is 300. After developing this understanding they begin to recognize the patterns in multiplying by multiples of 10. Students may use manipulatives, drawings, document camera, or interactive whiteboard to demonstrate their understanding.

GRADE 3 MATHEMATICS CURRICULUM NUMBERANDOPERATIONS–FRACTIONS
Waterford Public Schools 98
Develop understanding of fractions as numbers Grade 3 expectations are limited to fractions with denominators 2,3,4,6, and 8
Common Core State Standard Unwrapped Standard Explanation and Examples
CC.3.NF.1 Understand a fraction 1/b as the quantity formed by 1 part when a whole is partitioned into b equal parts; understand a fraction a/b as the quantity formed by a parts of size 1/b.
A. Understand that a fraction 1/b as the quantity formed by 1 part when a whole is equally divided into b parts.
B. Understand a fraction a/b as the quantity formed by a parts when a whole is equally divided into b parts.
A. – B. Some important concepts related to developing understanding of fractions include: Understand fractional parts must be equal‐sized
Example Non‐example
These are thirds These are NOT thirds The number of equal parts tell how many make a whole As the number of equal pieces in the whole increases, the
size of the fractional pieces decreases The size of the fractional part is relative to the whole
o The number of children in one‐half of a classroom is different than the number of children in one‐half of a school. (the whole in each set is different therefore the half in each set will be different)
When a whole is cut into equal parts, the denominator represents the number of equal parts
The numerator of a fraction is the count of the number of equal parts o ¾ means that there are 3 one‐fourths o Students can count one fourth, two fourths, three fourths

GRADE 3 MATHEMATICS CURRICULUM NUMBERANDOPERATIONS–FRACTIONS
Waterford Public Schools 99
Common Core State Standard Unwrapped Standard Explanation and Examples
Students express fractions as fair sharing, parts of a whole, and parts of a set. They use various contexts (candy bars, fruit, and cakes) and a variety of models (circles, squares, rectangles, fraction bars, and number lines) to develop understanding of fractions and represent fractions. Students need many opportunities to solve word problems that require fair sharing.
To develop understanding of fair shares, students first participate in situations where the number of objects is greater than the number of children and then progress into situations where the number of objects is less than the number of children. Examples: Four children share six brownies so that each child receives a
fair share. How many brownies will each child receive? Six children share four brownies so that each child receives a
fair share. What portion of each brownie will each child receive?
What fraction of the rectangle is shaded? How might you draw the rectangle in another way but with the same fraction shaded?
What fraction of the set is black?
Solution: 24
or 12
Solution: 26

GRADE 3 MATHEMATICS CURRICULUM NUMBERANDOPERATIONS–FRACTIONS
Waterford Public Schools 100
Common Core State Standard Unwrapped Standard Explanation and Examples
CC.3.NF.2a Represent a fraction 1/b on a number line diagram by defining the interval from 0 to 1 as the whole and partitioning it into b equal parts. Recognize that each part has size 1/b and that the endpoint of the part based at 0 locates the number 1/b on the number line.
A. Use a number line to represent a fraction1/b by marking the interval from 0 to 1 as the whole broken into b equal parts.
B. Recognize that each part is size 1/b when you start at the 0 end point.
A. – B. Students transfer their understanding of parts of a whole to partition a number line into equal parts. There are two new concepts addressed in this standard which students should have time to develop. 1. On a number line from 0 to 1, students can partition (divide)
it into equal parts and recognize that each segmented part represents the same length.
2. Students label each fractional part based on how far it is from
zero to the endpoint.
An interactive whiteboard may be used to help students develop these concepts.
CC.3.NF.2b Represent a fraction a/b on a number line diagram by marking off a lengths 1/b from 0. Recognize that the resulting interval has size a/b and that its endpoint locates the number a/b on the number line.
A. Represent a/b on a number line by marking off 1/b intervals from 0 end point.
B. Recognize that the resulting interval has size a/b.
Solution: 13

GRADE 3 MATHEMATICS CURRICULUM NUMBERANDOPERATIONS–FRACTIONS
Waterford Public Schools 101
Common Core State Standard Unwrapped Standard Explanation and Examples CC.3.NF.3a Understand two fractions as equivalent (equal) if they are the same size, or the same point on a number line.
A. Recognize equivalent fraction that are the same size.
B. Recognize fractions that are equivalent if on the same point on a number line.
A. – B. An important concept when comparing fractions is to look at the
size of the parts and the number of the parts. For example, 18 is
smaller than 12 because when 1 whole is cut into 8 pieces, the
pieces are much smaller than when 1 whole is cut into 2 pieces.
Students recognize when examining fractions with common denominators, the wholes have been divided into the same number of equal parts. So the fraction with the larger numerator has the larger number of equal parts.
62 6
5
To compare fractions that have the same numerator but different denominators, students understand that each fraction has the same number of equal parts but the size of the parts are different. They can infer that the same number of smaller pieces is less than the same number of bigger pieces.
83 4
3
CC.3.NF.3b Recognize and generate simple equivalent fractions, e.g., ½ = 2/4, 4/6 = 2/3). Explain why the fractions are equivalent, e.g., by using a visual fraction model
A. Recognize equivalent fractions.
B. Create equivalent fractions using a visual fraction model.
CC.3NF.3c. Express whole numbers as fractions, and recognize fractions that are equivalent to whole numbers. Examples: Express 3 in the form 3 = 3/1; recognize that 6/1 = 6; locate 4/4 and 1 at the same point of a number line diagram.
A. Write whole numbers as fractions.
B. Recognize fractions that are equivalent to whole numbers.
A. – B.
4/4 = 1
1/4 1/4
1/4 1/4
<
<

GRADE 3 MATHEMATICS CURRICULUM NUMBERANDOPERATIONS–FRACTIONS
Waterford Public Schools 102
Common Core State Standard Unwrapped Standard Explanation and Examples CC.3.NF.3d Compare two fractions with the same numerator or the same denominator by reasoning about their size. Recognize that comparisons are valid only when the two fractions refer to the same whole. Record the results of comparisons with the symbols >, =, or <, and justify the conclusions, e.g., by using a visual fraction model.
A. Compare two fractions with different numerator and the same denominator to reason about their size.
B. Compare two fractions with the same numerator and different denominators to reason about their size.
C. Record the comparisons with the symbols >, <, or =
D. Prove your conclusion by using a visual fraction model.
A. – D. 2/4 < 3/4 2/6 > 2/8

GRADE 3 MATHEMATICS CURRICULUM MEASUREMENTANDDATA
Waterford Public Schools 103
Solve problems involving measurement and estimation of intervals of time, liquid volumes, and masses of objects
Common Core State Standard Unwrapped Standard Explanation and Examples
CC.3.MD.1 Tell and write time to the nearest minute and measure time intervals in minutes. Solve word problems involving addition and subtraction of time intervals in minutes, e.g., by representing the problem on a number line diagram.
A. Tell and write time to the nearest minute.
B. Measure and record elapsed time.
C. Solve time word problems involving addition and subtraction of time intervals in minutes.
D. Represent the problem on a number line.
A. – D. Students in second grade learned to tell time to the nearest five minutes. In third grade, they extend telling time and measure elapsed time both in and out of context using clocks and number lines. Students may use an interactive whiteboard to demonstrate understanding and justify their thinking.
CC.3.MD.2 Measure and estimate liquid volumes and masses of objects using standard units of grams (g), kilogram (kg), and liters (l). (Excludes compound units such as cm3 and finding the geometric volume of a container.) Add, subtract, multiply, or divide to solve one‐step word problems involving masses or volumes that are given in the same units, e.g., by using drawings (such as a beaker with a measurement scale) to represent the problem. (Excludes multiplicative comparison problems [problems involving notions of “times as much”.
A. Measure and estimate liquid volumes and masses of objects using grams (g).
B. Measure and estimate liquid volumes and masses of objects using kilograms (kg).
C. Measure and estimate liquid volumes and masses of objects using liters (l).
D. Add or subtract to solve one‐step word problems involving masses or volume by using drawings (such as a beaker with a
A. – E. Students need multiple opportunities weighing classroom objects and filling containers to help them develop a basic understanding of the size and weight of a liter, a gram, and a kilogram. Milliliters may also be used to show amounts that are less than a liter. Example: Students identify 5 things that weigh about one gram. They record their findings with words and pictures. (Students can repeat this for 5 grams and 10 grams.) This activity helps develop gram benchmarks. One large paperclip weighs about one gram. A box of large paperclips (100 clips) weighs about 100 grams so 10 boxes would weigh one kilogram.

GRADE 3 MATHEMATICS CURRICULUM MEASUREMENTANDDATA
Waterford Public Schools 104
Common Core State Standard Unwrapped Standard Explanation and Examples measurement scale) to represent the problem.
E. Multiply or divide to solve one‐step word problems involving masses or volume by using drawings (such as a beaker with a measurement scale) to represent the problem. Excludes multiplicative comparison problems (problems involving notions of “times as much”.)
Represent and interpret data
Common Core State Standard Unwrapped Standard Explanation and Examples
CC.3.MD.3 Draw a scaled picture graph and a scaled bar graph to represent a data set with several categories. Solve one‐ and two‐step "how many more" and "how many less" problems using information presented in scaled bar graphs. For example, draw a bar graph in which each square in the bar graph might represent 5 pets.
A. Draw a scaled picture graph to represent a data set with several categories.
B. Draw a scaled pictograph to represent a data set with several categories.
C. Solve one and two‐
A. – C. Students should have opportunities reading and solving problems using scaled graphs before being asked to draw one. The following graphs all use five as the scale interval, but students should experience different intervals to further develop their understanding of scale graphs and number facts. Pictographs: Scaled pictographs include symbols that
represent multiple units. Below is an example of a pictograph with symbols that represent multiple units. Graphs should
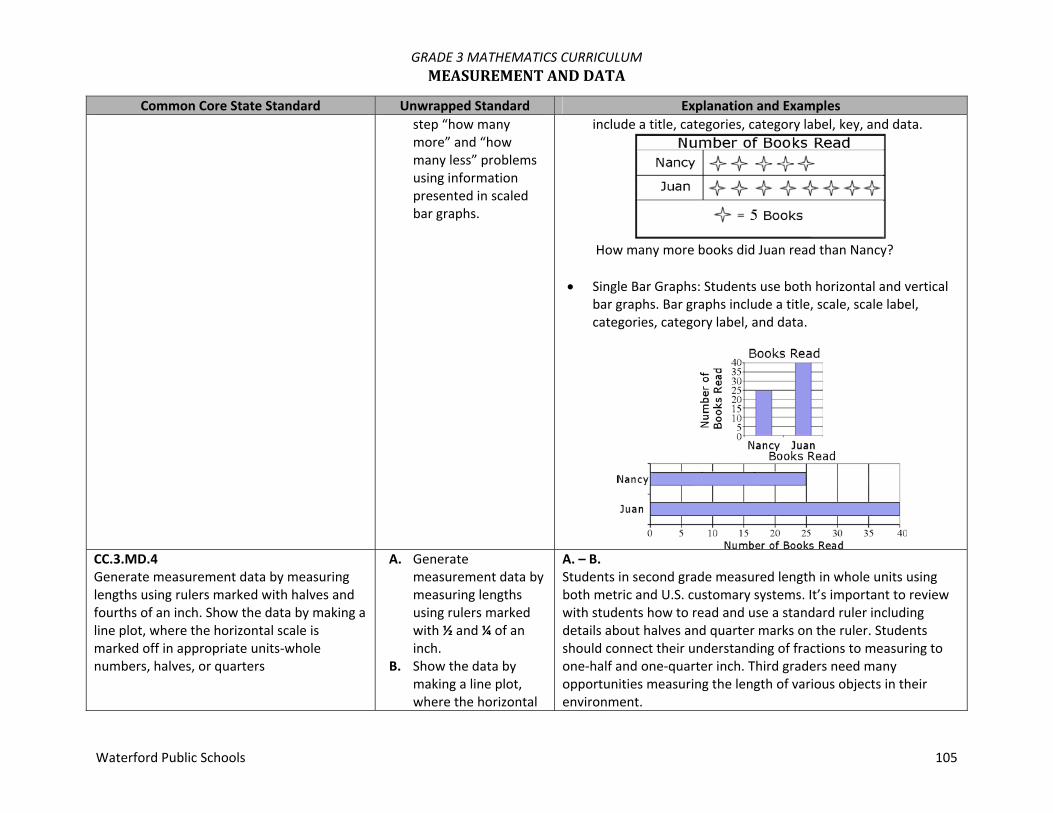
GRADE 3 MATHEMATICS CURRICULUM MEASUREMENTANDDATA
Waterford Public Schools 105
Common Core State Standard Unwrapped Standard Explanation and Examples step “how many more” and “how many less” problems using information presented in scaled bar graphs.
include a title, categories, category label, key, and data.
How many more books did Juan read than Nancy?
Single Bar Graphs: Students use both horizontal and vertical
bar graphs. Bar graphs include a title, scale, scale label, categories, category label, and data.
CC.3.MD.4 Generate measurement data by measuring lengths using rulers marked with halves and fourths of an inch. Show the data by making a line plot, where the horizontal scale is marked off in appropriate units‐whole numbers, halves, or quarters
A. Generate measurement data by measuring lengths using rulers marked with ½ and ¼ of an inch.
B. Show the data by making a line plot, where the horizontal
A. – B. Students in second grade measured length in whole units using both metric and U.S. customary systems. It’s important to review with students how to read and use a standard ruler including details about halves and quarter marks on the ruler. Students should connect their understanding of fractions to measuring to one‐half and one‐quarter inch. Third graders need many opportunities measuring the length of various objects in their environment.

GRADE 3 MATHEMATICS CURRICULUM MEASUREMENTANDDATA
Waterford Public Schools 106
Common Core State Standard Unwrapped Standard Explanation and Examples scale is marked off in appropriate units – whole numbers, halves, or quarters.
Some important ideas related to measuring with a ruler are: The starting point of where one places a ruler to begin
measuring Measuring is approximate. Items that students measure will
not always measure exactly ¼, ½ or one whole inch. Students will need to decide on an appropriate estimate length.
Making paper rulers and folding to find the half and quarter marks will help students develop a stronger understanding of measuring length
Students generate data by measuring and create a line plot to display their findings. An example of a line plot is shown below:

GRADE 3 MATHEMATICS CURRICULUM MEASUREMENTANDDATA
Waterford Public Schools 107
Geometric measurement: understand concepts of area and relate area to multiplication and to addition
Common Core State Standard Unwrapped Standard Explanation and Examples
CC.3.MD.5 Recognize area as an attribute of plane figures and understand concepts of area measurement. a. A square with side length 1 unit, called
"a unit square," is said to have "one square unit" of area, and can be used to measure area.
b. A plane figure which can be covered without gaps or overlaps by n unit squares is said to have an area of n square units.
A. Recognize area as an attribute of plane figures.
B. Understand concepts of area measurement.
A. – B. Students develop understanding of using square units to measure area by: Using different sized square units Filling in an area with the same sized square units and
counting the number of square units An interactive whiteboard would allow students to see that
square units can be used to cover a plane figure.
CC.3.MD.6 Measure areas by counting unit squares (square cm, square m, square in, square ft, and improvised units).
A. Measure areas by counting unit squares.
B. Use square cm, square m, square in, square ft, and improvised units to find area.
A. – B. Using different sized graph paper, students can explore the areas measured in square centimeters and square inches. An interactive whiteboard may also be used to display and count the unit squares (area) of a figure.
CC.3.MD.7a Find the area of a rectangle with whole‐number side lengths by tiling it, and show that the area is the same as would be found by multiplying the side lengths.
A. Find the area of a rectangle with whole‐number side lengths by tiling it.
B. Show that the area is the same as would be found by multiplying the side lengths.
A. – B. Students tile areas of rectangles, determine the area, record the length and width of the rectangle, investigate the patterns in the numbers, and discover that the area is the length times the width. Example: Joe and John made a poster that was 4’ by 3’. Mary and Amir made a poster that was 4’ by 2’. They placed their posters on the wall side‐by‐side so that that there was no space between them. How much area will the two posters cover?
CC.3.MD.7b Multiply side lengths to find areas of
A. Solve real world and mathematical

GRADE 3 MATHEMATICS CURRICULUM MEASUREMENTANDDATA
Waterford Public Schools 108
Common Core State Standard Unwrapped Standard Explanation and Examples rectangles with whole‐number side lengths in the context of solving real‐world and mathematical problems, and represent whole‐number products as rectangular areas in mathematical reasoning.
problems involving areas of rectangles.
B. Represent the product of the areas with appropriate labels.
Students use pictures, words, and numbers to explain their understanding of the distributive property in this context.
Example: Students can decompose a rectilinear figure into different rectangles. They find the area of the figure by adding the areas of each of the rectangles together.
CC.3.MD.7c Use tiling to show in a concrete case that the area of a rectangle with whole‐number side lengths a and b + c is the sum of a × b and a × c; use area models to represent the distributive property in mathematical reasoning.
A. Use tiling to model the area of a rectangle with whole‐numbered side lengths a and b + c is the sum of a x b and a x c. This shows the distributive property in mathematical reasoning.
CC.3.MD.7d Recognize area as additive. Find areas of rectilinear figures by decomposing them into non‐overlapping rectangles and adding the areas of the non‐overlapping parts, applying this technique to solve real‐world problems.
A. Recognize area as additive.
B. Find areas of rectangles by decomposing them into over‐lapping rectangles and adding the areas of non‐overlapping parts.
C. Solve real world problems using this technique.

GRADE 3 MATHEMATICS CURRICULUM MEASUREMENTANDDATA
Waterford Public Schools 109
Common Core State Standard Unwrapped Standard Explanation and Examples CC.3.MD.8 Solve real‐world and mathematical problems involving perimeters of polygons, including finding the perimeter given the side lengths, finding an unknown side length, and exhibiting rectangles with the same perimeter and different area or with the same area and different perimeters.
A. Solve real‐world problems and mathematical problems involving perimeters of polygons.
B. Find the perimeter given the side lengths.
C. Given a perimeter, find an unknown side length.
D. Show rectangles with the same perimeter and different area.
E. Show rectangles with the same area, but different perimeters.
A. – E. Students develop an understanding of the concept of perimeter by walking around the perimeter of a room, using rubber bands to represent the perimeter of a plane figure on a geoboard, or tracing around a shape on an interactive whiteboard. They find the perimeter of objects; use addition to find perimeters; and recognize the patterns that exist when finding the sum of the lengths and widths of rectangles. Students use geoboards, tiles, and graph paper to find all the possible rectangles that have a given perimeter (e.g., find the rectangles with a perimeter of 14 cm.) They record all the possibilities using dot or graph paper, compile the possibilities into an organized list or a table, and determine whether they have all the possible rectangles. Given a perimeter and a length or width, students use objects or pictures to find the missing length or width. They justify and communicate their solutions using words, diagrams, pictures, numbers, and an interactive whiteboard. Students use geoboards, tiles, graph paper, or technology to find all the possible rectangles with a given area (e.g. find the rectangles that have an area of 12 square units.) They record all the possibilities using dot or graph paper, compile the possibilities into an organized list or a table, and determine whether they have all the possible rectangles. Students then investigate the perimeter of the rectangles with an area of 12.

GRADE 3 MATHEMATICS CURRICULUM MEASUREMENTANDDATA
Waterford Public Schools 110
Common Core State Standard Unwrapped Standard Explanation and Examples
Area Length Width Perimeter 12 sq. in. 1 in. 12 in. 26 in. 12 sq. in. 2 in. 6 in. 16 in. 12 sq. in 3 in. 4 in. 14 in. 12 sq. in 4 in. 3 in. 14 in. 12 sq. in 6 in. 2 in. 16 in. 12 sq. in 12 in. 1 in. 26 in.
The patterns in the chart allow the students to identify the factors of 12, connect the results to the commutative property, and discuss the differences in perimeter within the same area. This chart can also be used to investigate rectangles with the same perimeter. It is important to include squares in the investigation.

GRADE 3 MATHEMATICS CURRICULUM GEOMETRY
Waterford Public Schools 111
Reason with shapes and attributes
Common Core State Standard Unwrapped Standard Explanation and Examples
CC.3.G.1 Understand that shapes in different categories (e.g., rhombuses, rectangles, and others) may share attributes (e.g., having four sides), and that the shared attributes can define a larger category (e.g., quadrilaterals). Recognize rhombuses, rectangles, and squares as examples of quadrilaterals, and draw examples of quadrilaterals that do not belong to any of these subcategories.
A. Understand that shapes in different categories may share attributes.
B. Recognize that shared attributes can define a larger category.
C. Recognize rhombuses, rectangles, and squares as examples of quadrilaterals.
D. Draw examples of quadrilaterals that do not belong to any of these subcategories.
A. – D. In second grade, students identify and draw triangles, quadrilaterals, pentagons, and hexagons. Third graders build on this experience and further investigate quadrilaterals (technology may be used during this exploration). Students recognize shapes that are and are not quadrilaterals by examining the properties of the geometric figures. They conceptualize that a quadrilateral must be a closed figure with four straight sides and begin to notice characteristics of the angles and the relationship between opposite sides. Students should be encouraged to provide details and use proper vocabulary when describing the properties of quadrilaterals. They sort geometric figures (see examples below) and identify squares, rectangles, and rhombuses as quadrilaterals.

GRADE 3 MATHEMATICS CURRICULUM GEOMETRY
Waterford Public Schools 112
Common Core State Standard Unwrapped Standard Explanation and Examples CC.3.G.2 Partition shapes into parts with equal areas. Express the area of each part as a unit fraction of the whole. For example, partition a shape into 4 parts with equal area, and describe the area of each part as 1/4 of the area of the shape.
A. Divide shapes into parts with equal areas.
B. Express the area of each part as a unit fraction of the whole.
A. – B. Given a shape, students partition it into equal parts, recognizing that these parts all have the same area. They identify the fractional name of each part and are able to partition a shape into parts with equal areas in several different ways.

GRADE 3 MATHEMATICS CURRICULUM PACINGGUIDE
Waterford Public Schools 113
Unit Title Pacing Standards
1. Understanding Multiplication and Division
Mathematical Applications 1‐7 3 weeks
3.OA.1 .Interpret products of whole numbers, e.g., interpret 5 × 7 as the total number of objects in 5 groups of 7 objects each.
3.OA.2 Interpret whole‐number quotients of whole numbers, e.g., interpret 56 ÷ 8 as the number of objects in each share when 56 objects are partitioned equally into 8 shares, or as a number of shares when 56 objects are partitioned into equal shares of 8 objects each.
3.MD.3 Draw a scaled picture graph and a scaled bar graph to represent a data set with several categories. Solve one‐ and two‐step “how many more” and “how many less” problems using information presented in scaled bar graphs.
2. Connecting and Using Multiplication and Division
Mathematical Applications 1‐7 5 weeks
3.OA.3 Use multiplication and division within 100 to solve word problems in situations involving equal groups, arrays, and measurement quantities, e.g., by using drawings and equations with a symbol for the unknown number to represent the problem.
3.OA.4 Determine the unknown whole number in a multiplication or division equation relating three whole numbers.
3.OA.5 Apply properties of operations as strategies to multiply and divide.
3.OA.6 Understand division as an unknown‐factor problem. 3.OA.7 Fluently multiply and divide within 100, using strategies
such as the relationship between multiplication and division (e.g., knowing that 8 × 5 = 40, one knows 40 ÷ 5 = 8) or properties of operations. By the end of Grade 3, know from memory all products of two one‐digit numbers.
3. Computing with Whole Numbers
Mathematical Applications 1‐8 4 weeks
3.OA.7 Fluently multiply and divide within 100, using strategies such as the relationship between multiplication and division (e.g., knowing that 8 × 5 = 40, one knows 40 ÷ 5 = 8) or properties of operations. By the end of Grade 3, know from memory all products of two one‐digit numbers.
3.OA.8 Solve two‐step word problems using the four operations.

GRADE 3 MATHEMATICS CURRICULUM PACINGGUIDE
Waterford Public Schools 114
Unit Title Pacing Standards Represent these problems using equations with a letter standing for the unknown quantity. Assess the reasonableness of answers using mental computation and estimation strategies including rounding.
3.OA.9 Identify arithmetic patterns (including patterns in the addition table or multiplication table), and explain them using properties of operations.
3.NBT.1 Use place value understanding to round whole numbers to the nearest 10 or 100.
3.NBT.2 Fluently add and subtract within 1000 using strategies and algorithms based on place value, properties of operations, and/or the relationship between addition and subtraction.
3.NBT.3 Multiply one‐digit whole numbers by multiples of 10 in the range 10–90 (e.g., 9 × 80, 5 × 60) using strategies based on place value and properties of operations.
4. Exploring Measurement and Data
Mathematical Applications 1,5,6,7,8 3 weeks
3.MD.1 Tell and write time to the nearest minute and measure time intervals in minutes. Solve word problems involving addition and subtraction of time intervals in minutes, e.g., by representing the problem on a number line diagram.
3.MD.2 Measure and estimate liquid volumes and masses of objects using standard units of grams (g), kilograms (kg), and liters (l). Add, subtract, multiply, or divide to solve one‐step word problems involving masses or volumes that are given in the same units, e.g., by using drawings (such as a beaker with a measurement scale) to represent the problem.
3.MD.3 Draw a scaled picture graph and a scaled bar graph to represent a data set with several categories. Solve one‐ and two‐step “how many more” and “how many less” problems using information presented in scaled bar graphs.
3.MD.4 Generate measurement data by measuring lengths using rulers marked with halves and fourths of an inch. Show the data by making a line plot, where the horizontal scale is marked off in appropriate units— whole numbers, halves,

GRADE 3 MATHEMATICS CURRICULUM PACINGGUIDE
Waterford Public Schools 115
Unit Title Pacing Standards or quarters.
5. Understanding Area and Perimeter
Mathematical Applications 1,5,6,7 4 weeks
3.MD.5 Recognize area as an attribute of plane figures and understand concepts of area measurement.
3.MD.6 Measure areas by counting unit squares (square cm, square m, square in, square ft, and improvised units).
3.MD.7 Relate area to the operations of multiplication and addition.
3.MD.8 Solve real world and mathematical problems involving perimeters of polygons, including finding the perimeter given the side lengths, finding an unknown side length, and exhibiting rectangles with the same perimeter and different areas or with the same area and different perimeters.
6. Reasoning about Two‐dimensional Shapes
Mathematical Applications 1,3,6,7 3 weeks
3.MD.8 Solve real world and mathematical problems involving perimeters of polygons, including finding the perimeter given the side lengths, finding an unknown side length, and exhibiting rectangles with the same perimeter and different areas or with the same area and different perimeters.
3.G.1 Understand that shapes in different categories (e.g., rhombuses, rectangles, and others) may share attributes (e.g., having four sides), and that the shared attributes can define a larger category (e.g., quadrilaterals). Recognize rhombuses, rectangles, and squares as examples of quadrilaterals, and draw examples of quadrilaterals that do not belong to any of these subcategories.
3.G.2 Partition shapes into parts with equal areas. Express the area of each part as a unit fraction of the whole.
7. Understanding Fractions
Mathematical Applications 1,2,5,6,7 3 weeks
3.NF.1 Understand a fraction 1/b as the quantity formed by 1 part when a whole is partitioned into b equal parts; understand a fraction a/b as the quantity formed by a parts of size 1/b.
3.NF.2 Understand a fraction as a number on the number line;

GRADE 3 MATHEMATICS CURRICULUM PACINGGUIDE
Waterford Public Schools 116
Unit Title Pacing Standards represent fractions on a number line diagram.
8. Reasoning about Fraction Comparisons and Equivalence
Mathematical Applications 1,2,3,5,6
3 weeks
3.NF.3 Explain equivalence of fractions in special cases, and compare fractions by reasoning about their size.
3.G.2 Partition shapes into parts with equal areas. Express the area of each part as a unit fraction of the whole.

GRADE 4 MATHEMATICS CURRICULUM OVERVIEW
Waterford Public Schools 117
OperationsandAlgebraicThinking(OA) Use the four operations with whole numbers to solve
problems. Gain familiarity with factors and multiples. Generate and analyze patterns.
NumberandOperationsinBaseTen(NBT)
Generalize place value understanding for multi‐digit whole numbers.
Use place value understanding and properties of operations to perform multi‐digit arithmetic.
NumberandOperations—Fractions(NF)
Extend understanding of fraction equivalence and ordering. Build fractions from unit fractions by applying and extending
previous understandings of operations on whole numbers. Understand decimal notation for fractions, and compare
decimal fractions.
MeasurementandData(MD) Solve problems involving measurement and conversion of
measurements from a larger unit to a smaller unit. Represent and interpret data. Geometric measurement: understand concepts of angle and
measure angles. Geometry(G)
Draw and identify lines and angles, and classify shapes by properties of their lines and angles
MathematicalPractices(MP)1. Make sense of problems and persevere in solving them. 2. Reason abstractly and quantitatively. 3. Construct viable arguments and critique the reasoning of
others. 4. Model with mathematics. 5. Use appropriate tools strategically. 6. Attend to precision. 7. Look for and make use of structure. 8. Look for and express regularity in repeated reasoning.
Assessments:
Teacher‐Created C.F.A.’s and Benchmarks Resources:
My Math by McGraw‐Hill

GRADE 4 MATHEMATICS CURRICULUM OPERATIONSANDALGEBRAICTHINKING
Waterford Public Schools 118
Use the four operations with whole numbers to solve problems
Common Core State Standard Unwrapped Standard Explanation and Examples
CC.4.OA.1 Interpret a multiplication equation as a comparison, e.g., interpret 35 = 5 x 7 as a statement that 35 is 5 times as many as 7 and 7 times as many as 5. Represent verbal statements of multiplicative comparisons as multiplication equations.
A. Interpret a multiplication equation as a comparison.
B. Represent a verbal or written statement of a multiplicative comparison as a multiplication equation.
A. A multiplicative comparison is a situation in which one quantity is multiplied by a specified number to get another quantity (e.g., “a is n times as much as b”).
B. Students should be able to identify and verbalize which quantity is being multiplied and which number tells how many times.
CC.4.OA.2 Multiply or divide to solve word problems involving multiplicative comparison, e.g., by using drawings and equations with a symbol for the unknown number to represent the problem, distinguishing multiplicative comparison from additive comparison.
A. Multiply or divide to solve word problems.
B. Be able to show this using pictures, symbols, and equations.
A. Students need many opportunities to solve contextual problems. “A blue hat costs $6. A red hat costs 3 times as much as the
blue hat. How much does the red hat cost?”
B. In solving this problem, the student should identify $6 as the quantity that is being multiplied by 3. The student should write the problem using a symbol to represent the unknown. ($6 x 3 = )
GRADE 4 MATHEMATICS CURRICULUM OPERATIONSANDALGEBRAICTHINKING
Waterford Public Schools 119
Common Core State Standard Unwrapped Standard Explanation and Examples
C. Be able to distinguish a multiplicative comparison from an additive one.
A red hat costs $18 and a blue hat costs $6. How many times as much does the red hat cost as the blue hat?
In solving this problem, the student should identify $18 as the quantity being divided into shares of $6.
The student should write the problem using a symbol to represent the unknown. ($18 ÷ $6 = )
C. When distinguishing multiplicative comparison from additive comparison, students should note that : additive comparisons focus on the difference between two
quantities (e.g., Deb has 3 apples and Karen has 5 apples. How many more apples does Karen have?). A simple way to remember this is, “How many more?”
multiplicative comparisons focus on comparing two quantities by showing that one quantity is a specified number of times larger or smaller than the other (e.g., Deb ran 3 miles. Karen ran 5 times as many miles as Deb. How many miles did Karen run?). A simple way to remember this is “How many times as much?” or “How many times as many?”
CC.4.OA.3 Solve multistep word problems posed with whole numbers and having whole‐number answers using the four operations, including problems in which remainders must be interpreted. Represent these problems using equations with a letter standing for the unknown quantity. Assess the reasonableness of answers using mental computation and estimation strategies including rounding.
A. Solve multistep word problems using the 4 operations. Questions and answers are whole numbers and may include remainders.
A. Students need many opportunities solving multistep story problems using all four operations. Examples: Chris bought clothes for school. She bought 3 shirts for $12
each and a skirt for $15. How much money did Chris spend on her new school clothes?

GRADE 4 MATHEMATICS CURRICULUM OPERATIONSANDALGEBRAICTHINKING
Waterford Public Schools 120
Common Core State Standard Unwrapped Standard Explanation and Examples B. Remainders need to
be interpreted.
C. Be able to represent these problems as equations that contain a letter standing for an unknown quantity.
D. Determine the
reasonableness of answers using mental computation and estimation to include rounding.
B. Kim is making candy bags. There will be 5 pieces of candy in
each bag. She had 53 pieces of candy. She ate 14 pieces of candy. How many candy bags can Kim make now? (7 bags with 4 leftover)
Kim has 28 cookies. She wants to share them equally
between herself and 3 friends. How many cookies will each person get? (7 cookies each) 28 ÷ 4 = a
There are 29 students in one class and 28 students in another class going on a field trip. Each car can hold 5 students. How many cars are needed to get all the students to the field trip? (12 cars, one possible explanation is 11 cars holding 5 students and the 12th holding the remaining 2 students) 29 + 28 = 11 x 5 + 2
C. Chris bought clothes for school. She bought 3 shirts for $12
each and a skirt for $15. How much money did Chris spend on her new school clothes? For the above problem: 3 x $12 + $15 = a
D. Estimation skills include identifying when estimation is appropriate, determining the level of accuracy needed, selecting the appropriate method of estimation, and verifying solutions or determining the reasonableness of situations using various estimation strategies. Estimation strategies include, but are not limited to: front‐end estimation with adjusting (using the highest place
value and estimating from the front end, making adjustments

GRADE 4 MATHEMATICS CURRICULUM OPERATIONSANDALGEBRAICTHINKING
Waterford Public Schools 121
Common Core State Standard Unwrapped Standard Explanation and Examples to the estimate by taking into account the remaining amounts),
clustering around an average (when the values are close together an average value is selected and multiplied by the number of values to determine an estimate),
rounding and adjusting (students round down or round up and then adjust their estimate depending on how much the rounding affected the original values),
using friendly or compatible numbers such as factors (students seek to fit numbers together ‐ e.g., rounding to factors and grouping numbers together that have round sums like 100 or 1000)
Gain familiarity with factors and multiples
Common Core State Standard Unwrapped Standard Explanation and Examples
CC.4.OA.4 Find all factor pairs for a whole number in the range 1‐100. Recognize that a whole number is a multiple of each of its factors. Determine whether a given whole number in the range 1‐100 is a multiple of a given one‐digit number. Determine whether a given whole number in the range 1‐100 is prime or composite.
A. Be able to find all factor pairs from 1 to 100.
B. Recognize that a whole number is a multiple of each of its 2 factors.
A. Students should understand the process of finding factor pairs so they can do this for any number 1 ‐100 Example: Factor pairs for 96: 1 and 96, 2 and 48, 3 and 32, 4 and 24, 6 and 16, 8 and 12. B. Multiples can be thought of as the result of skip counting by each of the factors. When skip counting, students should be able to identify the number of factors counted e.g., 5, 10, 15, 20 (there are 4 fives in 20).

GRADE 4 MATHEMATICS CURRICULUM OPERATIONSANDALGEBRAICTHINKING
Waterford Public Schools 122
Common Core State Standard Unwrapped Standard Explanation and Examples
C. Be able to decide if a given whole number between 1 and 100 is a multiple of a given one‐digit number.
D. Be able to decide if a given number between 1 and 100 is prime or composite.
Example: Factors of 24: 1, 2, 3, 4, 6, 8,12, 24 Multiples: 1,2,3,4,5…24 2,4,6,8,10,12,14,16,18,20,22,24 3,6,9,12,15,18,21,24 4,8,12,16,20,24 8,16,24 12,24 24 C. To determine if a number between1‐100 is a multiple of a given one‐digit number, some helpful hints include the following: all even numbers are multiples of 2 all even numbers that can be halved twice (with a whole
number result) are multiples of 4 all numbers ending in 0 or 5 are multiples of 5 D. Prime vs. Composite: A prime number is a number greater than 1 that has only 2
factors, 1 and itself. Composite numbers have more than 2 factors. Students investigate whether numbers are prime or composite by building rectangles (arrays) with the given area and finding
which numbers have more than two rectangles (e.g. 7 can be made into only 2 rectangles, 1 x 7 and 7 x 1, therefore it is a prime number)
finding factors of the number

GRADE 4 MATHEMATICS CURRICULUM OPERATIONSANDALGEBRAICTHINKING
Waterford Public Schools 123
Generate and Analyze Patterns
Common Core State Standard Unwrapped Standard Explanation and Examples
CC.4.OA.5 Generate a number or shape pattern that follows a given rule. Identify apparent features of the pattern that were not explicit in the rule itself. For example: Given the rule "Add 3" and the starting number 1, generate terms in the resulting sequence and observe that the terms appear to alternate between odd and even numbers. Explain informally why the numbers will continue to alternate in this way.
A. Create a number or shape pattern to follow a given rule.
A. Patterns involving numbers or symbols either repeat or grow. Students need multiple opportunities creating and extending number and shape patterns. Numerical patterns allow students to reinforce facts and develop fluency with operations. Patterns and rules are related. A pattern is a sequence that repeats the same process over and over. A rule dictates what that process will look like. Students investigate different patterns to find rules, identify features in the patterns, and justify the reason for those features. Example: Pattern Rule Feature(s) 3, 8, 13, 18, 23, 28, …
Start with 3, add 5
The numbers alternately end with a 3 or 8
5, 10, 15, 20 …
Start with 5, add 5
The numbers are multiples of 5 and end with either 0 or 5. The numbers that end with 5 are products of 5 and an odd number. The numbers that end in 0 are products of 5 and an even number.
After students have identified rules and features from patterns, they need to generate a numerical or shape pattern from a given rule.

GRADE 4 MATHEMATICS CURRICULUM OPERATIONSANDALGEBRAICTHINKING
Waterford Public Schools 124
Common Core State Standard Unwrapped Standard Explanation and Examples
B. Be able to identify features of a pattern that were not part of the rule.
Example: Rule: Starting at 1, create a pattern that starts at 1 and multiplies each number by 3. Stop when you have 6 numbers.
B. Students write 1, 3, 9, 27, 81, 243. Students notice that all the numbers are odd and that the sums of the digits of the 2 digit numbers are each 9. Some students might investigate this beyond 6 numbers. Another feature to investigate is the patterns in the differences of the numbers (3 ‐ 1 = 2, 9 ‐ 3 = 6, 27 ‐ 9 = 18, etc.)

GRADE 4 MATHEMATICS CURRICULUM NUMBERANDOPERATIONSINBASETEN
Waterford Public Schools 125
Generalize place value understanding for multi‐digit whole numbers
Common Core State Standard Unwrapped Standard Explanation and Examples
CC.4.NBT.1 Recognize that in a multi‐digit whole number, a digit in one place represents ten times what it represents in the place to its right. For example, recognize that 700 ÷ 70 = 10 by applying concepts of place value and division. (Grade 4 expectations in this domain are limited to whole numbers less than or equal to 1,000,000.)
A. Understand that a digit in one place represents ten times what it represents in the place to its right
A. Students should be familiar with and use place value as they work with numbers. Some activities that will help students develop understanding of this standard are: Investigate the product of 10 and any number, then justify
why the number now has a 0 at the end. (7 x 10 = 70 because 70 represents 7 tens and no ones, 10 x 35 = 350 because the 3 in 350 represents 3 hundreds, which is 10 times as much as 3 tens, and the 5 represents 5 tens, which is 10 times as much as 5 ones.) While students can easily see the pattern of adding a 0 at the end of a number when multiplying by 10, they need to be able to justify why this works.
Investigate the pattern, 6, 60, 600, 6,000, 60,000, 600,000 by dividing each number by the previous number.
CC.4.NBT.2 Read and write multi‐digit whole numbers using base‐ten numerals, number names, and expanded form. Compare two multi‐digit numbers based on meanings of the digits in each place, using >, =, and < symbols to record the results of comparisons. (Grade 4 expectations in this domain are limited to whole numbers less than or equal to 1,000,000.)
A. Be able to read and write multi‐digit numbers using base‐ten numerals, names and expanded form.
B. Compare 2 multi‐digit numbers based on the values of the digits in each place, using <, =, > to record the comparisons.
A. The expanded form of 275 is 200 + 70 + 5. B. Students use place value to compare numbers. For example, in comparing 34,570 and 34,192, a student might say, both numbers have the same value of 10,000s and the same value of 1000s however, the value in the 100s place is different so that is where I would compare the two numbers.

GRADE 4 MATHEMATICS CURRICULUM NUMBERANDOPERATIONSINBASETEN
Waterford Public Schools 126
Common Core State Standard Unwrapped Standard Explanation and Examples CC.4.NBT.3 Use place value understanding to round multi‐digit whole numbers to any place. (Grade 4 expectations in this domain are limited to whole numbers less than or equal to 1,000,000.)
A. Be able to round any multi‐digit whole number up to 1,000,000 to any place value spot.
A. When students are asked to round large numbers, they first need to identify which digit is in the appropriate place. Example: Round 76,398 to the nearest 1000. Step 1: Since I need to round to the nearest 1000, then the
answer is either 76,000 or 77,000. Step 2: I know that the halfway point between these two
numbers is 76,500. Step 3: I see that 76,398 is between 76,000 and 76,500. Step 4: Therefore, the rounded number would be 76,000.
Use place value understanding and properties of operations to perform multi‐digit arithmetic
Common Core State Standard Unwrapped Standard Explanation and Examples
CC.4.NBT.4 Fluently add and subtract multi‐digit whole numbers using the standard algorithm. (Grade 4 expectations in this domain are limited to whole numbers less than or equal to 1,000,000. A range of algorithms may be used.)
A. Fluently add and subtract multi‐digit whole numbers using the standard algorithm.
A. Students build on their understanding of addition and subtraction, their use of place value and their flexibility with multiple strategies to make sense of the standard algorithm. They continue to use place value in describing and justifying the processes they use to add and subtract. When students begin using the standard algorithm their explanation may be quite lengthy. After much practice with using place value to justify their steps, they will develop fluency with the algorithm. Students should be able to explain why the algorithm works.

GRADE 4 MATHEMATICS CURRICULUM NUMBERANDOPERATIONSINBASETEN
Waterford Public Schools 127
Common Core State Standard Unwrapped Standard Explanation and Examples
3892 + 1567
Student explanation for this problem: 1. Two ones plus seven ones is nine ones. 2. Nine tens plus six tens is 15 tens. 3. I am going to write down five tens and think of the10 tens as
one more hundred.(notates with a 1 above the hundreds column)
4. Eight hundreds plus five hundreds plus the extra hundred from adding the tens is 14 hundreds.
5. I am going to write the four hundreds and think of the 10 hundreds as one more 1000. (notates with a 1 above the thousands column)
6. Three thousands plus one thousand plus the extra thousand from the hundreds is five thousand.
3546 ‐ 928 Student explanation for this problem: 1. There are not enough ones to take 8 ones from 6 ones so I
have to use one ten as 10 ones. Now I have 3 tens and 16 ones. (Marks through the 4 and notates with a 3 above the 4 and writes a 1 above the ones column to be represented as 16 ones.)
2. Sixteen ones minus 8 ones is 8 ones. (Writes an 8 in the ones column of answer.)
3. Three tens minus 2 tens is one ten. (Writes a 1 in the tens column of answer.)
4. There are not enough hundreds to take 9 hundreds from 5 hundreds so I have to use one thousand as 10 hundreds.

GRADE 4 MATHEMATICS CURRICULUM NUMBERANDOPERATIONSINBASETEN
Waterford Public Schools 128
Common Core State Standard Unwrapped Standard Explanation and Examples (Marks through the 3 and notates with a 2 above it. (Writes down a 1 above the hundreds column.) Now I have 2 thousand and 15 hundreds.
5. Fifteen hundreds minus 9 hundreds is 6 hundreds. (Writes a 6 in the hundreds column of the answer).
6. I have 2 thousands left since I did not have to take away any thousands. (Writes 2 in the thousands place of answer.)
Note: Students should know that it is mathematically possible to subtract a larger number from a smaller number but that their work with whole numbers does not allow this as the difference would result in a negative number.
CC.4.NBT.5 Multiply a whole number of up to four digits by a one‐digit whole number, and multiply two two‐digit numbers, using strategies based on place value and the properties of operations. Illustrate and explain the calculation by using equations, rectangular arrays, and/or area models. (Grade 4 expectations in this domain are limited to whole numbers less than or equal to 1,000,000. A range of algorithms may be used.)
A. Multiply whole numbers up to four by one and two by two. These should be done using place value strategies as well as the properties of operations.
B. Be able to illustrate and explain the calculation using equations, arrays, and area models.
A. Students who develop flexibility in breaking numbers apart have a better understanding of the importance of place value and the distributive property in multi‐digit multiplication. Students use base ten blocks, area models, partitioning, compensation strategies, etc. when multiplying whole numbers and use words and diagrams to explain their thinking. They use the terms factor and product when communicating their reasoning. Multiple strategies enable students to develop fluency with multiplication and transfer that understanding to division. B. Use of place value and the distributive property are applied in the scaffolded examples below. To illustrate 154 x 6 students use base 10 blocks or use
drawings to show 154 six times. Seeing 154 six times will lead them to understand the distributive property, 154 X 6 = (100 + 50 + 4) x 6 = (100 x 6) + (50 X 6) + (4 X 6) = 600 + 300 + 24 = 924.

GRADE 4 MATHEMATICS CURRICULUM NUMBERANDOPERATIONSINBASETEN
Waterford Public Schools 129
Common Core State Standard Unwrapped Standard Explanation and Examples The area model shows the partial products.
14 x 16 = 224
Students explain this strategy and the one below with base
10 blocks, drawings, or numbers. 25
x24 400 (20 x 20) 100 (20 x 5) 80 (4 x 20) 20 (4 x 5) 600 25 x24 500 (20 x 25) 100 (4 x 25) 600
Using the area model, students first verbalize their understanding:
10 x 10 is 100 4 x 10 is 40 10 x 6 is 60, and 4 x 6 is 24.
They use different strategies to record this type of thinking.

GRADE 4 MATHEMATICS CURRICULUM NUMBERANDOPERATIONSINBASETEN
Waterford Public Schools 130
Common Core State Standard Unwrapped Standard Explanation and Examples Matrix model
This model should be introduced after students have facility with the strategies shown above.
20 5
20 400 100 500 4 80 20 100 480 + 120 600
CC.4.NBT.6 Find whole‐number quotients and remainders with up to four‐digit dividends and one‐digit divisors, using strategies based on place value, the properties of operations, and/or the relationship between multiplication and division. Illustrate and explain the calculation by using equations, rectangular arrays, and/or area models. (Grade 4 expectations in this domain are limited to whole numbers less than or equal to 1,000,000. A range of algorithms may be used.)
A. Be able to find whole‐number quotients and remainders with up to four‐digit dividends and one‐digit divisors, using strategies based on place value, the properties of operations, and/or the relationship between multiplication and division up to 1,000,000.
B. Illustrate and explain the above calculation using equations, arrays, and/or area models.
A. Students need opportunities to develop their understandings by using problems in and out of context.
B. Examples: A 4th grade teacher bought 4 new pencil boxes. She has 260 pencils. She wants to put the pencils in the boxes so that each box has the same number of pencils. How many pencils will there be in each box? Using Base 10 Blocks: Students build 260 with base 10 blocks
and distribute them into 4 equal groups. Some students may need to trade the 2 hundreds for tens but others may easily recognize that 200 divided by 4 is 50.
Using Place Value: 260 ÷ 4 = (200 ÷ 4) + (60 ÷ 4) Using Multiplication: 4 x 50 = 200, 4 x 10 = 40, 4 x 5 = 20; 50
+ 10 + 5 = 65; so 260 ÷ 4 = 65 Using an Open Array or Area Model

GRADE 4 MATHEMATICS CURRICULUM NUMBERANDOPERATIONSINBASETEN
Waterford Public Schools 131
Common Core State Standard Unwrapped Standard Explanation and Examples After developing an understanding of using arrays to divide, students begin to use a more abstract model for division. This model connects to a recording process that will be formalized in the 5th grade.
Example: 150 ÷ 6
Students make a rectangle and write 6 on one of its sides. They express their understanding that they need to think of the rectangle as representing a total of 150. 1. Students think, 6 times what number is a number close to
150? They recognize that 6 x 10 is 60 so they record 10 as a factor and partition the rectangle into 2 rectangles and label the area aligned to the factor of 10 with 60. They express that they have only used 60 of the 150 so they have 90 left.
2. Recognizing that there is another 60 in what is left they repeat the process above. They express that they have used 120 of the 150 so they have 30 left.
3. Knowing that 6 x 5 is 30. They write 30 in the bottom area of the rectangle and record 5 as a factor.

GRADE 4 MATHEMATICS CURRICULUM NUMBERANDOPERATIONSINBASETEN
Waterford Public Schools 132
Common Core State Standard Unwrapped Standard Explanation and Examples 4. Students express their calculations in various ways:
150 150 ÷ 6 = 10 + 10 + 5 = 25 ‐ 60 (6 x 10)
90 ‐ 60 (6 x 10) 30 ‐ 30 (6 x 5)
0
150 ÷ 6 = (60 ÷ 6) + (60 ÷ 6) + (30 ÷ 6) = 10 + 10 + 5 = 25 Example: 1917 ÷ 9
A student’s description of his or her thinking may be: I need to find out how many 9s are in 1917. I know that 200 x 9 is 1800. So if I use 1800 of the 1917, I have 117 left. I know that 9 x 10 is 90. So if I have 10 more 9s, I will have 27 left. I can make 3 more 9s. I have 200 nines, 10 nines and 3 nines. So I made 213 nines. 1917 ÷ 9 = 213.

GRADE 4 MATHEMATICS CURRICULUM NUMBERANDOPERATIONS–FRACTIONS
Waterford Public Schools 133
Extend understanding of fraction equivalence and ordering (Grade 4 expectations in this domain are limited to fractions w/ denominators 2,3,4,5,6,8,10,12,100)
Common Core State Standard Unwrapped Standard Explanation and Examples
CC.4.NF.1 Explain why a fraction a/b is equivalent to a fraction (n × a)/(n × b) by using visual fraction models, with attention to how the number and size of the parts differ even though the two fractions themselves are the same size. Use this principle to recognize and generate equivalent fractions.
A. Be able to explain why a fraction is equivalent if numerator and denominator are multiplied by the same number by using visual models. These models should show how the number and size of the parts differ.
B. Use this principle to identify and create equivalent fractions.
A. Students can use visual models or applets to generate equivalent fractions. All the models show 1/2. The second model shows 2/4 but also shows that 1/2 and 2/4 are equivalent fractions because their areas are equivalent. When a horizontal line is drawn through the center of the model, the number of equal parts doubles and size of the parts is halved. 1/2 x 2/2 = 2/4 1 2 = 2 x 1 3 = 3 x 1 4 = 4 x 1 2 4 2 x 2 6 3 x 2 8 4 x 2 B. Students will begin to notice connections between the models and fractions in the way both the parts and wholes are counted and begin to generate a rule for writing equivalent fractions.

GRADE 4 MATHEMATICS CURRICULUM NUMBERANDOPERATIONS–FRACTIONS
Waterford Public Schools 134
Common Core State Standard Unwrapped Standard Explanation and Examples CC.4.NF.2 Compare two fractions with different numerators and different denominators, e.g., by creating common denominators or numerators, or by comparing to a benchmark fraction such as 1/2. Recognize that comparisons are valid only when the two fractions refer to the same whole. Record the results of comparisons with symbols >, =, or <, and justify the conclusions, e.g., by using a visual fraction model.
A. Compare two fractions with different numerators and different denominators by creating common denominators.
B. Compare two
fractions with different numerators and different denominators by comparing to a benchmark
Benchmark fractions include common fractions between 0 and 1 such as halves, thirds, fourths, fifths, sixths, eighths, tenths, twelfths, and hundredths. Fractions can be compared using benchmarks, common denominators, or common numerators. Symbols used to describe comparisons include <, >, =.
A. Possible student thinking by creating common denominators:
65 >
12 because
63=
12 and
65>
63
Fractions with common denominators may be compared using the numerators as a guide.
62 <
63 <
65
Fractions with common numerators may be compared and ordered using the denominators as a guide.
103 <
83 <
43
B.
Fractions may be compared using 12 as a benchmark.

GRADE 4 MATHEMATICS CURRICULUM NUMBERANDOPERATIONS–FRACTIONS
Waterford Public Schools 135
Common Core State Standard Unwrapped Standard Explanation and Examples C. Understand that
these comparisons are only valid if the two fractions refer to the same whole
D. Record results of comparisons using <,=,>
E. Justify using a visual model.
Possible student thinking by using benchmarks: 18 is smaller than
12because when 1 whole is cut into 8 pieces,
the pieces are much smaller than when 1 whole is cut into 2 pieces.
C. 1/2 of 12 is not equal to ½ of 20 because the wholes are not the same size. D. ¼ < ½ E.

GRADE 4 MATHEMATICS CURRICULUM NUMBERANDOPERATIONS–FRACTIONS
Waterford Public Schools 136
Build fractions from unit fractions by applying and extending previous understandings of operations on whole numbers (Grade 4 expectations in this domain are limited to fractions w/ denominators 2,3,4,5,6,8,10,12,100)
Common Core State Standard Unwrapped Standard Explanation and Examples
CC.4.NF.3 Understand a fraction a/b with a > 1 as a sum of fractions 1/b. (Grade 4 expectations in this domain are limited to fractions with denominators 2, 3, 4, 5, 6, 8, 10, 12, 100.) CC.4.NF.3a Understand addition and subtraction of fractions as joining and separating parts referring to the same whole.
A. Understand that adding and subtracting of fractions is joining and separating parts that refer back to the same whole.
A. A fraction with a numerator of one is called a unit fraction. When students investigate fractions other than unit fractions, such as 2/3, they should be able to decompose the non‐unit fraction into a combination of several unit fractions.
3/5 = 1/5 +1/5 + 1/5
CC.4.NF.3b Decompose a fraction into a sum of fractions with the same denominator in more than one way, recording each decomposition by an equation. Justify decompositions, e.g., by using a visual fraction model. Examples: 3/8 = 1/8 + 1/8 + 1/8 ; 3/8 = 1/8 + 2/8 ; 2 1/8 = 1 + 1 + 1/8 = 8/8 + 8/8 + 1/8.
A. Be able to breakdown a fraction into sums of fractions with the same denominator in more than one way.
A.: 3/5 = 1/5 +1/5 +1/5
and 3/5 = 1/5 + 2/5
CC.4.NF.3c Add and subtract mixed numbers with like denominators, e.g., by replacing each mixed number with an equivalent fraction, and/or by using properties of operations and the relationship between addition and subtraction.
A. Add and subtract mixed numbers with like denominators, e.g., by replacing each mixed number with an equivalent fraction, and/or by using properties of operations and the relationship between addition and subtraction.
A. Being able to visualize this decomposition into unit fractions helps students when adding or subtracting fractions. Students need multiple opportunities to work with mixed numbers and be able to decompose them in more than one way. Students may use visual models to help develop this understanding. Examples: 1 ¼ ‐ ¾ = 4/4 + ¼ = 5/4 5/4 – ¾ = 2/4 or ½

GRADE 4 MATHEMATICS CURRICULUM NUMBERANDOPERATIONS–FRACTIONS
Waterford Public Schools 137
Common Core State Standard Unwrapped Standard Explanation and Examples CC.4.NF.3d Solve word problems involving addition and subtraction of fractions referring to the same whole and having like denominators, e.g., by using visual fraction models and equations to represent the problem.
A. Solve word problems involving addition and subtraction of fractions referring to the same whole and having like denominators.
B. Be able to use visual
models and equations to represent the problem.
A. Example of word problem: Mary and Lacey decide to share a pizza. Mary ate 3/6 and
Lacey ate 2/6 of the pizza. How much of the pizza did the girls eat together?
Solution: The amount of pizza Mary ate can be thought of a 3/6 or 1/6 and 1/6 and 1/6. The amount of pizza Lacey ate can be thought of a 1/6 and 1/6. The total amount of pizza they ate is 1/6 + 1/6 + 1/6 + 1/6 + 1/6 or 5/6 of the whole pizza.
A separate algorithm for mixed numbers in addition and subtraction is not necessary. Students will tend to add or subtract the whole numbers first and then work with the fractions using the same strategies they have applied to problems that contained only fractions.
B. Example: Trevor has 4 1/8 pizzas left over from his soccer party. After
giving some pizza to his friend, he has 2 4/8 of a pizza left. How much pizza did Trevor give to his friend?
Solution: Trevor had 4 1/8 pizzas to start. This is 33/8 of a pizza. The x’s show the pizza he has left which is 2 4/8 pizzas or 20/8 pizzas. The shaded rectangles without the x’s are the pizza he gave to his friend which is 13/8 or 1 5/8 pizzas.
x x x x
x x x x
x x xxx x x x
x x x x

GRADE 4 MATHEMATICS CURRICULUM NUMBERANDOPERATIONS–FRACTIONS
Waterford Public Schools 138
Common Core State Standard Unwrapped Standard Explanation and Examples CC.4.NF.4 Apply and extend previous understandings of multiplication to multiply a fraction by a whole number. (Grade 4 expectations in this domain are limited to fractions with denominators 2, 3, 4, 5, 6, 8, 10, 12, 100.) CC.4.NF.4a Understand a fraction a/b as a multiple of 1/b. For example, use a visual fraction model to represent 5/4 as the product 5 × (1/4), recording the conclusion by the equation 5/4 = 5 × (1/4).
A. Understand that a fraction is a multiple of 1 over the same denominator.
A. 5/4 = 5 x (1/4)
CC.4.NF.4b Understand a multiple of a/b as a multiple of 1/b, and use this understanding to multiply a fraction by a whole number. For example, use a visual fraction model to express 3 × (2/5) as 6 × (1/5), recognizing this product as 6/5. (In general, n × (a/b) = (n × a)/b.)
A. Use knowledge from CC.4.NF.4a to multiply a fraction by a whole number.
A. Examples:
3 x (2/5) = 6 x (1/5) = 6/5
52
52
52
51
51
51
51
51
51

GRADE 4 MATHEMATICS CURRICULUM NUMBERANDOPERATIONS–FRACTIONS
Waterford Public Schools 139
Common Core State Standard Unwrapped Standard Explanation and Examples CC.4.NF.4c Solve word problems involving multiplication of a fraction by a whole number, e.g., by using visual fraction models and equations to represent the problem. For example: If each person at a party will eat 3/8 of a pound of roast beef, and there will be 5 people at the party, how many pounds of roast beef will be needed? Between what two whole numbers does your answer lie?
A. Solve word problems involving multiplication of a fraction by a whole number.
A. If each person at a party eats 3/8 of a pound of roast beef, and there are 5 people at the party, how many pounds of roast beef are needed? Between what two whole numbers does your answer lie? A student may build a fraction model to represent this problem:
38 3
8 38
38
38
38
38
38
38
38
158 1 7 8

GRADE 4 MATHEMATICS CURRICULUM NUMBERANDOPERATIONS–FRACTIONS
Waterford Public Schools 140
Understand decimal notation for fractions, and compare decimal fractions Grade 4 expectations in this domain are limited to fractions w/ denominators 2,3,4,5,6,8,10,12,100
Common Core State Standard Unwrapped Standard Explanation and Examples
CC.4.NF.5 Express a fraction with denominator 10 as an equivalent fraction with denominator 100, and use this technique to add two fractions with respective denominators 10 and 100. For example, express 3/10 as 30/100 and add 3/10 + 4/100 = 34/100. (Students who can generate equivalent fractions can develop strategies for adding fractions with unlike denominators in general. But addition and subtraction with unlike denominators in general is not a requirement at this grade.)
A. Express a fraction with a denominator of 10 as an equivalent fraction with a denominator of 100.
B. Add fractions with
respective denominators of 10 and 100.
A. Students can use base ten blocks, graph paper, and other place value models to explore the relationship between fractions with denominators of 10 and denominators of 100.
3/10 = 30/100 Students may represent 3/10 with 3 longs and may also write the fraction as 30/100 with the whole in this case being the flat (the flat represents one hundred units with each unit equal to one hundredth). B.
3/10 + 4/100 = 30/100 + 4/100 = 34/100 CC.4.NF.6 Use decimal notation for fractions with denominators 10 or 100. For example, rewrite 0.62 as 62/100; describe a length as 0.62 meters; locate 0.62 on a number line diagram.
A. Use decimal notation for fractions with denominators 10 or 100.
A. Students make connections between fractions with denominators of 10 and 100 and the place value chart. By reading fraction names, students say 32/100 as thirty‐two hundredths and rewrite this as 0.32 or represent it on a place value model as shown below. Hundreds Tens Ones Tenths Hundredths
3 2 Students use the representations explored in 4.NF.5 to understand 32/100 can be expanded to 3/10 and 2/100.

GRADE 4 MATHEMATICS CURRICULUM NUMBERANDOPERATIONS–FRACTIONS
Waterford Public Schools 141
Students represent values such as 0.32 or 32/100 on a number line. 32/100 is more than 30/100 (or 3/10) and less than 40/100 (or 4/10). It is closer to 30/100 so it would be placed on the number line near that value.
CC.4.NF.7 Compare two decimals to hundredths by reasoning about their size. Recognize that comparisons are valid only when two decimals refer to the same whole. Record the results of comparisons with the symbols >, =, or <, and justify the conclusions, e.g., by using a visual model.
A. Compare two decimals up to 100ths by reasoning about their size.
B. Realize that comparisons can’t be valid if the decimals represent different wholes.
C. Record results of
comparisons using visual models or <,=,>
A. Students build area and other models to compare decimals. B. Through these experiences and their work with fraction models, they build the understanding that comparisons between decimals or fractions are only valid when the whole is the same for both cases. Each of the models below shows 3/10 but the whole on the right is much bigger than the whole on the left. They are both 3/10 but the model on the right is a much larger quantity than the model on the left. C. When the wholes are the same, the decimals or fractions can be compared.
0.5 0.80.1 0 0.2 0.3 0.4 0.6 0.7 0.9 1.0
0.32

GRADE 4 MATHEMATICS CURRICULUM NUMBERANDOPERATIONS–FRACTIONS
Waterford Public Schools 142
Example: Draw a model to show that 0.3 < 0.5. (Students would sketch
two models of approximately the same size to show the area that represents three‐tenths is smaller than the area that represents five‐tenths.

GRADE 4 MATHEMATICS CURRICULUM MEASUREMENTANDDATA
Waterford Public Schools 143
Solve problems involving measurement and conversion of measurements from a larger unit to a smaller one
Common Core State Standard Unwrapped Standard Explanation and Examples
CC.4.MD.1 Know relative sizes of measurement units within one system of units including km, m, cm; kg, g; lb, oz.; l, ml; hr, min, sec. Within a single system of measurement, express measurements in a larger unit in terms of smaller unit. Record measurement equivalents in a two‐column table. For example: Know that 1 ft is 12 times as long as 1 in. Express the length of a 4 ft snake as 48 in. Generate a conversion table for feet and inches listing the number pairs (1, 12), (2, 24), (3, 36).
A. Know relative sizes of measurement to include metric and customary units for length, weight/mass, capacity, and time.
B. Within one of these systems, be able to convert larger measurements to smaller ones.
C. Record measurement equivalence in a two‐column table.
A. Students need ample opportunities to become familiar with units of measure. Example:
One ounce is smaller than a quart. A kilogram is more than a gram
B. Students may use a two‐column chart to convert from larger to smaller units and record equivalent measurements. They make statements such as, if one foot is 12 inches, then 3 feet has to be 36 inches because there are 3 groups of 12. C.
kg g ft in lb oz 1 1000 1 12 1 16 2 2000 2 24 2 32 3 3000 3 36 3 48

GRADE 4 MATHEMATICS CURRICULUM MEASUREMENTANDDATA
Waterford Public Schools 144
Common Core State Standard Unwrapped Standard Explanation and Examples CC.4.MD.2 Use the four operations to solve word problems involving distances, intervals of time, liquid volumes, masses of objects, and money, including problems involving simple fractions or decimals, and problems that require expressing measurements given in a larger unit in terms of a smaller unit. Represent measurement quantities using diagrams such as number line diagrams that feature a measurement scale.
A. Be able to use the four operations to solve word problems involving units of measure, to include simple fractions or decimals.
B. Represent measurement quantities using diagrams such as number line diagrams that feature a measurement scale.
A. Division/fractions: Susan has 2 feet of ribbon. She wants to give her ribbon to her 3 best friends so each friend gets the same amount. How much ribbon will each friend get? Students may record their solutions using fractions or inches. (The answer would be 2/3 of a foot or 8 inches. Students are able to express the answer in inches because they understand that 1/3 of a foot is 4 inches and 2/3 of a foot is 2 groups of 1/3.) Addition: Mason ran for an hour and 15 minutes on Monday, 25 minutes on Tuesday, and 40 minutes on Wednesday. What was the total number of minutes Mason ran? Subtraction: A pound of apples costs $1.20. Rachel bought a pound and a half of apples. If she gave the clerk a $5.00 bill, how much change will she get back? Multiplication: Mario and his 2 brothers are selling lemonade. Mario brought one and a half liters, Javier brought 2 liters, and Ernesto brought 450 milliliters. How many total milliliters of lemonade did the boys have? B. Number line diagrams that feature a measurement scale can represent measurement quantities. Examples include: ruler, diagram marking off distance along a road with cities at various points, a timetable showing hours throughout the day, or a volume measure on the side of a container.
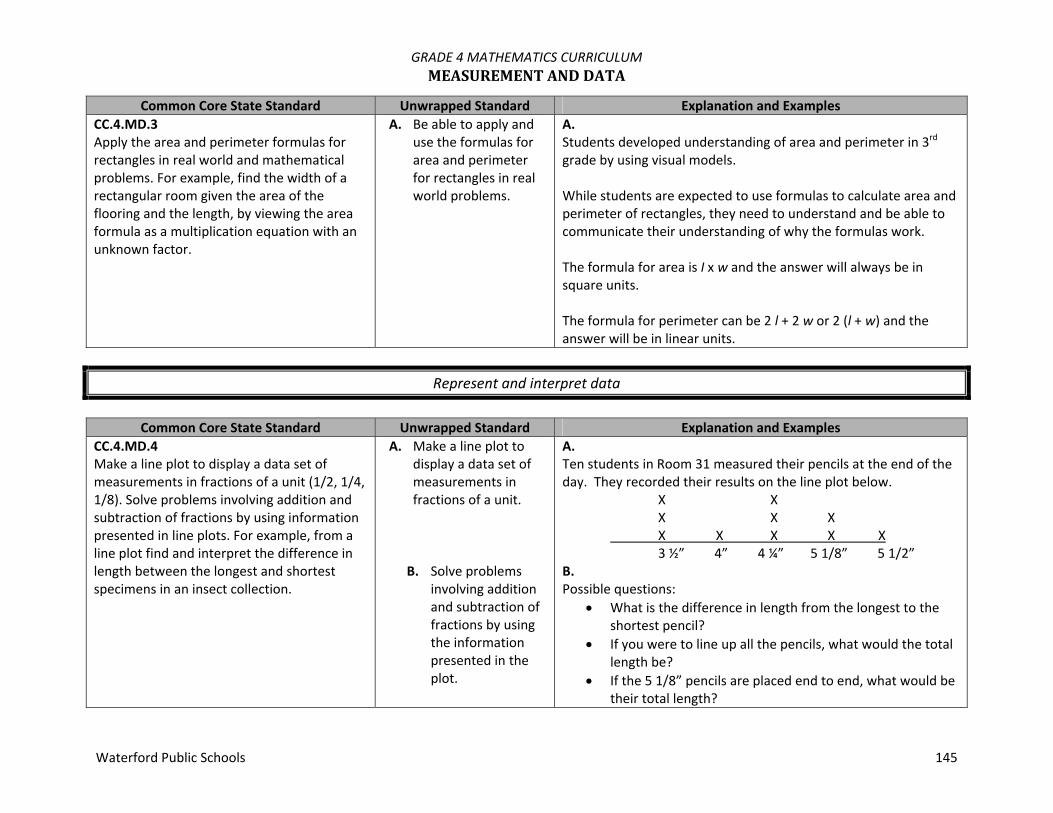
GRADE 4 MATHEMATICS CURRICULUM MEASUREMENTANDDATA
Waterford Public Schools 145
Common Core State Standard Unwrapped Standard Explanation and Examples CC.4.MD.3 Apply the area and perimeter formulas for rectangles in real world and mathematical problems. For example, find the width of a rectangular room given the area of the flooring and the length, by viewing the area formula as a multiplication equation with an unknown factor.
A. Be able to apply and use the formulas for area and perimeter for rectangles in real world problems.
A. Students developed understanding of area and perimeter in 3rd grade by using visual models. While students are expected to use formulas to calculate area and perimeter of rectangles, they need to understand and be able to communicate their understanding of why the formulas work. The formula for area is I x w and the answer will always be in square units. The formula for perimeter can be 2 l + 2 w or 2 (l + w) and the answer will be in linear units.
Represent and interpret data
Common Core State Standard Unwrapped Standard Explanation and Examples
CC.4.MD.4 Make a line plot to display a data set of measurements in fractions of a unit (1/2, 1/4, 1/8). Solve problems involving addition and subtraction of fractions by using information presented in line plots. For example, from a line plot find and interpret the difference in length between the longest and shortest specimens in an insect collection.
A. Make a line plot to display a data set of measurements in fractions of a unit.
B. Solve problems involving addition and subtraction of fractions by using the information presented in the plot.
A. Ten students in Room 31 measured their pencils at the end of the day. They recorded their results on the line plot below.
X X X X X
X X X X X 3 ½” 4” 4 ¼” 5 1/8” 5 1/2” B. Possible questions:
What is the difference in length from the longest to the shortest pencil?
If you were to line up all the pencils, what would the total length be?
If the 5 1/8” pencils are placed end to end, what would be their total length?
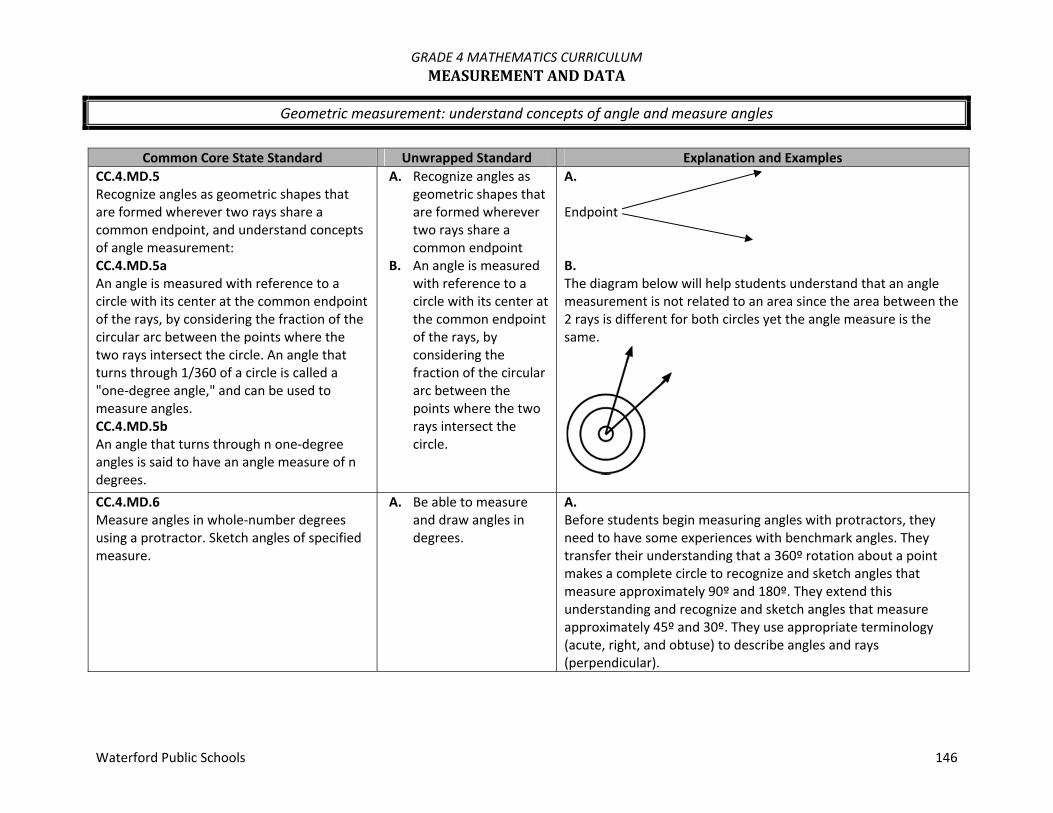
GRADE 4 MATHEMATICS CURRICULUM MEASUREMENTANDDATA
Waterford Public Schools 146
Geometric measurement: understand concepts of angle and measure angles
Common Core State Standard Unwrapped Standard Explanation and Examples
CC.4.MD.5 Recognize angles as geometric shapes that are formed wherever two rays share a common endpoint, and understand concepts of angle measurement: CC.4.MD.5a An angle is measured with reference to a circle with its center at the common endpoint of the rays, by considering the fraction of the circular arc between the points where the two rays intersect the circle. An angle that turns through 1/360 of a circle is called a "one‐degree angle," and can be used to measure angles. CC.4.MD.5b An angle that turns through n one‐degree angles is said to have an angle measure of n degrees.
A. Recognize angles as geometric shapes that are formed wherever two rays share a common endpoint
B. An angle is measured with reference to a circle with its center at the common endpoint of the rays, by considering the fraction of the circular arc between the points where the two rays intersect the circle.
A. Endpoint B. The diagram below will help students understand that an angle measurement is not related to an area since the area between the 2 rays is different for both circles yet the angle measure is the same.
CC.4.MD.6 Measure angles in whole‐number degrees using a protractor. Sketch angles of specified measure.
A. Be able to measure and draw angles in degrees.
A. Before students begin measuring angles with protractors, they need to have some experiences with benchmark angles. They transfer their understanding that a 360º rotation about a point makes a complete circle to recognize and sketch angles that measure approximately 90º and 180º. They extend this understanding and recognize and sketch angles that measure approximately 45º and 30º. They use appropriate terminology (acute, right, and obtuse) to describe angles and rays (perpendicular).

GRADE 4 MATHEMATICS CURRICULUM MEASUREMENTANDDATA
Waterford Public Schools 147
Common Core State Standard Unwrapped Standard Explanation and Examples CC.4.MD.7 Recognize angle measure as additive. When an angle is decomposed into non‐overlapping parts, the angle measure of the whole is the sum of the angle measures of the parts. Solve addition and subtraction problems to find unknown angles on a diagram in real world and mathematical problems, e.g., by using an equation with a symbol for the unknown angle measure.
A. Realize that an angle measure is additive.
B. When breaking down an angle, the angle measure of the whole is the sum of its parts.
C. Solve real world problems with addition and subtraction to find unknown angles on a diagram and be able to use an equation with a symbol for the unknown.
A. Joey knows that when a clock’s hands are exactly on 12 and 1, the angle formed by the clock’s hands measures 30º. What is the measure of the angle formed when a clock’s hands are exactly on the 12 and 4?
B. If the two rays are perpendicular, what is the value of m?
C. The five shapes in the diagram are the exact same size. Write an equation that will help you find the measure of the indicated angle. Find the angle measurement.
If: X + X + X + X + X = 360, what is the value of X?

GRADE 4 MATHEMATICS CURRICULUM GEOMETRY
Waterford Public Schools 148
Draw and identify lines and angles, and classify shapes by properties of their lines and angles
Common Core State Standard Unwrapped Standard Explanation and Examples
CC.4.G.1 Draw points, lines, line segments, rays, angles (right, acute, obtuse), and perpendicular and parallel line. Identify these in two‐dimensional figures.
A. Draw points, lines, line segments, rays, angles (right, acute, obtuse), and perpendicular and parallel line.
A. Examples of points, line segments, lines, angles, parallelism, and perpendicularity can be seen daily. Students do not easily identify lines and rays because they are more abstract.
Right angle
Acute angle
Obtuse angle
Straight angle

GRADE 4 MATHEMATICS CURRICULUM GEOMETRY
Waterford Public Schools 149
B. Identify the above in two‐dimensional figures.
B.
This trapezoid contains one set of parallel lines, 2 acute angles, and 2 obtuse angles.
CC.4.G.2 Classify two‐dimensional figures based on the presence or absence of parallel or perpendicular lines, or the presence or absence of angles of specified size. Recognize right triangles as a category, and identify right triangles.
A. Classify two‐dimensional figures based on the presence or absence of parallel or perpendicular lines, or the presence or absence of angles of specified size.
A. Two‐dimensional figures may be classified using different characteristics such as, parallel or perpendicular lines or by angle measurement. Parallel or Perpendicular Lines: Students should become familiar with the concept of parallel and perpendicular lines. Two lines are parallel if they never intersect and are always equidistant. Two lines are perpendicular if they intersect in right angles (90º). Students may use transparencies with lines to arrange two lines in different ways to determine that the 2 lines might intersect in one point or may never intersect. Further investigations may be initiated using geometry software. These types of explorations may lead to a discussion on angles. Parallel and perpendicular lines are shown below:

GRADE 4 MATHEMATICS CURRICULUM GEOMETRY
Waterford Public Schools 150
Example: Identify which of these shapes have perpendicular or
parallel sides and justify your selection.
A possible justification that students might give is: The square has perpendicular lines because the sides meet at a corner, forming right angles.
Angle Measurement: This expectation is closely connected to 4.MD.5, 4.MD.6, and 4.G.1. Students’ experiences with drawing and identifying right, acute, and obtuse angles support them in classifying two‐dimensional figures based on specified angle measurements. They use the benchmark angles of 90°, 180°, and 360° to approximate the measurement of angles.
B. Recognize right triangles as a category, and identify right triangles.
B. Right triangles can be a category for classification. A right triangle has one right angle. There are different types of right triangles. An isosceles right triangle has two or more congruent sides and a scalene right triangle has no congruent sides.

GRADE 4 MATHEMATICS CURRICULUM GEOMETRY
Waterford Public Schools 151
CC.4.G.3 Recognize a line of symmetry for a two‐dimensional figure as a line across the figure such that the figure can be folded along the line into matching parts. Identify line‐symmetric figures and draw lines of symmetry.
A. Recognize a line of symmetry for a two‐dimensional figure as a line across the figure such that the figure can be folded along the line into matching parts.
A. Students need experiences with figures which are symmetrical and non‐symmetrical. Figures include both regular and non‐regular polygons. Folding cut‐out figures will help students determine whether a figure has one or more lines of symmetry.
B. Identify symmetric figures and draw lines of symmetry.
B.
Line‐symmetric Not line‐symmetric

GRADE 4 MATHEMATICS CURRICULUM PACINGGUIDE
Waterford Public Schools 152
Unit Title Pacing Standards
1. Understanding and Using Place Value to Multiply and Divide
Mathematical Practices 1, 2, 4, 6, 7
5 weeks
4.NBT.1 Recognize that in a multi‐digit whole number, a digit in one place represents ten times what it represents in the place to its right.
4.NBT.2 Read and write multi‐digit whole numbers using base‐ten numerals, number names, and expanded form. Compare two multi‐digit numbers based on meanings of the digits in each place, using >, =, and < symbols to record the results of comparisons.
4.NBT.3 Use place value understanding to round multi‐digit whole numbers to any place.
4.NBT.5 Multiply a whole number of up to four digits by a one‐digit whole number, and multiply two two‐digit numbers, using strategies based on place value and the properties of operations. Illustrate and explain the calculation by using equations, rectangular arrays, and/or area models.
4.NBT.6 Find whole‐number quotients and remainders with up to four‐digit dividends and one‐digit divisors, using strategies based on place value, the properties of operations, and/or the relationship between multiplication and division. Illustrate and explain the calculation by using equations, rectangular arrays, and/or area models.
2. Factors and Multiples
Mathematical Practices 1, 3, 4, 5, 8 2 weeks
4.OA.1 Interpret a multiplication equation as a comparison, e.g., interpret 35 = 5 × 7 as a statement that 35 is 5 times as many as 7 and 7 times as many as 5. Represent verbal statements of multiplicative comparisons as multiplication equations.
4.OA.4 Find all factor pairs for a whole number in the range 1–100. Recognize that a whole number is a multiple of each of its factors. Determine whether a given whole number in the range 1–100 is a multiple of a given one‐digit number. Determine whether a given whole number in the range 1–100 is prime or composite.
4.OA.5 Generate a number or shape pattern that follows a given

GRADE 4 MATHEMATICS CURRICULUM PACINGGUIDE
Waterford Public Schools 153
Unit Title Pacing Standards rule. Identify apparent features of the pattern that were not explicit in the rule itself.
3. Multi‐Digit Whole Number Computation Mathematical Practices 1, 2, 3, 4, 5, 6, 7, 8
3 weeks
4.OA.2 Multiply or divide to solve word problems involving multiplicative comparison, e.g., by using drawings and equations with a symbol for the unknown number to represent the problem, distinguishing multiplicative comparison from additive comparison.
4.OA.3 Solve multistep word problems posed with whole numbers and having whole‐number answers using the four operations, including problems in which remainders must be interpreted. Represent these problems using equations with a letter standing for the unknown quantity. Assess the reasonableness of answers using mental computation and estimation strategies including rounding.
4.NBT.4 Fluently add and subtract multi‐digit whole numbers using the standard algorithm.
4. Comparing Fractions and Understanding Decimal Notation Mathematical Practices 1, 2, 3, 5, 7, 8
4 weeks
4.NF.1 Explain why a fraction a/b is equivalent to a fraction (n × a)/(n × b) by using visual fraction models, with attention to how the number and size of the parts differ even though the two fractions themselves are the same size. Use this principle to recognize and generate equivalent fractions.
4.NF.2 Compare two fractions with different numerators and different denominators, e.g., by creating common denominators or numerators, or by comparing to a benchmark fraction such as 1/2. Recognize that comparisons are valid only when the two fractions refer to the same whole. Record the results of comparisons with symbols >, =, or <, and justify the conclusions, e.g., by using a visual fraction model.
4.NF.5 Express a fraction with denominator 10 as an equivalent fraction with denominator 100, and use this technique to

GRADE 4 MATHEMATICS CURRICULUM PACINGGUIDE
Waterford Public Schools 154
Unit Title Pacing Standards add two fractions with respective denominators 10 and 100.
4.NF.6 Use decimal notation for fractions with denominators 10 or 100.
4.NF.7 Compare two decimals to hundredths by reasoning about their size. Recognize that comparisons are valid only when the two decimals refer to the same whole. Record the results of comparisons with the symbols >, =, or <, and justify the conclusions, e.g., by using a visual model.
5. Building Understanding of Addition, Subtraction, and Multiplication of Fractions Mathematical Practices 1, 2, 4, 5, 6, 7
6 weeks
4.NF.3 Understand a fraction a/b with a > 1 as a sum of fractions 1/b.
4.NF.4 Apply and extend previous understandings of multiplication to multiply a fraction by a whole number.
4.MD.4 Make a line plot to display a data set of measurements in fractions of a unit (1/2, 1/4, 1/8). Solve problems involving addition and subtraction of fractions by using information presented in line plots.
6. Solving Problems involving Measurement and Data Mathematical Practices 1, 2, 3, 4, 5, 6
3 weeks
4.MD.1 Know relative sizes of measurement units within one system of units including km, m, cm; kg, g; lb, oz.; l, ml; hr, min, sec. Within a single system of measurement, express measurements in a larger unit in terms of a smaller unit. Record measurement equivalents in a two‐column table.
4.MD.2 Use the four operations to solve word problems involving distances, intervals of time, liquid volumes, masses of objects, and money, including problems involving simple fractions or decimals, and problems that require expressing measurements given in a larger unit in terms of a smaller unit. Represent measurement quantities using diagrams such as number line diagrams that feature a measurement scale.
4.MD.3 Apply the area and perimeter formulas for rectangles in real world and mathematical problems.
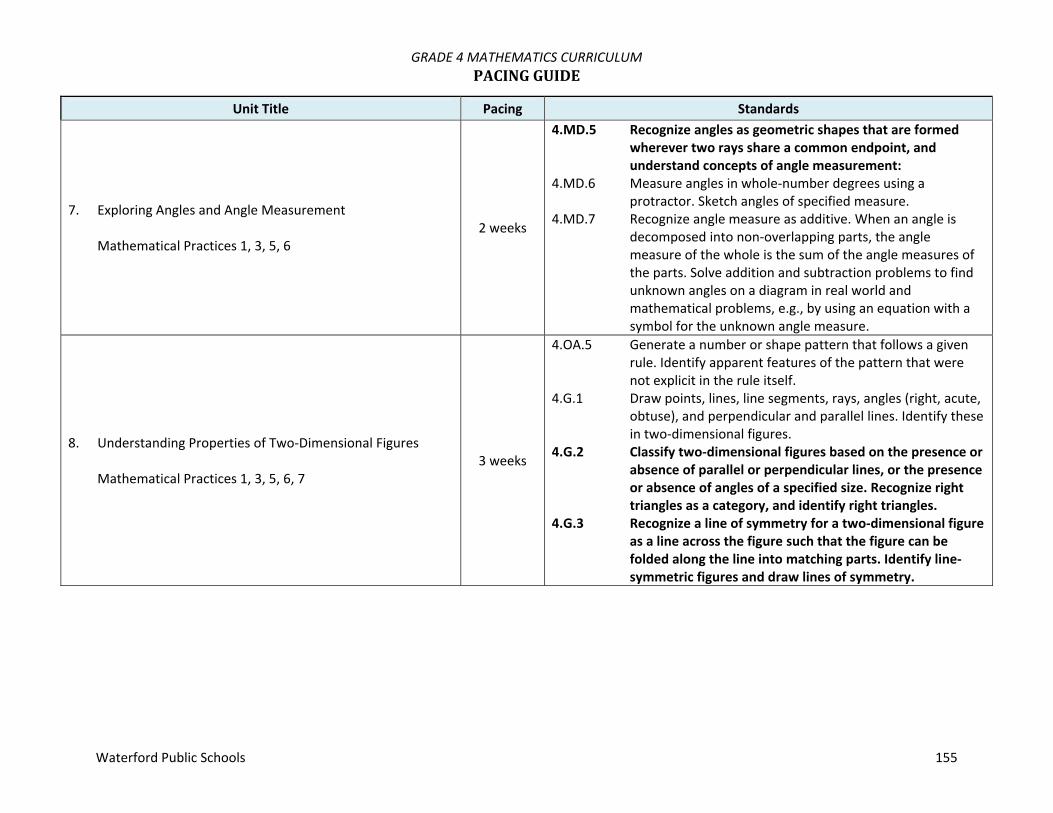
GRADE 4 MATHEMATICS CURRICULUM PACINGGUIDE
Waterford Public Schools 155
Unit Title Pacing Standards
7. Exploring Angles and Angle Measurement Mathematical Practices 1, 3, 5, 6
2 weeks
4.MD.5 Recognize angles as geometric shapes that are formed wherever two rays share a common endpoint, and understand concepts of angle measurement:
4.MD.6 Measure angles in whole‐number degrees using a protractor. Sketch angles of specified measure.
4.MD.7 Recognize angle measure as additive. When an angle is decomposed into non‐overlapping parts, the angle measure of the whole is the sum of the angle measures of the parts. Solve addition and subtraction problems to find unknown angles on a diagram in real world and mathematical problems, e.g., by using an equation with a symbol for the unknown angle measure.
8. Understanding Properties of Two‐Dimensional Figures Mathematical Practices 1, 3, 5, 6, 7
3 weeks
4.OA.5 Generate a number or shape pattern that follows a given rule. Identify apparent features of the pattern that were not explicit in the rule itself.
4.G.1 Draw points, lines, line segments, rays, angles (right, acute, obtuse), and perpendicular and parallel lines. Identify these in two‐dimensional figures.
4.G.2 Classify two‐dimensional figures based on the presence or absence of parallel or perpendicular lines, or the presence or absence of angles of a specified size. Recognize right triangles as a category, and identify right triangles.
4.G.3 Recognize a line of symmetry for a two‐dimensional figure as a line across the figure such that the figure can be folded along the line into matching parts. Identify line‐symmetric figures and draw lines of symmetry.
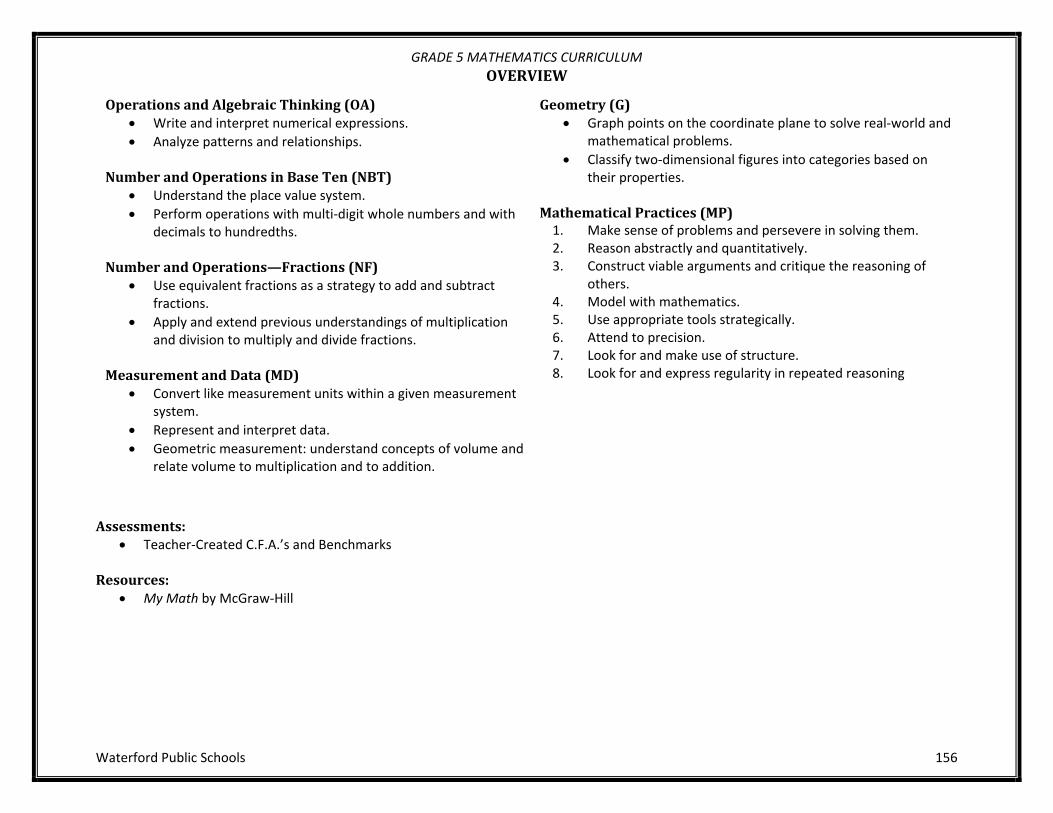
GRADE 5 MATHEMATICS CURRICULUM OVERVIEW
Waterford Public Schools 156
OperationsandAlgebraicThinking(OA) Write and interpret numerical expressions. Analyze patterns and relationships.
NumberandOperationsinBaseTen(NBT)
Understand the place value system. Perform operations with multi‐digit whole numbers and with
decimals to hundredths. NumberandOperations—Fractions(NF)
Use equivalent fractions as a strategy to add and subtract fractions.
Apply and extend previous understandings of multiplication and division to multiply and divide fractions.
MeasurementandData(MD)
Convert like measurement units within a given measurement system.
Represent and interpret data. Geometric measurement: understand concepts of volume and
relate volume to multiplication and to addition.
Geometry(G) Graph points on the coordinate plane to solve real‐world and
mathematical problems. Classify two‐dimensional figures into categories based on
their properties. MathematicalPractices(MP)1. Make sense of problems and persevere in solving them. 2. Reason abstractly and quantitatively. 3. Construct viable arguments and critique the reasoning of
others. 4. Model with mathematics. 5. Use appropriate tools strategically. 6. Attend to precision. 7. Look for and make use of structure. 8. Look for and express regularity in repeated reasoning
Assessments:
Teacher‐Created C.F.A.’s and Benchmarks Resources:
My Math by McGraw‐Hill

GRADE 5 MATHEMATICS CURRICULUM OPERATIONSANDALGEBRAICTHINKING
Waterford Public Schools 157
Write and interpret numerical expressions
Common Core State Standard Unwrapped Standard Explanation and Examples
CC.5.OA.1 Use parentheses, brackets, or braces in numerical expressions and evaluate expressions with these symbols.
A. Use parentheses, brackets, or braces in numerical expressions.
B. Evaluate expressions
with these symbols.
A. This standard builds on the expectations of third grade where students are expected to start learning the conventional order. Students need experiences with multiple expressions that use grouping symbols throughout the year to develop understanding of when and how to use parentheses, brackets, and braces. First, students use these symbols with whole numbers. Then the symbols can be used as students add, subtract, multiply and divide decimals and fractions. Examples: (26 + 18) 4 Answer: 11 {[2 x (3+5)] – 9} + [5 x (23‐18)] Answer: 32 12 – (0.4 x 2) Answer: 11.2 (2 + 3) x (1.5 – 0.5) Answer: 5 1 16
2 3
Answer: 5 1/6
{ 80 [ 2 x (3 ½ + 1 ½ ) ] }+ 100 Answer: 108
B. To further develop students’ understanding of grouping symbols and facility with operations, students place grouping symbols in equations to make the equations true or they compare expressions that are grouped differently. Examples: 15 ‐ 7 – 2 = 10 → 15 ‐ (7 – 2) = 10 3 x 125 ÷ 25 + 7 = 22 → [3 x (125 ÷ 25)] + 7 = 22 24 ÷ 12 ÷ 6 ÷ 2 = 2 x 9 + 3 ÷ ½ → 24 ÷ [(12 ÷ 6) ÷ 2] = (2 x 9) +
(3 ÷ ½)

GRADE 5 MATHEMATICS CURRICULUM OPERATIONSANDALGEBRAICTHINKING
Waterford Public Schools 158
Common Core State Standard Unwrapped Standard Explanation and Examples Compare 3 x 2 + 5 and 3 x (2 + 5) Compare 15 – 6 + 7 and 15 – (6 + 7)
CC.5.OA.2 Write simple expressions that record calculations with numbers, and interpret numerical expressions without evaluating them. For example, express the calculation “add 8 and 7, then multiply by 2” as 2 × (8 + 7). Recognize that 3 × (18932 + 921) is three times as large as 18932 + 921, without having to calculate the indicated sum or product.
A. Write simple expressions that record calculations with numbers.
B. Interpret numerical expressions without evaluating them.
A. Students use their understanding of operations and grouping symbols to write expressions and interpret the meaning of a numerical expression. Example: Students write an expression for calculations given in words
such as “divide 144 by 12, and then subtract 7.” They write (144 ÷ 12) – 7.
B. Students recognize that 0.5 x (300 ÷ 15) is ½ of (300 ÷ 15) without calculating the quotient.

GRADE 5 MATHEMATICS CURRICULUM OPERATIONSANDALGEBRAICTHINKING
Waterford Public Schools 159
Analyze patterns and relationships
Common Core State Standard Unwrapped Standard Explanation and Examples
CC.5.OA.3 Generate two numerical patterns using two given rules. Identify apparent relationships between corresponding terms. Form ordered pairs consisting of corresponding terms from the two patterns, and graph the ordered pairs on a coordinate plane. For example, given the rule “Add 3” and the starting number 0, and given the rule “Add 6” and the starting number 0, generate terms in the resulting sequences, and observe that the terms in one sequence are twice the corresponding terms in the other sequence. Explain informally why this is so.
A. Generate two numerical patterns using two given rules.
B. Identify apparent relationships between corresponding terms.
A. Example: Use the rule “add 3” to write a sequence of numbers. Starting with a 0, students write 0, 3, 6, 9, 12, . . . Use the rule “add 6” to write a sequence of numbers. Starting with 0, students write 0, 6, 12, 18, 24, . . . B. After comparing these two sequences, the students notice that each term in the second sequence is twice the corresponding terms of the first sequence. One way they justify this is by describing the patterns of the terms. Their justification may include some mathematical notation (See example below). A student may explain that both sequences start with zero and to generate each term of the second sequence he/she added 6, which is twice as much as was added to produce the terms in the first sequence. Students may also use the distributive property to describe the relationship between the two numerical patterns by reasoning that 6 + 6 + 6 = 2 (3 + 3 + 3). 0, +3 3, +3 6, +3 9, +312, . . .
0, +6 6, +6 12, +618, +6 24, . . .
GRADE 5 MATHEMATICS CURRICULUM OPERATIONSANDALGEBRAICTHINKING
Waterford Public Schools 160
Common Core State Standard Unwrapped Standard Explanation and Examples C. Form ordered pairs
consisting of corresponding terms from the two patterns, and graph the ordered pairs on a coordinate plane.
D. Explain informally why
this is so.
C. Once students can describe that the second sequence of numbers is twice the corresponding terms of the first sequence, the terms can be written in ordered pairs and then graphed on a coordinate grid. Ordered pairs
D. They should recognize that each point on the graph represents two quantities in which the second quantity is twice the first quantity.
(0, 0) (3, 6) (6, 12) (9, 18) (12, 24)
GRADE 5 MATHEMATICS CURRICULUM NUMBERANDOPERATIONSINBASETEN
Waterford Public Schools 161
Understand the place value system
Common Core State Standard Unwrapped Standard Explanation and Examples
CC.5.NBT.1 Recognize that in a multi‐digit number, a digit in one place represents 10 times as much as it represents in the place to its right and 1/10 of what it represents in the place to its left.
A. Recognize that in a multi‐digit number, a digit in one place represents 10 times as much as it represents in the place to its right.
B. Recognize that in a
multi‐digit number, a digit in one place represents 1/10 of what it represents in the place to its left.
In fourth grade, students examined the relationships of the digits in numbers for whole numbers only. This standard extends this understanding to the relationship of decimal fractions. Students use base ten blocks, pictures of base ten blocks, and interactive images of base ten blocks to manipulate and investigate the place value relationships. They use their understanding of unit fractions to compare decimal places and fractional language to describe those comparisons. A. Before considering the relationship of decimal fractions, students express their understanding that in multi‐digit whole numbers, a digit in one place represents 10 times what it represents in the place to its right and 1/10 of what it represents in the place to its left. A student thinks, “I know that in the number 5555, the 5 in the tens place (5555) represents 50 and the 5 in the hundreds place (5555) represents 500. So a 5 in the hundreds place is ten times as much as a 5 in the tens place or a 5 in the tens place is 1/10 of the value of a 5 in the hundreds place. B. To extend this understanding of place value to their work with decimals, students use a model of one unit; they cut it into 10 equal pieces, shade in, or describe 1/10 of that model using fractional language (“This is 1 out of 10 equal parts. So it is 1/10”. I can write this using 1/10 or 0.1”). They repeat the process by finding 1/10 of a 1/10 (e.g., dividing 1/10 into 10 equal parts to

GRADE 5 MATHEMATICS CURRICULUM NUMBERANDOPERATIONSINBASETEN
Waterford Public Schools 162
Common Core State Standard Unwrapped Standard Explanation and Examples arrive at 1/100 or 0.01) and can explain their reasoning, “0.01 is 1/10 of 1/10 thus is 1/100 of the whole unit.” In the number 55.55, each digit is 5, but the value of the digits is different because of the placement.
5 5 . 5 5 The 5 that the arrow points to is 1/10 of the 5 to the left and 10 times the 5 to the right. The 5 in the ones place is 1/10 of 50 and 10 times five tenths.
5 5 . 5 5 The 5 that the arrow points to is 1/10 of the 5 to the left and 10 times the 5 to the right. The 5 in the tenths place is 10 times five hundredths.
5.NBT.2. Explain patterns in the number of zeros of the product when multiplying a number by powers of 10, and explain patterns in the placement of the decimal point when a decimal is multiplied or divided by a power of 10. Use whole‐number exponents to denote powers of 10.
A. Explain patterns in the number of zeros of the product when multiplying a number by powers of 10.
A. Examples: Students might write: 36 x 10 = 36 x 101 = 360 36 x 10 x 10 = 36 x 102 = 3600 36 x 10 x 10 x 10 = 36 x 103 = 36,000 36 x 10 x 10 x 10 x 10 = 36 x 104 = 360,000

GRADE 5 MATHEMATICS CURRICULUM NUMBERANDOPERATIONSINBASETEN
Waterford Public Schools 163
Common Core State Standard Unwrapped Standard Explanation and Examples
B. Explain patterns in the
placement of the decimal point when a decimal is multiplied or divided by a power of 10.
C. Use whole‐number
exponents to denote powers of 10.
Students might think and/or say: I noticed that every time, I multiplied by 10 I added a zero to
the end of the number. That makes sense because each digit’s value became 10 times larger. To make a digit 10 times larger, I have to move it one place value to the left.
When I multiplied 36 by 10, the 30 became 300. The 6 became 60 or the 36 became 360. So I had to add a zero at the end to have the 3 represent 3 one‐hundreds (instead of 3 tens) and the 6 represents 6 tens (instead of 6 ones).
B.
.36 x 10 = .36 x 10¹ = 3.6
.36 x 100 = .36 x 10² = 36
.36 x 1000 = .36 x 10³ =360 C. Students should be able to use the same type of reasoning as above to explain why the following multiplication and division problem by powers of 10 make sense. 000,52310523 3 The place value of 523 is increased by
3 places. 3.52210223.5 2 The place value of 5.223 is increased by
2 places. 23.5103.52 1 The place value of 52.3 is decreased by
one place.

GRADE 5 MATHEMATICS CURRICULUM NUMBERANDOPERATIONSINBASETEN
Waterford Public Schools 164
Common Core State Standard Unwrapped Standard Explanation and Examples CC.5.NBT.3a Read and write decimals to thousandths using base‐ten numerals, number names, and expanded form, e.g., 347.392 = 3 × 100 + 4 × 10 + 7 × 1 + 3 × (1/10) + 9 × (1/100) + 2 × (1/1000).
A. Read and write decimals to thousandths using base‐ten numerals.
B. Read and write decimals to thousandths using number names.
Students build on the understanding they developed in fourth grade to read, write, and compare decimals to thousandths. They connect their prior experiences with using decimal notation for fractions and addition of fractions with denominators of 10 and 100. They use concrete models and number lines to extend this understanding to decimals to the thousandths. Models may include base ten blocks, place value charts, grids, pictures, drawings, manipulatives, technology‐based, etc. They read decimals using fractional language and write decimals in fractional form, as well as in expanded notation as show in the standard 3a. This investigation leads them to understanding equivalence of decimals (0.8 = 0.80 = 0.800). Examples: A. Some equivalent forms of 0.72 are: 72/100 7/10 + 2/100 7 x (1/10) + 2 x (1/100) 0.70 + 0.02
70/100 + 2/100 0.720 7 x (1/10) + 2 x (1/100) + 0 x (1/1000) 720/1000
B. 5.365 = five and three hundred sixty‐ five thousandths

GRADE 5 MATHEMATICS CURRICULUM NUMBERANDOPERATIONSINBASETEN
Waterford Public Schools 165
Common Core State Standard Unwrapped Standard Explanation and Examples CC.5.NBT.3b Compare two decimals to thousandths based on meanings of the digits in each place, using >, =, and < symbols to record the results of comparisons.
A. Compare two
decimals to thousandths place using symbols to record comparisons.
Students need to understand the size of decimal numbers and relate them to common benchmarks such as 0, 0.5 (0.50 and 0.500), and 1. Comparing tenths to tenths, hundredths to hundredths, and thousandths to thousandths is simplified if students use their understanding of fractions to compare decimals. A. Example: Comparing 0.25 and 0.17, a student might think, “25 hundredths is more than 17 hundredths”. They may also think that it is 8 hundredths more. They may write this comparison as 0.25 > 0.17 and recognize that 0.17 < 0.25 is another way to express this comparison. Comparing 0.207 to 0.26, a student might think, “Both numbers have 2 tenths, so I need to compare the hundredths. The second number has 6 hundredths and the first number has no hundredths so the second number must be larger. Another student might think while writing fractions, “I know that 0.207 is 207 thousandths (and may write 207/1000). 0.26 is 26 hundredths (and may write 26/100) but I can also think of it as 260 thousandths (260/1000). So, 260 thousandths is more than 207 thousandths. When rounding a decimal to a given place, students may identify the two possible answers, and use their understanding of place value to compare the given number to the possible answers.
GRADE 5 MATHEMATICS CURRICULUM NUMBERANDOPERATIONSINBASETEN
Waterford Public Schools 166
Common Core State Standard Unwrapped Standard Explanation and Examples CC.5.NBT.4 Use place value understanding to round decimals to any place.
A. Use place value understanding to round decimals to any place.
A. Example: Round 14.235 to the nearest tenth. Students recognize that the possible answer must be in tenths thus, it is either 14.2 or 14.3. They then identify that 14.235 is closer to 14.2 (14.20) than to 14.3 (14.30).
Perform operations with multi‐digit whole numbers and with decimals to hundredths
Common Core State Standard Unwrapped Standard Explanation and Examples
CC.5.NBT.5 Fluently multiply multi‐digit whole numbers using the standard algorithm.
A. Fluently multiply multi‐digit whole numbers using the standard algorithm.
In prior grades, students used various strategies to multiply. Students can continue to use these different strategies as long as they are efficient, but must also understand and be able to use the standard algorithm. In applying the standard algorithm, students recognize the importance of place value. A. Example: 123 x 34. When students apply the standard algorithm, they, decompose 34 into 30 + 4. Then they multiply 123 by 4, the value of the number in the ones place, and then multiply 123 by 30, the value of the 3 in the tens place, and add the two products.

GRADE 5 MATHEMATICS CURRICULUM NUMBERANDOPERATIONSINBASETEN
Waterford Public Schools 167
Common Core State Standard Unwrapped Standard Explanation and Examples CC.5.NBT.6 Find whole‐number quotients of whole numbers with up to four‐digit dividends and two‐digit divisors, using strategies based on place value, the properties of operations, and/or the relationship between multiplication and division. Illustrate and explain the calculation by using equations, rectangular arrays, and/or area models.
A. Find whole‐number quotients of whole numbers with up to four‐digit dividends and two‐digit divisors using strategies based on place value. Illustrate and explain.
In fourth grade, students’ experiences with division were limited to dividing by one‐digit divisors. This standard extends students’ prior experiences with strategies, illustrations, and explanations. When the two‐digit divisor is a “familiar” number, a student might decompose the dividend using place value. A. Example: Using expanded notation ~ 2682 ÷ 25 = (2000 + 600 + 80 + 2)
÷ 25 Using his or her understanding of the relationship between
100 and 25, a student might think ~ o I know that 100 divided by 25 is 4 so 200 divided by 25 is
8 and 2000 divided by 25 is 80. o 600 divided by 25 has to be 24. o Since 3 x 25 is 75, I know that 80 divided by 25 is 3 with
a reminder of 5. (Note that a student might divide into 82 and not 80)
o I can’t divide 2 by 25 so 2 plus the 5 leaves a remainder of 7.
o 80 + 24 + 3 = 107. So, the answer is 107 with a remainder of 7.
Using an equation that relates division to multiplication, 25 x n = 2682, a student might estimate the answer to be slightly larger than 100 because s/he recognizes that 25 x 100 = 2500.

GRADE 5 MATHEMATICS CURRICULUM NUMBERANDOPERATIONSINBASETEN
Waterford Public Schools 168
Common Core State Standard Unwrapped Standard Explanation and Examples B. Find whole‐number
quotients of whole numbers with up to four‐digit dividends and two‐digit divisors using the properties of operations. Illustrate and explain.
B. Example: 968 ÷ 21 Using base ten models, a student can represent 962 and use
the models to make an array with one dimension of 21. The student continues to make the array until no more groups of 21 can be made. Remainders are not part of the array.
C. Find whole‐number quotients of whole numbers with up to four‐digit dividends and two‐digit divisors using the relationship between multiplication and division. Illustrate and explain.
C. Example: 9984 ÷ 64 An area model for division is shown below. As the student
uses the area model, s/he keeps track of how much of the 9984 is left to divide.
GRADE 5 MATHEMATICS CURRICULUM NUMBERANDOPERATIONSINBASETEN
Waterford Public Schools 169
Common Core State Standard Unwrapped Standard Explanation and Examples CC.5.NBT.7 Add, subtract, multiply, and divide decimals to hundredths, using concrete models or drawings and strategies based on place value, properties of operations, and/or the relationship between addition and subtraction; relate the strategy to a written method and explain the reasoning used.
A. Add, subtract, multiply, and divide decimals to hundredths, using concrete models or drawings and strategies based on place value.
B. Add, subtract, multiply, and divide decimals to hundredths, using concrete models or drawings and strategies based on properties of operations.
C. Add, subtract, multiply, and divide decimals to hundredths, using concrete models or drawings and strategies based on the relationship between addition and subtraction.
D. Relate the strategy to a written method and explain the reasoning used.
A. – D. This standard requires students to extend the models and strategies they developed for whole numbers in grades 1‐4 to decimal values. Before students are asked to give exact answers, they should estimate answers based on their understanding of operations and the value of the numbers. Examples: 3.6 + 1.7
o A student might estimate the sum to be larger than 5 because 3.6 is more than 3 ½ and 1.7 is more than 1½.
5.4 – 0.8 o A student might estimate the answer to be a little more
than 4.4 because a number less than 1 is being subtracted.
6 x 2.4 o A student might estimate an answer between 12 and
18 since 6 x 2 is 12 and 6 x 3 is 18. Another student might give an estimate of a little less than 15 because s/he figures the answer to be very close, but smaller than 6 x 2 ½ and think of 2 ½ groups of 6 as 12 (2 groups of 6) + 3 (½ of a group of 6).
Students should be able to express that when they add decimals they add tenths to tenths and hundredths to hundredths. So, when they are adding in a vertical format (numbers beneath each other), it is important that they write numbers with the same place value beneath each other. This understanding can be reinforced by connecting addition of decimals to their understanding of addition of fractions. Adding fractions with denominators of 10 and 100 is a standard in fourth grade.

GRADE 5 MATHEMATICS CURRICULUM NUMBERANDOPERATIONSINBASETEN
Waterford Public Schools 170
Common Core State Standard Unwrapped Standard Explanation and Examples Example: 4 ‐ 0.3 3 tenths subtracted from 4 wholes. The wholes must be
divided into tenths.
The answer is 3 and 7/10 or 3.7. Example: An area model can be useful for illustrating products.
Students should be able to describe the partial products displayed by the area model. For example,
“ 3/10 times 4/10 is 12/100. 3/10 times 2 is 6/10 or 60/100. 1 group of 4/10 is 4/10 or 40/100. 1 group of 2 is 2. ”
Example of division: finding the number in each group or share Students should be encouraged to apply a fair sharing model
separating decimal values into equal parts such as

GRADE 5 MATHEMATICS CURRICULUM NUMBERANDOPERATIONSINBASETEN
Waterford Public Schools 171
Common Core State Standard Unwrapped Standard Explanation and Examples Example of division: find the number of groups Joe has 1.6 meters of rope. He has to cut pieces of rope that
are 0.2 meters long. How many can he cut? To divide to find the number of groups, a student might
o Draw a segment to represent 1.6 meters. In doing so, s/he would count in tenths to identify the 6 tenths, and be able identify the number of 2 tenths within the 6 tenths. The student can then extend the idea of counting by tenths to divide the one meter into tenths and determine that there are 5 more groups of 2 tenths.
o Count groups of 2 tenths without the use of models or diagrams. Knowing that 1 can be thought of as 10/10, a student might think of 1.6 as 16 tenths. Counting 2 tenths, 4 tenths, 6 tenths, . . .16 tenths, a student can count 8 groups of 2 tenths.
o Use their understanding of multiplication and think, “8 groups of 2 is 16, so 8 groups of 2/10 is 16/10 or 1 6/10.”

GRADE 5 MATHEMATICS CURRICULUM NUMBERANDOPERATIONS–FRACTIONS
Waterford Public Schools 172
Use equivalent fractions as a strategy to add and subtract fractions
Common Core State Standard Unwrapped Standard Explanation and Examples
CC.5.NF.1 Add and subtract fractions with unlike denominators (including mixed numbers) by replacing given fractions with equivalent fractions in such a way as to produce an equivalent sum or difference of fractions with like denominators. For example, 2/3 + 5/4 = 8/12 + 15/12 = 23/12. (In general, a/b + c/d = (ad + bc)/bd.)
A. Add and subtract fractions with unlike denominators (including mixed numbers) by replacing given fractions with equivalent fractions.
A. Students should apply their understanding of equivalent fractions developed in fourth grade and their ability to rewrite fractions in an equivalent form to find common denominators. They should know that multiplying the denominators will always give a common denominator but may not result in the smallest denominator. Examples: 2
578
1640
3540
5140
3 1 4
16 3 3 12
212 3 1 12
CC.5.NF.2 Solve word problems involving addition and subtraction of fractions referring to the same whole, including cases of unlike denominators, e.g., by using visual fraction models or equations to represent the problem. Use benchmark fractions and number sense of fractions to estimate mentally and assess the reasonableness of answers. For example, recognize an incorrect result 2/5 + 1/2 = 3/7 by observing that 3/7 < 1/2.
A. Solve word problems involving addition and subtraction of fractions referring to the same whole, including cases of unlike denominators, e.g., by using visual fraction models or equations to represent the problem.
A. Example: Jerry was making two different types of cookies. One recipe needed 3 4 cup of sugar and the other needed
23 cup of sugar.
How much sugar did he need to make both recipes? Mental estimation:
o A student may say that Jerry needs more than 1 cup of sugar but less than 2 cups. An explanation may compare both fractions to 1 2and state that both are larger than 1 2 so the total must be more than 1. In addition, both fractions are slightly less than 1 so the sum cannot be more than 2.

GRADE 5 MATHEMATICS CURRICULUM NUMBERANDOPERATIONS–FRACTIONS
Waterford Public Schools 173
Common Core State Standard Unwrapped Standard Explanation and Examples
Area model
34
912
23
812
34
23
1712
1212
512 1 5 12
Linear model
Solution:
Example: Using a bar diagram Sonia had 2 1 3candy bars. She promised her brother that
she would give him 1 2 of a candy bar. How much will she have left after she gives her brother the amount she promised?
If Mary ran 3 miles every week for 4 weeks, she would reach her goal for the month. The first day of the first week she ran 1 3 4 miles. How many miles does she still need to run the first week?
o Using addition to find the answer: 1 3 4 + n = 3

GRADE 5 MATHEMATICS CURRICULUM NUMBERANDOPERATIONS–FRACTIONS
Waterford Public Schools 174
Common Core State Standard Unwrapped Standard Explanation and Examples o A student might add 1 1 4 to 1
34 to get to 3 miles.
Then he or she would add 1 6 more. Thus 1 1 4 miles + 16 of a mile is what Mary needs to run during that week.
B. Use benchmark fractions and number sense of fractions to estimate mentally and assess the reasonableness of answers.
B. Example: Using an area model to subtract
This diagram models a way to show how 3 1 6 and 134 can
be expressed with a denominator of 12. Once this is accomplished, a student can complete the problem, 2 14/12 – 1 9/12 = 1 5/12.
Estimation skills include identifying when estimation is appropriate, determining the level of accuracy needed, selecting the appropriate method of estimation, and verifying solutions or determining the reasonableness of situations using various estimation strategies. Estimation strategies for calculations with fractions extend from students’ work with whole number operations and can be supported through the use of physical models. Example: Elli drank quart of milk and Javier drank of a quart less
than Ellie. How much milk did they drink all together?

GRADE 5 MATHEMATICS CURRICULUM NUMBERANDOPERATIONS–FRACTIONS
Waterford Public Schools 175
Common Core State Standard Unwrapped Standard Explanation and Examples Solution:
This is how much milk Javier drank
Together they drank 1 quarts of
milk This solution is reasonable because Ellie drank more than ½ quart and Javier drank ½ quart so together they drank slightly more than one quart.
Apply and extend previous understandings of multiplication and division to multiply and divide fractions
Common Core State Standard Unwrapped Standard Explanation and Examples
CC.5.NF.3 Interpret a fraction as division of the numerator by the denominator (a/b = a ÷ b). Solve word problems involving division of whole numbers leading to answers in the form of fractions or mixed numbers, e.g., by using visual fraction models or equations to represent the problem. For example, interpret 3/4 as the result of dividing 3 by 4, noting that 3/4 multiplied by 4 equals 3 and that when 3 wholes are shared equally among 4 people each person has a share of size 3/4. If 9 people want to share a 50‐pound sack of rice equally by weight, how many pounds of rice should each person get? Between what two whole numbers does your answer lie?
A. Interpret a fraction as division of the numerator by the denominator (a/b = a ÷ b).
B. Solve word problems involving division of whole numbers leading to answers in the form of fractions or mixed numbers, e.g., by using visual fraction models or equations to represent the problem.
A. Students are expected to demonstrate their understanding using concrete materials, drawing models, and explaining their thinking when working with fractions in multiple contexts. They read 3/5 as “three fifths” and after many experiences with sharing problems, learn that 3/5 can also be interpreted as “3 divided by 5.” B. Examples: Ten team members are sharing 3 boxes of cookies. How much
of a box will each student get? o When working this problem a student should recognize
that the 3 boxes are being divided into 10 groups, so s/he is seeing the solution to the following equation, 10 x n = 3 (10 groups of some amount is 3 boxes) which can also be written as n = 3 ÷ 10. Using models or diagram, they divide each box into 10 groups, resulting in each team member getting 3/10 of a box.
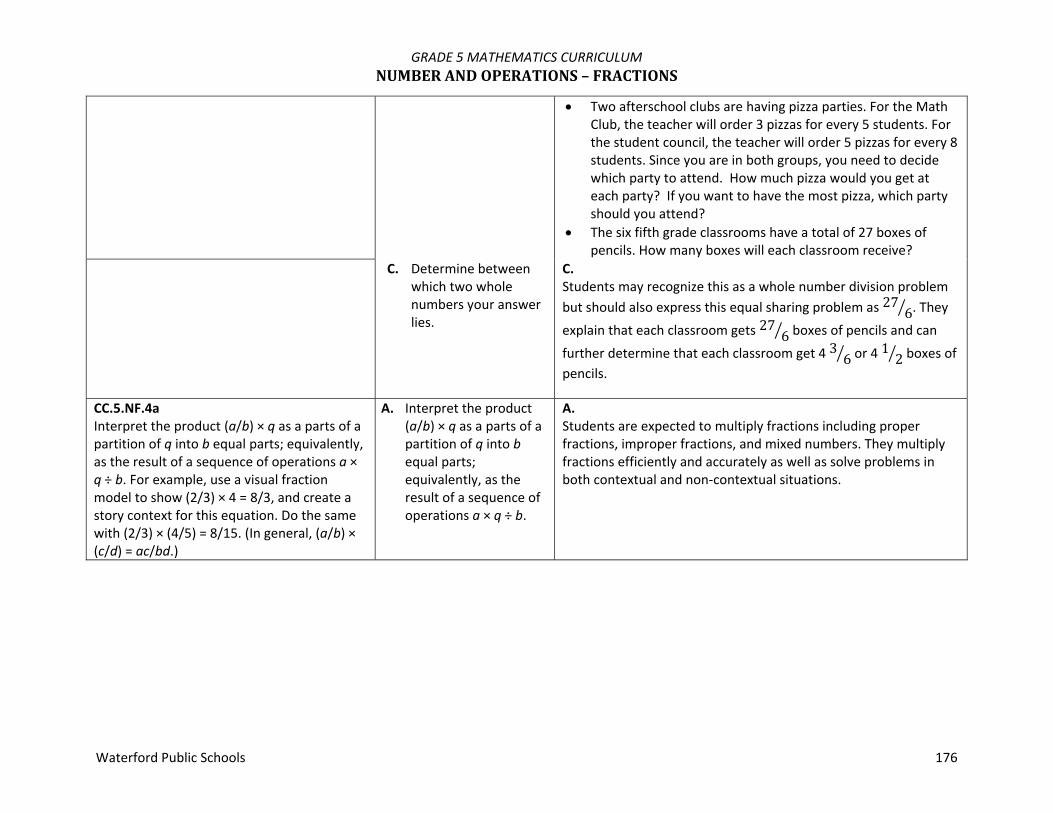
GRADE 5 MATHEMATICS CURRICULUM NUMBERANDOPERATIONS–FRACTIONS
Waterford Public Schools 176
Two afterschool clubs are having pizza parties. For the Math Club, the teacher will order 3 pizzas for every 5 students. For the student council, the teacher will order 5 pizzas for every 8 students. Since you are in both groups, you need to decide which party to attend. How much pizza would you get at each party? If you want to have the most pizza, which party should you attend?
The six fifth grade classrooms have a total of 27 boxes of pencils. How many boxes will each classroom receive?
C. Determine between which two whole numbers your answer lies.
C. Students may recognize this as a whole number division problem but should also express this equal sharing problem as 27 6. They explain that each classroom gets 27 6 boxes of pencils and can further determine that each classroom get 4 3 6or 4
12 boxes of
pencils.
CC.5.NF.4a Interpret the product (a/b) × q as a parts of a partition of q into b equal parts; equivalently, as the result of a sequence of operations a × q ÷ b. For example, use a visual fraction model to show (2/3) × 4 = 8/3, and create a story context for this equation. Do the same with (2/3) × (4/5) = 8/15. (In general, (a/b) × (c/d) = ac/bd.)
A. Interpret the product (a/b) × q as a parts of a partition of q into b equal parts; equivalently, as the result of a sequence of operations a × q ÷ b.
A. Students are expected to multiply fractions including proper fractions, improper fractions, and mixed numbers. They multiply fractions efficiently and accurately as well as solve problems in both contextual and non‐contextual situations.
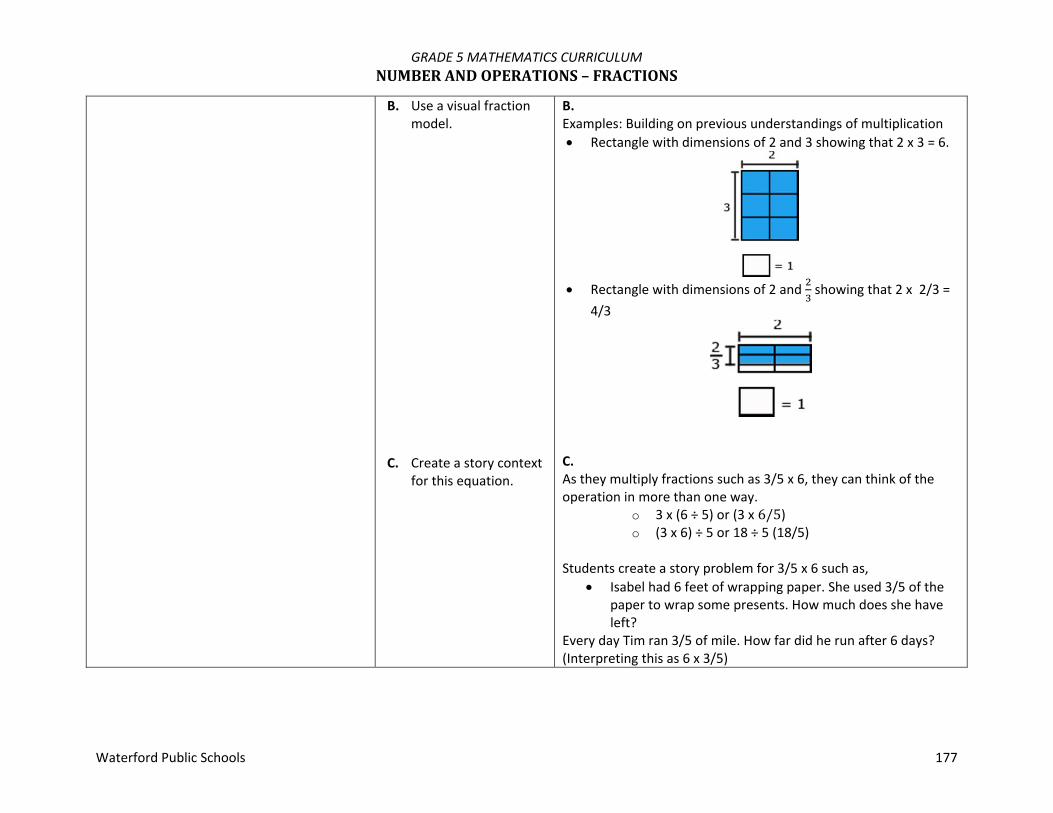
GRADE 5 MATHEMATICS CURRICULUM NUMBERANDOPERATIONS–FRACTIONS
Waterford Public Schools 177
B. Use a visual fraction model.
C. Create a story context
for this equation.
B. Examples: Building on previous understandings of multiplication Rectangle with dimensions of 2 and 3 showing that 2 x 3 = 6.
Rectangle with dimensions of 2 and showing that 2 x 2/3 =
4/3
C. As they multiply fractions such as 3/5 x 6, they can think of the operation in more than one way.
o 3 x (6 ÷ 5) or (3 x 6/5) o (3 x 6) ÷ 5 or 18 ÷ 5 (18/5)
Students create a story problem for 3/5 x 6 such as,
Isabel had 6 feet of wrapping paper. She used 3/5 of the paper to wrap some presents. How much does she have left?
Every day Tim ran 3/5 of mile. How far did he run after 6 days? (Interpreting this as 6 x 3/5)

GRADE 5 MATHEMATICS CURRICULUM NUMBERANDOPERATIONS–FRACTIONS
Waterford Public Schools 178
CC.5.NF.4b Find the area of a rectangle with fractional side lengths by tiling it with unit squares of the appropriate unit fraction side lengths, and show that the area is the same as would be found by multiplying the side lengths. Multiply fractional side lengths to find areas of rectangles, and represent fraction products as rectangular areas.
A. Find the area of a rectangle with fractional side lengths by tiling it with unit squares of the appropriate unit fraction side lengths.
B. Show that the area is the same as would be found by multiplying the side lengths.
A. 2 groups of 3
B.
In solving the problem x , students use an area model to
visualize it as a 2 by 4 array of small rectangles each of which has side lengths 1/3 and 1/5. They reason that 1/3 x 1/5 = 1/(3 x 5) by counting squares in the entire rectangle, so the area of the shaded area is (2 x 4) x 1/(3 x 5) =
.
They can explain that the product is less than because
they are finding of . They can further estimate that the
answer must be between and because of is more
than of and less than one group of .
The area model and the line segments show that the area is the same quantity as the product of the side lengths.
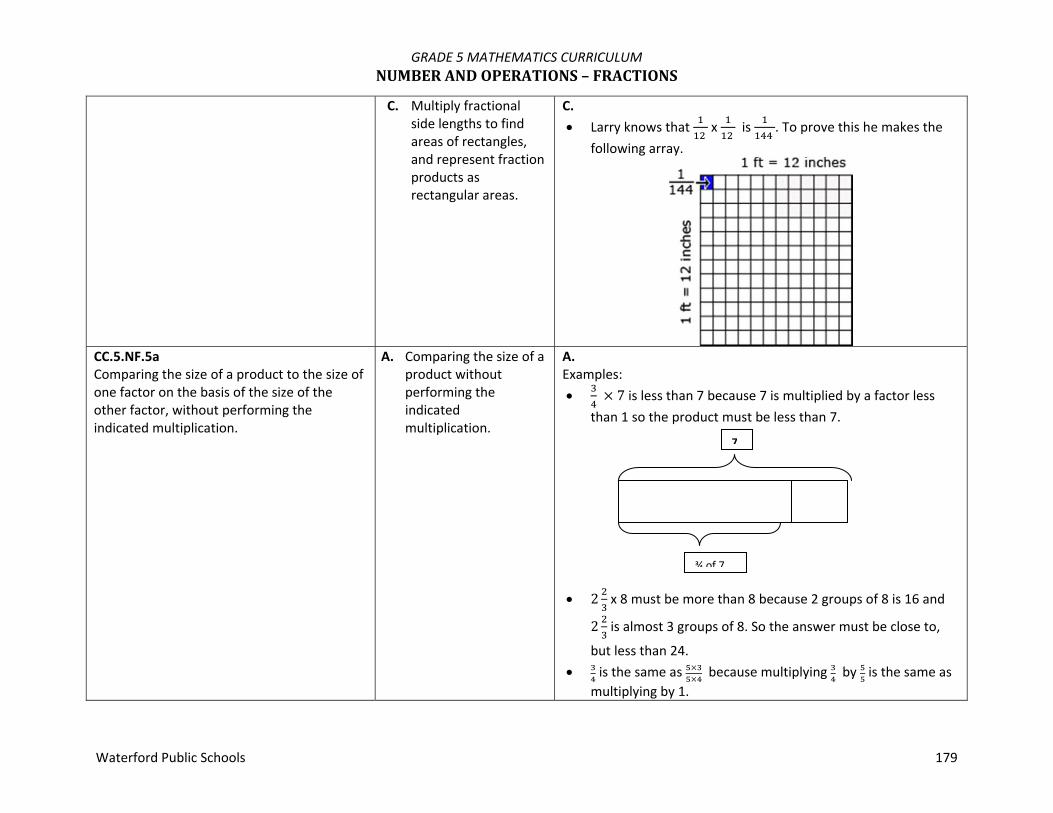
GRADE 5 MATHEMATICS CURRICULUM NUMBERANDOPERATIONS–FRACTIONS
Waterford Public Schools 179
C. Multiply fractional side lengths to find areas of rectangles, and represent fraction products as rectangular areas.
C. Larry knows that
x
is
. To prove this he makes the
following array.
CC.5.NF.5a Comparing the size of a product to the size of one factor on the basis of the size of the other factor, without performing the indicated multiplication.
A. Comparing the size of a product without performing the indicated multiplication.
A. Examples: 7 is less than 7 because 7 is multiplied by a factor less
than 1 so the product must be less than 7. 2 x 8 must be more than 8 because 2 groups of 8 is 16 and
2 is almost 3 groups of 8. So the answer must be close to,
but less than 24. is the same as because multiplying by is the same as
multiplying by 1.
7
¾ of 7

GRADE 5 MATHEMATICS CURRICULUM NUMBERANDOPERATIONS–FRACTIONS
Waterford Public Schools 180
CC.5.NF.5b Explaining why multiplying a given number by a fraction greater than 1 results in a product greater than the given number (recognizing multiplication by whole numbers greater than 1 as a familiar case); explaining why multiplying a given number by a fraction less than 1 results in a product smaller than the given number; and relating the principle of fraction equivalence a/b = (n×a)/(n×b) to the effect of multiplying a/b by 1.
A. Explain why multiplying a given number by a fraction greater than 1 results in a product greater than the given number.
B. Explain why multiplying a given number by a fraction less than 1 results in a product smaller than the given number.
C. Relate the principle of fraction equivalence a/b = (n×a)/(n×b) to the effect of multiplying a/b by 1.
A. 2 8 must be more than 8 because 2 groups of 8 is 16 and
2 is almost 3 groups of 8. So the answer must be close to, but less than 24.
B. x 7 must be less than 7 because 1 x 7 is 7 and 2/3 is less than
1.
C. is the same as because multiplying by is the same as
multiplying by 1.
5.NF.6. Solve real world problems involving multiplication of fractions and mixed numbers, e.g., by using visual fraction models or equations to represent the problem.
A. Solve real world problems involving multiplication of fractions and mixed numbers using visual models or equations.
A. Examples: Evan bought 6 roses for his mother. of them were red. How
many red roses were there? Using a visual, a student divides the 6 roses into 3 groups and
counts how many are in 2 of the 3 groups.
A student can use an equation to solve.
6 4 red roses

GRADE 5 MATHEMATICS CURRICULUM NUMBERANDOPERATIONS–FRACTIONS
Waterford Public Schools 181
Mary and Joe determined that the dimensions of their school flag needed to be 1 ft. by 2 ft. What will be the area of the school flag?
A student can draw an array to find this product and can also use his or her understanding of decomposing numbers to explain the multiplication. Thinking ahead a student may decide to multiply by 1 instead of 2 .
The explanation may include the following:
First, I am going to multiply 2 by 1 and then by .
When I multiply 2 by 1, it equals 2 .
Now I have to multiply 2 by .
times 2 is .
times is .
So the answer is 2 + + or 2 + + = 2 = 3

GRADE 5 MATHEMATICS CURRICULUM NUMBERANDOPERATIONS–FRACTIONS
Waterford Public Schools 182
CC.5.NF.7a Interpret division of a unit fraction by a non‐zero whole number, and compute such quotients. For example, create a story context for (1/3) ÷ 4 and use a visual fraction model to show the quotient; use the relationship between multiplication and division to explain that (1/3) ÷ 4 = 1/12 because (1/12) × 4 = 1/3.
A. Interpret division of a unit fraction by a non‐zero whole number, and compute such quotients.
B. Create a story
problem using a visual fraction model.
C. Explain by using the relationship between multiplication and division.
A. In fifth grade, students experience division problems with whole number divisors and unit fraction dividends (fractions with a numerator of 1) or with unit fraction divisors and whole number dividends. Students extend their understanding of the meaning of fractions, how many unit fractions are in a whole, and their understanding of multiplication and division as involving equal groups or shares and the number of objects in each group/share. In sixth grade, they will use this foundational understanding to divide into and by more complex fractions and develop abstract methods of dividing by fractions. B. – C. Division Example: Knowing the number of groups/shares and finding how many/much in each group/share Four students sitting at a table were given 1/3 of a pan of
brownies to share. How much of a pan will each student get if they share the pan of brownies equally? o The diagram shows the 1/3 pan divided into 4 equal
shares with each share equaling 1/12 of the pan.

GRADE 5 MATHEMATICS CURRICULUM NUMBERANDOPERATIONS–FRACTIONS
Waterford Public Schools 183
CC.5.NF.7b Interpret division of a whole number by a unit fraction, and compute such quotients. For example, create a story context for 4 ÷ (1/5) and use a visual fraction model to show the quotient; use the relationship between multiplication and division to explain that 4 ÷ (1/5) = 20 because 20 × (1/5) = 4.
A. Interpret division of a whole number by a unit fraction, and compute such quotients.
B. Create a story problem using a visual fraction model.
C. Explain by using the relationship between multiplication and division.
A. – C. Knowing how many in each group/share and finding how many groups/shares Angelo has 4 lbs of peanuts. He wants to give each of his
friends 1/5 lb. How many friends can receive 1/5 lb of peanuts? A diagram for 4 ÷ 1/5 is shown below. Students explain that since there are five fifths in one whole, there must be 20 fifths in 4 lbs.
1 lb. of peanuts
4 ÷ (1/5) = 20 because 20 x (1/5) = 4. CC.5.NF.7c Solve real‐world problems involving division of unit fractions by non‐zero whole numbers and division of whole numbers by unit fractions, e.g., by using visual fraction models and equations to represent the problem. For example, How much chocolate will each person get if 3 people share 1/2 lb of chocolate equally? How many 1/3‐cup servings are in 2 cups of raisins?
A. Solve real‐world problems involving division of unit fractions by non‐zero whole numbers.
B. Solve real‐world problems involving division of unit fractions by unit fractions.
12
336
316
A. Examples: How much rice will each person get if 3 people share lb of
rice equally?
A student may think or draw ½ and cut it into 3 equal groups
then determine that each of those part is 1/6. B. A student may think of as equivalent to .
divided by 3 is .

GRADE 5 MATHEMATICS CURRICULUM MEASUREMENTANDDATA
Waterford Public Schools 184
Convert like measurement units within a given measurement system
Common Core State Standard Unwrapped Standard Explanation and Examples
CC.5.MD.1 Convert among different‐sized standard measurement units within a given measurement system (e.g., convert 5 cm to 0.05 m), and use these conversions in solving multi‐step real world problems.
A. Convert among different‐sized standard measurement units within a given measurement system.
B. Use these conversions in solving multi‐step real world problems.
In fifth grade, students build on their prior knowledge of related measurement units to determine equivalent measurements. Prior to making actual conversions, they examine the units to be converted, determine if the converted amount will be more or less units than the original unit, and explain their reasoning. They use several strategies to convert measurements. When converting metric measurement, students apply their understanding of place value and decimals. A. Convert 9 m to 900 cm. B. Last year when you went to the doctor, you were 4ft. 5 in. This year they measured you and you are 60 inches. How much did you grow in one year?

GRADE 5 MATHEMATICS CURRICULUM MEASUREMENTANDDATA
Waterford Public Schools 185
Represent and interpret data
Common Core State Standard Unwrapped Standard Explanation and Examples
CC.5.MD.2 Make a line plot to display a data set of measurements in fractions of a unit (1/2, 1/4, 1/8). Use operations on fractions for this grade to solve problems involving information presented in line plots. For example, given different measurements of liquid in identical beakers, find the amount of liquid each beaker would contain if the total amount in all the beakers were redistributed equally.
A. Make a line plot to display a data set of measurements in fractions of a unit (1/2, 1/4, 1/8).
B. Use operations on fractions for this grade to solve problems involving information presented in line plots.
A. Ten beakers, measured in liters, are filled with a liquid.
The line plot above shows the amount of liquid in liters in 10 beakers. If the liquid is redistributed equally, how much liquid would each beaker have? (This amount is the mean.) B. Students apply their understanding of operations with fractions. They use either addition and/or multiplication to determine the total number of liters in the beakers. Then the sum of the liters is shared evenly among the ten beakers.
GRADE 5 MATHEMATICS CURRICULUM MEASUREMENTANDDATA
Waterford Public Schools 186
Geometric measurement: understand concepts of volume and relate volume to multiplication and to addition
Common Core State Standard Unwrapped Standard Explanation and Examples
CC.5.MD.3 Recognize volume as an attribute of solid figures and understand concepts of volume measurement. a. A cube with side length 1 unit, called a "unit cube," is said to have "one cubic unit" of volume, and can be used to measure volume. b. A solid figure which can be packed without gaps or overlaps using n unit cubes is said to have a volume of n cubic units.
A. Recognize volume as an attribute of solid figures.
B. Understand concepts of volume measurement.
A. Students’ prior experiences with volume were restricted to liquid volume. As students develop their understanding volume they understand that a 1‐unit by 1‐unit by 1‐unit cube is the standard unit for measuring volume. This cube has a length of 1 unit, a width of 1 unit and a height of 1 unit and is called a cubic unit. This cubic unit is written with an exponent of 3 (e.g., in3, m3). B. Students connect this notation to their understanding of powers of 10 in our place value system. Models of cubic inches, centimeters, cubic feet, etc are helpful in developing an image of a cubic unit. Students estimate how many cubic yards would be needed to fill the classroom or how many cubic centimeters would be needed to fill a pencil box.
CC.5.MD.4 Measure volumes by counting unit cubes, using cubic cm, cubic in, cubic ft, and improvised units.
A. Measure volumes by counting unit cubes, using cubic cm, cubic in, cubic ft, and improvised units.
A. Students understand that same sized cubic units are used to measure volume. They select appropriate units to measure volume. For example, they make a distinction between which units are more appropriate for measuring the volume of a gym and the volume of a box of books. They can also improvise a cubic unit using any unit as a length (e.g., the length of their pencil). Students can apply these ideas by filling containers with cubic units (wooden cubes) to find the volume. They may also use drawings or interactive computer software to simulate the same filling process.

GRADE 5 MATHEMATICS CURRICULUM MEASUREMENTANDDATA
Waterford Public Schools 187
Relate volume to the operations of multiplication and addition and real world and mathematical problems involving volume
Common Core State Standard Unwrapped Standard Explanation and Examples
CC.5.MD.5a Find the volume of a right rectangular prism with whole‐number side lengths by packing it with unit cubes and show that the volume is the same as would be found by multiplying the edge lengths, equivalently by multiplying the height by the area of the base. Represent three‐fold whole‐number products as volumes, e.g., to represent the associative property of multiplication.
A. Volume is the same as would be found by multiplying the edge lengths by multiplying the height by the area of the base.
B. Represent three‐fold whole number products as volume to represent the associative property of multiplication.
Students need multiple opportunities to measure volume by filling rectangular prisms with cubes and looking at the relationship between the total volume and the area of the base. They derive the volume formula (volume equals the area of the base times the height) and explore how this idea would apply to other prisms. Students use the associative property of multiplication and decomposition of numbers using factors to investigate rectangular prisms with a given number of cubic units. Examples: A. When given 24 cubes, students make as many rectangular
prisms as possible with a volume of 24 cubic units. Students build the prisms and record possible dimensions.
Length Width Height
1 2 12 2 2 6 4 2 3 8 3 1
B. Calculating volume:
(1 x 2) x 12= 24 or 1 x (2 x 12) = 24

GRADE 5 MATHEMATICS CURRICULUM MEASUREMENTANDDATA
Waterford Public Schools 188
Common Core State Standard Unwrapped Standard Explanation and Examples CC.5.MD.5b Apply the formulas V =l×w×h and V = b×h for rectangular prisms to find volumes of right rectangular prisms with whole‐number edge lengths in the context of solving real‐world and mathematical problems.
A. Apply the formulas of volume for rectangular prisms to find volumes of right rectangular prisms.
A. Students determine the volume of concrete needed to build
the steps in the diagram below.
CC.5.MD.5c Recognize volume as additive. Find volumes of solid figures composed of two non‐overlapping right rectangular prisms by adding the volumes of the non‐overlapping parts, applying this technique to solve real world problems.
A. Recognize volume as additive. (Finding volume of solid figures composed of two non‐overlapping rectangular prisms.
A. A homeowner is building a swimming pool and needs to
calculate the volume of water needed to fill the pool. The design of the pool is shown in the illustration below.
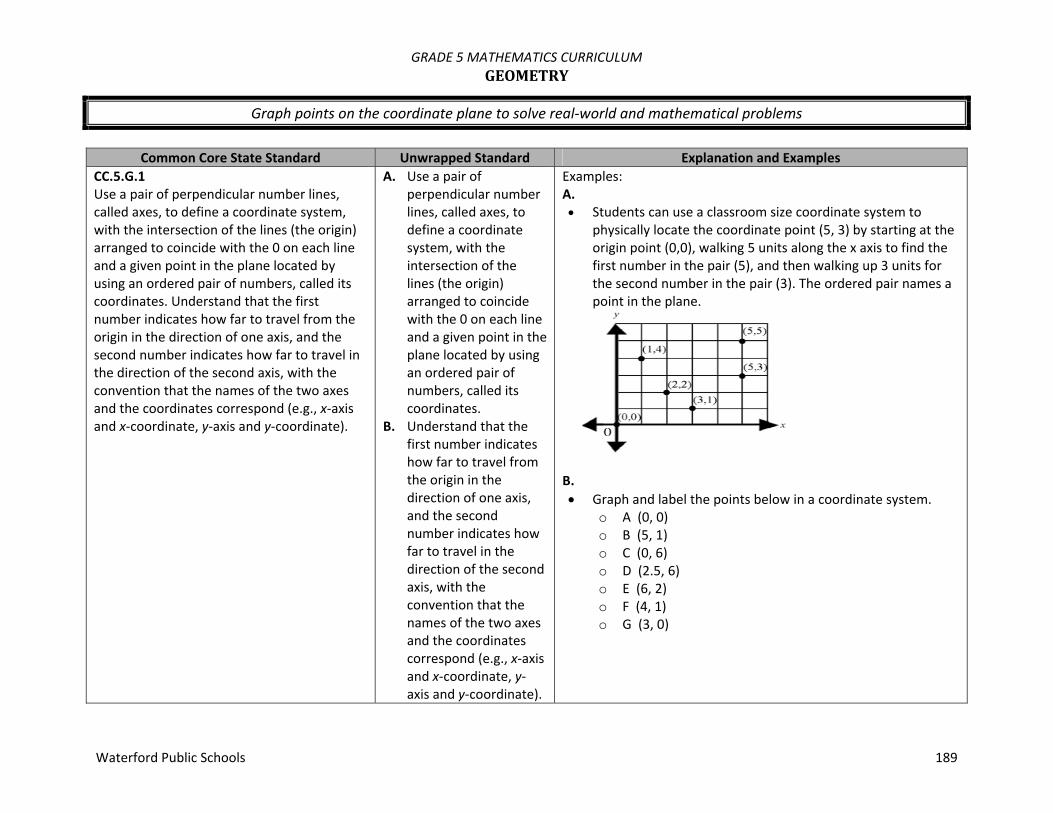
GRADE 5 MATHEMATICS CURRICULUM GEOMETRY
Waterford Public Schools 189
Graph points on the coordinate plane to solve real‐world and mathematical problems
Common Core State Standard Unwrapped Standard Explanation and Examples
CC.5.G.1 Use a pair of perpendicular number lines, called axes, to define a coordinate system, with the intersection of the lines (the origin) arranged to coincide with the 0 on each line and a given point in the plane located by using an ordered pair of numbers, called its coordinates. Understand that the first number indicates how far to travel from the origin in the direction of one axis, and the second number indicates how far to travel in the direction of the second axis, with the convention that the names of the two axes and the coordinates correspond (e.g., x‐axis and x‐coordinate, y‐axis and y‐coordinate).
A. Use a pair of perpendicular number lines, called axes, to define a coordinate system, with the intersection of the lines (the origin) arranged to coincide with the 0 on each line and a given point in the plane located by using an ordered pair of numbers, called its coordinates.
B. Understand that the first number indicates how far to travel from the origin in the direction of one axis, and the second number indicates how far to travel in the direction of the second axis, with the convention that the names of the two axes and the coordinates correspond (e.g., x‐axis and x‐coordinate, y‐axis and y‐coordinate).
Examples: A. Students can use a classroom size coordinate system to
physically locate the coordinate point (5, 3) by starting at the origin point (0,0), walking 5 units along the x axis to find the first number in the pair (5), and then walking up 3 units for the second number in the pair (3). The ordered pair names a point in the plane.
B. Graph and label the points below in a coordinate system.
o A (0, 0) o B (5, 1) o C (0, 6) o D (2.5, 6) o E (6, 2) o F (4, 1) o G (3, 0)
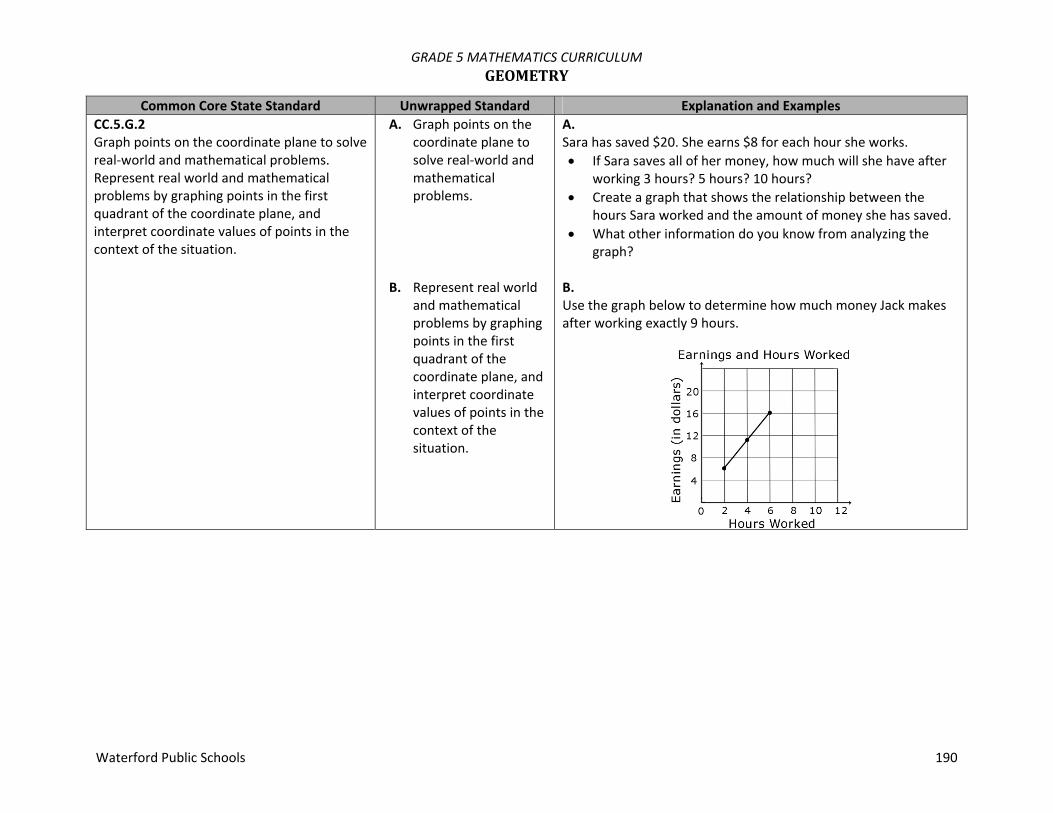
GRADE 5 MATHEMATICS CURRICULUM GEOMETRY
Waterford Public Schools 190
Common Core State Standard Unwrapped Standard Explanation and Examples CC.5.G.2 Graph points on the coordinate plane to solve real‐world and mathematical problems. Represent real world and mathematical problems by graphing points in the first quadrant of the coordinate plane, and interpret coordinate values of points in the context of the situation.
A. Graph points on the coordinate plane to solve real‐world and mathematical problems.
A. Sara has saved $20. She earns $8 for each hour she works. If Sara saves all of her money, how much will she have after
working 3 hours? 5 hours? 10 hours? Create a graph that shows the relationship between the
hours Sara worked and the amount of money she has saved. What other information do you know from analyzing the
graph?
B. Represent real world and mathematical problems by graphing points in the first quadrant of the coordinate plane, and interpret coordinate values of points in the context of the situation.
B. Use the graph below to determine how much money Jack makes after working exactly 9 hours.

GRADE 5 MATHEMATICS CURRICULUM GEOMETRY
Waterford Public Schools 191
Classify two‐dimensional figures into categories based on their properties
Common Core State Standard Unwrapped Standard Explanation and Examples
CC.5.G.3 Understand that attributes belonging to a category of two‐dimensional figures also belong to all subcategories of that category. For example, all rectangles have four right angles and squares are rectangles, so all squares have four right angles.
A. Understand that attributes belonging to a category of two‐dimensional figures also belong to all subcategories of that category.
A. Geometric properties include properties of sides (parallel, perpendicular, congruent), properties of angles (type, measurement, congruent), and properties of symmetry (point and line). Example: If the opposite sides on a parallelogram are parallel and
congruent, then rectangles are parallelograms
A sample of questions that might be posed to students include: A parallelogram has 4 sides with both sets of opposite sides
parallel. What types of quadrilaterals are parallelograms? Regular polygons have all of their sides and angles congruent.
Name or draw some regular polygons. All rectangles have 4 right angles. Squares have 4 right angles
so they are also rectangles. True or False? A trapezoid has 2 sides parallel so it must be a parallelogram.
True or False? CC.5.G.4 Classify two‐dimensional figures into categories based on their properties: Classify two‐dimensional figures in a hierarchy based on properties.
A. Classify two‐dimensional figures into categories based on their properties.
A. Properties of figure may include: Properties of sides—parallel, perpendicular, congruent,
number of sides Properties of angles—types of angles, congruent
Examples:
A right triangle can be both scalene and isosceles, but not equilateral.
A scalene triangle can be right, acute and obtuse.

GRADE 5 MATHEMATICS CURRICULUM GEOMETRY
Waterford Public Schools 192
Common Core State Standard Unwrapped Standard Explanation and Examples
Triangles can be classified by: Angles
o Right: The triangle has one angle that measures 90º. o Acute: The triangle has exactly three angles that
measure between 0º and 90º. o Obtuse: The triangle has exactly one angle that
measures greater than 90º and less than 180º.
Sides o Equilateral: All sides of the triangle are the same length. o Isosceles: At least two sides of the triangle are the same
length. o Scalene: No sides of the triangle are the same length.
B. Classify two‐
dimensional figures in a hierarchy based on properties.
B.

GRADE 5 MATHEMATICS CURRICULUM PACINGGUIDE
Waterford Public Schools 193
Unit Title Pacing Standards
1. Understanding the Place Value System
Mathematical Practices 1, 4, 5, 6, 7, 8 4 weeks
5.NBT.1 Recognize that in a multi‐digit number, a digit in one place represents 10 times as much as it represents in the place to its right and 1/10 of what it represents in the place to its left.
5.NBT.2 Explain patterns in the number of zeros of the product when multiplying a number by powers of 10, and explain patterns in the placement of the decimal point when a decimal is multiplied or divided by a power of 10. Use whole‐number exponents to denote powers of 10.
5.NBT.3 Read, write, and compare decimals to thousandths.
2. Computing with Whole Numbers and Decimals Mathematical Practices 1, 2, 4, 5, 6, 8
3 weeks
5.NBT.5 Fluently multiply multi‐digit whole numbers using the standard algorithm.
5.NBT.6 Find whole‐number quotients of whole numbers with up to four‐digit dividends and two‐digit divisors, using strategies based on place value, the properties of operations, and/or the relationship between multiplication and division. Illustrate and explain the calculation by using equations, rectangular arrays, and/or area models.
5.NBT.7 Add, subtract, multiply, and divide decimals to hundredths, using concrete models or drawings and strategies based on place value, properties of operations, and/or the relationship between addition and subtraction; relate the strategy to a written method and explain the reasoning used.
3. Algebraic Connections Mathematical Practices 1, 6, 7
3 weeks
5.OA.1 Use parentheses, brackets, or braces in numerical expressions, and evaluate expressions with these symbols.
5.OA.2 Write simple expressions that record calculations with numbers, and interpret numerical expressions without evaluating them.
5.OA.3 Generate two numerical patterns using two given rules. Identify apparent relationships between corresponding terms. Form ordered pairs consisting of corresponding
GRADE 5 MATHEMATICS CURRICULUM PACINGGUIDE
Waterford Public Schools 194
Unit Title Pacing Standards terms from the two patterns, and graph the ordered pairs on a coordinate plane.
5.G.1 Use a pair of perpendicular number lines, called axes, to define a coordinate system, with the intersection of the lines (the origin) arranged to coincide with the 0 on each line and a given point in the plane located by using an ordered pair of numbers, called its coordinates. Understand that the first number indicates how far to travel from the origin in the direction of one axis, and the second number indicates how far to travel in the direction of the second axis, with the convention that the names of the two axes and the coordinates correspond (e.g., x‐axis and x‐coordinate, y‐axis and y‐coordinate).
5.G.2 Represent real world and mathematical problems by graphing points in the first quadrant of the coordinate plane, and interpret coordinate values of points in the context of the situation.
4. Addition and Subtraction of Fractions Mathematical Practices 1, 4, 5, 6, 7, 8
4 weeks
5.NF.1 Add and subtract fractions with unlike denominators (including mixed numbers) by replacing given fractions with equivalent fractions in such a way as to produce an equivalent sum or difference of fractions with like denominators.
5.NF.2 Solve word problems involving addition and subtraction of fractions referring to the same whole, including cases of unlike denominators, e.g., by using visual fraction models or equations to represent the problem. Use benchmark fractions and number sense of fractions to estimate mentally and assess the reasonableness of answers.
5.MD.2 Make a line plot to display a data set of measurements in fractions of a unit (1/2, 1/4, 1/8). Use operations on fractions for this grade to solve problems involving information presented in line plots.

GRADE 5 MATHEMATICS CURRICULUM PACINGGUIDE
Waterford Public Schools 195
Unit Title Pacing Standards
5. Making Sense of Multiplication of Fractions Mathematical Practices 1, 4, 6, 7, 8
4 weeks
5.NF.3 Interpret a fraction as division of the numerator by the denominator (a/b = a ÷ b). Solve word problems involving division of whole numbers leading to answers in the form of fractions or mixed numbers, e.g., by using visual fraction models or equations to represent the problem.
5.NF.4 Apply and extend previous understandings of multiplication to multiply a fraction or whole number by a fraction.
5.NF.5 Interpret multiplication as scaling (resizing) 5.NF.6 Solve real world problems involving multiplication of
fractions and mixed numbers, e.g., by using visual fraction models or equations to represent the problem.
6. Understanding Division of a Unit Fraction and a Whole Number Mathematical Practices 1, 3, 4, 5, 6
3 weeks 5.NF.7 Apply and extend previous understandings of division to
divide unit fractions by whole numbers and whole numbers by unit fractions.
7. Classifying 2‐Dimensional Figures Mathematical Practices 1, 2, 3, 6
3 weeks
5.G.3 Understand that attributes belonging to a category of two‐dimensional figures also belong to all subcategories of that category. For example, all rectangles have four right angles and squares are rectangles, so all squares have four right angles.
5.G.4 Classify two‐dimensional figures in a hierarchy based on properties.
8. Exploring Volumes of Solid Figures Mathematical Practices 1, 4, 5, 6, 8
4 weeks
5.MD.3 Recognize volume as an attribute of solid figures and understand concepts of volume measurement.
5.MD.4 Measure volumes by counting unit cubes, using cubic cm, cubic in, cubic ft, and improvised units.
5.MD.5 Relate volume to the operations of multiplication and addition and solve real world and mathematical problems involving volume.

GRADE 6 MATHEMATICS CURRICULUM OVERVIEW
Waterford Public Schools 196
RatioandProportionalRelationships Students will understand the concept of a ratio as well as use ratio and rate reasoning to solve real world and mathematical problems.
TheNumberSystem
Students will understand the meaning of fractions, the meanings of multiplication and division, and the inverse relationship between multiplication and division to understand and explain why the procedures for dividing fractions make sense. Students will be able to add, subtract, multiply, and divide fractions fluently, and use these operations to solve problems, including multi‐step problems and problems involving measurement.
ExpressionsandEquations Students will write mathematical expressions and equations that correspond to given situations, evaluate expressions, and use
expressions and formulas to solve problems. Students will understand that a variable is a letter standing for a number, where the number is unknown, or where, for the purpose at hand, it can be any number in the domain of interest. Students will understand that expressions in different forms can be equivalent, and they use the laws of arithmetic to rewrite expressions to represent a total quantity in a different way (such as to represent it more compactly or to feature different information). Students will know that the solutions of an equation are the values of the variables that make the equation true. Students will use properties of operations and the idea of maintaining the equality of both sides of an equation to solve simple one‐step equations.
Geometry Students will reason about relationships among shapes to determine area and surface area. They will find areas of right triangles, other
triangles, and special quadrilaterals by decomposing these shapes, rearranging or removing pieces, and relating the shapes to rectangles. Using these methods, students will discuss, develop, and justify formulas for areas of triangles and parallelograms. Students will find areas of polygons and surface areas of prisms and pyramids by decomposition into pieces whose area they can determine.
StatisticsandProbability Students will understand that collected data can be described by its center spread and recognize that this value represents all the values
of the set. Students will display data in a variety of plots and graphs. Assessments:
Teacher‐Created C.F.A.’s and Benchmarks Resources:
Math Connects by McGraw‐Hill

GRADE 6 MATHEMATICS CURRICULUM RATIOSANDPROPORTIONALRELATIONSHIPS
Waterford Public Schools 197
What is a ratio? A proportion? A unit rate? How do you use ratios and proportions to solve various problems?
How can ratios be used to convert measurements and solve percent problems?
Common Core State Standard Unwrapped Standard Explanation and Examples
CC.6.RP.1 Understand the concept of a ratio and use ratio language to describe a ratio relationship between two quantities. For example, "The ratio of wings to beaks in the bird house at the zoo was 2:1, because for every 2 wings there was 1 beak." "For every vote candidate A received, candidate C received nearly three votes."
A. Understand and describe what a ratio is
B. Know the three ways to notate ratios
C. Use ratios to compare quantities
A. – C. A ratio is a comparison of two quantities which can be written as
a to b, ba, or a:b.
A rate is a ratio where two measurements are related to each other. When discussing measurement of different units, the word rate is used rather than ratio. Understanding rate, however, is complicated and there is no universally accepted definition. When using the term rate, contextual understanding is critical. Students need many opportunities to use models to demonstrate the relationships between quantities before they are expected to work with rates numerically. A comparison of 8 black circles to 4 white circles can be written as the ratio of 8:4 and can be regrouped into 4 black circles to 2 white circles (4:2) and 2 black circles to 1 white circle (2:1). Students should be able to identify all these ratios and describe them using “For every…., there are …”
CC.6.RP.2 Understand the concept of a unit rate a/b associated with a ratio a:b with b ≠ 0 (b not equal to zero), and use rate language in the context of a ratio relationship. For example,
A. Understand the concept of a unit rate
B. Relate rates, ratios and percentages to each other
A. – B. A unit rate compares a quantity in terms of one unit of another quantity. Students will often use unit rates to solve missing value problems. Cost per item or distance per time unit are common unit rates, however, students should be able to flexibly use unit rates to

GRADE 6 MATHEMATICS CURRICULUM RATIOSANDPROPORTIONALRELATIONSHIPS
Waterford Public Schools 198
Common Core State Standard Unwrapped Standard Explanation and Examples “This recipe has a ratio of 3 cups of flour to 4 cups of sugar, so there is 3/4 cup of flour for each cup of sugar.” “We paid $75 for 15 hamburgers, which is a rate of $5 per hamburger.” (Expectations for unit rates in this grade are limited to non‐complex fractions.)
name the amount of either quantity in terms of the other quantity. Students will begin to notice that related unit rates are reciprocals as in the first example. It is not intended that this be taught as an algorithm or rule because at this level, students should primarily use reasoning to find these unit rates. In Grade 6, students are not expected to work with unit rates expressed as complex fractions. Both the numerator and denominator of the original ratio will be whole numbers. Examples: On a bicycle you can travel 20 miles in 4 hours. What are the unit
rates in this situation, (the distance you can travel in 1 hour and the amount of time required to travel 1 mile)?
Solution:
You can travel 5 miles in 1 hour written as hrmi
1 5 and it takes
5 1 of
a hour to travel each mile written as mi 1
hr 51
. Students can
represent the relationship between 20 miles and 4 hours.
A simple modeling clay recipe calls for 1 cup corn starch, 2 cups
salt, and 2 cups boiling water. How many cups of corn starch are needed to mix with each cup of salt?
1 mile
1 hour

GRADE 6 MATHEMATICS CURRICULUM RATIOSANDPROPORTIONALRELATIONSHIPS
Waterford Public Schools 199
Common Core State Standard Unwrapped Standard Explanation and Examples CC.6.RP.3a Make tables of equivalent ratios relating quantities with whole‐number measurements, find missing values in the tables, and plot the pairs of values on the coordinate plane. Use tables to compare ratios.
A. Create tables of equivalent ratios
B. Find missing values with tables of equivalent ratios
C. Plot pairs of values on a coordinate plane
D. Use tables to compare ratios
A. – D. (3a. – 3d.) Examples: Using the information in the table, find the number of yards in
24 feet. Feet 3 6 9 15 24 Yards 1 2 3 5 ?
There are several strategies that students could use to determine the solution to this problem. o Add quantities from the table to total 24 feet (9 feet and 15
feet); therefore the number of yards must be 8 yards (3 yards and 5 yards).
o Use multiplication to find 24 feet: 1) 3 feet x 8 = 24 feet; therefore 1 yard x 8 = 8 yards, or 2) 6 feet x 4 = 24 feet; therefore 2 yards x 4 = 8 yards.
Compare the number of black to white circles. If the ratio
remains the same, how many black circles will you have if you have 60 white circles?
Black 4 40 20 60 ? White 3 30 15 45 60
If 6 is 30% of a value, what is that value? (Solution: 20)
CC.6.RP.3b Solve unit rate problems including those involving unit pricing and constant speed. For example, If it took 7 hours to mow 4 lawns, then at that rate, how many lawns could be mowed in 35 hours? At what rate were lawns being mowed?
A. Use unit rates and proportions to solve problems
6
0%
30% 100% ?
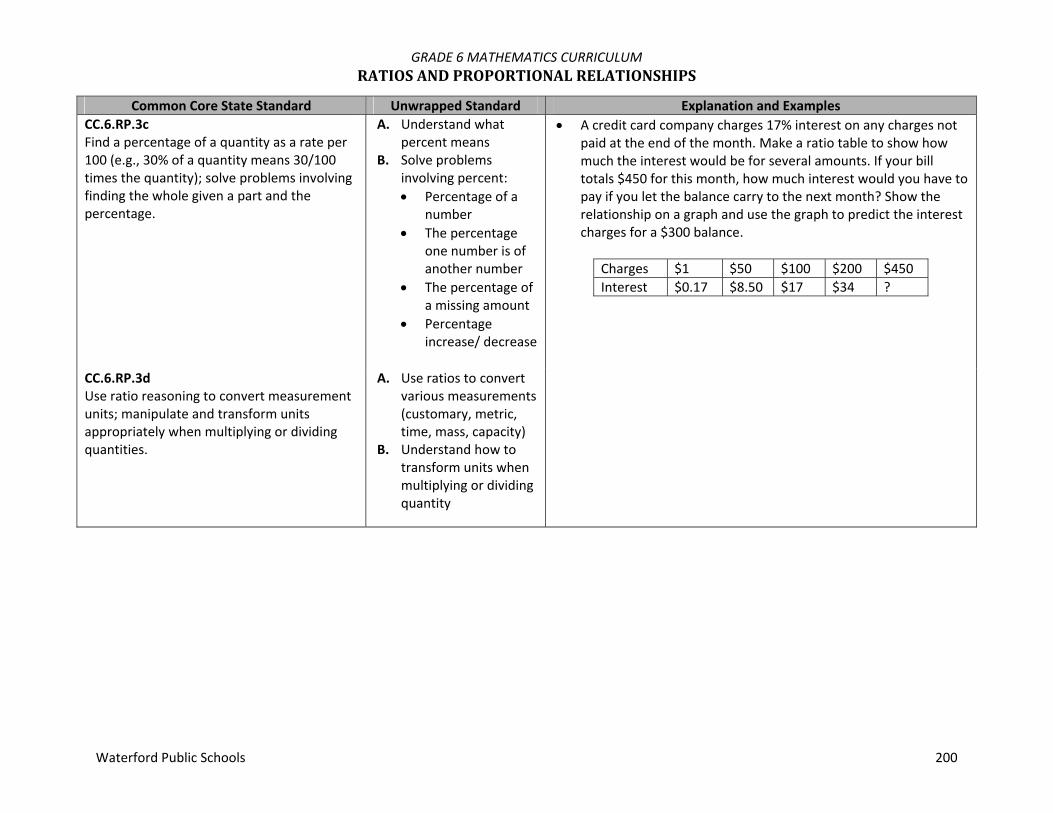
GRADE 6 MATHEMATICS CURRICULUM RATIOSANDPROPORTIONALRELATIONSHIPS
Waterford Public Schools 200
Common Core State Standard Unwrapped Standard Explanation and Examples CC.6.RP.3c Find a percentage of a quantity as a rate per 100 (e.g., 30% of a quantity means 30/100 times the quantity); solve problems involving finding the whole given a part and the percentage.
A. Understand what percent means
B. Solve problems involving percent: Percentage of a
number The percentage
one number is of another number
The percentage of a missing amount
Percentage increase/ decrease
A credit card company charges 17% interest on any charges not paid at the end of the month. Make a ratio table to show how much the interest would be for several amounts. If your bill totals $450 for this month, how much interest would you have to pay if you let the balance carry to the next month? Show the relationship on a graph and use the graph to predict the interest charges for a $300 balance.
Charges $1 $50 $100 $200 $450 Interest $0.17 $8.50 $17 $34 ?
CC.6.RP.3d Use ratio reasoning to convert measurement units; manipulate and transform units appropriately when multiplying or dividing quantities.
A. Use ratios to convert various measurements (customary, metric, time, mass, capacity)
B. Understand how to transform units when multiplying or dividing quantity
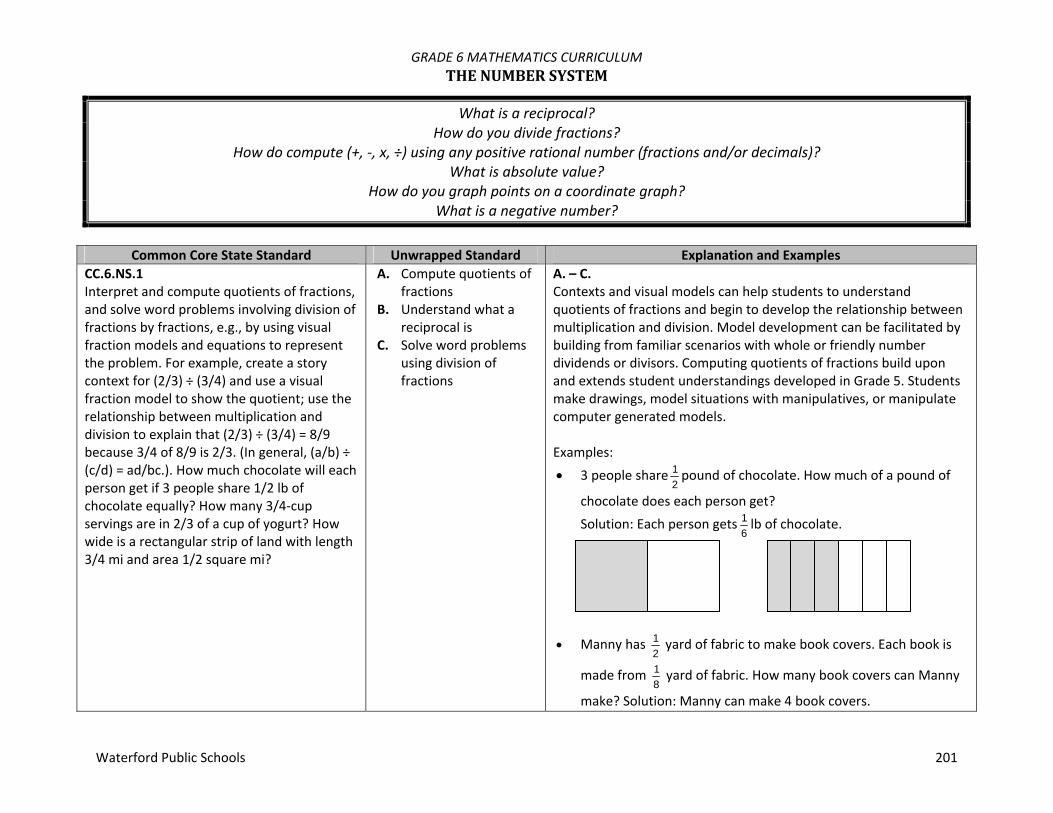
GRADE 6 MATHEMATICS CURRICULUM THENUMBERSYSTEM
Waterford Public Schools 201
What is a reciprocal? How do you divide fractions?
How do compute (+, ‐, x, ÷) using any positive rational number (fractions and/or decimals)? What is absolute value?
How do you graph points on a coordinate graph? What is a negative number?
Common Core State Standard Unwrapped Standard Explanation and Examples
CC.6.NS.1 Interpret and compute quotients of fractions, and solve word problems involving division of fractions by fractions, e.g., by using visual fraction models and equations to represent the problem. For example, create a story context for (2/3) ÷ (3/4) and use a visual fraction model to show the quotient; use the relationship between multiplication and division to explain that (2/3) ÷ (3/4) = 8/9 because 3/4 of 8/9 is 2/3. (In general, (a/b) ÷ (c/d) = ad/bc.). How much chocolate will each person get if 3 people share 1/2 lb of chocolate equally? How many 3/4‐cup servings are in 2/3 of a cup of yogurt? How wide is a rectangular strip of land with length 3/4 mi and area 1/2 square mi?
A. Compute quotients of fractions
B. Understand what a reciprocal is
C. Solve word problems using division of fractions
A. – C. Contexts and visual models can help students to understand quotients of fractions and begin to develop the relationship between multiplication and division. Model development can be facilitated by building from familiar scenarios with whole or friendly number dividends or divisors. Computing quotients of fractions build upon and extends student understandings developed in Grade 5. Students make drawings, model situations with manipulatives, or manipulate computer generated models. Examples:
3 people share21 pound of chocolate. How much of a pound of
chocolate does each person get?
Solution: Each person gets61 lb of chocolate.
Manny has 21 yard of fabric to make book covers. Each book is
made from 81 yard of fabric. How many book covers can Manny
make? Solution: Manny can make 4 book covers.

GRADE 6 MATHEMATICS CURRICULUM THENUMBERSYSTEM
Waterford Public Schools 202
Common Core State Standard Unwrapped Standard Explanation and Examples
Represent 32
21 in a problem context and draw a model to show
your solution.
Context: You are making a recipe that calls for 32 cup of yogurt. You
have 21 cup of yogurt from a snack pack. How much of the recipe can
you make? Explanation of Model:
The first model shows21 cup. The shaded squares in all three models
show 21 cup.
The second model shows 21 cup and also shows
31 cups horizontally.
The third model shows 21 cup moved to fit in only the area shown by
yd81
yd81
yd81
81 yd
yd21

GRADE 6 MATHEMATICS CURRICULUM THENUMBERSYSTEM
Waterford Public Schools 203
Common Core State Standard Unwrapped Standard Explanation and Examples
32 of the model.
32 is the new referent unit (whole) .
3 out of the 4 squares in the 32 portion are shaded. A
21 cup is only
43 of a
32 cup portion, so you can only make ¾ of the recipe.
21
21
CC.6.NS.2 Fluently divide multi‐digit numbers using the standard algorithm.
A. Use long division to solve problems
B. Use estimation to do long division
A. – B. Students are expected to fluently and accurately divide multi‐digit whole numbers. Divisors can be any number of digits at this grade level. As students divide they should continue to use their understanding of place value to describe what they are doing. When using the standard algorithm, students’ language should reference place value. For example, when dividing 32 into 8456, as they write a 2 in the quotient they should say, “there are 200 thirty‐twos in 8456 ” and could write 6400 beneath the 8456 rather than only writing 64.
There are 200 thirty twos in 8456.
32
31
31
31

GRADE 6 MATHEMATICS CURRICULUM THENUMBERSYSTEM
Waterford Public Schools 204
Common Core State Standard Unwrapped Standard Explanation and Examples
200 times 32 is 6400. 8456 minus 6400 is 2056.
There are 60 thirty twos in 2056.
60 times 32 is 1920. 2056 minus 1920 is 136.
There are 4 thirty twos in 136. 4 times 32 is 128.
The remainder is 8. There is not a full thirty two in 8; there is only part of a thirty two in 8.

GRADE 6 MATHEMATICS CURRICULUM THENUMBERSYSTEM
Waterford Public Schools 205
Common Core State Standard Unwrapped Standard Explanation and Examples This can also be written as
328 or
41 . There is ¼ of a thirty two in 8.
8456 = 264 * 32 + 8
CC.6.NS.3 Fluently add, subtract, multiply, and divide multi‐digit decimals using the standard algorithm for each operation.
A. Be able to add, subtract, multiply and divide decimals
A. The use of estimation strategies supports student understanding of operating on decimals. Example: First, students estimate the sum and then find the exact sum of
14.4 and 8.75. An estimate of the sum might be 14 + 9 or 23. Students may also state if their estimate is low or high. They would expect their answer to be greater than 23. They can use their estimates to self‐correct.
Answers of 10.19 or 101.9 indicate that students are not considering the concept of place value when adding (adding tenths to tenths or hundredths to hundredths) whereas answers like 22.125 or 22.79 indicate that students are having difficulty understanding how the four‐tenths and seventy‐five hundredths fit together to make one whole and 25 hundredths.
Students use the understanding they developed in 5th grade related to the patterns involved when multiplying and dividing by powers of ten to develop fluency with operations with multi‐digit decimals.
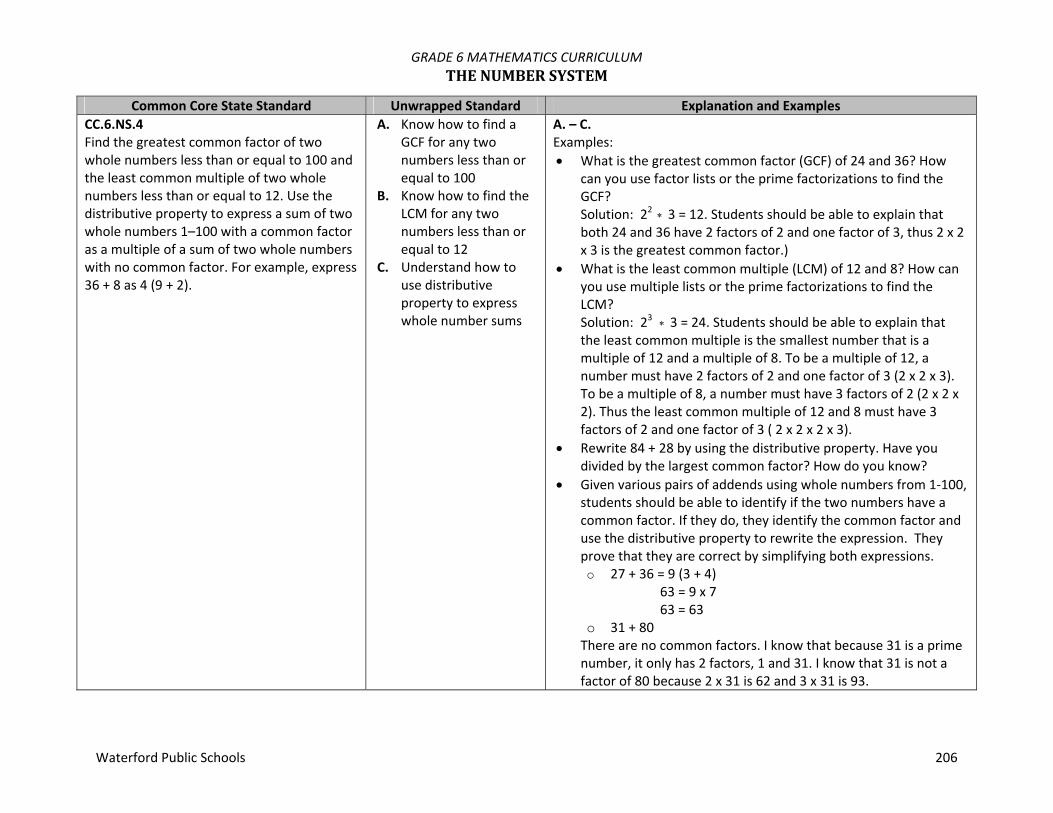
GRADE 6 MATHEMATICS CURRICULUM THENUMBERSYSTEM
Waterford Public Schools 206
Common Core State Standard Unwrapped Standard Explanation and Examples CC.6.NS.4 Find the greatest common factor of two whole numbers less than or equal to 100 and the least common multiple of two whole numbers less than or equal to 12. Use the distributive property to express a sum of two whole numbers 1–100 with a common factor as a multiple of a sum of two whole numbers with no common factor. For example, express 36 + 8 as 4 (9 + 2).
A. Know how to find a GCF for any two numbers less than or equal to 100
B. Know how to find the LCM for any two numbers less than or equal to 12
C. Understand how to use distributive property to express whole number sums
A. – C. Examples: What is the greatest common factor (GCF) of 24 and 36? How
can you use factor lists or the prime factorizations to find the GCF? Solution: 22 3 = 12. Students should be able to explain that both 24 and 36 have 2 factors of 2 and one factor of 3, thus 2 x 2 x 3 is the greatest common factor.)
What is the least common multiple (LCM) of 12 and 8? How can you use multiple lists or the prime factorizations to find the LCM? Solution: 23 3 = 24. Students should be able to explain that the least common multiple is the smallest number that is a multiple of 12 and a multiple of 8. To be a multiple of 12, a number must have 2 factors of 2 and one factor of 3 (2 x 2 x 3). To be a multiple of 8, a number must have 3 factors of 2 (2 x 2 x 2). Thus the least common multiple of 12 and 8 must have 3 factors of 2 and one factor of 3 ( 2 x 2 x 2 x 3).
Rewrite 84 + 28 by using the distributive property. Have you divided by the largest common factor? How do you know?
Given various pairs of addends using whole numbers from 1‐100, students should be able to identify if the two numbers have a common factor. If they do, they identify the common factor and use the distributive property to rewrite the expression. They prove that they are correct by simplifying both expressions. o 27 + 36 = 9 (3 + 4)
63 = 9 x 7 63 = 63
o 31 + 80 There are no common factors. I know that because 31 is a prime number, it only has 2 factors, 1 and 31. I know that 31 is not a factor of 80 because 2 x 31 is 62 and 3 x 31 is 93.
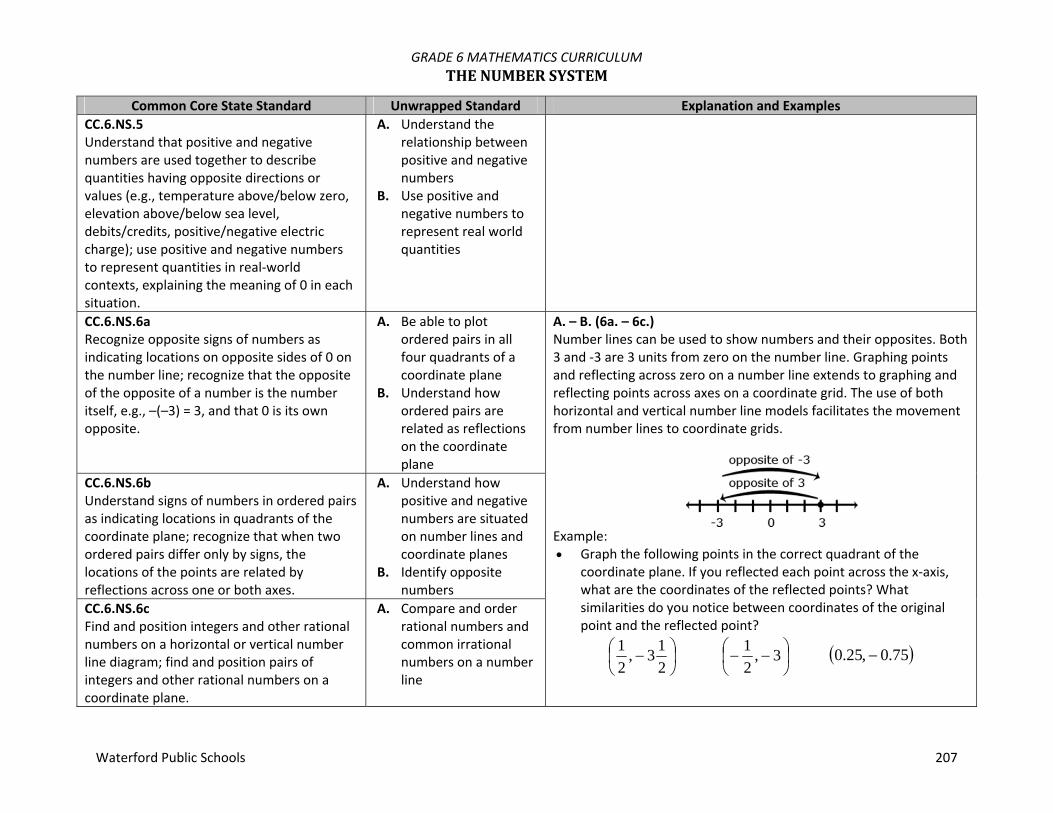
GRADE 6 MATHEMATICS CURRICULUM THENUMBERSYSTEM
Waterford Public Schools 207
Common Core State Standard Unwrapped Standard Explanation and Examples CC.6.NS.5 Understand that positive and negative numbers are used together to describe quantities having opposite directions or values (e.g., temperature above/below zero, elevation above/below sea level, debits/credits, positive/negative electric charge); use positive and negative numbers to represent quantities in real‐world contexts, explaining the meaning of 0 in each situation.
A. Understand the relationship between positive and negative numbers
B. Use positive and negative numbers to represent real world quantities
CC.6.NS.6a Recognize opposite signs of numbers as indicating locations on opposite sides of 0 on the number line; recognize that the opposite of the opposite of a number is the number itself, e.g., –(–3) = 3, and that 0 is its own opposite.
A. Be able to plot ordered pairs in all four quadrants of a coordinate plane
B. Understand how ordered pairs are related as reflections on the coordinate plane
A. – B. (6a. – 6c.) Number lines can be used to show numbers and their opposites. Both 3 and ‐3 are 3 units from zero on the number line. Graphing points and reflecting across zero on a number line extends to graphing and reflecting points across axes on a coordinate grid. The use of both horizontal and vertical number line models facilitates the movement from number lines to coordinate grids.
Example: Graph the following points in the correct quadrant of the
coordinate plane. If you reflected each point across the x‐axis, what are the coordinates of the reflected points? What similarities do you notice between coordinates of the original point and the reflected point?
213 ,
21
3 ,
21
75.0 ,25.0
CC.6.NS.6b Understand signs of numbers in ordered pairs as indicating locations in quadrants of the coordinate plane; recognize that when two ordered pairs differ only by signs, the locations of the points are related by reflections across one or both axes.
A. Understand how positive and negative numbers are situated on number lines and coordinate planes
B. Identify opposite numbers
CC.6.NS.6c Find and position integers and other rational numbers on a horizontal or vertical number line diagram; find and position pairs of integers and other rational numbers on a coordinate plane.
A. Compare and order rational numbers and common irrational numbers on a number line

GRADE 6 MATHEMATICS CURRICULUM THENUMBERSYSTEM
Waterford Public Schools 208
Common Core State Standard Unwrapped Standard Explanation and Examples CC.6.NS.7a Interpret statements of inequality as statements about the relative position of two numbers on a number line diagram. For example, interpret –3 > –7 as a statement that –3 is located to the right of –7 on a number line oriented from left to right.
A. Understand and interpret inequalities with rational numbers and common irrational numbers on a number line
A. – D. (7a. – 7d.) Common models to represent and compare integers include number line models, temperature models and the profit‐loss model. On a number line model, the number is represented by an arrow drawn from zero to the location of the number on the number line; the absolute value is the length of this arrow. The number line can also be viewed as a thermometer where each point of on the number line is a specific temperature. In the profit‐loss model, a positive number corresponds to profit and the negative number corresponds to a loss. Each of these models is useful for examining values but can also be used in later grades when students begin to perform operations on integers. In working with number line models, students internalize the order of the numbers; larger numbers on the right or top of the number line and smaller numbers to the left or bottom of the number line. They use the order to correctly locate integers and other rational numbers on the number line. By placing two numbers on the same number line, they are able to write inequalities and make statements about the relationships between the numbers. Case 1: Two positive numbers
5 > 3 5 is greater than 3
CC.6.NS.7b Write, interpret, and explain statements of order for rational numbers in real‐world contexts. For example, write –3 degrees C > –7 degrees C to express the fact that –3 degrees C is warmer than –7 degrees C.
A. Write, interpret, and explain statements of order for rational numbers in real‐world contexts
CC.6.NS.7c Understand the absolute value of a rational number as its distance from 0 on the number line; interpret absolute value as magnitude for a positive or negative quantity in a real‐world situation. For example, for an account balance of –30 dollars, write |–30| = 30 to describe the size of the debt in dollars.
A. Understand the meaning of absolute value
B. Interpret absolute value in real‐world situations

GRADE 6 MATHEMATICS CURRICULUM THENUMBERSYSTEM
Waterford Public Schools 209
Common Core State Standard Unwrapped Standard Explanation and Examples CC.6.NS.7d Distinguish comparisons of absolute value from statements about order. For example, recognize that an account balance less than –30 dollars represents a debt greater than 30 dollars.
A. Distinguish comparisons of absolute value from statements about order
Case 2: One positive and one negative number
3 > ‐3 positive 3 is greater than negative 3 negative 3 is less than positive 3
Case 3: Two negative numbers
‐3 > ‐5 negative 3 is greater than negative 5 negative 5 is less than negative 3
Comparative statements generate informal experience with operations and lay the foundation for formal work with operations on integers in grade 7. Examples: One of the thermometers shows ‐3°C and the other shows ‐7°C.
Which thermometer shows which temperature? Which is the colder temperature? How much colder? Write an inequality to show the relationship between the temperatures and explain how the model shows this relationship.

GRADE 6 MATHEMATICS CURRICULUM THENUMBERSYSTEM
Waterford Public Schools 210
Common Core State Standard Unwrapped Standard Explanation and Examples
Students recognize the distance from zero as the absolute value or magnitude of a rational number. Students need multiple experiences to understand the relationships between numbers, absolute value, and statements about order.
The Great Barrier Reef is the world’s largest reef system and is
located off the coast of Australia. It reaches from the surface of the ocean to a depth of 150 meters. Students could represent this value as less than 150 meters or a depth no greater than 150 meters below sea level
CC.6.NS.8 Solve real‐world and mathematical problems by graphing points in all four quadrants of the coordinate plane. Include use of coordinates and absolute value to find distances between points with the same first coordinate or the same second coordinate.
A. Be able to graph points in all four quadrants of a coordinate plane
B. Understand how absolute value and distances are related on the coordinate graph
A. – B. Example: If the points on the coordinate plane below are the three
vertices of a rectangle, what are the coordinates of the fourth vertex? How do you know? What are the length and width of the rectangle?

GRADE 6 MATHEMATICS CURRICULUM THENUMBERSYSTEM
Waterford Public Schools 211
Common Core State Standard Unwrapped Standard Explanation and Examples
To determine the distance along the x‐axis between the point (‐4, 2) and (2, 2) a student must recognize that ‐4 is | 4| or 4 units to the left of 0 and 2 is |2| or 2 units to the right of zero, so the two points are total of 6 units apart along the x‐axis. Students should represent this on the coordinate grid and numerically with an absolute value expression, | 4| + |2|.

GRADE 6 MATHEMATICS CURRICULUM EXPRESSIONSANDEQUATIONS
Waterford Public Schools 212
What is an exponent? What is a variable (dependent and independent)? How do you solve one‐step linear equations?
What is an inequality, and how are they graphed on a number line?
Common Core State Standard Unwrapped Standard Explanation and Examples
CC.6.EE.1 Write and evaluate numerical expressions involving whole‐number exponents.
A. Understand what exponents mean
B. Know what exponents of one and zero equal
A. – B. Examples: Write the following as a numerical expressions using exponential
notation. o The area of a square with a side length of 8 m (Solution:
228 m ) o The volume of a cube with a side length of 5 ft: (Solution:
335 ft ) o Yu‐Lee has a pair of mice. The mice each have 2 babies. The
babies grow up and have two babies of their own: (Solution: 32 mice)
Evaluate: o 34 (Solution: 64) o 625 4 (Solution: 101) o 2632472 (Solution: 67)
CC.6.EE.2a Write expressions that record operations with numbers and with letters standing for numbers. For example, express the calculation "Subtract y from 5" as 5 ‐ y.
A. Understand what a variable is
B. Write algebraic expression using a variable
A. – B. (2a. – 2c.) It is important for students to read algebraic expressions in a manner that reinforces that the variable represents a number. r + 21 as “some number plus 21 as well as “r plus 21” n 6 as “some number times 6 as well as “n times 6”
s6 and s ÷ 6 as “as some number divided by 6” as well as “s
divided by 6”

GRADE 6 MATHEMATICS CURRICULUM EXPRESSIONSANDEQUATIONS
Waterford Public Schools 213
Common Core State Standard Unwrapped Standard Explanation and Examples CC.6.EE.2b Identify parts of an expression using mathematical terms (sum, term, product, factor, quotient, coefficient); view one or more parts of an expression as a single entity. For example, describe the expression 2(8 + 7) as a product of two factors; view (8 + 7) as both a single entity and a sum of two terms.
A. Understand the following terms: sum, term, difference, product, factor, quotient, coefficient
Students should identify the parts of an algebraic expression including variables, coefficients, constants, and the names of operations (sum, difference, product, and quotient). Development of this common language helps students to understand the structure of expressions and explain their process for simplifying expressions. Terms are the parts of a sum. When the term is an explicit number, it is called a constant. When the term is a product of a number and a variable, the number is called the coefficient of the variable. Variables are letters that represent numbers. There are various possibilities for the numbers they can represent; students can substitute these possible numbers for the letters in the expression for various different purposes. Consider the following expression:
6352 xyx The variables are x and y. There are 4 terms, x2, 5y, 3x, and 6. There are 3 variable terms, x2, 5y, 3x. They have coefficients of 1, 5, and 3 respectively. The coefficient of x2 is 1, since x2 = 1 x2. The term 5y represent 5 y’s or 5 * y. There is one constant term, 6. The expression shows a sum of all four terms. Examples: 7 more than 3 times a number (Solution: 73 x ) 3 times the sum of a number and 5 (Solution: )5(3 x 7 less than the product of 2 and a number (Solution: 72 x ) Twice the difference between a number and 5 (Solution:
)5(2 z )
CC.6.EE.2c Evaluate expressions by substituting values for their variables. Include expressions that arise from formulas in real‐world problems. Perform arithmetic operations, including those involving whole‐number exponents, in the conventional order when there are no parentheses to specify a particular order (Order of Operations). For example, use the formulas V = s^3 and A = 6 s^2 to find the volume and surface area of a cube with sides of length s = 1/2.
A. Use algebraic substitution to solve problems

GRADE 6 MATHEMATICS CURRICULUM EXPRESSIONSANDEQUATIONS
Waterford Public Schools 214
Common Core State Standard Unwrapped Standard Explanation and Examples
Evaluate 5(n + 3) – 7n, when n =12.
The expression c + 0.07c can be used to find the total cost of an item with 7% sales tax, where c is the pre‐tax cost of the item. Use the expression to find the total cost of an item that cost $25.
The perimeter of a parallelogram is found using the formula p = 2l + 2w. What is the perimeter of a rectangular picture frame with dimensions of 8.5 inches by 11 inches.
CC.6.EE.3 Apply the properties of operations as strategies to generate equivalent expressions. For example, apply the distributive property to the expression 3(2 + x) to produce the equivalent expression 6 + 3x; apply properties of operations to y + y + y to produce the equivalent expression 3y.
A. Use order of operations and algebraic properties ( (i.e., commutative, associative, distributive, inverse operations, and the additive and multiplicative identities) to evaluate or simplify an expression
A. Students use their understanding of multiplication to interpret 3 (2 + x). For example, 3 groups of (2 + x). They use a model to represent x, and make an array to show the meaning of 3(2 + x). They can explain why it makes sense that 3(2 + x) is equal to 6 + 3x. An array with 3 columns and x + 2 in each column: Students interpret y as referring to one y. Thus, they can reason that one y plus one y plus one y must be 3y. They also the distributive property, the multiplicative identity property of 1, and the commutative property for multiplication to prove that y + y + y = 3y:
y + y + y = y x 1 + y x 1 + y x 1 = y x (1 + 1 + 1) = y x 3 = 3y

GRADE 6 MATHEMATICS CURRICULUM EXPRESSIONSANDEQUATIONS
Waterford Public Schools 215
Common Core State Standard Unwrapped Standard Explanation and Examples CC.6.EE.4 Identify when two expressions are equivalent (i.e., when the two expressions name the same number regardless of which value is substituted into them). For example, the expressions y + y + y and 3y are equivalent because they name the same number regardless of which number y stands for.
A. Identify when two expressions are equivalent
A. Students connect their experiences with finding and identifying equivalent forms of whole numbers and can write expressions in various forms. Students generate equivalent expressions using the associative, commutative, and distributive properties. They can prove that the expressions are equivalent by simplifying each expression into the same form. Example: Are the expressions equivalent? How do you know? 4m + 8 4(m+2) 3m + 8 + m 2 + 2m + m + 6 + m Solution:
Expression Simplifying the Expression
Explanation
4m + 8 4m + 8
Already in simplest form
4(m+2) 4(m+2) 4m + 8
Distributive property
3m + 8 + m 3m + 8 + m 3m + m + 8 (3m + m) + 8 4m + 8
Combined like terms
2 + 2m + m + 6 + m
2 + 2m + m + 6 + m 2 + 6 + 2m + m + m (2 + 6) + (2m + m + m) 8 + 4m 4m + 8
Combined like terms

GRADE 6 MATHEMATICS CURRICULUM EXPRESSIONSANDEQUATIONS
Waterford Public Schools 216
Common Core State Standard Unwrapped Standard Explanation and Examples CC.6.EE.5 Understand solving an equation or inequality as a process of answering a question: which values from a specified set, if any, make the equation or inequality true? Use substitution to determine whether a given number in a specified set makes an equation or inequality true.
A. Use substitution to determine whether a given number in a specified set makes an equation or inequality true
B. Solve one‐step algebraic equations or inequalities
A. –B. Beginning experiences in solving equations should require students to understand the meaning of the equation as well as the question being asked. Solving equations using reasoning and prior knowledge should be required of students to allow them to develop effective strategies such as using reasoning, fact families, and inverse operations. Students may use balance models in representing and solving equations and inequalities. Consider the following situation: Joey had 26 papers in his desk. His teacher gave him some more and now he has 100. How many papers did his teacher give him? This situation can be represented by the equation 26 + n = 100 where n is the number of papers the teacher gives to Joey. This equation can be stated as “some number was added to 26 and the result was 100”. Students ask themselves “What number was added to 26 to get 100?” to help them determine the value of the variable that makes the equation true. Students could use several different strategies to find a solution to the problem. o Reasoning: 26 + 70 is 96. 96 + 4 is 100, so the number added to
26 to get 100 is 74. o Use knowledge of fact families to write related equations:
n + 26 = 100, 100 ‐ n = 26, 100 ‐ 26 = n. Select the equation that helps you find n easily.
o Use knowledge of inverse operations: Since subtraction “undoes” addition then subtract 26 from 100 to get the numerical value of n
o Scale model: There are 26 blocks on the left side of the scale and 100 blocks on the right side of the scale. All the blocks are the same size. 74 blocks need to be added to the left side of the scale to make the scale balance.
o Bar Model: Each bar represents one of the values. Students use

GRADE 6 MATHEMATICS CURRICULUM EXPRESSIONSANDEQUATIONS
Waterford Public Schools 217
Common Core State Standard Unwrapped Standard Explanation and Examples this visual representation to demonstrate that 26 and the unknown value together make 100.
Examples: The equation 1144.0 s where s represents the number of
stamps in a booklet. The booklet of stamps costs 11 dollars and each stamp costs 44 cents. How many stamps are in the booklet? Explain the strategies you used to determine your answer. Show that your solution is correct using substitution.
Twelve is less than 3 times another number can be shown by the inequality n312 . What numbers could possibly make this a true statement?
CC.6.EE.6 Use variables to represent numbers and write expressions when solving a real‐world or mathematical problem; understand that a variable can represent an unknown number, or, depending on the purpose at hand, any number in a specified set.
A. Use variables to represent numbers
B. write expressions when solving a real‐world or mathematical problem
C. understand that a variable can represent an unknown number
A. – C. Connecting writing expressions with story problems and/or drawing pictures will give students a context for this work. It is important for students to read algebraic expressions in a manner that reinforces that the variable represents a number. Examples: Maria has three more than twice as many crayons as Elizabeth.
Write an algebraic expression to represent the number of crayons that Maria has. (Solution: 2c + 3 where c represents the number of crayons that Elizabeth has.)
An amusement park charges $28 to enter and $0.35 per ticket. Write an algebraic expression to represent the total amount spent. (Solution: 28 + 0.35t where t represents the number of tickets purchased)
Andrew has a summer job doing yard work. He is paid $15 per hour and a $20 bonus when he completes the yard. He was paid $85 for completing one yard. Write an equation to represent the amount of money he earned. (Solution: 15h + 20 = 85 where h is
100
26 n
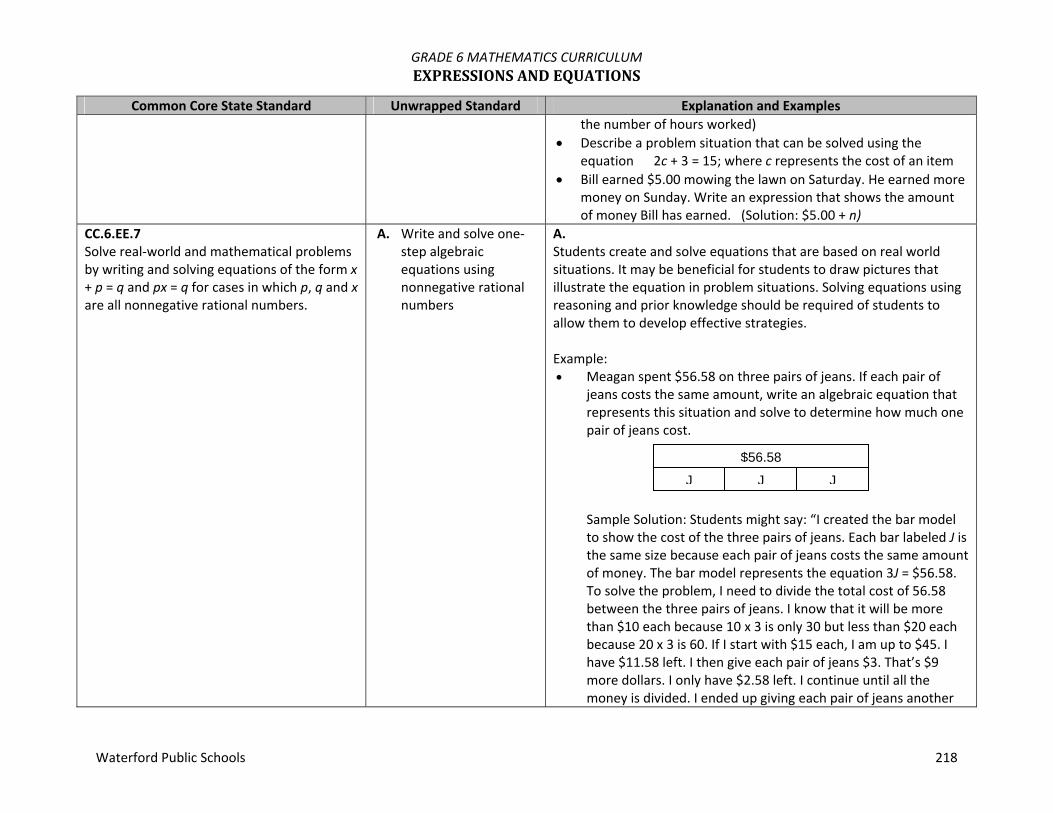
GRADE 6 MATHEMATICS CURRICULUM EXPRESSIONSANDEQUATIONS
Waterford Public Schools 218
Common Core State Standard Unwrapped Standard Explanation and Examples the number of hours worked)
Describe a problem situation that can be solved using the equation 2c + 3 = 15; where c represents the cost of an item
Bill earned $5.00 mowing the lawn on Saturday. He earned more money on Sunday. Write an expression that shows the amount of money Bill has earned. (Solution: $5.00 + n)
CC.6.EE.7 Solve real‐world and mathematical problems by writing and solving equations of the form x + p = q and px = q for cases in which p, q and x are all nonnegative rational numbers.
A. Write and solve one‐step algebraic equations using nonnegative rational numbers
A. Students create and solve equations that are based on real world situations. It may be beneficial for students to draw pictures that illustrate the equation in problem situations. Solving equations using reasoning and prior knowledge should be required of students to allow them to develop effective strategies. Example: Meagan spent $56.58 on three pairs of jeans. If each pair of
jeans costs the same amount, write an algebraic equation that represents this situation and solve to determine how much one pair of jeans cost.
Sample Solution: Students might say: “I created the bar model to show the cost of the three pairs of jeans. Each bar labeled J is the same size because each pair of jeans costs the same amount of money. The bar model represents the equation 3J = $56.58. To solve the problem, I need to divide the total cost of 56.58 between the three pairs of jeans. I know that it will be more than $10 each because 10 x 3 is only 30 but less than $20 each because 20 x 3 is 60. If I start with $15 each, I am up to $45. I have $11.58 left. I then give each pair of jeans $3. That’s $9 more dollars. I only have $2.58 left. I continue until all the money is divided. I ended up giving each pair of jeans another
$56.58
J J J

GRADE 6 MATHEMATICS CURRICULUM EXPRESSIONSANDEQUATIONS
Waterford Public Schools 219
Common Core State Standard Unwrapped Standard Explanation and Examples $0.86. Each pair of jeans costs $18.86 (15+3+0.86). I double check that the jeans cost $18.86 each because $18.86 x 3 is $56.58.”
Julio gets paid $20 for babysitting. He spends $1.99 on a
package of trading cards and $6.50 on lunch. Write and solve an equation to show how much money Julio has left. (Solution: 20 = 1.99 + 6.50 + x, x = $11.51)
CC.6.EE.8 Write an inequality of the form x > c or x < c to represent a constraint or condition in a real‐world or mathematical problem. Recognize that inequalities of the form x > c or x < c have infinitely many solutions; represent solutions of such inequalities on number line diagrams.
A. Recognize that inequalities have infinitely many solutions
B. Represent solutions to inequalities on a number line
C. Write inequalities to represent various real world problems
A. – C. Examples: Graph x ≤ 4.
Jonas spent more than $50 at an amusement park. Write an inequality to represent the amount of money Jonas spent. What are some possible amounts of money Jonas could have spent? Represent the situation on a number line.
Less than $200.00 was spent by the Flores family on groceries last month. Write an inequality to represent this amount and graph this inequality on a number line.
Solution: 200 > x
201.99 6.50 money left over (m)

GRADE 6 MATHEMATICS CURRICULUM EXPRESSIONSANDEQUATIONS
Waterford Public Schools 220
Common Core State Standard Unwrapped Standard Explanation and Examples CC.6.EE.9 Use variables to represent two quantities in a real‐world problem that change in relationship to one another; write an equation to express one quantity, thought of as the dependent variable, in terms of the other quantity, thought of as the independent variable. Analyze the relationship between the dependent and independent variables using graphs and tables, and relate these to the equation. For example, in a problem involving motion at constant speed, list and graph ordered pairs of distances and times, and write the equation d = 65t to represent the relationship between distance and time.
A. Understand the difference between dependent and independent variables
B. Analyze the relationship between dependent and independent variable on a graph
A. – B. Students can use many forms to represent relationships between quantities. Multiple representations include describing the relationship using language, a table, an equation, or a graph. Translating between multiple representations helps students understand that each form represents the same relationship and provides a different perspective on the function. Examples: What is the relationship between the two variables? Write an
expression that illustrates the relationship. x 1 2 3 4 y 2.5 5 7.5 10
Use the graph below to describe the change in y as x increases by
1.
Susan started with $1 in her savings. She plans to add $4 per
week to her savings. Use an equation, table and graph to demonstrate the relationship between the number of weeks that pass and the amount in her savings account.

GRADE 6 MATHEMATICS CURRICULUM EXPRESSIONSANDEQUATIONS
Waterford Public Schools 221
Common Core State Standard Unwrapped Standard Explanation and Examples o Language: Susan has $1 in her savings account. She is going
to save $4 each week.
o Equation: y = 4x + 1
o Table: x y
0 1
1 5
2 9
o Graph:

GRADE 6 MATHEMATICS CURRICULUM GEOMETRY
Waterford Public Schools 222
How do you find areas and perimeters of polygons? How do you find volume and surface area of rectangular prisms?
What is a net?
Common Core State Standard Unwrapped Standard Explanation and Examples
CC.6.G.1 Find area of right triangles, other triangles, special quadrilaterals, and polygons by composing into rectangles or decomposing into triangles and other shapes; apply these techniques in the context of solving real‐world and mathematical problems.
A. Be able to find areas of various polygons
B. Solve real‐world problems by finding areas
A. – B. Special quadrilaterals include rectangles, squares, parallelograms, trapezoids, rhombi, and kites. Students can use tools such as the Isometric Drawing Tool on NCTM’s Illuminations site to shift, rotate, color, decompose and view figures in 2D or 3D (http://illuminations.nctm.org/ActivityDetail.aspx?ID=125) Examples: Find the area of a triangle with a base length of three units and a
height of four units. Find the area of the trapezoid shown below using the formulas
for rectangles and triangles. A rectangle measures 3 inches by 4 inches. If the lengths of each
side double, what is the effect on the area? The area of the rectangular school garden is 24 square units. The
length of the garden is 8 units. What is the length of the fence needed to enclose the entire garden?
The sixth grade class at Hernandez School is building a giant wooden H for their school. The H will be 10 feet tall and 10 feet wide and the thickness of the block letter will be 2.5 feet. o How large will the H be if measured in square feet? o The truck that will be used to bring the wood from the
lumber yard to the school can only hold a piece of wood
12
7
3

GRADE 6 MATHEMATICS CURRICULUM GEOMETRY
Waterford Public Schools 223
Common Core State Standard Unwrapped Standard Explanation and Examples that is 60 inches by 60 inches. What pieces of wood (how many pieces and what dimensions) are needed to complete the project?
CC.6.G.2 Find the volume of a right rectangular prism with fractional edge lengths by packing it with unit cubes of the appropriate unit fraction edge lengths, and show that the volume is the same as would be found by multiplying the edge lengths of the prism. Apply the formulas V = l w h and V = b h to find volumes of right rectangular prisms with fractional edge lengths in the context of solving real‐world and mathematical problems.
A. Find volumes of rectangular prisms with a formula, even with fractional edge lengths
B. Use unit cubes to show an understanding of volumes of rectangular prisms
C. Solve real world problems using volume
A. – C. Students need multiple opportunities to measure volume by filling rectangular prisms with blocks and looking at the relationship between the total volume and the area of the base. Through these experiences, students derive the volume formula (volume equals the area of the base times the height). Students can explore the connection between filling a box with unit cubes and the volume formula using interactive applets such as the Cubes Tool on NCTM’s Illuminations (http://illuminations.nctm.org/ActivityDetail.aspx?ID=6). In addition to filling boxes, students can draw diagrams to represent fractional side lengths, connecting with multiplication of fractions. This process is similar to composing and decomposing two dimensional shapes. Examples: The model shows a cubic foot filled with cubic inches. The cubic
inches can also be labeled as a fractional cubic unit with
dimensions of 121 ft3.

GRADE 6 MATHEMATICS CURRICULUM GEOMETRY
Waterford Public Schools 224
Common Core State Standard Unwrapped Standard Explanation and Examples
The models show a rectangular prism with dimensions 3/2
inches, 5/2 inches, and 5/2 inches. Each of the cubic units in
the model is 21 in3. Students work with the model to illustrate 3/2
x 5/2 x 5/2 = (3 x 5 x 5) x 1/8. Students reason that a small cube has volume 1/8 because 8 of them fit in a unit cube.

GRADE 6 MATHEMATICS CURRICULUM GEOMETRY
Waterford Public Schools 225
Common Core State Standard Unwrapped Standard Explanation and Examples CC.6.G.3 Draw polygons in the coordinate plane given coordinates for the vertices; use coordinates to find the length of a side joining points with the same first coordinate or the same second coordinate. Apply these techniques in the context of solving real‐world and mathematical problems.
A. Draw polygons in a coordinate plane and measure distances of vertical or horizontal sides
A. Example: On a map, the library is located at (‐2, 2), the city hall building is
located at (0,2), and the high school is located at (0,0). Represent the locations as points on a coordinate grid with a unit of 1 mile. o What is the distance from the library to the city hall
building? The distance from the city hall building to the high school? How do you know?
o What shape is formed by connecting the three locations? The city council is planning to place a city park in this area. How large is the area of the planned park?
CC.6.G.4 Represent three‐dimensional figures using nets made up of rectangles and triangles, and use the nets to find the surface area of these figures. Apply these techniques in the context of solving real‐world and mathematical problems.
A. Know what nets are B. Represent various 3‐D
objects with nets C. Find surface areas of
3‐D figures using nets
A. – C. Students construct models and nets of three dimensional figures, describing them by the number of edges, vertices, and faces. Solids include rectangular and triangular prisms. Students are expected to use the net to calculate the surface area. Students can create nets of 3D figures with specified dimensions using the Dynamic Paper Tool on NCTM’s Illuminations (http://illuminations.nctm.org/ActivityDetail.aspx?ID=205). Students also describe the types of faces needed to create a three‐dimensional figure. Students make and test conjectures by determining what is needed to create a specific three‐dimensional figure. Examples: Describe the shapes of the faces needed to construct a
rectangular pyramid. Cut out the shapes and create a model. Did your faces work? Why or why not?
Create the net for a given prism or pyramid, and then use the net to calculate the surface area.

GRADE 6 MATHEMATICS CURRICULUM GEOMETRY
Waterford Public Schools 226
Common Core State Standard Unwrapped Standard Explanation and Examples

GRADE 6 MATHEMATICS CURRICULUM STATISTICSANDPROBABILITY
Waterford Public Schools 227
What is statistics? What are measures of central tendency? How do you interpret various graphs?
Common Core State Standard Unwrapped Standard Explanation and Examples
CC.6.SP.1 Recognize a statistical question as one that anticipates variability in the data related to the question and accounts for it in the answers. For example, "How old am I?" is not a statistical question, but "How old are the students in my school?" is a statistical question because one anticipates variability in students' ages.
A. Understand what statistics are about
A. Statistics are numerical data relating to an aggregate of individuals; statistics is also the name for the science of collecting, analyzing and interpreting such data. A statistical question anticipates an answer that varies from one individual to the next and is written to account for the variability in the data. Data are the numbers produced in response to a statistical question. Data are frequently collected from surveys or other sources (i.e. documents). Questions can result in a narrow or wide range of numerical values. For example, asking classmates “How old are the students in my class in years?” will result in less variability than asking “How old are the students in my class in months?” Students might want to know about the fitness of the students at their school. Specifically, they want to know about the exercise habits of the students. So rather than asking "Do you exercise?" they should ask about the amount of exercise the students at their school get per week. A statistical question for this study could be:“How many hours per week on average do students at Jefferson Middle School exercise?” To collect this information, students might design a survey question that anticipates variability by providing a variety of possible anticipated responses that have numerical answers, such as: 3 hours per week, 4 hours per week, and so on. Be sure that students ask questions that have specific numerical answers.

GRADE 6 MATHEMATICS CURRICULUM STATISTICSANDPROBABILITY
Waterford Public Schools 228
Common Core State Standard Unwrapped Standard Explanation and Examples CC.6.SP.2 Understand that a set of data collected to answer a statistical question has a distribution which can be described by its center, spread, and overall shape.
A. Interpret a data set using statistical tools (mean, median mode, range)
A. The two dot plots show the 6‐trait writing scores for a group of students on two different traits, organization and ideas. The center, spread and overall shape can be used to compare the data sets. Students consider the context in which the data were collected and identify clusters, peaks, gaps, and symmetry. Showing the two graphs vertically rather than side by side helps students make comparisons. For example, students would be able to see from the display of the two graphs that the ideas scores are generally higher than the organization scores. One observation students might make is that the scores for organization are clustered around a score of 3 whereas the scores for ideas are clustered around a score of 5.
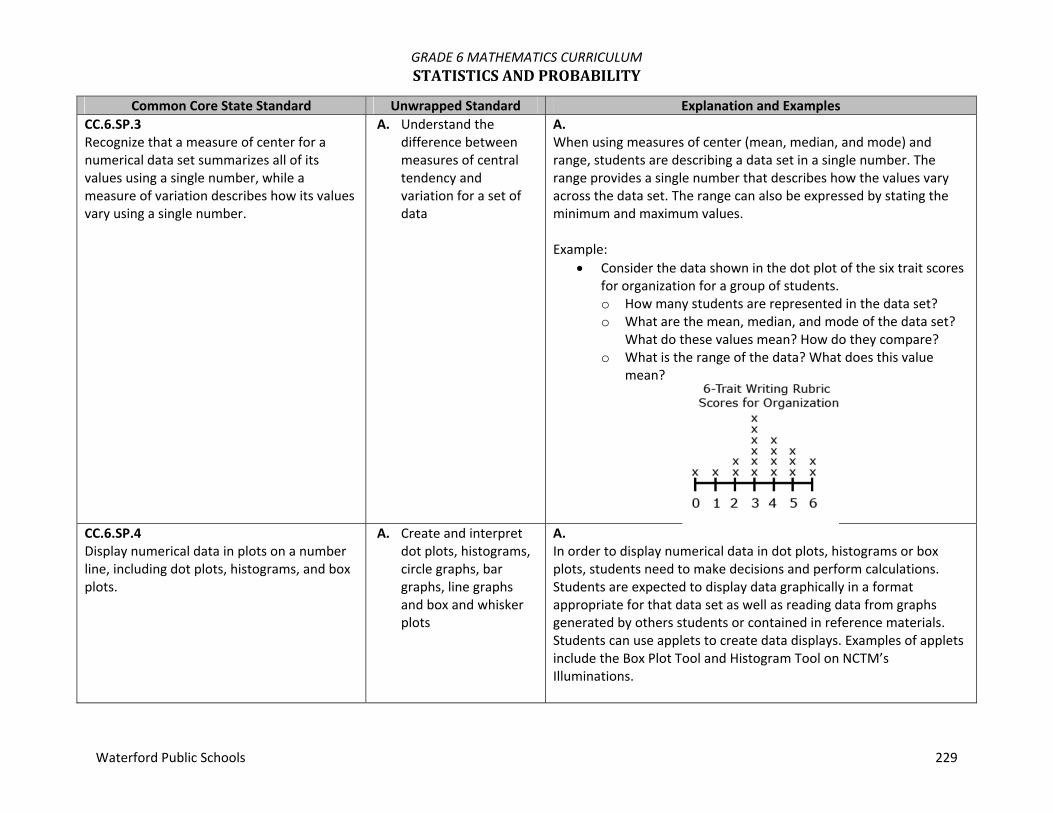
GRADE 6 MATHEMATICS CURRICULUM STATISTICSANDPROBABILITY
Waterford Public Schools 229
Common Core State Standard Unwrapped Standard Explanation and Examples CC.6.SP.3 Recognize that a measure of center for a numerical data set summarizes all of its values using a single number, while a measure of variation describes how its values vary using a single number.
A. Understand the difference between measures of central tendency and variation for a set of data
A. When using measures of center (mean, median, and mode) and range, students are describing a data set in a single number. The range provides a single number that describes how the values vary across the data set. The range can also be expressed by stating the minimum and maximum values. Example:
Consider the data shown in the dot plot of the six trait scores for organization for a group of students. o How many students are represented in the data set? o What are the mean, median, and mode of the data set?
What do these values mean? How do they compare? o What is the range of the data? What does this value
mean?
CC.6.SP.4 Display numerical data in plots on a number line, including dot plots, histograms, and box plots.
A. Create and interpret dot plots, histograms, circle graphs, bar graphs, line graphs and box and whisker plots
A. In order to display numerical data in dot plots, histograms or box plots, students need to make decisions and perform calculations. Students are expected to display data graphically in a format appropriate for that data set as well as reading data from graphs generated by others students or contained in reference materials. Students can use applets to create data displays. Examples of applets include the Box Plot Tool and Histogram Tool on NCTM’s Illuminations.

GRADE 6 MATHEMATICS CURRICULUM STATISTICSANDPROBABILITY
Waterford Public Schools 230
Common Core State Standard Unwrapped Standard Explanation and Examples Box Plot Tool: http://illuminations.nctm.org/ActivityDetail.aspx?ID=77 Histogram Tool: http://illuminations.nctm.org/ActivityDetail.aspx?ID=78 Dot plots are simple plots on a number line where each dot represents a piece of data in the data set. Dot plots are suitable for small to moderate size data sets and are useful for highlighting the distribution of the data including clusters, gaps, and outliers. In most real data sets, there is a large amount of data and many numbers will be unique. A graph (such as a dot plot) that shows how many ones, how many twos, etc. would not be meaningful; however, a histogram can be used. Students organize the data into convenient ranges and use these intervals to generate a frequency table and histogram. Note that changing the size of the range changes the appearance of the graph and the conclusions you may draw from it. Box plots are another useful way to display data and are plotted horizontally or vertically on a number line. Box plots are generated from the five number summary of a data set consisting of the minimum, maximum, median, and two quartile values. Students can readily compare two sets of data if they are displayed with side by side box plots on the same scale. Box plots display the degree of spread of the data and the skewness of the data. Examples: Nineteen students completed a writing sample that was scored
using the six traits rubric. The scores for the trait of organization were 0, 1, 2, 2, 3, 3, 3, 3, 3, 3, 4, 4, 4, 4, 5, 5, 5, 6, 6. Create a data display. What are some observations that can be made from the data display?
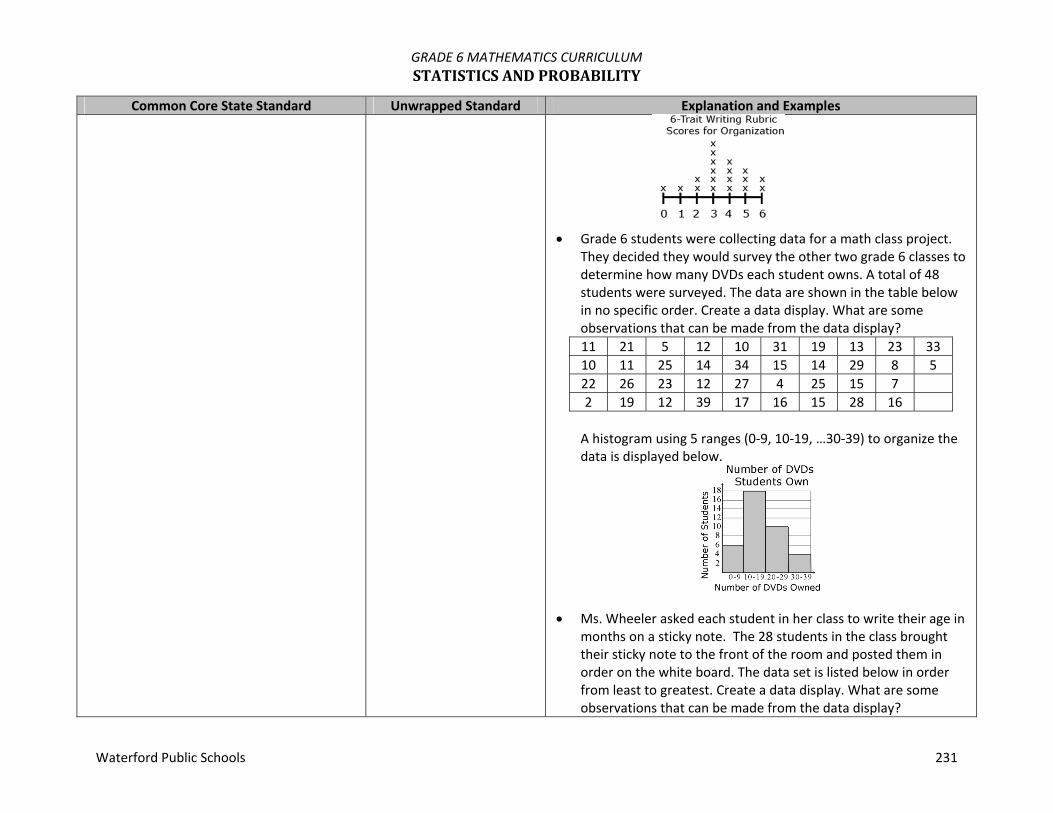
GRADE 6 MATHEMATICS CURRICULUM STATISTICSANDPROBABILITY
Waterford Public Schools 231
Common Core State Standard Unwrapped Standard Explanation and Examples
Grade 6 students were collecting data for a math class project.
They decided they would survey the other two grade 6 classes to determine how many DVDs each student owns. A total of 48 students were surveyed. The data are shown in the table below in no specific order. Create a data display. What are some observations that can be made from the data display? 11 21 5 12 10 31 19 13 23 33 10 11 25 14 34 15 14 29 8 5 22 26 23 12 27 4 25 15 7 2 19 12 39 17 16 15 28 16
A histogram using 5 ranges (0‐9, 10‐19, …30‐39) to organize the data is displayed below.
Ms. Wheeler asked each student in her class to write their age in
months on a sticky note. The 28 students in the class brought their sticky note to the front of the room and posted them in order on the white board. The data set is listed below in order from least to greatest. Create a data display. What are some observations that can be made from the data display?

GRADE 6 MATHEMATICS CURRICULUM STATISTICSANDPROBABILITY
Waterford Public Schools 232
Common Core State Standard Unwrapped Standard Explanation and Examples
130 130 131 131 132 132 132 133 134 136 137 137 138 139 139 139 140 141 142 142 142 143 143 144 145 147 149 150
Five number summary Minimum – 130 months Quartile 1 (Q1) – (132 + 133) ÷ 2 = 132.5 months Median (Q2) – 139 months Quartile 3 (Q3) – (142 + 143) ÷ 2 = 142.5 months Maximum – 150 months
This box plot shows that ¼ of the students in the class are from 130 to 132.5 months old ¼ of the students in the class are from 142.5 months to 150
months old ½ of the class are from 132.5 to 142.5 months old the median class age is 139 months.
CC.6.SP.5 Summarize and describe distributions. Summarize numerical data sets in relation to their context, such as by: CC.6.SP.5a Reporting the number of observations.
A. Summarize and describe distributions
B. Summarize numerical data sets in relation to their context
A. – B. Students summarize numerical data by providing background information about the attribute being measured, methods and unit of measurement, the context of data collection activities, the number of observations, and summary statistics. Summary statistics include quantitative measures of center, spread, and variability including extreme values (minimum and maximum), mean, median, mode,

GRADE 6 MATHEMATICS CURRICULUM STATISTICSANDPROBABILITY
Waterford Public Schools 233
Common Core State Standard Unwrapped Standard Explanation and Examples CC.6.SP.5 b Describing the nature of the attribute under investigation, including how it was measured and its units of measurement. CC.6.SP.5c Giving quantitative measures of center (median and/or mean) and variability (interquartile range and/or mean absolute deviation), as well as describing any overall pattern and any striking deviations from the overall pattern with reference to the context in which the data was gathered. CC.6.SP.5d Relating the choice of measures of center and variability to the shape of the data distribution and the context in which the data was gathered.
range, quartiles, interquartile ranges, and mean absolute deviation. The measure of center that a student chooses to describe a data set will depend upon the shape of the data distribution and context of data collection. The mode is the value in the data set that occurs most frequently. The mode is the least frequently used as a measure of center because data sets may not have a mode, may have more than one mode, or the mode may not be descriptive of the data set. The mean is a very common measure of center computed by adding all the numbers in the set and dividing by the number of values. The mean can be affected greatly by a few data points that are very low or very high. In this case, the median or middle value of the data set might be more descriptive. In data sets that are symmetrically distributed, the mean and median will be very close to the same. In data sets that are skewed, the mean and median will be different, with the median frequently providing a better overall description of the data set. Understanding the Mean The mean measures center in the sense that it is the value that each data point would take on if the total of the data values were redistributed equally, and also in the sense that it is a balance point. Students develop understanding of what the mean represents by redistributing data sets to be level or fair. The leveling process can be connected to and used to develop understanding of the computation of the mean. For example, students could generate a data set by measuring the number of jumping jacks they can perform in 5 seconds, the length of their feet to the nearest inch, or the number of letters in their names. It is best if the data generated for this activity are 5 to 10 data points which are whole numbers between 1 and 10 that are easy to model with counters or stacking cubes. Students generate a data set by drawing eight student names at

GRADE 6 MATHEMATICS CURRICULUM STATISTICSANDPROBABILITY
Waterford Public Schools 234
Common Core State Standard Unwrapped Standard Explanation and Examples random from the popsicle stick cup. The number of letters in each of the names is used to create the data set. If the names drawn were Carol, Mike, Maria, Luis, Monique, Sierra, John, and Karen there would be 3 names with 4 letters each, 3 names with 5 letters each, 1 name with 6 letters and 1 name with 7 letters. This data set could be represented with stacking cubes. Students can model the mean by “leveling” the stacks or distributing the blocks so the stacks are “fair”. Students are seeking to answer the question “If all of the students had the same number of letters in their name, how many letters would each person have?” One block from the stack of six and two blocks from the stack of 7 can be moved down to the stacks of 4 and then all the stacks have five blocks. If all students had the same number of letters in their name, they would have five letters. The mean number of letters in a name in this data set is 5.

GRADE 6 MATHEMATICS CURRICULUM STATISTICSANDPROBABILITY
Waterford Public Schools 235
Common Core State Standard Unwrapped Standard Explanation and Examples If it was not possible to make the stacks exactly even, students could begin to consider what part of the extra blocks each stack would have. Understanding Mean Absolute Deviation The use of mean absolute deviation in 6th grade is mainly exploratory. The intent is to build a deeper understanding of variability. Students would understand the mean distance between the pieces of data and the mean of the data set expresses the spread of the data set. Students can see that the larger the mean distance, the greater the variability. Comparisons can be made between different data sets. In the previous data set, the names drawn were Carol, Mike, Maria, Luis, Monique, Sierra, John, and Karen. There were 3 names with 4 letters each, 3 names with 5 letters each, 1 name with 6 letters and 1 name with 7 letters. This data can be represented on a dot plot. The mean of the data set is 5. To find the mean absolute deviation, students examine each of the data points and its difference from the mean. This analysis can be represented on the dot plot itself or in a table. Each of the names with 4 letters has one fewer letter than the mean, each of the names with 5 letters has zero difference in letters as compared to the mean, each of the names with 6 letters has one more letter than the mean, and each of the names with 7 letters has two more letters than the
3 4 5 6 7 8

GRADE 6 MATHEMATICS CURRICULUM STATISTICSANDPROBABILITY
Waterford Public Schools 236
Common Core State Standard Unwrapped Standard Explanation and Examples mean. The absolute deviations are the absolute value of each difference.
Name Number of letters in a name
Deviation from
the Mean
Absolute Deviation
from the Mean John 4 ‐1 1 Luis 4 ‐1 1 Mike 4 ‐1 1 Carol 5 0 0 Maria 5 0 0 Karen 5 0 0 Sierra 6 +1 1 Monique 7 +2 2 Total 40 0 6
The mean of the absolute deviations is found by summing the absolute deviations and dividing by the number of data points. In this case, the mean absolute deviation would be 6 ÷ 8 or ¾ or 0.75. The mean absolute deviation is a small number, indicating that there is little variability in the data set.
3 4 5 6 7 8
‐1
‐1
‐1
0
0
0
+1 +2
Deviations from the mean
3 4 5 6 7 8
1
1
1
0
0
0
1 2
Absolute Deviations

GRADE 6 MATHEMATICS CURRICULUM STATISTICSANDPROBABILITY
Waterford Public Schools 237
Common Core State Standard Unwrapped Standard Explanation and Examples Consider a different data set also containing 8 names. If the names were Sue, Joe, Jim, Amy, Sabrina, Monique, Timothy, and Adelita. Summarize the data set and its variability. How does this compare to the first data set?
The mean of this data set is still 5. 5840
8)7773333(
Name Number of
letters in a name
Deviation from
the Mean
Absolute Deviation
from the Mean Sue 3 ‐2 2 Joe 3 ‐2 2 Jim 3 ‐2 2 Amy 3 ‐2 2 Sabrina 7 +2 2 Timothy 7 +2 2 Adelita 7 +2 2 Monique 7 +2 2 Total 40 0 16
The mean deviation of this data set is 16 ÷ 8 or 2. Although the mean is the same, there is much more variability in this data set. Understanding Medians and Quartiles Students can also summarize and describe the center and variability in data sets using the median and a five number summary consisting of the minimum, quartiles, and maximum as seen in the box plot example in 6.SP.4. The median is the middle number of the data set with half the number below the median and half the numbers above the median. The quartiles partition the data set into four parts by dividing each of the halves of the data set into half again. Quartile 1 (Q1 or the lower quartile) is the middle value of the lower half of the

GRADE 6 MATHEMATICS CURRICULUM STATISTICSANDPROBABILITY
Waterford Public Schools 238
Common Core State Standard Unwrapped Standard Explanation and Examples data set and quartile 3 (Q3 or the upper quartile) is the middle value of the upper half of the data set. The median can also be referred to as quartile 2 (Q2). The range of the data is the difference between the minimum and maximum values. The interquartile range of the data is the difference between the lower and upper quartiles (Q3 – Q1). The interquartile range is a measure of the dispersion or spread of the data set: a small value indicates values that are clustered near the median whereas a larger value indicates values that are more distributed. Consider the first data set again. Recall that the names drawn were Carol, Mike, Maria, Luis, Monique, Sierra, John, and Karen. The data set can be represented in a numerical list. To find the median and quartile, the values are placed in order from least to greatest.
5 4 5 4 7 6 4 5 4 4 4 5 5 5 6 7 The middle value in the ordered data set is the median. If there are an even number of values, the median is the mean of the middle two values. In this case, the median would be 5 because 5 is the average of the 4th and 5th values which are both 5. Students find quartile 1 (Q1) by examining the lower half of the data. Again there are 4 values which is an even number of values. Q1 would be the average of the 2nd and 3rd value in the data set or 4. Students find quartile 3 (Q3) by examining the upper half of the data. Q3 would be the average of the 6th and 7th value in the data set or 5.5. The mean of the data set was 5 and the median is also 5, showing that the values are probably clustered close to the mean. The interquartile range is 1.5 (5.5 – 4). The interquartile range is small, showing little variability in the data.
Median = 5Q1 = 4 Q3 = 5.5
4 4 4 5 5 5 6 7

GRADE 6 MATHEMATICS CURRICULUM PACINGGUIDE
Waterford Public Schools 239
Common Core Standard – Unit 1st Trimester 2nd Trimester 3rd Trimester Ratios and Proportional Relationships Relate rates, ratios and percentages to each other X X Create tables of equivalent ratios X X Find missing values with tables of equivalent ratios X X Plot pairs of values on a coordinate plane X X X Use tables to compare ratios X X Understand and describe what a ratio is X Know the three ways to notate ratios X Use ratios to compare quantities X Use unit rates and proportions to solve problems X Understand what percent means X Be able to plot ordered pairs in all four quadrants of a coordinate plane X X X Be able to graph points in all four quadrants of a coordinate plane X Solve problems involving percent
Percentage of a number The percentage one number is of another number The percentage of a missing amount Percentage increase/ decrease
X
Use ratios to convert various measurements (customary, metric, time, mass, capacity SCIENCE Understand how to transform units when multiplying or dividing quantity SCIENCE Number System (NS‐1 through NS‐8) Know how to find a GCF for any two numbers less than or equal to 100 X Know how to find the LCM for any two numbers less than or equal to 12 X Be able to plot ordered pairs in all four quadrants of a coordinate plane X X X Be able to graph points in all four quadrants of a coordinate plane X Use long division to solve problems X Use estimation to do long division X Be able to add, subtract, multiply and divide decimals X Compute quotients of fractions X Understand what a reciprocal is X Solve word problems using division of fractions X Understand how to use distributive property to express whole number sums X

GRADE 6 MATHEMATICS CURRICULUM PACINGGUIDE
Waterford Public Schools 240
Common Core Standard – Unit 1st Trimester 2nd Trimester 3rd Trimester Be able to plot ordered pairs in all four quadrants of a coordinate plane X X X Understand how ordered pairs are related as reflections on the coordinate plane X Compare and order rational numbers and common irrational numbers on a number line X Understand and interpret inequalities with rational numbers and common irrational numbers on a number line X
Write, interpret, and explain statements of order for rational numbers in real‐world contexts X Understand the meaning of absolute value X Interpret absolute value in real‐world situations X Distinguish comparisons of absolute value from statements about order X Understand how absolute value and distances are related on the coordinate graph X Interpret absolute value in real‐world situations X Distinguish comparisons of absolute value from statements about order X Understand how absolute value and distances are related on the coordinate graph X Expressions and Equations (EE‐1 through EE‐9) Understand what exponents mean ADVANCED REGULAR Understand the following terms: sum, term, difference, product, factor, quotient, coefficient X Understand what statistics are about X Understand the difference between measures of central tendency and variation for a set of data X Create and interpret dot plots, histograms, circle graphs, bar graphs, line graphs and box and whisker plots X Summarize and describe distributions X Summarize numerical data sets in relation to their context X Solve one‐step algebraic equations or inequalities X X Use variables to represent numbers X X Understand the difference between dependent and independent variables SCIENCE Analyze the relationship between dependent and independent variable on a graph SCIENCE Geometry (G1 through G‐4) Be able to find areas of various polygons X X Solve real‐world problems by finding areas X X Find volumes of rectangular prisms with a formula, even with fractional edge lengths X X Use unit cubes to show an understanding of volumes of rectangular prisms X X Solve real world problems using volume X X Draw polygons in a coordinate plane and measure distances of vertical or horizontal sides X X

GRADE 6 MATHEMATICS CURRICULUM PACINGGUIDE
Waterford Public Schools 241
Common Core Standard – Unit 1st Trimester 2nd Trimester 3rd Trimester Be able to find areas of various polygons X X Solve real‐world problems by finding areas X X Find volumes of rectangular prisms with a formula, even with fractional edge lengths X X Use unit cubes to show an understanding of volumes of rectangular prisms X X Solve real world problems using volume X X Draw polygons in a coordinate plane and measure distances of vertical or horizontal sides X X Statistics and Probability (SP‐1 through SP‐5) Understand what statistics are about X Understand the difference between measures of central tendency and variation for a set of data X Create and interpret dot plots, histograms, circle graphs, bar graphs, line graphs and box and whisker plots X Summarize and describe distributions X Summarize numerical data sets in relation to their context X Interpret a data set using statistical tools (mean, median mode, range) SCIENCE

GRADE 7 MATHEMATICS CURRICULUM OVERVIEW
Waterford Public Schools 242
RatioandProportionalRelationships Students will extend their understanding of ratios and develop understanding of proportionality to solve single‐ and multi‐step
problems. Students will use their understanding of ratios and proportionality to solve a wide variety of percent problems, including those involving discounts, interest, taxes, tips, and percent increase or decrease. Students will solve problems about similar objects (including geometric figures) by using scale factors that relate corresponding lengths between the objects or by using the fact that relationships of lengths within an object are preserved in similar objects. Students will graph proportional relationships and understand the unit rate informally as a measure of the steepness of the related line, called the slope.
OperationswithRationalNumbers
Students will develop a unified understanding of number, recognizing fractions, decimals, and percents as different representations of rational numbers. Students will extend addition, subtraction, multiplication, and division and their properties to all rational numbers, including integers and numbers represented by complex fractions and negative fractions. By applying the laws of arithmetic, and by viewing negative numbers in terms of everyday contexts (e.g., amounts owed or temperatures below zero), students will explain why the rules for adding, subtracting, multiplying, and dividing with negative numbers make sense.
LinearExpressionsandEquations
Students will use the arithmetic of rational numbers as they formulate and solve linear equations in one variable and use these equations to solve problems.
Geometry
Students will use ideas about distance and angles, how they behave under dilations, translations, rotations and reflections, and ideas about congruence and similarity to describe and analyze figures and situations in two‐ and three‐dimensional space and to solve problems, including multi‐step problems. Students will see the plausibility of the formulas for the circumference and area of a circle.
StatisticsandProbability
Students will build on their previous work with single data distributions to compare two data distributions and address questions about differences between populations. They will begin informal work with random sampling to generate data sets and learn about the importance of representative samples for drawing inferences.
Assessments:
Teacher‐Created C.F.A.’s and Benchmarks Resources:
Math Connects by McGraw‐Hill
GRADE 7 MATHEMATICS CURRICULUM RATIOANDPROPORTIONALRELATIONSHIPS
Waterford Public Schools 243
What is a Ratio? Proportion? Unit rate? What is a scale factor?
How are proportions related to linear equations? How is slope related to a proportional constant?
Common Core State Standard Unwrapped Standard Explanation and Examples
CC.7.RP.1 Compute unit rates associated with ratios of fractions, including ratios of lengths, areas and other quantities measured in like or different units. For example, If a person walks 1/2 mile in each 1/4 hour, compute the unit rate as the complex fraction (1/2)/(1/4) miles per hour, equivalently 2 miles per hour.
A. Compute unit rates associated with ratios of fraction or decimals
B. Solve practical problems involving rates, ratios, percentages and proportionality
CC.7.RP.2 Analyze proportional relationships and use them to solve real‐world and mathematical problems. Recognize and represent proportional relationships between quantities.
A. Determine whether a proportion exists between two ratios
B. Identify constants of proportionality
C. Represent proportional relationships by equations
D. Explain what a point (x, y) on the graph of a proportional relationship means
E. Write and solve problems involving proportional relationships using linear equations
A. – F. Students may use a content web site and/or interactive white board to create tables and graphs of proportional or non‐proportional relationships. Graphing proportional relationships represented in a table helps students recognize that the graph is a line through the origin (0,0) with a constant of proportionality equal to the slope of the line. Examples: A student is making trail mix. Create a graph to determine if
the quantities of nuts and fruit are proportional for each serving size listed in the table. If the quantities are proportional, what is the constant of proportionality or unit rate that defines the relationship? Explain how you determined the constant of proportionality and how it relates to both the table and graph.

GRADE 7 MATHEMATICS CURRICULUM RATIOANDPROPORTIONALRELATIONSHIPS
Waterford Public Schools 244
Common Core State Standard Unwrapped Standard Explanation and Examples F. Determine the
constant rate of change in a linear relationship and recognize this as the slope of a line
The relationship is proportional. For each of the other serving sizes there are 2 cups of fruit for every 1 cup of nuts (2:1). The constant of proportionality is shown in the first column of the table and by the slope of the line on the graph.
The graph below represents the cost of gum packs as a unit
rate of $2 dollars for every pack of gum. The unit rate is represented as $2/pack. Represent the relationship using a table and an equation.
Serving Size 1 2 3 4 Cups of Nuts (x) 1 2 3 4 Cups of Fruit (y) 2 4 6 8
CC.7.RP.2a Decide whether two quantities are in a proportional relationship, e.g., by testing for equivalent ratios in a table or graphing on a coordinate plane and observing whether the graph is a straight line through the origin.
CC.7.RP.2b Identify the constant of proportionality (unit rate) in tables, graphs, equations, diagrams, and verbal descriptions of proportional relationships.

GRADE 7 MATHEMATICS CURRICULUM RATIOANDPROPORTIONALRELATIONSHIPS
Waterford Public Schools 245
Common Core State Standard Unwrapped Standard Explanation and Examples CC.7.RP.2c Represent proportional relationships by equations. For example, if total cost t is proportional to the number n of items purchased at a constant price p, the relationship between the total cost and the number of items can be expressed as t = pn.
Table: Number of Packs of Gum (g)
Cost in Dollars (d)
0 0 1 2 2 4 3 6 4 8
Equation: d = 2g, where d is the cost in dollars and g is the packs of gum A common error is to reverse the position of the variables when writing equations. Students may find it useful to use variables specifically related to the quantities rather than using x and y. Constructing verbal models can also be helpful. A student might describe the situation as “the number of packs of gum times the cost for each pack is the total cost in dollars”. They can use this verbal model to construct the equation. Students can check their equation by substituting values and comparing their results to the table. The checking process helps student revise and recheck their model as necessary. The number of packs of gum times the cost for each pack is the total cost (g x 2 = d).
CC.7.RP.2d Explain what a point (x, y) on the graph of a proportional relationship means in terms of the situation, with special attention to the points (0, 0) and (1, r) where r is the unit rate.

GRADE 7 MATHEMATICS CURRICULUM RATIOANDPROPORTIONALRELATIONSHIPS
Waterford Public Schools 246
Common Core State Standard Unwrapped Standard Explanation and Examples CC.7.RP.3 Use proportional relationships to solve multistep ratio and percent problems. Examples: simple interest, tax, markups and markdowns, gratuities and commissions, fees, percent increase and decrease, percent error.
A. Use proportional relationships to solve multistep ratio and percent problems, including the idea of scale factor
A. Students should be able to explain or show their work using a representation (numbers, words, pictures, physical objects, or equations) and verify that their answer is reasonable. Models help students to identify the parts of the problem and how the values are related. For percent increase and decrease, students identify the starting value, determine the difference, and compare the difference in the two values to the starting value. Examples: Gas prices are projected to increase 124% by April 2015. A
gallon of gas currently costs $4.17. What is the projected cost of a gallon of gas for April 2015?
A student might say: “The original cost of a gallon of gas is $4.17. An increase of 100% means that the cost will double. I will also need to add another 24% to figure out the final projected cost of a gallon of gas. Since 25% of $4.17 is about $1.04, the projected cost of a gallon of gas should be around $9.40.”
$4.17 + 4.17 + (0.24 4.17) = 2.24 x 4.17
A sweater is marked down 33%. Its original price was $37.50.
What is the price of the sweater before sales tax?
100%
$4.17
100%
$4.17
24%
?
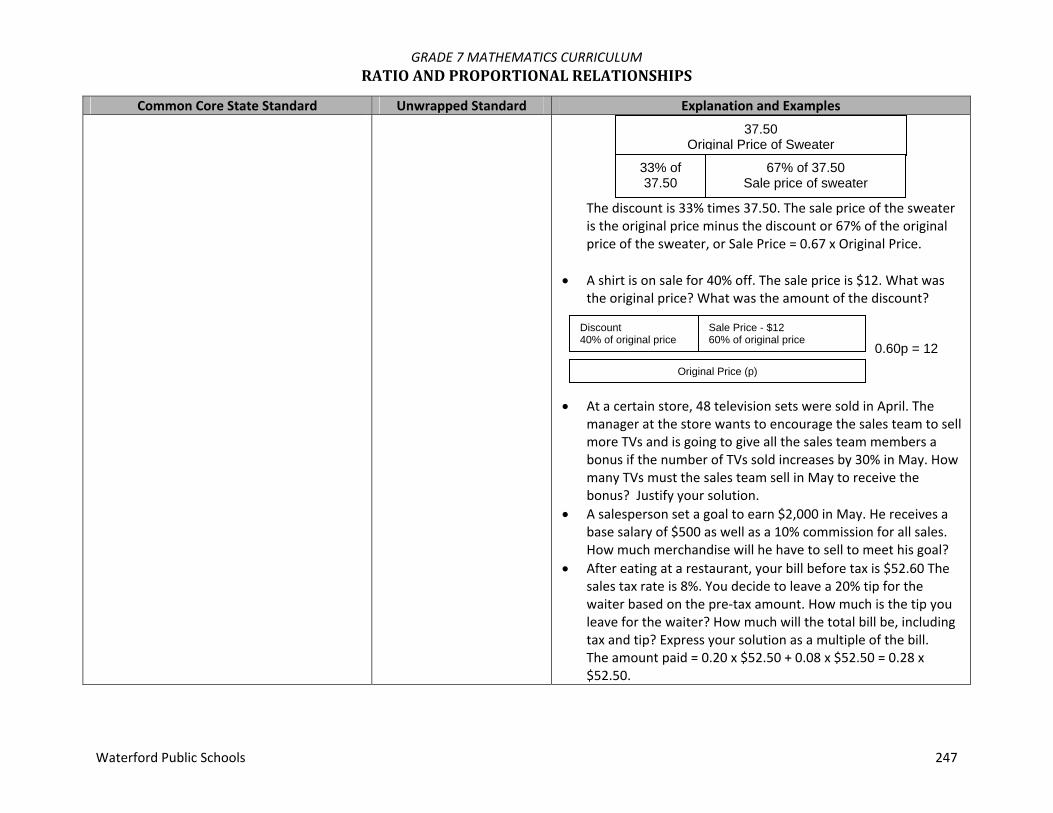
GRADE 7 MATHEMATICS CURRICULUM RATIOANDPROPORTIONALRELATIONSHIPS
Waterford Public Schools 247
Common Core State Standard Unwrapped Standard Explanation and Examples
The discount is 33% times 37.50. The sale price of the sweater is the original price minus the discount or 67% of the original price of the sweater, or Sale Price = 0.67 x Original Price.
A shirt is on sale for 40% off. The sale price is $12. What was
the original price? What was the amount of the discount?
At a certain store, 48 television sets were sold in April. The
manager at the store wants to encourage the sales team to sell more TVs and is going to give all the sales team members a bonus if the number of TVs sold increases by 30% in May. How many TVs must the sales team sell in May to receive the bonus? Justify your solution.
A salesperson set a goal to earn $2,000 in May. He receives a base salary of $500 as well as a 10% commission for all sales. How much merchandise will he have to sell to meet his goal?
After eating at a restaurant, your bill before tax is $52.60 The sales tax rate is 8%. You decide to leave a 20% tip for the waiter based on the pre‐tax amount. How much is the tip you leave for the waiter? How much will the total bill be, including tax and tip? Express your solution as a multiple of the bill. The amount paid = 0.20 x $52.50 + 0.08 x $52.50 = 0.28 x $52.50.
37.50 Original Price of Sweater
33% of 37.50
67% of 37.50 Sale price of sweater
Discount 40% of original price
Sale Price - $12 60% of original price
0.60p = 12Original Price (p)
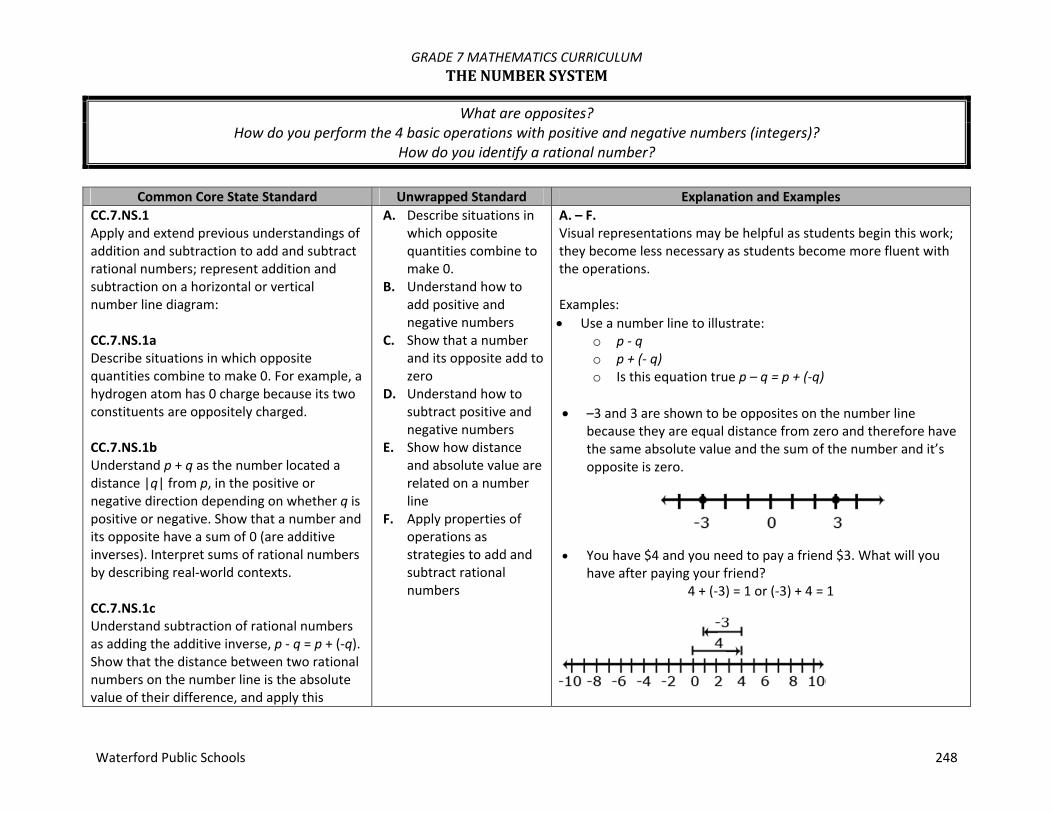
GRADE 7 MATHEMATICS CURRICULUM THENUMBERSYSTEM
Waterford Public Schools 248
What are opposites? How do you perform the 4 basic operations with positive and negative numbers (integers)?
How do you identify a rational number?
Common Core State Standard Unwrapped Standard Explanation and Examples
CC.7.NS.1 Apply and extend previous understandings of addition and subtraction to add and subtract rational numbers; represent addition and subtraction on a horizontal or vertical number line diagram: CC.7.NS.1a Describe situations in which opposite quantities combine to make 0. For example, a hydrogen atom has 0 charge because its two constituents are oppositely charged. CC.7.NS.1b Understand p + q as the number located a distance |q| from p, in the positive or negative direction depending on whether q is positive or negative. Show that a number and its opposite have a sum of 0 (are additive inverses). Interpret sums of rational numbers by describing real‐world contexts. CC.7.NS.1c Understand subtraction of rational numbers as adding the additive inverse, p ‐ q = p + (‐q). Show that the distance between two rational numbers on the number line is the absolute value of their difference, and apply this
A. Describe situations in which opposite quantities combine to make 0.
B. Understand how to add positive and negative numbers
C. Show that a number and its opposite add to zero
D. Understand how to subtract positive and negative numbers
E. Show how distance and absolute value are related on a number line
F. Apply properties of operations as strategies to add and subtract rational numbers
A. – F. Visual representations may be helpful as students begin this work; they become less necessary as students become more fluent with the operations. Examples: Use a number line to illustrate:
o p ‐ q o p + (‐ q) o Is this equation true p – q = p + (‐q)
–3 and 3 are shown to be opposites on the number line
because they are equal distance from zero and therefore have the same absolute value and the sum of the number and it’s opposite is zero.
You have $4 and you need to pay a friend $3. What will you have after paying your friend?
4 + (‐3) = 1 or (‐3) + 4 = 1

GRADE 7 MATHEMATICS CURRICULUM THENUMBERSYSTEM
Waterford Public Schools 249
Common Core State Standard Unwrapped Standard Explanation and Examples principle in real‐world contexts. CC.7.NS.1d Apply properties of operations as strategies to add and subtract rational numbers. CC.7.NS.2 Apply and extend previous understandings of multiplication and division of fractions to multiply and divide rational numbers. CC.7.NS.2a Understand that multiplication is extended from fractions to rational numbers by requiring that operations continue to satisfy the properties of operations, particularly the distributive property, leading to products such as (‐1)(‐1) = 1 and the rules for multiplying signed numbers. Interpret products of rational numbers by describing real‐world contexts. CC.7.NS.2b Understand that integers can be divided, provided that the divisor is not zero, and every quotient of integers (with non‐zero divisor) is a rational number. If p and q are integers then –(p/q) = (–p)/q = p/(–q). Interpret quotients of rational numbers by describing real‐world contexts. CC.7.NS.2c Apply properties of operations as strategies to multiply and divide rational numbers.
A. Know how to multiply signed numbers
B. Know how to divide signed numbers
C. Know how to multiply and divide rational numbers
D. Know what a rational number is
E. Know how to convert rational numbers to decimals and fractions
F. Know how to identify a rational number
A. – F. Multiplication and division of integers is an extension of multiplication and division of whole numbers. Examples:
Examine the family of equations. What patterns do you see? Create a model and context for each of the products. Write and model the family of equations related to 3 x 4 = 12.
Equation Number Line Model Context
2 x 3 = 6
Selling two packages of apples at $3.00 per pack
2 x ‐3 = ‐6
Spending 3 dollars each on 2 packages of apples
‐2 x 3 = ‐6
Owing 2 dollars to each of your three friends

GRADE 7 MATHEMATICS CURRICULUM THENUMBERSYSTEM
Waterford Public Schools 250
Common Core State Standard Unwrapped Standard Explanation and Examples CC.7.NS.2d Convert a rational number to a decimal using long division; know that the decimal form of a rational number terminates in 0s or eventually repeats.
‐2 x ‐3 = 6
Forgiving 3 debts of $2.00 each
CC.7.NS.3 Solve real‐world and mathematical problems involving the four operations with rational numbers. (Computations with rational numbers extend the rules for manipulating fractions to complex fractions.)
A. Solve real‐world and mathematical problems involving the four operations with rational numbers
A. Examples: Your cell phone bill is automatically deducting $32 from your
bank account every month. How much will the deductions total for the year?
‐32 + ‐32 + ‐32 + ‐32 + ‐32 + ‐32 + ‐32 + ‐32 + ‐32 + ‐32 + ‐32 + ‐32 = 12 (‐32)
It took a submarine 20 seconds to drop to 100 feet below sea
level from the surface. What was the rate of the descent?
ft/sec -5second 1
feet 5seconds 20
feet 100

GRADE 7 MATHEMATICS CURRICULUM EXPRESSIONSANDEQUATIONS
Waterford Public Schools 251
How do you simplify algebraic expressions? What is an inequality?
How do you solve one‐ and two‐step equations AND inequalities?
Common Core State Standard Unwrapped Standard Explanation and Examples
CC.7.EE.1 Apply properties of operations as strategies to add, subtract, factor, and expand linear expressions with rational coefficients.
A. Know how to simplify algebraic expressions
A. Examples: Write an equivalent expression for 253 x .
Suzanne thinks the two expressions aa 4232 and 210 a are equivalent? Is she correct? Explain why or why
not? Write equivalent expressions for: 123 a .
Possible solutions might include factoring as in )4(3 a , or other expressions such as 572 aa .
A rectangle is twice as long as wide. One way to write an expression to find the perimeter would be wwww 22 . Write the expression in two other ways. Solution: w6 OR )2(2)(2 ww .
An equilateral triangle has a perimeter of 156 x . What is the
length of each of the sides of the triangle? Solution: )52(3 x , therefore each side is 52 x units long.

GRADE 7 MATHEMATICS CURRICULUM EXPRESSIONSANDEQUATIONS
Waterford Public Schools 252
Common Core State Standard Unwrapped Standard Explanation and Examples CC.7.EE.2 Understand that rewriting an expression in different forms in a problem context can shed light on the problem and how the quantities in it are related. For example, a + 0.05a = 1.05a means that “increase by 5%” is the same as “multiply by 1.05.”
A. Understand how to combine like terms
B. Write expressions, formulas, equations or inequalities using variables to represent mathematical relationships and solve problems
C. Analyze a variety of patterns and generalize with algebraic expressions, formulas or equations
A. – C. Examples: Jamie and Ted both get paid an equal hourly wage of $9 per
hour. This week, Ted made an additional $27 dollars in overtime. Write an expression that represents the weekly wages of both if J = the number of hours that Jamie worked this week and T = the number of hours Ted worked this week? Can you write the expression in another way?
Students may create several different expressions depending upon how they group the quantities in the problem. One student might say: To find the total wage, I would first multiply the number of hours Jamie worked by 9. Then I would multiply the number of hours Ted worked by 9. I would add these two values with the $27 overtime to find the total wages for the week. The student would write the expression
2799 TJ . Another student might say: To find the total wages, I would add the number of hours that Ted and Jamie worked. I would multiply the total number of hours worked by 9. I would then add the overtime to that value to get the total wages for the week. The student would write the expression 27)(9 TJ A third student might say: To find the total wages, I would need to figure out how much Jamie made and add that to how much Ted made for the week. To figure out Jamie’s wages, I would multiply the number of hours she worked by 9. To figure out Ted’s wages, I would multiply the number of hours he worked by 9 and then add the $27 he earned in overtime. My final step would be to add Jamie and Ted wages for the week to find their combined total wages. The student would write

GRADE 7 MATHEMATICS CURRICULUM EXPRESSIONSANDEQUATIONS
Waterford Public Schools 253
Common Core State Standard Unwrapped Standard Explanation and Examples the expression )279()9( TJ
Given a square pool as shown in the picture, write four
different expressions to find the total number of tiles in the border. Explain how each of the expressions relates to the diagram and demonstrate that the expressions are equivalent. Which expression do you think is most useful? Explain your thinking.
CC.7.EE.3 Solve multi‐step real‐life and mathematical problems posed with positive and negative rational numbers in any form (whole numbers, fractions, and decimals), using tools strategically. Apply properties of operations as strategies to calculate with numbers in any form; convert between forms as appropriate; and assess the reasonableness of answers using mental computation and estimation strategies. For example: If a woman making $25 an hour gets a 10% raise, she will make an additional 1/10 of her salary an hour, or $2.50, for a new salary of $27.50. If you want to place a towel bar 9 3/4 inches long in the center of a door that is 27 1/2 inches wide, you will need to place the bar about 9 inches from each edge; this estimate can be used as a check on the exact computation.
A. Know how to solve various problems using integers in any form (and be able to convert between forms as needed)
A. Estimation strategies for calculations with fractions and decimals extend from students’ work with whole number operations. Estimation strategies include, but are not limited to: front‐end estimation with adjusting (using the highest place
value and estimating from the front end making adjustments to the estimate by taking into account the remaining amounts),
clustering around an average (when the values are close together an average value is selected and multiplied by the number of values to determine an estimate),
rounding and adjusting (students round down or round up and then adjust their estimate depending on how much the rounding affected the original values),
using friendly or compatible numbers such as factors (students seek to fit numbers together ‐ i.e., rounding to factors and grouping numbers together that have round sums like 100 or 1000), and

GRADE 7 MATHEMATICS CURRICULUM EXPRESSIONSANDEQUATIONS
Waterford Public Schools 254
Common Core State Standard Unwrapped Standard Explanation and Examples using benchmark numbers that are easy to compute (students
select close whole numbers for fractions or decimals to determine an estimate).
Example: The youth group is going on a trip to the state fair. The trip
costs $52. Included in that price is $11 for a concert ticket and the cost of 2 passes, one for the rides and one for the game booths. Each of the passes cost the same price. Write an equation representing the cost of the trip and determine the price of one pass.
2x + 11 = 52 2x = 41 x = $20.5
CC.7.EE.4 Use variables to represent quantities in a real‐world or mathematical problem, and construct simple equations and inequalities to solve problems by reasoning about the quantities CC.7.EE.4a Solve word problems leading to equations of the form px + q = r and p(x + q) = r, where p, q, and r are specific rational numbers. Solve equations of these forms fluently. Compare an algebraic solution to an arithmetic solution, identifying the sequence of the operations used in each approach. For example, The perimeter of a rectangle is 54 cm. Its length is 6 cm. What is its width?
A. Be able to solve two‐step algebraic equations
B. Be able to solve two‐step inequalities and graph the solution
A. – B. Examples: Amie had $26 dollars to spend on school supplies. After buying
10 pens, she had $14.30 left. How much did each pen cost?
The sum of three consecutive even numbers is 48. What is the smallest of these numbers?
Solve: 20545
n
Florencia has at most $60 to spend on clothes. She wants to
buy a pair of jeans for $22 dollars and spend the rest on t‐shirts. Each t‐shirt costs $8. Write an inequality for the number of t‐shirts she can purchase.
Steven has $25 dollars. He spent $10.81, including tax, to buy a
x x 11
52

GRADE 7 MATHEMATICS CURRICULUM EXPRESSIONSANDEQUATIONS
Waterford Public Schools 255
Common Core State Standard Unwrapped Standard Explanation and Examples CC.7.EE.4b Solve word problems leading to inequalities of the form px + q > r or px + q < r, where p, q, and r are specific rational numbers. Graph the solution set of the inequality and interpret it in the context of the problem. For example, As a salesperson, you are paid $50 per week plus $3 per sale. This week you want your pay to be at least $100. Write an inequality for the number of sales you need to make, and describe the solutions.
new DVD. He needs to set aside $10.00 to pay for his lunch next week. If peanuts cost $0.38 per package including tax, what is the maximum number of packages that Steven can buy?
Write an equation or inequality to model the situation. Explain how you determined whether to write an equation or inequality and the properties of the real number system that you used to find a solution.
Solve 2321
x and graph your solution on a number line.

GRADE 7 MATHEMATICS CURRICULUM GEOMETRY
Waterford Public Schools 256
How does similarity between objects relate to scale factor? How do you find areas and perimeters, volumes and surface areas, for various figures?
What do you know about angles?
Common Core State Standard Unwrapped Standard Explanation and Examples
CC.7.G.1 Solve problems involving scale drawings of geometric figures, including computing actual lengths and areas from a scale drawing and reproducing a scale drawing at a different scale.
A. Solve problems involving scale
B. Compare and describe in writing the relationships, including congruence, equality in scale, between the angles, side, perimeters and areas of congruent and similar geometric shapes
C. Determine the effect of scale factors in the perimeter and areas of 2‐D shapes and on the surface area and volumes of 3‐D shapes
A. – C. Example:
Julie showed you the scale drawing of her room. If each 2 cm on the scale drawing equals 5 ft, what are the actual dimensions of Julie’s room? Reproduce the drawing at 3 times its current size.
CC.7.G.2 Draw (freehand, with ruler and protractor, and with technology) geometric shapes with given conditions. Focus on constructing triangles from three measures of angles or sides, noticing when the conditions determine a unique triangle, more than one triangle, or no triangle
A. Draw (freehand, with ruler and protractor, and with technology) geometric shapes with given conditions
B. Identify triangles by angles and sides
C. Classify 2‐D and 3‐D figures based on their
A. – C. Conditions may involve points, line segments, angles, parallelism, congruence, angles, and perpendicularity. Examples: Is it possible to draw a triangle with a 90˚ angle and one leg
that is 4 inches long and one leg that is 3 inches long? If so, draw one. Is there more than one such triangle?

GRADE 7 MATHEMATICS CURRICULUM GEOMETRY
Waterford Public Schools 257
Common Core State Standard Unwrapped Standard Explanation and Examples properties
Draw a triangle with angles that are 60 degrees. Is this a
unique triangle? Why or why not? Draw an isosceles triangle with only one 80 degree angle. Is
this the only possibility or can you draw another triangle that will also meet these conditions?
Can you draw a triangle with sides that are 13 cm, 5 cm and 6cm?
Draw a quadrilateral with one set of parallel sides and no right angles.
CC.7.G.3 Describe the two‐dimensional figures that result from slicing three‐dimensional figures, as in plane sections of right rectangular prisms and right rectangular pyramids.
A. Describe the two‐dimensional figures that result from slicing three‐dimensional figures, as in plane sections of right rectangular prisms and right rectangular pyramids
A. Example:
Using a clay model of a rectangular prism, describe the shapes that are created when planar cuts are made diagonally, perpendicularly, and parallel to the base.
CC.7.G.4 Know the formulas for the area and circumference of a circle and use them to solve problems; give an informal derivation of the relationship between the circumference and area of a circle.
A. Know the formulas for the area and circumference of a circle and use them to solve problems
B. Understand where the formula for a circle’s area and circumference come
A. – D. Examples: The seventh grade class is building a mini golf game for the
school carnival. The end of the putting green will be a circle. If the circle is 10 feet in diameter, how many square feet of grass carpet will they need to buy to cover the circle? How might you communicate this information to the salesperson to make sure you receive a piece of carpet that is the correct size?

GRADE 7 MATHEMATICS CURRICULUM GEOMETRY
Waterford Public Schools 258
Common Core State Standard Unwrapped Standard Explanation and Examples from
C. Recognize the relationships among radius, diameter, circumference and area of circles and develop formulas for finding circumference and area based on these relationships
D. Know the formulas for the area and perimeter of polygons
Students measure the circumference and diameter of several circular objects in the room (clock, trash can, door knob, wheel, etc.). Students organize their information and discover the relationship between circumference and diameter by noticing the pattern in the ratio of the measures. Students write an expression that could be used to find the circumference of a circle with any diameter and check their expression on other circles.
Students will use a circle as a model to make several equal parts as you would in a pie model. The greater number the cuts, the better. The pie pieces are laid out to form a shape similar to a parallelogram. Students will then write an expression for the area of the parallelogram related to the radius (note: the length of the base of the parallelogram is half the circumference, or πr, and the height is r, resulting in an area of πr2. Extension: If students are given the circumference of a circle, could they write a formula to determine the circle’s area or given the area of a circle, could they write the formula for the circumference?

GRADE 7 MATHEMATICS CURRICULUM GEOMETRY
Waterford Public Schools 259
Common Core State Standard Unwrapped Standard Explanation and Examples CC.7.G.5 Use facts about supplementary, complementary, vertical, and adjacent angles in a multi‐step problem to write and solve simple equations for an unknown angle in a figure.
A. Know what supplementary, complementary, vertical and adjacent angles are
B. Solve problems using them
A. – B. Angle relationships that can be explored include but are not limited to: Same‐side (consecutive) interior and same‐side (consecutive)
exterior angles are supplementary.
Examples: Write and solve an equation to find the measure of angle x.
Write and solve an equation to find the measure of angle x.
CC.7.G.6 Solve real‐world and mathematical problems involving area, volume and surface area of two‐ and three‐dimensional objects composed of triangles, quadrilaterals, polygons, cubes, and right prisms.
A. Use area, volume and surface area to solve real world problems
A. Students understanding of volume can be supported by focusing on the area of base times the height to calculate volume. Students understanding of surface area can be supported by focusing on the sum of the area of the faces. Nets can be used to evaluate surface area calculations. Examples: Choose one of the figures shown below and write a step by
step procedure for determining the area. Find another person that chose the same figure as you did. How are your

GRADE 7 MATHEMATICS CURRICULUM GEOMETRY
Waterford Public Schools 260
Common Core State Standard Unwrapped Standard Explanation and Examples procedures the same and different? Do they yield the same result?
A cereal box is a rectangular prism. What is the volume of the
cereal box? What is the surface area of the cereal box? (Hint: Create a net of the cereal box and use the net to calculate the surface area.) Make a poster explaining your work to share with the class.
Find the area of a triangle with a base length of three units and a height of four units.
Find the area of the trapezoid shown below using the formulas for rectangles and triangles.
12
7
3

GRADE 7 MATHEMATICS CURRICULUM STATISTICSANDPROBABILITY
Waterford Public Schools 261
What is statistics? What are measures of central tendency?
What is a random sample? How do you conduct and analyze a probability experiment?
Common Core State Standard Unwrapped Standard Explanation and Examples
CC.7.SP.1 Understand that statistics can be used to gain information about a population by examining a sample of the population; generalizations about a population from a sample are valid only if the sample is representative of that population. Understand that random sampling tends to produce representative samples and support valid inferences.
A. Understand what statistics is
B. Know what a sample is and when it is valid
C. Understand random sampling and its uses
A. – C. Example: The school food service wants to increase the number of
students who eat hot lunch in the cafeteria. The student council has been asked to conduct a survey of the student body to determine the students’ preferences for hot lunch. They have determined two ways to do the survey. The two methods are listed below. Identify the type of sampling used in each survey option. Which survey option should the student council use and why?
1. Write all of the students’ names on cards and pull them out in a draw to determine who will complete the survey.
2. Survey the first 20 students that enter the lunch room. CC.7.SP.2 Use data from a random sample to draw inferences about a population with an unknown characteristic of interest. Generate multiple samples (or simulated samples) of the same size to gauge the variation in estimates or predictions. For example, estimate the mean word length in a book by randomly sampling words from the book; predict the winner of a school election based on randomly sampled survey data. Gauge how far off the estimate or prediction might be.
A. Use data from a random sample to draw inferences about a population
A. Example: Below is the data collected from two random samples of 100
students regarding student’s school lunch preference. Make at least two inferences based on the results.

GRADE 7 MATHEMATICS CURRICULUM STATISTICSANDPROBABILITY
Waterford Public Schools 262
Common Core State Standard Unwrapped Standard Explanation and Examples CC.7.SP.3 Informally assess the degree of visual overlap of two numerical data distributions with similar variabilities, measuring the difference between the centers by expressing it as a multiple of a measure of variability. For example, the mean height of players on the basketball team is 10 cm greater than the mean height of players on the soccer team, about twice the variability (mean absolute deviation) on either team; on a dot plot, the separation between the two distributions of heights is noticeable.
A. Compare and contrast graphs of two sets of data
A. Students can readily find data as described in the example on sports team or college websites. Other sources for data include American Fact Finder (Census Bureau), Fed Stats, Ecology Explorers, USGS, or CIA World Factbook. Researching data sets provides opportunities to connect mathematics to their interests and other academic subjects. Students can utilize statistic functions in graphing calculators or spreadsheets for calculations with larger data sets or to check their computations. Students calculate mean absolute deviations in preparation for later work with standard deviations. Example: Jason wanted to compare the mean height of the players on his favorite basketball and soccer teams. He thinks the mean height of the players on the basketball team will be greater but doesn’t know how much greater. He also wonders if the variability of heights of the athletes is related to the sport they play. He thinks that there will be a greater variability in the heights of soccer players as compared to basketball players. He used the rosters and player statistics from the team websites to generate the following lists. Basketball Team – Height of Players in inches for 2010‐2011 Season 75, 73, 76, 78, 79, 78, 79, 81, 80, 82, 81, 84, 82, 84, 80, 84 Soccer Team – Height of Players in inches for 2010 73, 73, 73, 72, 69, 76, 72, 73, 74, 70, 65, 71, 74, 76, 70, 72, 71, 74, 71, 74, 73, 67, 70, 72, 69, 78, 73, 76, 69 To compare the data sets, Jason creates a two dot plots on the same scale. The shortest player is 65 inches and the tallest players are 84 inches.

GRADE 7 MATHEMATICS CURRICULUM STATISTICSANDPROBABILITY
Waterford Public Schools 263
Common Core State Standard Unwrapped Standard Explanation and Examples
In looking at the distribution of the data, Jason observes that there is some overlap between the two data sets. Some players on both teams have players between 73 and 78 inches tall. Jason decides to use the mean and mean absolute deviation to compare the data sets. Jason sets up a table for each data set to help him with the calculations. The mean height of the basketball players is 79.75 inches as compared to the mean height of the soccer players at 72.07 inches, a difference of 7.68 inches. The mean absolute deviation (MAD) is calculated by taking the mean of the absolute deviations for each data point. The difference between each data point and the mean is recorded in the second column of the table. Jason used rounded values (80 inches for the mean height of basketball players and 72 inches for the mean height of soccer players) to find the differences. The absolute deviation, absolute value of the deviation, is recorded in the third column. The absolute deviations are summed and divided by the number of data points in the set.

GRADE 7 MATHEMATICS CURRICULUM STATISTICSANDPROBABILITY
Waterford Public Schools 264
Common Core State Standard Unwrapped Standard Explanation and Examples The mean absolute deviation is 2.14 inches for the basketball players and 2.53 for the soccer players. These values indicate moderate variation in both data sets. There is slightly more variability in the height of the soccer players. The difference between the heights of the teams is approximately 3 times the variability of the data sets (7.68 ÷ 2.53 = 3.04). Soccer Players (n = 29) Basketball Players (n = 16) Height (in)
Deviation from Mean (in)
Absolute Deviation (in)
Height (in)
Deviation from Mean (in)
Absolute Deviation (in)
65 ‐7 7 73 ‐7 7 67 ‐5 5 75 ‐5 5 69 ‐3 3 76 ‐4 4 69 ‐3 3 78 ‐2 2 69 ‐3 3 78 ‐2 2 70 ‐2 2 79 ‐1 1 70 ‐2 2 79 ‐1 1 70 ‐2 2 80 0 0 71 ‐1 1 80 0 0 71 ‐1 1 81 1 1 71 ‐1 1 81 1 1 72 0 0 82 2 2 72 0 0 82 2 2 72 0 0 84 4 4 72 0 0 84 4 4 73 +1 1 84 4 4 73 +1 1 73 +1 1 73 +1 1

GRADE 7 MATHEMATICS CURRICULUM STATISTICSANDPROBABILITY
Waterford Public Schools 265
Common Core State Standard Unwrapped Standard Explanation and Examples 73 +1 1 73 +1 1 74 +2 2 74 +2 2 74 +2 2 74 +2 2 76 +4 4 76 +4 4 76 +4 4 78 +6 6 Σ = 2090
Σ = 62 Σ = 1276
Σ = 40
Mean = 2090 ÷ 29 =72 inches Mean = 1276 ÷ 16 =80 inchesMAD = 62 ÷ 29 = 2.13 inches MAD = 40 ÷ 16 = 2.5 inches
CC.7.SP.4 Use measures of center and measures of variability for numerical data from random samples to draw informal comparative inferences about two populations. For example, decide whether the words in a chapter of a seventh‐grade science book are generally longer than the words in a chapter of a fourth‐grade science book.
A. Use statistics to draw inferences about two sets of data
B. Identify where measures of central tendency and spread are found in graphical displays including box and whisker plots, stem and leaf plots, scatterplots and histograms
A. – B. Measures of center include mean, median, and mode. The measures of variability include range, mean absolute deviation, and interquartile range. Example: The two data sets below depict random samples of the
housing prices sold in the King River and Toby Ranch areas of Arizona. Based on the prices below which measure of center will provide the most accurate estimation of housing prices in Arizona? Explain your reasoning.
o King River area {1.2 million, 242000, 265500, 140000, 281000, 265000, 211000}
o Toby Ranch homes {5million, 154000, 250000, 250000, 200000, 160000, 190000}

GRADE 7 MATHEMATICS CURRICULUM STATISTICSANDPROBABILITY
Waterford Public Schools 266
Common Core State Standard Unwrapped Standard Explanation and Examples CC.7.SP.5 Understand that the probability of a chance event is a number between 0 and 1 that expresses the likelihood of the event occurring. Larger numbers indicate greater likelihood. A probability near 0 indicates an unlikely event, a probability around 1/2 indicates an event that is neither unlikely nor likely, and a probability near 1 indicates a likely event.
A. Understand that the probability of a chance event is a number between 0 and 1 that expresses the likelihood of the event occurring
B. Know that probabilities can be expressed as fractions, decimals or percents
A. – B. Probability can be expressed in terms such as impossible, unlikely, likely, or certain or as a number between 0 and 1 as illustrated on the number line. Students can use simulations such as Marble Mania on AAAS or the Random Drawing Tool on NCTM’s Illuminations to generate data and examine patterns. Marble Mania http://www.sciencenetlinks.com/interactives/marble/marblemania.html Random Drawing Tool ‐ http://illuminations.nctm.org/activitydetail.aspx?id=67
Example: The container below contains 2 gray, 1 white, and 4 black
marbles. Without looking, if you choose a marble from the container, will the probability be closer to 0 or to 1 that you will select a white marble? A gray marble? A black marble? Justify each of your predictions.

GRADE 7 MATHEMATICS CURRICULUM STATISTICSANDPROBABILITY
Waterford Public Schools 267
Common Core State Standard Unwrapped Standard Explanation and Examples CC.7.SP.6 Approximate the probability of a chance event by collecting data on the chance process that produces it and observing its long‐run relative frequency, and predict the approximate relative frequency given the probability. For example, when rolling a number cube 600 times, predict that a 3 or 6 would be rolled roughly 200 times, but probably not exactly 200 times.
A. Conduct probability experiments and express the probability based on possible outcomes
A. Students can collect data using physical objects or graphing calculator or web‐based simulations. Students can perform experiments multiple times, pool data with other groups, or increase the number of trials in a simulation to look at the long‐run relative frequencies. Example: Each group receives a bag that contains 4 green marbles, 6 red marbles, and 10 blue marbles. Each group performs 50 pulls, recording the color of marble drawn and replacing the marble into the bag before the next draw. Students compile their data as a group and then as a class. They summarize their data as experimental probabilities and make conjectures about theoretical probabilities (How many green draws would you expect if you were to conduct 1000 pulls? 10,000 pulls?). Students create another scenario with a different ratio of marbles in the bag and make a conjecture about the outcome of 50 marble pulls with replacement. (An example would be 3 green marbles, 6 blue marbles, 3 blue marbles.) Students try the experiment and compare their predictions to the experimental outcomes to continue to explore and refine conjectures about theoretical probability.

GRADE 7 MATHEMATICS CURRICULUM STATISTICSANDPROBABILITY
Waterford Public Schools 268
Common Core State Standard Unwrapped Standard Explanation and Examples CC.7.SP.7 Develop a probability model and use it to find probabilities of events. Compare probabilities from a model to observed frequencies; if the agreement is not good, explain possible sources of the discrepancy. CC.7.SP.7a Develop a uniform probability model by assigning equal probability to all outcomes, and use the model to determine probabilities of events. For example, if a student is selected at random from a class, find the probability that Jane will be selected and the probability that a girl will be selected. CC.7.SP.7b Develop a probability model (which may not be uniform) by observing frequencies in data generated from a chance process. For example, find the approximate probability that a spinning penny will land heads up or that a tossed paper cup will land open‐end down. Do the outcomes for the spinning penny appear to be equally likely based on the observed frequencies?
A. Be able to list the sample space for a probability experiment and list the probabilities for each event
A. Students need multiple opportunities to perform probability experiments and compare these results to theoretical probabilities. Critical components of the experiment process are making predictions about the outcomes by applying the principles of theoretical probability, comparing the predictions to the outcomes of the experiments, and replicating the experiment to compare results. Experiments can be replicated by the same group or by compiling class data. Experiments can be conducted using various random generation devices including, but not limited to, bag pulls, spinners, number cubes, coin toss, and colored chips. Students can collect data using physical objects or graphing calculator or web‐based simulations. Students can also develop models for geometric probability (i.e. a target). Example: If you choose a point in the square, what is the probability that
it is not in the circle?

GRADE 7 MATHEMATICS CURRICULUM STATISTICSANDPROBABILITY
Waterford Public Schools 269
Common Core State Standard Unwrapped Standard Explanation and Examples CC.7.SP.8 Find probabilities of compound events using organized lists, tables, tree diagrams, and simulations. CC.7.SP.8a Understand that, just as with simple events, the probability of a compound event is the fraction of outcomes in the sample space for which the compound event occurs. CC.7.SP.8b Represent sample spaces for compound events using methods such as organized lists, tables and tree diagrams. For an event described in everyday language (e.g., “rolling double sixes”), identify the outcomes in the sample space which compose the event. CC.7.SP.8c Design and use a simulation to generate frequencies for compound events. For example, use random digits as a simulation tool to approximate the answer to the question: if 40% of donors have type A blood, what is the probability that it will take at least 4 donors to find one with type A blood?
A. Know what a compound probability is
B. Know how to find the sample space for compound events
C. Know how to compute compound probabilities
D. Design and use a simulation to generate frequencies for compound events
E. Perform experiments to determine experimental probabilities
F. Compare and contrast experimental and theoretical probability results in writing
A. – F. Examples: Students conduct a bag pull experiment. A bag contains 5
marbles. There is one red marble, two blue marbles and two purple marbles. Students will draw one marble without replacement and then draw another. What is the sample space for this situation? Explain how you determined the sample space and how you will use it to find the probability of drawing one blue marble followed by another blue marble.
Show all possible arrangements of the letters in the word FRED using a tree diagram. If each of the letters is on a tile and drawn at random, what is the probability that you will draw the letters F‐R‐E‐D in that order? What is the probability that your “word” will have an F as the first letter?

GRADE 7 MATHEMATICS CURRICULUM PACINGGUIDE
Waterford Public Schools 270
Common Core Standard – Unit Fall Winter Spring
The Number System ( NS‐1 through NS‐3)
Describe situations in which opposite quantities combine to make 0 X
Understand how to add, subtract, multiply and divide positive and negative numbers X
Show that a number and its opposite add to zero X
Understand how to subtract positive and negative numbers X
Show how distance and absolute value are related on a number line X
Know how to add, subtract, multiply and divide rational numbers X
Know how to identify a rational number X
Represent fractions as terminating or repeating decimals X
Solve real‐world and mathematical problems involving the four operations with rational numbers X
Expressions and Equations (EE‐1 through EE‐4)
Evaluate and simplify algebraic expressions, equations and formulas using algebraic properties (i.e. commutative, associative, distributive, inverse operations, and the additive and multiplicative identities) and the order of operations
X
Understand how to combine like terms X
Write expressions, formulas, equations or inequalities using variables to represent mathematical relationships and solve problems X
Analyze a variety of patterns and generalize with algebraic expressions, formulas or equations X

GRADE 7 MATHEMATICS CURRICULUM PACINGGUIDE
Waterford Public Schools 271
Common Core Standard – Unit Fall Winter Spring
Write, model and solve one‐ and two‐step equations and inequalities using integers in any form using a variety of methods including tables, concrete models and the properties of equality X
Solve real world problems using a variety of algebraic methods including tables, graphs, equations and inequalities X
Ratios and Proportional Relationships (RP‐1 through RP‐3)
Solve practical problems involving rates, ratios, percentages and proportionality X
Determine whether a proportion exists between two ratios X
Identify constants of proportionality (Unit Rate) X
Represent proportional relationships by equations X
Write ratios and proportions to solve problems in context involving rates, scale factors and percentages X
Explain what a point (x, y) on the graph of a proportional relationship means X
Write and solve problems involving proportional relationships using linear equations X
Determine the constant rate of change in a linear relationship and recognize this as the slope of a line X
Geometry (G‐1 through G‐6)
Use measurements to examine the ratios between corresponding side lengths of scale models and similar figures X
Compare and describe in writing the relationships, including congruence, equality in scale, between the angles, side, perimeters and areas of congruent and similar geometric shapes X
Determine the effect of scale factors in the perimeter and areas of 2‐D shapes and on the surface area and volumes of 3‐D shapes X

GRADE 7 MATHEMATICS CURRICULUM PACINGGUIDE
Waterford Public Schools 272
Common Core Standard – Unit Fall Winter Spring
Classify 2‐D and 3‐D figures based on their properties X
Construct and/or examine right triangles, make and text conjectures about the relationships of the angles and sides X
Visualize 3‐D objects from different perspectives and analyze cross‐sections, surface areas and volumes X
Recognize the relationships among radius, diameter, circumference and area of circles and develop formulas for finding circumference and area based on these relationships X
Use formulas to solve problems involving perimeters and areas of polygons and circles X
Use facts about supplementary, complementary, vertical and adjacent angles in a multi‐step problem to write and solve simple equations for an unknown angles in a figure X
Use 2‐D representations of rectangular prisms, pyramids and cylinders to determine surface area X
Develop and use formulas to determine volumes and surface areas of geometric solids X
Statistics and Probability (SP‐1 through SP‐8)
Understand what statistics is X
Explain the effects of sampling size and sampling techniques on statistical claims X
Use data from samples to make inferences about a population and determine whether claims are reasonable or false X
Understand random sampling and its uses X
Compare two sets of data based on their spread and measures of central tendency X
Identify where measures of central tendency and spread are found in graphical displays including box and whisker plots, stem and leaf plots, scatterplots and histograms X

GRADE 7 MATHEMATICS CURRICULUM PACINGGUIDE
Waterford Public Schools 273
Common Core Standard – Unit Fall Winter Spring
Understand that the probability of a chance event is a number between 0 and 1 that expresses the likelihood of the event occurring X
Solve probability problems in familiar context including simple events such as coin tosses and compound events such as flipping a coin and rolling a number cube X
Conduct probability experiments and express the probability based on possible outcomes, and test predictions about outcomes and fairness X
Compare and contrast experimental and theoretical probability results in writing X
Source: CT State Department of Education 5/7/12

GRADE 8 MATHEMATICS CURRICULUM OVERVIEW
Waterford Public Schools 274
NumberSense Students will understand rational and irrational numbers.
EquationsandExpressions
Students will use linear equations, and systems of linear equations to represent, analyze, and solve a variety of problems. They will understand that the slope (m) of a line is a constant rate of change, so that if the input or x‐coordinate changes by an amount A, the output or y‐coordinate changes by the amount mA. Students will also formulate and solve linear equations in one variable and use these equations to solve problems.
Functions
Students will grasp the concept of a function as a rule that assigns to each element of its domain exactly one element of its range. They will use function notation and understand that functions describe situations where one quantity determines another.
Geometry
Students will understand the statement of the Pythagorean Theorem and its converse, and will explain why the Pythagorean Theorem is valid, for example, by decomposing a square in two different ways. They will apply the Pythagorean Theorem to find distances between points on the coordinate plane, to find lengths, and to analyze polygons.
StatisticsandProbability
Students will construct and interpret scatter plots as well as lines of best fit. Assessments:
Teacher‐Created C.F.A.’s and Benchmarks Resources:
Math Connects by McGraw‐Hill

GRADE 8 MATHEMATICS CURRICULUM NUMBERSENSE
Waterford Public Schools 275
When do numbers behave irrationally? How do fractions, decimals, percents and ratios relate to each other?
What are square roots? How are square roots and squares related?
Common Core State Standard Unwrapped Standard Explanation and Examples
CC.8.NS.1 Understand informally that every number has a decimal expansion; the rational numbers are those with decimal expansions that terminate in 0s or eventually repeat. Know that other numbers are called irrational.
A. Understand the difference between rational and irrational numbers
B. Be able to identify rational and irrational numbers
A. – B. Students can use graphic organizers to show the relationship between the subsets of the real number system.
CC.8.NS.2 Use rational approximations of irrational numbers to compare the size of irrational numbers, locate them approximately on a number line diagram, and estimate the value of expressions (e.g., π2). For example, by truncating the decimal expansion of √2 (square root of 2), show that √2 is between 1 and 2, then between 1.4 and 1.5, and explain how to continue on to get better approximations.
A. Be able to locate rational and irrational numbers on a number line
B. Be able to approximate irrational square roots
A. – B. Students can approximate square roots by iterative processes. Examples: Approximate the value of to the nearest hundredth.
Solution: Students start with a rough estimate based upon perfect squares. falls between 2 and 3 because 5 falls between 22 = 4 and 32 = 9. The value will be closer to 2 than to 3. Students continue the iterative process with the tenths place value. falls between 2.2 and 2.3 because 5 falls between 2.22 = 4.84 and 2.32 = 5.29. The value is closer to
5
5
5
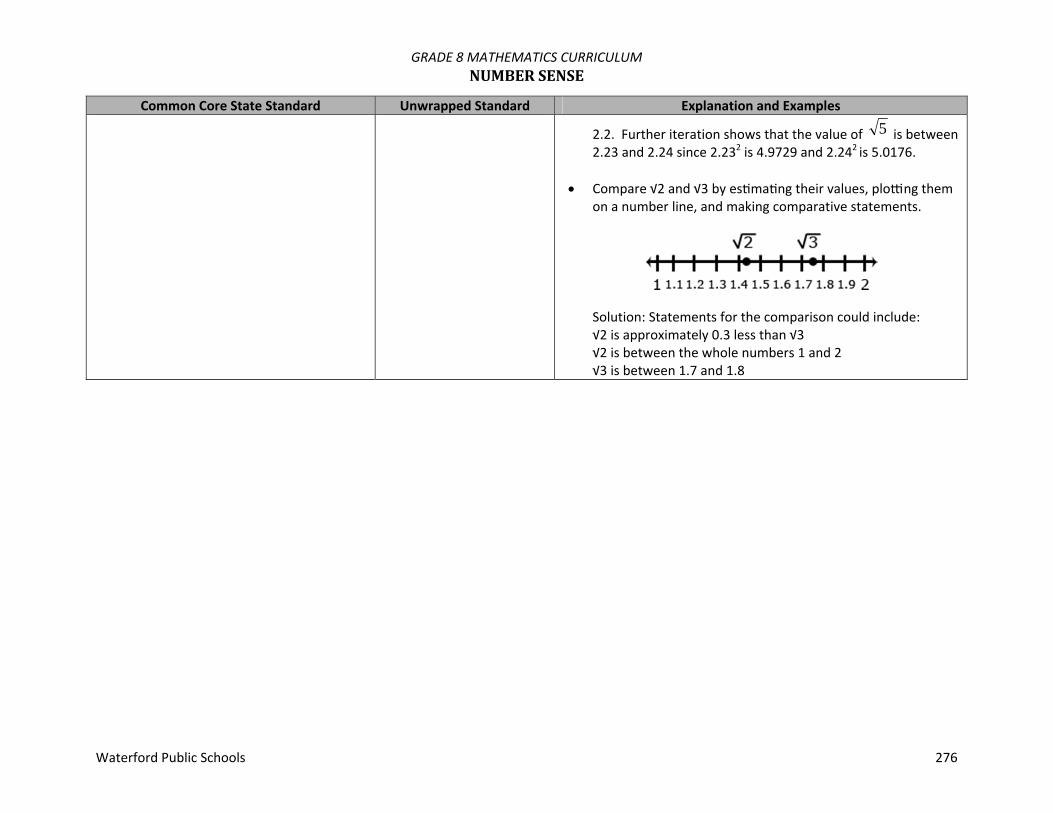
GRADE 8 MATHEMATICS CURRICULUM NUMBERSENSE
Waterford Public Schools 276
Common Core State Standard Unwrapped Standard Explanation and Examples
2.2. Further iteration shows that the value of is between 2.23 and 2.24 since 2.232 is 4.9729 and 2.242 is 5.0176.
Compare √2 and √3 by es ma ng their values, plo ng them
on a number line, and making comparative statements.
Solution: Statements for the comparison could include: √2 is approximately 0.3 less than √3 √2 is between the whole numbers 1 and 2 √3 is between 1.7 and 1.8
5

GRADE 8 MATHEMATICS CURRICULUM EXPRESSIONSANDEQUATIONS
Waterford Public Schools 277
What are negative exponents? How do you solve equations with square roots and cube roots?
What is scientific notation and how do you solve problems with numbers of this form? How are proportions represented on a coordinate graph?
How do you solve multi‐step linear equations? How is the solution to a system of two linear equations represented on a coordinate graph?
Common Core State Standard Unwrapped Standard Explanation and Examples
CC.8.EE.1 Know and apply the properties of integer exponents to generate equivalent numerical expressions. For example, 32 × 3(–5) = 3(–3) = 1/(33) = 1/27.
A. Be able to work with positive and negative exponents (and zero exponent)
A. Examples:
CC.8.EE.2 Use square root and cube root symbols to represent solutions to equations of the form x2 = p and x3 = p, where p is a positive rational number. Evaluate square roots of small perfect squares and cube roots of small perfect cubes. Know that √2 is irra onal.
A. Use square root and cube root symbols to represent solutions to equations of the form x2 = p and x3 = p
B. Evaluate square roots of small perfect squares and cube roots of small perfect cubes
A. – B. Examples:
and
and
Solve Solution:
2564
5
42
3
2561
4
1444
44
4737
3
43
52 43 152
143
152
164
125
116,000
932 3 9
271
31
31
3
33
31
271
271
3
33
92 x92 x
x2 93 x

GRADE 8 MATHEMATICS CURRICULUM EXPRESSIONSANDEQUATIONS
Waterford Public Schools 278
Common Core State Standard Unwrapped Standard Explanation and Examples
Solve Solution:
CC.8.EE.3 Use numbers expressed in the form of a single digit times an integer power of 10 to estimate very large or very small quantities, and to express how many times as much one is than the other. For example, estimate the population of the United States as 3 × 10⁸ and the population of the world as 7 × 10⁹, and determine that the world population is more than 20 times larger.
A. Understand what scientific notation is
B. Know how to convert standard numerals to scientific notation, and vice versa
A. – B. Scientific notation is a commonly used notation; generally, it is utilized to represent very large or very small numbers more concisely. Numbers in scientific notation are written in the form a x 10n, where 1<a<10 and n is an integer
CC.8.EE.4 Perform operations with numbers expressed in scientific notation, including problems where both decimal and scientific notation are used. Use scientific notation and choose units of appropriate size for measurements of very large or very small quantities (e.g., use millimeters per year for seafloor spreading). Interpret scientific notation that has been generated by technology.
A. Perform four basic operations of numbers in scientific notation
B. Understand how to use scientific notation with calculators
A. – B. Students can convert decimal forms to scientific notation and apply rules of exponents to simplify expressions. In working with calculators or spreadsheets, it is important that students recognize scientific notation. Students should recognize that the output of 2.45E+23 is 2.45 x 10²³ and 3.5E‐4 is 3.5 x 10‐4. Students enter scientific notation using E or EE (scientific notation), * (multiplication), and ^ (exponent) symbols.
83 x83 x33 3 8x2x

GRADE 8 MATHEMATICS CURRICULUM EXPRESSIONSANDEQUATIONS
Waterford Public Schools 279
Common Core State Standard Unwrapped Standard Explanation and Examples CC.8.EE.5 Graph proportional relationships, interpreting the unit rate as the slope of the graph. Compare two different proportional relationships represented in different ways. For example, compare a distance‐time graph to a distance‐time equation to determine which of two moving objects has greater speed.
A. Graph proportional relationships, interpreting the unit rate as the slope of the graph
B. Compare two different proportional relationships represented in different ways
A. – B. Using graphs of experiences that are familiar to students increases accessibility and supports understanding and interpretation of proportional relationship. Students are expected to both sketch and interpret graphs. Example: Compare the scenarios to determine which represents a
greater speed. Include a description of each scenario including the unit rates in your explanation.
Scenario 1: Scenario 2:
CC.8.EE.6 Use similar triangles to explain why the slope m is the same between any two distinct points on a non‐vertical line in the coordinate plane; derive the equation y =mx for a line through the origin and the equation y = mx + b for a line intercepting the vertical axis at b.
A. Determine the constant rate of change (proportional constant) and recognize this as the slope of a line
A. Example:
Explain why is similar to , and deduce that
has the same slope as . Express each line as an equation.
ACB DFE
AB BE
y = 50x x is time in hours y is distance in miles

GRADE 8 MATHEMATICS CURRICULUM EXPRESSIONSANDEQUATIONS
Waterford Public Schools 280
Common Core State Standard Unwrapped Standard Explanation and Examples
CC.8.EE.7a Give examples of linear equations in one variable with one solution, infinitely many solutions, or no solutions. Show which of these possibilities is the case by successively transforming the given equation into simpler forms, until an equivalent equation of the form x = a, a = a, or a = b results (where a and b are different numbers).
A. Be able to solve multi‐step linear equations
A. As students transform linear equations in one variable into simpler forms, they discover the equations can have one solution, infinitely many solutions, or no solutions. When the equation has one solution, the variable has one value that makes the equation true as in 12‐4y=16. The only value for y that makes this equation true is ‐1. When the equation has infinitely many solutions, the equation is true for all real numbers as in 7x + 14 = 7 (x+2). As this equation is simplified, the variable terms cancel leaving 14 = 14 or 0 = 0. Since the expressions are equivalent, the value for the two sides of the equation will be the same regardless which real number is used for the substitution. When an equation has no solutions it is also called an inconsistent equation. This is the case when the two expressions are not equivalent as in 5x ‐ 2 = 5(x+1). When simplifying this equation, students will find that the solution appears to be two numbers that are not equal or ‐2 = 1. In this case, regardless which real number is used for the substitution, the equation is not true and therefore has no solution.

GRADE 8 MATHEMATICS CURRICULUM EXPRESSIONSANDEQUATIONS
Waterford Public Schools 281
Common Core State Standard Unwrapped Standard Explanation and Examples CC.8.EE.7b Solve linear equations with rational number coefficients, including equations whose solutions require expanding expressions using the distributive property and collecting like terms.
A. Be able to solve multi‐step linear equations involving the distributive property and combining like terms
A. Examples: Solve for x:
o o o
Solve:
o
o
CC.8.EE.8a Understand that solutions to a system of two linear equations in two variables correspond to points of intersection of their graphs, because points of intersection satisfy both equations simultaneously. CC.8.EE.8b Solve systems of two linear equations in two variables algebraically, and estimate solutions by graphing the equations. Solve simple cases by inspection. For example, 3x + 2y = 5 and 3x + 2y = 6 have no solution because 3x + 2y cannot simultaneously be 5 and 6. CC.8.EE.8c Solve real‐world and mathematical problems leading to two linear equations in two variables. For example, given coordinates for two pairs of points, determine whether the line through the first pair of points intersects
A. Understand that a solution to a systems of two equations is the point of intersection of the graphs
B. Be able to solve a system of linear equations algebraically
C. Estimate solutions to a system of linear equations by graphing
D. Solve real‐world and mathematical problems leading to two linear equations in two variables
A. – D. Systems of linear equations can also have one solution, infinitely many solutions or no solutions. Students will discover these cases as they graph systems of linear equations and solve them algebraically. A system of linear equations whose graphs meet at one point (intersecting lines) has only one solution, the ordered pair representing the point of intersection. A system of linear equations whose graphs do not meet (parallel lines) has no solutions and the slopes of these lines are the same. A system of linear equations whose graphs are coincident (the same line) has infinitely many solutions, the set of ordered pairs representing all the points on the line. By making connections between algebraic and graphical solutions and the context of the system of linear equations, students are able to make sense of their solutions. Students need opportunities to work with equations and context that include whole number and/or decimals/fractions.
4)7(3 x8483 xx
235)1(3 xx
7)3(7 m
yy31
43
32
41

GRADE 8 MATHEMATICS CURRICULUM EXPRESSIONSANDEQUATIONS
Waterford Public Schools 282
Common Core State Standard Unwrapped Standard Explanation and Examples the line through the second pair. Examples:
Find x and y using elimination and then using substitution. 3x + 4y = 7 ‐2x + 8y = 10
Plant A and Plant B are on different watering schedules. This
affects their rate of growth. Compare the growth of the two plants to determine when their heights will be the same.
Let W = number of weeks Let H = height of the plant after W weeks
Plant A Plant B
W H W H 0 4 (0,4) 0 2 (01 6 (1,6) 1 6 (12 8 (2,8) 2 10 (23 10 (3,10) 3 14 (3
Given each set of coordinates, graph their corresponding
lines. Solution:

GRADE 8 MATHEMATICS CURRICULUM EXPRESSIONSANDEQUATIONS
Waterford Public Schools 283
Common Core State Standard Unwrapped Standard Explanation and Examples Write an equation that represent the growth rate of Plant A
and Plant B. Solution: Plant A H = 2W + 4 Plant B H = 4W + 2
At which week will the plants have the same height?
Solution: The plants have the same height after one week. Plant A: H = 2W + 4 Plant B: H = 4W + 2 Plant A: H = 2(1) + 4 Plant B: H = 4(1) + 2 Plant A: H = 6 Plant B: H = 6 After one week, the height of Plant A and Plant B are both 6 inches.

GRADE 8 MATHEMATICS CURRICULUM FUNCTIONS
Waterford Public Schools 284
What is a function? What do dependent variables depend on?
How do you identify a linear equation or model versus a non‐linear one? How do you find and interpret slope and y‐intercept, both algebraically and graphically?
Common Core State Standard Unwrapped Standard Explanation and Examples
CC.8.F.1 Understand that a function is a rule that assigns to each input exactly one output. The graph of a function is the set of ordered pairs consisting of an input and the corresponding output. (Function notation is not required in Grade 8.)
A. Understand what a function is both algebraically and graphically
A. For example, the rule that takes x as input and gives x2+5x+4 as output is a function. Using y to stand for the output we can represent this function with the equation y = x2+5x+4, and the graph of the equation is the graph of the function. Students are not yet expected use function notation such as f(x) = x2+5x+4.
CC.8.F.2 Compare properties of two functions each represented in a different way (algebraically, graphically, numerically in tables, or by verbal descriptions). For example, given a linear function represented by a table of values and a linear function represented by an algebraic expression, determine which function has the greater rate of change.
A. Compare properties of two functions each represented in a different way
A. Examples: Compare the two linear functions listed below and determine
which equation represents a greater rate of change.
Function 1:
Function 2: The function whose input x and output y are related by
y = 3x + 7

GRADE 8 MATHEMATICS CURRICULUM FUNCTIONS
Waterford Public Schools 285
Common Core State Standard Unwrapped Standard Explanation and Examples Compare the two linear functions listed below and determine
which has a negative slope.
Function 1: Gift Card Samantha starts with $20 on a gift card for the book store. She spends $3.50 per week to buy a magazine. Let y be the amount remaining as a function of the number of weeks, x.
x y 0 20 1 16.50 2 13.00 3 9.50 4 6.00
Function 2: The school bookstore rents graphing calculators for $5 per month. It also collects a non‐refundable fee of $10.00 for the school year. Write the rule for the total cost (c) of renting a calculator as a function of the number of months (m). Solution: Function 1 is an example of a function whose graph has negative slope. Samantha starts with $20 and spends money each week. The amount of money left on the gift card decreases each week. The graph has a negative slope of ‐3.5, which is the amount the gift card balance decreases with Samantha’s weekly magazine purchase. Function 2 is an example of a function whose graph has positive slope. Students pay a yearly nonrefundable fee for renting the calculator and pay $5 for each month they rent the calculator. This function has a positive slope of 5 which is the amount of the monthly rental fee. An equation for Example 2

GRADE 8 MATHEMATICS CURRICULUM FUNCTIONS
Waterford Public Schools 286
Common Core State Standard Unwrapped Standard Explanation and Examples could be c = 5m + 10.
CC.8.F.3 Interpret the equation y = mx + b as defining a linear function, whose graph is a straight line; give examples of functions that are not linear. For example, the function A = s2 giving the area of a square as a function of its side length is not linear because its graph contains the points (1,1), (2,4) and (3,9), which are not on a straight line.
A. Interpret the equation y = mx + b as defining a linear function
B. Identify linear and non‐linear equations
A. – B. Example: Determine which of the functions listed below are linear and
which are not linear and explain your reasoning. o y = ‐2x2 + 3 non linear o y = 2x linear o A = πr2 non linear o y = 0.25 + 0.5(x – 2) linear
CC.8.F.4 Construct a function to model a linear relationship between two quantities. Determine the rate of change and initial value of the function from a description of a relationship or from two (x, y) values, including reading these from a table or from a graph. Interpret the rate of change and initial value of a linear function in terms of the situation it models, and in terms of its graph or a table of values.
A. Construct a function to model a linear relationship between two quantities
B. Be able to identify and interpret slope and y‐intercept
A. – B. Examples: The table below shows the cost of renting a car. The
company charges $45 a day for the car as well as charging a one‐time $25 fee for the car’s navigation system (GPS).Write an expression for the cost in dollars, c, as a function of the number of days, d.
Students might write the equation c = 45d + 25 using the verbal description or by first making a table.
Days (d) Cost (c) in dollars 1 70 2 115 3 160

GRADE 8 MATHEMATICS CURRICULUM FUNCTIONS
Waterford Public Schools 287
Common Core State Standard Unwrapped Standard Explanation and Examples 4 205
Students should recognize that the rate of change is 45 (the cost of renting the car) and that initial cost (the first day charge) also includes paying for the navigation system. Classroom discussion about one time fees vs. recurrent fees will help students model contextual situations.
When scuba divers come back to the surface of the water,
they need to be careful not to ascend too quickly. Divers should not come to the surface more quickly than a rate of 0.75 ft per second. If the divers start at a depth of 100 feet, the equation d = 0.75t – 100 shows the relationship between the time of the ascent in seconds (t) and the distance from the surface in feet (d).
o Will they be at the surface in 5 minutes? How long will it take the divers to surface from their dive?
o Make a table of values showing several times and the corresponding distance of the divers from the surface. Explain what your table shows. How do the values in the table relate to your equation?
CC.8.F.5 Describe qualitatively the functional relationship between two quantities by reading a graph (e.g., where the function is increasing or decreasing, linear or nonlinear). Sketch a graph that exhibits the qualitative features of a function that has been described verbally.
A. Know how to read and interpret a linear or non‐linear graph
B. Sketch a graph exhibiting the qualitative features of a function
A. – B. Example: The graph below shows a student’s trip to school. This
student walks to his friend’s house and, together, they ride a bus to school. The bus stops once before arriving at school.
Describe how each part A‐E of the graph relates to the story.
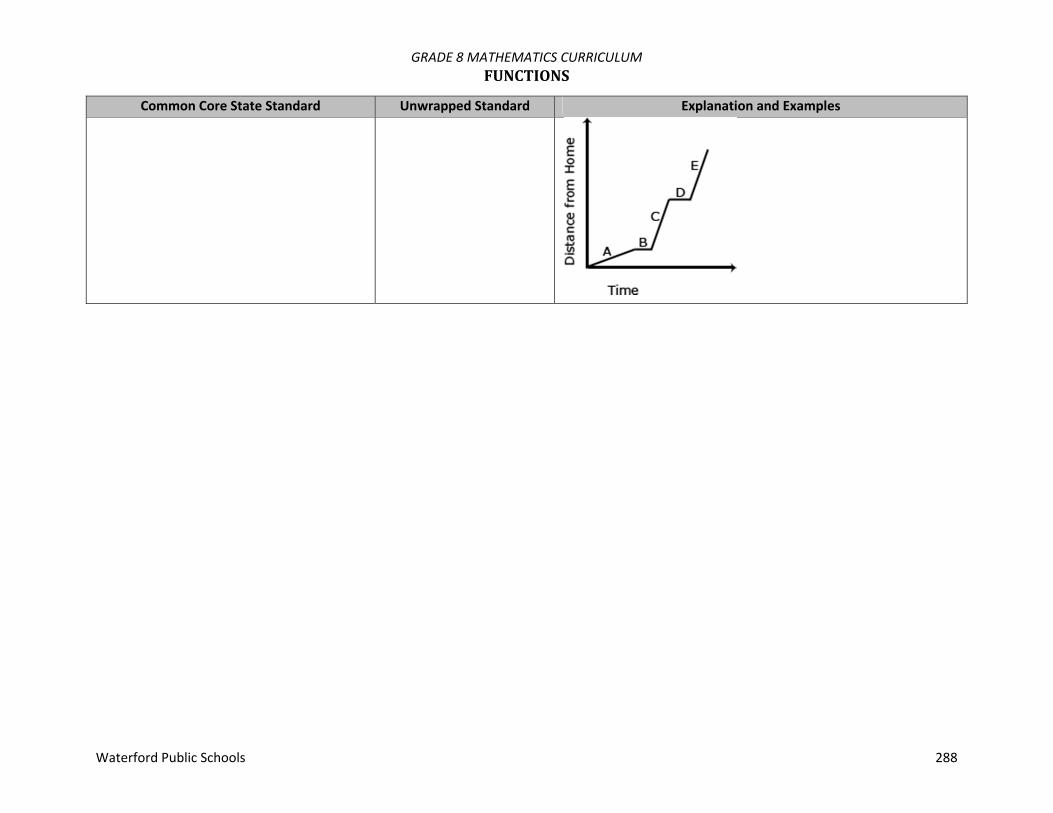
GRADE 8 MATHEMATICS CURRICULUM FUNCTIONS
Waterford Public Schools 288
Common Core State Standard Unwrapped Standard Explanation and Examples
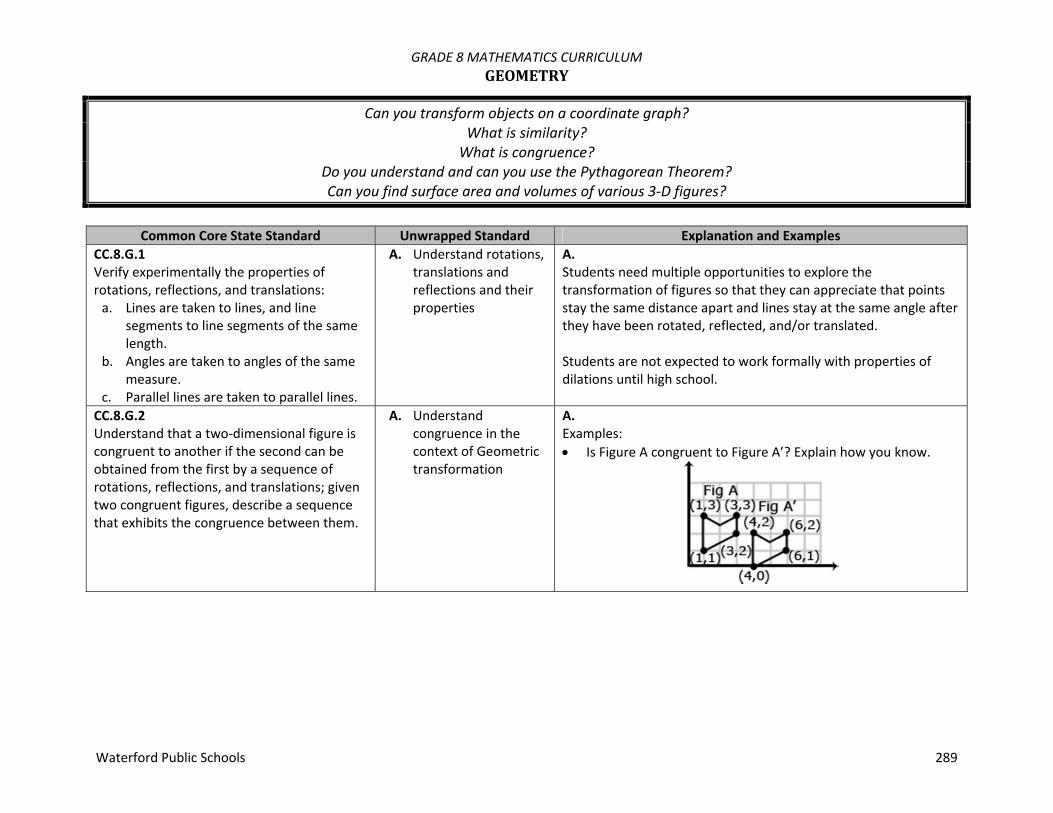
GRADE 8 MATHEMATICS CURRICULUM GEOMETRY
Waterford Public Schools 289
Can you transform objects on a coordinate graph? What is similarity? What is congruence?
Do you understand and can you use the Pythagorean Theorem? Can you find surface area and volumes of various 3‐D figures?
Common Core State Standard Unwrapped Standard Explanation and Examples
CC.8.G.1 Verify experimentally the properties of rotations, reflections, and translations: a. Lines are taken to lines, and line
segments to line segments of the same length.
b. Angles are taken to angles of the same measure.
c. Parallel lines are taken to parallel lines.
A. Understand rotations, translations and reflections and their properties
A. Students need multiple opportunities to explore the transformation of figures so that they can appreciate that points stay the same distance apart and lines stay at the same angle after they have been rotated, reflected, and/or translated. Students are not expected to work formally with properties of dilations until high school.
CC.8.G.2 Understand that a two‐dimensional figure is congruent to another if the second can be obtained from the first by a sequence of rotations, reflections, and translations; given two congruent figures, describe a sequence that exhibits the congruence between them.
A. Understand congruence in the context of Geometric transformation
A. Examples: Is Figure A congruent to Figure A’? Explain how you know.

GRADE 8 MATHEMATICS CURRICULUM GEOMETRY
Waterford Public Schools 290
Common Core State Standard Unwrapped Standard Explanation and Examples Describe the sequence of transformations that results in the
transformation of Figure A to Figure A’.
CC.8.G.3 Describe the effect of dilations, translations, rotations and reflections on two‐dimensional figures using coordinates.
A. Describe the effect of dilations, translations, rotations and reflections on two‐dimensional figures using coordinates
A. A dilation is a transformation that moves each point along a ray emanating from a fixed center, and multiplies distances from the center by a common scale factor. In dilated figures, the dilated figure is similar to its pre‐image. Translation: A translation is a transformation of an object that moves the object so that every point of the object moves in the same direction as well as the same distance. In a translation, the translated object is congruent to its pre‐image. has been translated 7 units to the right and 3 units up. To get from A (1,5) to A’ (8,8), move A 7 units to the right (from x = 1 to x = 8) and 3 units up (from y = 5 to y = 8). Points B + C also move in the same direction (7 units to the right and 3 units up).
ABC

GRADE 8 MATHEMATICS CURRICULUM GEOMETRY
Waterford Public Schools 291
Common Core State Standard Unwrapped Standard Explanation and Examples Reflection: A reflection is a transformation that flips an object across a line of reflection (in a coordinate grid the line of reflection may be the x or y axis). In a rotation, the rotated object is congruent to its pre‐image.
When an object is reflected across the y axis, the reflected x coordinate is the opposite of the pre‐image x coordinate.
Rotation: A rotated figure is a figure that has been turned about a fixed point. This is called the center of rotation. A figure can be rotated up to 360˚. Rotated figures are congruent to their pre‐image figures. Consider when is rotated 180˚ clockwise about the origin. The coordinates of are D(2,5), E(2,1), and F(8,1). When rotated 180˚, has new coordinates D’(‐2,‐5), E’(‐2,‐1) and F’(‐8,‐1). Each coordinate is the opposite of its pre‐image.
DEFDEF''' FED

GRADE 8 MATHEMATICS CURRICULUM GEOMETRY
Waterford Public Schools 292
Common Core State Standard Unwrapped Standard Explanation and Examples
CC.8.G.4 Understand that a two‐dimensional figure is similar to another if the second can be obtained from the first by a sequence of rotations, reflections, translations, and dilations; given two similar two‐dimensional figures, describe a sequence that exhibits the similarity between them.
A. Understand similarity in the context of Geometric transformations
A. Examples: Is Figure A similar to Figure A’? Explain how you know.
Describe the sequence of transformations that results in the transformation of Figure A to Figure A’.

GRADE 8 MATHEMATICS CURRICULUM GEOMETRY
Waterford Public Schools 293
Common Core State Standard Unwrapped Standard Explanation and Examples CC.8.G.5 Use informal arguments to establish facts about the angle sum and exterior angle of triangles, about the angles created when parallel lines are cut by a transversal, and the angle‐angle criterion for similarity of triangles. For example, arrange three copies of the same triangle so that the three angles appear to form a line, and give an argument in terms of transversals why this is so.
A. Understand the facts about the angle sum and exterior angles of triangles
A. Examples: Students can informally prove relationships with transversals.
Show that m 3 + m + m = 180˚ if l and m are parallel lines and t1 & t2 are transversals.
+ + = 180˚. Angle 1 and Angle 5 are congruent because they are corresponding angles ( ). can be substituted for .
: because alternate interior angles are congruent. can be substituted for
Therefore m + m + m = 180˚
Students can informally conclude that the sum of a triangle is 180º (the angle‐sum theorem) by applying their understanding of lines and alternate interior angles. In the figure below, line x is parallel to line yz:
4 5
1 2 315 1
5
24
4 2
3 4 5

GRADE 8 MATHEMATICS CURRICULUM GEOMETRY
Waterford Public Schools 294
Common Core State Standard Unwrapped Standard Explanation and Examples
Angle a is 35º because it alternates with the angle inside the triangle that measures 35º. Angle c is 80º because it alternates with the angle inside the triangle that measures 80º. Because lines have a measure of 180º, and angles a + b + c form a straight line, then angle b must be 65 º (180 – 35 + 80 = 65). Therefore, the sum of the angles of the triangle are 35º + 65 º + 80 º
CC.8.G.6 Explain a proof of the Pythagorean Theorem and its converse.
A. Explain a proof of the Pythagorean Theorem and its converse
A. Students should verify, using a model, that the sum of the squares of the legs is equal to the square of the hypotenuse in a right triangle. Students should also understand that if the sum of the squares of the 2 smaller legs of a triangle is equal to the square of the third leg, then the triangle is a right triangle.
CC.8.G.7 Apply the Pythagorean Theorem to determine unknown side lengths in right triangles in real‐world and mathematical problems in two and three dimensions.
A. Know how to use the Pythagorean Theorem to solve problems
A. Through authentic experiences and exploration, students should use the Pythagorean Theorem to solve problems. Problems can include working in both two and three dimensions. Students should be familiar with the common Pythagorean triplets.

GRADE 8 MATHEMATICS CURRICULUM GEOMETRY
Waterford Public Schools 295
Common Core State Standard Unwrapped Standard Explanation and Examples CC.8.G.8 Apply the Pythagorean Theorem to find the distance between two points in a coordinate system.
A. Apply the Pythagorean Theorem to find the distance between two points in a coordinate system
A. Example: Students will create a right triangle from the two points given
(as shown in the diagram below) and then use the Pythagorean Theorem to find the distance between the two given points.
CC.8.G.9 Know the formulas for the volume of cones, cylinders and spheres and use them to solve real‐world and mathematical problems.
A. Know the formulas for the volume of cones, cylinders and spheres and use them to solve real‐world and mathematical problems
A. Example: James wanted to plant pansies in his new planter. He wondered how much potting soil he should buy to fill it. Use the measurements in the diagram below to determine the planter’s volume.

GRADE 8 MATHEMATICS CURRICULUM STATISTICSANDPROBABILITY
Waterford Public Schools 296
Can you create and interpret scatterplots? other graphs? What is a line of best fit (line of regression)?
Can you use a line of best fit to make inferences or predictions?
Common Core State Standard Unwrapped Standard Explanation and Examples
CC.8.SP.1 Construct and interpret scatter plots for bivariate measurement data to investigate patterns of association between two quantities. Describe patterns such as clustering, outliers, positive or negative association, linear association, and nonlinear association.
A. Be able to create and interpret scatterplots
A. Students build on their previous knowledge of scatter plots examine relationships between variables. They analyze scatterplots to determine positive and negative associations, the degree of association, and type of association. Students examine outliers to determine if data points are valid or represent a recording or measurement error. Students can use tools such as those at the National Center for Educational Statistics to create a graph or generate data sets. (http://nces.ed.gov/nceskids/createagraph/default.aspx) Examples: Data for 10 students’ Math and Science scores are provided
in the chart. Describe the association between the Math and Science scores.
Student 1 2 3 4 5 6 7 8 9 10
Math 64 50 85 34 56 24 72 63 42 93
Science 68 70 83 33 60 27 74 63 40 96
Data for 10 students’ Math scores and the distance they live
from school are provided in the table below. Describe the association between the Math scores and the distance they live from school. Student 1 2 3 4 5 6 7 8 9 10
Math score 64 50 85 34 56 24 72 63 42 93
Dist from school (miles)
0.5 1.8 1 2.3 3.4 0.2 2.5 1.6 0.8 2.5

GRADE 8 MATHEMATICS CURRICULUM STATISTICSANDPROBABILITY
Waterford Public Schools 297
Common Core State Standard Unwrapped Standard Explanation and Examples Data from a local fast food restaurant is provided showing
the number of staff members and the average time for filling an order are provided in the table below. Describe the association between the number of staff and the average time for filling an order.
Number of staff 3 4 5 6 7 8
Average time to fill order (seconds)
180 138 120 108 96 84
The chart below lists the life expectancy in years for people in
the United States every five years from 1970 to 2005. What would you expect the life expectancy of a person in the United States to be in 2010, 2015, and 2020 based upon this data? Explain how you determined your values.
Date 1970 1975 1980 1985 1990 1995 2000 2005 Life Expectancy (in years)
70.8 72.6 73.7 74.7 75.4 75.8 76.8 77.4
CC.8.SP.2 Know that straight lines are widely used to model relationships between two quantitative variables. For scatter plots that suggest a linear association, informally fit a straight line, and informally assess the model fit by judging the closeness of the data points to the line.
A. Be able to create and interpret lines of best fit.
A. Examples: The capacity of the fuel tank in a car is 13.5 gallons. The table
below shows the number of miles traveled and how many gallons of gas are left in the tank. Describe the relationship between the variables. If the data is linear, determine a line of best fit. Do you think the line represents a good fit for the data set? Why or why not? What is the average fuel efficiency of the car in miles per gallon?
Miles Traveled 0 75 120 160 250 300
Gallons Used 0 2.3 4.5 5.7 9.7 10.7

GRADE 8 MATHEMATICS CURRICULUM STATISTICSANDPROBABILITY
Waterford Public Schools 298
Common Core State Standard Unwrapped Standard Explanation and Examples CC.8.SP.3 Use the equation of a linear model to solve problems in the context of bivariate measurement data, interpreting the slope and intercept. For example, in a linear model for a biology experiment, interpret a slope of 1.5 cm/hr as meaning that an additional hour of sunlight each day is associated with an additional 1.5 cm in mature plant height.
A. Be able to create and use linear models to solve problems
A. Examples: 1. Given data from students’ math scores and absences,
make a scatterplot.
2. Draw a line of best fit, paying attention to the closeness of the data points on either side of the line.
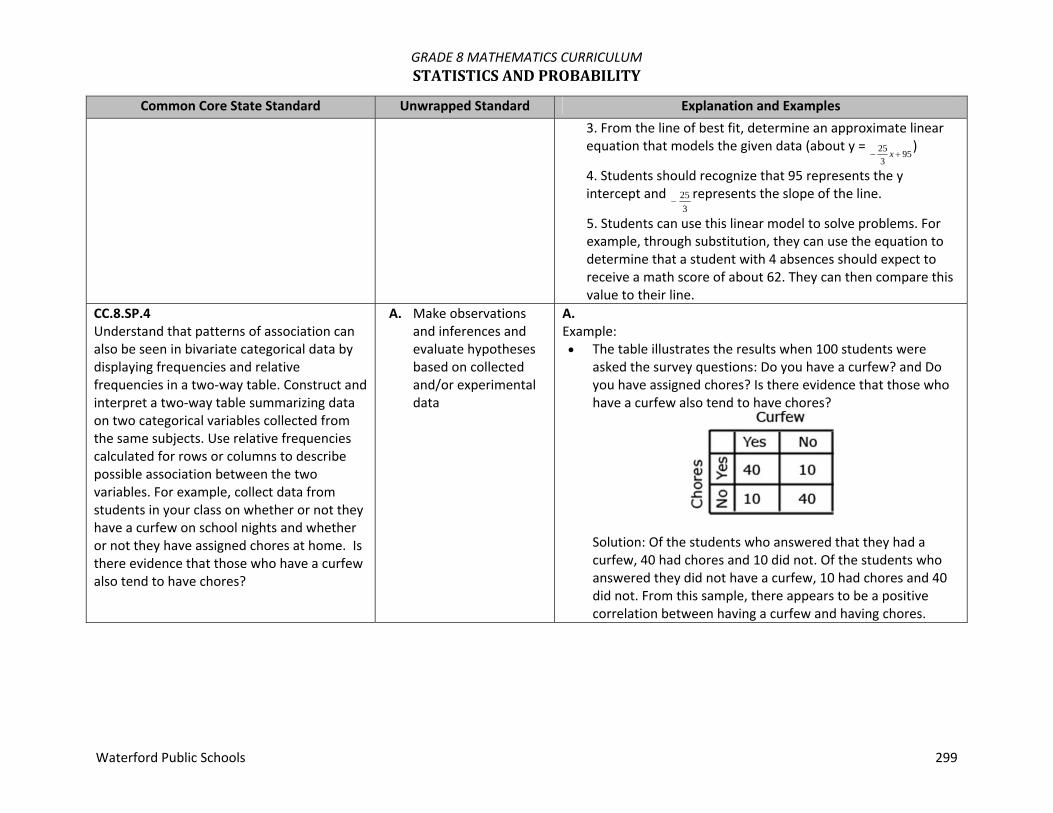
GRADE 8 MATHEMATICS CURRICULUM STATISTICSANDPROBABILITY
Waterford Public Schools 299
Common Core State Standard Unwrapped Standard Explanation and Examples 3. From the line of best fit, determine an approximate linear equation that models the given data (about y =
95325
x)
4. Students should recognize that 95 represents the y intercept and
325
represents the slope of the line.
5. Students can use this linear model to solve problems. For example, through substitution, they can use the equation to determine that a student with 4 absences should expect to receive a math score of about 62. They can then compare this value to their line.
CC.8.SP.4 Understand that patterns of association can also be seen in bivariate categorical data by displaying frequencies and relative frequencies in a two‐way table. Construct and interpret a two‐way table summarizing data on two categorical variables collected from the same subjects. Use relative frequencies calculated for rows or columns to describe possible association between the two variables. For example, collect data from students in your class on whether or not they have a curfew on school nights and whether or not they have assigned chores at home. Is there evidence that those who have a curfew also tend to have chores?
A. Make observations and inferences and evaluate hypotheses based on collected and/or experimental data
A. Example: The table illustrates the results when 100 students were
asked the survey questions: Do you have a curfew? and Do you have assigned chores? Is there evidence that those who have a curfew also tend to have chores?
Solution: Of the students who answered that they had a curfew, 40 had chores and 10 did not. Of the students who answered they did not have a curfew, 10 had chores and 40 did not. From this sample, there appears to be a positive correlation between having a curfew and having chores.

GRADE 8 MATHEMATICS CURRICULUM PACINGGUIDE
Waterford Public Schools 300
Common Core Standard ‐ Unit Fall Winter Spring
Number System (NS‐1, NS‐2)
Represent all rational numbers as Fractions/Decimals/Percents X
Represent fractions as terminating or repeating decimals X
Compare and order rational and common irrational numbers and locate them on a number line X
Extend the understanding of numbers to include integers, rational numbers and real numbers X
Identify perfect squares and their square roots; use these to estimate other square roots X
Calculate the square roots of positive rational numbers using technology X
Be able to approximate irrational square roots X
Equations and Expressions (EE‐1 through EE‐4)
Know and apply the properties of integer (positive, negative and zero) exponents X
Use the rules for exponents to multiply and divide with powers of ten and extend to other bases X
Understand the relationship between squares and square roots X
Use square root and cube root symbols to represent solutions to equations of the form x2 = p and x3 = p X
Evaluate square roots of small perfect squares and cube roots of small perfect cubes X
Read, write, compare and solve problems with whole numbers in scientific notation and/or absolute value X
Develop and describe strategies for estimating and multiplying whole numbers expressed in sci. notation X

GRADE 8 MATHEMATICS CURRICULUM PACINGGUIDE
Waterford Public Schools 301
Common Core Standard ‐ Unit Fall Winter Spring
Estimate and solve problems containing whole numbers in scientific notation and/or powers of ten X
Read and represent whole numbers and those between zero and one in sci. notation, and compare their magnitude X
Estimate answers to problems in context containing numbers expressed in sci. notation X
Perform four basic operations of numbers in scientific notation X
Understand how to use scientific notation with calculators X
Geometry (G‐1 through G‐9)
Identify lines of symmetry and reflections, rotations and translations of geometric figures X
Draw the result of transformations on polygons on coordinate planes X
Use a coordinate plane to make and test conjectures about changes in the coordinates of the vertices of polygons as a result of a transformation X
Understand congruence in the context of Geometric transformation X
Understand similarity in the context of Geometric transformations X
Describe the effect of transformations on polygons that have line and/or rotational symmetry X
Apply side and angle relationships in geometric figures to solve problems including the Pythagorean Theorem and similar figures X
Examine right triangles and make and test conjectures about the relationships of the angles and sides and develop the Pythagorean Theorem X
Explain a proof of the Pythagorean Theorem and its converse X
Apply the Pythagorean Theorem to find the distance between two points in a coordinate system X
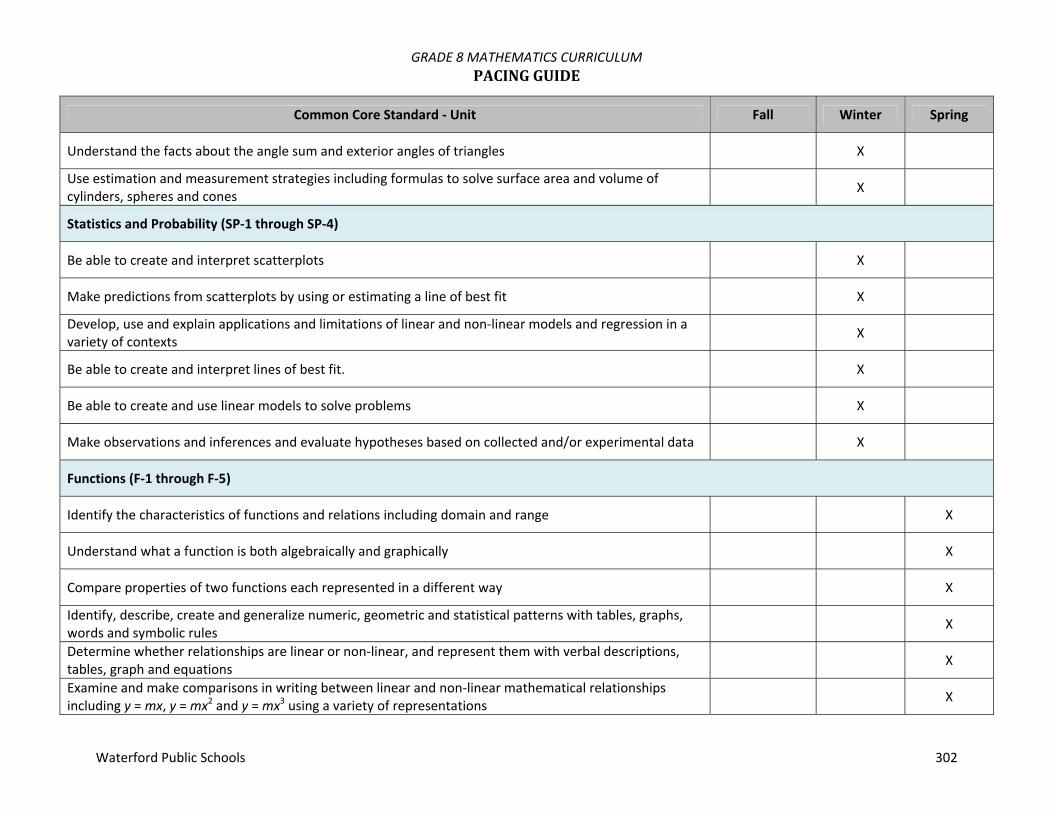
GRADE 8 MATHEMATICS CURRICULUM PACINGGUIDE
Waterford Public Schools 302
Common Core Standard ‐ Unit Fall Winter Spring
Understand the facts about the angle sum and exterior angles of triangles X
Use estimation and measurement strategies including formulas to solve surface area and volume of cylinders, spheres and cones X
Statistics and Probability (SP‐1 through SP‐4)
Be able to create and interpret scatterplots X
Make predictions from scatterplots by using or estimating a line of best fit X
Develop, use and explain applications and limitations of linear and non‐linear models and regression in a variety of contexts X
Be able to create and interpret lines of best fit. X
Be able to create and use linear models to solve problems X
Make observations and inferences and evaluate hypotheses based on collected and/or experimental data X
Functions (F‐1 through F‐5)
Identify the characteristics of functions and relations including domain and range X
Understand what a function is both algebraically and graphically X
Compare properties of two functions each represented in a different way X
Identify, describe, create and generalize numeric, geometric and statistical patterns with tables, graphs, words and symbolic rules X
Determine whether relationships are linear or non‐linear, and represent them with verbal descriptions, tables, graph and equations X
Examine and make comparisons in writing between linear and non‐linear mathematical relationships including y = mx, y = mx2 and y = mx3 using a variety of representations X

GRADE 8 MATHEMATICS CURRICULUM PACINGGUIDE
Waterford Public Schools 303
Common Core Standard ‐ Unit Fall Winter Spring
Represent functions and relations on the coordinate plane X
Be able to identify and interpret slope and y‐intercept X
Know how to read and interpret a linear or non‐linear graph X
Sketch a graph exhibiting the qualitative features of a function X
Equations and Expressions (EE‐5 through EE‐8)
Write and solve problems involving proportional relationships using linear equation X
Graph proportional relationships, interpreting the unit rate as the slope of the graph X
Compare two different proportional relationships represented in different ways X
Determine the constant rate of change (proportional constant) in a linear relationship and recognize this as the slope of a line X
Write and solve multi‐step equations using various algebraic methods including the distributive property X
Understand that a solution to a system of two equations is the point of intersection of the graphs X
Examine and solve systems of two linear equations X
Source: CT State Department of Education 5/7/12

GRADE 9‐12 MATHEMATICS CURRICULUM OVERVIEW
Waterford Public Schools 304
The high school standards specify the mathematics that all students should study in order to be college and career ready. Additional mathematics that students should learn in fourth credit courses or advanced courses such as calculus, advanced statistics, or discrete mathematics is indicated by (+). All standards without a (+) symbol should be in the common mathematics curriculum for all college and career ready students. Standards with a (+) symbol may also appear in courses intended for all students. The high school standards are listed in conceptual categories including Number and Quantity, Algebra, Functions, Modeling, Geometry, and Statistics and Probability, and Contemporary Mathematics. Conceptual categories portray a coherent view of high school mathematics; a student’s work with functions, for example, crosses a number of traditional course boundaries, potentially up through and including calculus. Modeling is best interpreted not as a collection of isolated topics but in relation to other standards. Making mathematical models is a Standard for Mathematical Practice, and specific modeling standards appear throughout the high school standards indicated by a star symbol ★. NumberandQuantity
The Real Number System (N‐RN) Quantities (N‐Q) The Complex Number System (N‐CN) Vector and Matrix Quantities (N‐VM)
Algebra
Seeing Structure in Expressions (A‐SSE) Arithmetic with Polynomials and Rational Expressions (A‐APR) Creating Equations (A‐CED) Reasoning with Equations and Inequalities (A‐REI)
Functions
Interpreting Functions (F‐IF) Building Functions (F‐BF) Linear, Quadratic, and Exponential Models (F‐LE) Trigonometric Functions (F‐TF)
Geometry Congruence (G‐CO) Similarity, Right Triangles, and Trigonometry (G‐SRT) Circles (G‐C) Expressing Geometric Properties with Equations (G‐GPE) Geometric Measurement and Dimension (G‐GMD) Modeling with Geometry (G‐MG)
Modeling StatisticsandProbability
Interpreting Categorical and Quantitative Data (S‐ID) Making Inferences and Justifying Conclusions (S‐IC) Conditional Probability and the Rules of Probability (S‐CP) Using Probability to Make Decisions (S‐MD)

GRADE 9‐12 MATHEMATICS CURRICULUM NUMBERANDQUANTITY
Waterford Public Schools 305
TheRealNumberSystem(N‐RN) Extend the properties of exponents to rational exponents Use properties of rational and irrational numbers.
Quantities(N‐Q)
Reason quantitatively and use units to solve problems TheComplexNumberSystem(N‐CN)
Perform arithmetic operations with complex numbers Represent complex numbers and their operations on the complex plane Use complex numbers in polynomial identities and equations
VectorandMatrixQuantities(N‐VM)
Represent and model with vector quantities. Perform operations on vectors. Perform operations on matrices and use matrices in applications.
MathematicalPractices(MP)1. Make sense of problems and persevere in solving them. 2. Reason abstractly and quantitatively. 3. Construct viable arguments and critique the reasoning of others. 4. Model with mathematics. 5. Use appropriate tools strategically. 6. Attend to precision. 7. Look for and make use of structure. 8. Look for and express regularity in repeated reasoning.

GRADE 9‐12 MATHEMATICS CURRICULUM NUMBERANDQUANTITY
Waterford Public Schools 306
NumbersandNumberSystemsDuring the years from kindergarten to eighth grade, students must repeatedly extend their conception of number. At first, “number” means “counting number”: 1, 2, 3…. Soon after that, 0 is used to represent “none” and the whole numbers are formed by the counting numbers together with zero. The next extension is fractions. At first, fractions are barely numbers and tied strongly to pictorial representations. Yet by the time students understand division of fractions, they have a strong concept of fractions as numbers and have connected them, via their decimal representations, with the base‐ten system used to represent the whole numbers. During middle school, fractions are augmented by negative fractions to form the rational numbers. In Grade 8, students extend this system once more, augmenting the rational numbers with the irrational numbers to form the real numbers. In high school, students will be exposed to yet another extension of number, when the real numbers are augmented by the imaginary numbers to form the complex numbers. With each extension of number, the meanings of addition, subtraction, multiplication, and division are extended. In each new number system—integers, rational numbers, real numbers, and complex numbers—the four operations stay the same in two important ways: They have the commutative, associative, and distributive properties and their new meanings are consistent with their previous meanings. Extending the properties of whole‐number exponents leads to new and productive notation. For example, properties of whole‐number exponents suggest that (51/3)3 should be 5(1/3)3 = 51 = 5 and that 51/3 should be the cube root of 5. Calculators, spreadsheets, and computer algebra systems can provide ways for students to become better acquainted with these new number systems and their notation. They can be used to generate data for numerical experiments, to help understand the workings of matrix, vector, and complex number algebra, and to experiment with non‐integer exponents. QuantitiesIn real world problems, the answers are usually not numbers but quantities: numbers with units, which involves measurement. In their work in measurement up through Grade 8, students primarily measure commonly used attributes such as length, area, and volume. In high school, students encounter a wider variety of units in modeling, e.g., acceleration, currency conversions, derived quantities such as person‐hours and heating degree days, social science rates such as per‐capita income, and rates in everyday life such as points scored per game or batting averages. They also encounter novel situations in which they themselves must conceive the attributes of interest. For example, to find a good measure of overall highway safety, they might propose measures such as fatalities per year, fatalities per year per driver, or fatalities per vehicle‐mile traveled. Such a conceptual process is sometimes called quantification. Quantification is important for science, as when surface area suddenly “stands out” as an important variable in evaporation. Quantification is also important for companies, which must conceptualize relevant attributes and create or choose suitable measures for them.

GRADE 9‐12 MATHEMATICS CURRICULUM NUMBERANDQUANTITY
Waterford Public Schools 307
Common Core State Standard Unwrapped Standard Explanation and Examples N‐RN:TheRealNumberSystem
ExtendthepropertiesofexponentstorationalexponentsN.RN.1 Explain how the definition of the meaning of rational exponents follows from extending the properties of integer exponents to those values, allowing for a notation for radicals in terms of rational exponents. For example, we define 51/3 to be the cube root of 5 because we want (5 1/3)3 = 5(1/3)3 to hold, so (5 1/3)3 must equal 5.
A. Understand that the denominator of the rational exponent is the root index and the numerator is the exponent of the radicand. For example, 5 1/2 = √5
B. Extend the properties of exponents to justify that (5 1/2 )2 = 5
A. Students may explain orally or in written format.
N.RN.2 Rewrite expressions involving radicals and rational exponents using the properties of exponents.
A. Convert from radical representation to using rational exponents and vice versa.
A. Examples:
2
3 2 35 5 ;
23 235 5
Rewrite using fractional exponents: 4
5 45 516 2 2
Rewrite 2
xx
in at least three alternate forms.
Solution: 32
3 32
1 1 1xx xxx
Rewrite 4 42 .using only rational exponents.
Rewrite 3 3 23 3 1x x x in simplest form.

GRADE 9‐12 MATHEMATICS CURRICULUM NUMBERANDQUANTITY
Waterford Public Schools 308
Common Core State Standard Unwrapped Standard Explanation and Examples Usepropertiesofrationalandirrationalnumbers
N.RN.3 Explain why the sum or product of two rational numbers is rational; that the sum of a rational number and an irrational number is irrational; and that the product of a nonzero rational number and an irrational number is irrational.
A. Know and justify that when adding or multiplying two rational numbers the result is a rational number
B. Know and justify that when adding a rational number and an irrational number the result is irrational.
C. Know and justify that when multiplying of a nonzero rational number and an irrational number the result is irrational
A. – C. Since every difference is a sum and every quotient is a product, this includes differences and quotients as well. Explaining why the four operations on rational numbers produce rational numbers can be a review of students understanding of fractions and negative numbers. Explaining why the sum of a rational and an irrational number is irrational, or why the product is irrational, includes reasoning about the inverse relationship between addition and subtraction (or between multiplication and addition). Example: Explain why the number 2π must be irrational, given that π is irrational. Answer: if 2π were rational, then half of 2π would also be rational, so π would have to be rational as well.
N‐Q:QuantitiesReasonquantitativelyanduseunitstosolveproblems
N.Q.1 Use units as a way to understand problems and to guide the solution of multi‐step problems; choose and interpret units consistently in formulas; choose and interpret the scale and the origin in graphs and data displays.
A. Interpret units in the context of the problem.
B. When solving a multi‐step problem, use units to evaluate the appropriateness of the solution.
C. Choose the appropriate units for a specific formula and interpret the meaning of the unit in that context.
D. Choose and interpret both the scale and the origin in graphs and
A. – D. Include word problems where quantities are given in different units, which must be converted to make sense of the problem. For example, a problem might have an object moving 12 feet per second and another at 5 miles per hour. To compare speeds, students convert 12 feet per second to miles per hour:
hr24day1
min60hr1
sec60min1sec24000 which is more
than 8 miles per hour.

GRADE 9‐12 MATHEMATICS CURRICULUM NUMBERANDQUANTITY
Waterford Public Schools 309
Common Core State Standard Unwrapped Standard Explanation and Examples data displays Graphical representations and data displays include,
but are not limited to: line graphs, circle graphs, histograms, multi‐line graphs, scatterplots, and multi‐bar graphs.
N.Q.2 Define appropriate quantities for the purpose of descriptive modeling.
A. Determine and interpret appropriate quantities when using descriptive modeling.
A. Examples: What type of measurements would one use to
determine their income and expenses for one month?
How could one express the number of accidents in Arizona?
N.Q.3 Choose a level of accuracy appropriate to limitations on measurement when reporting quantities.
A. Determine the accuracy of values based on their limitations in the context of the situation.
A. The margin of error and tolerance limit varies according to the measure, tool used, and context. Example: Determining price of gas by estimating to the nearest cent is appropriate because you will not pay in
fractions of a cent but the cost of gas is gallon
479.3$ .
N‐CN:TheComplexNumberSystemPerformarithmeticoperationswithcomplexnumbers
N.CN.1 Know there is a complex number i such that i2 = –1, and every complex number has the form a + bi with a and b real.
A. Know that every number is a complex number of the form a + bi, where a and b are real numbers.
B. Know that the complex number i2 = –1.

GRADE 9‐12 MATHEMATICS CURRICULUM NUMBERANDQUANTITY
Waterford Public Schools 310
Common Core State Standard Unwrapped Standard Explanation and Examples N.CN.2 Use the relation i2 = –1 and the commutative, associative, and distributive properties to add, subtract, and multiply complex numbers.
A. Apply the fact that the complex number i2 = –1.
B. Use the associative, commutative, and distributive properties, to add, subtract, and multiply complex numbers.
A. – B. Example: Simplify the following expression. Justify each
step using the commutative, associative and distributive properties. ii 4723
Solutions may vary; one solution follows:
ii
ii
ii
ii
iii
iii
iiiii
261326821
82621)1(82621
82621
8141221
8141221
8141221
4724734723
2
2
2
2
Distributive Property
Distributive Property
Distributive Property
Associative Property
Computation
Computation
Computation Commutative Property
12 i

GRADE 9‐12 MATHEMATICS CURRICULUM NUMBERANDQUANTITY
Waterford Public Schools 311
Common Core State Standard Unwrapped Standard Explanation and Examples N.CN.3 Find the conjugate of a complex number; use conjugates to find moduli and quotients of complex numbers.
A. Given a complex number, find its conjugate and use it to find quotients of complex numbers.
B. Find the magnitude (length), modulus (length) or absolute value (length), of the vector representation of a complex number.
A. – B. Example: Given w = 2 – 5i and z = 3 + 4i
a. Use the conjugate to find the modulus of w. b. Find the quotient of z and w.
Solution: a. b.
29
29
254
)1(254
254
2510104
5252
2
2
2
22
22
2
2
w
w
w
w
iw
iiiw
iiw
www
292314
254208156
5252
52435243
iwz
iiwz
ii
ii
wz
ii
wz

GRADE 9‐12 MATHEMATICS CURRICULUM NUMBERANDQUANTITY
Waterford Public Schools 312
Common Core State Standard Unwrapped Standard Explanation and Examples
RepresentcomplexnumbersandtheiroperationsonthecomplexplaneN.CN.4 Represent complex numbers on the complex plane in rectangular and polar form (including real and imaginary numbers), and explain why the rectangular and polar forms of a given complex number represent the same number.
A. Transform complex numbers in a complex plane from rectangular to polar form and vice versa.
B. Know and explain why both forms, rectangular and polar, represent the same number.
A. – B. Students will represent complex numbers using rectangular and polar coordinates. a + bi = r(cos θ + sin θ)
Examples: Plot the points corresponding to 3 – 2i and 1 + 4i.
Add these complex numbers and plot the result. How is this point related to the two others?
Write the complex number with modulus (absolute value) 2 and argument π/3 in rectangular form.
Find the modulus and argument ( 20 ) of
the number 6 6 . N.CN.5 Represent addition, subtraction, multiplication, and conjugation of complex numbers geometrically on the complex plane; use properties of this representation for computation. For example, (1 – √3i)3 = 8 because (1 – √3i) has modulus 2 and argument 120°.
A. Geometrically show addition, subtraction, and multiplication of complex numbers on the complex coordinate plane.
B. Geometrically show that the conjugate of complex numbers in a complex plane is the reflection across the x‐axis.
C. Evaluate the power of a complex number, in rectangular form,

GRADE 9‐12 MATHEMATICS CURRICULUM NUMBERANDQUANTITY
Waterford Public Schools 313
Common Core State Standard Unwrapped Standard Explanation and Examples using the polar form of that complex number.
N.CN.6 Calculate the distance between numbers in the complex plane as the modulus of the difference, and the midpoint of a segment as the average of the numbers at its endpoints.
A. Calculate the distance between values in the complex plane as the magnitude, modulus, of the difference, and the midpoint of a segment as the average of the coordinates of its endpoints.
UsecomplexnumbersinpolynomialidentitiesandequationsN.CN.7 Solve quadratic equations with real coefficients that have complex solutions.
A. Solve quadratic equations with real coefficients that have solutions of the form a + bi and a – bi.
A. Examples: Within which number system can x2 = – 2 be
solved? Explain how you know. Solve x2+ 2x + 2 = 0 over the complex numbers. Find all solutions of 2x2 + 5 = 2x and express them
in the form a + bi. N.CN.8 Extend polynomial identities to the complex numbers. For example, rewrite x2+ 4 as (x + 2i)(x – 2i).
A. Use polynomial identities to write equivalent expressions in the form of complex numbers

GRADE 9‐12 MATHEMATICS CURRICULUM NUMBERANDQUANTITY
Waterford Public Schools 314
Common Core State Standard Unwrapped Standard Explanation and Examples N.CN.9 Know the Fundamental Theorem of Algebra; show that it is true for quadratic polynomials.
A. Understand The Fundamental Theorem of Algebra, which says that the number of complex solutions to a polynomial equation is the same as the degree of the polynomial. Show that this is true for a quadratic polynomial.
A. Examples: How many zeros does 832 2 xx have? Find all
the zeros and explain, orally or in written format, your answer in terms of the Fundamental Theorem of Algebra.
How many complex zeros does the following polynomial have? How do you know?
12)3()2()3()( 22 xxxxxp
N‐VM:VectorandMatrixQuantitiesRepresentandmodelwithvectorquantities
N.VM.1 Recognize vector quantities as having both magnitude and direction. Represent vector quantities by directed line segments, and use appropriate symbols for vectors and their magnitudes (e.g., v, |v|, ||v||, v).
A. Know that a vector is a directed line segment representing magnitude and direction.
B. Use the appropriate symbol representation for vectors and their magnitude.
N.VM.2 Find the components of a vector by subtracting the coordinates of an initial point from the coordinates of a terminal point.
A. Find the component form of a vector by subtracting the coordinates of an initial point from the coordinates of a terminal point, therefore placing the initial point of the vector at the origin.
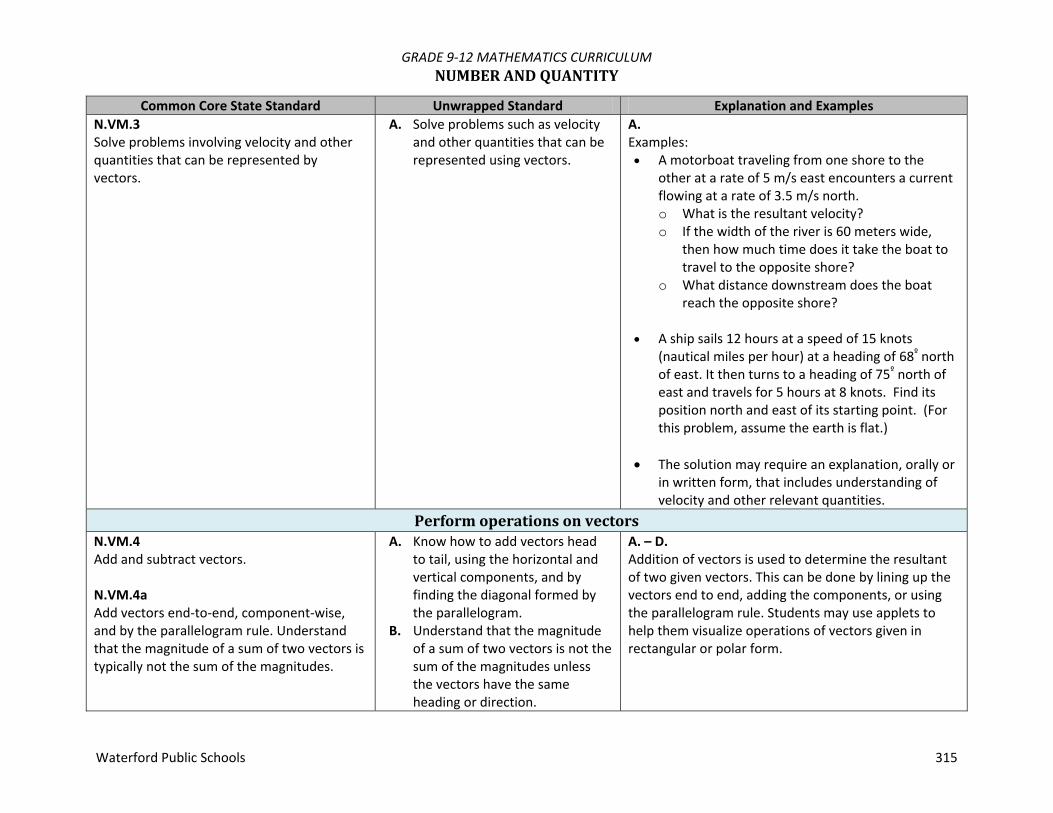
GRADE 9‐12 MATHEMATICS CURRICULUM NUMBERANDQUANTITY
Waterford Public Schools 315
Common Core State Standard Unwrapped Standard Explanation and Examples N.VM.3 Solve problems involving velocity and other quantities that can be represented by vectors.
A. Solve problems such as velocity and other quantities that can be represented using vectors.
A. Examples: A motorboat traveling from one shore to the
other at a rate of 5 m/s east encounters a current flowing at a rate of 3.5 m/s north. o What is the resultant velocity? o If the width of the river is 60 meters wide,
then how much time does it take the boat to travel to the opposite shore?
o What distance downstream does the boat reach the opposite shore?
A ship sails 12 hours at a speed of 15 knots
(nautical miles per hour) at a heading of 68º north of east. It then turns to a heading of 75º north of east and travels for 5 hours at 8 knots. Find its position north and east of its starting point. (For this problem, assume the earth is flat.)
The solution may require an explanation, orally or
in written form, that includes understanding of velocity and other relevant quantities.
PerformoperationsonvectorsN.VM.4 Add and subtract vectors. N.VM.4a Add vectors end‐to‐end, component‐wise, and by the parallelogram rule. Understand that the magnitude of a sum of two vectors is typically not the sum of the magnitudes.
A. Know how to add vectors head to tail, using the horizontal and vertical components, and by finding the diagonal formed by the parallelogram.
B. Understand that the magnitude of a sum of two vectors is not the sum of the magnitudes unless the vectors have the same heading or direction.
A. – D. Addition of vectors is used to determine the resultant of two given vectors. This can be done by lining up the vectors end to end, adding the components, or using the parallelogram rule. Students may use applets to help them visualize operations of vectors given in rectangular or polar form.

GRADE 9‐12 MATHEMATICS CURRICULUM NUMBERANDQUANTITY
Waterford Public Schools 316
Common Core State Standard Unwrapped Standard Explanation and Examples N.VM.4b Given two vectors in magnitude and direction form, determine the magnitude and direction of their sum. N.VM.4c Understand vector subtraction v – w as v + (–w), where –w is the additive inverse of w, with the same magnitude as w and pointing in the opposite direction. Represent vector subtraction graphically by connecting the tips in the appropriate order, and perform vector subtraction component‐wise.
C. Know how to subtract vectors and that vector subtraction is defined much like subtraction of real numbers, in that v – w is the same as v + (–w), where –w is the additive inverse of w. The opposite of w, ‐w, has the same magnitude, but the direction of the angle differs by 180.
D. Represent vector subtraction on a graph by connecting the vectors head to tail in the correct order and using the components of those vectors to find the difference.
Examples: Given two vectors u and v, can the magnitude of
the resultant be found by adding the magnitude of each vector? Use an example to illustrate your explanation.
If u = 8,2 and v = 8,2 , find u + v, u + (‐v), and u – v. Explain the relationship between u + (‐v) and u – v in terms of the vector components.
A plane is flying due east at an average speed of 500 miles per hour. There is a crosswind from the south at 60 miles per hour. What is the magnitude and direction of the resultant?
N.VM.5 Multiply a vector by a scalar. N.VM.5a Represent scalar multiplication graphically by scaling vectors and possibly reversing their direction; perform scalar multiplication component‐wise, e.g., as c(vx, vy) = (cvx, cvy).
N.VM.5b Compute the magnitude of a scalar multiple cv using ||cv|| = |c|v. Compute the direction of cv knowing that when |c|v 0, the direction
A. Represent scalar multiplication of vectors on a graph by increasing or decreasing the magnitude of the vector by the factor of the given scalar. If the scalar is less than zero, the new vector’s direction is opposite the original vector’s direction.
B. Represent scalar multiplication of vectors using the component form, such as c(vx, vy) = (cvx, cvy).
C. Find the magnitude of a scalar
A. – C. The result of multiplying a vector v by a positive scalar c is a vector in the same direction as v with a magnitude of cv. If c is negative, then the direction of v is reversed by scalar multiplication. Students will represent scalar multiplication graphically and component‐wise. Students may use applets to help them visualize operations of vectors given in rectangular or polar form. Example: Given u = 4,2 , write the components and draw
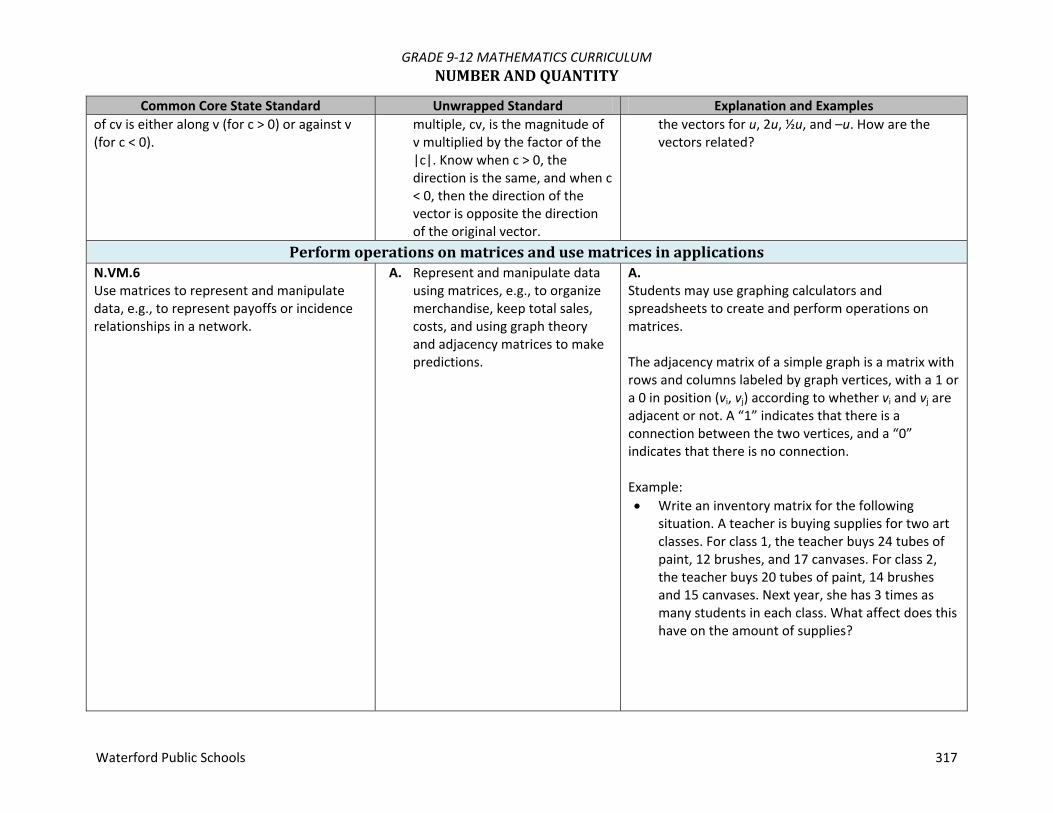
GRADE 9‐12 MATHEMATICS CURRICULUM NUMBERANDQUANTITY
Waterford Public Schools 317
Common Core State Standard Unwrapped Standard Explanation and Examples of cv is either along v (for c > 0) or against v (for c < 0).
multiple, cv, is the magnitude of v multiplied by the factor of the |c|. Know when c > 0, the direction is the same, and when c < 0, then the direction of the vector is opposite the direction of the original vector.
the vectors for u, 2u, ½u, and –u. How are the vectors related?
PerformoperationsonmatricesandusematricesinapplicationsN.VM.6 Use matrices to represent and manipulate data, e.g., to represent payoffs or incidence relationships in a network.
A. Represent and manipulate data using matrices, e.g., to organize merchandise, keep total sales, costs, and using graph theory and adjacency matrices to make predictions.
A. Students may use graphing calculators and spreadsheets to create and perform operations on matrices. The adjacency matrix of a simple graph is a matrix with rows and columns labeled by graph vertices, with a 1 or a 0 in position (vi, vj) according to whether vi and vj are adjacent or not. A “1” indicates that there is a connection between the two vertices, and a “0” indicates that there is no connection. Example: Write an inventory matrix for the following
situation. A teacher is buying supplies for two art classes. For class 1, the teacher buys 24 tubes of paint, 12 brushes, and 17 canvases. For class 2, the teacher buys 20 tubes of paint, 14 brushes and 15 canvases. Next year, she has 3 times as many students in each class. What affect does this have on the amount of supplies?

GRADE 9‐12 MATHEMATICS CURRICULUM NUMBERANDQUANTITY
Waterford Public Schools 318
Common Core State Standard Unwrapped Standard Explanation and Examples Solution: Year 1
Year 2
N.VM.7 Multiply matrices by scalars to produce new matrices, e.g., as when all of the payoffs in a game are doubled.
A. Multiply matrices by a scalar, e.g., when the inventory of jeans for July is twice that for January.
A. Students may use graphing calculators and spreadsheets to create and perform operations on matrices. Example:
80220634115197
3
The following is an inventory matrix for Company
A’s jellybean, lollipop, and gum flavors. The price per unit is $0.03 for jelly beans, gum, and lollipops. Determine the gross profit for each flavor and for the entire lot.
Class 1
Class 2
454260513672
P B C
Class 1
Class 2
151420171224
P B C

GRADE 9‐12 MATHEMATICS CURRICULUM NUMBERANDQUANTITY
Waterford Public Schools 319
Common Core State Standard Unwrapped Standard Explanation and Examples
N.VM.8 Add, subtract, and multiply matrices of appropriate dimensions.
A. Know that the dimensions of a matrix are based on the number of rows and columns.
B. Add, subtract, and multiply matrices of appropriate dimensions.
A. – B. Students may use graphing calculators and spreadsheets to create and perform operations on matrices. Example: Find 2A – B + C and BA given Matrices A, B and
C below.
Matrix A Matrix B
80220634115197
8639114718551823
Matrix C
87213809511274

GRADE 9‐12 MATHEMATICS CURRICULUM NUMBERANDQUANTITY
Waterford Public Schools 320
Common Core State Standard Unwrapped Standard Explanation and Examples N.VM.9 Understand that, unlike multiplication of numbers, matrix multiplication for square matrices is not a commutative operation, but still satisfies the associative and distributive properties.
A. Understand that matrix multiplication is not commutative, AB BA, however it is associative and satisfies the distributive properties.
A. Students may use graphing calculators and spreadsheets to create and perform operations on matrices. Example: Given
7926
5432
6431
CandBandA ;
determine if the following statements are true: o AB = BA o (AB)C = A(BC)
N.VM.10 Understand that the zero and identity matrices play a role in matrix addition and multiplication similar to the role of 0 and 1 in the real numbers. The determinant of a square matrix is nonzero if and only if the matrix has a multiplicative inverse.
A. Identify a zero matrix and understand that it behaves in matrix addition, subtraction, and multiplication, much like 0 in the real numbers system.
B. Identify an identity matrix for a square matrix and understand that it behaves in matrix multiplication much like the number 1 in the real number system.
C. Find the determinant of a square matrix, and know that it is a nonzero value if the matrix has an inverse.
D. Know that if a matrix has an inverse, then the determinant of a square matrix is a nonzero value.

GRADE 9‐12 MATHEMATICS CURRICULUM NUMBERANDQUANTITY
Waterford Public Schools 321
Common Core State Standard Unwrapped Standard Explanation and Examples N.VM.11 Multiply a vector (regarded as a matrix with one column) by a matrix of suitable dimensions to produce another vector. Work with matrices as transformations of vectors.
A. To translate the vector AB , where A(1,3) and B(4,9), 2 units to the right and 5 units up, perform the following matrix multiplication.
1114863
119341
100510201
A. A matrix is a two dimensional array with rows and columns; a vector is a one dimensional array that is either one row or one column of the matrix. Students will use matrices to transform geometric objects in the coordinate plane. Students may demonstrate transformations using dynamic geometry programs or applets. They will explain the relationship between the ordered pair representation of a vector and its graphical representation.
N.VM.12 Work with 2 × 2 matrices as a transformations of the plane, and interpret the absolute value of the determinant in terms of area.
A. Given the coordinates of the vertices of a parallelogram in the coordinate plane, find the vector representation for two adjacent sides with the same initial point. Write the components of the vectors in a 2x2 matrix and find the determinant of the 2x2 matrix. The absolute value of the determinant is the area of the parallelogram. (This is called the dot product of the two vectors.)
A. Students should be able to utilize matrix multiplication to perform reflections, rotations and dilations, and find the area of a parallelogram. Students may demonstrate these relationships using dynamic geometry programs or applets.

GRADE 9‐12 MATHEMATICS CURRICULUM ALGEBRA
Waterford Public Schools 322
SeeingStructureinExpressions(A‐SSE) Interpret the structure of expressions Write expressions in equivalent forms to solve problems
ArithmeticwithPolynomialsandRationalExpressions(A‐APR)
Perform arithmetic operations on polynomials Understand the relationship between zeros and factors of polynomials Use polynomial identities to solve problems Rewrite rational expressions
CreatingEquations(A‐CED)
Create equations that describe numbers or relationships ReasoningwithEquationsandInequalities(A‐REI)
Understand solving equations as a process of reasoning and explain the reasoning Solve equations and inequalities in one variable Solve systems of equations Represent and solve equations and inequalities graphically
MathematicalPractices(MP)1. Make sense of problems and persevere in solving them. 2. Reason abstractly and quantitatively. 3. Construct viable arguments and critique the reasoning of others. 4. Model with mathematics. 5. Use appropriate tools strategically. 6. Attend to precision. 7. Look for and make use of structure. 8. Look for and express regularity in repeated reasoning.

GRADE 9‐12 MATHEMATICS CURRICULUM ALGEBRA
Waterford Public Schools 323
Expressions An expression is a record of a computation with numbers, symbols that represent numbers, arithmetic operations, exponentiation, and, at more advanced levels, the operation of evaluating a function. Conventions about the use of parentheses and the order of operations assure that each expression is unambiguous. Creating an expression that describes a computation involving a general quantity requires the ability to express the computation in general terms, abstracting from specific instances. Reading an expression with comprehension involves analysis of its underlying structure. This may suggest a different but equivalent way of writing the expression that exhibits some different aspect of its meaning. For example, p + 0.05p can be interpreted as the addition of a 5% tax to a price p. Rewriting p + 0.05p as 1.05p shows that adding a tax is the same as multiplying the price by a constant factor. Algebraic manipulations are governed by the properties of operations and exponents, and the conventions of algebraic notation. At times, an expression is the result of applying operations to simpler expressions. For example, p + 0.05p is the sum of the simpler expressions p and 0.05p. Viewing an expression as the result of operation on simpler expressions can sometimes clarify its underlying structure. A spreadsheet or a computer algebra system (CAS) can be used to experiment with algebraic expressions, perform complicated algebraic manipulations, and understand how algebraic manipulations behave. EquationsandInequalitiesAn equation is a statement of equality between two expressions, often viewed as a question asking for which values of the variables the expressions on either side are in fact equal. These values are the solutions to the equation. An identity, in contrast, is true for all values of the variables; identities are often developed by rewriting an expression in an equivalent form. The solutions of an equation in one variable form a set of numbers; the solutions of an equation in two variables form a set of ordered pairs of numbers, which can be plotted in the coordinate plane. Two or more equations and/or inequalities form a system. A solution for such a system must satisfy every equation and inequality in the system. An equation can often be solved by successively deducing from it one or more simpler equations. For example, one can add the same constant to both sides without changing the solutions, but squaring both sides might lead to extraneous solutions. Strategic competence in solving includes looking ahead for productive manipulations and anticipating the nature and number of solutions. Some equations have no solutions in a given number system, but have a solution in a larger system. For example, the solution of x + 1 = 0 is an integer, not a whole number; the solution of 2x + 1 = 0 is a rational number, not an integer; the solutions of x2 – 2 = 0 are real numbers, not rational numbers; and the solutions of x2 + 2 = 0 are complex numbers, not real numbers.

GRADE 9‐12 MATHEMATICS CURRICULUM ALGEBRA
Waterford Public Schools 324
The same solution techniques used to solve equations can be used to rearrange formulas. For example, the formula for the area of a trapezoid, A = ((b1+b2)/2)h, can be solved for h using the same deductive process. Inequalities can be solved by reasoning about the properties of inequality. Many, but not all, of the properties of equality continue to hold for inequalities and can be useful in solving them. ConnectionstoFunctionsandModelingExpressions can define functions, and equivalent expressions define the same function. Asking when two functions have the same value for the same input leads to an equation; graphing the two functions allows for finding approximate solutions of the equation. Converting a verbal description to an equation, inequality, or system of these is an essential skill in modeling.

GRADE 9‐12 MATHEMATICS CURRICULUM ALGEBRA
Waterford Public Schools 325
Common Core State Standard Unwrapped Standard Explanation and Examples A‐SSE:SeeingStructureinExpressionsInterpretthestructureofexpressions
A.SSE.1★ Interpret expressions that represent a quantity in terms of its context. A.SSE.1a Interpret parts of an expression, such as terms, factors, and coefficients. A.SSE.1b Interpret complicated expressions by viewing one or more of their parts as a single entity. For example, interpret P(1+r)n as the product of P and a factor not depending on P.
A. Identify the different parts of the expression and explain their meaning within the context of a problem.
B. Decompose expressions and make sense of the multiple factors and terms by explaining the meaning of the individual parts.
A. Students should understand the vocabulary for the parts that make up the whole expression and be able to identify those parts and interpret there meaning in terms of a context.
A.SSE.2 Use the structure of an expression to identify ways to rewrite it. For example, see x4 – y4 as (x2)2 – (y2)2, thus recognizing it as a difference of squares that can be factored as (x2 – y2)(x2 + y2).
A. Rewrite algebraic expressions in different equivalent forms such as factoring or combining like terms.
B. Use factoring techniques such as common factors, grouping, the difference of two squares, the sum or difference of two cubes, or a combination of methods to factor completely.
C. Simplify expressions including combining like terms, using the distributive property
A. Students should extract the greatest common factor (whether a constant, a variable, or a combination of each). If the remaining expression is quadratic, students should factor the expression further. Example:
Factor xxx 352 23
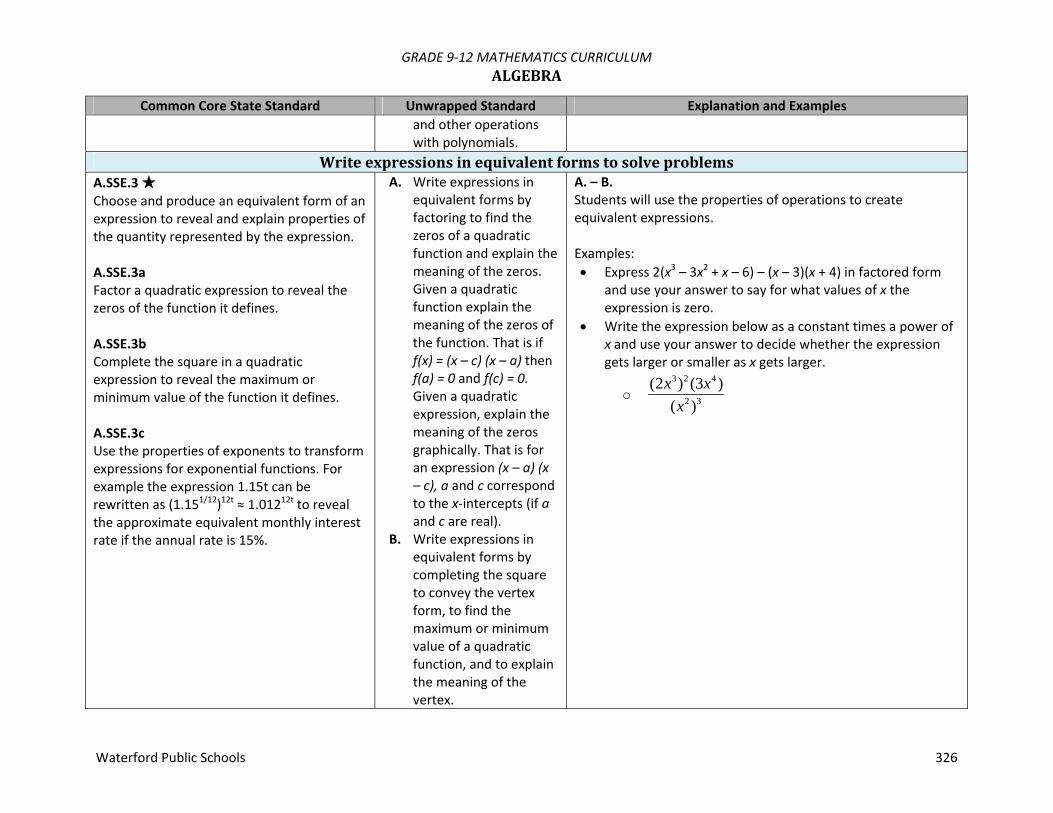
GRADE 9‐12 MATHEMATICS CURRICULUM ALGEBRA
Waterford Public Schools 326
Common Core State Standard Unwrapped Standard Explanation and Examples and other operations with polynomials.
WriteexpressionsinequivalentformstosolveproblemsA.SSE.3 ★ Choose and produce an equivalent form of an expression to reveal and explain properties of the quantity represented by the expression. A.SSE.3a Factor a quadratic expression to reveal the zeros of the function it defines. A.SSE.3b Complete the square in a quadratic expression to reveal the maximum or minimum value of the function it defines. A.SSE.3c Use the properties of exponents to transform expressions for exponential functions. For example the expression 1.15t can be rewritten as (1.151/12)12t ≈ 1.01212t to reveal the approximate equivalent monthly interest rate if the annual rate is 15%.
A. Write expressions in equivalent forms by factoring to find the zeros of a quadratic function and explain the meaning of the zeros. Given a quadratic function explain the meaning of the zeros of the function. That is if f(x) = (x – c) (x – a) then f(a) = 0 and f(c) = 0. Given a quadratic expression, explain the meaning of the zeros graphically. That is for an expression (x – a) (x – c), a and c correspond to the x‐intercepts (if a and c are real).
B. Write expressions in equivalent forms by completing the square to convey the vertex form, to find the maximum or minimum value of a quadratic function, and to explain the meaning of the vertex.
A. – B. Students will use the properties of operations to create equivalent expressions. Examples: Express 2(x3 – 3x2 + x – 6) – (x – 3)(x + 4) in factored form
and use your answer to say for what values of x the expression is zero.
Write the expression below as a constant times a power of x and use your answer to decide whether the expression gets larger or smaller as x gets larger.
o 3 2 4
2 3
(2 ) (3 )( )
x xx

GRADE 9‐12 MATHEMATICS CURRICULUM ALGEBRA
Waterford Public Schools 327
Common Core State Standard Unwrapped Standard Explanation and Examples C. Use properties of
exponents (such as power of a power, product of powers, power of a product, and rational exponents, etc.) to write an equivalent form of an exponential function to reveal and explain specific information about its approximate rate of growth or decay.
A.SSE.4 ★ Derive the formula for the sum of a finite geometric series (when the common ratio is not 1), and use the formula to solve problems. For example, calculate mortgage payments.
A. Develop the formula for the sum of a finite geometric series when the ratio is not 1.
B. Use the formula to solve real world problems such as calculating the height of a tree after n years given the initial height of the tree and the rate the tree grows each year. Calculate mortgage payments.
A. – B. Example: In February, the Bezanson family starts saving for a trip to
Australia in September. The Bezanson’s expect their vacation to cost $5375. They start with $525. Each month they plan to deposit 20% more than the previous month. Will they have enough money for their trip?

GRADE 9‐12 MATHEMATICS CURRICULUM ALGEBRA
Waterford Public Schools 328
Common Core State Standard Unwrapped Standard Explanation and Examples A‐APR:ArithmeticwithPolynomialsandRationalExpressions
PerformarithmeticoperationsonpolynomialsA.APR.1 Understand that polynomials form a system analogous to the integers, namely, they are closed under the operations of addition, subtraction, and multiplication; add, subtract, and multiply polynomials.
A. Understand the definition of a polynomial.
B. Understand the concepts of combining like terms and closure.
C. Add, subtract, and multiply polynomials and understand how closure applies under these operations.
UnderstandtherelationshipbetweenzerosandfactorsofpolynomialsA.APR.2 Know and apply the Remainder Theorem: For a polynomial p(x) and a number a, the remainder on division by x – a is p(a), so p(a) = 0 if and only if (x – a) is a factor of p(x).
A. Understand and apply the Remainder Theorem.
B. Understand how this standard relates to A.SSE.3a.
C. Understand that a is a root of a polynomial function if and only if x‐a is a factor of the function.
A. – C. The Remainder theorem says that if a polynomial p(x) is divided by x – a, then the remainder is the constant p(a). That is, p(x)q(x)(x a) p(a).So if p(a) = 0 then p(x) = q(x)(x‐a). Let p(x) x53x48x2 9x30 . Evaluate p(‐2). What does your answer tell you about the factors of p(x)? [Answer: p(‐2) = 0 so x+2 is a factor.]
A.APR.3 Identify zeros of polynomials when suitable factorizations are available, and use the zeros to construct a rough graph of the function defined by the polynomial.
A. Find the zeros of a polynomial when the polynomial is factored.
B. Use the zeros of a function to sketch a graph of the function.
A. – B. Graphing calculators or programs can be used to generate graphs of polynomial functions. Example: Factor the expression x3 4x2 59x 126and explain
how your answer can be used to solve the equation
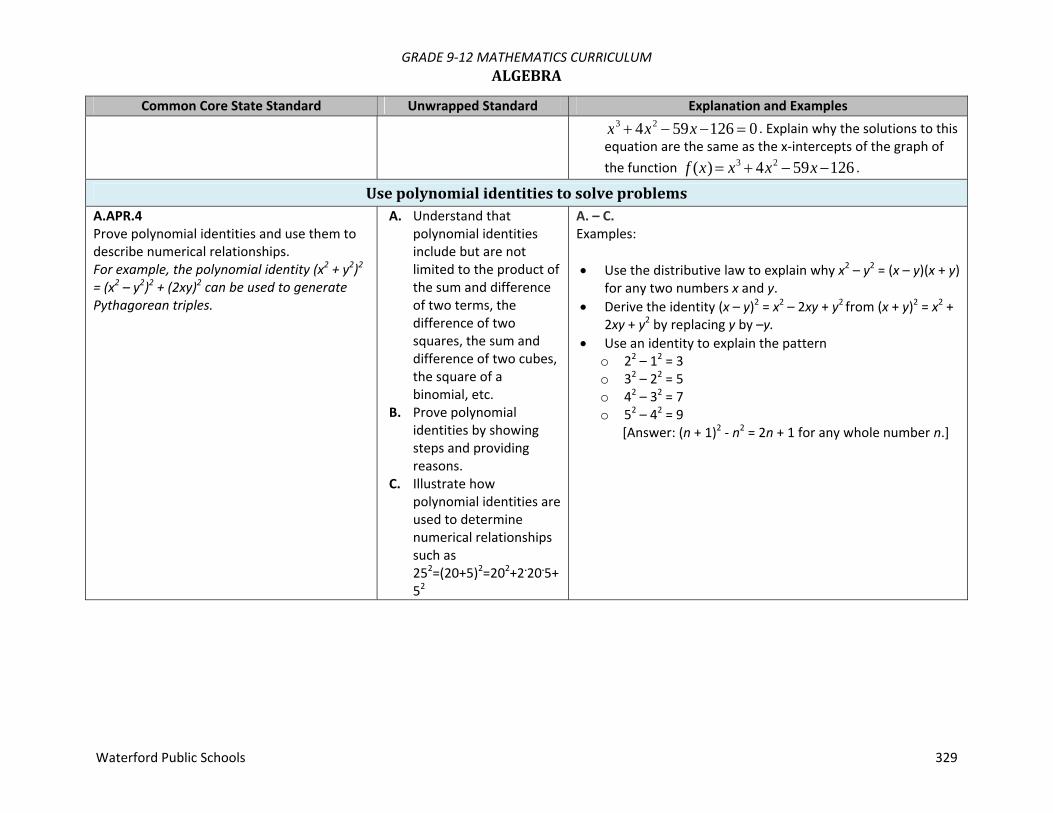
GRADE 9‐12 MATHEMATICS CURRICULUM ALGEBRA
Waterford Public Schools 329
Common Core State Standard Unwrapped Standard Explanation and Examples
x3 4x2 59x 126 0 . Explain why the solutions to this equation are the same as the x‐intercepts of the graph of the function f (x) x3 4x2 59x 126 .
UsepolynomialidentitiestosolveproblemsA.APR.4 Prove polynomial identities and use them to describe numerical relationships. For example, the polynomial identity (x2 + y2)2 = (x2 – y2)2 + (2xy)2 can be used to generate Pythagorean triples.
A. Understand that polynomial identities include but are not limited to the product of the sum and difference of two terms, the difference of two squares, the sum and difference of two cubes, the square of a binomial, etc.
B. Prove polynomial identities by showing steps and providing reasons.
C. Illustrate how polynomial identities are used to determine numerical relationships such as 252=(20+5)2=202+2.20.5+52
A. – C. Examples: Use the distributive law to explain why x2 – y2 = (x – y)(x + y)
for any two numbers x and y. Derive the identity (x – y)2 = x2 – 2xy + y2 from (x + y)2 = x2 +
2xy + y2 by replacing y by –y. Use an identity to explain the pattern
o 22 – 12 = 3 o 32 – 22 = 5 o 42 – 32 = 7 o 52 – 42 = 9
[Answer: (n + 1)2 ‐ n2 = 2n + 1 for any whole number n.]

GRADE 9‐12 MATHEMATICS CURRICULUM ALGEBRA
Waterford Public Schools 330
Common Core State Standard Unwrapped Standard Explanation and Examples A.APR.5 Know and apply the Binomial Theorem for the expansion of (x + y)n in powers of x and y for a positive integer n, where x and y are any numbers, with coefficients determined for example by Pascal’s Triangle.1 1The Binomial Theorem can be proved by mathematical induction or by a combinatorial argument.
A. For small values of n, use Pascal’s Triangle to determine the coefficients of the binomial expansion.
B. Use the Binomial Theorem to find the nth term in the expansion of a binomial to a positive power.
Examples: Use Pascal’s Triangle to expand the expression 4)12( x .
Find the middle term in the expansion of 182 )2( x .
↑ ↑ ↑ ↑ ↑ 4C0 4C1 4C2 4C3 4C4
RewriterationalexpressionsA.APR.6 Rewrite simple rational expressions in different forms; write a(x)/b(x) in the form q(x) + r(x)/b(x), where a(x), b(x), q(x), and r(x) are polynomials with the degree of r(x) less than the degree of b(x), using inspection, long division, or, for the more complicated examples, a computer algebra system.
A. Rewrite rational
expressions,
a xb x
, in
the form
r xq x
b x
by using factoring, long division, or synthetic division. Use a computer algebra system for complicated examples to assist with building a broader conceptual understanding.
A. The polynomial q(x) is called the quotient and the polynomial r(x) is called the remainder. Expressing a rational expression in this form allows one to see different properties of the graph, such as horizontal asymptotes. Examples: Find the quotient and remainder for the rational expression
and use them to write the expression in a different form.
Express in a form that reveals the horizontal
asymptote of its graph. [Answer: 2 , so the horizontal asymptote is y = 2.]
(x+1)3 = x3+3x2+3x+1

GRADE 9‐12 MATHEMATICS CURRICULUM ALGEBRA
Waterford Public Schools 331
Common Core State Standard Unwrapped Standard Explanation and Examples A.APR.7 Understand that rational expressions form a system analogous to the rational numbers, closed under addition, subtraction, multiplication, and division by a nonzero rational expression; add, subtract, multiply, and divide rational expressions.
A. Simplify rational expressions by adding, subtracting, multiplying, or dividing.
B. Understand that rational expressions are closed under addition, subtraction, multiplication, and division (by a nonzero expression).
A. – B. Examples: Use the formula for the sum of two fractions to explain why
the sum of two rational expressions is another rational expression.
Express in the form / , where a(x) and b(x) are polynomials.
A‐CED:CreatingEquationsCreateequationsthatdescribenumbersorrelationships
A.CED.1 Create equations and inequalities in one variable and use them to solve problems. Include equations arising from linear and quadratic functions, and simple rational and exponential functions.
A. Create linear, quadratic, rational and exponential equations and inequalities in one variable and use them in a contextual situation to solve problems.
A. Equations can represent real world and mathematical problems. Include equations and inequalities that arise when comparing the values of two different functions, such as one describing linear growth and one describing exponential growth. Examples: Given that the following trapezoid has area 54 cm2, set up
an equation to find the length of the base, and solve the equation.
Lava coming from the eruption of a volcano follows a parabolic path. The height h in feet of a piece of lava t seconds after it is ejected from the volcano is given by
16 936. After how many seconds does the lava reach its maximum height of 1000 feet?

GRADE 9‐12 MATHEMATICS CURRICULUM ALGEBRA
Waterford Public Schools 332
Common Core State Standard Unwrapped Standard Explanation and Examples A.CED.2 Create equations in two or more variables to represent relationships between quantities; graph equations on coordinate axes with labels and scales.
A. Create equations in two or more variables to represent relationships between quantities.
B. Graph equations in two variables on a coordinate plane and label the axes and scales.
A.CED.3 Represent constraints by equations or inequalities, and by systems of equations and/or inequalities, and interpret solutions as viable or non‐ viable options in a modeling context. For example, represent inequalities describing nutritional and cost constraints on combinations of different foods.
A. Write and use a system of equations and/or inequalities to solve a real world problem. Recognize that the equations and inequalities represent the constraints of the problem. Use the Objective Equation and the Corner Principle to determine the solution to the problem. (Linear Programming)
A. Example: A club is selling hats and jackets as a fundraiser. Their
budget is $1500 and they want to order at least 250 items. They must buy at least as many hats as they buy jackets. Each hat costs $5 and each jacket costs $8. o Write a system of inequalities to represent the
situation. o Graph the inequalities. o If the club buys 150 hats and 100 jackets, will the
conditions be satisfied? o What is the maximum number of jackets they can buy
and still meet the conditions?
A.CED.4 Rearrange formulas to highlight a quantity of interest, using the same reasoning as in solving equations. For example, rearrange Ohm’s law V = IR to highlight resistance R.
A. Solve multi‐variable formulas or literal equations, for a specific variable.
A. Examples: The Pythagorean Theorem expresses the relation between
the legs a and b of a right triangle and its hypotenuse c with the equation a2 + b2 = c2. o Why might the theorem need to be solved for c? o Solve the equation for c and write a problem situation
where this form of the equation might be useful.
Solve 343
V r for radius r.

GRADE 9‐12 MATHEMATICS CURRICULUM ALGEBRA
Waterford Public Schools 333
Common Core State Standard Unwrapped Standard Explanation and Examples Motion can be described by the formula below, where t =
time elapsed, u = initial velocity, a = acceleration, and s = distance traveled s = ut+½at2
o Why might the equation need to be rewritten in terms of a?
o Rewrite the equation in terms of a. A‐REI:ReasoningwithEquationsandInequalities
UnderstandsolvingequationsasaprocessofreasoningandexplainthereasoningA.REI.1 Explain each step in solving a simple equation as following from the equality of numbers asserted at the previous step, starting from the assumption that the original equation has a solution. Construct a viable argument to justify a solution method.
A. Assuming an equation has a solution, construct a convincing argument that justifies each step in the solution process. Justifications may include the associative, commutative, and division properties, combining like terms, multiplication by 1, etc.
A. Properties of operations can be used to change expressions on either side of the equation to equivalent expressions. In addition, adding the same term to both sides of an equation or multiplying both sides by a non‐zero constant produces an equation with the same solutions. Other operations, such as squaring both sides, may produce equations that have extraneous solutions. Examples: Explain why the equation x/2 + 7/3 = 5 has the same
solutions as the equation 3x + 14 = 30. Does this mean that x/2 + 7/3 is equal to 3x + 14?
Show that x = 2 and x = ‐3 are solutions to the equation 6. Write the equation in a form that shows these
are the only solutions, explaining each step in your reasoning.

GRADE 9‐12 MATHEMATICS CURRICULUM ALGEBRA
Waterford Public Schools 334
Common Core State Standard Unwrapped Standard Explanation and Examples A.REI.2 Solve simple rational and radical equations in one variable, and give examples showing how extraneous solutions may arise.
A. Solve simple rational and radical equations in one variable and provide examples of how extraneous solutions arise.
A. Examples: 52 x
215287
x
2
473 x
SolveequationsandinequalitiesinonevariableA.REI.3 Solve linear equations and inequalities in one variable, including equations with coefficients represented by letters.
A. Solve linear equations in one variable, including coefficients represented by letters.
B. Solve linear inequalities in one variable, including coefficients represented by letters.
A. – B. Examples:
7 8 1113
y
3x > 9 ax + 7 = 12
4
97
3
xx
Solve for x: 2/3x + 9 < 18 A.REI.4a Use the method of completing the square to transform any quadratic equation in x into an equation of the form (x – p)2 = q that has the same solutions. Derive the quadratic formula from this form.
A. Transform a quadratic equation written in standard form to an equation in vertex form ‐ by completing the
square. 2x p q
B. Derive the quadratic formula by completing the square on the standard form of a quadratic equation.
A. – B. Students should solve by factoring, completing the square, and using the quadratic formula. The zero product property is used to explain why the factors are set equal to zero. Students should relate the value of the discriminant to the type of root to expect. A natural extension would be to relate the type of solutions to ax2 + bx + c = 0 to the behavior of the graph of y = ax2 + bx + c .

GRADE 9‐12 MATHEMATICS CURRICULUM ALGEBRA
Waterford Public Schools 335
Common Core State Standard Unwrapped Standard Explanation and Examples A.REI.4b Solve quadratic equations by inspection (e.g., for x2 = 49), taking square roots, completing the square, the quadratic formula and factoring, as appropriate to the initial form of the equation. Recognize when the quadratic formula gives complex solutions and write them as a ± bi for real numbers a and b.
A. Solve quadratic equations in one variable by simple inspection, taking the square root, factoring, and completing the square.
B. Understand why taking the square root of both sides of an equation yields two solutions.
C. Use the quadratic formula to solve any quadratic equation, recognizing the formula produces all complex solutions. Write the solutions in the form , where a and b are real numbers. bi a ±
D. Explain how complex solutions affect the graph of a quadratic equation.
A. – D.
Value of Discriminant
Nature of Roots Nature of Graph
b2 – 4ac = 0 1 real roots intersects x‐axis once
b2 – 4ac > 0 2 real roots intersects x‐axis twice
b2 – 4ac < 0 2 complex roots
does not intersect x‐axis
Are the roots of 2x2 + 5 = 2x real or complex? How many
roots does it have? Find all solutions of the equation. What is the nature of the roots of x2 + 6x + 10 = 0? Solve
the equation using the quadratic formula and completing the square. How are the two methods related?
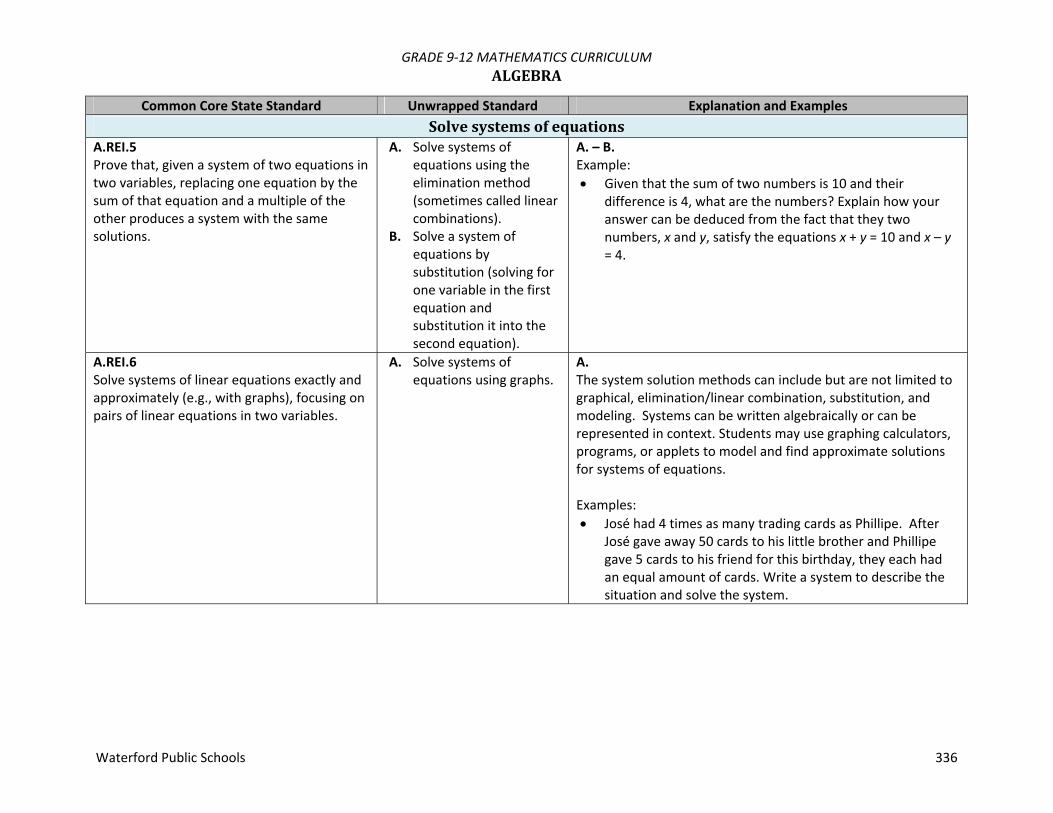
GRADE 9‐12 MATHEMATICS CURRICULUM ALGEBRA
Waterford Public Schools 336
Common Core State Standard Unwrapped Standard Explanation and Examples Solvesystemsofequations
A.REI.5 Prove that, given a system of two equations in two variables, replacing one equation by the sum of that equation and a multiple of the other produces a system with the same solutions.
A. Solve systems of equations using the elimination method (sometimes called linear combinations).
B. Solve a system of equations by substitution (solving for one variable in the first equation and substitution it into the second equation).
A. – B. Example: Given that the sum of two numbers is 10 and their
difference is 4, what are the numbers? Explain how your answer can be deduced from the fact that they two numbers, x and y, satisfy the equations x + y = 10 and x – y = 4.
A.REI.6 Solve systems of linear equations exactly and approximately (e.g., with graphs), focusing on pairs of linear equations in two variables.
A. Solve systems of equations using graphs.
A. The system solution methods can include but are not limited to graphical, elimination/linear combination, substitution, and modeling. Systems can be written algebraically or can be represented in context. Students may use graphing calculators, programs, or applets to model and find approximate solutions for systems of equations. Examples: José had 4 times as many trading cards as Phillipe. After
José gave away 50 cards to his little brother and Phillipe gave 5 cards to his friend for this birthday, they each had an equal amount of cards. Write a system to describe the situation and solve the system.

GRADE 9‐12 MATHEMATICS CURRICULUM ALGEBRA
Waterford Public Schools 337
Common Core State Standard Unwrapped Standard Explanation and Examples
Solve the system of equations: x+ y = 11 and 3x – y = 5.
Use a second method to check your answer. Solve the system of equations: x – 2y + 3z = 5, x + 3z = 11, 5y – 6z = 9.
The opera theater contains 1,200 seats, with three different prices. The seats cost $45 dollars per seat, $50 per seat, and $60 per seat. The opera needs to gross $63,750 on seat sales. There are twice as many $60 seats as $45 seats. How many seats in each level need to be sold?
A.REI.7 Solve a simple system consisting of a linear equation and a quadratic equation in two variables algebraically and graphically. For example, find the points of intersection between the line y = –3x and the circle x2 + y2 = 3.
A. Solve a system containing a linear equation and a quadratic equation in two variables (conic sections possible) graphically and symbolically.
A. Example: Two friends are driving to the Grand Canyon in separate
cars. Suzette has been there before and knows the way but Andrea does not. During the trip Andrea gets ahead of Suzette and pulls over to wait for her. Suzette is traveling at a constant rate of 65 miles per hour. Andrea sees Suzette drive past. To catch up, Andrea accelerates at a constant rate. The distance in miles (d) that her car travels as a function of time in hours (t) since Suzette’s car passed is given by d = 3500t2.
Write and solve a system of equations to determine how long it takes for Andrea to catch up with Suzette.

GRADE 9‐12 MATHEMATICS CURRICULUM ALGEBRA
Waterford Public Schools 338
Common Core State Standard Unwrapped Standard Explanation and Examples A.REI.8 Represent a system of linear equations as a single matrix equation in a vector variable.
A. Write a system of linear equations as a single matrix equation.
A. Example:
Write the system
11320
42
cacba
cb as a matrix equation.
Identify the coefficient matrix, the variable matrix, and the constant matrix.
A.REI.9 Find the inverse of a matrix if it exists and use it to solve systems of linear equations (using technology for matrices of dimension 3 × 3 or greater).
A. Find the inverse of a matrix if it exists and use it to solve systems of linear equations (using technology for matrices of dimension 3 × 3 or greater). Find the dimension
of matrices. Understand when
matrices can be multiplied.
Understand that matrix multiplication is not commutative.
Understand the concept of an identity matrix.
Understand why multiplication by the inverse of the coefficient matrix yields a solution to the system (if it exists).
A. Students will perform multiplication, addition, subtraction, and scalar multiplication of matrices. They will use the inverse of a matrix to solve a matrix equation. Students may use graphing calculators, programs, or applets to model and find solutions for systems of equations. Example: Solve the system of equations by converting to a matrix
equation and using the inverse of the coefficient matrix. 5 2 43 2 0x yx y
Solution:
Matrix
2325
A
Matrix x
Xy
Matrix 40
B

GRADE 9‐12 MATHEMATICS CURRICULUM ALGEBRA
Waterford Public Schools 339
Common Core State Standard Unwrapped Standard Explanation and Examples
45
43
21
21
=Matrix A 1-
1X A B
3
204
45
43
21
21
yx
RepresentandsolveequationsandinequalitiesgraphicallyA.REI.10 Understand that the graph of an equation in two variables is the set of all its solutions plotted in the coordinate plane, often forming a curve (which could be a line).
A. Understand that all solutions to an equation in two variables are contained on the graph of that equation.
A. Example: Which of the following points is on the circle with equation
1 2 5? (a) (1, ‐2) (b) (2, 2) (c) (3, ‐1) (d) (3, 4)
A.REI.11 ★ Explain why the x‐coordinates of the points where the graphs of the equations y = f(x) and y = g(x) intersect are the solutions of the equation f(x) = g(x); find the solutions approximately, e.g., using technology to graph the functions, make tables of values, or find successive approximations. Include cases where f(x) and/or g(x) are linear, polynomial, rational, absolute value, exponential, and logarithmic functions.
A. Explain why the intersection of y = f(x) and y = g(x) is the solution of f(x) = g(x) for any combination of linear, polynomial, rational, absolute value, exponential, and logarithmic functions. Find the solution(s) by: Using technology to
graph the equations and determine their point of intersection,
Using tables of values, or
A. Students need to understand that numerical solution methods (data in a table used to approximate an algebraic function) and graphical solution methods may produce approximate solutions, and algebraic solution methods produce precise solutions that can be represented graphically or numerically. Students may use graphing calculators or programs to generate tables of values, graph, or solve a variety of functions. Example: Given the following equations determine the x value that
results in an equal output for both functions.
1)3()(
23)(2
xxg
xxf
GRADE 9‐12 MATHEMATICS CURRICULUM ALGEBRA
Waterford Public Schools 340
Common Core State Standard Unwrapped Standard Explanation and Examples Using successive
approximations that become closer and closer to the actual value.
A.REI.12 Graph the solutions to a linear inequality in two variables as a half‐ plane (excluding the boundary in the case of a strict inequality), and graph the solution set to a system of linear inequalities in two variables as the intersection of the corresponding half‐planes.
A. Graph the solutions to a linear inequality in two variables as a half‐plane, excluding the boundary for non‐inclusive inequalities.
B. Graph the solution set to a system of linear inequalities in two variables as the intersection of their corresponding half‐planes.
A. – B. Students may use graphing calculators, programs, or applets to model and find solutions for inequalities or systems of inequalities. Examples: Graph the solution: y < 2x + 3. A publishing company publishes a total of no more than
100 magazines every year. At least 30 of these are women’s magazines, but the company always publishes at least as many women’s magazines as men’s magazines. Find a system of inequalities that describes the possible number of men’s and women’s magazines that the company can produce each year consistent with these policies. Graph the solution set.
Graph the system of linear inequalities below and determine if (3, 2) is a solution to the system.
33203
yxyxyx

GRADE 9‐12 MATHEMATICS CURRICULUM ALGEBRA
Waterford Public Schools 341
Common Core State Standard Unwrapped Standard Explanation and Examples Solution:
(3, 2) is not an element of the solution set (graphically or by substitution).

GRADE 9‐12 MATHEMATICS CURRICULUM FUNCTIONS
Waterford Public Schools 342
InterpretingFunctions(F‐IF) Understand the concept of a function and use function notation Interpret functions that arise in applications in terms of the context Analyze functions using different representations
BuildingFunctions(F‐BF)
Build a function that models a relationship between two quantities Build new functions from existing functions
Linear,Quadratic,andExponentialModels(F‐LE)
Construct and compare linear, quadratic, and exponential models and solve problems Interpret expressions for functions in terms of the situation they model
TrigonometricFunctions(F‐TF)
Extend the domain of trigonometric functions using the unit circle Model periodic phenomena with trigonometric functions Prove and apply trigonometric identities
MathematicalPractices(MP)1. Make sense of problems and persevere in solving them. 2. Reason abstractly and quantitatively. 3. Construct viable arguments and critique the reasoning of others. 4. Model with mathematics. 5. Use appropriate tools strategically. 6. Attend to precision. 7. Look for and make use of structure. 8. Look for and express regularity in repeated reasoning.

GRADE 9‐12 MATHEMATICS CURRICULUM FUNCTIONS
Waterford Public Schools 343
Functions describe situations where one quantity determines another. For example, the return on $10,000 invested at an annualized percentage rate of 4.25% is a function of the length of time the money is invested. Because we continually make theories about dependencies between quantities in nature and society, functions are important tools in the construction of mathematical models. In school mathematics, functions usually have numerical inputs and outputs and are often defined by an algebraic expression. For example, the time in hours it takes for a car to drive 100 miles is a function of the car’s speed in miles per hour, v; the rule T(v) = 100/v expresses this relationship algebraically and defines a function whose name is T. The set of inputs to a function is called its domain. We often infer the domain to be all inputs for which the expression defining a function has a value, or for which the function makes sense in a given context. A function can be described in various ways, such as by a graph (e.g., the trace of a seismograph); by a verbal rule, as in, “I’ll give you a state, you give me the capital city;” by an algebraic expression like f(x) = a + bx; or by a recursive rule. The graph of a function is often a useful way of visualizing the relationship of the function models, and manipulating a mathematical expression for a function can throw light on the function’s properties. Functions presented as expressions can model many important phenomena. Two important families of functions characterized by laws of growth are linear functions, which grow at a constant rate, and exponential functions, which grow at a constant percent rate. Linear functions with a constant term of zero describe proportional relationships. A graphing utility or a computer algebra system can be used to experiment with properties of these functions and their graphs and to build computational models of functions, including recursively defined functions. ConnectionstoExpressions,Equations,Modeling,andCoordinates Determining an output value for a particular input involves evaluating an expression; finding inputs that yield a given output involves solving an equation. Questions about when two functions have the same value for the same input lead to equations, whose solutions can be visualized from the intersection of their graphs. Because functions describe relationships between quantities, they are frequently used in modeling. Sometimes functions are defined by a recursive process, which can be displayed effectively using a spreadsheet or other technology.
GRADE 9‐12 MATHEMATICS CURRICULUM FUNCTIONS
Waterford Public Schools 344
Common Core State Standard Unwrapped Standard Explanation and Examples F‐IF:InterpretingFunctions
UnderstandtheconceptofafunctionandusefunctionnotationF.IF.1 Understand that a function from one set (called the domain) to another set (called the range) assigns to each element of the domain exactly one element of the range. If f is a function and x is an element of its domain, then f(x) denotes the output of f corresponding to the input x. The graph of f is the graph of the equation y=f(x).
A. Use the definition of a function to determine whether a relationship is a function given a table, graph or words.
B. Given the function f(x), identify x as an element of the domain, the input, and f(x) is an element in the range, the output.
C. Know that the graph of the function, f, is the graph of the equation y=f(x).
A. – C. The domain of a function given by an algebraic expression, unless otherwise specified, is the largest possible domain.
F.IF.2 Use function notation, evaluate functions for inputs in their domains, and interpret statements that use function notation in terms of a context.
A. When a relation is determined to be a function, use f(x) notation.
B. Evaluate functions for inputs in their domain.
C. Interpret statements that use function notation in terms of the context in which they are used.
A. – C. The domain of a function given by an algebraic expression, unless otherwise specified, is the largest possible domain. Examples: If 124)( 2 xxxf , find ).2(f
Let 2)3(2)( xxf . Find )3(f , )21(f , )(af , and )( haf
If P(t) is the population of Tucson t years after 2000, interpret the statements P(0) = 487,000 and P(10)‐P(9) = 5,900.

GRADE 9‐12 MATHEMATICS CURRICULUM FUNCTIONS
Waterford Public Schools 345
Common Core State Standard Unwrapped Standard Explanation and Examples F.IF.3 Recognize that sequences are functions, sometimes defined recursively, whose domain is a subset of the integers. For example, the Fibonacci sequence is defined recursively by f(0) = f(1) = 1, f(n+1) = f(n) + f(n‐1) for n ≥ 1.
A. Recognize that sequences, sometimes defined recursively, are functions whose domain is a subset of the set of integers.
InterpretfunctionsthatariseinapplicationsintermsofthecontextF.IF.4 ★ For a function that models a relationship between two quantities, interpret key features of graphs and tables in terms of the quantities, and sketch graphs showing key features given a verbal description of the relationship. Key features include: intercepts; intervals where the function is increasing, decreasing, positive, or negative; relative maximums and minimums; symmetries; end behavior; and periodicity.
A. Given a function, identify key features in graphs and tables including: intercepts; intervals where the function is increasing, decreasing, positive, or negative; relative maximums and minimums; symmetries; end behavior; and periodicity.
B. Given the key features of a function, sketch the graph.
A. – B. Students may be given graphs to interpret or produce graphs given an expression or table for the function, by hand or using technology. Examples: A rocket is launched from 180 feet above the ground at time
t = 0. The function that models this situation is given by h = – 16t2 + 96t + 180, where t is measured in seconds and h is height above the ground measured in feet. o What is a reasonable domain restriction for t in this
context? o Determine the height of the rocket two seconds after it
was launched. o Determine the maximum height obtained by the rocket. o Determine the time when the rocket is 100 feet above
the ground. o Determine the time at which the rocket hits the ground. o How would you refine your answer to the first question
based on your response to the second and fifth questions?
Compare the graphs of y = 3x2 and y = 3x3.
Let 2( )
2R x
x
. Find the domain of R(x). Also find the

GRADE 9‐12 MATHEMATICS CURRICULUM FUNCTIONS
Waterford Public Schools 346
Common Core State Standard Unwrapped Standard Explanation and Examples range, zeros, and asymptotes of R(x).
Let 155)( 23 xxxxf . Graph the function and identify end behavior and any intervals of constancy, increase, and decrease.
It started raining lightly at 5am, then the rainfall became heavier at 7am. By 10am the storm was over, with a total rainfall of 3 inches. It didn’t rain for the rest of the day. Sketch a possible graph for the number of inches of rain as a function of time, from midnight to midday.
F.IF.5 ★ Relate the domain of a function to its graph and, where applicable, to the quantitative relationship it describes. For example, if the function h(n) gives the number of person‐hours it takes to assemble n engines in a factory, then the positive integers would be an appropriate domain for the function.
A. Given the graph of a function, determine the practical domain of the function as it relates to the numerical relationship it describes.
A. Students may explain orally, or in written format, the existing relationships.
F.IF.6 ★ Calculate and interpret the average rate of change of a function (presented symbolically or as a table) over a specified interval. Estimate the rate of change from a graph.
A. Calculate the average rate of change over a specified interval of a function presented symbolically or in a table.
B. Estimate the average rate of change over a specified interval of a function from the function’s graph.
C. Interpret, in context, the average rate of change of a function over a specified interval.
A. – C. The average rate of change of a function y = f(x) over an interval [a,b] is . In addition to finding average rates of change from functions given symbolically, graphically, or in a table, Students may collect data from experiments or simulations (ex. falling ball, velocity of a car, etc.) and find average rates of change for the function modeling the situation. Examples: Use the following table to find the average rate of change of
g over the intervals [‐2, ‐1] and [0,2]:

GRADE 9‐12 MATHEMATICS CURRICULUM FUNCTIONS
Waterford Public Schools 347
Common Core State Standard Unwrapped Standard Explanation and Examples x g(x) ‐2 2 ‐1 ‐1 0 ‐4 2 ‐10
The table below shows the elapsed time when two different
cars pass a 10, 20, 30, 40 and 50 meter mark on a test track. o For car 1, what is the average velocity (change in
distance divided by change in time) between the 0 and 10 meter mark? Between the 0 and 50 meter mark? Between the 20 and 30 meter mark? Analyze the data to describe the motion of car 1.
o How does the velocity of car 1 compare to that of car 2? Car 1 Car 2 d t t 10 4.472 1.742 20 6.325 2.899 30 7.746 3.831 40 8.944 4.633 50 10 5.348
AnalyzefunctionsusingdifferentrepresentationsF.IF.7 ★ Graph functions expressed symbolically and show key features of the graph, by hand in simple cases and using technology for more complicated cases. F.IF.7a Graph linear and quadratic functions and show intercepts, maxima, and minima.
A. Graph functions expressed symbolically and show key features of the graph. Graph simple cases by hand, and use technology to show more complicated cases including:
A. – G. Key characteristics include but are not limited to maxima, minima, intercepts, symmetry, end behavior, and asymptotes. Students may use graphing calculators or programs, spreadsheets, or computer algebra systems to graph functions. Examples: Describe key characteristics of the graph of
f(x) = │x – 3│ + 5.
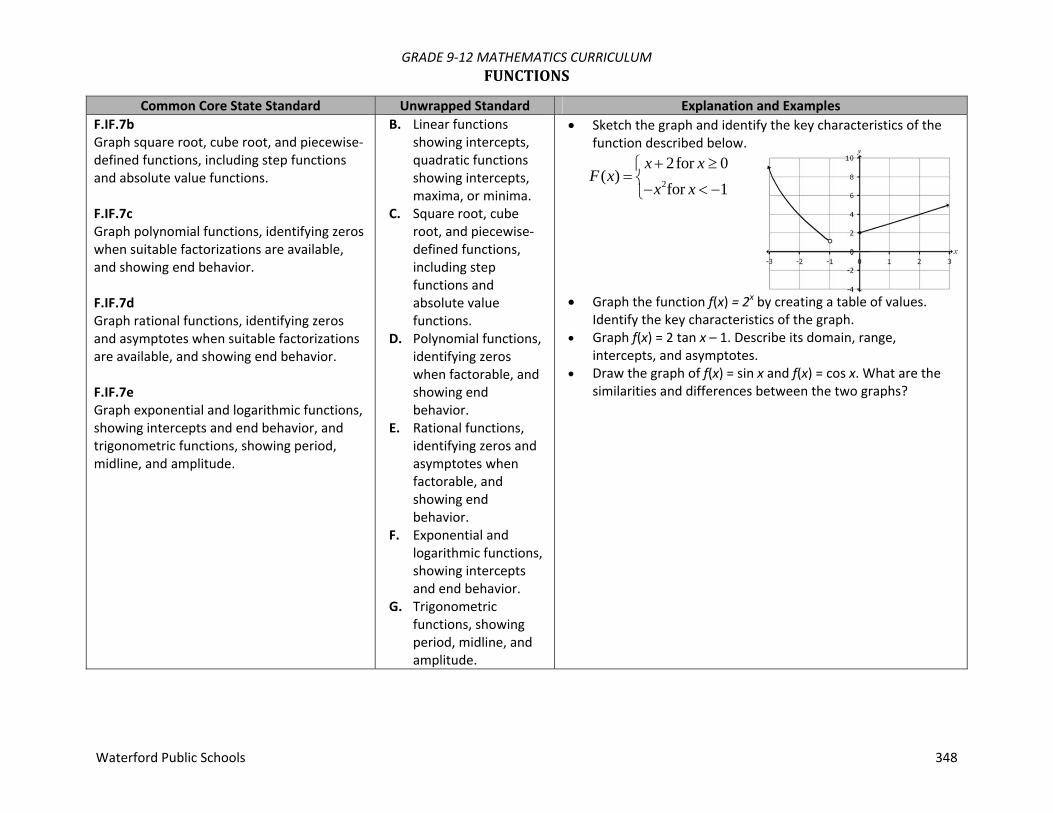
GRADE 9‐12 MATHEMATICS CURRICULUM FUNCTIONS
Waterford Public Schools 348
Common Core State Standard Unwrapped Standard Explanation and Examples F.IF.7b Graph square root, cube root, and piecewise‐defined functions, including step functions and absolute value functions. F.IF.7c Graph polynomial functions, identifying zeros when suitable factorizations are available, and showing end behavior. F.IF.7d Graph rational functions, identifying zeros and asymptotes when suitable factorizations are available, and showing end behavior. F.IF.7e Graph exponential and logarithmic functions, showing intercepts and end behavior, and trigonometric functions, showing period, midline, and amplitude.
B. Linear functions showing intercepts, quadratic functions showing intercepts, maxima, or minima.
C. Square root, cube root, and piecewise‐defined functions, including step functions and absolute value functions.
D. Polynomial functions, identifying zeros when factorable, and showing end behavior.
E. Rational functions, identifying zeros and asymptotes when factorable, and showing end behavior.
F. Exponential and logarithmic functions, showing intercepts and end behavior.
G. Trigonometric functions, showing period, midline, and amplitude.
Sketch the graph and identify the key characteristics of the function described below.
2
2for 0( )
for 1x x
F xx x
Graph the function f(x) = 2x by creating a table of values. Identify the key characteristics of the graph.
Graph f(x) = 2 tan x – 1. Describe its domain, range, intercepts, and asymptotes.
Draw the graph of f(x) = sin x and f(x) = cos x. What are the similarities and differences between the two graphs?
GRADE 9‐12 MATHEMATICS CURRICULUM FUNCTIONS
Waterford Public Schools 349
Common Core State Standard Unwrapped Standard Explanation and Examples F.IF.8 Write a function defined by an expression in different but equivalent forms to reveal and explain different properties of the function. F.IF.8a Use the process of factoring and completing the square in a quadratic function to show zeros, extreme values, and symmetry of the graph, and interpret these in terms of a context. F.IF.8b Use the properties of exponents to interpret expressions for exponential functions. For example, identify percent rate of change in functions such as y = (1.02) , y = (0.97) , y = (1.01), y = (1.2) , and classify them as representing exponential growth or decay. t t 12t t 10
A. Write a function in equivalent forms to show different properties of the function.
B. Explain the different properties of a function that are revealed by writing a function in equivalent forms.
C. Use the process of factoring and completing the square in a quadratic function to show zeros, extreme values, and symmetry of the graph, and interpret these in terms of a context.
D. Use the properties of exponents to interpret expressions for percent rate of change, and classify them as growth or decay.

GRADE 9‐12 MATHEMATICS CURRICULUM FUNCTIONS
Waterford Public Schools 350
Common Core State Standard Unwrapped Standard Explanation and Examples F.IF.9 Compare properties of two functions each represented in a different way (algebraically, graphically, numerically in tables, or by verbal descriptions). For example, given a graph of one quadratic function and an algebraic expression for another, say which has the larger maximum.
A. Compare the key features of two functions represented in different ways. For example, compare the end behavior of two functions, one of which is represented graphically and the other is represented symbolically.
A. Examine the functions below. Which function has the larger
maximum? How do you know?
F‐BF:BuildingFunctionsBuildafunctionthatmodelsarelationshipbetweentwoquantities
F.BF.1 ★ Write a function that describes a relationship between two quantities. F.BF.1a Determine an explicit expression, a recursive process, or steps for calculation from a context. F.BF.1b Combine standard function types using
A. From context, either write an explicit expression, define a recursive process, or describe the calculations needed to model a function between two quantities.
B. Combine standard function types, such
A. – C. Students will analyze a given problem to determine the function expressed by identifying patterns in the function’s rate of change. They will specify intervals of increase, decrease, constancy, and, if possible, relate them to the function’s description in words or graphically. Students may use graphing calculators or programs, spreadsheets, or computer algebra systems to model functions. Examples: You buy a $10,000 car with an annual interest rate of 6
percent compounded annually and make monthly payments
2082)( 2 xxxf

GRADE 9‐12 MATHEMATICS CURRICULUM FUNCTIONS
Waterford Public Schools 351
Common Core State Standard Unwrapped Standard Explanation and Examples arithmetic operations. For example, build a function that models the temperature of a cooling body by adding a constant function to a decaying exponential, and relate these functions to the model. F.BF.1c Compose functions. For example, if T(y) is the temperature in the atmosphere as a function of height, and h(t) is the height of a weather balloon as a function of time, then T(h(t)) is the temperature at the location of the weather balloon as a function of time.
as linear and exponential, using arithmetic operations.
C. Compose functions.
of $250. Express the amount remaining to be paid off as a function of the number of months, using a recursion equation.
A cup of coffee is initially at a temperature of 93º F. The difference between its temperature and the room temperature of 68º F decreases by 9% each minute. Write a function describing the temperature of the coffee as a function of time.
The radius of a circular oil slick after t hours is given in feet by 10 0.5 , for 0 ≤ t ≤ 10. Find the area of the oil slick
as a function of time.
F.BF.2 ★ Write arithmetic and geometric sequences both recursively and with an explicit formula, use them to model situations, and translate between the two forms.
A. Write arithmetic sequences recursively and explicitly, use the two forms to model a situation, and translate between the two forms.
B. Write geometric sequences recursively and explicitly, use the two forms to model a situation, and translate between the two forms.
C. Understand that linear functions are the explicit form of recursively‐defined arithmetic sequences and that exponential
A. – C. An explicit rule for the nth term of a sequence gives an as an expression in the term’s position n; a recursive rule gives the first term of a sequence, and a recursive equation relates an to the preceding term(s). Both methods of presenting a sequence describe an as a function of n. Examples: Generate the 5th‐11th terms of a sequence if A1= 2 and
1)( 2)1( nn AA
Use the formula: An= A1 + d(n ‐ 1) where d is the common difference to generate a sequence whose first three terms are: ‐7, ‐4, and ‐1.
There are 2,500 fish in a pond. Each year the population decreases by 25 percent, but 1,000 fish are added to the pond at the end of the year. Find the population in five years. Also, find the long‐term population.
Given the formula An= 2n ‐ 1, find the 17th term of the sequence. What is the 9th term in the sequence 3, 5, 7, 9, …?
Given a1 = 4 and an= an‐1+ 3, write the explicit formula.
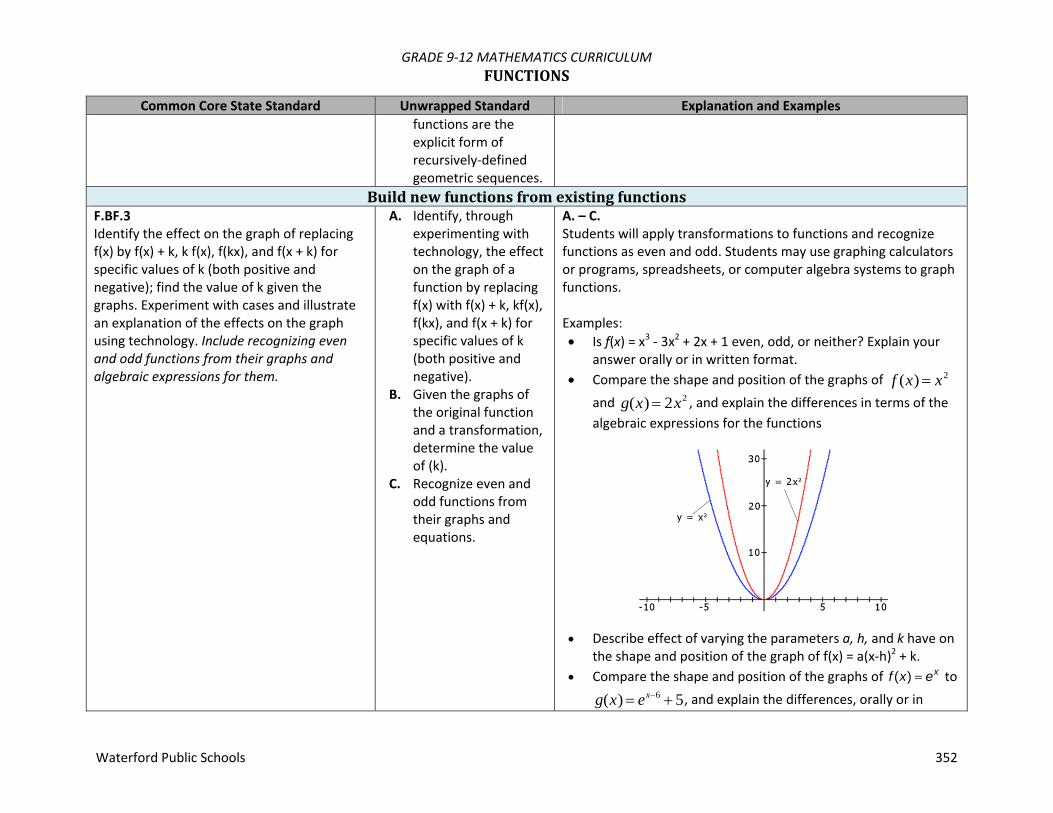
GRADE 9‐12 MATHEMATICS CURRICULUM FUNCTIONS
Waterford Public Schools 352
Common Core State Standard Unwrapped Standard Explanation and Examples functions are the explicit form of recursively‐defined geometric sequences.
BuildnewfunctionsfromexistingfunctionsF.BF.3 Identify the effect on the graph of replacing f(x) by f(x) + k, k f(x), f(kx), and f(x + k) for specific values of k (both positive and negative); find the value of k given the graphs. Experiment with cases and illustrate an explanation of the effects on the graph using technology. Include recognizing even and odd functions from their graphs and algebraic expressions for them.
A. Identify, through experimenting with technology, the effect on the graph of a function by replacing f(x) with f(x) + k, kf(x), f(kx), and f(x + k) for specific values of k (both positive and negative).
B. Given the graphs of the original function and a transformation, determine the value of (k).
C. Recognize even and odd functions from their graphs and equations.
A. – C. Students will apply transformations to functions and recognize functions as even and odd. Students may use graphing calculators or programs, spreadsheets, or computer algebra systems to graph functions. Examples: Is f(x) = x3 ‐ 3x2 + 2x + 1 even, odd, or neither? Explain your
answer orally or in written format. Compare the shape and position of the graphs of f (x) x2
and g(x) 2x2 , and explain the differences in terms of the algebraic expressions for the functions
Describe effect of varying the parameters a, h, and k have on the shape and position of the graph of f(x) = a(x‐h)2 + k.
Compare the shape and position of the graphs of xexf )( to
g(x) ex6 5, and explain the differences, orally or in

GRADE 9‐12 MATHEMATICS CURRICULUM FUNCTIONS
Waterford Public Schools 353
Common Core State Standard Unwrapped Standard Explanation and Examples written format, in terms of the algebraic expressions for the functions
Describe the effect of varying the parameters a, h, and k on
the shape and position of the graph f(x) = ab(x + h) + k., orally or in written format. What effect do values between 0 and 1 have? What effect do negative values have?
Compare the shape and position of the graphs of y = sin x to y
= 2 sin x.
F.BF.4 Find inverse functions. F.BF.4a Solve an equation of the form f(x) = c for a simple function f that has an inverse and write an expression for the inverse. For example, f(x) =2 x3 or f(x) = (x+1)/(x–1) for x ≠1.
A. Solve a function for the dependent variable and write the inverse of a function by interchanging the values of the dependent and independent variables.
B. Verify that one
A. – D. Students may use graphing calculators or programs, spreadsheets, or computer algebra systems to model functions. Examples: For the function h(x) = (x – 2)3, defined on the domain of all
real numbers, find the inverse function if it exists or explain why it doesn’t exist.
Graph h(x) and h‐1(x) and explain how they relate to each other graphically.

GRADE 9‐12 MATHEMATICS CURRICULUM FUNCTIONS
Waterford Public Schools 354
Common Core State Standard Unwrapped Standard Explanation and Examples F.BF.4b Verify by composition that one function is the inverse of another. F.BF.4c Read values of an inverse function from a graph or a table, given that the function has an inverse. F.BF.4d Produce an invertible function from a non‐invertible function by restricting the domain.
function is the inverse of another by illustrating that f‐1(f(x)) = f(f‐1(x)) = x.
C. Read values of an inverse function from a graph or table.
D. Find the inverse of a function that is not one‐to‐one by restricting the domain.
Find a domain for f(x) = 3x2 + 12x ‐ 8 on which it has an inverse. Explain why it is necessary to restrict the domain of the function.
F.BF.5 Understand the inverse relationship between exponents and logarithms and use this relationship to solve problems involving logarithms and exponents.
A. Understand the inverse relationship between exponents and logarithms and use this relationship to solve problems involving logarithms and exponents.
A. Students may use graphing calculators or programs, spreadsheets, or computer algebra systems to solve problems involving logarithms and exponents. Example: Find the inverse of f(x) = 3(10)2x.
F‐LE:Linear,Quadratic,andExponentialModelsConstructandcomparelinear,quadratic,andexponentialmodelsandsolveproblems
F.LE.1 Distinguish between situations that can be modeled with linear functions and with exponential functions. F.LE.1a Prove that linear functions grow by equal differences over equal intervals, and that exponential functions grow by equal factors
A. Given a contextual situation, describe whether the situation in question has a linear pattern of change or an exponential pattern of change.
B. Show that linear
A. – D. Students may use graphing calculators or programs, spreadsheets, or computer algebra systems to model and compare linear and exponential functions. Examples: A cell phone company has three plans. Graph the equation
for each plan, and analyze the change as the number of minutes used increases. When is it beneficial to enroll in Plan

GRADE 9‐12 MATHEMATICS CURRICULUM FUNCTIONS
Waterford Public Schools 355
Common Core State Standard Unwrapped Standard Explanation and Examples over equal intervals. F.LE.1b Recognize situations in which one quantity changes at a constant rate per unit interval relative to another. F.LE.1c Recognize situations in which a quantity grows or decays by a constant percent rate per unit interval relative to another.
functions change at the same rate over time and that exponential functions change by equal factors over time.
C. Describe situations where one quantity changes at a constant rate per unit interval as compared to another.
D. Describe situations where a quantity grows or decays at a constant percent rate per unit interval as compared to another.
1? Plan 2? Plan 3? o $59.95/month for 700 minutes and $0.25 for each
additional minute, o $39.95/month for 400 minutes and $0.15 for each
additional minute, and o $89.95/month for 1,400 minutes and $0.05 for each
additional minute. A computer store sells about 200 computers at the price of
$1,000 per computer. For each $50 increase in price, about ten fewer computers are sold. How much should the computer store charge per computer in order to maximize their profit?
Students can investigate functions and graphs modeling different situations involving simple and compound interest. Students can compare interest rates with different periods of compounding (monthly, daily) and compare them with the corresponding annual percentage rate. Spreadsheets and applets can be used to explore and model different interest rates and loan terms. Students can use graphing calculators or programs, spreadsheets, or computer algebra systems to construct linear and exponential functions. Examples: A couple wants to buy a house in five years. They need to
save a down payment of $8,000. They deposit $1,000 in a bank account earning 3.25% interest, compounded quarterly. How much will they need to save each month in order to meet their goal?
Sketch and analyze the graphs of the following two situations. What information can you conclude about the types of growth each type of interest has? o Lee borrows $9,000 from his mother to buy a car. His

GRADE 9‐12 MATHEMATICS CURRICULUM FUNCTIONS
Waterford Public Schools 356
Common Core State Standard Unwrapped Standard Explanation and Examples mom charges him 5% interest a year, but she does not compound the interest.
o Lee borrows $9,000 from a bank to buy a car. The bank charges 5% interest compounded annually.
Calculate the future value of a given amount of money, with and without technology.
Calculate the present value of a certain amount of money for a given length of time in the future, with and without technology.
F.LE.2 Construct linear and exponential functions, including arithmetic and geometric sequences, given a graph, a description of a relationship, or two input‐output pairs (include reading these from a table).
A. Create linear and exponential functions given the following situations: arithmetic and
geometric sequences
a graph a description of a
relationship two points, which
can be read from a table
A. Students may use graphing calculators or programs, spreadsheets, or computer algebra systems to construct linear and exponential functions. Examples: Determine an exponential function of the form f(x) = abx
using data points from the table. Graph the function and identify the key characteristics of the graph.
x f(x) 0 1 1 3 3 27
Sara’s starting salary is $32,500. Each year she receives a
$700 raise. Write a sequence in explicit form to describe the situation.
GRADE 9‐12 MATHEMATICS CURRICULUM FUNCTIONS
Waterford Public Schools 357
Common Core State Standard Unwrapped Standard Explanation and Examples F.LE.3 Observe using graphs and tables that a quantity increasing exponentially eventually exceeds a quantity increasing linearly, quadratically, or (more generally) as a polynomial function.
A. Make the connection, using graphs and tables, that a quantity increasing exponentially eventually exceeds a quantity increasing linearly, quadratically, or any other polynomial function.
A. Example: Contrast the growth of the f(x)=x3 and f(x)=3x.
F.LE.4 For exponential models, express as a logarithm the solution to abct =d where a,c, and d are numbers and the base b Is 2,10,or e; evaluate the logarithm using technology.
A. Express logarithms as solutions to exponential functions using bases 2, 10, and e.
B. Use technology to evaluate a logarithm.
A. – B. Students may use graphing calculators or programs, spreadsheets, or computer algebra systems to analyze exponential models and evaluate logarithms. Example: Solve 200 e0.04t = 450 for t.
Solution: We first isolate the exponential part by dividing both sides of the equation by 200. e0.04t = 2.25 Now we take the natural logarithm of both sides. ln e0.04t = ln 2.25 The left hand side simplifies to 0.04t, by logarithmic identity 1. 0.04t = ln 2.25 Lastly, divide both sides by 0.04 t = ln (2.25) / 0.04 t 20.3
GRADE 9‐12 MATHEMATICS CURRICULUM FUNCTIONS
Waterford Public Schools 358
Common Core State Standard Unwrapped Standard Explanation and Examples
InterpretexpressionsforfunctionsintermsofthesituationtheymodelF.LE.5 Interpret the parameters in a linear or exponential function in terms of a context.
A. Based on the context of a situation, explain the meaning of the coefficients, factors, exponents, and/or intercepts in a linear or exponential function.
A. Students may use graphing calculators or programs, spreadsheets, or computer algebra systems to model and interpret parameters in linear, quadratic or exponential functions. Example: A function of the form f(n) = P(1 + r)n is used to model the
amount of money in a savings account that earns 5% interest, compounded annually, where n is the number of years since the initial deposit. What is the value of r? What is the meaning of the constant P in terms of the savings account? Explain either orally or in written format.
F‐TF:TrigonometricFunctions
ExtendthedomainoftrigonometricfunctionsusingtheunitcircleF.TF.1 Understand radian measure of an angle as the length of the arc on the unit circle subtended by the angle.
A. Know that if the length of an arc subtended by an angle is the same length as the radius of the circle, then the measure of the angle is 1 radian.
B. Know that the graph of the function, f, is the graph of the equation y=f(x).

GRADE 9‐12 MATHEMATICS CURRICULUM FUNCTIONS
Waterford Public Schools 359
Common Core State Standard Unwrapped Standard Explanation and Examples F.TF.2 Explain how the unit circle in the coordinate plane enables the extension of trigonometric functions to all real numbers, interpreted as radian measures of angles traversed counterclockwise around the unit circle.
A. Explain how radian measures of angles rotated counterclockwise in a unit circle are in a one‐to‐one correspondence with the nonnegative real numbers, and that angles rotated clockwise in a unit circle are in a ont‐to‐one correspondence with the non‐positive real numbers.
A. Students may use applets and animations to explore the unit circle and trigonometric functions. Students may explain (orally or in written format) their understanding.
F.TF.3 Use special triangles to determine geometrically the values of sine, cosine, tangent for /3, /4 and /6, and use the unit circle to express the values of sine, cosines, and tangent for x, +x, and 2 –x in terms of their values for x, where x is any real number.
A. Use 30º‐60º‐90º and 45º‐45º‐90º triangles to determine the values of sine, cosine, and tangent for values of , ,
A.
Evaluate all six trigonometric functions of θ = 3.
Evaluate all six trigonometric functions of θ = 225o.
Find the value of x in the given triangle where DCAD andDBAC
30,60 CmAm . Explain your process for solving the problem including the use of trigonometric ratios as appropriate.

GRADE 9‐12 MATHEMATICS CURRICULUM FUNCTIONS
Waterford Public Schools 360
Common Core State Standard Unwrapped Standard Explanation and Examples Find the measure of the missing segment in the given triangle
where DCAD , DBAC ,
3AB12,AC,30Cm,60Am . Explain (orally or in written format) your process for solving the problem including use of trigonometric ratios as appropriate.
F.TF.4 Use the unit circle to explain symmetry (odd and even) and periodicity of trigonometric functions.
A. Use the unit circle and periodicity to find values of sine, cosine, and tangent for any value of , such as
, 2 where is a real number.
B. Use the values of the trigonometric functions derived from the unit circle to explain how trigonometric functions repeat themselves.
C. Use the unit circle to explain that f(x) is an even function if f(‐x) = f(x), for all x, and an odd function if f(‐x) = ‐f(x). Also know that an
A. – C. Students may use applets and animations to explore the unit circle and trigonometric functions. Students may explain (orally or written format) their understanding of symmetry and periodicity of trigonometric functions.
GRADE 9‐12 MATHEMATICS CURRICULUM FUNCTIONS
Waterford Public Schools 361
Common Core State Standard Unwrapped Standard Explanation and Examples even function is symmetric about the y‐axis.
ModelperiodicphenomenawithtrigonometricfunctionsF.TF.5 ★ Choose trigonometric functions to model periodic phenomena with specified amplitude, frequency, and midline.
A. Use sine and cosine to model periodic phenomena such as the ocean’s tide or the rotation of a Ferris wheel.
B. Given the amplitude; frequency; and midline in situations or graphs, determine a trigonometric function used to model the situation.
A. – B. Students may use graphing calculators or programs, spreadsheets, or computer algebra systems to model trigonometric functions and periodic phenomena. Example: The temperature of a chemical reaction oscillates between a
low of 20 C and a high of 120 C. The temperature is at its lowest point when t = 0 and completes one cycle over a six hour period. o Sketch the temperature, T, against the elapsed time, t,
over a 12 hour period. o Find the period, amplitude, and the midline of the graph
you drew in part a). o Write a function to represent the relationship between
time and temperature. o What will the temperature of the reaction be 14 hours
after it began? o At what point during a 24 hour day will the reaction have
a temperature of 60 C? F.TF.6 Understand that restricting a trigonometric function to a domain on which it is always increasing or always decreasing allows its inverse to be constructed.
A. Know that the inverse for a trigonometric function can be found by restricting the domain of the function so it is always increasing or decreasing.
A. Students may use graphing calculators or programs, spreadsheets, or computer algebra systems to model trigonometric functions. Examples: Identify a domain for the sine function that would permit an
inverse function to be constructed. Describe the behavior of the graph of the sine function over this interval.

GRADE 9‐12 MATHEMATICS CURRICULUM FUNCTIONS
Waterford Public Schools 362
Common Core State Standard Unwrapped Standard Explanation and Examples Explain (orally or in written format) why the domain cannot be expanded any further.
F.TF.7 ★ Use inverse functions to solve trigonometric equations that arise in modeling contexts; evaluate the solutions using technology, and interpret them in terms of the context.
A. Use the inverse of trigonometric functions to solve equations that arise in real‐world contexts.
B. Use technology to evaluate the solutions to the inverse trigonometric functions, and interpret their meaning in terms of the context.
A. – B. Students may use graphing calculators or programs, spreadsheets, or computer algebra systems to model trigonometric functions and solve trigonometric equations. Example: Two physics students set up an experiment with a spring. In
their experiment, a weighted ball attached to the bottom of the spring was pulled downward 6 inches from the rest position. It rose to 6 inches above the rest position and returned to 6 inches below the rest position once every 6
seconds. The equation
th2
cos6 accurately models
the height above and below the rest position every 6 seconds. Students may explain, orally or in written format, when the weighted ball first will be at a height of 3 inches, 4 inches, and 5 inches above rest position.
ProveandapplytrigonometricidentitiesF.TF.8 Prove the Pythagorean identity sin2(θ) + cos2(θ) = 1 and use it to calculate trigonometric ratios.
A. Use the unit circle to prove the Pythagorean identity sin2(θ) + cos2(θ) =1
B. Given the value of the sin(θ) or cos(θ), use the Pythagorean identity sin2(θ) + cos2(θ) = 1 to calculate other trigonometric ratios.

GRADE 9‐12 MATHEMATICS CURRICULUM FUNCTIONS
Waterford Public Schools 363
Common Core State Standard Unwrapped Standard Explanation and Examples F.TF.9 Prove the addition and subtraction formulas for sine, cosine, and tangent and use them to solve problems.
A. Prove the addition and subtraction formulas sin(ά±β), cos(ά±β), and tan(ά±β).
B. Use the addition and subtraction formulas to determine exact trigonometric values such as sin(75º) or cos
)12/(

GRADE 9‐12 MATHEMATICS CURRICULUM GEOMETRY
Waterford Public Schools 364
Congruence(G‐CO) Experiment with transformations in the plane Understand congruence in terms of rigid motions Prove geometric theorems Make geometric constructions
Similarity,RightTriangles,andTrigonometry(G‐SRT)
Understand similarity in terms of similarity transformations Prove theorems involving similarity Define trigonometric ratios and solve problems involving right
triangles Apply trigonometry to general triangles
Circles(G‐C)
Understand and apply theorems about circles Find arc lengths and areas of sectors of circles
ExpressingGeometricPropertieswithEquations(G‐GPE)
Translate between the geometric description and the equation for a conic section
Use coordinates to prove simple geometric theorems algebraically
GeometricMeasurementandDimension(G‐GMD) Explain volume formulas and use them to solve problems Visualize relationships between two‐dimensional and three‐
dimensional objects ModelingwithGeometry(G‐MG)
Apply geometric concepts in modeling situations
MathematicalPractices(MP)1. Make sense of problems and persevere in solving them. 2. Reason abstractly and quantitatively. 3. Construct viable arguments and critique the reasoning of
others. 4. Model with mathematics. 5. Use appropriate tools strategically. 6. Attend to precision. 7. Look for and make use of structure. 8. Look for and express regularity in repeated reasoning.

GRADE 9‐12 MATHEMATICS CURRICULUM GEOMETRY
Waterford Public Schools 365
An understanding of the attributes and relationships of geometric objects can be applied in diverse contexts—interpreting a schematic drawing, estimating the amount of wood needed to frame a sloping roof, rendering computer graphics, or designing a sewing pattern for the most efficient use of material. Although there are many types of geometry, school mathematics is devoted primarily to plane Euclidean geometry, studied both synthetically (without coordinates) and analytically (with coordinates). Euclidean geometry is characterized most importantly by the Parallel Postulate, that through a point not on a given line there is exactly one parallel line. (Spherical geometry, in contrast, has no parallel lines.) During high school, students begin to formalize their geometry experiences from elementary and middle school, using more precise definitions and developing careful proofs. Later in college some students develop Euclidean and other geometries carefully from a small set of axioms. The concepts of congruence, similarity, and symmetry can be understood from the perspective of geometric transformation. Fundamental are the rigid motions: translations, rotations, reflections, and combinations of these, all of which are here assumed to preserve distance and angles (and therefore shapes generally). Reflections and rotations each explain a particular type of symmetry, and the symmetries of an object offer insight into its attributes—as when the reflective symmetry of an isosceles triangle assures that its base angles are congruent. In the approach taken here, two geometric figures are defined to be congruent if there is a sequence of rigid motions that carries one onto the other. This is the principle of superposition. For triangles, congruence means the equality of all corresponding pairs of sides and all corresponding pairs of angles. During the middle grades, through experiences drawing triangles from given conditions, students notice ways to specify enough measures in a triangle to ensure that all triangles drawn with those measures are congruent. Once these triangle congruence criteria (ASA, SAS, and SSS) are established using rigid motions, they can be used to prove theorems about triangles, quadrilaterals, and other geometric figures. Similarity transformations (rigid motions followed by dilations) define similarity in the same way that rigid motions define congruence, thereby formalizing the similarity ideas of “same shape” and “scale factor” developed in the middle grades. These transformations lead to the criterion for triangle similarity that two pairs of corresponding angles are congruent. The definitions of sine, cosine, and tangent for acute angles are founded on right triangles and similarity, and, with the Pythagorean Theorem, are fundamental in many real‐world and theoretical situations. The Pythagorean Theorem is generalized to non‐right triangles by the Law of Cosines. Together, the Laws of Sines and Cosines embody the triangle congruence criteria for the cases where three pieces of information suffice to completely solve a triangle. Furthermore, these laws yield two possible solutions in the ambiguous case, illustrating that Side‐Side‐Angle is not a congruence criterion.

GRADE 9‐12 MATHEMATICS CURRICULUM GEOMETRY
Waterford Public Schools 366
Analytic geometry connects algebra and geometry, resulting in powerful methods of analysis and problem solving. Just as the number line associates numbers with locations in one dimension, a pair of perpendicular axes associates pairs of numbers with locations in two dimensions. This correspondence between numerical coordinates and geometric points allows methods from algebra to be applied to geometry and vice versa. The solution set of an equation becomes a geometric curve, making visualization a tool for doing and understanding algebra. Geometric shapes can be described by equations, making algebraic manipulation into a tool for geometric understanding, modeling, and proof. Geometric transformations of the graphs of equations correspond to algebraic changes in their equations. Dynamic geometry environments provide students with experimental and modeling tools that allow them to investigate geometric phenomena in much the same way as computer algebra systems allow them to experiment with algebraic phenomena. ConnectionstoEquationsThe correspondence between numerical coordinates and geometric points allows methods from algebra to be applied to geometry and vice versa. The solution set of an equation becomes a geometric curve, making visualization a tool for doing and understanding algebra. Geometric shapes can be described by equations, making algebraic manipulation into a tool for geometric understanding, modeling, and proof.

GRADE 9‐12 MATHEMATICS CURRICULUM GEOMETRY
Waterford Public Schools 367
Common Core State Standard Unwrapped Standard Explanation and Examples G‐CO:Congruence
ExperimentwithtransformationsintheplaneG.CO.1 Know precise definitions of angle, circle, perpendicular line, parallel line, and line segment, based on the undefined notions of point, line, distance along a line, and distance around a circular arc.
A. Understand and use definitions of angles, circles, perpendicular lines, parallel lines, and line segments based on the undefined term of a point, a line, the distance along a line, and the length of an arc.
G.CO.2 Represent transformations in the plane using, e.g., transparencies and geometry software; describe transformations as functions that take points in the plane as inputs and give other points as outputs. Compare transformations that preserve distance and angle to those that do not (e.g., translation versus horizontal stretch).
A. Use various technologies such as transparencies, geometry software, interactive whiteboards, and digital visual presenters to represent and compare rigid and size transformations of figures in a coordinate plane. Comparing transformations that preserve distance and angle to those that do not.
B. Describe and compare function
A. – B. Students may use geometry software and/or manipulatives to model and compare transformations.

GRADE 9‐12 MATHEMATICS CURRICULUM GEOMETRY
Waterford Public Schools 368
Common Core State Standard Unwrapped Standard Explanation and Examples transformations on a set of points as inputs to produce another set of points as outputs, to include translations and horizontal and vertical stretch
G‐CO.3 Given a rectangle, parallelogram, trapezoid, or regular polygon, describe the rotations and reflections that carry it onto itself.
A. Describe the rotations and reflections of a rectangle, parallelogram, trapezoid, or regular polygon that maps each figure onto itself.
A. Students may use geometry software and/or manipulatives to model transformations.
G.CO.4 Develop definitions of rotations, reflections, and translations in terms of angles, circles, perpendicular lines, parallel lines, and line segments.
A. Using previous comparisons and descriptions of transformations, develop and understand the meaning of rotations, reflections, and translations based on angles, circles, perpendicular lines, parallel lines, and line segments.
A. Students may use geometry software and/or manipulatives to model transformations. Students may observe patterns and develop definitions of rotations, reflections, and translations.

GRADE 9‐12 MATHEMATICS CURRICULUM GEOMETRY
Waterford Public Schools 369
Common Core State Standard Unwrapped Standard Explanation and Examples G.CO.5 Given a geometric figure and a rotation, reflection, or translation, draw the transformed figure using, e.g., graph paper, tracing paper, or geometry software. Specify a sequence of transformations that will carry a given figure onto another.
A. Transform a geometric figure given a rotation, reflection, or translation using graph paper, tracing paper, or geometric software.
B. Create sequences of transformations that map a geometric figure on to itself and another geometric figure.
A. – B. Students may use geometry software and/or manipulatives to model transformations and demonstrate a sequence of transformations that will carry a given figure onto another.
UnderstandcongruenceintermsofrigidmotionG.CO.6 Use geometric descriptions of rigid motions to transform figures and to predict the effect of a given rigid motion on a given figure; given two figures, use the definition of congruence in terms of rigid motions to decide if they are congruent.
A. Use descriptions of rigid motion and transformed geometric figures to predict the effects rigid motion has on figures in the coordinate plane.
B. Knowing that rigid transformations preserve size and shape or distance and angle, use this fact to connect the idea of congruency and develop the definition of congruent.
A. – B. A rigid motion is a transformation of points in space consisting of a sequence of one or more translations, reflections, and/or rotations. Rigid motions are assumed to preserve distances and angle measures. Students may use geometric software to explore the effects of rigid motion on a figure(s).

GRADE 9‐12 MATHEMATICS CURRICULUM GEOMETRY
Waterford Public Schools 370
Common Core State Standard Unwrapped Standard Explanation and Examples G.CO.7 Use the definition of congruence in terms of rigid motions to show that two triangles are congruent if and only if corresponding pairs of sides and corresponding pairs of angles are congruent.
A. Use the definition of congruence, based on rigid motion, to show two triangles are congruent if and only if their corresponding sides and corresponding angles are congruent.
A. A rigid motion is a transformation of points in space consisting of a sequence of one or more translations, reflections, and/or rotations. Rigid motions are assumed to preserve distances and angle measures. Congruence of triangles Two triangles are said to be congruent if one can be exactly superimposed on the other by a rigid motion, and the congruence theorems specify the conditions under which this can occur.
G.CO.8 Explain how the criteria for triangle congruence (ASA, SAS, and SSS) follow from the definition of congruence in terms of rigid motions.
A. Explain how the criteria for triangle congruence (ASA, SAS, and SSS) follow from the definition of congruence in terms of rigid motions.
ProvegeometrictheoremsG.CO.9 Prove theorems about lines and angles. Theorems include: vertical angles are congruent; when a transversal crosses parallel lines, alternate interior angles are congruent and corresponding angles are congruent; points on a perpendicular bisector of a line segment are exactly those equidistant from the segment’s endpoints.
A. Prove theorems pertaining to lines and angles.
B. Prove vertical angles are congruent.
C. Prove when a transversal crosses parallel lines, alternate interior angles are congruent and corresponding angels are congruent.
D. Prove points on a perpendicular
A. – D. Students may use geometric simulations (computer software or graphing calculator) to explore theorems about lines and angles.

GRADE 9‐12 MATHEMATICS CURRICULUM GEOMETRY
Waterford Public Schools 371
Common Core State Standard Unwrapped Standard Explanation and Examples bisector of a line segment are exactly those equidistant from the segment’s endpoints.
G.CO.10 Prove theorems about triangles. Theorems include: measures of interior angles of a triangle sum to 180º; base angles of isosceles triangles are congruent; the segment joining midpoints of two sides of a triangle is parallel to the third side and half the length; the medians of a triangle meet at a point.
A. Prove theorems pertaining to triangles.
B. Prove the measures of interior angles of a triangle have a sum of 180º.
C. Prove base angles of isosceles triangles are congruent.
D. Prove the segment joining midpoints of two sides of a triangle is parallel to the third side and half the length.
E. Prove the medians of a triangle meet at a point.
A. – E. Students may use geometric simulations (computer software or graphing calculator) to explore theorems about triangles.
G.CO.11 Prove theorems about parallelograms. Theorems include: opposite sides are congruent, opposite angles are congruent, the diagonals of a parallelogram bisect each other, and conversely, rectangles are parallelograms with congruent diagonals.
A. Prove theorems pertaining to parallelograms.
B. Prove opposite sides are congruent.
C. Prove opposite angles are congruent.
D. Prove the diagonals of a parallelogram bisect
A. – D. Students may use geometric simulations (computer software or graphing calculator) to explore theorems about parallelograms.

GRADE 9‐12 MATHEMATICS CURRICULUM GEOMETRY
Waterford Public Schools 372
Common Core State Standard Unwrapped Standard Explanation and Examples each other, and conversely, rectangles are parallelograms with congruent diagonals. Makegeometricconstructions
G.CO.12 Make formal geometric constructions with a variety of tools and methods (compass and straightedge, string, reflective devices, paper folding, dynamic geometric software, etc.). Copying a segment; copying an angle; bisecting a segment; bisecting an angle; constructing perpendicular lines, including the perpendicular bisector of a line segment; and constructing a line parallel to a given line through a point not on the line.
A. Copy a segment B. Copy an angle. C. Bisect a segment D. Bisect an angle E. Construct
perpendicular lines, including the perpendicular bisector of a line segment.
F. Construct a line parallel to a given line through a point not on the line.
A. – F. Students may use geometric software to make geometric constructions. Examples: Construct a triangle given the lengths of two sides and the
measure of the angle between the two sides. Construct the circumcenter of a given triangle.
G.CO.13 Construct an equilateral triangle, a square, and a regular hexagon inscribed in a circle.
A. Construct an equilateral triangle so that each vertex of the equilateral triangle is on the circle.
B. Construct a square so that each vertex of the square is on the circle.
C. Construct a regular hexagon so that each vertex of the regular
A. – C. Students may use geometric software to make geometric constructions.

GRADE 9‐12 MATHEMATICS CURRICULUM GEOMETRY
Waterford Public Schools 373
Common Core State Standard Unwrapped Standard Explanation and Examples hexagon is on the circle.
G‐SRT:Similarity,RightTriangles,andTrigonometryUnderstandsimilarityintermsofsimilaritytransformations
G.SRT.1 Verify experimentally the properties of dilations given by a center and a scale factor. G.SRT.1a A dilation takes a line not passing through the center of the dilation to a parallel line, and leaves a line passing through the center unchanged. G.SRT.1b The dilation of a line segment is longer or shorter in the ratio given by the scale factor.
A. Given a center and a scale factor, verify experimentally, that when dilating a figure in a coordinate plane, a segment of the pre‐image that does not pass through the center of the dilation, is parallel to its image when the dilation is performed. However, a segment that passes through the center remains unchanged.
B. Given a center and a scale factor, verify experimentally, that when performing dilations of a line segment, the pre‐image, the segment which becomes the image is longer or shorter based on the ratio given by the scale factor.
A. – B. A dilation is a transformation that moves each point along the ray through the point emanating from a fixed center, and multiplies distances from the center by a common scale factor. Students may use geometric simulation software to model transformations. Students may observe patterns and verify experimentally the properties of dilations.

GRADE 9‐12 MATHEMATICS CURRICULUM GEOMETRY
Waterford Public Schools 374
Common Core State Standard Unwrapped Standard Explanation and Examples G.SRT.2 Given two figures, use the definition of similarity in terms of similarity transformations to decide if they are similar; explain using similarity transformations the meaning of similarity for triangles as the equality of all corresponding pairs of angles and the proportionality of all corresponding pairs of sides.
A. Use the idea of dilation transformations to develop the definition of similarity.
B. Given two figures determine whether they are similar and explain their similarity based on the equality of corresponding angles and the proportionality of corresponding sides.
A. – B. A similarity transformation is a rigid motion followed by a dilation. Students may use geometric simulation software to model transformations and demonstrate a sequence of transformations to show congruence or similarity of figures.
G.SRT.3 Use the properties of similarity transformations to establish the AA criterion for two triangles to be similar.
A. Use the properties of similarity transformations to develop the criteria for proving similar triangles; AA.
ProvetheoremsinvolvingsimilarityG.SRT.4 Prove theorems about triangles. Theorems include: a line parallel to one side of a triangle divides the other two proportionally, and conversely; the Pythagorean Theorem proved using triangle similarity.
A. Use AA, SAS, SSS similarity theorems to prove triangles are similar.
B. Use triangle similarity to prove other theorems about triangles.
C. Prove a line parallel to one side of a triangle divides the other two proportionally, and
A. – D. Students may use geometric simulation software to model transformations and demonstrate a sequence of transformations to show congruence or similarity of figures.

GRADE 9‐12 MATHEMATICS CURRICULUM GEOMETRY
Waterford Public Schools 375
Common Core State Standard Unwrapped Standard Explanation and Examples it’s converse.
D. Prove the Pythagorean Theorem using triangle similarity.
G.SRT.5 Use congruence and similarity criteria for triangles to solve problems and to prove relationships in geometric figures.
A. Using similarity theorems, prove that two triangles are congruent.
B. Prove geometric figures, other than triangles, are similar and/or congruent.
A. – B. Similarity postulates include SSS, SAS, and AA. Congruence postulates include SSS, SAS, ASA, AAS, and H‐L. Students may use geometric simulation software to model transformations and demonstrate a sequence of transformations to show congruence or similarity of figures.

GRADE 9‐12 MATHEMATICS CURRICULUM GEOMETRY
Waterford Public Schools 376
Common Core State Standard Unwrapped Standard Explanation and Examples
DefinethetrigonometricratiosandsolveproblemsinvolvingrighttrianglesG.SRT.6 Understand that by similarity, side ratios in right triangles are properties of the angles in the triangle, leading to definitions of trigonometric ratios for acute angles.
A. Using a corresponding angle of similar right triangles, show that the relationships of the side ratios are the same, which leads to the definition of trigonometric ratios for acute angles.
A. Students may use applets to explore the range of values of the trigonometric ratios as θ ranges from 0 to 90 degrees.
cosecant of θ = csc θ =opposite
hypotenuse
secant of θ = sec θ =adjacent
hypotenuse
cotangent of θ = cot θ =oppositeadjacent
sine of θ = sin θ =hypotenuse
opposite
cosine of θ = cos θ =hypotenuse
adjacent
tangent of θ = tan θ =adjacentopposite
G.SRT.7 Explain and use the relationship between the sine and cosine of complementary angles.
A. Explore the sine of an acute angle and the cosine of its complement and determine their relationship.
A. Geometric simulation software, applets, and graphing calculators can be used to explore the relationship between sine and cosine.
θ opposite of θ
Adjacent to θ
hypotenuse

GRADE 9‐12 MATHEMATICS CURRICULUM GEOMETRY
Waterford Public Schools 377
Common Core State Standard Unwrapped Standard Explanation and Examples G.SRT.8 ★ Use trigonometric ratios and the Pythagorean Theorem to solve right triangles in applied problems.
A. Apply both trigonometric ratios and Pythagorean Theorem to solve application problems involving right triangles.
A. Students may use graphing calculators or programs, tables, spreadsheets, or computer algebra systems to solve right triangle problems. Example: Find the height of a tree to the nearest tenth if the angle of
elevation of the sun is 28° and the shadow of the tree is 50 ft.
ApplytrigonometrytogeneraltrianglesG.SRT.9 Derive the formula A=½ ab sin (C) for the area of a triangle by drawing an auxiliary line from a vertex perpendicular to the opposite side.
A. For a triangle that is not a right triangle, draw an auxiliary line from a vertex, perpendicular to the opposite side and derive the formula, A=½ ab sin (C), for the area of a triangle, using the fact that the height of the triangle is, h=a sin(C).

GRADE 9‐12 MATHEMATICS CURRICULUM GEOMETRY
Waterford Public Schools 378
Common Core State Standard Unwrapped Standard Explanation and Examples G.SRT.10 Prove the Laws of Sines and Cosines and use them to solve problems.
A. Using trigonometry and the relationship among sides and angles of any triangle, such as sin(C)=(h/a) , prove the Law of Sines.
B. Using trigonometry and the relationship among sides and angles of any triangle and the Pythagorean Theorem to prove the Law of Cosines.
C. Use the Laws of Sines to solve problems.
D. Use the Laws of Cosines to solve problems.
G.SRT.11 Understand and apply the Law of Sines and the Law of Cosines to find unknown measurements in right and non‐right triangles (e.g., surveying problems, resultant forces).
A. Understand and apply the Law of Sines and the Law of Cosines to find unknown measures in right triangles.
B. Understand and apply the Law of Sines and the Law of Cosines to find unknown measures in non‐right triangles.
A. – B. Example:
Tara wants to fix the location of a mountain by taking measurements from two positions 3 miles apart. From the first position, the angle between the mountain and the second position is 78o. From the second position, the angle between the mountain and the first position is 53o. How can Tara determine the distance of the mountain from each position, and what is the distance from each position?

GRADE 9‐12 MATHEMATICS CURRICULUM GEOMETRY
Waterford Public Schools 379
Common Core State Standard Unwrapped Standard Explanation and Examples
G‐C:CirclesUnderstandandapplytheoremsaboutcircles
G.C.1 Prove that all circles are similar.
A. Using the fact that the ratio of diameter to circumference is the same for circles, prove that all circles are similar.
A. Students may use geometric simulation software to model transformations and demonstrate a sequence of transformations to show congruence or similarity of figures.
G.C.2 Identify and describe relationships among inscribed angles, radii, and chords. Include the relationship between central, inscribed, and circumscribed angles; inscribed angles on a diameter are right angles; the radius of a circle is perpendicular to the tangent where the radius intersects the circle.
A. Identify and describe relationships among inscribed angles, radii, and chords. Include the relationship between central, inscribed, and circumscribed angles; inscribed angles on a diameter are right angles; the radius of a circle is perpendicular to the tangent where the radius intersects the circle.
A. Examples: Given the circle below with radius of 10 and chord length of
12, find the distance from the chord to the center of the circle.
Find the unknown length in the picture below.

GRADE 9‐12 MATHEMATICS CURRICULUM GEOMETRY
Waterford Public Schools 380
Common Core State Standard Unwrapped Standard Explanation and Examples G.C.3 Construct the inscribed and circumscribed circles of a triangle, and prove properties of angles for a quadrilateral inscribed in a circle.
A. Construct inscribed circles of a triangle.
B. Construct circumscribed circles of a triangle.
C. Using definitions, properties, and theorems, prove properties of angles for a quadrilateral inscribed in a circle.
A. – C. Students may use geometric simulation software to make geometric constructions
G.C.4 Construct a tangent line from a point outside a given circle to the circle.
A. Construct a tangent line from a point outside a given circle to the circle.
A. Students may use geometric simulation software to make geometric constructions
FindarclengthsandareasofsectorsofcirclesG.C.5 Derive using similarity the fact that the length of the arc intercepted by an angle is proportional to the radius, and define the radian measure of the angle as the constant of proportionality; derive the formula for the area of a sector.
A. Use similarity to derive the fact that the length of the arc intercepted by an angle is proportional to the radius, identifying the constant of proportionality as the radian measure of the angle.
B. Find the arc length of a circle.
C. Using similarity, derive the formula for the area of a sector.
D. Find the area of a
A. – D. Students can use geometric simulation software to explore angle and radian measures and derive the formula for the area of a sector.

GRADE 9‐12 MATHEMATICS CURRICULUM GEOMETRY
Waterford Public Schools 381
Common Core State Standard Unwrapped Standard Explanation and Examples sector in a circle.
G‐GPE:ExpressingGeometricPropertieswithEquationsTranslatebetweenthegeometricdescriptionandtheequationforaconicsection
G.GPE.1 Derive the equation of a circle of given center and radius using the Pythagorean Theorem; complete the square to find the center and radius of a circle given by an equation.
A. Use the Pythagorean Theorem to derive the equation of a circle, given the center and the radius.
B. Given an equation of a circle, complete the square to find the center and radius of a circle.
A. – B. Students may use geometric simulation software to explore the connection between circles and the Pythagorean Theorem. Examples: Write an equation for a circle with a radius of 2 units and
center at (1, 3). Write an equation for a circle given that the endpoints of the
diameter are (‐2, 7) and (4, ‐8). Find the center and radius of the circle 4x2 + 4y2 ‐ 4x + 2y – 1
= 0. G.GPE.2 Derive the equation of a parabola given a focus and a directrix.
A. Given a focus and directrix, derive the equation of a parabola.
B. Given a parabola, identify the vertex, focus, directrix, and axis of symmetry, noting that every point on the parabola is the same distance from the focus and the directrix.
A. – B. Students may use geometric simulation software to explore parabolas. Examples: Write and graph an equation for a parabola with focus (2, 3)
and directrix y = 1.

GRADE 9‐12 MATHEMATICS CURRICULUM GEOMETRY
Waterford Public Schools 382
Common Core State Standard Unwrapped Standard Explanation and Examples G.GPE.3 Derive the equations of ellipses and hyperbolas given the foci, using the fact that the sum or difference of distances from the foci is constant.
A. Given the foci, derive the equation of an ellipse, noting that the sum of the distances from the foci to any fixed point on the ellipse is constant, identifying the major and minor axis.
B. Given the foci, derive the equation of a hyperbola, noting that the absolute value of the differences of the distances form the foci to a point on the hyperbola is constant, and identifying the vertices, center, transverse axis, conjugate axis, and asymptotes.
A. – B. Students may use geometric simulation software to explore conic sections. Example: Write an equation in standard form for an ellipse with foci at
(0, 5) and (2, 0) and a center at the origin.
UsecoordinatestoprovesimplegeometrictheoremsalgebraicallyG.GPE.4 Use coordinates to prove simple geometric theorems algebraically. For example, prove or disprove that a figure defined by four given points in the coordinate plane is a rectangle; prove or disprove that the point (1, √3) lies on the circle centered at the origin and containing the point (0, 2).
A. Use coordinate geometry to prove geometric theorems algebraically; such as prove or disprove that a figure defined by four given points in the coordinate plane is a rectangle; prove
A. Students may use geometric simulation software to model figures and prove simple geometric theorems. Example: Use slope and distance formula to verify the polygon formed
by connecting the points (‐3, ‐2), (5, 3), (9, 9), (1, 4) is a parallelogram.

GRADE 9‐12 MATHEMATICS CURRICULUM GEOMETRY
Waterford Public Schools 383
Common Core State Standard Unwrapped Standard Explanation and Examples or disprove that the point (1, √3) lies on the circle centered at the origin and containing the point (0, 2).
G.GPE.5 Prove the slope criteria for parallel and perpendicular lines and use them to solve geometric problems (e.g., find the equation of a line parallel or perpendicular to a given line that passes through a given point).
A. Using slope, prove lines are parallel or perpendicular
B. Find equations of lines based on certain slope criteria such as; finding the equation of a line parallel or perpendicular to a given line that passes through a given point.
A. – B. Lines can be horizontal, vertical, or neither. Students may use a variety of different methods to construct a parallel or perpendicular line to a given line and calculate the slopes to compare the relationships.
G.GPE.6 Find the point on a directed line segment between two given points that partitions the segment in a given ratio.
A. Given two points, find the point on the line segment between the two points that divides the segment into a given ratio.
A. Students may use geometric simulation software to model figures or line segments. Examples: Given A(3, 2) and B(6, 11),
o Find the point that divides the line segment AB two‐thirds of the way from A to B. The point two‐thirds of the way from A to B has x‐coordinate two‐thirds of the way from 3 to 6 and y coordinate two‐thirds of the way from 2 to 11. So, (5, 8) is the point that is two‐thirds from point A to point B.

GRADE 9‐12 MATHEMATICS CURRICULUM GEOMETRY
Waterford Public Schools 384
Common Core State Standard Unwrapped Standard Explanation and Examples o Find the midpoint of line segment AB.
G.GPE.7 ★ Use coordinates to compute perimeters of polygons and areas of triangles and rectangles, e.g., using the distance formula.
A. Use coordinate geometry and the distance formula to find the perimeters of polygons and the areas of triangles and rectangles.
A. Students may use geometric simulation software to model figures
G‐GMD:GeometricMeasureandDimensionExplainvolumeformulasandusethemtosolveproblems
G.GMD.1 Give an informal argument for the formulas for the circumference of a circle, area of a circle, volume of a cylinder, pyramid, and cone. Use dissection arguments, Cavalieri’s principle, and informal limit arguments.
A. Explain the formulas for the circumference of a circle and the area of a circle by determining the meaning of each term or factor. G.GMD.1 Explain the formulas for the volume of a cylinder, pyramid and cone by determining the meaning of each term or factor.
A. Cavalieri’s principle is if two solids have the same height and the same cross‐sectional area at every level, then they have the same volume
G.GMD.2 Give an informal argument using Cavalieri’s principle for the formulas for the volume of a sphere and other solid figures.
A. Using Cavalieri’s Principle, provide informal arguments to develop the formulas for the volume of spheres and other solid figures.
A. Cavalieri’s principle is if two solids have the same height and the same cross‐sectional area at every level, then they have the same volume.

GRADE 9‐12 MATHEMATICS CURRICULUM GEOMETRY
Waterford Public Schools 385
Common Core State Standard Unwrapped Standard Explanation and Examples G.GMD.3 ★ Use volume formulas for cylinders, pyramids, cones, and spheres to solve problems.*
A. Solve problems using volume formulas for cylinders, pyramids, cones, and spheres.
A. Missing measures can include but are not limited to slant height, altitude, height, diagonal of a prism, edge length, and radius.
Visualize relationships between two‐dimensional and three‐dimensional objects G.GMD.4 Identify the shapes of two‐dimensional cross‐sections of three‐dimensional objects, and identify three‐dimensional objects generated by rotations of two‐dimensional objects.
A. Given a three‐ dimensional object, identify the shape made when the object is cut into cross‐sections.
B. When rotating a two‐ dimensional figure, such as a square, know the three‐dimensional figure that is generated, such as a cylinder. Understand that a cross section of a solid is an intersection of a plane (two‐dimensional) and a solid (three‐dimensional).
A. – B. Students may use geometric simulation software to model figures and create cross sectional views. Example: Identify the shape of the vertical, horizontal, and other cross
sections of a cylinder.
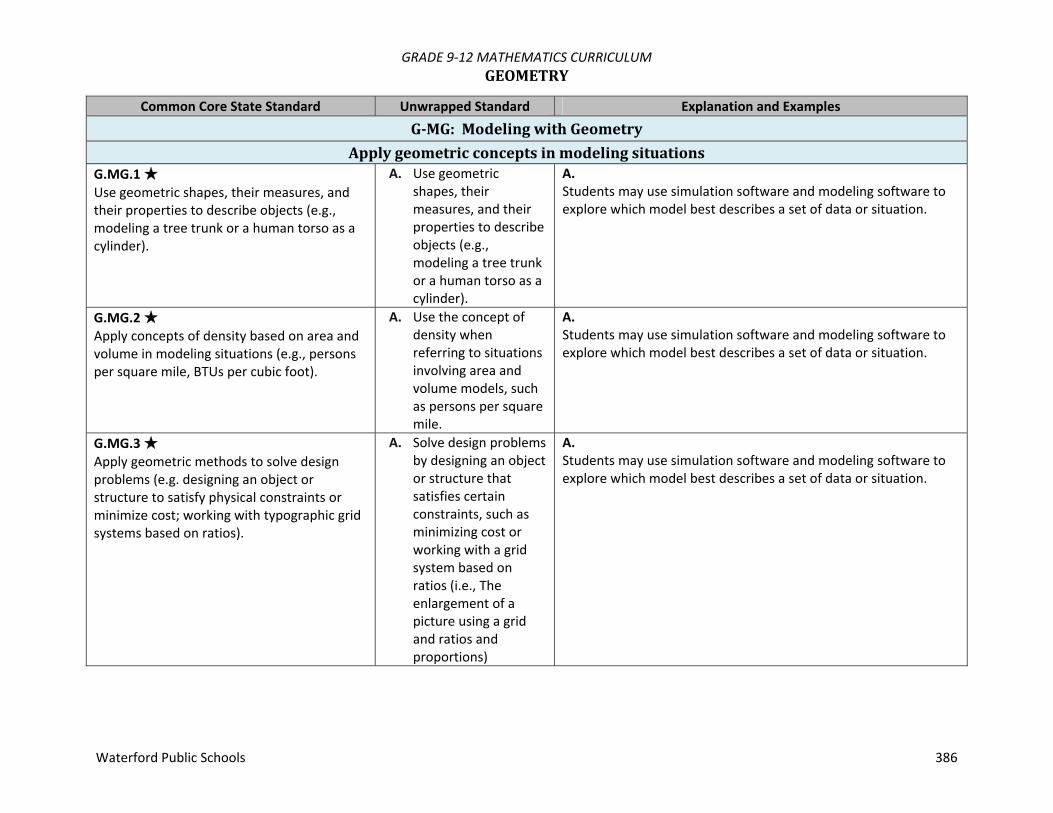
GRADE 9‐12 MATHEMATICS CURRICULUM GEOMETRY
Waterford Public Schools 386
Common Core State Standard Unwrapped Standard Explanation and Examples
G‐MG:ModelingwithGeometryApplygeometricconceptsinmodelingsituations
G.MG.1 ★ Use geometric shapes, their measures, and their properties to describe objects (e.g., modeling a tree trunk or a human torso as a cylinder).
A. Use geometric shapes, their measures, and their properties to describe objects (e.g., modeling a tree trunk or a human torso as a cylinder).
A. Students may use simulation software and modeling software to explore which model best describes a set of data or situation.
G.MG.2 ★ Apply concepts of density based on area and volume in modeling situations (e.g., persons per square mile, BTUs per cubic foot).
A. Use the concept of density when referring to situations involving area and volume models, such as persons per square mile.
A. Students may use simulation software and modeling software to explore which model best describes a set of data or situation.
G.MG.3 ★ Apply geometric methods to solve design problems (e.g. designing an object or structure to satisfy physical constraints or minimize cost; working with typographic grid systems based on ratios).
A. Solve design problems by designing an object or structure that satisfies certain constraints, such as minimizing cost or working with a grid system based on ratios (i.e., The enlargement of a picture using a grid and ratios and proportions)
A. Students may use simulation software and modeling software to explore which model best describes a set of data or situation.

GRADE 9‐12 MATHEMATICS CURRICULUM MODELING
Waterford Public Schools 387
Modeling links classroom mathematics and statistics to everyday life, work, and decision‐making. Modeling is the process of choosing and using appropriate mathematics and statistics to analyze empirical situations, to understand them better, and to improve decisions. Quantities and their relationships in physical, economic, public policy, social, and everyday situations can be modeled using mathematical and statistical methods. When making mathematical models, technology is valuable for varying assumptions, exploring consequences, and comparing predictions with data. A model can be very simple, such as writing total cost as a product of unit price and number bought, or using a geometric shape to describe a physical object like a coin. Even such simple models involve making choices. It is up to us whether to model a coin as a three‐dimensional cylinder, or whether a two‐dimensional disk works well enough for our purposes. Other situations—modeling a delivery route, a production schedule, or a comparison of loan amortizations—need more elaborate models that use other tools from the mathematical sciences. Real‐world situations are not organized and labeled for analysis; formulating tractable models, representing such models, and analyzing them is appropriately a creative process. Like every such process, this depends on acquired expertise as well as creativity. Some examples of such situations might include:
Estimating how much water and food is needed for emergency relief in a devastated city of 3 million people, and how it might be distributed.
Planning a table tennis tournament for 7 players at a club with 4 tables, where each player plays against each other player. Designing the layout of the stalls in a school fair so as to raise as much money as possible. Analyzing stopping distance for a car. Modeling savings account balance, bacterial colony growth, or investment growth. Engaging in critical path analysis, e.g., applied to turnaround of an aircraft at an airport. Analyzing risk in situations such as extreme sports, pandemics, and terrorism. Relating population statistics to individual predictions.
In situations like these, the models devised depend on a number of factors: How precise an answer do we want or need? What aspects of the situation do we most need to understand, control, or optimize? What resources of time and tools do we have? The range of models that we can create and analyze is also constrained by the limitations of our mathematical, statistical, and technical skills, and our ability to recognize significant variables and relationships among them. Diagrams of various kinds, spreadsheets and other technology, and algebra are powerful tools for understanding and solving problems drawn from different types of real‐world situations. One of the insights provided by mathematical modeling is that essentially the same mathematical or statistical structure can sometimes model seemingly different situations. Models can also shed light on the mathematical structures themselves, for example, as when a model of bacterial growth makes more vivid the explosive growth of the exponential function.

GRADE 9‐12 MATHEMATICS CURRICULUM MODELING
Waterford Public Schools 388
The basic modeling cycle is summarized in the diagram. It involves (1) identifying variables in the situation and selecting those that represent essential features, (2) formulating a model by creating and selecting geometric, graphical, tabular, algebraic, or statistical representations that describe relationships between the variables, (3) analyzing and performing operations on these relationships to draw conclusions, (4) interpreting the results of the mathematics in terms of the original situation, (5) validating the conclusions by comparing them with the situation, and then either improving the model or, if it is acceptable, (6) reporting on the conclusions and the reasoning behind them. Choices, assumptions, and approximations are present throughout this cycle. In descriptive modeling, a model simply describes the phenomena or summarizes them in a compact form. Graphs of observations are a familiar descriptive model—for example, graphs of global temperature and atmospheric CO2 over time. Analytic modeling seeks to explain data on the basis of deeper theoretical ideas, albeit with parameters that are empirically based; for example, exponential growth of bacterial colonies (until cut‐off mechanisms such as pollution or starvation intervene) follows from a constant reproduction rate. Functions are an important tool for analyzing such problems. Graphing utilities, spreadsheets, computer algebra systems, and dynamic geometry software are powerful tools that can be used to model purely mathematical phenomena (e.g., the behavior of polynomials) as well as physical phenomena. Modeling Standards Modeling is best interpreted not as a collection of isolated topics but rather in relation to other standards. Making mathematical models is a Standard for Mathematical Practice, and specific modeling standards appear throughout the high school standards indicated by a star symbol ★.

GRADE 9‐12 MATHEMATICS CURRICULUM STATISTICSANDPROBABILITY
Waterford Public Schools 389
InterpretingCategoricalandQuantitativeData(S‐ID) Summarize, represent, and interpret data on a single count or measurement variable Summarize, represent, and interpret data on two categorical and quantitative variables Interpret linear models
MakingInferencesandJustifyingConclusions(S‐IC)
Understand and evaluate random processes underlying statistical experiments Make inferences and justify conclusions from sample surveys, experiments and observational studies
ConditionalProbabilityandtheRulesofProbability(S‐CP)
Understand independence and conditional probability and use them to interpret data Use the rules of probability to compute probabilities of compound events in a uniform probability model
UsingProbabilitytoMakeDecisions(S‐MD)
Calculate expected values and use them to solve problems Use probability to evaluate outcomes of decisions
MathematicalPractices(MP)1. Make sense of problems and persevere in solving them. 2. Reason abstractly and quantitatively. 3. Construct viable arguments and critique the reasoning of others. 4. Model with mathematics. 5. Use appropriate tools strategically. 6. Attend to precision. 7. Look for and make use of structure. 8. Look for and express regularity in repeated reasoning.

GRADE 9‐12 MATHEMATICS CURRICULUM STATISTICSANDPROBABILITY
Waterford Public Schools 390
Decisions or predictions are often based on data—numbers in context. These decisions or predictions would be easy if the data always sent a clear message, but the message is often obscured by variability. Statistics provides tools for describing variability in data and for making informed decisions that take it into account. Data are gathered, displayed, summarized, examined, and interpreted to discover patterns and deviations from patterns. Quantitative data can be described in terms of key characteristics: measures of shape, center, and spread. The shape of a data distribution might be described as symmetric, skewed, flat, or bell shaped, and it might be summarized by a statistic measuring center (such as mean or median) and a statistic measuring spread (such as standard deviation or interquartile range). Different distributions can be compared numerically using these statistics or compared visually using plots. Knowledge of center and spread are not enough to describe a distribution. Which statistics to compare, which plots to use, and what the results of a comparison might mean, depend on the question to be investigated and the real‐life actions to be taken. Randomization has two important uses in drawing statistical conclusions. First, collecting data from a random sample of a population makes it possible to draw valid conclusions about the whole population, taking variability into account. Second, randomly assigning individuals to different treatments allows a fair comparison of the effectiveness of those treatments. A statistically significant outcome is one that is unlikely to be due to chance alone, and this can be evaluated only under the condition of randomness. The conditions under which data are collected are important in drawing conclusions from the data; in critically reviewing uses of statistics in public media and other reports, it is important to consider the study design, how the data were gathered, and the analyses employed as well as the data summaries and the conclusions drawn. Random processes can be described mathematically by using a probability model: a list or description of the possible outcomes (the sample space), each of which is assigned a probability. In situations such as flipping a coin, rolling a number cube, or drawing a card, it might be reasonable to assume various outcomes are equally likely. In a probability model, sample points represent outcomes and combine to make up events; probabilities of events can be computed by applying the Addition and Multiplication Rules. Interpreting these probabilities relies on an understanding of independence and conditional probability, which can be approached through the analysis of two‐way tables. Technology plays an important role in statistics and probability by making it possible to generate plots, regression functions, and correlation coefficients, and to simulate many possible outcomes in a short amount of time. ConnectionstoFunctionsandModelingFunctions may be used to describe data; if the data suggest a linear relationship, the relationship can be modeled with a regression line, and its strength and direction can be expressed through a correlation coefficient.

GRADE 9‐12 MATHEMATICS CURRICULUM STATISTICSANDPROBABILITY
Waterford Public Schools 391
Common Core State Standard Unwrapped Standard Explanation and Examples S‐ID:InterpretingCategoricalandQuantitativeData
Summarize,represent,andinterpretdataonasinglecountormeasurementvariableS.ID.1 Represent data with plots on the real number line (dot plots, histograms, and box plots
A. Construct dot plots, histograms and box plots for data on a real number line.
S.ID.2 Use statistics appropriate to the shape of the data distribution to compare center (median, mean) and spread (interquartile range, standard deviation) of two or more different data sets.
A. Describe a distribution using center and spread.
B. Use the correct measure of center and spread to describe a distribution that is symmetric or skewed.
C. Identify outliers (extreme data points) and their effects on data sets.
D. Compare two or more different data sets using the center and spread of each.
A. – D. Students may use spreadsheets, graphing calculators and statistical software for calculations, summaries, and comparisons of data sets. Examples: The two data sets below depict the housing prices sold in the
King River area and Toby Ranch areas of Pinal County, Arizona. Based on the prices below which price range can be expected for a home purchased in Toby Ranch? In the King River area? In Pinal County?
King River area {1.2 million, 242000, 265500, 140000, 281000, 265000, 211000}
Toby Ranch homes {5million, 154000, 250000, 250000, 200000, 160000, 190000}
Given a set of test scores: 99, 96, 94, 93, 90, 88, 86, 77, 70, 68, find the mean, median and standard deviation. Explain how the values vary about the mean and median. What information does this give the teacher?
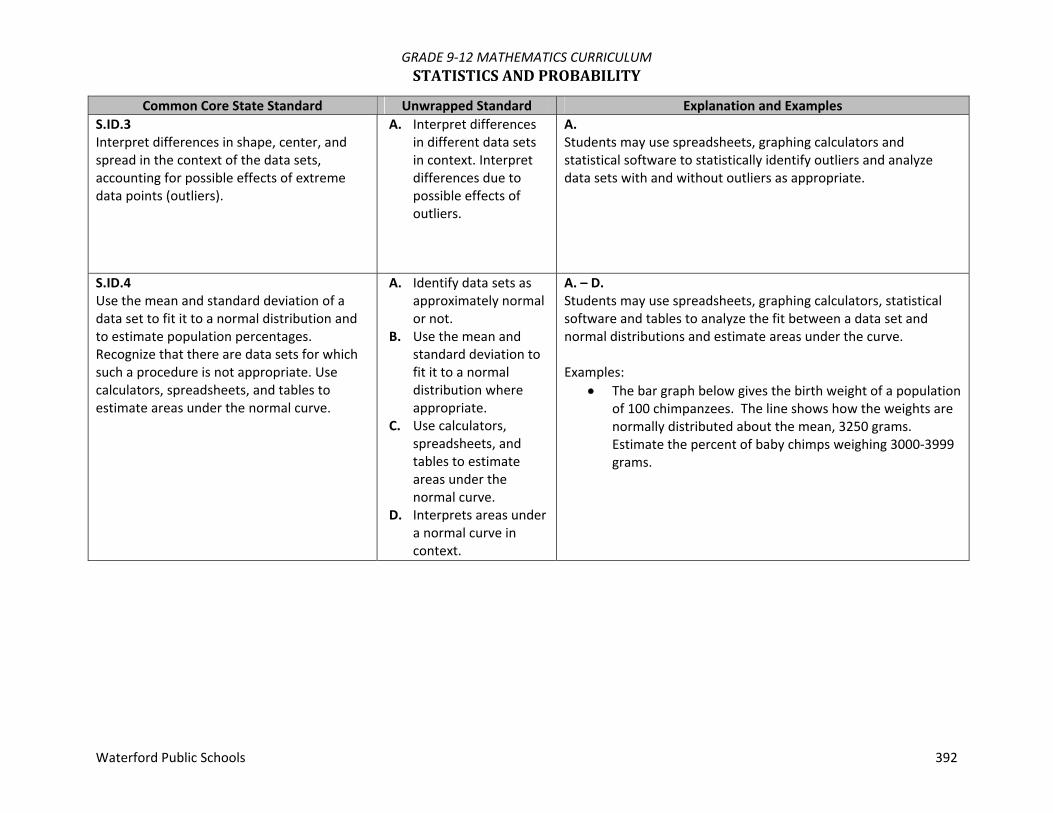
GRADE 9‐12 MATHEMATICS CURRICULUM STATISTICSANDPROBABILITY
Waterford Public Schools 392
Common Core State Standard Unwrapped Standard Explanation and Examples S.ID.3 Interpret differences in shape, center, and spread in the context of the data sets, accounting for possible effects of extreme data points (outliers).
A. Interpret differences in different data sets in context. Interpret differences due to possible effects of outliers.
A. Students may use spreadsheets, graphing calculators and statistical software to statistically identify outliers and analyze data sets with and without outliers as appropriate.
S.ID.4 Use the mean and standard deviation of a data set to fit it to a normal distribution and to estimate population percentages. Recognize that there are data sets for which such a procedure is not appropriate. Use calculators, spreadsheets, and tables to estimate areas under the normal curve.
A. Identify data sets as approximately normal or not.
B. Use the mean and standard deviation to fit it to a normal distribution where appropriate.
C. Use calculators, spreadsheets, and tables to estimate areas under the normal curve.
D. Interprets areas under a normal curve in context.
A. – D. Students may use spreadsheets, graphing calculators, statistical software and tables to analyze the fit between a data set and normal distributions and estimate areas under the curve. Examples:
The bar graph below gives the birth weight of a population of 100 chimpanzees. The line shows how the weights are normally distributed about the mean, 3250 grams. Estimate the percent of baby chimps weighing 3000‐3999 grams.

GRADE 9‐12 MATHEMATICS CURRICULUM STATISTICSANDPROBABILITY
Waterford Public Schools 393
Common Core State Standard Unwrapped Standard Explanation and Examples
Determine which situation(s) is best modeled by a normal
distribution. Explain your reasoning. Annual income of a household in the U.S. Weight of babies born in one year in the U.S.
Summarize,represent,andinterpretdataontwocategoricalandquantitativevariablesS.ID.5 Summarize categorical data for two categories in two‐way frequency tables. Interpret relative frequencies in the context of the data (including joint, marginal, and conditional relative frequencies). Recognize possible associations and trends in the data.
A. Create a two‐way table from two categorical variables and read values from two way table. Interpret joint, marginal, and relative frequencies in context.
B. Recognize associations and trends in data from a two‐way table.
A. – B. Students may use spreadsheets, graphing calculators, and statistical software to create frequency tables and determine associations or trends in the data. Examples: Two‐way Frequency Table
A two‐way frequency table is shown below displaying the relationship between age and baldness. We took a sample of 100 male subjects, and determined who is or is not bald. We also recorded the age of the male subjects by categories.

GRADE 9‐12 MATHEMATICS CURRICULUM STATISTICSANDPROBABILITY
Waterford Public Schools 394
Common Core State Standard Unwrapped Standard Explanation and Examples
Two‐way Frequency Table Bald Age Total Younger than 45 45 or older No 35 11 46 Yes 24 30 54 Total 59 41 100
The total row and total column entries in the table above report the marginal frequencies, while entries in the body of the table are the joint frequencies.
Two‐way Relative Frequency Table
The relative frequencies in the body of the table are called conditional relative frequencies.
Two‐way Relative Frequency Table
Bald Age Total Younger than 45 45 or older No 0.35 0.11 0.46 Yes 0.24 0.30 0.54 Total 0.59 0.41 1.00
S.ID.6 Represent data on two quantitative variables on a scatter plot, and describe how the variables are related.
A. Create a scatter plot from two quantitative variables.
B. Describe the form, strength and direction of the relationship.
6a. – 6c. The residual in a regression model is the difference between the observed and the predicted for some ( the dependent variable and the independent variable). So if we have a model , and a data point the residual is for this point is: . Students may use spreadsheets, graphing calculators, and statistical software to represent data, describe how the variables are related, fit

GRADE 9‐12 MATHEMATICS CURRICULUM STATISTICSANDPROBABILITY
Waterford Public Schools 395
Common Core State Standard Unwrapped Standard Explanation and Examples S.ID.6a Fit a function to the data; use functions fitted to data to solve problems in the context of the data. Use given functions or choose a function suggested by the context. Emphasize linear and exponential models.
A. Categorize data as linear or not. Use algebraic methods and technology to fit a linear function to the data. Use the function to predict values.
B. Explain the meaning of the slope and y‐intercept in context.
C. Categorize data as exponential. Use algebraic methods and technology to fit an exponential function to the data. Use the function to predict values.
D. Explain the meaning of the growth rate and y‐intercept in context.
E. Categorize data as quadratic. Use algebraic methods and technology to fit a quadratic function to the data. Use the function to predict values.
F. Explain the meaning of the constant and coefficients in context.
functions to data, perform regressions, and calculate residuals. Example: Measure the wrist and neck size of each person in your class
and make a scatterplot. Find the least squares regression line. Calculate and interpret the correlation coefficient for this linear regression model. Graph the residuals and evaluate the fit of the linear equations.

GRADE 9‐12 MATHEMATICS CURRICULUM STATISTICSANDPROBABILITY
Waterford Public Schools 396
Common Core State Standard Unwrapped Standard Explanation and Examples S.ID.6b Informally assess the fit of a function by plotting and analyzing residuals.
A. Calculate a residual. Create and analyze a residual plot.
S.ID.6c Fit a linear function for a scatter plot that suggests a linear association.
A. Categorize data as linear or not. Use algebraic methods and technology to fit a linear function to the data. Use the function to predict values.
Interpret linear models S.ID.7 Interpret the slope (rate of change) and the intercept (constant term) of a linear model in the context of the data.
A. Explain the meaning of the slope and y‐intercept in context.
A. Students may use spreadsheets or graphing calculators to create representations of data sets and create linear models. Example: Lisa lights a candle and records its height in inches every
hour. The results recorded as (time, height) are (0, 20), (1, 18.3), (2, 16.6), (3, 14.9), (4, 13.2), (5, 11.5), (7, 8.1), (9, 4.7), and (10, 3). Express the candle’s height (h) as a function of time (t) and state the meaning of the slope and the intercept in terms of the burning candle.
Solution: h = ‐1.7t + 20 Slope: The candle’s height decreases by 1.7 inches for each hour it is burning. Intercept: Before the candle begins to burn, its height is 20 inches.
S.ID.8 Compute (using technology) and interpret the correlation coefficient of a linear fit.
A. Use a calculator or computer to find the correlation coefficient
A. Students may use spreadsheets, graphing calculators, and statistical software to represent data, describe how the variables

GRADE 9‐12 MATHEMATICS CURRICULUM STATISTICSANDPROBABILITY
Waterford Public Schools 397
Common Core State Standard Unwrapped Standard Explanation and Examples for a linear
association. Interpret the meaning of the value in the context of the data.
are related, fit functions to data, perform regressions, and calculate residuals and correlation coefficients. Example: Collect height, shoe‐size, and wrist circumference data for
each student. Determine the best way to display the data. Answer the following questions: Is there a correlation between any two of the three indicators? Is there a correlation between all three indicators? What patterns and trends are apparent in the data? What inferences can be made from the data?
S.ID.9 Distinguish between correlation and causation.
A. Explain the difference between correlation and causation.
A. Some data leads observers to believe that there is a cause and effect relationship when a strong relationship is observed. Students should be careful not to assume that correlation implies causation. The determination that one thing causes another requires a controlled randomized experiment. Example: Diane did a study for a health class about the effects of a
student’s end‐of‐year math test scores on height. Based on a graph of her data, she found that there was a direct relationship between students’ math scores and height. She concluded that “doing well on your end‐of‐course math tests makes you tall.” Is this conclusion justified? Explain any flaws in Diane’s reasoning.

GRADE 9‐12 MATHEMATICS CURRICULUM STATISTICSANDPROBABILITY
Waterford Public Schools 398
Common Core State Standard Unwrapped Standard Explanation and Examples S‐IC:MakingInferencesandJustifyingConclusions
UnderstandandevaluaterandomprocessesunderlyingstatisticalexperimentsS.IC.1 Understand statistics as a process for making inferences about population parameters based on a random sample from that population.
A. Explain in context the difference between values describing a population and a sample.
S.IC.2 Decide if a specified model is consistent with results from a given data‐generating process, e.g., using simulation. For example, a model says a spinning coin falls heads up with probability 0.5. Would a result of 5 tails in a row cause you to question the model?
A. Explain how well and why a sample represents the variable of interest from a population.
B. Demonstrate understanding of the different kinds of sampling methods.
C. Design simulations of random sampling: assign digits in appropriate proportions for events, carry out the simulation using random number generators and random number tables and explain the outcomes in context of the population and
A. – C. Possible data‐generating processes include (but are not limited to): flipping coins, spinning spinners, rolling a number cube, and simulations using the random number generators. Students may use graphing calculators, spreadsheet programs, or applets to conduct simulations and quickly perform large numbers of trials. The law of large numbers states that as the sample size increases, the experimental probability will approach the theoretical probability. Comparison of data from repetitions of the same experiment is part of the model building verification process. Example: Have multiple groups flip coins. One group flips a coin 5
times, one group flips a coin 20 times, and one group flips a coin 100 times. Which group’s results will most likely approach the theoretical probability?

GRADE 9‐12 MATHEMATICS CURRICULUM STATISTICSANDPROBABILITY
Waterford Public Schools 399
Common Core State Standard Unwrapped Standard Explanation and Examples the known proportions.
Makeinferencesandjustifyconclusionsfromsamplesurveys,experimentsandobservationalstudiesS.IC.3 Recognize the purposes of and differences among sample surveys, experiments, and observational studies; explain how randomization relates to each.
A. Identify situations as either sample survey, experiment, or observational study. Discuss the appropriateness of each one’s use in contexts with limiting factors.
B. Design or evaluate sample surveys, experiments and observational studies with randomization. Discuss the importance of randomization in these processes.
A. – B. Students should be able to explain techniques/applications for randomly selecting study subjects from a population and how those techniques/applications differ from those used to randomly assign existing subjects to control groups or experimental groups in a statistical experiment. In statistics, an observational study draws inferences about the possible effect of a treatment on subjects, where the assignment of subjects into a treated group versus a control group is outside the control of the investigator (for example, observing data on academic achievement and socio‐economic status to see if there is a relationship between them). This is in contrast to controlled experiments, such as randomized controlled trials, where each subject is randomly assigned to a treated group or a control group before the start of the treatment.
S.IC.4 Use data from a sample survey to estimate a population mean or proportion; develop a margin of error through the use of simulation models for random sampling.
A. Use sample means and sample proportions to estimate population values.
B. Conduct simulations of random sampling to gather sample means and sample proportions. Explain what the results mean about variability in a
A. – B. Students may use computer generated simulation models based upon sample surveys results to estimate population statistics and margins of error.

GRADE 9‐12 MATHEMATICS CURRICULUM STATISTICSANDPROBABILITY
Waterford Public Schools 400
Common Core State Standard Unwrapped Standard Explanation and Examples population and use results to calculate margins of error for these estimates.
S.IC.5 Use data from a randomized experiment to compare two treatments; use simulations to decide if differences between parameters are significant.
A. Evaluate effectiveness and differences in two treatments based on data from randomized experiments. Explain in context.
B. Use simulations to generate data simulating application of two treatments. Use results to evaluate significance of differences.
A. – B. Students may use computer generated simulation models to decide how likely it is that observed differences in a randomized experiment are due to chance. Treatment is a term used in the context of an experimental design to refer to any prescribed combination of values of explanatory variables. For example, one wants to determine the effectiveness of weed killer. Two equal parcels of land in a neighborhood are treated; one with a placebo and one with weed killer to determine whether there is a significant difference in effectiveness in eliminating weeds.
S.IC.6 Evaluate reports based on data.
A. Read and explain in context data from outside reports.
A. Explanations can include but are not limited to sample size, biased survey sample, interval scale, unlabeled scale, uneven scale, and outliers that distort the line‐of‐best‐fit. In a pictogram the symbol scale used can also be a source of distortion. As a strategy, collect reports published in the media and ask students to consider the source of the data, the design of the study, and the way the data are analyzed and displayed. Example: A reporter used the two data sets below to calculate the
mean housing price in Arizona as $629,000. Why is this calculation not representative of the typical housing price in Arizona?
King River area {1.2 million, 242000, 265500, 140000,

GRADE 9‐12 MATHEMATICS CURRICULUM STATISTICSANDPROBABILITY
Waterford Public Schools 401
Common Core State Standard Unwrapped Standard Explanation and Examples 281000, 265000, 211000}
Toby Ranch homes {5million, 154000, 250000, 250000, 200000, 160000, 190000}
S‐CP:ConditionalProbabilityandtheRulesofProbabilityUnderstandindependenceandconditionalprobabilityandusethemtointerpretdata
S.CP.1 Describe events as subsets of a sample space (the set of outcomes) using characteristics (or categories) of the outcomes, or as unions, intersections, or complements of other events (“or”, “and”, and “not”).
A. Define a sample space and events within the sample space. Identify subsets from sample space given defined events, including unions, intersections and complements of events.
A. Intersection: The intersection of two sets A and B is the set of elements that are common to both set A and set B. It is denoted by A ∩ B and is read ‘A intersection B’. A ∩ B in the diagram is {1, 5} this means: BOTH/AND Union: The union of two sets A and B is the set of elements, which are in A or in B or in both. It is denoted by A ∪ B and is read ‘A union B’.
A ∪ B in the diagram is {1, 2, 3, 4, 5, 7} this means: EITHER/OR/ANY could be both
U
BA
7 5
4 3
2 1
8

GRADE 9‐12 MATHEMATICS CURRICULUM STATISTICSANDPROBABILITY
Waterford Public Schools 402
Common Core State Standard Unwrapped Standard Explanation and Examples Complement: The complement of the set A ∪B is the set of elements that are members of the universal set U but are not in A ∪B. It is denoted by (A ∪ B )’ (A ∪ B )’ in the diagram is {8}
S.CP.2 Understand that two events A and B are independent if the probability of A and B occurring together is the product of their probabilities, and use this characterization to determine if they are independent.
A. Identify two events as independent or not. Explain properties of Independence and Conditional Probabilities in context and simple English.
S.CP.3 Understand the conditional probability of A given B as P(A and B)/P(B), and interpret independence of A and B as saying that the conditional probability of A given B is the same as the probability of A, and the conditional probability of B given A is the same as the probability of B.
A. Define and calculate conditional probabilities. Use the Multiplication Principal to decide if two events are independent and to calculate conditional probabilities.
S.CP.4 Construct and interpret two‐way frequency tables of data when two categories are associated with each object being classified. Use the two‐way table as a sample space to decide if events are independent and to approximate conditional probabilities. For example, collect data from a random sample of students in your school on their favorite subject among math, science, and English.
A. Construct and interpret two‐way frequency tables of data for two categorical variables. Calculate probabilities from the table. Use probabilities from the table to evaluate independence of two
A. Students may use spreadsheets, graphing calculators, and simulations to create frequency tables and conduct analyses to determine if events are independent or determine approximate conditional probabilities.

GRADE 9‐12 MATHEMATICS CURRICULUM STATISTICSANDPROBABILITY
Waterford Public Schools 403
Common Core State Standard Unwrapped Standard Explanation and Examples Estimate the probability that a randomly selected student from your school will favor science given that the student is in tenth grade. Do the same for other subjects and compare the results.
variables.
S.CP.5 Recognize and explain the concepts of conditional probability and independence in everyday language and everyday situations. For example, compare the chance of having lung cancer if you are a smoker with the chance of being a smoker if you have lung cancer.
A. Recognize and explain the concepts of independence and conditional probability in everyday situations.
A. Examples: What is the probability of drawing a heart from a standard
deck of cards on a second draw, given that a heart was drawn on the first draw and not replaced? Are these events independent or dependent?
At Johnson Middle School, the probability that a student takes computer science and French is 0.062. The probability that a student takes computer science is 0.43. What is the probability that a student takes French given that the student is taking computer science?
UsetherulesofprobabilitytocomputeprobabilitiesofcompoundeventsinauniformprobabilitymodelS.CP.6 Find the conditional probability of A given B as the fraction of B’s outcomes that also belong to A, and interpret the answer in terms of the model.
A. Calculate conditional probabilities using the definition: “the conditional probability of A given B as the fraction of B’s outcomes that also belong to A”. Interpret the probability in context.
A. Students could use graphing calculators, simulations, or applets to model probability experiments and interpret the outcomes.

GRADE 9‐12 MATHEMATICS CURRICULUM STATISTICSANDPROBABILITY
Waterford Public Schools 404
Common Core State Standard Unwrapped Standard Explanation and Examples S.CP.7 Apply the Addition Rule, P(A or B) = P(A) + P(B) – P(A and B), and interpret the answer in terms of the model.
A. Identify two events as disjoint (mutually exclusive). Calculate probabilities using the Addition Rule. Interpret the probability in context.
A. Students could use graphing calculators, simulations, or applets to model probability experiments and interpret the outcomes. Example: In a math class of 32 students, 18 are boys and 14 are girls.
On a unit test, 5 boys and 7 girls made an A grade. If a student is chosen at random from the class, what is the probability of choosing a girl or an A student?
S.CP.8 Apply the general Multiplication Rule in a uniform probability model, P(A and B) = P(A)P(B|A) = P(B)P(A|B), and interpret the answer in terms of the model.
A. Calculate probabilities using the General Multiplication Rule. Interpret in context.
A. Students could use graphing calculators, simulations, or applets to model probability experiments and interpret the outcomes.
S.CP.9 Use permutations and combinations to compute probabilities of compound events and solve problems.
A. Identify situations as appropriate for use of a permutation or combination to calculate probabilities. Use permutations and combinations in conjunction with other probability methods to calculate probabilities of compound events and solve problems.
A. Students may use calculators or computers to determine sample spaces and probabilities. Example: You and two friends go to the grocery store and each buys a soda. If there are five different kinds of soda, and each friend is equally likely to buy each variety, what is the probability that no one buys the same kind?
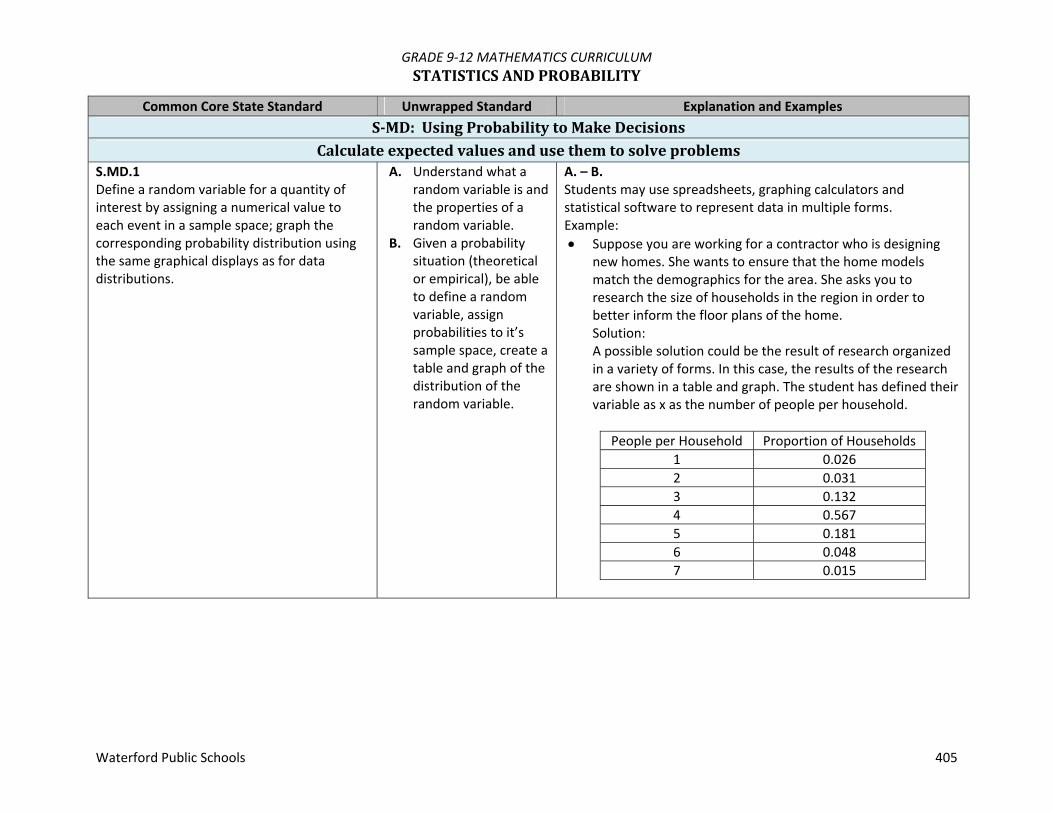
GRADE 9‐12 MATHEMATICS CURRICULUM STATISTICSANDPROBABILITY
Waterford Public Schools 405
Common Core State Standard Unwrapped Standard Explanation and Examples S‐MD:UsingProbabilitytoMakeDecisions
CalculateexpectedvaluesandusethemtosolveproblemsS.MD.1 Define a random variable for a quantity of interest by assigning a numerical value to each event in a sample space; graph the corresponding probability distribution using the same graphical displays as for data distributions.
A. Understand what a random variable is and the properties of a random variable.
B. Given a probability situation (theoretical or empirical), be able to define a random variable, assign probabilities to it’s sample space, create a table and graph of the distribution of the random variable.
A. – B. Students may use spreadsheets, graphing calculators and statistical software to represent data in multiple forms. Example: Suppose you are working for a contractor who is designing
new homes. She wants to ensure that the home models match the demographics for the area. She asks you to research the size of households in the region in order to better inform the floor plans of the home. Solution: A possible solution could be the result of research organized in a variety of forms. In this case, the results of the research are shown in a table and graph. The student has defined their variable as x as the number of people per household.
People per Household Proportion of Households
1 0.026 2 0.031 3 0.132 4 0.567 5 0.181 6 0.048 7 0.015

GRADE 9‐12 MATHEMATICS CURRICULUM STATISTICSANDPROBABILITY
Waterford Public Schools 406
Common Core State Standard Unwrapped Standard Explanation and Examples
S.MD.2 Calculate the expected value of a random variable; interpret it as the mean of the probability distribution.
A. Calculate and interpret in context the expected value of a random variable.
A. Students may use spreadsheets or graphing calculators to complete calculations or create probability models. The expected value of an uncertain event is the sum of the possible points earned multiplied by each points chance of occurring. Example: In a game, you roll a six sided number cube numbered with 1,
2, 3, 4, 5 and 6. You earn 3 points if a 6 comes up, 6 points if a 2, 4 or 5 comes up, and nothing otherwise. Since there is a 1/6 chance of each number coming up, the outcomes, probabilities and payoffs look like this:
Outcome Probability Points
1 1/6 0 2 1/6 6 3 1/6 0 4 1/6 6 5 1/6 6 6 1/6 3

GRADE 9‐12 MATHEMATICS CURRICULUM STATISTICSANDPROBABILITY
Waterford Public Schools 407
Common Core State Standard Unwrapped Standard Explanation and Examples
The expected value is sum of the products of the probability and points earned for each outcome (the entries in the last two columns multiplied together):
points 50.33616
616
610
616
610
61
S.MD.3 Develop a probability distribution for a random variable defined for a sample space in which theoretical probabilities can be calculated; find the expected value. For example, find the theoretical probability distribution for the number of correct answers obtained by guessing on all five questions of a multiple‐choice test where each question has four choices, and find the expected grade under various grading schemes.
A. Develop a theoretical probability distribution and find the expected value.
A. Students may use graphing calculators or programs, spreadsheets, or computer algebra systems to model and interpret parameters in linear, quadratic or exponential functions.
S.MD.4 Develop a probability distribution for a random variable defined for a sample space in which probabilities are assigned empirically; find the expected value. For example, find a current data distribution on the number of TV sets per household in the United States, and calculate the expected number of sets per household. How many TV sets would you expect to find in 100 randomly selected households?
A. Develop an empirical probability distribution and find the expected value.
A. Students may use graphing calculators or programs, spreadsheets, or computer algebra systems to model and interpret parameters in linear, quadratic or exponential functions.

GRADE 9‐12 MATHEMATICS CURRICULUM STATISTICSANDPROBABILITY
Waterford Public Schools 408
Common Core State Standard Unwrapped Standard Explanation and Examples Useprobabilitiestoevaluateoutcomesofdecisions
S.MD.5 Weigh the possible outcomes of a decision by assigning probabilities to payoff values and finding expected values. S.MD.5a Find the expected payoff for a game of chance. For example, find the expected winnings from a state lottery ticket or a game at a fast‐ food restaurant. S.MD.5b Evaluate and compare strategies on the basis of expected values. For example, compare a high‐deductible versus a low‐deductible automobile insurance policy using various, but reasonable, chances of having a minor or a major accident.
A. Set up a probability distribution for a random variable representing payoff values in a game of chance.
A. Different types of insurance to be discussed include but are not limited to: health, automobile, property, rental, and life insurance. Students may use graphing calculators or programs, spreadsheets, or computer algebra systems to model and interpret parameters in linear, quadratic or exponential functions.
S.MD.6 Use probabilities to make fair decisions (e.g., drawing by lots, using a random number generator).
A. Make decisions based on expected values. Use expected values to compare long term benefits of several situations.
A. Students may use graphing calculators or programs, spreadsheets, or computer algebra systems to model and interpret parameters in linear, quadratic or exponential functions.
S.MD.7 Analyze decisions and strategies using probability concepts (e.g., product testing, medical testing, pulling a hockey goalie at the end of a game).
A. Explain in context decisions made based on expected values.
A. Students may use graphing calculators or programs, spreadsheets, or computer algebra systems to model and interpret parameters in linear, quadratic or exponential functions.

GRADE 9‐12 MATHEMATICS CURRICULUM ALGEBRAI–S
Waterford Public Schools 409
This course covers operations on signed numbers and algebraic expressions, polynomials and simple factoring, solution of equations and inequalities, and graphing. Essential Questions
1. What are the subsystems of the real number system? 2. What are the field properties of the real number system? 3. What is the order of operations for simplifying an algebraic or numerical expression? 4. How do you use the laws of integral exponents to evaluate algebraic expressions? 5. Why use scientific notation and exponents? 6. How are equations and graphs related? 7. What strategies can you use to graph linear equations, linear inequalities, and absolute value equations? 8. How do you solve equations or inequalities algebraically? 9. How do you add, subtract and multiply polynomials?
Course #: 314 Credit: 1 credit Resources: www.connected.mcgraw‐hill.com

GRADE 9‐12 MATHEMATICS CURRICULUM ALGEBRAI–S
Waterford Public Schools 410
QuarterOne I. Expressions,Equations,andFunctions
Unwrapped Unit Resources (Chapter.Section) Assessment Common Core State Standards
(http://www.corestandards.org/the‐standards/mathematics)
Lesson 1: Variables and Expressions 1.1
CC.9‐12.A.SSE.1a Interpret parts of an expression, such as terms, factors, and coefficients
CC.9‐12.A.SSE.2 Use the structure of an expression to identify ways to rewrite it.
Lesson 2: Order of Operations 1.2 CFA 1.1 to 1.2
CC.9‐12. A.SSE.1b Interpret complicated expressions by viewing one or more of their parts as a single entity.
CC.9‐12.A.SSE.2 Use the structure of an expression to identify ways to rewrite it.
Lesson 3: Properties of Numbers 1.3
.SSE.1b Interpret complicated expressions by viewing one or more of their parts as a single entity.
CC.9‐12.A.SSE.2 Use the structure of an expression to identify ways to rewrite it.
Lesson 4: Distributive Property 1.4 CFA 1.3 to 1.4
CC.9‐12.A.SSE.1a Interpret parts of an expression, such as terms, factors, and coefficients
CC.9‐12.A.SSE.2 Use the structure of an expression to identify ways to rewrite it.
Lesson 5: Equations 1.5
CC.9‐12. A.CED.1 Create equations and inequalities in one variable and use them to solve problems
CC.9‐12.A.REI.1 Explain each step in solving a simple equation as following from the equality of numbers asserted at the previous step, starting from the assumption that the original equation has a solution. Construct a viable argument to justify a solution method.
CC.9‐12.A.REI.3 Solve linear equations and inequalities in one variable, including equations with coefficients represented by letters.
Lesson 6: Relations 1.6
CC.9‐12.A.REI.10 Understand that the graph of an equation in two variables is the set of all its solutions plotted in the coordinate plane, often forming a curve (which could be a line).
CC.9‐12.A.F.IF.1 Understand that a function from one set (called the domain) to another set (called the range) assigns to each element of the domain exactly one element of the range.

GRADE 9‐12 MATHEMATICS CURRICULUM ALGEBRAI–S
Waterford Public Schools 411
Unwrapped Unit Resources (Chapter.Section) Assessment Common Core State Standards
(http://www.corestandards.org/the‐standards/mathematics)
Lesson 7: Functions Function values f(2) or f(a) only Not f(x‐3)
1.7 Study Notebook
CFA 1.5 to 1.7
CC.9‐12. A.REI.10 Understand that the graph of an equation in two variables is the set of all its solutions plotted in the coordinate plane, often forming a curve (which could be a line).
CC.9‐12.F.IF.1 Understand that a function from one set (called the domain) to another set (called the range) assigns to each element of the domain exactly one element of the range.
CC.9‐12.F.IF.2 Use function notation, evaluate functions for inputs in their domains, and interpret statements that use function notation in terms of a context.
CC.9‐12.F.IF.5 Relate the domain of a function to its graph and, where applicable, to the quantitative relationship it describes.
CC.9‐12.F.IF.9 Compare properties of two functions each represented in a different way (algebraically, graphically, numerically in tables, or by verbal descriptions).
CC.9‐12.F.BF.1a Determine an explicit expression, a recursive process, or steps for calculation from a context.
Unit
Assessment 1.1 – 1.7
II. LinearEquations
Unwrapped Unit Resources (Chapter.Section) Assessment Common Core State Standards
(http://www.corestandards.org/the‐standards/mathematics)
Lesson 1: Writing Equations 2.1 CC.9‐12.A.CED.1 Create equations and inequalities in one variable and use them to solve problems.

GRADE 9‐12 MATHEMATICS CURRICULUM ALGEBRAI–S
Waterford Public Schools 412
Unwrapped Unit Resources (Chapter.Section) Assessment Common Core State Standards
(http://www.corestandards.org/the‐standards/mathematics)
Lesson 2: Solving One Step Equations Multiple days
2.2 Study Guide & Intervention 2.2 Practice 2.2
CFA 2.1 to 2.2
CC.9‐12.A.CED.1 Create equations and inequalities in one variable and use them to solve problems.
CC.9‐12.A.REI.1 Explain each step in solving a simple equation as following from the equality of numbers asserted at the previous step, starting from the assumption that the original equation has a solution. Construct a viable argument to justify a solution method.
CC.9‐12.A.REI.3 Solve linear equations and inequalities in one variable, including equations with coefficients represented by letters.
Lesson 3: Solving Multi Step Equations 2.3
Study Guide & Intervention 2.3
CFA 2.3
CC.9‐12.A.CED.1 Create equations and inequalities in one variable and use them to solve problems.
CC.9‐12.A.REI.1 Explain each step in solving a simple equation as following from the equality of numbers asserted at the previous step, starting from the assumption that the original equation has a solution. Construct a viable argument to justify a solution method.
CC.9‐12.A.REI.3 Solve linear equations and inequalities in one variable, including equations with coefficients represented by letters.
Lesson 4: Solving Equations with Variable on Each Side Multiple days: Variable on both side Day 1 Distributive Prop. Day 2
2.4 Study Guide & Intervention 2.4
CFA 2.4
CC.9‐12.A.CED.1 Create equations and inequalities in one variable and use them to solve problems.
CC.9‐12.A.REI.1 Explain each step in solving a simple equation as following from the equality of numbers asserted at the previous step, starting from the assumption that the original equation has a solution. Construct a viable argument to justify a solution method.
CC.9‐12.A.REI.3 Solve linear equations and inequalities in one variable, including equations with coefficients represented by letters.
Lesson 5: Ratio and Proportions 2.6
CC.9‐12.N.Q.1 Use units as a way to understand problems and to guide the solution of multi‐step problems; choose and interpret units consistently in formulas; choose and interpret the scale and the origin in graphs and data displays.
CC.9‐12.A.REI.1 Explain each step in solving a simple equation as following from the equality of numbers asserted at the previous step, starting from the assumption that the original equation has a solution. Construct a viable argument to justify a solution method.
CC.9‐12.A.REI.3 Solve linear equations and inequalities in one variable, including equations with coefficients represented by letters

GRADE 9‐12 MATHEMATICS CURRICULUM ALGEBRAI–S
Waterford Public Schools 413
Unwrapped Unit Resources (Chapter.Section) Assessment Common Core State Standards
(http://www.corestandards.org/the‐standards/mathematics)
Lesson 6: Literal Equations and Dimensional Analysis
2.8 Study Guide & Intervention
CFA 2.6 & 2.8
CC.9‐12. N.Q.1 Use units as a way to understand problems and to guide the solution of multi‐step problems; choose and interpret units consistently in formulas; choose and interpret the scale and the origin in graphs and data displays.
CC.9‐12.A.CED.4 Rearrange formulas to highlight a quantity of interest, using the same reasoning as in solving equations
CC.9‐12.A.REI.3 Solve linear equations and inequalities in one variable, including equations with coefficients represented by letters.
Unit Assessment 2.1 – 2.4, 2.6,
2.8

GRADE 9‐12 MATHEMATICS CURRICULUM ALGEBRAI–S
Waterford Public Schools 414
QuarterTwo
III. LinearFunctions
Unwrapped Unit Resources (Chapter.Section) Assessment Common Core State Standards
(http://www.corestandards.org/the‐standards/mathematics)
Lesson 1: Graphing Linear Equations using x and y‐intercepts 3.1
CC.9‐12.A.CED.2 Create equations in two or more variables to represent relationships between quantities; graph equations on coordinate axes with labels and scales.
CC.9‐12.A.REI.10 Understand that the graph of an equation in two variables is the set of all its solutions plotted in the coordinate plane, often forming a curve (which could be a line).
CC.9‐12.F.IF.4 For a function that models a relationship between two quantities, interpret key features of graphs and tables in terms of the quantities, and sketch graphs showing key features given a verbal description of the relationship.
CC.9‐12.F.IF.7a Graph linear and quadratic functions and show intercepts, maxima, and minima.
CC.9‐12.F.BF.1a Determine an explicit expression, a recursive process, or steps for calculation from a context.
Lesson 2: Graphing Linear Equations using a Table of Values 3.1 CFA 3.1
CC.9‐12.A.CED.2 Create equations in two or more variables to represent relationships between quantities; graph equations on coordinate axes with labels and scales.
CC.9‐12.A.REI.10 Understand that the graph of an equation in two variables is the set of all its solutions plotted in the coordinate plane, often forming a curve (which could be a line).
CC.9‐12.F.IF.4 For a function that models a relationship between two quantities, interpret key features of graphs and tables in terms of the quantities, and sketch graphs showing key features given a verbal description of the relationship.
CC.9‐12.F.IF.7a Graph linear and quadratic functions and show intercepts, maxima, and minima.
CC.9‐12.F.BF.1a Determine an explicit expression, a recursive process, or steps for calculation from a context.

GRADE 9‐12 MATHEMATICS CURRICULUM ALGEBRAI–S
Waterford Public Schools 415
Unwrapped Unit Resources (Chapter.Section) Assessment Common Core State Standards
(http://www.corestandards.org/the‐standards/mathematics)
Lesson 3:Rate of Change & Slope, graphically 3.3
CC.9‐12.F.IF.6 Calculate and interpret the average rate of change of a function (presented symbolically or as a table) over a specified interval. Estimate the rate of change from a graph.
CC.9‐12.F.LE.1a Prove that linear functions grow by equal differences over equal intervals, and that exponential functions grow by equal factors over equal intervals.
Lesson 3:Rate of Change & Slope, using two points 3.3 CFA 3.3
CC.9‐12.F.IF.6 Calculate and interpret the average rate of change of a function (presented symbolically or as a table) over a specified interval. Estimate the rate of change from a graph.
CC.9‐12.F.LE.1a Prove that linear functions grow by equal differences over equal intervals, and that exponential functions grow by equal factors over equal intervals.
Lesson 4:Arithmetic Sequences as Functions Formula for the nth term is given
3.5 CFA 3.5
CC.9‐12.A.CED.2 Create equations in two or more variables to represent relationships between quantities; graph equations on coordinate axes with labels and scales. Recognize that sequences are functions, sometimes defined recursively, whose domain is a subset of the integers
CC.9‐12.F.IF.3 Recognize that sequences are functions, sometimes defined recursively, whose domain is a subset of the integers.
CC.9‐12.F.BF.2 Write arithmetic and geometric sequences both recursively and with an explicit formula, use them to model situations, and translate between the two forms.
CC.9‐12.F.LE.1a Prove that linear functions grow by equal differences over equal intervals, and that exponential functions grow by equal factors over equal intervals.
CC.9‐12.F.LE.1b Recognize situations in which one quantity changes at a constant rate per unit interval relative to another.
CC.9‐12.F.LE.2 Construct linear and exponential functions, including arithmetic and geometric sequences, given a graph, a description of a relationship, or two input‐output pairs (include reading these from a table).
Unit
Assessment 3.1, 3.3, & 3.5

GRADE 9‐12 MATHEMATICS CURRICULUM ALGEBRAI–S
Waterford Public Schools 416
IV. LinearFunctionsandRelations
Unwrapped Unit Resources (Chapter.Section) Assessment Common Core State Standards
(http://www.corestandards.org/the‐standards/mathematics)
Lesson 1: Graphing Equations in Slope‐Intercept Form
4.1 Study Guide & Intervention
CC.9‐12.A.CED.2 Create equations in two or more variables to represent relationships between quantities; graph equations on coordinate axes with labels and scales.
CC.9‐12.A.CED.4 Rearrange formulas to highlight a quantity of interest, using the same reasoning as in solving equations.
CC.9‐12.F.IF.7a Graph linear and quadratic functions and show intercepts, maxima, and minima.
CC.9‐12.F.BF.1a Determine an explicit expression, a recursive process, or steps for calculation from a context.
CC.9‐12.A.LE.5 Interpret the parameters in a linear or exponential function in terms of a context.
CC.9‐12.S.ID.7 Interpret the slope (rate of change) and the intercept (constant term) of a linear model in the context of the data.
Lesson 2:Writing Equations in Slope‐Intercept Form Multiple days
4.2 Study Guide & Intervention
CFA 4.1 to 4.2
CC.9‐12.A.CED.2 Create equations in two or more variables to represent relationships between quantities; graph equations on coordinate axes with labels and scales.
CC.9‐12.A.CED.3 Rearrange formulas to highlight a quantity of interest, using the same reasoning as in solving equations.
CC.9‐12.F.BF.1 Write a function that describes a relationship between two quantities.
CC.9‐12.A.LE.2 Construct linear and exponential functions, including arithmetic and geometric sequences, given a graph, a description of a relationship, or two input‐output pairs (include reading these from a table).

GRADE 9‐12 MATHEMATICS CURRICULUM ALGEBRAI–S
Waterford Public Schools 417
Unwrapped Unit Resources (Chapter.Section) Assessment Common Core State Standards
(http://www.corestandards.org/the‐standards/mathematics)
Lesson 3:Parallel and Perpendicular Lines Multiple days
4.4 Study Guide & Intervention
CFA 4.4
CC.9‐12.A.CED.2 Create equations in two or more variables to represent relationships between quantities; graph equations on coordinate axes with labels and scales.
CC.9‐12.F.BF.1a Determine an explicit expression, a recursive process, or steps for calculation from a context.
CC.9‐12.F.LE.2 Construct linear and exponential functions, including arithmetic and geometric sequences, given a graph, a description of a relationship, or two input‐output pairs (include reading these from a table).
CC.9‐12.S.ID.7 Interpret the slope (rate of change) and the intercept (constant term) of a linear model in the context of the data.
Lesson 4: Scatter Plots and Lines of Best Fit
4.5 Study Guide & Intervention
CC.9‐12.N.Q.1 Use units as a way to understand problems and to guide the solution of multi‐step problems; choose and interpret units consistently in formulas; choose and interpret the scale and the origin in graphs and data displays.
CC.9‐12.A.CED.2 Create equations in two or more variables to represent relationships between quantities; graph equations on coordinate axes with labels and scales.
CC.9‐12.F.BF.1a Determine an explicit expression, a recursive process, or steps for calculation from a context.
CC.9‐12.F.LE.2 Construct linear and exponential functions, including arithmetic and geometric sequences, given a graph, a description of a relationship, or two input‐output pairs (include reading these from a table).
CC.9‐12.F.LE.5 Interpret the parameters in a linear or exponential function in terms of a context.
CC.9‐12.S.ID.6a Fit a function to the data; use functions fitted to data to solve problems in the context of the data. Use given functions or choose a function suggested by the context. Emphasize linear, quadratic, and exponential models.
CC.9‐12.S.ID.6c Fit a linear function for a scatter plot that suggests a linear association.
CC.9‐12.S.ID.7 Interpret the slope (rate of change) and the intercept (constant term) of a linear model in the context of the data.

GRADE 9‐12 MATHEMATICS CURRICULUM ALGEBRAI–S
Waterford Public Schools 418
Unwrapped Unit Resources (Chapter.Section) Assessment Common Core State Standards
(http://www.corestandards.org/the‐standards/mathematics)
Lesson 5: Regression and Median‐Fit Lines Reinforcement of Best Fit Lines(do check for understanding)
4.6 CFA 4.5 to 4.6
CC.9‐12.A.CED.2 Create equations in two or more variables to represent relationships between quantities; graph equations on coordinate axes with labels and scales.
CC.9‐12.F.BF.1a Determine an explicit expression, a recursive process, or steps for calculation from a context.
CC.9‐12.F.LE.2 Construct linear and exponential functions, including arithmetic and geometric sequences, given a graph, a description of a relationship, or two input‐output pairs (include reading these from a table).
CC.9‐12.S.ID.6 Represent data on two quantitative variables on a scatter plot, and describe how the variables are related.
CC.9‐12.S.ID.8 Compute (using technology) and interpret the correlation coefficient of a linear fit.
Unit Assessment 4.1 – 4.6, omit 4.3

GRADE 9‐12 MATHEMATICS CURRICULUM ALGEBRAI–S
Waterford Public Schools 419
QuarterThree
V. LinearInequalities
Unwrapped Unit Resources (Chapter.Section) Assessment Common Core State Standards
(http://www.corestandards.org/the‐standards/mathematics)
Lesson 1: Solving Linear Inequalities Addition and Subtraction 5.1 CC.9‐12.A.CED.1 Create equations and inequalities in one variable and use them
to solve problems. CC.9‐12.A.REI.3 Solve linear equations and inequalities in one variable,
including equations with coefficients represented by letters. Lesson 2: Solving Linear Inequalities Multiplication and Division 5.2 CFA 5.1 & 5.2
Lesson 3: Solving Multi‐Step Inequalities 5.3 CFA 5.3
CC.9‐12.A.CED.1 Create equations and inequalities in one variable and use them to solve problems.
CC.9‐12.A.REI.3 Solve linear equations and inequalities in one variable, including equations with coefficients represented by letters.
Unit
Assessment 5.1 – 5.3
VI. Polynomials
Unwrapped Unit Resources (Chapter.Section) Assessment Common Core State Standards
(http://www.corestandards.org/the‐standards/mathematics)
Lesson 1: Multiplying Monomials Multiple days
7.1Study Guide & Intervention
CC.9‐12.A.SSE.2 Use the structure of an expression to identify ways to rewrite it.
CC.9‐12.F.IF.8b Use the properties of exponents to interpret expressions for exponential functions.
Lesson 2:Dividing Monomials Multiple days
7.2Study Guide & Intervention
Lesson 3: Scientific Notation
7.3(no operations) Study Guide & Intervention
CFA 7.1 to 7.3
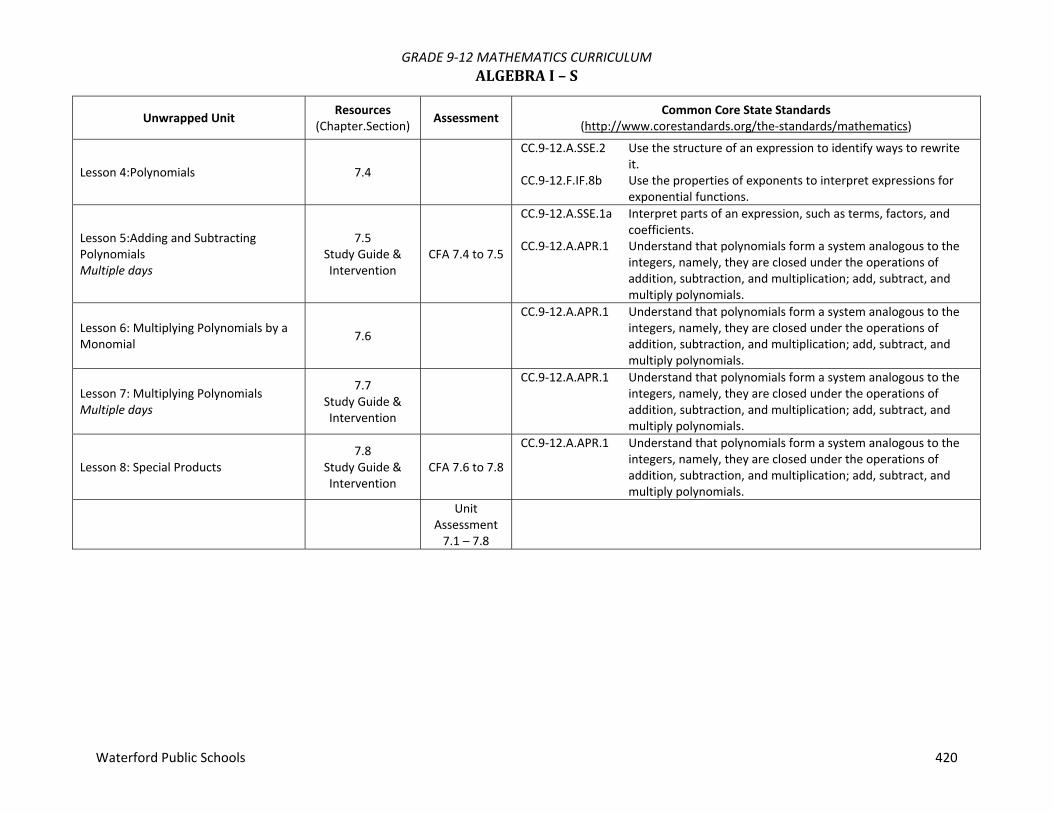
GRADE 9‐12 MATHEMATICS CURRICULUM ALGEBRAI–S
Waterford Public Schools 420
Unwrapped Unit Resources (Chapter.Section) Assessment Common Core State Standards
(http://www.corestandards.org/the‐standards/mathematics)
Lesson 4:Polynomials 7.4
CC.9‐12.A.SSE.2 Use the structure of an expression to identify ways to rewrite it.
CC.9‐12.F.IF.8b Use the properties of exponents to interpret expressions for exponential functions.
Lesson 5:Adding and Subtracting Polynomials Multiple days
7.5 Study Guide & Intervention
CFA 7.4 to 7.5
CC.9‐12.A.SSE.1a Interpret parts of an expression, such as terms, factors, and coefficients.
CC.9‐12.A.APR.1 Understand that polynomials form a system analogous to the integers, namely, they are closed under the operations of addition, subtraction, and multiplication; add, subtract, and multiply polynomials.
Lesson 6: Multiplying Polynomials by a Monomial 7.6
CC.9‐12.A.APR.1 Understand that polynomials form a system analogous to the integers, namely, they are closed under the operations of addition, subtraction, and multiplication; add, subtract, and multiply polynomials.
Lesson 7: Multiplying Polynomials Multiple days
7.7 Study Guide & Intervention
CC.9‐12.A.APR.1 Understand that polynomials form a system analogous to the integers, namely, they are closed under the operations of addition, subtraction, and multiplication; add, subtract, and multiply polynomials.
Lesson 8: Special Products 7.8
Study Guide & Intervention
CFA 7.6 to 7.8
CC.9‐12.A.APR.1 Understand that polynomials form a system analogous to the integers, namely, they are closed under the operations of addition, subtraction, and multiplication; add, subtract, and multiply polynomials.
Unit
Assessment 7.1 – 7.8

GRADE 9‐12 MATHEMATICS CURRICULUM ALGEBRAI–S
Waterford Public Schools 421
QuarterFour
VII. FactoringandQuadraticEquations
Unwrapped Unit Resources (Chapter.Section) Assessment Common Core State Standards
(http://www.corestandards.org/the‐standards/mathematics)
Lesson 1: Monomials and Factoring GCF only
8.1, 8.2 (first half)
CC.9‐12.A.SSE.2 Use the structure of an expression to identify ways to rewrite it.
CC.9‐12.A.SSE.3a Factor a quadratic expression to reveal the zeros of the function it defines.
Lesson 2: Distributive Property and Zero Product Property
8.2(second half) Study Guide & Intervention
CFA 8.1 to 8.2
CC.9‐12.A.SSE.2 Use the structure of an expression to identify ways to rewrite it.
CC.9‐12.A.SSE.3a Factor a quadratic expression to reveal the zeros of the function it defines.
Lesson 3:Factoring & Solving Quadratic Equations, a=1 Multiple days
8.3 Practice
CC.9‐12.A.SSE.2 Use the structure of an expression to identify ways to rewrite it.
CC.9‐12.A.SSE.3a Factor a quadratic expression to reveal the zeros of the function it defines.
CC.9‐12.A.CED.2 Create equations and inequalities in one variable and use them to solve problems.
CC.9‐12.A.REI.1 Explain each step in solving a simple equation as following from the equality of numbers asserted at the previous step, starting from the assumption that the original equation has a solution. Construct a viable argument to justify a solution method.
CC.9‐12.A.REI.4b Solve quadratic equations by inspection (e.g., for x2 = 49), taking square roots, completing the square, the quadratic formula and factoring, as appropriate to the initial form of the equation. Recognize when the quadratic formula gives complex solutions and write them as a ± bi for real numbers a and b.
Lesson 4: Factoring & Solving Quadratic Equations, a>1 Multiple days
8.4 Study Guide & Intervention
CFA 8.3 to 8.4
CC.9‐12.A.SSE.2 Use the structure of an expression to identify ways to rewrite it.
CC.9‐12.A.SSE.3a Factor a quadratic expression to reveal the zeros of the function it defines.
CC.9‐12.A.CED.2 Create equations and inequalities in one variable and use them to solve problems.
CC.9‐12.A.REI.1 Explain each step in solving a simple equation as following from the equality of numbers asserted at the previous step, starting

GRADE 9‐12 MATHEMATICS CURRICULUM ALGEBRAI–S
Waterford Public Schools 422
Unwrapped Unit Resources (Chapter.Section) Assessment Common Core State Standards
(http://www.corestandards.org/the‐standards/mathematics)
from the assumption that the original equation has a solution. Construct a viable argument to justify a solution method.
CC.9‐12.A.REI.4b Solve quadratic equations by inspection (e.g., for x2 = 49), taking square roots, completing the square, the quadratic formula and factoring, as appropriate to the initial form of the equation. Recognize when the quadratic formula gives complex solutions and write them as a ± bi for real numbers a and b.
Lesson 5: Difference of Two Squares & Solving Quadratic Equations Multiple days
8.5 Study Guide & Intervention
CC.9‐12.A.SSE.2 Use the structure of an expression to identify ways to rewrite it.
CC.9‐12.A.SSE.3a Factor a quadratic expression to reveal the zeros of the function it defines.
CC.9‐12.A.CED.2 Create equations and inequalities in one variable and use them to solve problems.
CC.9‐12.A.REI.4b Solve quadratic equations by inspection (e.g., for x2 = 49), taking square roots, completing the square, the quadratic formula and factoring, as appropriate to the initial form of the equation. Recognize when the quadratic formula gives complex solutions and write them as a ± bi for real numbers a and b.
Lesson 6: Perfect Square Trinomials & Solving Quadratic Equations Multiple days
8.6 Study Guide & Intervention
CC.9‐12.A.SSE.2 Use the structure of an expression to identify ways to rewrite it.
CC.9‐12.A.SSE.3a Factor a quadratic expression to reveal the zeros of the function it defines.
CC.9‐12.A.REI.1 Explain each step in solving a simple equation as following from the equality of numbers asserted at the previous step, starting from the assumption that the original equation has a solution. Construct a viable argument to justify a solution method.

GRADE 9‐12 MATHEMATICS CURRICULUM ALGEBRAI–S
Waterford Public Schools 423
Unwrapped Unit Resources (Chapter.Section) Assessment Common Core State Standards
(http://www.corestandards.org/the‐standards/mathematics)
Lesson 7: Factoring Completely & Solving Equations with Special Products
8.5, 8.6 Study Guide & Intervention
CFA 8.5 to 8.6
CC.9‐12.A.SSE.2 Use the structure of an expression to identify ways to rewrite it.
CC.9‐12.A.SSE.3a Factor a quadratic expression to reveal the zeros of the function it defines.
CC.9‐12.A.CED.2 Create equations and inequalities in one variable and use them to solve problems.
CC.9‐12.A.REI.1 Explain each step in solving a simple equation as following from the equality of numbers asserted at the previous step, starting from the assumption that the original equation has a solution. Construct a viable argument to justify a solution method.
CC.9‐12.A.REI.4b Solve quadratic equations by inspection (e.g., for x2 = 49), taking square roots, completing the square, the quadratic formula and factoring, as appropriate to the initial form of the equation. Recognize when the quadratic formula gives complex solutions and write them as a ± bi for real numbers a and b.
Unit
Assessment 8.1 – 8.6
VIII. ProbabilityandStatistics
Unwrapped Unit Resources (Chapter.Section) Assessment Common Core State Standards
(http://www.corestandards.org/the‐standards/mathematics)
Lesson 1: Measures of Central Tendency 12.2 CC.9‐12.S.ID.2 Use statistics appropriate to the shape of the data distribution
to compare center (median, mean) and spread (interquartile range, standard deviation) of two or more different data sets.
Lesson 2: Permutations and Combinations 12.4
Lesson 3: Probability of Compound Events 12.5 CFA 12.2,
12.4, 12.5
Unit Assessment 12.2, 12.4 &
12.5

GRADE 9‐12 MATHEMATICS CURRICULUM ALGEBRAI–A
Waterford Public Schools 424
Algebra furnishes the language and is the principal tool of mathematics. An understanding of formulas, equations, problems, functional relations, graphs, and simplified algebraic techniques is the immediate objective. Essential Questions
1. What are the subsystems of the real number system? 2. What are the field properties of the real number system? 3. What is the order of operations for simplifying an algebraic or numerical expression? 4. How do you use the laws of integral exponents to evaluate algebraic expressions? 5. Why use scientific notation and exponents? 6. How are equations and graphs related? 7. What strategies can you use to graph linear equations, linear inequalities, and absolute value equations? 8. How do you solve equations or inequalities algebraically? 9. How can you use equations, inequalities, and linear systems to solve real life problems? 10. How do you add, subtract and multiply polynomials? 11. What techniques can you use to factor and solve polynomial equations? 12. How do you solve a quadratic equation? 13. How are quadratic functions and their graphs related? 14. When will you ever use quadratic equations in real life?
Course #: 324 Credit: 1 credit Resources: www.connected.mcgraw‐hill.com

GRADE 9‐12 MATHEMATICS CURRICULUM ALGEBRAI–A
Waterford Public Schools 425
QuarterOneI. Expressions,Equations,andFunctions
Unwrapped Unit Resources (Chapter.Section) Assessment Common Core State Standards
(http://www.corestandards.org/the‐standards/mathematics)
Lesson 1: Variables and Expressions 1.1
CC.9‐12.A.SSE.1a Interpret parts of an expression, such as terms, factors, and coefficients.
CC.9‐12.A.SSE.2 Use the structure of an expression to identify ways to rewrite it.
Lesson 2: Order of Operations 1.2
CC.9‐12.A.SSE.1b Interpret complicated expressions by viewing one or more of their parts as a single entity.
CC.9‐12.A.SSE.2 Use the structure of an expression to identify ways to rewrite it.
Lesson 3: Properties of Numbers 1.3
CC.9‐12.A.SSE.1b Interpret complicated expressions by viewing one or more of their parts as a single entity.
CC.9‐12.A.SSE.2 Use the structure of an expression to identify ways to rewrite it.
Lesson 4: Distributive Property 1.4 CFA 1.1 to 1.4
CC.9‐12.A.SSE.1a Interpret parts of an expression, such as terms, factors, and coefficients.
CC.9‐12.A.SSE.2 Use the structure of an expression to identify ways to rewrite it.
Lesson 5: Equations 1.5
CC.9‐12.A.CED.1 Create equations and inequalities in one variable and use them to solve problems.
CC.9‐12.A.REI.1 Explain each step in solving a simple equation as following from the equality of numbers asserted at the previous step, starting from the assumption that the original equation has a solution. Construct a viable argument to justify a solution method.
CC.9‐12.A.REI.3 Solve linear equations and inequalities in one variable, including equations with coefficients represented by letters.

GRADE 9‐12 MATHEMATICS CURRICULUM ALGEBRAI–A
Waterford Public Schools 426
Unwrapped Unit Resources (Chapter.Section) Assessment Common Core State Standards
(http://www.corestandards.org/the‐standards/mathematics)
Lesson 6: Relations 1.6
CC.9‐12.A.REI.10 Understand that the graph of an equation in two variables is the set of all its solutions plotted in the coordinate plane, often forming a curve (which could be a line).
CC.9‐12.F.IF.1 Understand that a function from one set (called the domain) to another set (called the range) assigns to each element of the domain exactly one element of the range. If f is a function and x is an element of its domain, then f(x) denotes the output of f corresponding to the input x. The graph of f is the graph of the equation y = f(x).
Lesson 7: Functions 1.7 CFA 1.5 to 1.7
CC.9‐12.A.REI.10 Understand that the graph of an equation in two variables is the set of all its solutions plotted in the coordinate plane, often forming a curve (which could be a line).
CC.9‐12.F.IF.1 Understand that a function from one set (called the domain) to another set (called the range) assigns to each element of the domain exactly one element of the range. If f is a function and x is an element of its domain, then f(x) denotes the output of f corresponding to the input x. The graph of f is the graph of the equation y = f(x).
CC.9‐12.F.IF.2 Use function notation, evaluate functions for inputs in their domains, and interpret statements that use function notation in terms of a context.
CC.9‐12.F.IF.5 Relate the domain of a function to its graph and, where applicable, to the quantitative relationship it describes.
CC.9‐12.F.IF.9 Compare properties of two functions each represented in a different way (algebraically, graphically, numerically in tables, or by verbal descriptions).
CC.9‐12.F.BF.1a Write a function that describes a relationship between two quantities.
Unit
Assessment 1.1 – 1.7

GRADE 9‐12 MATHEMATICS CURRICULUM ALGEBRAI–A
Waterford Public Schools 427
II. LinearEquations
Unwrapped Unit Resources (Chapter.Section) Assessment Common Core State Standards
(http://www.corestandards.org/the‐standards/mathematics)
Lesson 1: Writing Equations 2.1 CC.9‐12.A.CED.1 Create equations and inequalities in one variable and use them to solve problems.
Lesson 2:Solving One Step Equations 2.2
CC.9‐12.A.CED.1 Create equations and inequalities in one variable and use them to solve problems.
CC.9‐12.A.REI.1 Explain each step in solving a simple equation as following from the equality of numbers asserted at the previous step, starting from the assumption that the original equation has a solution. Construct a viable argument to justify a solution method.
CC.9‐12.A.REI.3 Solve linear equations and inequalities in one variable, including equations with coefficients represented by letters.
Lesson 3:Solving Multi Step Equations 2.3
CC.9‐12. A.CED.1 Create equations and inequalities in one variable and use them to solve problems.
CC.9‐12.A.REI.1 Explain each step in solving a simple equation as following from the equality of numbers asserted at the previous step, starting from the assumption that the original equation has a solution. Construct a viable argument to justify a solution method.
CC.9‐12.A.REI.3 Solve linear equations and inequalities in one variable, including equations with coefficients represented by letters.
Lesson 4:Solving Equations with Variable on Each Side 2.4 CFA 2.1 to 2.4
CC.9‐12. A.CED.1 Create equations and inequalities in one variable and use them to solve problems.
CC.9‐12.A.REI.1 Explain each step in solving a simple equation as following from the equality of numbers asserted at the previous step, starting from the assumption that the original equation has a solution. Construct a viable argument to justify a solution method.
CC.9‐12.A.REI.3 Solve linear equations and inequalities in one variable, including equations with coefficients represented by letters.

GRADE 9‐12 MATHEMATICS CURRICULUM ALGEBRAI–A
Waterford Public Schools 428
Unwrapped Unit Resources (Chapter.Section) Assessment Common Core State Standards
(http://www.corestandards.org/the‐standards/mathematics)
Lesson 5: Solving Equation involving Absolute Value 2.5
CC.9‐12. A.CED.1 Create equations and inequalities in one variable and use them to solve problems.
CC.9‐12.A.REI.1 Explain each step in solving a simple equation as following from the equality of numbers asserted at the previous step, starting from the assumption that the original equation has a solution. Construct a viable argument to justify a solution method.
CC.9‐12.A.REI.3 Solve linear equations and inequalities in one variable, including equations with coefficients represented by letters.
Lesson 6: Ratio and Proportions 2.6
CC.9‐12. N.Q.1 Use units as a way to understand problems and to guide the solution of multi‐step problems; choose and interpret units consistently in formulas; choose and interpret the scale and the origin in graphs and data displays.
CC.9‐12.A.REI.1 Explain each step in solving a simple equation as following from the equality of numbers asserted at the previous step, starting from the assumption that the original equation has a solution. Construct a viable argument to justify a solution method.
CC.9‐12.A.REI.3 Solve linear equations and inequalities in one variable, including equations with coefficients represented by letters.
Lesson 7:Literal Equations and Dimensional Analysis 2.8 CFA 2.5, 2.6 &
2.8
CC.9‐12. N.Q.1 Use units as a way to understand problems and to guide the solution of multi‐step problems; choose and interpret units consistently in formulas; choose and interpret the scale and the origin in graphs and data displays.
CC.9‐12.A.CED.4 Rearrange formulas to highlight a quantity of interest, using the same reasoning as in solving equations.
CC.9‐12.A.REI.3 Solve linear equations and inequalities in one variable, including equations with coefficients represented by letters.
Unit Assessment 2.1 – 2.8, omit 2.7

GRADE 9‐12 MATHEMATICS CURRICULUM ALGEBRAI–A
Waterford Public Schools 429
III. LinearFunctions
Unwrapped Unit Resources (Chapter.Section) Assessment Common Core State Standards
(http://www.corestandards.org/the‐standards/mathematics)
Lesson 1: Graphing Linear Equations, include family of graphs, estimating solutions, and zeros of the function
3.1, 3.2
CC.9‐12.A.CED.1 Create equations and inequalities in one variable and use them to solve problems.
CC.9‐12.A.CED.2 Create equations in two or more variables to represent relationships between quantities; graph equations on coordinate axes with labels and scales.
CC.9‐12.A.REI.10 Understand that the graph of an equation in two variables is the set of all its solutions plotted in the coordinate plane, often forming a curve (which could be a line).
CC.9‐12.F.IF.4 For a function that models a relationship between two quantities, interpret key features of graphs and tables in terms of the quantities, and sketch graphs showing key features given a verbal description of the relationship.
CC.9‐12.F.IF.7a Graph linear and quadratic functions and show intercepts, maxima, and minima.
CC.9‐12.F.BF.1a Determine an explicit expression, a recursive process, or steps for calculation from a context.
Lesson 2:Rate of Change & Slope 3.3 CFA 3.1 to 3.3
CC.9‐12.F.IF.6 Calculate and interpret the average rate of change of a function (presented symbolically or as a table) over a specified interval. Estimate the rate of change from a graph.
CC.9‐12.F.LE.1a Prove that linear functions grow by equal differences over equal intervals, and that exponential functions grow by equal factors over equal intervals.

GRADE 9‐12 MATHEMATICS CURRICULUM ALGEBRAI–A
Waterford Public Schools 430
Unwrapped Unit Resources (Chapter.Section) Assessment Common Core State Standards
(http://www.corestandards.org/the‐standards/mathematics)
Lesson 3: Direct Variation 3.4
CC.9‐12.A.CED.2 Create equations in two or more variables to represent relationships between quantities; graph equations on coordinate axes with labels and scales.
CC.9‐12.A.REI.10 Understand that the graph of an equation in two variables is the set of all its solutions plotted in the coordinate plane, often forming a curve (which could be a line).
CC.9‐12.F.IF.7a Graph linear and quadratic functions and show intercepts, maxima, and minima.
CC.9‐12.F.BF.1a Prove that linear functions grow by equal differences over equal intervals, and that exponential functions grow by equal factors over equal intervals.
CC.9‐12.F.LE.5 Interpret the parameters in a linear or exponential function in terms of a context.
Lesson 4: Arithmetic Sequences as Functions 3.5
CC.9‐12.A.CED.2 Create equations in two or more variables to represent relationships between quantities; graph equations on coordinate axes with labels and scales.
CC.9‐12.F.IF.3 Recognize that sequences are functions, sometimes defined recursively, whose domain is a subset of the integers.
CC.9‐12.F.BF.2 Write arithmetic and geometric sequences both recursively and with an explicit formula, use them to model situations, and translate between the two forms.
CC.9‐12.F.LE.1a Prove that linear functions grow by equal differences over equal intervals, and that exponential functions grow by equal factors over equal intervals.
CC.9‐12.F.LE.1b Recognize situations in which one quantity changes at a constant rate per unit interval relative to another.
CC.9‐12.F.LE.2 Construct linear and exponential functions, including arithmetic and geometric sequences, given a graph, a description of a relationship, or two input‐output pairs (include reading these from a table).

GRADE 9‐12 MATHEMATICS CURRICULUM ALGEBRAI–A
Waterford Public Schools 431
Unwrapped Unit Resources (Chapter.Section) Assessment Common Core State Standards
(http://www.corestandards.org/the‐standards/mathematics)
Lesson 5: Proportional and Non‐Proportional Relationships 3.6 CFA 3.4 to 3.6
CC.9‐12.A.CED.2 Create equations in two or more variables to represent relationships between quantities; graph equations on coordinate axes with labels and scales.
CC.9‐12.F.IF.2 Write arithmetic and geometric sequences both recursively and with an explicit formula, use them to model situations, and translate between the two forms.
CC.9‐12.F.IF.9 Compare properties of two functions each represented in a different way (algebraically, graphically, numerically in tables, or by verbal descriptions).
CC.9‐12.F.BF.1a Prove that linear functions grow by equal differences over equal intervals, and that exponential functions grow by equal factors over equal intervals.
CC.9‐12.F.LE.1b Recognize situations in which one quantity changes at a constant rate per unit interval relative to another.
CC.9‐12.F.LE.2 Construct linear and exponential functions, including arithmetic and geometric sequences, given a graph, a description of a relationship, or two input‐output pairs (include reading these from a table).
Unit
Assessment 3.1 – 3.6

GRADE 9‐12 MATHEMATICS CURRICULUM ALGEBRAI–A
Waterford Public Schools 432
QuarterTwo
IV. LinearFunctionsandRelationships
Unwrapped Unit Resources (Chapter.Section) Assessment Common Core State Standards
(http://www.corestandards.org/the‐standards/mathematics)
Lesson 1: Graphing Equations in Slope‐Intercept Form 4.1
CC.9‐12.A.CED.2 Create equations in two or more variables to represent relationships between quantities; graph equations on coordinate axes with labels and scales.
CC.9‐12.A.CED.4 Rearrange formulas to highlight a quantity of interest, using the same reasoning as in solving equations.
CC.9‐12.F.IF.7a Graph linear and quadratic functions and show intercepts, maxima, and minima.
CC.9‐12.F.BF.1a Determine an explicit expression, a recursive process, or steps for calculation from a context.
CC.9‐12.A.LE.5 Interpret the parameters in a linear or exponential function in terms of a context.
CC.9‐12.S.ID.7 Interpret the slope (rate of change) and the intercept (constant term) of a linear model in the context of the data.
Lesson 2: Writing Equations in Slope‐Intercept Form 4.2
CC.9‐12.A.CED.2 Create equations in two or more variables to represent relationships between quantities; graph equations on coordinate axes with labels and scales.
CC.9‐12.A.CED.3 Represent constraints by equations or inequalities, and by systems of equations and/or inequalities, and interpret solutions as viable or nonviable options in a modeling context.
CC.9‐12.F.BF.1 Write a function that describes a relationship between two quantities.
CC.9‐12.F.LE.2 Construct linear and exponential functions, including arithmetic and geometric sequences, given a graph, a description of a relationship, or two input‐output pairs (include reading these from a table).

GRADE 9‐12 MATHEMATICS CURRICULUM ALGEBRAI–A
Waterford Public Schools 433
Unwrapped Unit Resources (Chapter.Section) Assessment Common Core State Standards
(http://www.corestandards.org/the‐standards/mathematics)
Lesson 3: Writing Equations in Point‐Slope Form 4.3
CC.9‐12.A.CED.2 Create equations in two or more variables to represent relationships between quantities; graph equations on coordinate axes with labels and scales.
CC.9‐12.F.IF.2 Use function notation, evaluate functions for inputs in their domains, and interpret statements that use function notation in terms of a context.
CC.9‐12.F.IF.9 Compare properties of two functions each represented in a different way (algebraically, graphically, numerically in tables, or by verbal descriptions).
CC.9‐12.F.BF.1a Determine an explicit expression, a recursive process, or steps for calculation from a context.
CC.9‐12.F.LE.2 Construct linear and exponential functions, including arithmetic and geometric sequences, given a graph, a description of a relationship, or two input‐output pairs (include reading these from a table).
Lesson 4: Parallel and Perpendicular Lines 4.4 CFA 4.1 to 4.4
CC.9‐12.A.CED.2 Create equations in two or more variables to represent relationships between quantities; graph equations on coordinate axes with labels and scales.
CC.9‐12.F.BF.1a Determine an explicit expression, a recursive process, or steps for calculation from a context.
CC.9‐12.F.LE.2 Construct linear and exponential functions, including arithmetic and geometric sequences, given a graph, a description of a relationship, or two input‐output pairs (include reading these from a table).
CC.9‐12.S.ID.7 Interpret the slope (rate of change) and the intercept (constant term) of a linear model in the context of the data.
Lesson 5: Scatter Plots and Lines of Best Fit 4.5, 4.5 Lab
CC.9‐12.N.Q.1 Use units as a way to understand problems and to guide the solution of multi‐step problems; choose and interpret units consistently in formulas; choose and interpret the scale and the origin in graphs and data displays.
CC.9‐12.A.CED.2 Create equations in two or more variables to represent relationships between quantities; graph equations on coordinate axes with labels and scales.
CC.9‐12.F.BF.1a Determine an explicit expression, a recursive process, or steps for calculation from a context.

GRADE 9‐12 MATHEMATICS CURRICULUM ALGEBRAI–A
Waterford Public Schools 434
Unwrapped Unit Resources (Chapter.Section) Assessment Common Core State Standards
(http://www.corestandards.org/the‐standards/mathematics)
CC.9‐12.F.LE.2 Construct linear and exponential functions, including arithmetic and geometric sequences, given a graph, a description of a relationship, or two input‐output pairs (include reading these from a table).
CC.9‐12.F.LE.5 Interpret the parameters in a linear or exponential function in terms of a context.
CC.9‐12.S.ID.6a Fit a function to the data; use functions fitted to data to solve problems in the context of the data. Use given functions or choose a function suggested by the context. Emphasize linear, quadratic, and exponential models.
CC.9‐12.S.ID.6c Fit a linear function for a scatter plot that suggests a linear association.
CC.9‐12.S.ID.7 Interpret the slope (rate of change) and the intercept (constant term) of a linear model in the context of the data.
Lesson 6: Regression and Median‐Fit Lines
4.6 include graphing
calculator CFA 4.5 to 4.6
CC.9‐12.A.CED.2 Create equations in two or more variables to represent relationships between quantities; graph equations on coordinate axes with labels and scales.
CC.9‐12.F.BF.1a Determine an explicit expression, a recursive process, or steps for calculation from a context.
CC.9‐12.F.LE.2 Construct linear and exponential functions, including arithmetic and geometric sequences, given a graph, a description of a relationship, or two input‐output pairs (include reading these from a table).
CC.9‐12.S.ID.6 Represent data on two quantitative variables on a scatter plot, and describe how the variables are related.
CC.9‐12.S.ID.8 Compute (using technology) and interpret the correlation coefficient of a linear fit.
Unit
Assessment 4.1 – 4.6
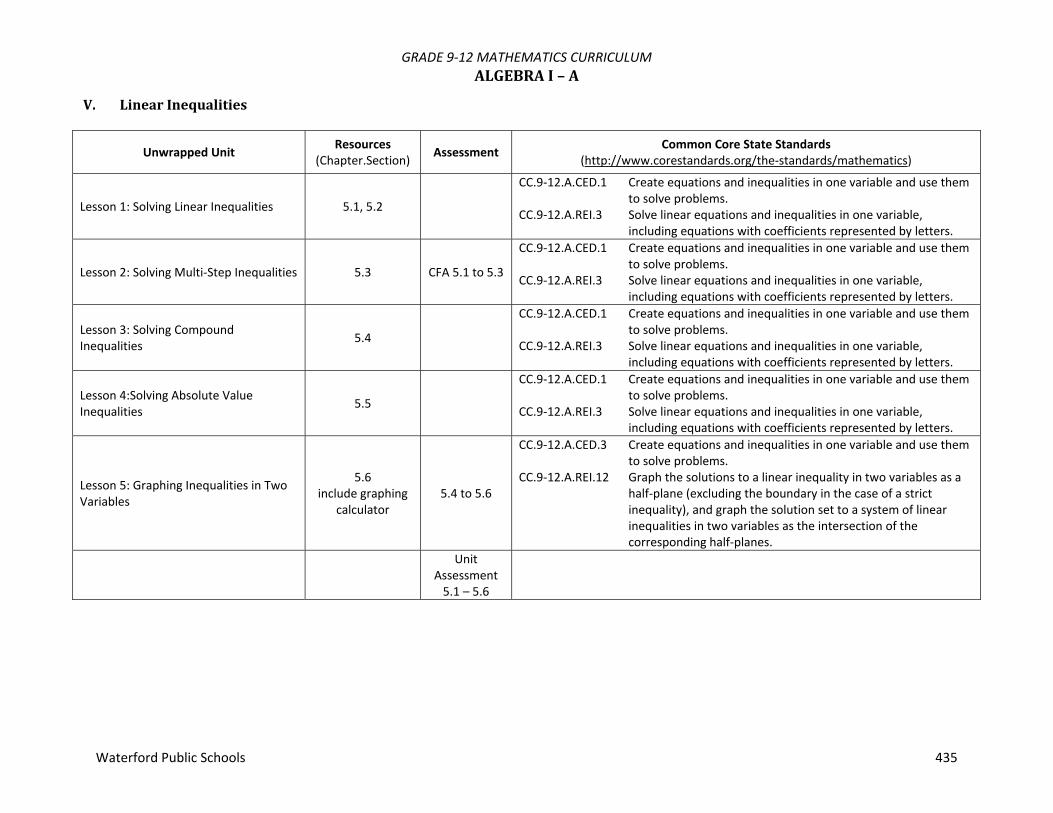
GRADE 9‐12 MATHEMATICS CURRICULUM ALGEBRAI–A
Waterford Public Schools 435
V. LinearInequalities
Unwrapped Unit Resources (Chapter.Section) Assessment Common Core State Standards
(http://www.corestandards.org/the‐standards/mathematics)
Lesson 1: Solving Linear Inequalities 5.1, 5.2
CC.9‐12.A.CED.1 Create equations and inequalities in one variable and use them to solve problems.
CC.9‐12.A.REI.3 Solve linear equations and inequalities in one variable, including equations with coefficients represented by letters.
Lesson 2: Solving Multi‐Step Inequalities 5.3 CFA 5.1 to 5.3
CC.9‐12.A.CED.1 Create equations and inequalities in one variable and use them to solve problems.
CC.9‐12.A.REI.3 Solve linear equations and inequalities in one variable, including equations with coefficients represented by letters.
Lesson 3: Solving Compound Inequalities 5.4
CC.9‐12.A.CED.1 Create equations and inequalities in one variable and use them to solve problems.
CC.9‐12.A.REI.3 Solve linear equations and inequalities in one variable, including equations with coefficients represented by letters.
Lesson 4:Solving Absolute Value Inequalities 5.5
CC.9‐12.A.CED.1 Create equations and inequalities in one variable and use them to solve problems.
CC.9‐12.A.REI.3 Solve linear equations and inequalities in one variable, including equations with coefficients represented by letters.
Lesson 5: Graphing Inequalities in Two Variables
5.6 include graphing
calculator 5.4 to 5.6
CC.9‐12.A.CED.3 Create equations and inequalities in one variable and use them to solve problems.
CC.9‐12.A.REI.12 Graph the solutions to a linear inequality in two variables as a half‐plane (excluding the boundary in the case of a strict inequality), and graph the solution set to a system of linear inequalities in two variables as the intersection of the corresponding half‐planes.
Unit
Assessment 5.1 – 5.6

GRADE 9‐12 MATHEMATICS CURRICULUM ALGEBRAI–A
Waterford Public Schools 436
VI. SystemsofLinearEquationsandInequalities
Unwrapped Unit Resources (Chapter.Section) Assessment Common Core State Standards
(http://www.corestandards.org/the‐standards/mathematics)
Lesson 1: Graphing Systems of Equations 6.1
CC.9‐12.A.CED.2 Create equations in two or more variables to represent relationships between quantities; graph equations on coordinate axes with labels and scales.
CC.9‐12.A.CED.3 Represent constraints by equations or inequalities, and by systems of equations and/or inequalities, and interpret solutions as viable or nonviable options in a modeling context.
CC.9‐12.A.REI.6 Solve systems of linear equations exactly and approximately (e.g., with graphs), focusing on pairs of linear equations in two variables.
Lesson 2:Substitution 6.2
CC.9‐12.A.CED.2 Create equations in two or more variables to represent relationships between quantities; graph equations on coordinate axes with labels and scales.
CC.9‐12.A.CED.3 Represent constraints by equations or inequalities, and by systems of equations and/or inequalities, and interpret solutions as viable or nonviable options in a modeling context.
CC.9‐12.A.REI.6 Solve systems of linear equations exactly and approximately (e.g., with graphs), focusing on pairs of linear equations in two variables.
Lesson 3: Elimination 6.3, 6.4 CFA 6.1 to 6.4
CC.9‐12.A.CED.2 Create equations in two or more variables to represent relationships between quantities; graph equations on coordinate axes with labels and scales.
CC.9‐12.A.REI.5 Prove that, given a system of two equations in two variables, replacing one equation by the sum of that equation and a multiple of the other produces a system with the same solutions.
CC.9‐12.A.REI.6 Solve systems of linear equations exactly and approximately (e.g., with graphs), focusing on pairs of linear equations in two variables.

GRADE 9‐12 MATHEMATICS CURRICULUM ALGEBRAI–A
Waterford Public Schools 437
Unwrapped Unit Resources (Chapter.Section) Assessment Common Core State Standards
(http://www.corestandards.org/the‐standards/mathematics)
Lesson 4:Applying Systems of Linear Equations 6.5
CC.9‐12.A.CED.2 Create equations in two or more variables to represent relationships between quantities; graph equations on coordinate axes with labels and scales.
CC.9‐12.A.REI.6 Solve systems of linear equations exactly and approximately (e.g., with graphs), focusing on pairs of linear equations in two variables.
Lesson 5: Systems of Inequalities 6.6, 6.1&6.6Lab CFA 6.5 to 6.6
CC.9‐12.A.REI.12 Graph the solutions to a linear inequality in two variables as a half‐plane (excluding the boundary in the case of a strict inequality), and graph the solution set to a system of linear inequalities in two variables as the intersection of the corresponding half‐planes.
Unit
Assessment 6.1 – 6.6

GRADE 9‐12 MATHEMATICS CURRICULUM ALGEBRAI–A
Waterford Public Schools 438
QuarterThree
VII. Polynomials
Unwrapped Unit Resources (Chapter.Section) Assessment Common Core State Standards
(http://www.corestandards.org/the‐standards/mathematics)
Lesson 1: Multiplying Monomials 7.1
CC.9‐12.A.SSE.2 Use the structure of an expression to identify ways to rewrite it.
CC.9‐12.F.IF.8b Use the properties of exponents to interpret expressions for exponential functions.
Lesson 2: Dividing Monomials& Scientific Notation/Standard Form
7.2, 7.3(no operations) CC.9‐12.A.SSE.2 Use the structure of an expression to identify ways to rewrite
it. CC.9‐12.F.IF.8b Use the properties of exponents to interpret expressions for
exponential functions. Lesson 3: Polynomials 7.4 CFA 7.1 to 7.4
Lesson 4: Adding and Subtracting Polynomials 7.5
CC.9‐12.A.SSE.1a Interpret parts of an expression, such as terms, factors, and coefficients.
CC.9‐12.A.APR.1 Understand that polynomials form a system analogous to the integers, namely, they are closed under the operations of addition, subtraction, and multiplication; add, subtract, and multiply polynomials.
Lesson 5: Multiplying Polynomials by a Monomial 7.6
CC.9‐12.A.APR.1 Understand that polynomials form a system analogous to the integers, namely, they are closed under the operations of addition, subtraction, and multiplication; add, subtract, and multiply polynomials.
Lesson 6: Multiplying Polynomials 7.7
CC.9‐12.A.APR.1 Understand that polynomials form a system analogous to the integers, namely, they are closed under the operations of addition, subtraction, and multiplication; add, subtract, and multiply polynomials.
Lesson 7: Special Products 7.8 CFA 7.5 to 7.8
CC.9‐12.A.APR.1 Understand that polynomials form a system analogous to the integers, namely, they are closed under the operations of addition, subtraction, and multiplication; add, subtract, and multiply polynomials.
Unit
Assessment 7.1 – 7.8
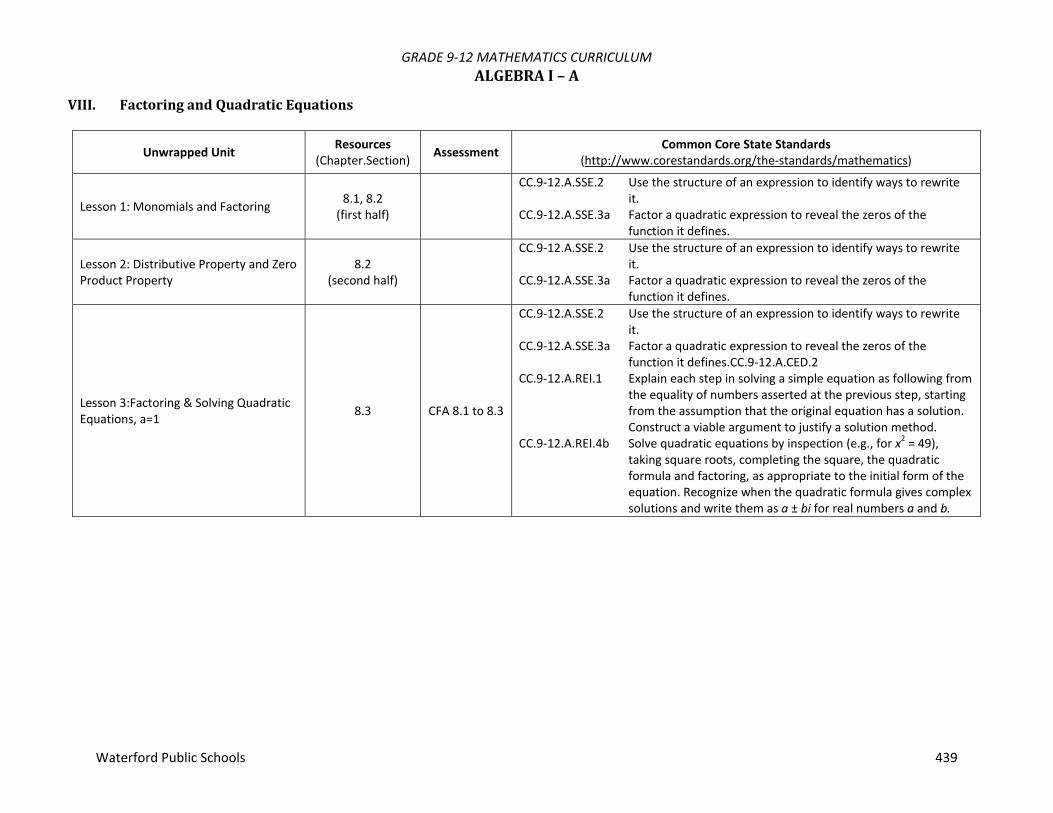
GRADE 9‐12 MATHEMATICS CURRICULUM ALGEBRAI–A
Waterford Public Schools 439
VIII. FactoringandQuadraticEquations
Unwrapped Unit Resources (Chapter.Section) Assessment Common Core State Standards
(http://www.corestandards.org/the‐standards/mathematics)
Lesson 1: Monomials and Factoring 8.1, 8.2 (first half)
CC.9‐12.A.SSE.2 Use the structure of an expression to identify ways to rewrite it.
CC.9‐12.A.SSE.3a Factor a quadratic expression to reveal the zeros of the function it defines.
Lesson 2: Distributive Property and Zero Product Property
8.2 (second half)
CC.9‐12.A.SSE.2 Use the structure of an expression to identify ways to rewrite it.
CC.9‐12.A.SSE.3a Factor a quadratic expression to reveal the zeros of the function it defines.
Lesson 3:Factoring & Solving Quadratic Equations, a=1 8.3 CFA 8.1 to 8.3
CC.9‐12.A.SSE.2 Use the structure of an expression to identify ways to rewrite it.
CC.9‐12.A.SSE.3a Factor a quadratic expression to reveal the zeros of the function it defines.CC.9‐12.A.CED.2
CC.9‐12.A.REI.1 Explain each step in solving a simple equation as following from the equality of numbers asserted at the previous step, starting from the assumption that the original equation has a solution. Construct a viable argument to justify a solution method.
CC.9‐12.A.REI.4b Solve quadratic equations by inspection (e.g., for x2 = 49), taking square roots, completing the square, the quadratic formula and factoring, as appropriate to the initial form of the equation. Recognize when the quadratic formula gives complex solutions and write them as a ± bi for real numbers a and b.

GRADE 9‐12 MATHEMATICS CURRICULUM ALGEBRAI–A
Waterford Public Schools 440
Unwrapped Unit Resources (Chapter.Section) Assessment Common Core State Standards
(http://www.corestandards.org/the‐standards/mathematics)
Lesson 4: Factoring & Solving Quadratic Equations, a>1 8.4
CC.9‐12.A.SSE.2 Use the structure of an expression to identify ways to rewrite it.
CC.9‐12.A.SSE.3a Factor a quadratic expression to reveal the zeros of the function it defines.CC.9‐12.A.CED.2
CC.9‐12.A.REI.1 Explain each step in solving a simple equation as following from the equality of numbers asserted at the previous step, starting from the assumption that the original equation has a solution. Construct a viable argument to justify a solution method.
CC.9‐12.A.REI.4b Solve quadratic equations by inspection (e.g., for x2 = 49), taking square roots, completing the square, the quadratic formula and factoring, as appropriate to the initial form of the equation. Recognize when the quadratic formula gives complex solutions and write them as a ± bi for real numbers a and b.
Lesson 5: Difference of Two Squares & Solving Quadratic Equations 8.5
CC.9‐12.A.SSE.2 Use the structure of an expression to identify ways to rewrite it.
CC.9‐12.A.SSE.3a Factor a quadratic expression to reveal the zeros of the function it defines.CC.9‐12.A.CED.2
CC.9‐12.A.REI.4b Solve quadratic equations by inspection (e.g., for x2 = 49), taking square roots, completing the square, the quadratic formula and factoring, as appropriate to the initial form of the equation. Recognize when the quadratic formula gives complex solutions and write them as a ± bi for real numbers a and b.
Lesson 6: Perfect Square Trinomials & Solving Quadratic Equations 8.6 CFA 8.4 to 8.6
CC.9‐12.A.SSE.2 Use the structure of an expression to identify ways to rewrite it.
CC.9‐12.A.SSE.3a Factor a quadratic expression to reveal the zeros of the function it defines.CC.9‐12.A.REI.1
Unit
Assessment 8.1 – 8.6
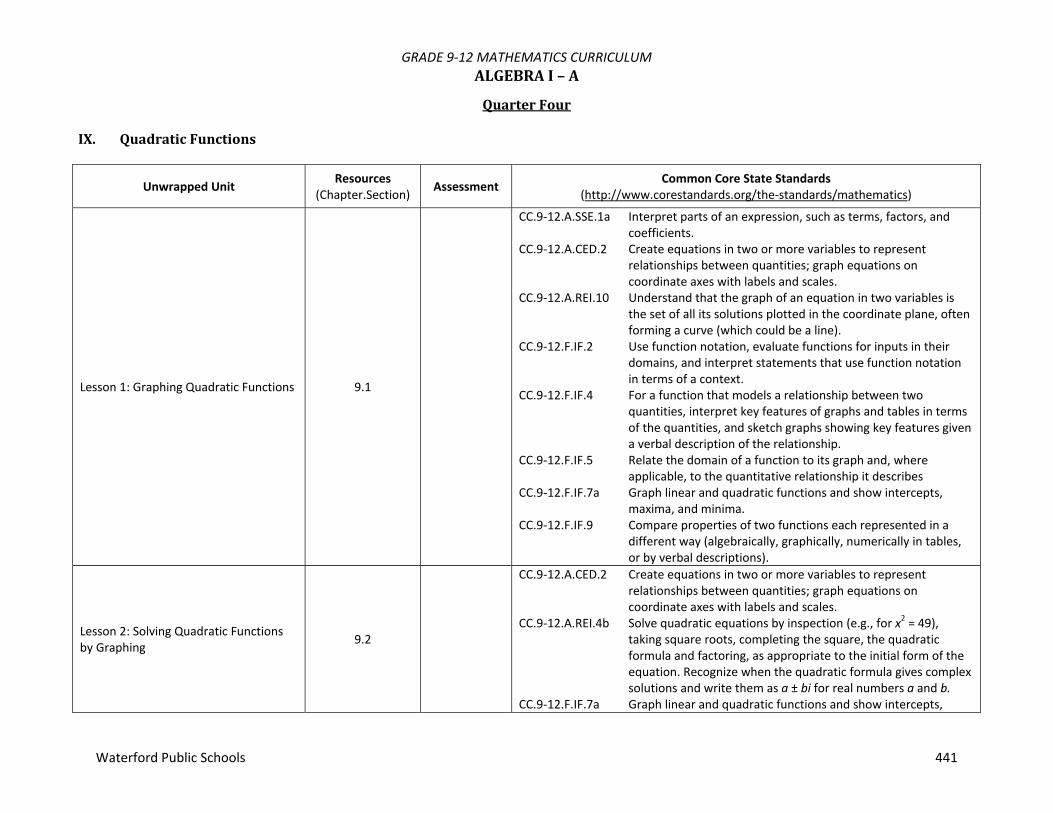
GRADE 9‐12 MATHEMATICS CURRICULUM ALGEBRAI–A
Waterford Public Schools 441
QuarterFour
IX. QuadraticFunctions
Unwrapped Unit Resources (Chapter.Section) Assessment Common Core State Standards
(http://www.corestandards.org/the‐standards/mathematics)
Lesson 1: Graphing Quadratic Functions 9.1
CC.9‐12.A.SSE.1a Interpret parts of an expression, such as terms, factors, and coefficients.
CC.9‐12.A.CED.2 Create equations in two or more variables to represent relationships between quantities; graph equations on coordinate axes with labels and scales.
CC.9‐12.A.REI.10 Understand that the graph of an equation in two variables is the set of all its solutions plotted in the coordinate plane, often forming a curve (which could be a line).
CC.9‐12.F.IF.2 Use function notation, evaluate functions for inputs in their domains, and interpret statements that use function notation in terms of a context.
CC.9‐12.F.IF.4 For a function that models a relationship between two quantities, interpret key features of graphs and tables in terms of the quantities, and sketch graphs showing key features given a verbal description of the relationship.
CC.9‐12.F.IF.5 Relate the domain of a function to its graph and, where applicable, to the quantitative relationship it describes
CC.9‐12.F.IF.7a Graph linear and quadratic functions and show intercepts, maxima, and minima.
CC.9‐12.F.IF.9 Compare properties of two functions each represented in a different way (algebraically, graphically, numerically in tables, or by verbal descriptions).
Lesson 2: Solving Quadratic Functions by Graphing 9.2
CC.9‐12.A.CED.2 Create equations in two or more variables to represent relationships between quantities; graph equations on coordinate axes with labels and scales.
CC.9‐12.A.REI.4b Solve quadratic equations by inspection (e.g., for x2 = 49), taking square roots, completing the square, the quadratic formula and factoring, as appropriate to the initial form of the equation. Recognize when the quadratic formula gives complex solutions and write them as a ± bi for real numbers a and b.
CC.9‐12.F.IF.7a Graph linear and quadratic functions and show intercepts,

GRADE 9‐12 MATHEMATICS CURRICULUM ALGEBRAI–A
Waterford Public Schools 442
Unwrapped Unit Resources (Chapter.Section) Assessment Common Core State Standards
(http://www.corestandards.org/the‐standards/mathematics)
maxima, and minima.CC.9‐12.F.IF.8a Use the process of factoring and completing the square in a
quadratic function to show zeros, extreme values, and symmetry of the graph, and interpret these in terms of a context.
Lesson 3:Transformations of Quadratic Functions 9.3 CFA 9.1 to 9.3
CC.9‐12.A.SSE.3b Complete the square in a quadratic expression to reveal the maximum or minimum value of the function it defines.
CC.9‐12.F.IF.7a Graph linear and quadratic functions and show intercepts, maxima, and minima.
CC.9‐12.F.IF.8a Use the process of factoring and completing the square in a quadratic function to show zeros, extreme values, and symmetry of the graph, and interpret these in terms of a context.
CC.9‐12.F.IF.9 Compare properties of two functions each represented in a different way (algebraically, graphically, numerically in tables, or by verbal descriptions).
CC.9‐12.F.BF.1b Combine standard function types using arithmetic operations. CC.9‐12.F.BF.3 Identify the effect on the graph of replacing f(x) by f(x) + k, k
f(x), f(kx), and f(x + k) for specific values of k (both positive and negative); find the value of k given the graphs. Experiment with cases and illustrate an explanation of the effects on the graph using technology. Include recognizing even and odd functions from their graphs and algebraic expressions for them.
Lesson 4:Solving Quadratic Equations by Completing the Square, a=1 9.4
CC.9‐12.A.SSE.3b Complete the square in a quadratic expression to reveal the maximum or minimum value of the function it defines.
CC.9‐12.A.CED.2 Create equations in two or more variables to represent relationships between quantities; graph equations on coordinate axes with labels and scales.
CC.9‐12.A.REI.4 Solve quadratic equations in one variable. CC.9‐12.F.IF.8a Use the process of factoring and completing the square in a
quadratic function to show zeros, extreme values, and symmetry of the graph, and interpret these in terms of a context.

GRADE 9‐12 MATHEMATICS CURRICULUM ALGEBRAI–A
Waterford Public Schools 443
Unwrapped Unit Resources (Chapter.Section) Assessment Common Core State Standards
(http://www.corestandards.org/the‐standards/mathematics)
Lesson 5: Solving Quadratic Equations by Using the Quadratic Formula 9.5 CFA 9.4 to 9.5
CC.9‐12.A.CED.2 Create equations in two or more variables to represent relationships between quantities; graph equations on coordinate axes with labels and scales.
CC.9‐12.A.REI.4 Solve quadratic equations in one variable.
Unit
Assessment 9.1 – 9.5
X. ProbabilityandStatistics
Unwrapped Unit Resources (Chapter.Section) Assessment Common Core State Standards
(http://www.corestandards.org/the‐standards/mathematics)
Lesson 1: Measures of Central Tendency 12.2 CC.9‐12.S.ID.2 Use statistics appropriate to the shape of the data distribution
to compare center (median, mean) and spread (interquartile range, standard deviation) of two or more different data sets.
Lesson 2: Permutations and Combinations 12.4
CC.9‐12.S.ID.2 Use statistics appropriate to the shape of the data distribution to compare center (median, mean) and spread (interquartile range, standard deviation) of two or more different data sets.
Lesson 3: Probability of Compound Events 12.5 CFA 12.2,
12.4 &, 12.5
CC.9‐12.S.ID.2 Use statistics appropriate to the shape of the data distribution to compare center (median, mean) and spread (interquartile range, standard deviation) of two or more different data sets.
Unit Assessment 12.2, 12.4 &
2.5

GRADE 9‐12 MATHEMATICS CURRICULUM PROBABILITYANDSTATISTICS–S
Waterford Public Schools 444
This Course will include such topics as discrete functions, statistical analysis, probability applications, reasoning, communication, connections and problem solving. Real world hands‐on applications are used to investigate and apply the concepts in the course. Calculators are used to organize, analyze and present results. Essential Questions
1. How are samples selected? 2. What are the measures of central tendency, how are they calculated, and what do they mean? 3. What are the measures of variation, how are they calculated, and what do they mean? 4. What are the measures of position, how are they calculated, and what do they mean? 5. What is a permutation and what is a combination and how are they used? 6. If A and B are two events, how do you calculate the probability of A OR B? 7. If A and B are two events, how do you calculate the probability of A AND B?
Course #: 335 Prerequisite: Successful completion of Algebra I – S or Algebra I – A Credit: ½ credit Resources: Probability & Statistics, Bluman, 8th Edition

GRADE 9‐12 MATHEMATICS CURRICULUM PROBABILITYANDSTATISTICS–S
Waterford Public Schools 445
QuarterOneI. TheNatureofProbabilityandStatistics
Unwrapped Unit Resources (Chapter.Section) Assessment Common Core State Standards
(http://www.corestandards.org/the‐standards/mathematics)
Lesson 1: Descriptive and Inferential Statistics 1.1
CC.9‐12.S.IC.1 Understand statistics as a process for making inferences about population parameters based on a random sample from that population.
CC.9‐12.S.IC.3 Recognize the purposes of and differences among sample surveys, experiments, and observational studies; explain how randomization relates to each.
CC.9‐12.S.IC.4 Use data from a sample survey to estimate a population mean or proportion; develop a margin of error through the use of simulation models for random sampling.
Lesson 2: Variables and Types of Data 1.2
CC.9‐12.S.IC.1 Understand statistics as a process for making inferences about population parameters based on a random sample from that population.
CC.9‐12.S.IC.3 Recognize the purposes of and differences among sample surveys, experiments, and observational studies; explain how randomization relates to each.
CC.9‐12.S.IC.4 Use data from a sample survey to estimate a population mean or proportion; develop a margin of error through the use of simulation models for random sampling.
Lesson 3: Data Collection and Sampling Techniques 1.3
CC.9‐12.S.IC.1 Understand statistics as a process for making inferences about population parameters based on a random sample from that population.
CC.9‐12.S.IC.3 Recognize the purposes of and differences among sample surveys, experiments, and observational studies; explain how randomization relates to each.
CC.9‐12.S.IC.4 Use data from a sample survey to estimate a population mean or proportion; develop a margin of error through the use of simulation models for random sampling.

GRADE 9‐12 MATHEMATICS CURRICULUM PROBABILITYANDSTATISTICS–S
Waterford Public Schools 446
Unwrapped Unit Resources (Chapter.Section) Assessment Common Core State Standards
(http://www.corestandards.org/the‐standards/mathematics)
Lesson 4: Uses and Misuses of Statistics 1.5
CC.9‐12.S.IC.1 Understand statistics as a process for making inferences about population parameters based on a random sample from that population.
CC.9‐12.S.IC.3 Recognize the purposes of and differences among sample surveys, experiments, and observational studies; explain how randomization relates to each.
CC.9‐12.S.IC.4 Use data from a sample survey to estimate a population mean or proportion; develop a margin of error through the use of simulation models for random sampling.
Unit Assessment CFA Lesson 1 ‐ 4
II. FrequencyDistributionsandGraphs
Unwrapped Unit Resources (Chapter.Section) Assessment Common Core State Standards
(http://www.corestandards.org/the‐standards/mathematics)
Lesson 1: Organizing Data Using Categorical, Ungrouped, and Grouped Frequency Distributions
2.1
CC.9‐12.S.ID.1 Represent data with plots on the real number line (dot plots, histograms, and box plots).
CC.9‐12.S.ID.4 Use the mean and standard deviation of a data set to fit it to a normal distribution and to estimate population percentages. Recognize that there are data sets for which such a procedure is not appropriate. Use calculators, spreadsheets, and tables to estimate areas under the normal curve.
CC.9‐12.S.ID.5 Summarize categorical data for two categories in two‐way frequency tables. Interpret relative frequencies in the context of the data (including joint, marginal, and conditional relative frequencies). Recognize possible associations and trends in the data.
CC.9‐12.S.ID.6 Represent data on two quantitative variables on a scatter plot, and describe how the variables are related.

GRADE 9‐12 MATHEMATICS CURRICULUM PROBABILITYANDSTATISTICS–S
Waterford Public Schools 447
Unwrapped Unit Resources (Chapter.Section) Assessment Common Core State Standards
(http://www.corestandards.org/the‐standards/mathematics)
Lesson 2: Histograms, Frequency Polygons, and Ogives 2.2
CC.9‐12.S.ID.1 Represent data with plots on the real number line (dot plots, histograms, and box plots).
CC.9‐12.S.ID.4 Use the mean and standard deviation of a data set to fit it to a normal distribution and to estimate population percentages. Recognize that there are data sets for which such a procedure is not appropriate. Use calculators, spreadsheets, and tables to estimate areas under the normal curve.
CC.9‐12.S.ID.5 Summarize categorical data for two categories in two‐way frequency tables. Interpret relative frequencies in the context of the data (including joint, marginal, and conditional relative frequencies). Recognize possible associations and trends in the data.
CC.9‐12.S.ID.6 Represent data on two quantitative variables on a scatter plot, and describe how the variables are related.
Lesson 3: Pareto Charts, Time Series Graphs, and Pie Graphs 2.3
CC.9‐12.S.ID.1 Represent data with plots on the real number line (dot plots, histograms, and box plots).
CC.9‐12.S.ID.4 Use the mean and standard deviation of a data set to fit it to a normal distribution and to estimate population percentages. Recognize that there are data sets for which such a procedure is not appropriate. Use calculators, spreadsheets, and tables to estimate areas under the normal curve.
CC.9‐12.S.ID.5 Summarize categorical data for two categories in two‐way frequency tables. Interpret relative frequencies in the context of the data (including joint, marginal, and conditional relative frequencies). Recognize possible associations and trends in the data.
CC.9‐12.S.ID.6 Represent data on two quantitative variables on a scatter plot, and describe how the variables are related.
Unit Assessment CFA Lesson 1 ‐ 3

GRADE 9‐12 MATHEMATICS CURRICULUM PROBABILITYANDSTATISTICS–S
Waterford Public Schools 448
III. DataDescription
Unwrapped Unit Resources (Chapter.Section) Assessment Common Core State Standards
(http://www.corestandards.org/the‐standards/mathematics)
Lesson 1: Measures of Central Tendency 3.1
CC.9‐12.S.ID.2 Use statistics appropriate to the shape of the data distribution to compare center (median, mean) and spread (interquartile range, standard deviation) of two or more different data sets.
CC.9‐12.S.ID.3 Interpret differences in shape, center, and spread in the context of the data sets, accounting for possible effects of extreme data points (outliers).
Lesson 2: Measures of Variation 3.2
CC.9‐12.S.ID.2 Use statistics appropriate to the shape of the data distribution to compare center (median, mean) and spread (interquartile range, standard deviation) of two or more different data sets.
CC.9‐12.S.ID.3 Interpret differences in shape, center, and spread in the context of the data sets, accounting for possible effects of extreme data points (outliers).
Lesson 3: Measures of Position 3.3
CC.9‐12.S.ID.2 Use statistics appropriate to the shape of the data distribution to compare center (median, mean) and spread (interquartile range, standard deviation) of two or more different data sets.
CC.9‐12.S.ID.3 Interpret differences in shape, center, and spread in the context of the data sets, accounting for possible effects of extreme data points (outliers).
Lesson 4: Exploratory Data Analysis 3.4
CC.9‐12.S.ID.2 Use statistics appropriate to the shape of the data distribution to compare center (median, mean) and spread (interquartile range, standard deviation) of two or more different data sets.
CC.9‐12.S.ID.3 Interpret differences in shape, center, and spread in the context of the data sets, accounting for possible effects of extreme data points (outliers).
Unit Assessment CFA Lesson 1 ‐ 4

GRADE 9‐12 MATHEMATICS CURRICULUM PROBABILITYANDSTATISTICS–S
Waterford Public Schools 449
QuarterTwo
IV. ProbabilityandCountingRules
Unwrapped Unit Resources (Chapter.Section) Assessment Common Core State Standards
(http://www.corestandards.org/the‐standards/mathematics)
Lesson 1: Sample Spaces and Probability 4.1
CC.9‐12.S.IC.2 Decide if a specified model is consistent with results from a given data‐generating process, e.g., using simulation.
CC.9‐12.S.CP.1 Describe events as subsets of a sample space (the set of outcomes) using characteristics (or categories) of the outcomes, or as unions, intersections, or complements of other events (“or,” “and,” “not”).
Lesson 2: Addition Rules for Probability 4.2 CC.9‐12.S.CP.7 Apply the Addition Rule, P(A or B) = P(A) + P(B) – P(A and B), and interpret the answer in terms of the model.
Lesson 3: Multiplication Rules and Conditional Probability 4.3
CC.9‐12.S.CP.2 Understand that two events A and B are independent if the probability of A and B occurring together is the product of their probabilities, and use this characterization to determine if they are independent.
CC.9‐12.S.CP.3 Understand the conditional probability of A given B as P(A and B)/P(B), and interpret independence of A and B as saying that the conditional probability of A given B is the same as the probability of A, and the conditional probability of B given A is the same as the probability of B.
CC.9‐12.S.CP.5 Recognize and explain the concepts of conditional probability and independence in everyday language and everyday situations.
CC.9‐12.S.CP.8 Apply the general Multiplication Rule in a uniform probability model, P(A and B) = P(A)P(B|A) = P(B)P(A|B), and interpret the answer in terms of the model.
Lesson 4: Counting Rules 4.4 CC.9‐12.S.CP.9 Use permutations and combinations to compute probabilities of compound events and solve problems.
Unit Assessment CFA Lesson 1 ‐ 4
V. DiscreteProbabilityDistributions

GRADE 9‐12 MATHEMATICS CURRICULUM PROBABILITYANDSTATISTICS–S
Waterford Public Schools 450
Unwrapped Unit Resources (Chapter.Section) Assessment Common Core State Standards
(http://www.corestandards.org/the‐standards/mathematics)
Lesson 1: Probability Distributions 5.1
CC.9‐12.S.MD.1 Define a random variable for a quantity of interest by assigning a numerical value to each event in a sample space; graph the corresponding probability distribution using the same graphical displays as for data distributions.
Lesson 2: Mean, Variance, and Expectation 5.2
CC.9‐12.S.MD.2 Calculate the expected value of a random variable; interpret it as the mean of the probability distribution.
CC.9‐12.S.MD.5 Weigh the possible outcomes of a decision by assigning probabilities to payoff values and finding expected values.
CC.9‐12.S.MD.6 Use probabilities to make fair decisions (e.g., drawing by lots, using a random number generator).
CC.9‐12.S.MD.7 Analyze decisions and strategies using probability concepts (e.g., product testing, medical testing, pulling a hockey goalie at the end of a game).
Lesson 3: Binomial Distribution 5.3
Unit Assessment CFA Lesson 1‐3
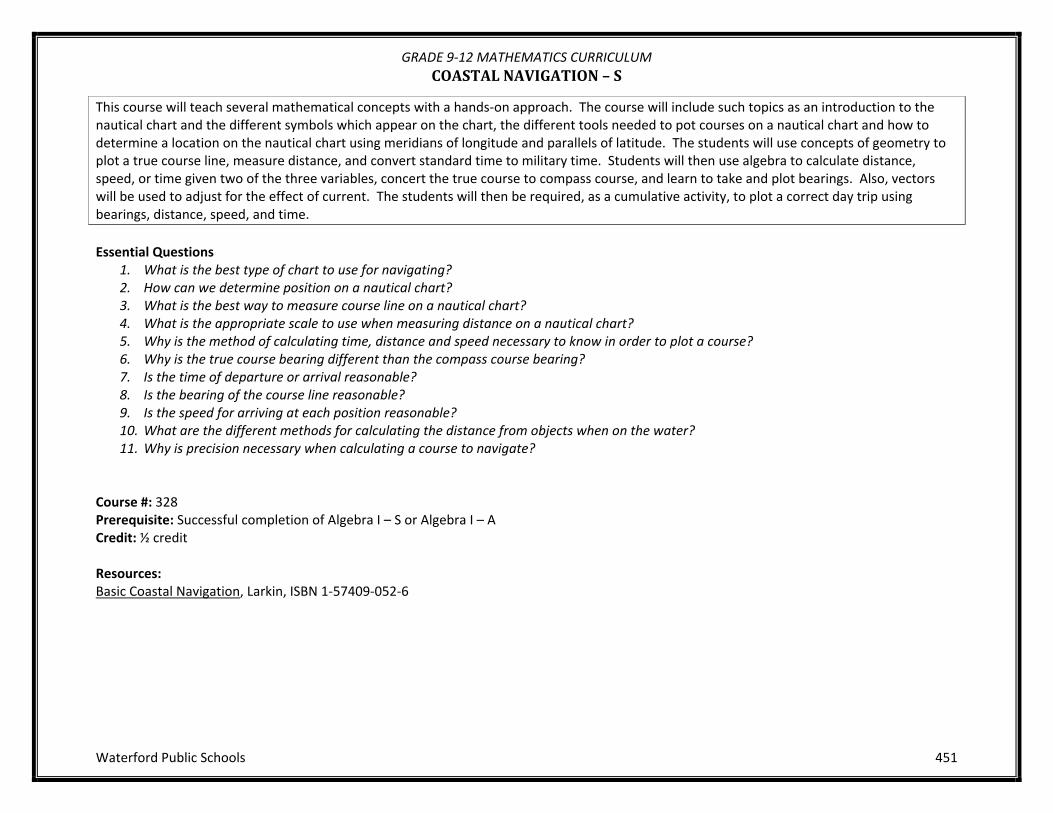
GRADE 9‐12 MATHEMATICS CURRICULUM COASTALNAVIGATION–S
Waterford Public Schools 451
This course will teach several mathematical concepts with a hands‐on approach. The course will include such topics as an introduction to the nautical chart and the different symbols which appear on the chart, the different tools needed to pot courses on a nautical chart and how to determine a location on the nautical chart using meridians of longitude and parallels of latitude. The students will use concepts of geometry to plot a true course line, measure distance, and convert standard time to military time. Students will then use algebra to calculate distance, speed, or time given two of the three variables, concert the true course to compass course, and learn to take and plot bearings. Also, vectors will be used to adjust for the effect of current. The students will then be required, as a cumulative activity, to plot a correct day trip using bearings, distance, speed, and time. Essential Questions
1. What is the best type of chart to use for navigating? 2. How can we determine position on a nautical chart? 3. What is the best way to measure course line on a nautical chart? 4. What is the appropriate scale to use when measuring distance on a nautical chart? 5. Why is the method of calculating time, distance and speed necessary to know in order to plot a course? 6. Why is the true course bearing different than the compass course bearing? 7. Is the time of departure or arrival reasonable? 8. Is the bearing of the course line reasonable? 9. Is the speed for arriving at each position reasonable? 10. What are the different methods for calculating the distance from objects when on the water? 11. Why is precision necessary when calculating a course to navigate?
Course #: 328 Prerequisite: Successful completion of Algebra I – S or Algebra I – A Credit: ½ credit Resources: Basic Coastal Navigation, Larkin, ISBN 1‐57409‐052‐6

GRADE 9‐12 MATHEMATICS CURRICULUM COASTALNAVIGATION–S
Waterford Public Schools 452
QuarterOneI. FoundationsofNavigation
Unwrapped Unit Resources (Chapter.Section) Assessment Common Core State Standards
(http://www.corestandards.org/the‐standards/mathematics)
Lesson 1: Nautical Charts Ch. 1 Visible Distance to Horizon Worksheet
Lesson 2: Online Nautical Almanacs Ch. 2 Internet Project Worksheets
Lesson 3: Aids to Navigation Ch. 3 Nautical Chart Project
II. PlottingCourseonNauticalCharts
Unwrapped Unit Resources (Chapter.Section) Assessment Common Core State Standards
(http://www.corestandards.org/the‐standards/mathematics)
Lesson 1: Measuring Latitude and Longitude Ch. 5 Lat/Long Worksheet
Lesson 2: True Course Conversion Ch. 6 13214: Fishing at Dumplings
Lesson 3: How to Measure Distance on a Nautical Chart Ch. 7 1210Tr: Distance &
Course Trip
CC.9‐12.G.CO.1 Know precise definitions of angle, circle, perpendicular line, parallel line, and line segment, based on the undefined notions of point, line, distance along a line, and distance around a circular arc.
CC.9‐12.G.CO.12 Make formal geometric constructions with a variety of tools and methods (compass and straightedge, string, reflective devices, paper folding, dynamic geometric software, etc.).
CC.9‐12.G.GPE.6 Find the point on a directed line segment between two given points that partitions the segment in a given ratio.
Lesson 4: Ded Reckoning Ch. 8 Ch. 9 13218: DR Trip 1
CC.9‐12.A.CED.1 Create equations and inequalities in one variable and use them to solve problems.
CC.9‐12.A.REI.1 Explain each step in solving a simple equation as following from the equality of numbers asserted at the

GRADE 9‐12 MATHEMATICS CURRICULUM COASTALNAVIGATION–S
Waterford Public Schools 453
Unwrapped Unit Resources (Chapter.Section) Assessment Common Core State Standards
(http://www.corestandards.org/the‐standards/mathematics)
previous step, starting from the assumption that the original equation has a solution. Construct a viable argument to justify a solution method.
CC.9‐12.A.REI.3 Solve linear equations and inequalities in one variable, including equations with coefficients represented by letters.
QuarterTwo
III. FindingtheBoat’sPositiononaChart
Unwrapped Unit Resources (Chapter.Section) Assessment Common Core State Standards
(http://www.corestandards.org/the‐standards/mathematics)
Lesson 1: Lines of Position, Estimated Position, Two Bearing Fix, Three Bearing Fix
Ch. 11 13218: Cruising RI Sound
CC.9‐12.G.CO.1 Know precise definitions of angle, circle, perpendicular line, parallel line, and line segment, based on the undefined notions of point, line, distance along a line, and distance around a circular arc.
CC.9‐12.G.CO.12 Make formal geometric constructions with a variety of tools and methods (compass and straightedge, string, reflective devices, paper folding, dynamic geometric software, etc.).
CC.9‐12.G.MG.3 Apply geometric methods to solve design problems (e.g., designing an object or structure to satisfy physical constraints or minimize cost; working with typographic grid systems based on ratios).
Lesson 2: Running Fixes Ch. 11 13218: Running Fix
CC.9‐12.G.CO.1 Know precise definitions of angle, circle, perpendicular line, parallel line, and line segment, based on the undefined notions of point, line, distance along a line, and distance around a circular arc.

GRADE 9‐12 MATHEMATICS CURRICULUM COASTALNAVIGATION–S
Waterford Public Schools 454
Unwrapped Unit Resources (Chapter.Section) Assessment Common Core State Standards
(http://www.corestandards.org/the‐standards/mathematics)
Lesson 3: Compensating For Current Ch. 16 13218: Current
CC.9‐12.N.VM.1 Recognize vector quantities as having both magnitude and direction. Represent vector quantities by directed line segments, and use appropriate symbols for vectors and their magnitudes (e.g., v, |v|, ||v||, v).
CC.9‐12.N.VM.4 Add and subtract vectors.

GRADE 9‐12 MATHEMATICS CURRICULUM PLANEGEOMETRY–S
Waterford Public Schools 455
This is a one‐year course designed for students who have successfully completed an Algebra I course. The basic concepts covered are the same as those in the Plane Geometry – A course. The presentation is more informal. Brief theoretical work precedes an emphasis on application. Recommendation: May be taken concurrently with Algebra I – A during the sophomore year with a grade of A‐ or better in Algebra I – S and department head approval. Essential Questions 1. What are the four basic constructions? 2. How are definitions, postulates, and theorems used in proving theorems? 3. How do classifications, congruence relationships, similar relationships and the Pythagorean Theorem apply to triangles? 4. What are the parts of a circle and what are the formulas for circumference and area? 5. What are the different types of polygons and how do you find their areas and perimeters? 6. How are sine, cosine and tangent defined and used to solve problems? 7. How would slope, midpoint, and parallel and perpendicular apply to a graph? 8. What are the volume formulas for prisms, cylinders, pyramids, cones and spheres and how can they be applied?
Course #: 340 Prerequisite: Successful completion of Algebra I – S or Algebra I – A Credit: 1 credit Resources: http://hosted23.renlearn.com/13187

GRADE 9‐12 MATHEMATICS CURRICULUM PLANEGEOMETRY–S
Waterford Public Schools 456
QuarterOneI. FoundationsofGeometry–PartI
Unwrapped Unit Resources (Chapter.Section) Assessment Common Core State Standards
(http://www.corestandards.org/the‐standards/mathematics)
Lesson 1: Collinear and coplanar points Objective 1
CC.9‐12.G.CO.1 Know precise definitions of angle, circle, perpendicular line, parallel line, and line segment, based on the undefined notions of point, line, distance along a line, and distance around a circular arc.
Lesson 2: Basic Terms & Notations Objective 2
CC.9‐12.G.CO.1 Know precise definitions of angle, circle, perpendicular line, parallel line, and line segment, based on the undefined notions of point, line, distance along a line, and distance around a circular arc.
Lesson 3: Points, Lines, Planes, & Space Objective 3 CFA: Lesson 1 to Lesson 3
CC.9‐12.G.CO.1 Know precise definitions of angle, circle, perpendicular line, parallel line, and line segment, based on the undefined notions of point, line, distance along a line, and distance around a circular arc.
Lesson 4: Find distances and midpoints on number lines Objective 4
CC.9‐12.G.GPE.6 Find the point on a directed line segment between two given points that partitions the segment in a given ratio.
CC.9‐12.G.GPE.7 Use coordinates to compute perimeters of polygons and areas of triangles and rectangles, e.g., using the distance formula
Lesson 5: Use Midpoints to find measure of segment Objective 5 CC.9‐12.G.GPE.6 Find the point on a directed line segment between two given
points that partitions the segment in a given ratio. Lesson 6: Word Problems‐ Midpoints and Number Lines Objective 6 CFA: Lesson 4
to Lesson 6 CC.9‐12.G.GPE.6 Find the point on a directed line segment between two given
points that partitions the segment in a given ratio.
CFA Unit 1 Assessment

GRADE 9‐12 MATHEMATICS CURRICULUM PLANEGEOMETRY–S
Waterford Public Schools 457
III. FoundationsofGeometry–PartII
Unwrapped Unit Resources (Chapter.Section) Assessment Common Core State Standards
(http://www.corestandards.org/the‐standards/mathematics)
Lesson 1: Segment Addition Postulate Objective 7 CC.9‐12.G.MG
Lesson 2: Angle definitions, notation, & properties Objective 8
CC.9‐12.G.CO.1 Know precise definitions of angle, circle, perpendicular line, parallel line, and line segment, based on the undefined notions of point, line, distance along a line, and distance around a circular arc.
CC.9‐12.G.CO.12 Make formal geometric constructions with a variety of tools and methods (compass and straightedge, string, reflective devices, paper folding, dynamic geometric software, etc.).
Lesson 3: Classify angles as acute, right, or obtuse Objective 9 CFA: Lesson 1
to Lesson 3
CC.9‐12.G.CO.1 Know precise definitions of angle, circle, perpendicular line, parallel line, and line segment, based on the undefined notions of point, line, distance along a line, and distance around a circular arc.
CC.9‐12.G.CO.12 Make formal geometric constructions with a variety of tools and methods (compass and straightedge, string, reflective devices, paper folding, dynamic geometric software, etc.).
Lesson 4: Angle addition & angle bisectors Objective 10
CC.9‐12.G.CO.1 Know precise definitions of angle, circle, perpendicular line, parallel line, and line segment, based on the undefined notions of point, line, distance along a line, and distance around a circular arc.
CC.9‐12.G.CO.12 Make formal geometric constructions with a variety of tools and methods (compass and straightedge, string, reflective devices, paper folding, dynamic geometric software, etc.).
Lesson 5: Linear Pairs & vertical angles Objective 11 CC.9‐12.G.SRT.7 Explain and use the relationship between the sine and cosine of complementary angles.
Lesson 6: Use algebra to find complements or supplements Objective 12 CFA: Lesson 4
to Lesson 6 CC.9‐12.G.SRT.7 Explain and use the relationship between the sine and cosine of
complementary angles.
CFA Unit 2 Assessment
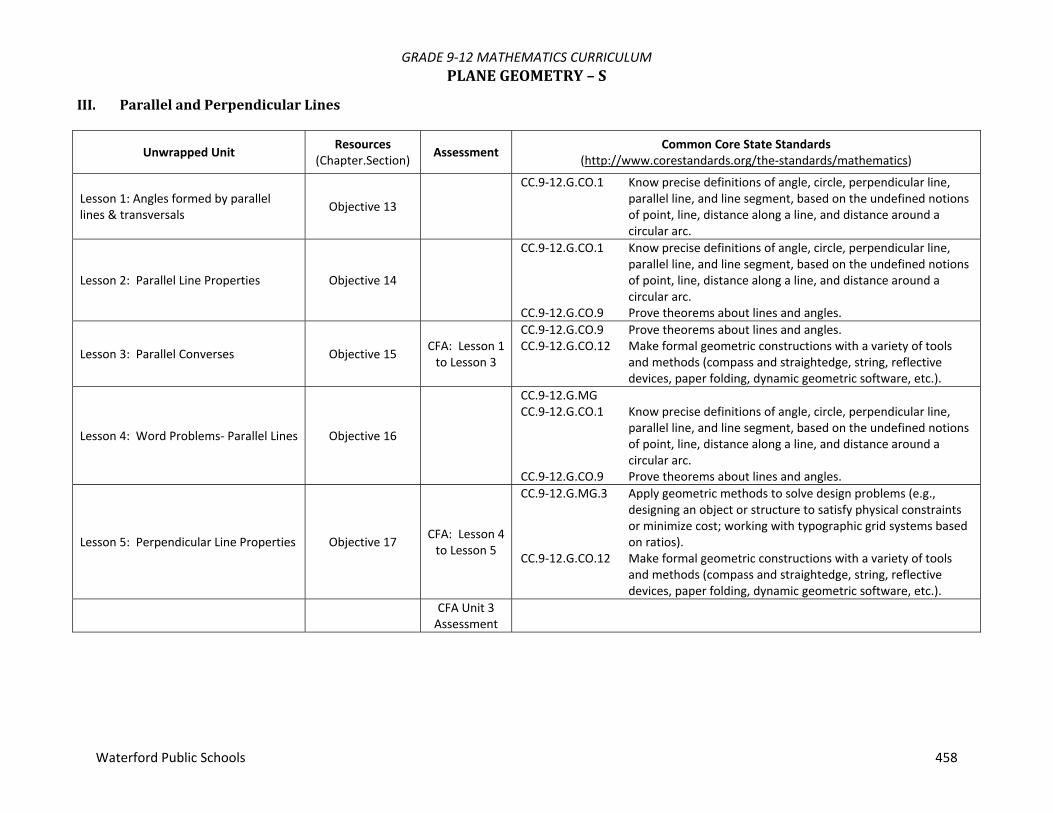
GRADE 9‐12 MATHEMATICS CURRICULUM PLANEGEOMETRY–S
Waterford Public Schools 458
III. ParallelandPerpendicularLines
Unwrapped Unit Resources (Chapter.Section) Assessment Common Core State Standards
(http://www.corestandards.org/the‐standards/mathematics)
Lesson 1: Angles formed by parallel lines & transversals Objective 13
CC.9‐12.G.CO.1 Know precise definitions of angle, circle, perpendicular line, parallel line, and line segment, based on the undefined notions of point, line, distance along a line, and distance around a circular arc.
Lesson 2: Parallel Line Properties Objective 14
CC.9‐12.G.CO.1 Know precise definitions of angle, circle, perpendicular line, parallel line, and line segment, based on the undefined notions of point, line, distance along a line, and distance around a circular arc.
CC.9‐12.G.CO.9 Prove theorems about lines and angles.
Lesson 3: Parallel Converses Objective 15 CFA: Lesson 1 to Lesson 3
CC.9‐12.G.CO.9 Prove theorems about lines and angles.CC.9‐12.G.CO.12 Make formal geometric constructions with a variety of tools
and methods (compass and straightedge, string, reflective devices, paper folding, dynamic geometric software, etc.).
Lesson 4: Word Problems‐ Parallel Lines Objective 16
CC.9‐12.G.MG CC.9‐12.G.CO.1 Know precise definitions of angle, circle, perpendicular line,
parallel line, and line segment, based on the undefined notions of point, line, distance along a line, and distance around a circular arc.
CC.9‐12.G.CO.9 Prove theorems about lines and angles.
Lesson 5: Perpendicular Line Properties Objective 17 CFA: Lesson 4 to Lesson 5
CC.9‐12.G.MG.3 Apply geometric methods to solve design problems (e.g., designing an object or structure to satisfy physical constraints or minimize cost; working with typographic grid systems based on ratios).
CC.9‐12.G.CO.12 Make formal geometric constructions with a variety of tools and methods (compass and straightedge, string, reflective devices, paper folding, dynamic geometric software, etc.).
CFA Unit 3 Assessment

GRADE 9‐12 MATHEMATICS CURRICULUM PLANEGEOMETRY–S
Waterford Public Schools 459
QuarterTwoIV. Triangles
Unwrapped Unit Resources (Chapter.Section) Assessment Common Core State Standards
(http://www.corestandards.org/the‐standards/mathematics)
Lesson 1: Name Parts of Triangles Objective 18 CC.9‐12.G.CO.12 Make formal geometric constructions with a variety of tools
and methods (compass and straightedge, string, reflective devices, paper folding, dynamic geometric software, etc.).
Lesson 2: Classify triangles as scalene, isosceles, or equilateral Objective 19
CC.9‐12.G.CO.12 Make formal geometric constructions with a variety of tools and methods (compass and straightedge, string, reflective devices, paper folding, dynamic geometric software, etc.).
Lesson 3: Classify triangles as acute, obtuse, or right Objective 20 CFA: Lesson 1
to Lesson 3
CC.9‐12.G.CO.12 Make formal geometric constructions with a variety of tools and methods (compass and straightedge, string, reflective devices, paper folding, dynamic geometric software, etc.).
Lesson 4: Perpendiculars and Distance Objective 21
CC.9‐12.G.CO.12 Make formal geometric constructions with a variety of tools and methods (compass and straightedge, string, reflective devices, paper folding, dynamic geometric software, etc.).
CC.9‐12.G.MG.3 Apply geometric methods to solve design problems (e.g., designing an object or structure to satisfy physical constraints or minimize cost; working with typographic grid systems based on ratios).
Lesson 5: Medians, altitudes, angles bisectors & mid‐segments Objective 22
CC.9‐12.G.CO.9 Prove theorems about lines and angles.CC.9‐12.G.CO.10 Prove theorems about triangles. CC.9‐12.G.MG.3 Apply geometric methods to solve design problems (e.g.,
designing an object or structure to satisfy physical constraints or minimize cost; working with typographic grid systems based on ratios).
Lesson 6: Angle measures in isosceles triangles Objective23 CFA: Lesson 4
to lesson 6
CC.9‐12.G.CO.10 CC.9‐12.G.CO.12 Make formal geometric constructions with a variety of tools
and methods (compass and straightedge, string, reflective devices, paper folding, dynamic geometric software, etc.).
CFA Unit 4 Assessment

GRADE 9‐12 MATHEMATICS CURRICULUM PLANEGEOMETRY–S
Waterford Public Schools 460
V. Polygons
Unwrapped Unit Resources (Chapter.Section) Assessment Common Core State Standards
(http://www.corestandards.org/the‐standards/mathematics)
Lesson 1: Identify polygons by # of sides Objective 24 CC.9‐12.G.MG.1 Use geometric shapes, their measures, and their properties to
describe objects (e.g., modeling a tree trunk or a human torso as a cylinder).
Lesson 2: Polygons properties Objective 25 CC.9‐12.G.MG.1 Use geometric shapes, their measures, and their properties to
describe objects (e.g., modeling a tree trunk or a human torso as a cylinder).
Lesson 3: Sum of the interior angles of polygons Objective 26
CC.9‐12.G.MG.3 Apply geometric methods to solve design problems (e.g., designing an object or structure to satisfy physical constraints or minimize cost; working with typographic grid systems based on ratios).
Lesson 4: Interior or exterior angles of polygons Objective 27
CC.9‐12.G.MG.3 Apply geometric methods to solve design problems (e.g., designing an object or structure to satisfy physical constraints or minimize cost; working with typographic grid systems based on ratios).
Lesson 5: WP: Polygons Objective 28 CFA: Lesson 1 to Lesson 5
CC.9‐12.G.MG.3 Apply geometric methods to solve design problems (e.g., designing an object or structure to satisfy physical constraints or minimize cost; working with typographic grid systems based on ratios).
Lesson 6: Classify quadrilaterals Objective 29
CC.9‐12.G.CO.11 Prove theorems about parallelograms.CC.9‐12.G.CO.12 Make formal geometric constructions with a variety of tools
and methods (compass and straightedge, string, reflective devices, paper folding, dynamic geometric software, etc.).
CC.9‐12.G.GPE.4 Use coordinates to prove simple geometric theorems algebraically.
Lesson 7: Quadrilateral characteristics Objective 30 CFA: Lesson 6 to Lesson 7
CC.9‐12.G.CO.11 Prove theorems about parallelograms.CC.9‐12.G.CO.12 Make formal geometric constructions with a variety of tools
and methods (compass and straightedge, string, reflective devices, paper folding, dynamic geometric software, etc.).
CC.9‐12.G.GPE.4 Use coordinates to prove simple geometric theorems algebraically.
CFA Unit 5 Assessment

GRADE 9‐12 MATHEMATICS CURRICULUM PLANEGEOMETRY–S
Waterford Public Schools 461
VI. PythagoreanTheorem
Unwrapped Unit Resources (Chapter.Section) Assessment Common Core State Standards
(http://www.corestandards.org/the‐standards/mathematics)
Lesson 1: Pythagorean Theorem to solve sides Objective 31 CC.9‐12.G.SRT.8 Use trigonometric ratios and the Pythagorean Theorem to solve
right triangles in applied problems. Lesson 2: Pythagorean Theorem to determine right triangle Objective 32 CC.9‐12.G.SRT.8 Use trigonometric ratios and the Pythagorean Theorem to solve
right triangles in applied problems.
Lesson 3: Pythagorean Triples Objective 33 CFA: Lesson 1 to Lesson 3
CC.9‐12.G.SRT.8 Use trigonometric ratios and the Pythagorean Theorem to solve right triangles in applied problems.
Lesson 4: Side lengths to classify triangles by angles Objective 34 CC.9‐12.G.SRT.8 Use trigonometric ratios and the Pythagorean Theorem to solve
right triangles in applied problems.
Lesson 5: WP: Pythagorean Theorem Objective 35 CFA: Lesson 4 to Lesson 5
CC.9‐12.G.SRT.8 Use trigonometric ratios and the Pythagorean Theorem to solve right triangles in applied problems
Lesson 6: 30‐60‐90 Triangles Objective 36 CC.9‐12.G.C.3 Construct the inscribed and circumscribed circles of a triangle,
and prove properties of angles for a quadrilateral inscribed in a circle.
Lesson 7: 45‐45‐90 Triangles Objective 37 CC.9‐12.G.C.3 Construct the inscribed and circumscribed circles of a triangle,
and prove properties of angles for a quadrilateral inscribed in a circle.
Lesson 8: Apply special right triangles Objective 38 CC.9‐12.G.C.3 Construct the inscribed and circumscribed circles of a triangle,
and prove properties of angles for a quadrilateral inscribed in a circle.
CFA Unit 6 Assessment

GRADE 9‐12 MATHEMATICS CURRICULUM PLANEGEOMETRY–S
Waterford Public Schools 462
QuarterThree
VII. Area
Unwrapped Unit Resources (Chapter.Section) Assessment Common Core State Standards
(http://www.corestandards.org/the‐standards/mathematics)
Lesson 1: Area & perimeter of rectangles and squares Objective 39
CC.9‐12.G.C.5 Derive using similarity the fact that the length of the arc intercepted by an angle is proportional to the radius, and define the radian measure of the angle as the constant of proportionality; derive the formula for the area of a sector.
CC.9‐12.G.MG.3 Apply geometric methods to solve design problems (e.g., designing an object or structure to satisfy physical constraints or minimize cost; working with typographic grid systems based on ratios).
CC.9‐12.G.GPE.6 Find the point on a directed line segment between two given points that partitions the segment in a given ratio
CC.9‐12.G.GMD.1 Give an informal argument for the formulas for the circumference of a circle, area of a circle, volume of a cylinder, pyramid, and cone.
Lesson 2: Area of parallelograms Objective 40
CC.9‐12.G.C.5 Derive using similarity the fact that the length of the arc intercepted by an angle is proportional to the radius, and define the radian measure of the angle as the constant of proportionality; derive the formula for the area of a sector.
CC.9‐12.G.MG.3 Apply geometric methods to solve design problems (e.g., designing an object or structure to satisfy physical constraints or minimize cost; working with typographic grid systems based on ratios).
CC.9‐12.G.GPE.6 Find the point on a directed line segment between two given points that partitions the segment in a given ratio
CC.9‐12.G.GMD.1 Give an informal argument for the formulas for the circumference of a circle, area of a circle, volume of a cylinder, pyramid, and cone.
Lesson 3: Area of triangles Objective 41
CC.9‐12.G.C.5 Derive using similarity the fact that the length of the arc intercepted by an angle is proportional to the radius, and define the radian measure of the angle as the constant of proportionality; derive the formula for the area of a sector.
CC.9‐12.G.MG.3 Apply geometric methods to solve design problems (e.g.,
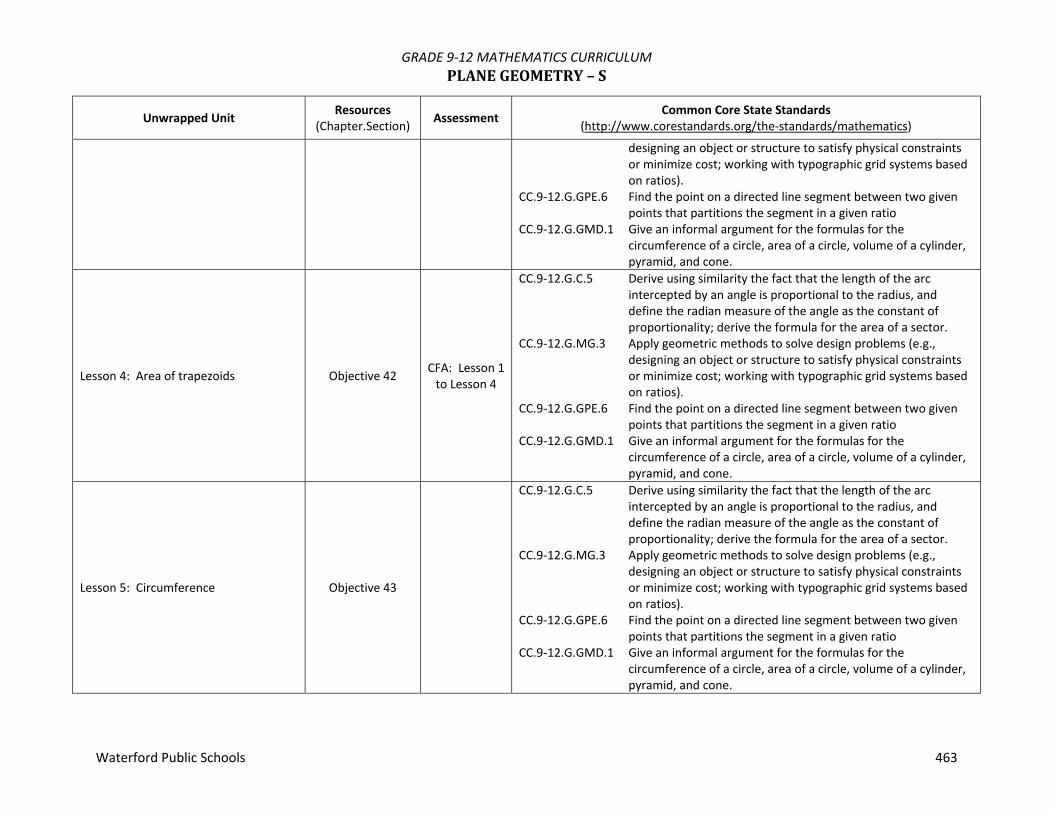
GRADE 9‐12 MATHEMATICS CURRICULUM PLANEGEOMETRY–S
Waterford Public Schools 463
Unwrapped Unit Resources (Chapter.Section) Assessment Common Core State Standards
(http://www.corestandards.org/the‐standards/mathematics)
designing an object or structure to satisfy physical constraints or minimize cost; working with typographic grid systems based on ratios).
CC.9‐12.G.GPE.6 Find the point on a directed line segment between two given points that partitions the segment in a given ratio
CC.9‐12.G.GMD.1 Give an informal argument for the formulas for the circumference of a circle, area of a circle, volume of a cylinder, pyramid, and cone.
Lesson 4: Area of trapezoids Objective 42 CFA: Lesson 1 to Lesson 4
CC.9‐12.G.C.5 Derive using similarity the fact that the length of the arc intercepted by an angle is proportional to the radius, and define the radian measure of the angle as the constant of proportionality; derive the formula for the area of a sector.
CC.9‐12.G.MG.3 Apply geometric methods to solve design problems (e.g., designing an object or structure to satisfy physical constraints or minimize cost; working with typographic grid systems based on ratios).
CC.9‐12.G.GPE.6 Find the point on a directed line segment between two given points that partitions the segment in a given ratio
CC.9‐12.G.GMD.1 Give an informal argument for the formulas for the circumference of a circle, area of a circle, volume of a cylinder, pyramid, and cone.
Lesson 5: Circumference Objective 43
CC.9‐12.G.C.5 Derive using similarity the fact that the length of the arc intercepted by an angle is proportional to the radius, and define the radian measure of the angle as the constant of proportionality; derive the formula for the area of a sector.
CC.9‐12.G.MG.3 Apply geometric methods to solve design problems (e.g., designing an object or structure to satisfy physical constraints or minimize cost; working with typographic grid systems based on ratios).
CC.9‐12.G.GPE.6 Find the point on a directed line segment between two given points that partitions the segment in a given ratio
CC.9‐12.G.GMD.1 Give an informal argument for the formulas for the circumference of a circle, area of a circle, volume of a cylinder, pyramid, and cone.
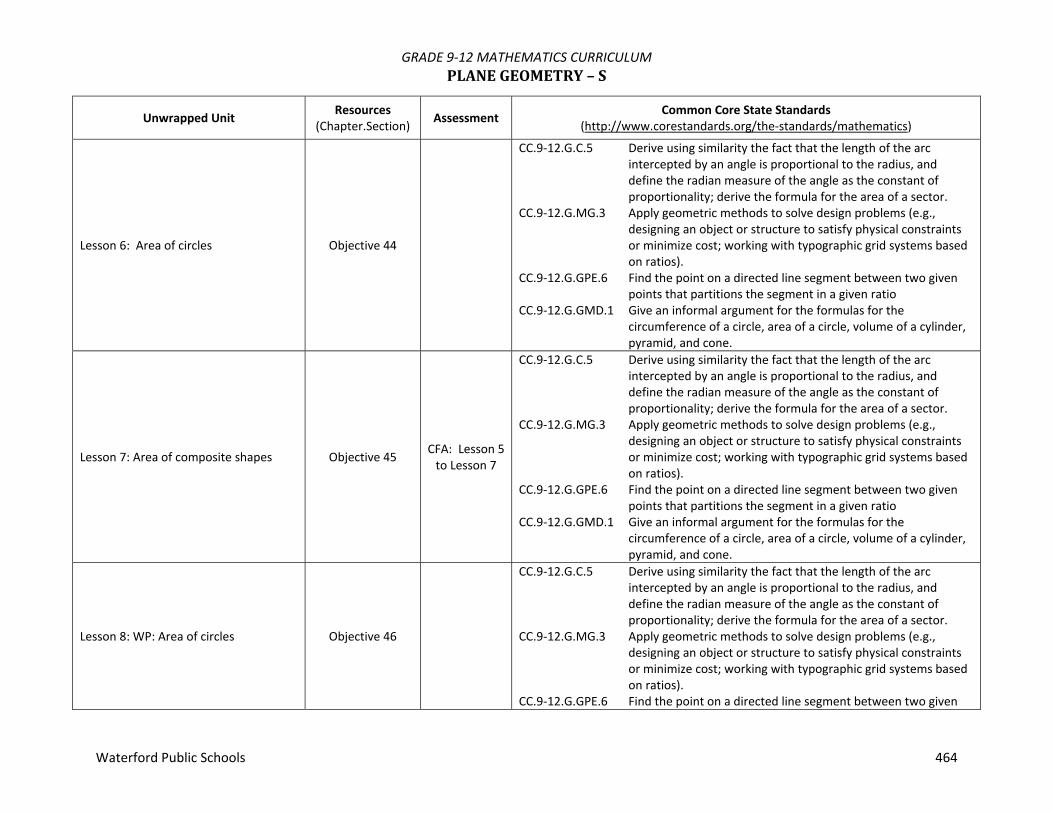
GRADE 9‐12 MATHEMATICS CURRICULUM PLANEGEOMETRY–S
Waterford Public Schools 464
Unwrapped Unit Resources (Chapter.Section) Assessment Common Core State Standards
(http://www.corestandards.org/the‐standards/mathematics)
Lesson 6: Area of circles Objective 44
CC.9‐12.G.C.5 Derive using similarity the fact that the length of the arc intercepted by an angle is proportional to the radius, and define the radian measure of the angle as the constant of proportionality; derive the formula for the area of a sector.
CC.9‐12.G.MG.3 Apply geometric methods to solve design problems (e.g., designing an object or structure to satisfy physical constraints or minimize cost; working with typographic grid systems based on ratios).
CC.9‐12.G.GPE.6 Find the point on a directed line segment between two given points that partitions the segment in a given ratio
CC.9‐12.G.GMD.1 Give an informal argument for the formulas for the circumference of a circle, area of a circle, volume of a cylinder, pyramid, and cone.
Lesson 7: Area of composite shapes Objective 45 CFA: Lesson 5 to Lesson 7
CC.9‐12.G.C.5 Derive using similarity the fact that the length of the arc intercepted by an angle is proportional to the radius, and define the radian measure of the angle as the constant of proportionality; derive the formula for the area of a sector.
CC.9‐12.G.MG.3 Apply geometric methods to solve design problems (e.g., designing an object or structure to satisfy physical constraints or minimize cost; working with typographic grid systems based on ratios).
CC.9‐12.G.GPE.6 Find the point on a directed line segment between two given points that partitions the segment in a given ratio
CC.9‐12.G.GMD.1 Give an informal argument for the formulas for the circumference of a circle, area of a circle, volume of a cylinder, pyramid, and cone.
Lesson 8: WP: Area of circles Objective 46
CC.9‐12.G.C.5 Derive using similarity the fact that the length of the arc intercepted by an angle is proportional to the radius, and define the radian measure of the angle as the constant of proportionality; derive the formula for the area of a sector.
CC.9‐12.G.MG.3 Apply geometric methods to solve design problems (e.g., designing an object or structure to satisfy physical constraints or minimize cost; working with typographic grid systems based on ratios).
CC.9‐12.G.GPE.6 Find the point on a directed line segment between two given

GRADE 9‐12 MATHEMATICS CURRICULUM PLANEGEOMETRY–S
Waterford Public Schools 465
Unwrapped Unit Resources (Chapter.Section) Assessment Common Core State Standards
(http://www.corestandards.org/the‐standards/mathematics)
points that partitions the segment in a given ratioCC.9‐12.G.GMD.1 Give an informal argument for the formulas for the
circumference of a circle, area of a circle, volume of a cylinder, pyramid, and cone.
Lesson 9: Geometric probability using area Objective 47
CC.9‐12.S‐CP.8 Apply the general Multiplication Rule in a uniform probability model, P(A and B) = P(A)P(B|A) = P(B)P(A|B), and interpret the answer in terms of the model.
Lesson 10: Perimeter of composite shapes Objective 48
CC.9‐12.G.C.5 Derive using similarity the fact that the length of the arc intercepted by an angle is proportional to the radius, and define the radian measure of the angle as the constant of proportionality; derive the formula for the area of a sector.
CC.9‐12.G.MG.3 Apply geometric methods to solve design problems (e.g., designing an object or structure to satisfy physical constraints or minimize cost; working with typographic grid systems based on ratios).
CC.9‐12.G.GPE.6 Find the point on a directed line segment between two given points that partitions the segment in a given ratio
CC.9‐12.G.GMD.1 Give an informal argument for the formulas for the circumference of a circle, area of a circle, volume of a cylinder, pyramid, and cone.
CFA Unit 7 Assessment
VIII. SurfaceAreaandVolume
Unwrapped Unit Resources (Chapter.Section) Assessment Common Core State Standards
(http://www.corestandards.org/the‐standards/mathematics)
Lesson 1: Surface area of rectangular prisms Objective 49 CC.9‐12.G.GMD.3 Use volume formulas for cylinders, pyramids, cones, and
spheres to solve problems.
Lesson 2: Volume of rectangular prisms and cubes Objective 50
CC.9‐12.G.MG.2 Apply concepts of density based on area and volume in modeling situations (e.g., persons per square mile, BTUs per cubic foot).
CC.9‐12.G.MG.3 Apply geometric methods to solve design problems (e.g.,

GRADE 9‐12 MATHEMATICS CURRICULUM PLANEGEOMETRY–S
Waterford Public Schools 466
Unwrapped Unit Resources (Chapter.Section) Assessment Common Core State Standards
(http://www.corestandards.org/the‐standards/mathematics)
designing an object or structure to satisfy physical constraints or minimize cost; working with typographic grid systems based on ratio).
CC.9‐12.G.GMD.1 Give an informal argument for the formulas for the circumference of a circle, area of a circle, volume of a cylinder, pyramid, and cone.
CC.9‐12.G.GMD.3 Use volume formulas for cylinders, pyramids, cones, and spheres to solve problems.
Lesson 3: Surface area of cylinders Objective 51 CC.9‐12.G.GMD.3 Use volume formulas for cylinders, pyramids, cones, and spheres to solve problems.
Lesson 4: Volume of cylinders Objective 52 CFA: Lesson 1 to Lesson 4
CC.9‐12.G.MG.2 Apply concepts of density based on area and volume in modeling situations (e.g., persons per square mile, BTUs per cubic foot).
CC.9‐12.G.MG.3 Apply geometric methods to solve design problems (e.g., designing an object or structure to satisfy physical constraints or minimize cost; working with typographic grid systems based on ratio).
CC.9‐12.G.GMD.1 Give an informal argument for the formulas for the circumference of a circle, area of a circle, volume of a cylinder, pyramid, and cone.
CC.9‐12.G.GMD.3 Use volume formulas for cylinders, pyramids, cones, and spheres to solve problems.
Lesson 5: Volume of pyramids Objective 53 CC.9‐12.G.GMD.3 Use volume formulas for cylinders, pyramids, cones, and spheres to solve problems.
Lesson 6: Volume of cones Objective 54 CC.9‐12.G.GMD.3 Use volume formulas for cylinders, pyramids, cones, and spheres to solve problems.
Lesson 7: Volume and surface area of spheres Objective 55 CFA: Lesson 5
to Lesson 7 CC.9‐12.G.GMD.3 Use volume formulas for cylinders, pyramids, cones, and
spheres to solve problems. Lesson 8: Surface area of composite solids Objective 56 CC.9‐12.G.GMD.3 Use volume formulas for cylinders, pyramids, cones, and
spheres to solve problems.
Lesson 9: Volume of composite Solids Objective 57 CC.9‐12.G.GMD.3 Use volume formulas for cylinders, pyramids, cones, and spheres to solve problems.
CFA Unit 8 Assessment

GRADE 9‐12 MATHEMATICS CURRICULUM PLANEGEOMETRY–S
Waterford Public Schools 467
QuarterFour
IX. CongruentandSimilarTriangles
Unwrapped Unit Resources (Chapter.Section) Assessment Common Core State Standards
(http://www.corestandards.org/the‐standards/mathematics)
Lesson 1: Corresponding parts of congruent triangles Objective 58 CC.9‐12.G.SRT.5 Use congruence and similarity criteria for triangles to solve
problems and to prove relationships in geometric figures. Lesson 2: Rule that proves triangle congruence Objective 59 CC.9‐12.G.SRT.5 Use congruence and similarity criteria for triangles to solve
problems and to prove relationships in geometric figures.
Lesson 3: Solve proportions Objective 60 CC.9‐12.G.SRT.5 Use congruence and similarity criteria for triangles to solve problems and to prove relationships in geometric figures.
Lesson 4: WP: Solve proportions Objective 61 CFA: Lesson 1 to Lesson 4
CC.9‐12.G.SRT.5 Use congruence and similarity criteria for triangles to solve problems and to prove relationships in geometric figures.
Lesson 5: Similar figures & proportions Objective 62
CC.9‐12.G.SRT.1 Verify experimentally the properties of dilations given by a center and a scale factor.
CC.9‐12.G.SRT.5 Use congruence and similarity criteria for triangles to solve problems and to prove relationships in geometric figures.
Lesson 6: Similar triangles & proportions Objective 63
CC.9‐12.G.SRT.1 Verify experimentally the properties of dilations given by a center and a scale factor.
CC.9‐12.G.SRT.5 Use congruence and similarity criteria for triangles to solve problems and to prove relationships in geometric figures.
Lesson 7: WP: Similar triangles & proportions Objective 64
CC.9‐12.G.SRT.1 Verify experimentally the properties of dilations given by a center and a scale factor.
CC.9‐12.G.SRT.5 Use congruence and similarity criteria for triangles to solve problems and to prove relationships in geometric figures.
Lesson 8: Side‐splitter theorem Objective 65 CFA: Lesson 5 to Lesson 8
CC.9‐12.G.SRT.5 Use congruence and similarity criteria for triangles to solve problems and to prove relationships in geometric figures.
CFA Unit 9 Assessment

GRADE 9‐12 MATHEMATICS CURRICULUM PLANEGEOMETRY–S
Waterford Public Schools 468
XI. Circles
Unwrapped Unit Resources (Chapter.Section) Assessment Common Core State Standards
(http://www.corestandards.org/the‐standards/mathematics)
Lesson 1: Parts of circles Objective 66
CC.9‐12.G.CO.1 Know precise definitions of angle, circle, perpendicular line, parallel line, and line segment, based on the undefined notions of point, line, distance along a line, and distance around a circular arc.
CC.9‐12.G.C.1 Prove that all circles are similar. CC.9‐12.G.C.2 Identify and describe relationships among inscribed angles,
radii, and chords. CC.9‐12.G.GMD.1 Give an informal argument for the formulas for the
circumference of a circle, area of a circle, volume of a cylinder, pyramid, and cone.
Lesson 2: Central & inscribed angles & arcs Objective 67 CC.9‐12.G.C2 Identify and describe relationships among inscribed angles,
radii, and chords.
Lesson 3: Inscribed quadrilaterals Objective 68 CFA: Lesson 1 to Lesson 3
CC.9‐12.G.C2 Identify and describe relationships among inscribed angles, radii, and chords.
Lesson 4: Chords & intercepted arcs Objective 69
CC.9‐12.G.C2 Identify and describe relationships among inscribed angles, radii, and chords.
CC.9‐12.G.CO.12 Make formal geometric constructions with a variety of tools and methods (compass and straightedge, string, reflective devices, paper folding, dynamic geometric software, etc.).
CC.9‐12.G.MG.3 Apply geometric methods to solve design problems (e.g., designing an object or structure to satisfy physical constraints or minimize cost; working with typographic grid systems based on ratios).
Lesson 5: Angles & arcs formed by tangents, secants & chords Objective 70
CC.9‐12.G.C2 Identify and describe relationships among inscribed angles, radii, and chords.
CC.9‐12.G.C.4 Construct a tangent line from a point outside a given circle to the circle.

GRADE 9‐12 MATHEMATICS CURRICULUM PLANEGEOMETRY–S
Waterford Public Schools 469
Unwrapped Unit Resources (Chapter.Section) Assessment Common Core State Standards
(http://www.corestandards.org/the‐standards/mathematics)
Lesson 6: Tangent properties Objective 71 CFA: Lesson 4 to Lesson 6
CC.9‐12.G.CO.12 Make formal geometric constructions with a variety of tools and methods (compass and straightedge, string, reflective devices, paper folding, dynamic geometric software, etc.).
CC.9‐12.G.C.2 Identify and describe relationships among inscribed angles, radii, and chords.
CC.9‐12.G.C.4 Construct a tangent line from a point outside a given circle to the circle.
CFA Unit 10 Assessment

GRADE 9‐12 MATHEMATICS CURRICULUM PLANEGEOMETRY–A
Waterford Public Schools 470
Plane Geometry is the study of figures on a plane and in space. The proof of theorems, corollaries and original problems is stressed. This course trains students to think logically. Essential Questions
1. What are the four basic constructions? 2. How are definitions, postulates, and theorems used in proving theorems? 3. How do classifications, congruence relationships, similar relationships and the Pythagorean Theorem apply to triangles? 4. What are the parts of a circle and what are the formulas for circumference and area? 5. What are the different types of polygons and how do you find their areas and perimeters? 6. How are sine, cosine and tangent defined and used to solve problems? 7. How would slope, midpoint, and parallel and perpendicular apply to a graph? 8. What are the volume formulas for prisms, cylinders, pyramids, cones and spheres and how can they be applied?
Course #: 342 Prerequisite: Successful completion of Algebra I – A Credit: 1 credit Resources: www.connected.mcgraw‐hill.com

GRADE 9‐12 MATHEMATICS CURRICULUM PLANEGEOMETRY–A
Waterford Public Schools 471
QuarterOneI. FoundationsofGeometry
Unwrapped Unit Resources (Chapter.Section) Assessment Common Core State Standards
(http://www.corestandards.org/the‐standards/mathematics)
Lesson 1: Points, Lines, Planes, and Space 1.1
CC.9‐12.G.CO.1 Know precise definitions of angle, circle, perpendicular line, parallel line, and line segment, based on the undefined notions of point, line, distance along a line, and distance around a circular arc.
Lesson 2: Linear Measure 1.2
CC.9‐12.G.CO.1 Know precise definitions of angle, circle, perpendicular line, parallel line, and line segment, based on the undefined notions of point, line, distance along a line, and distance around a circular arc.
CC.9‐12.G.CO.12 Make formal geometric constructions with a variety of tools and methods (compass and straightedge, string, reflective devices, paper folding, dynamic geometric software, etc.).
Lesson 3: Distance and Midpoints 1.3 CFA: Lesson 1 to Lesson 3
CC.9‐12.G.CO.1 Know precise definitions of angle, circle, perpendicular line, parallel line, and line segment, based on the undefined notions of point, line, distance along a line, and distance around a circular arc.
CC.9‐12.G.CO.12 Make formal geometric constructions with a variety of tools and methods (compass and straightedge, string, reflective devices, paper folding, dynamic geometric software, etc.).
CC.9‐12.G.GPE.6 Find the point on a directed line segment between two given points that partitions the segment in a given ratio.
Lesson 4: Angle Measure 1.4
CC.9‐12.G.CO.1 Know precise definitions of angle, circle, perpendicular line, parallel line, and line segment, based on the undefined notions of point, line, distance along a line, and distance around a circular arc.
CC.9‐12.G.CO.12 Make formal geometric constructions with a variety of tools and methods (compass and straightedge, string, reflective devices, paper folding, dynamic geometric software, etc.).
Lesson 5: Angle Relationships 1.5
Unit Assessment CFA Lesson 1 – Lesson 5
CC.9‐12.G.SRT.7 Explain and use the relationship between the sine and cosine of complementary angles.

GRADE 9‐12 MATHEMATICS CURRICULUM PLANEGEOMETRY–A
Waterford Public Schools 472
II. Transformations
Unwrapped Unit Resources (Chapter.Section) Assessment Common Core State Standards
(http://www.corestandards.org/the‐standards/mathematics)
Lesson 1: Translations, Reflections about the axes and y=x, Rotations of 90o 9.1, 9.2, 9.3 CFA: Lesson 1
CC.9‐12.G.CO.2 Represent transformations in the plane using, e.g., transparencies and geometry software; describe transformations as functions that take points in the plane as inputs and give other points as outputs. Compare transformations that preserve distance and angle to those that do not (e.g., translation versus horizontal stretch
CC.9‐12.G.CO.4 Develop definitions of rotations, reflections, and translations in terms of angles, circles, perpendicular lines, parallel lines, and line segments.
CC.9‐12.G.CO.5 Given a geometric figure and a rotation, reflection, or translation, draw the transformed figure using, e.g., graph paper, tracing paper, or geometry software. Specify a sequence of transformations that will carry a given figure onto another.
CC.9‐12.G.CO.6 Use geometric descriptions of rigid motions to transform figures and to predict the effect of a given rigid motion on a given figure; given two figures, use the definition of congruence in terms of rigid motions to decide if they are congruent.
CC.9‐12.G.CO.7 Use the definition of congruence in terms of rigid motions to show that two triangles are congruent if and only if corresponding pairs of sides and corresponding pairs of angles are congruent.
CC.9‐12.G.CO.12 Make formal geometric constructions with a variety of tools and methods (compass and straightedge, string, reflective devices, paper folding, dynamic geometric software, etc.).
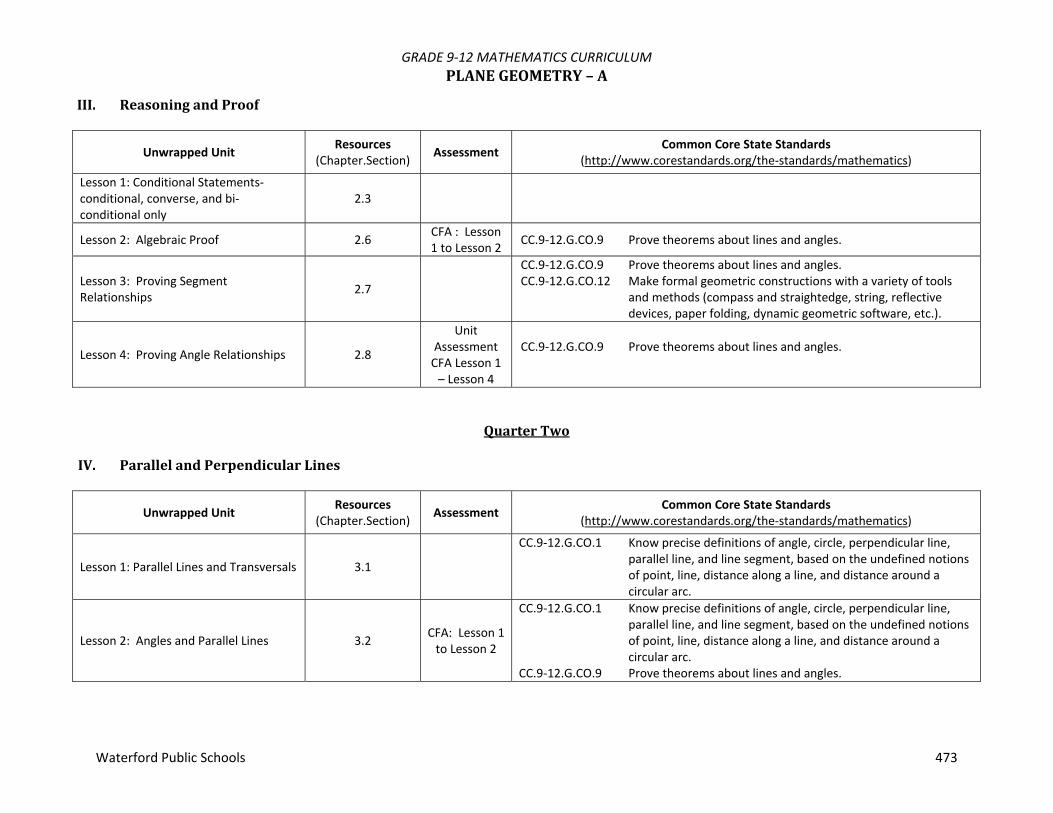
GRADE 9‐12 MATHEMATICS CURRICULUM PLANEGEOMETRY–A
Waterford Public Schools 473
III. ReasoningandProof
Unwrapped Unit Resources (Chapter.Section) Assessment Common Core State Standards
(http://www.corestandards.org/the‐standards/mathematics)
Lesson 1: Conditional Statements‐ conditional, converse, and bi‐conditional only
2.3
Lesson 2: Algebraic Proof 2.6 CFA : Lesson 1 to Lesson 2 CC.9‐12.G.CO.9 Prove theorems about lines and angles.
Lesson 3: Proving Segment Relationships 2.7
CC.9‐12.G.CO.9 Prove theorems about lines and angles.CC.9‐12.G.CO.12 Make formal geometric constructions with a variety of tools
and methods (compass and straightedge, string, reflective devices, paper folding, dynamic geometric software, etc.).
Lesson 4: Proving Angle Relationships 2.8
Unit Assessment CFA Lesson 1 – Lesson 4
CC.9‐12.G.CO.9 Prove theorems about lines and angles.
QuarterTwo
IV. ParallelandPerpendicularLines
Unwrapped Unit Resources (Chapter.Section) Assessment Common Core State Standards
(http://www.corestandards.org/the‐standards/mathematics)
Lesson 1: Parallel Lines and Transversals 3.1
CC.9‐12.G.CO.1 Know precise definitions of angle, circle, perpendicular line, parallel line, and line segment, based on the undefined notions of point, line, distance along a line, and distance around a circular arc.
Lesson 2: Angles and Parallel Lines 3.2 CFA: Lesson 1 to Lesson 2
CC.9‐12.G.CO.1 Know precise definitions of angle, circle, perpendicular line, parallel line, and line segment, based on the undefined notions of point, line, distance along a line, and distance around a circular arc.
CC.9‐12.G.CO.9 Prove theorems about lines and angles.

GRADE 9‐12 MATHEMATICS CURRICULUM PLANEGEOMETRY–A
Waterford Public Schools 474
Unwrapped Unit Resources (Chapter.Section) Assessment Common Core State Standards
(http://www.corestandards.org/the‐standards/mathematics)
Lesson 3: Proving Lines Parallel 3.5
CC.9‐12.G.CO.9 Prove theorems about lines and angles.CC.9‐12.G.CO.12 Make formal geometric constructions with a variety of tools
and methods (compass and straightedge, string, reflective devices, paper folding, dynamic geometric software, etc.).
Lesson 4: Perpendiculars and Distance 3.6
Unit Assessment CFA Lesson 1 – Lesson 4
CC.9‐12.G.CO.12 Make formal geometric constructions with a variety of tools and methods (compass and straightedge, string, reflective devices, paper folding, dynamic geometric software, etc.).
CC.9‐12.G.MG.3 Apply geometric methods to solve design problems (e.g., designing an object or structure to satisfy physical constraints or minimize cost; working with typographic grid systems based on ratios).
V. CongruentTriangles
Unwrapped Unit Resources (Chapter.Section) Assessment Common Core State Standards
(http://www.corestandards.org/the‐standards/mathematics)
Lesson 1: Classifying Triangles 4.1 CC.9‐12.G.CO.12 Make formal geometric constructions with a variety of tools
and methods (compass and straightedge, string, reflective devices, paper folding, dynamic geometric software, etc.).
Lesson 2: Angles of Triangles 4.2 CC.9‐12.G.CO.10 Prove theorems about triangles.
Lesson 3: Congruent Triangles 4.3 CFA: Lesson 1 to Lesson 3
CC.9‐12.G.CO.7 Use the definition of congruence in terms of rigid motions to show that two triangles are congruent if and only if corresponding pairs of sides and corresponding pairs of angles are congruent.
CC.9‐12.G.CO.10 Prove theorems about triangles. CC.9‐12.G.SRT.5 Use congruence and similarity criteria for triangles to solve
problems and to prove relationships in geometric figures.
Lesson 4: Proving Triangles Congruent 4.4, 4.5 CFA: Lesson 4
CC.9‐12.G.CO.10 Prove theorems about triangles.CC.9‐12.G.CO.12 Make formal geometric constructions with a variety of tools
and methods (compass and straightedge, string, reflective devices, paper folding, dynamic geometric software, etc.).
CC.9‐12.G.SRT.5 Use congruence and similarity criteria for triangles to solve problems and to prove relationships in geometric figures.

GRADE 9‐12 MATHEMATICS CURRICULUM PLANEGEOMETRY–A
Waterford Public Schools 475
Unwrapped Unit Resources (Chapter.Section) Assessment Common Core State Standards
(http://www.corestandards.org/the‐standards/mathematics)
Lesson 5: Isosceles and Equilateral Triangles 4.6
CC.9‐12.G.CO.10 Prove theorems about triangles.CC.9‐12.G.CO.12 Make formal geometric constructions with a variety of tools
and methods (compass and straightedge, string, reflective devices, paper folding, dynamic geometric software, etc.).
Lesson 6: Triangles and Coordinate Proof 4.8
Unit Assessment CFA Lesson 1 – Lesson 6
CC.9‐12.G.CO.10 Prove theorems about triangles. CC.9‐12.G.GPE.4 Use coordinates to prove simple geometric theorems
algebraically.
QuarterThree
VI. RelationshipsinTriangles
Unwrapped Unit Resources (Chapter.Section) Assessment Common Core State Standards
(http://www.corestandards.org/the‐standards/mathematics)
Lesson 1: Bisectors, Medians, and Altitudes of Triangles 5.1, 5.2
CC.9‐12.G.CO.9 Prove theorems about lines and angles.CC.9‐12.G.CO.10 Prove theorems about triangles. CC.9‐12.G.MG.3 Apply geometric methods to solve design problems (e.g.,
designing an object or structure to satisfy physical constraints or minimize cost; working with typographic grid systems based on ratios).
Lesson 2: Inequalities in One Triangle 5.3 CC.9‐12.G.CO.10 Prove theorems about triangles.
Lesson 3: The Triangle Inequality Theorem 5.5 CFA: Lesson 1
to Lesson 3
CC.9‐12.G.CO.10 Prove theorems about triangles.CC.9‐12.G.MG.3 Apply geometric methods to solve design problems (e.g.,
designing an object or structure to satisfy physical constraints or minimize cost; working with typographic grid systems based on ratios).

GRADE 9‐12 MATHEMATICS CURRICULUM PLANEGEOMETRY–A
Waterford Public Schools 476
VII. Quadrilaterals
Unwrapped Unit Resources (Chapter.Section) Assessment Common Core State Standards
(http://www.corestandards.org/the‐standards/mathematics)
Lesson 1: Angles of Polygons 6.1 CC.9‐12.G.MG.1 Use geometric shapes, their measures, and their properties to
describe objects (e.g., modeling a tree trunk or a human torso as a cylinder).
Lesson 2: Parallelograms 6.2 CC.9‐12.G.CO.11 Prove theorems about parallelograms.CC.9‐12.G.GPE.4 Use coordinates to prove simple geometric theorems
algebraically.
Lesson 3: Tests for Parallelograms 6.3 CFA: Lesson 1 to Lesson 3
CC.9‐12.G.CO.11 Prove theorems about parallelograms.CC.9‐12.G.CO.12 Make formal geometric constructions with a variety of tools
and methods (compass and straightedge, string, reflective devices, paper folding, dynamic geometric software, etc.).
CC.9‐12.G.GPE.4 Use coordinates to prove simple geometric theorems algebraically.
Lesson 4: Rectangles 6.4
CC.9‐12.G.CO.11 Prove theorems about parallelograms.CC.9‐12.G.CO.12 Make formal geometric constructions with a variety of tools
and methods (compass and straightedge, string, reflective devices, paper folding, dynamic geometric software, etc.).
CC.9‐12.G.GPE.4
Lesson 5: Rhombi and Squares 6.5 CFA: Lesson 4 to Lesson 5
CC.9‐12.G.CO.11 Prove theorems about parallelograms.CC.9‐12.G.CO.12 Make formal geometric constructions with a variety of tools
and methods (compass and straightedge, string, reflective devices, paper folding, dynamic geometric software, etc.).
CC.9‐12.G.GPE.4 Use coordinates to prove simple geometric theorems algebraically.
Lesson 6: Trapezoids and Kites 6.6
Unit Assessment CFA Lesson 1 – Lesson 6
CC.9‐12.G.GPE.4 Use coordinates to prove simple geometric theorems algebraically
CC.9‐12.G.MG.3 Apply geometric methods to solve design problems (e.g., designing an object or structure to satisfy physical constraints or minimize cost; working with typographic grid systems based on ratios).

GRADE 9‐12 MATHEMATICS CURRICULUM PLANEGEOMETRY–A
Waterford Public Schools 477
VIII. ProportionsandSimilarity
Unwrapped Unit Resources (Chapter.Section) Assessment Common Core State Standards
(http://www.corestandards.org/the‐standards/mathematics)
Lesson 1: Ratios and Proportions 7.1
CC.9‐12.G.MG.3 Apply geometric methods to solve design problems (e.g., designing an object or structure to satisfy physical constraints or minimize cost; working with typographic grid systems based on ratios).
Lesson 2: Similar Polygons 7.2
CC.9‐12.G.SRT.2 Given two figures, use the definition of similarity in terms of similarity transformations to decide if they are similar; explain using similarity transformations the meaning of similarity for triangles as the equality of all corresponding pairs of angles and the proportionality of all corresponding pairs of sides.
Lesson 3: Similar Triangles 7.3 CFA: Lesson 1 to Lesson 3
CC.9‐12.G.SRT.2 Given two figures, use the definition of similarity in terms of similarity transformations to decide if they are similar; explain using similarity transformations the meaning of similarity for triangles as the equality of all corresponding pairs of angles and the proportionality of all corresponding pairs of sides.
CC.9‐12.G.SRT.3 Use the properties of similarity transformations to establish the AA criterion for two triangles to be similar.
CC.9‐12.G.SRT.4 Prove theorems about triangles. CC.9‐12.G.SRT.5 Use congruence and similarity criteria for triangles to solve
problems and to prove relationships in geometric figures.
Lesson 4: Parallel Lines and Proportional Parts 7.4
CC.9‐12.G.CO.10 Prove theorems about triangles.CC.9‐12.G.CO.12 Make formal geometric constructions with a variety of tools
and methods (compass and straightedge, string, reflective devices, paper folding, dynamic geometric software, etc.).
CC.9‐12.G.SRT.4 Prove theorems about triangles. CC.9‐12.G.SRT.5 Use congruence and similarity criteria for triangles to solve
problems and to prove relationships in geometric figures. CC.9‐12.G.SRT.6 Understand that by similarity, side ratios in right triangles are
properties of the angles in the triangle, leading to definitions of trigonometric ratios for acute angles.
Lesson 5: Parts of Similar Triangles 7.5
Unit Assessment CFA: Lesson 1 to Lesson 5
CC.9‐12.G.SRT.4 Prove theorems about triangles. CC.9‐12.G.SRT.5 Use congruence and similarity criteria for triangles to solve
problems and to prove relationships in geometric figures.

GRADE 9‐12 MATHEMATICS CURRICULUM PLANEGEOMETRY–A
Waterford Public Schools 478
QuarterFour
IX. RightTrianglesandTrigonometry
Unwrapped Unit Resources (Chapter.Section) Assessment Common Core State Standards
(http://www.corestandards.org/the‐standards/mathematics)
Lesson 1: Geometric Mean 8.1 CC.9‐12.G.SRT.4 Prove theorems about triangles.CC.9‐12.G.SRT.5 Use congruence and similarity criteria for triangles to solve
problems and to prove relationships in geometric figures.
Lesson 2: Pythagorean Theorem and its Converse 8.2
CC.9‐12.G.SRT.8 Use trigonometric ratios and the Pythagorean Theorem to solve right triangles in applied problems.
CC.9‐12.G.MG.3 Apply geometric methods to solve design problems (e.g., designing an object or structure to satisfy physical constraints or minimize cost; working with typographic grid systems based on ratios).
Lesson 3: Special Right Triangles 8.3 CFA: Lesson 1 to Lesson 3
CC.9‐12.G.SRT.6 Understand that by similarity, side ratios in right triangles are properties of the angles in the triangle, leading to definitions of trigonometric ratios for acute angles.
Lesson 4: Trigonometry 8.4
CC.9‐12.G.SRT.6 Understand that by similarity, side ratios in right triangles are properties of the angles in the triangle, leading to definitions of trigonometric ratios for acute angles.
CC.9‐12.G.SRT.7 Explain and use the relationship between the sine and cosine of complementary angles.
CC.9‐12.G.SRT.8 Use trigonometric ratios and the Pythagorean Theorem to solve right triangles in applied problems.
Lesson 5: Angles of Elevation and Depression 8.5
Unit Assessment CFA Lesson 1 – Lesson 5
CC.9‐12.G.SRT.8 Use trigonometric ratios and the Pythagorean Theorem to solve right triangles in applied problems.

GRADE 9‐12 MATHEMATICS CURRICULUM PLANEGEOMETRY–A
Waterford Public Schools 479
X. AreaandVolume
Unwrapped Unit Resources (Chapter.Section) Assessment Common Core State Standards
(http://www.corestandards.org/the‐standards/mathematics)
Lesson 1: Area of rectangles, squares, parallelograms, triangles, trapezoids, kites, regular polygons, circles ( sector area)
11.1, 11.2, 11.3, 11.4
CC.9‐12.G.GPE.6 Find the point on a directed line segment between two given points that partitions the segment in a given ratio.
CC.9‐12.G.MG.3 Apply geometric methods to solve design problems (e.g., designing an object or structure to satisfy physical constraints or minimize cost; working with typographic grid systems based on ratios).
CC.9‐12.G.C.5 Derive using similarity the fact that the length of the arc intercepted by an angle is proportional to the radius, and define the radian measure of the angle as the constant of proportionality; derive the formula for the area of a sector.
CC.9‐12.G.GMD.1 Give an informal argument for the formulas for the circumference of a circle, area of a circle, volume of a cylinder, pyramid, and cone.
Lesson 2: Volume of prisms, pyramids, cylinders, cones, and spheres 12.4, 12.5, 12.6 CFA: Lesson 1
to Lesson 2
CC.9‐12.G.GMD.1 Give an informal argument for the formulas for the circumference of a circle, area of a circle, volume of a cylinder, pyramid, and cone.
CC.9‐12.G.GMD.3 Use volume formulas for cylinders, pyramids, cones, and spheres to solve problems.
CC.9‐12.G.MG.2 Apply concepts of density based on area and volume in modeling situations (e.g., persons per square mile, BTUs per cubic foot).
CC.9‐12.G.MG.3 Apply geometric methods to solve design problems (e.g., designing an object or structure to satisfy physical constraints or minimize cost; working with typographic grid systems based on ratios).

GRADE 9‐12 MATHEMATICS CURRICULUM PLANEGEOMETRY–A
Waterford Public Schools 480
XI. Circles
Unwrapped Unit Resources (Chapter.Section) Assessment Common Core State Standards
(http://www.corestandards.org/the‐standards/mathematics)
Lesson 1: Circles and Circumference 10.1
CC.9‐12.G.CO.1 Know precise definitions of angle, circle, perpendicular line, parallel line, and line segment, based on the undefined notions of point, line, distance along a line, and distance around a circular arc.
CC.9‐12.G.C.1 Prove that all circles are similar. CC.9‐12.G.C.2 Identify and describe relationships among inscribed angles,
radii, and chords. CC.9‐12.G.GMD.1 Give an informal argument for the formulas for the
circumference of a circle, area of a circle, volume of a cylinder, pyramid, and cone.
Lesson 2: Measuring Angles and Arcs 10.2
CC.9‐12.G.C.2 Identify and describe relationships among inscribed angles, radii, and chords.
CC.9‐12.G.C.5 Derive using similarity the fact that the length of the arc intercepted by an angle is proportional to the radius, and define the radian measure of the angle as the constant of proportionality; derive the formula for the area of a sector.
Lesson 3: Arcs and Chords 10.3 CFA: Lesson 1 to Lesson 3
CC.9‐12.G.CO.12 Make formal geometric constructions with a variety of tools and methods (compass and straightedge, string, reflective devices, paper folding, dynamic geometric software, etc.).
CC.9‐12.G.C.2 Identify and describe relationships among inscribed angles, radii, and chords.
CC.9‐12.G.MG.3 Apply geometric methods to solve design problems (e.g., designing an object or structure to satisfy physical constraints or minimize cost; working with typographic grid systems based on ratios).
Lesson 4: Inscribed Angles 10.4
CC.9‐12.G.C.2 Identify and describe relationships among inscribed angles, radii, and chords.
CC.9‐12.G.C.3 Construct the inscribed and circumscribed circles of a triangle, and prove properties of angles for a quadrilateral inscribed in a circle.

GRADE 9‐12 MATHEMATICS CURRICULUM PLANEGEOMETRY–A
Waterford Public Schools 481
Unwrapped Unit Resources (Chapter.Section) Assessment Common Core State Standards
(http://www.corestandards.org/the‐standards/mathematics)
Lesson 5: Tangents 10.5
CC.9‐12.G.CO.12 Make formal geometric constructions with a variety of tools and methods (compass and straightedge, string, reflective devices, paper folding, dynamic geometric software, etc.).
CC.9‐12.G.C.2 Identify and describe relationships among inscribed angles, radii, and chords.
CC.9‐12.G.C.4 Construct a tangent line from a point outside a given circle to the circle.
Lesson 6: Secants, Tangents and Angle Measure 10.6 CFA: Lesson 4
to 6 CC.9‐12.G.C.4 Construct a tangent line from a point outside a given circle to
the circle.
Lesson 7: Special Segments in a Circle 10.7
Unit Assessment CFA Lesson 1 – Lesson 7
CC.9‐12.G.C.4 Construct a tangent line from a point outside a given circle to the circle.

GRADE 9‐12 MATHEMATICS CURRICULUM PLANEGEOMETRY–H
Waterford Public Schools 482
Plane Geometry is the study of figures on a plan and in space. Theorems and corollaries are examined and proved. Applications of geometric principles are investigated. This is a more rigorous treatment of the material than the advanced course. Essential Questions
1. What are the four basic constructions? 2. How are definitions, postulates, and theorems used in proving theorems? 3. How do classifications, congruence relationships, similar relationships and the Pythagorean Theorem apply to triangles? 4. What are the parts of a circle and what are the formulas for circumference and area? 5. What are the different types of polygons and how do you find their areas and perimeters? 6. How are sine, cosine and tangent defined and used to solve problems? 7. How would slope, midpoint, and parallel and perpendicular apply to a graph? 8. What are the volume formulas for prisms, cylinders, pyramids, cones and spheres and how can they be applied?
Course #: 341 Prerequisite: Grade of A in Algebra I – A and 8th grade teacher recommendation Credit: 1 credit Resources: Geometry, Moise & Downs, ISBN 0‐201‐05028‐5

GRADE 9‐12 MATHEMATICS CURRICULUM PLANEGEOMETRY–H
Waterford Public Schools 483
QuarterOneI. FoundationsofGeometry
Unwrapped Unit Resources (Chapter.Section) Assessment Common Core State Standards
(http://www.corestandards.org/the‐standards/mathematics)
Lesson 1: Sets and Properties of Real Numbers 2.1
CC.9‐12.N.RN.3 Explain why the sum or product of two rational numbers is rational; that the sum of a rational number and an irrational number is irrational; and that the product of a nonzero rational number and an irrational number is irrational.
Lesson 2: Points, Lines, Planes, and Space 3.2, 3.3
CC.9‐12.G.CO.1 Know precise definitions of angle, circle, perpendicular line, parallel line, and line segment, based on the undefined notions of point, line, distance along a line, and distance around a circular arc.
Lesson 3: Linear Measure, Distance and Midpoints 2.4, 2.5, 2.6 CFA: Lesson 1
to 2
CC.9‐12.G.CO.1 Know precise definitions of angle, circle, perpendicular line, parallel line, and line segment, based on the undefined notions of point, line, distance along a line, and distance around a circular arc.
CC.9‐12.G.CO.12 Make formal geometric constructions with a variety of tools and methods (compass and straightedge, string, reflective devices, paper folding, dynamic geometric software, etc.).
CC.9‐12.G.GPE.6 Find the point on a directed line segment between two given points that partitions the segment in a given ratio.
Lesson 4: Convex Sets and Separation 3.4
CC.9‐12.G.CO.1 Know precise definitions of angle, circle, perpendicular line, parallel line, and line segment, based on the undefined notions of point, line, distance along a line, and distance around a circular arc.
Lesson 5: Angle Measure and Angle Relationships 4.2
Unit Assessment CFA Lesson 1 – Lesson 5
CC.9‐12.G.CO.1 Know precise definitions of angle, circle, perpendicular line, parallel line, and line segment, based on the undefined notions of point, line, distance along a line, and distance around a circular arc.
CC.9‐12.G.CO.12 Make formal geometric constructions with a variety of tools and methods (compass and straightedge, string, reflective devices, paper folding, dynamic geometric software, etc.).
CC.9‐12.G.SRT.7 Explain and use the relationship between the sine and cosine of complementary angles.

GRADE 9‐12 MATHEMATICS CURRICULUM PLANEGEOMETRY–H
Waterford Public Schools 484
II. Transformations
Unwrapped Unit Resources (Chapter.Section) Assessment Common Core State Standards
(http://www.corestandards.org/the‐standards/mathematics)
Lesson 1: Translations, Reflections about the axes and y=x, Rotations of 90o, Composition of transformations, Dilations
18.2, 18.3 CFA: Lesson 1
CC.9‐12.G.CO.2 Represent transformations in the plane using, e.g., transparencies and geometry software; describe transformations as functions that take points in the plane as inputs and give other points as outputs. Compare transformations that preserve distance and angle to those that do not (e.g., translation versus horizontal stretch).
CC.9‐12.G.CO.4 Develop definitions of rotations, reflections, and translations in terms of angles, circles, perpendicular lines, parallel lines, and line segments.
CC.9‐12.G.CO.5 Given a geometric figure and a rotation, reflection, or translation, draw the transformed figure using, e.g., graph paper, tracing paper, or geometry software. Specify a sequence of transformations that will carry a given figure onto another.
CC.9‐12.G.CO.6 Use geometric descriptions of rigid motions to transform figures and to predict the effect of a given rigid motion on a given figure; given two figures, use the definition of congruence in terms of rigid motions to decide if they are congruent.
CC.9‐12.G.CO.7 Use the definition of congruence in terms of rigid motions to show that two triangles are congruent if and only if corresponding pairs of sides and corresponding pairs of angles are congruent.
CC.9‐12.G.CO.12 Make formal geometric constructions with a variety of tools and methods (compass and straightedge, string, reflective devices, paper folding, dynamic geometric software, etc.).
CC.9‐12.G.SRT.1 Verify experimentally the properties of dilations given by a center and a scale factor.
CC.9‐12.G.GPE.6 Find the point on a directed line segment between two given points that partitions the segment in a given ratio.

GRADE 9‐12 MATHEMATICS CURRICULUM PLANEGEOMETRY–H
Waterford Public Schools 485
III. ReasoningandProof
Unwrapped Unit Resources (Chapter.Section) Assessment Common Core State Standards
(http://www.corestandards.org/the‐standards/mathematics)
Lesson 1: Triangles, Complementary, Supplementary, and Vertical Angles 9.4, 4.2
CC.9‐12.G.CO.12 Make formal geometric constructions with a variety of tools and methods (compass and straightedge, string, reflective devices, paper folding, dynamic geometric software, etc.).
CC.9‐12.G.SRT.7 Explain and use the relationship between the sine and cosine of complementary angles.
Lesson 2: Perpendiculars 4.4, 8.1, 8.2 CC.9‐12.G.CO.12 Make formal geometric constructions with a variety of tools
and methods (compass and straightedge, string, reflective devices, paper folding, dynamic geometric software, etc.).
Lesson 3: Conditional Statements & Logic 4.8
Lesson 4: Algebraic Proof and Assumptions from a diagram 4.5 CFA: Lesson 1
to Lesson 3 CC.9‐12.G.CO.9 Prove theorems about lines and angles.
Lesson 5: Proving Segment and Angle Relationships 4.6, 4.9
Unit Assessment CFA Lesson 1 – Lesson 5
CC.9‐12.G.CO.9 Prove theorems about lines and angles.CC.9‐12.G.CO.12 Make formal geometric constructions with a variety of tools
and methods (compass and straightedge, string, reflective devices, paper folding, dynamic geometric software, etc.).
QuarterTwo
IV. CongruentTriangles
Unwrapped Unit Resources (Chapter.Section) Assessment Common Core State Standards
(http://www.corestandards.org/the‐standards/mathematics)
Lesson 1: Congruent Triangles with Geometer’s Sketchpad 5.2
CC.9‐12.G.CO.7 Use the definition of congruence in terms of rigid motions to show that two triangles are congruent if and only if corresponding pairs of sides and corresponding pairs of angles are congruent.
CC.9‐12.G.CO.10 Prove theorems about triangles. CC.9‐12.G.SRT.5 Use congruence and similarity criteria for triangles to solve
problems and to prove relationships in geometric figures.

GRADE 9‐12 MATHEMATICS CURRICULUM PLANEGEOMETRY–H
Waterford Public Schools 486
Unwrapped Unit Resources (Chapter.Section) Assessment Common Core State Standards
(http://www.corestandards.org/the‐standards/mathematics)
Lesson 2: Proving Triangles Congruent 5.3 CFA: Lesson 1 to Lesson 2
CC.9‐12.G.CO.10 Prove theorems about triangles.CC.9‐12.G.CO.12 Make formal geometric constructions with a variety of tools
and methods (compass and straightedge, string, reflective devices, paper folding, dynamic geometric software, etc.).
CC.9‐12.G.SRT.5 Use congruence and similarity criteria for triangles to solve problems and to prove relationships in geometric figures.
Lesson 3: Triangles and Coordinate Proof 5.4, 5.5, 5.9
CC.9‐12.G.CO.10 Prove theorems about triangles.CC.9‐12.G.GPE.4 Use coordinates to prove simple geometric theorems
algebraically.
Lesson 4: Isosceles and Equilateral Triangles 5.7
CC.9‐12.G.CO.10 Prove theorems about triangles.CC.9‐12.G.CO.12 Make formal geometric constructions with a variety of tools
and methods (compass and straightedge, string, reflective devices, paper folding, dynamic geometric software, etc.).
Lesson 5: Bisectors, Medians, and Altitudes of Triangles 5.10
Unit Assessment CFA Lesson 1 – Lesson 5
CC.9‐12.G.CO.9 Prove theorems about lines and angles.CC.9‐12.G.CO.10 Prove theorems about triangles. CC.9‐12.G.MG.3 Apply geometric methods to solve design problems (e.g.,
designing an object or structure to satisfy physical constraints or minimize cost; working with typographic grid systems based on ratios).
V. IndirectProofsandGeometricInequalities
Unwrapped Unit Resources (Chapter.Section) Assessment Common Core State Standards
(http://www.corestandards.org/the‐standards/mathematics)
Lesson 1: Indirect Proofs 6.2 CC.9‐12.G.CO.9 Prove theorems about lines and angles.CC.9‐12.G.CO.10 Prove theorems about triangles. CC.9‐12.G.CO.11 Prove theorems about parallelograms.
Lesson 2: Parts Theorem and Exterior Angles of Triangles 7.3, 7.4 CC.9‐12.G.CO.10 Prove theorems about triangles.
Lesson 3: Inequalities in One Triangle and Triangle Inequality Theorem 7.5, 7.6
CC.9‐12.G.CO.10 Prove theorems about triangles.CC.9‐12.G.MG.3 Apply geometric methods to solve design problems (e.g.,
designing an object or structure to satisfy physical constraints or minimize cost; working with typographic grid systems based on ratios).

GRADE 9‐12 MATHEMATICS CURRICULUM PLANEGEOMETRY–H
Waterford Public Schools 487
Unwrapped Unit Resources (Chapter.Section) Assessment Common Core State Standards
(http://www.corestandards.org/the‐standards/mathematics)
Lesson 4: Inequalities in Two Triangles 7.7
Unit Assessment CFA Lesson 1‐
4
CC.9‐12.G.CO.10 Prove theorems about triangles.
QuarterThree
VI. ParallelLinesandParallelograms
Unwrapped Unit Resources (Chapter.Section) Assessment Common Core State Standards
(http://www.corestandards.org/the‐standards/mathematics)
Lesson 1: Parallel Lines and Transversals 9.2
CC.9‐12.G.CO.1 Know precise definitions of angle, circle, perpendicular line, parallel line, and line segment, based on the undefined notions of point, line, distance along a line, and distance around a circular arc.
Lesson 2: Angles and Parallel Lines 9.3
CC.9‐12.G.CO.1 Know precise definitions of angle, circle, perpendicular line, parallel line, and line segment, based on the undefined notions of point, line, distance along a line, and distance around a circular arc.
CC.9‐12.G.CO.9 Prove theorems about lines and angles.
Lesson 3: Proving Lines Parallel 9.1 CFA: Lesson 1 to Lesson 3
CC.9‐12.G.CO.9 Prove theorems about lines and angles.CC.9‐12.G.CO.12 Make formal geometric constructions with a variety of tools
and methods (compass and straightedge, string, reflective devices, paper folding, dynamic geometric software, etc.).
Lesson 4: Angles of triangles 9.4 CC.9‐12.G.CO.10 Prove theorems about triangles.
Lesson 5: Angles of polygons 16.1, 16.2 CC.9‐12.G.MG.1 Use geometric shapes, their measures, and their properties to
describe objects (e.g., modeling a tree trunk or a human torso as a cylinder).
Lesson 6: Properties of Parallelograms 9.5 CC.9‐12.G.CO.11 Prove theorems about parallelograms.CC.9‐12.G.GPE.4
Lesson 7: Proving Quadrilaterals to be Parallelograms 9.5
CC.9‐12.G.CO.11 Prove theorems about parallelograms.CC.9‐12.G.CO.12 Make formal geometric constructions with a variety of tools
and methods (compass and straightedge, string, reflective
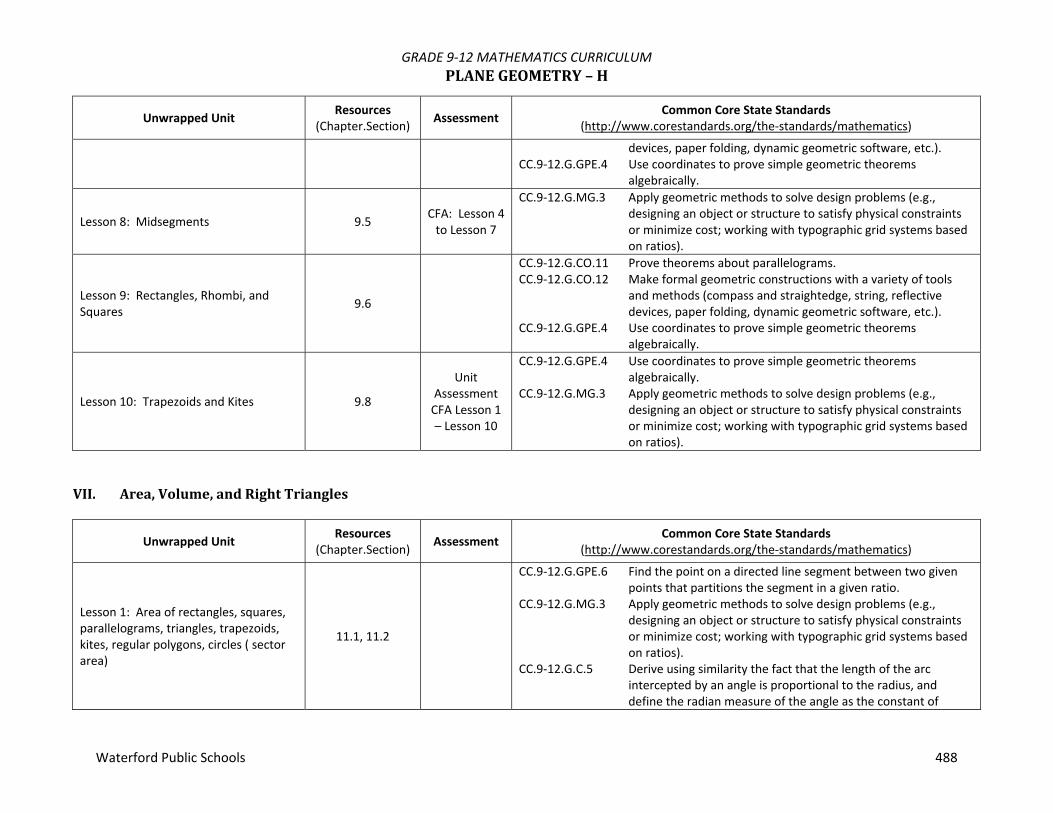
GRADE 9‐12 MATHEMATICS CURRICULUM PLANEGEOMETRY–H
Waterford Public Schools 488
Unwrapped Unit Resources (Chapter.Section) Assessment Common Core State Standards
(http://www.corestandards.org/the‐standards/mathematics)
devices, paper folding, dynamic geometric software, etc.).CC.9‐12.G.GPE.4 Use coordinates to prove simple geometric theorems
algebraically.
Lesson 8: Midsegments 9.5 CFA: Lesson 4 to Lesson 7
CC.9‐12.G.MG.3 Apply geometric methods to solve design problems (e.g., designing an object or structure to satisfy physical constraints or minimize cost; working with typographic grid systems based on ratios).
Lesson 9: Rectangles, Rhombi, and Squares 9.6
CC.9‐12.G.CO.11 Prove theorems about parallelograms.CC.9‐12.G.CO.12 Make formal geometric constructions with a variety of tools
and methods (compass and straightedge, string, reflective devices, paper folding, dynamic geometric software, etc.).
CC.9‐12.G.GPE.4 Use coordinates to prove simple geometric theorems algebraically.
Lesson 10: Trapezoids and Kites 9.8
Unit Assessment CFA Lesson 1 – Lesson 10
CC.9‐12.G.GPE.4 Use coordinates to prove simple geometric theorems algebraically.
CC.9‐12.G.MG.3 Apply geometric methods to solve design problems (e.g., designing an object or structure to satisfy physical constraints or minimize cost; working with typographic grid systems based on ratios).
VII. Area,Volume,andRightTriangles
Unwrapped Unit Resources (Chapter.Section) Assessment Common Core State Standards
(http://www.corestandards.org/the‐standards/mathematics)
Lesson 1: Area of rectangles, squares, parallelograms, triangles, trapezoids, kites, regular polygons, circles ( sector area)
11.1, 11.2
CC.9‐12.G.GPE.6 Find the point on a directed line segment between two given points that partitions the segment in a given ratio.
CC.9‐12.G.MG.3 Apply geometric methods to solve design problems (e.g., designing an object or structure to satisfy physical constraints or minimize cost; working with typographic grid systems based on ratios).
CC.9‐12.G.C.5 Derive using similarity the fact that the length of the arc intercepted by an angle is proportional to the radius, and define the radian measure of the angle as the constant of

GRADE 9‐12 MATHEMATICS CURRICULUM PLANEGEOMETRY–H
Waterford Public Schools 489
Unwrapped Unit Resources (Chapter.Section) Assessment Common Core State Standards
(http://www.corestandards.org/the‐standards/mathematics)
proportionality; derive the formula for the area of a sector.CC.9‐12.G.GMD.1 Give an informal argument for the formulas for the
circumference of a circle, area of a circle, volume of a cylinder, pyramid, and cone.
Lesson 2: Volume of prisms, pyramids, cylinders, cones, and spheres
19.1, 19.2, 19.3, 19.4, 19.5
CFA: Lesson 1 to Lesson 2
CC.9‐12.G.GMD.1 Give an informal argument for the formulas for the circumference of a circle, area of a circle, volume of a cylinder, pyramid, and cone.
CC.9‐12.G.GMD.3 Use volume formulas for cylinders, pyramids, cones, and spheres to solve problems.
CC.9‐12.G.MG.2 Apply concepts of density based on area and volume in modeling situations (e.g., persons per square mile, BTUs per cubic foot).
CC.9‐12.G.MG.3 Apply geometric methods to solve design problems (e.g., designing an object or structure to satisfy physical constraints or minimize cost; working with typographic grid systems based on ratios).
Lesson 3: Pythagorean Theorem and its Converse 11.3
CC.9‐12.G.SRT.8 Use trigonometric ratios and the Pythagorean Theorem to solve right triangles in applied problems.
CC.9‐12.G.MG.3 Apply geometric methods to solve design problems (e.g., designing an object or structure to satisfy physical constraints or minimize cost; working with typographic grid systems based on ratios).
Lesson 4: Special Right Triangles 11.4
Unit Assessment CFA Lesson 1
‐ 4
CC.9‐12.G.SRT.6 Understand that by similarity, side ratios in right triangles are properties of the angles in the triangle, leading to definitions of trigonometric ratios for acute angles.

GRADE 9‐12 MATHEMATICS CURRICULUM PLANEGEOMETRY–H
Waterford Public Schools 490
QuarterFour
VIII. ProportionsandSimilarity
Unwrapped Unit Resources (Chapter.Section) Assessment Common Core State Standards
(http://www.corestandards.org/the‐standards/mathematics)
Lesson 1: Ratios and Proportions 12.1
CC.9‐12.G.MG.3 Apply geometric methods to solve design problems (e.g., designing an object or structure to satisfy physical constraints or minimize cost; working with typographic grid systems based on ratios).
Lesson 2: Similar Polygons and Triangles 12.2, 12.4
CC.9‐12.G.SRT.2 Given two figures, use the definition of similarity in terms of similarity transformations to decide if they are similar; explain using similarity transformations the meaning of similarity for triangles as the equality of all corresponding pairs of angles and the proportionality of all corresponding pairs of sides.
CC.9‐12.G.SRT.3 Use the properties of similarity transformations to establish the AA criterion for two triangles to be similar.
CC.9‐12.G.SRT.4 Prove theorems about triangles. CC.9‐12.G.SRT.5 Use congruence and similarity criteria for triangles to solve
problems and to prove relationships in geometric figures.
Lesson 3: SSS and SAS Similarity 12.4 CFA: Lesson 1 to Lesson 3
CC.9‐12.G.SRT.2 Given two figures, use the definition of similarity in terms of similarity transformations to decide if they are similar; explain using similarity transformations the meaning of similarity for triangles as the equality of all corresponding pairs of angles and the proportionality of all corresponding pairs of sides.
CC.9‐12.G.SRT.3 Use the properties of similarity transformations to establish the AA criterion for two triangles to be similar.
CC.9‐12.G.SRT.4 Prove theorems about triangles. CC.9‐12.G.SRT.5 Use congruence and similarity criteria for triangles to solve
problems and to prove relationships in geometric figures.
Lesson 4: Segments Divided Proportionally 12.3
CC.9‐12.G.CO.10 Prove theorems about triangles.CC.9‐12.G.CO.12 Make formal geometric constructions with a variety of tools
and methods (compass and straightedge, string, reflective devices, paper folding, dynamic geometric software, etc.).
CC.9‐12.G.SRT.4 Prove theorems about triangles. CC.9‐12.G.SRT.5 Use congruence and similarity criteria for triangles to solve
problems and to prove relationships in geometric figures.

GRADE 9‐12 MATHEMATICS CURRICULUM PLANEGEOMETRY–H
Waterford Public Schools 491
Unwrapped Unit Resources (Chapter.Section) Assessment Common Core State Standards
(http://www.corestandards.org/the‐standards/mathematics)
CC.9‐12.G.SRT.6 Understand that by similarity, side ratios in right triangles are properties of the angles in the triangle, leading to definitions of trigonometric ratios for acute angles.
Lesson 5: Geometric Mean and the Altitude to the Hypotenuse 12.5
CC.9‐12.G.SRT.4 Prove theorems about triangles.CC.9‐12.G.SRT.5 Use congruence and similarity criteria for triangles to solve
problems and to prove relationships in geometric figures.
IX. RightTrianglesandTrigonometry
Unwrapped Unit Resources (Chapter.Section) Assessment Common Core State Standards
(http://www.corestandards.org/the‐standards/mathematics)
Lesson 1: Right Triangle Trigonometry 17.1
CC.9‐12.G.SRT.6 Understand that by similarity, side ratios in right triangles are properties of the angles in the triangle, leading to definitions of trigonometric ratios for acute angles.
CC.9‐12.G.SRT.7 Explain and use the relationship between the sine and cosine of complementary angles.
CC.9‐12.G.SRT.8 Use trigonometric ratios and the Pythagorean Theorem to solve right triangles in applied problems.
Lesson 2: Angles of Elevation and Depression 17.2 CC.9‐12.G.SRT.8 Use trigonometric ratios and the Pythagorean Theorem to solve
right triangles in applied problems.
Lesson 3: Bearing Examples and System Examples with Trigonometry Supplement
Unit Assessment CFA Lesson 1 – Lesson 3
CC.9‐12.G.SRT.8 Use trigonometric ratios and the Pythagorean Theorem to solve right triangles in applied problems.
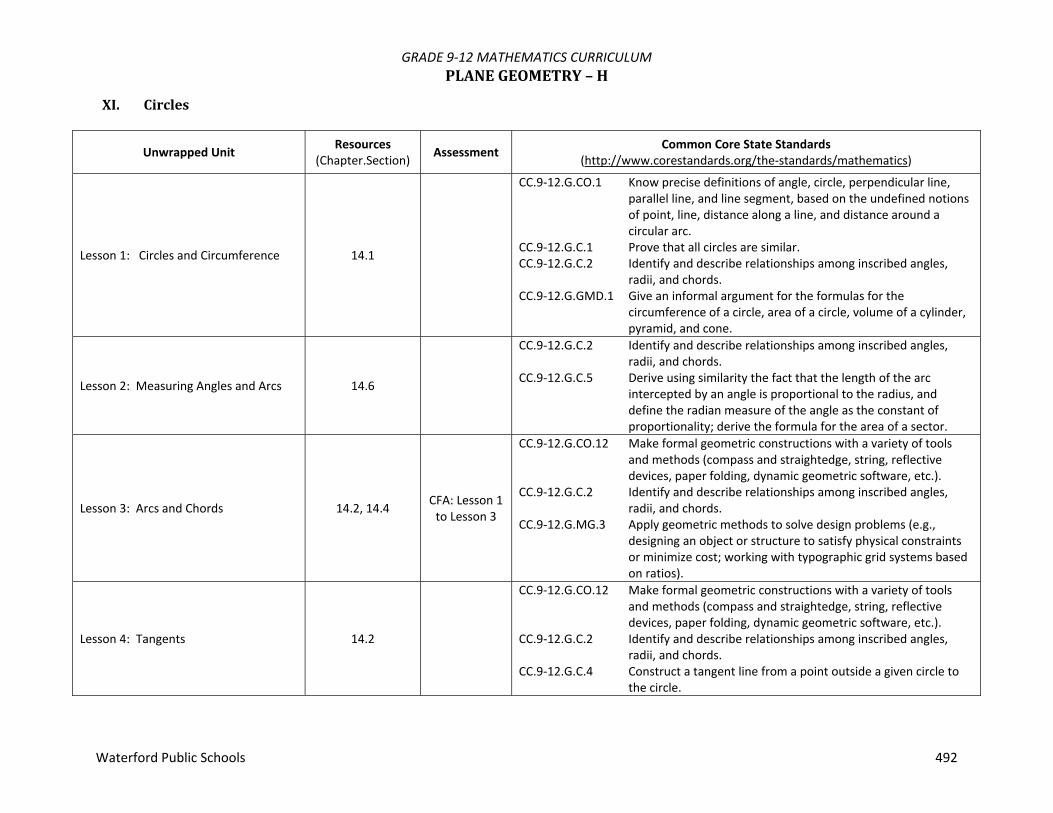
GRADE 9‐12 MATHEMATICS CURRICULUM PLANEGEOMETRY–H
Waterford Public Schools 492
XI. Circles
Unwrapped Unit Resources (Chapter.Section) Assessment Common Core State Standards
(http://www.corestandards.org/the‐standards/mathematics)
Lesson 1: Circles and Circumference 14.1
CC.9‐12.G.CO.1 Know precise definitions of angle, circle, perpendicular line, parallel line, and line segment, based on the undefined notions of point, line, distance along a line, and distance around a circular arc.
CC.9‐12.G.C.1 Prove that all circles are similar. CC.9‐12.G.C.2 Identify and describe relationships among inscribed angles,
radii, and chords. CC.9‐12.G.GMD.1 Give an informal argument for the formulas for the
circumference of a circle, area of a circle, volume of a cylinder, pyramid, and cone.
Lesson 2: Measuring Angles and Arcs 14.6
CC.9‐12.G.C.2 Identify and describe relationships among inscribed angles, radii, and chords.
CC.9‐12.G.C.5 Derive using similarity the fact that the length of the arc intercepted by an angle is proportional to the radius, and define the radian measure of the angle as the constant of proportionality; derive the formula for the area of a sector.
Lesson 3: Arcs and Chords 14.2, 14.4 CFA: Lesson 1 to Lesson 3
CC.9‐12.G.CO.12 Make formal geometric constructions with a variety of tools and methods (compass and straightedge, string, reflective devices, paper folding, dynamic geometric software, etc.).
CC.9‐12.G.C.2 Identify and describe relationships among inscribed angles, radii, and chords.
CC.9‐12.G.MG.3 Apply geometric methods to solve design problems (e.g., designing an object or structure to satisfy physical constraints or minimize cost; working with typographic grid systems based on ratios).
Lesson 4: Tangents 14.2
CC.9‐12.G.CO.12 Make formal geometric constructions with a variety of tools and methods (compass and straightedge, string, reflective devices, paper folding, dynamic geometric software, etc.).
CC.9‐12.G.C.2 Identify and describe relationships among inscribed angles, radii, and chords.
CC.9‐12.G.C.4 Construct a tangent line from a point outside a given circle to the circle.

GRADE 9‐12 MATHEMATICS CURRICULUM PLANEGEOMETRY–H
Waterford Public Schools 493
Unwrapped Unit Resources (Chapter.Section) Assessment Common Core State Standards
(http://www.corestandards.org/the‐standards/mathematics)
Lesson 5: Inscribed Angles 14.5
CC.9‐12.G.C.2 Identify and describe relationships among inscribed angles, radii, and chords.
CC.9‐12.G.C.3 Construct the inscribed and circumscribed circles of a triangle, and prove properties of angles for a quadrilateral inscribed in a circle.
Lesson 6: Secants, Tangents and Angle Measure 14.5 (2) CFA: Lesson 4
to 6 CC.9‐12.G.C.4 Construct a tangent line from a point outside a given circle to
the circle.
Lesson 7: Special Segments in a Circle 14.7
Unit Assessment CFA Lesson 1 – Lesson 7
CC.9‐12.G.C.4 Construct a tangent line from a point outside a given circle to the circle.

GRADE 9‐12 MATHEMATICS CURRICULUM ALGEBRAI–SPARTII
Waterford Public Schools 494
This course is a continuation of the Algebra I – S course. This course covers forms of linear equations and inequalities coordinate geometry, quadratic equations and their solutions, and right triangle trigonometry. This course may not be taken concurrently with or following Algebra II – A. Recommendation: May be taken concurrently with Plan Geometry – S during the junior year with a grade of B‐ or better in Algebra I – S and with department head approval. Essential Questions
1. How can you use equations, inequalities, and linear systems to solve real life problems? 2. What techniques can you use to factor and solve polynomial equations? 3. How do you solve a quadratic equation? 4. How are quadratic functions and their graphs related? 5. When will you ever use quadratic equations in real life?
Course #: WMS005 Prerequisite: Successful completion of Credit: 1 credit Resources: www.connected.mcgraw‐hill.com

GRADE 9‐12 MATHEMATICS CURRICULUM ALGEBRAI–SPARTII
Waterford Public Schools 495
QuarterOneI. ReinforcementUnit
Unwrapped Unit Resources (Chapter.Section) Assessment Common Core State Standards
(http://www.corestandards.org/the‐standards/mathematics)
*Lesson 1: Order of Operations, Evaluating, and Math Expressions
Extra Practice 1.1, 1.2, 1.3
CC.9‐12.A.SSE.1a Interpret parts of an expression, such as terms, factors, and coefficients.
CC.9‐12.A.SSE.1b Interpret complicated expressions by viewing one or more of their parts as a single entity.
CC.9‐12.A.SSE.2 Use the structure of an expression to identify ways to rewrite it.
*Lesson 2:Distributive Property, Simplifying, Solving Multi‐Step Equations, and Relations
Extra Practice 1.4, 1.5, 1.6
CFA 1.1 – 1.6
CC.9‐12.A.SSE.1a Interpret parts of an expression, such as terms, factors, and coefficients.
CC.9‐12.A.SSE.2 Use the structure of an expression to identify ways to rewrite it.
CC.9‐12.A.CED.1 Create equations and inequalities in one variable and use them to solve problems.
CC.9‐12.A.REI.1 Explain each step in solving a simple equation as following from the equality of numbers asserted at the previous step, starting from the assumption that the original equation has a solution. Construct a viable argument to justify a solution method.
CC.9‐12.A.REI.3 Solve linear equations and inequalities in one variable, including equations with coefficients represented by letters.
*Lesson 3:Functions, Writing Equations Extra Practice 1.7, 2.1
CC.9‐12.A.REI.10 Understand that the graph of an equation in two variables is the set of all its solutions plotted in the coordinate plane, often forming a curve (which could be a line).
CC.9‐12.A.F.IF.1 Understand that a function from one set (called the domain) to another set (called the range) assigns to each element of the domain exactly one element of the range. If f is a function and x is an element of its domain, then f(x) denotes the output of f corresponding to the input x. The graph of f is the graph of the equation y = f(x).
CC.9‐12.A.F.IF.2 Use function notation, evaluate functions for inputs in their domains, and interpret statements that use function notation in terms of a context.
CC.9‐12.A.F.IF.5 Relate the domain of a function to its graph and, where

GRADE 9‐12 MATHEMATICS CURRICULUM ALGEBRAI–SPARTII
Waterford Public Schools 496
Unwrapped Unit Resources (Chapter.Section) Assessment Common Core State Standards
(http://www.corestandards.org/the‐standards/mathematics)
applicable, to the quantitative relationship it describes.CC.9‐12.A.F.IF.9 Compare properties of two functions each represented in a
different way (algebraically, graphically, numerically in tables, or by verbal descriptions).
CC.9‐12.A.F.BF.1a Determine an explicit expression, a recursive process, or steps for calculation from a context.
CC.9‐12.A.CED.1 Create equations and inequalities in one variable and use them to solve problems.
*Lesson 4:Ratio & Proportion, Literal Equations, Solving Linear Equations
Extra Practice 2.6, 2.8, 3.2
CFA 1.7, 2.1, 2.6, 2.8, 3.2
CC.9‐12.A.REI.1 Explain each step in solving a simple equation as following from the equality of numbers asserted at the previous step, starting from the assumption that the original equation has a solution. Construct a viable argument to justify a solution method.
CC.9‐12.A.REI.3 Solve linear equations and inequalities in one variable, including equations with coefficients represented by letters.
CC.9‐12.A.REI.10 Understand that the graph of an equation in two variables is the set of all its solutions plotted in the coordinate plane, often forming a curve (which could be a line).
CC.9‐12.A.F.IF.7a Graph linear and quadratic functions and show intercepts, maxima, and minima.
CC.9‐12.N.Q.1 Use units as a way to understand problems and to guide the solution of multi‐step problems; choose and interpret units consistently in formulas; choose and interpret the scale and the origin in graphs and data displays.
CC.9‐12.A.CED.1 Create equations and inequalities in one variable and use them to solve problems.
CC.9‐12.A.CED.4 Rearrange formulas to highlight a quantity of interest, using the same reasoning as in solving equations.
Unit Assessment 1.1‐ 1.7, 2.1, 2.6, 2.8, 3.2
* These lessons are reinforcements of previously learned concepts.

GRADE 9‐12 MATHEMATICS CURRICULUM ALGEBRAI–SPARTII
Waterford Public Schools 497
II. ReinforcementUnit,AbsoluteValueEquations,andLinearFunctions
Unwrapped Unit Resources (Chapter.Section) Assessment Common Core State Standards
(http://www.corestandards.org/the‐standards/mathematics)
Lesson 1: Solving & Graphing Equations Involving Absolute Value On number line
2.5 Study Guide & Intervention
CC.9‐12.A.CED.1 Create equations and inequalities in one variable and use them to solve problems.
CC.9‐12.A.REI.1 Explain each step in solving a simple equation as following from the equality of numbers asserted at the previous step, starting from the assumption that the original equation has a solution. Construct a viable argument to justify a solution method.
CC.9‐12.A.REI.3 Solve linear equations and inequalities in one variable, including equations with coefficients represented by letters.
Lesson 2:Family of Linear Functions, Zeros 3.2 CFA 2.5, 3.2
CC.9‐12.F.IF.7a Graph linear and quadratic functions and show intercepts, maxima, and minima.
CC.9‐12.A.CED.1 Create equations and inequalities in one variable and use them to solve problems.
CC.9‐12.A.REI.10 Understand that the graph of an equation in two variables is the set of all its solutions plotted in the coordinate plane, often forming a curve (which could be a line).
*Lesson 3: Graphing Linear Equations, Rate of Change, Slope, Slope‐Intercept Form
Extra Practice 3.1, 3.3, 4.1
CC.9‐12.A.CED.2 Create equations in two or more variables to represent relationships between quantities; graph equations on coordinate axes with labels and scales.
CC.9‐12.A.CED.4 Rearrange formulas to highlight a quantity of interest, using the same reasoning as in solving equations.
CC.9‐12.A.REI.10 Understand that the graph of an equation in two variables is the set of all its solutions plotted in the coordinate plane, often forming a curve (which could be a line).
CC.9‐12.F.IF.4 For a function that models a relationship between two quantities, interpret key features of graphs and tables in terms of the quantities, and sketch graphs showing key features given a verbal description of the relationship.
CC.9‐12.F.IF.6 Calculate and interpret the average rate of change of a function (presented symbolically or as a table) over a specified interval. Estimate the rate of change from a graph.
CC.9‐12.F.IF.7a Graph linear and quadratic functions and show intercepts, maxima, and minima.
CC.9‐12.F.BF.1a Determine an explicit expression, a recursive process, or steps

GRADE 9‐12 MATHEMATICS CURRICULUM ALGEBRAI–SPARTII
Waterford Public Schools 498
Unwrapped Unit Resources (Chapter.Section) Assessment Common Core State Standards
(http://www.corestandards.org/the‐standards/mathematics)
for calculation from a context.CC.9‐12.F.LE.1a Prove that linear functions grow by equal differences over
equal intervals, and that exponential functions grow by equal factors over equal intervals.
CC.9‐12.F.LE.5 Interpret the parameters in a linear or exponential function in terms of a context.
CC.9‐12.S.ID.7 Interpret the slope (rate of change) and the intercept (constant term) of a linear model in the context of the data.
Lesson 4: Direct Variation, *Arithmetic Sequences as Functions
3.4, *Extra Practice 3.5
CC.9‐12.A.CED.2 Create equations in two or more variables to represent relationships between quantities; graph equations on coordinate axes with labels and scales.
CC.9‐12.A.REI.10 Understand that the graph of an equation in two variables is the set of all its solutions plotted in the coordinate plane, often forming a curve (which could be a line).
CC.9‐12.F.IF.3 Recognize that sequences are functions, sometimes defined recursively, whose domain is a subset of the integers.
CC.9‐12.F.IF.7a Graph linear and quadratic functions and show intercepts, maxima, and minima.
CC.9‐12.F.BF.1a Determine an explicit expression, a recursive process, or steps for calculation from a context.
CC.9‐12.F.BF.2 Write arithmetic and geometric sequences both recursively and with an explicit formula, use them to model situations, and translate between the two forms.
CC.9‐12.F.LE.1a Prove that linear functions grow by equal differences over equal intervals, and that exponential functions grow by equal factors over equal intervals.
CC.9‐12.F.LE.1b Recognize situations in which one quantity changes at a constant rate per unit interval relative to another.
CC.9‐12.F.LE.2 Construct linear and exponential functions, including arithmetic and geometric sequences, given a graph, a description of a relationship, or two input‐output pairs (include reading these from a table).
CC.9‐12.F.LE.5 Interpret the parameters in a linear or exponential function in terms of a context.

GRADE 9‐12 MATHEMATICS CURRICULUM ALGEBRAI–SPARTII
Waterford Public Schools 499
Unwrapped Unit Resources (Chapter.Section) Assessment Common Core State Standards
(http://www.corestandards.org/the‐standards/mathematics)
Lesson 5: Proportional & Non‐Proportional Relationships 3.6 CFA 3.1 – 3.6,
omit 3.2, 4.1
CC.9‐12.A.CED.2 Create equations in two or more variables to represent relationships between quantities; graph equations on coordinate axes with labels and scales.
CC.9‐12.F.IF.2 Use function notation, evaluate functions for inputs in their domains, and interpret statements that use function notation in terms of a context.
CC.9‐12.F.IF.9 Compare properties of two functions each represented in a different way (algebraically, graphically, numerically in tables, or by verbal descriptions).
CC.9‐12.F.BF.1a Determine an explicit expression, a recursive process, or steps for calculation from a context.
CC.9‐12.F.LE.1b Recognize situations in which one quantity changes at a constant rate per unit interval relative to another.
CC.9‐12.F.LE.2 Construct linear and exponential functions, including arithmetic and geometric sequences, given a graph, a description of a relationship, or two input‐output pairs (include reading these from a table).
*Lesson 6:Writing Equations in Slope‐Intercept Form, Parallel & Perpendicular Lines
Extra Practice 4.2, 4.4
CC.9‐12.N.Q.1 Use units as a way to understand problems and to guide the solution of multi‐step problems; choose and interpret units consistently in formulas; choose and interpret the scale and the origin in graphs and data displays.
CC.9‐12.A.CED.4 Rearrange formulas to highlight a quantity of interest, using the same reasoning as in solving equations.
CC.9‐12.A.REI.3 Solve linear equations and inequalities in one variable, including equations with coefficients represented by letters.
Unit Assessment 2.5, 3.1‐ 3.6, 4.1, 4.2, 4.4
* These lessons are reinforcements of previously learned concepts.

GRADE 9‐12 MATHEMATICS CURRICULUM ALGEBRAI–SPARTII
Waterford Public Schools 500
QuarterTwo
III. ReinforcementUnit&LinearInequalities
Unwrapped Unit Resources (Chapter.Section) Assessment Common Core State Standards
(http://www.corestandards.org/the‐standards/mathematics)
*Lesson 1: Solving Linear Inequalities Extra Practice 5.1, 5.2, 5.3
CC.9‐12.A.CED.1 Create equations and inequalities in one variable and use them to solve problems.
CC.9‐12.A.REI.3 Solve linear equations and inequalities in one variable, including equations with coefficients represented by letters.
Lesson 2: Solving Compound Inequalities 5.4 CFA 5.1‐ 5.4
CC.9‐12.A.CED.1 Create equations and inequalities in one variable and use them to solve problems.
CC.9‐12.A.REI.3 Solve linear equations and inequalities in one variable, including equations with coefficients represented by letters.
Lesson 3: Solving Absolute Value Inequalities 5.5
CC.9‐12.A.CED.1 Create equations and inequalities in one variable and use them to solve problems.
CC.9‐12.A.REI.3 Solve linear equations and inequalities in one variable, including equations with coefficients represented by letters.
Lesson 4: Graphing Inequalities on Coordinate Plane 5.6 CFA 5.5, 5.6
CC.9‐12.A.CED.1 Create equations and inequalities in one variable and use them to solve problems.
CC.9‐12.A.REI.12 Graph the solutions to a linear inequality in two variables as a half‐plane (excluding the boundary in the case of a strict inequality), and graph the solution set to a system of linear inequalities in two variables as the intersection of the corresponding half‐planes.
Unit
Assessment 5.1 – 5.6
* These lessons are reinforcements of previously learned concepts.

GRADE 9‐12 MATHEMATICS CURRICULUM ALGEBRAI–SPARTII
Waterford Public Schools 501
V. SystemsofLinearEquationsandInequalities
Unwrapped Unit Resources (Chapter.Section) Assessment Common Core State Standards
(http://www.corestandards.org/the‐standards/mathematics)
Lesson 1: Graphing Systems of Equations
6.1 Study Guide & Intervention
CC.9‐12.A.CED.2 Create equations in two or more variables to represent relationships between quantities; graph equations on coordinate axes with labels and scales.
CC.9‐12.A.CED.3 Represent constraints by equations or inequalities, and by systems of equations and/or inequalities, and interpret solutions as viable or nonviable options in a modeling context.
CC.9‐12. A.REI.6 Solve systems of linear equations exactly and approximately (e.g., with graphs), focusing on pairs of linear equations in two variables.
Lesson 2:Substitution Multiple days
6.2 Study Guide & Intervention
CFA 6.1, 6.2
CC.9‐12.A.CED.2 Create equations in two or more variables to represent relationships between quantities; graph equations on coordinate axes with labels and scales.
CC.9‐12.A.CED.3 Represent constraints by equations or inequalities, and by systems of equations and/or inequalities, and interpret solutions as viable or nonviable options in a modeling context.
CC.9‐12. A.REI.6 Solve systems of linear equations exactly and approximately (e.g., with graphs), focusing on pairs of linear equations in two variables.
Lesson 3: Elimination Multiple days
6.3, 6.4 Study Guide & Intervention
CC.9‐12.A.CED.2 Create equations in two or more variables to represent relationships between quantities; graph equations on coordinate axes with labels and scales.
CC.9‐12. A.REI.5 Prove that, given a system of two equations in two variables, replacing one equation by the sum of that equation and a multiple of the other produces a system with the same solutions.
CC.9‐12. A.REI.6 Solve systems of linear equations exactly and approximately (e.g., with graphs), focusing on pairs of linear equations in two variables.

GRADE 9‐12 MATHEMATICS CURRICULUM ALGEBRAI–SPARTII
Waterford Public Schools 502
Unwrapped Unit Resources (Chapter.Section) Assessment Common Core State Standards
(http://www.corestandards.org/the‐standards/mathematics)
Lesson 4:Applying Systems of Linear Equations
6.5 Study Guide & Intervention
CFA 6.3 to 6.5
CC.9‐12.A.CED.2 Create equations in two or more variables to represent relationships between quantities; graph equations on coordinate axes with labels and scales.
CC.9‐12. A.REI.6 Solve systems of linear equations exactly and approximately (e.g., with graphs), focusing on pairs of linear equations in two variables.
Lesson 5:Systems of Inequalities 6.8
Study Guide & Intervention
CC.9‐12. A.REI.12 Graph the solutions to a linear inequality in two variables as a half‐plane (excluding the boundary in the case of a strict inequality), and graph the solution set to a system of linear inequalities in two variables as the intersection of the corresponding half‐planes.
Unit
Assessment 6.1‐ 6.5, 6.8
QuarterThree
VI. Polynomials
Unwrapped Unit Resources (Chapter.Section) Assessment Common Core State Standards
(http://www.corestandards.org/the‐standards/mathematics)
*Lesson 1: Multiplying & Dividing Monomials, Scientific Notation Multiple days
Extra Practice 7.1, 7.2, 7.3(no operations)
Study Guide & Intervention
CC.9‐12.A.SSE.2 Use the structure of an expression to identify ways to rewrite
it. CC.9‐12.F.IF.8b
*Lesson 2: Polynomials, Adding and Subtracting Polynomials
Extra Practice 7.4, 7.5
CC.9‐12.A.SSE.1a Interpret parts of an expression, such as terms, factors, and coefficients.
CC.9‐12.A.APR.1 Understand that polynomials form a system analogous to the integers, namely, they are closed under the operations of addition, subtraction, and multiplication; add, subtract, and multiply polynomials.

GRADE 9‐12 MATHEMATICS CURRICULUM ALGEBRAI–SPARTII
Waterford Public Schools 503
Unwrapped Unit Resources (Chapter.Section) Assessment Common Core State Standards
(http://www.corestandards.org/the‐standards/mathematics)
*Lesson 3: Multiplying Polynomials Multiple days
Extra Practice 7.6, 7.7, 7.8 CFA 7.1 to 7.8
CC.9‐12.A.APR.1 Understand that polynomials form a system analogous to the integers, namely, they are closed under the operations of addition, subtraction, and multiplication; add, subtract, and multiply polynomials.
*Lesson 4: Monomials and Factoring, : Distributive Property
Extra Practice 8.1, 8.2 Distributive Property only
CC.9‐12.A.SSE.2 Use the structure of an expression to identify ways to rewrite it.
CC.9‐12.A.SSE.3a Factor a quadratic expression to reveal the zeros of the function it defines.
Lesson 5: Factoring by Grouping 8.2 Factoring by Grouping only CFA 8.1, 8.2
CC.9‐12.A.SSE.2 Use the structure of an expression to identify ways to rewrite it.
CC.9‐12.A.SSE.3a Factor a quadratic expression to reveal the zeros of the function it defines.
*Lesson 6: Factoring & Solving Quadratic Equations Multiple days
Extra Practice 8.3, 8.4
CC.9‐12.A.SSE.2 Use the structure of an expression to identify ways to rewrite it.
CC.9‐12.A.SSE.3a Factor a quadratic expression to reveal the zeros of the function it defines.
CC.9‐12.A.CED.2 Create equations in two or more variables to represent relationships between quantities; graph equations on coordinate axes with labels and scales.
CC.9‐12. A.REI.1 Explain each step in solving a simple equation as following from the equality of numbers asserted at the previous step, starting from the assumption that the original equation has a solution. Construct a viable argument to justify a solution method.
CC.9‐12. A.REI.4b Solve quadratic equations by inspection (e.g., for x2 = 49), taking square roots, completing the square, the quadratic formula and factoring, as appropriate to the initial form of the equation. Recognize when the quadratic formula gives complex solutions and write them as a ± bi for real numbers a and b.
*Lesson 7: Difference of Two Squares, Perfect Square Trinomials, & Solving Quadratic Equations Multiple days
Extra Practice 8.5, 8.6 CFA 8.3‐ 8.6
CC.9‐12.A.SSE.2 Use the structure of an expression to identify ways to rewrite it.
CC.9‐12.A.SSE.3a Factor a quadratic expression to reveal the zeros of the function it defines.
CC.9‐12.A.CED.2 Create equations in two or more variables to represent relationships between quantities; graph equations on coordinate axes with labels and scales.

GRADE 9‐12 MATHEMATICS CURRICULUM ALGEBRAI–SPARTII
Waterford Public Schools 504
Unwrapped Unit Resources (Chapter.Section) Assessment Common Core State Standards
(http://www.corestandards.org/the‐standards/mathematics)
CC.9‐12. A.REI.1 Explain each step in solving a simple equation as following from the equality of numbers asserted at the previous step, starting from the assumption that the original equation has a solution. Construct a viable argument to justify a solution method.
CC.9‐12. A.REI.4b Solve quadratic equations by inspection (e.g., for x2 = 49), taking square roots, completing the square, the quadratic formula and factoring, as appropriate to the initial form of the equation. Recognize when the quadratic formula gives complex solutions and write them as a ± bi for real numbers a and b.
Unit Assessment 7.1‐7.8, 8.1‐
8.6
* These lessons are reinforcements of previously learned concepts.
VII. Probability&Statistics
Unwrapped Unit Resources (Chapter.Section) Assessment Common Core State Standards
(http://www.corestandards.org/the‐standards/mathematics)
*Lesson 1: Measures of Central Tendency
Practice & Extra Practice 12.2
CC.9‐12.S.ID.2 Use statistics appropriate to the shape of the data distribution to compare center (median, mean) and spread (interquartile range, standard deviation) of two or more different data sets.
*Lesson 2: Permutations and Combinations
Practice& Extra Practice 12.4
CFA 12.2, 12.4
CC.9‐12.S.ID.2 Use statistics appropriate to the shape of the data distribution to compare center (median, mean) and spread (interquartile range, standard deviation) of two or more different data sets.
*Lesson 3: Probability of Compound Events
Practice & Extra Practice 12.5
CC.9‐12.S.ID.2 Use statistics appropriate to the shape of the data distribution to compare center (median, mean) and spread (interquartile range, standard deviation) of two or more different data sets.
Unit Assessment 12.2, 12.4,
12.5
* These lessons are reinforcements of previously learned concepts.

GRADE 9‐12 MATHEMATICS CURRICULUM ALGEBRAI–SPARTII
Waterford Public Schools 505
QuarterFour
VIII. QuadraticFunctions
Unwrapped Unit Resources (Chapter.Section) Assessment Common Core State Standards
(http://www.corestandards.org/the‐standards/mathematics)
Lesson 1:Graphing Quadratic Functions Multiple days
9.1 Study Guide and Intervention
CC.9‐12.A.SSE.1a Interpret parts of an expression, such as terms, factors, and coefficients.
CC.9‐12.A.CED.2 Create equations in two or more variables to represent relationships between quantities; graph equations on coordinate axes with labels and scales.
CC.9‐12.A.REI.10 Understand that the graph of an equation in two variables is the set of all its solutions plotted in the coordinate plane, often forming a curve (which could be a line).
CC.9‐12.F.IF.2 Use function notation, evaluate functions for inputs in their domains, and interpret statements that use function notation in terms of a context.
CC.9‐12.F.IF.4 For a function that models a relationship between two quantities, interpret key features of graphs and tables in terms of the quantities, and sketch graphs showing key features given a verbal description of the relationship.
CC.9‐12.F.IF.5 Relate the domain of a function to its graph and, where applicable, to the quantitative relationship it describes.
CC.9‐12.F.IF.7a Graph linear and quadratic functions and show intercepts, maxima, and minima.
CC.9‐12.F.IF.9 Compare properties of two functions each represented in a different way (algebraically, graphically, numerically in tables, or by verbal descriptions).
Lesson 2:Solving Quadratic Functions by Graphing no approximating roots
9.2 Study Guide and Intervention
CFA 9.1, 9.2
CC.9‐12.A.CED.2 Create equations in two or more variables to represent relationships between quantities; graph equations on coordinate axes with labels and scales.
CC.9‐12.A.REI.4b Solve quadratic equations by inspection (e.g., for x2 = 49), taking square roots, completing the square, the quadratic formula and factoring, as appropriate to the initial form of the equation. Recognize when the quadratic formula gives complex solutions and write them as a ± bi for real numbers a and b.
CC.9‐12.F.IF.7a Graph linear and quadratic functions and show intercepts,

GRADE 9‐12 MATHEMATICS CURRICULUM ALGEBRAI–SPARTII
Waterford Public Schools 506
Unwrapped Unit Resources (Chapter.Section) Assessment Common Core State Standards
(http://www.corestandards.org/the‐standards/mathematics)
maxima, and minima.CC.9‐12.F.IF.8a Use the process of factoring and completing the square in a
quadratic function to show zeros, extreme values, and symmetry of the graph, and interpret these in terms of a context.
Lesson 3:Transformations of Quadratic Functions Multiple days
9.3 Study Guide and Intervention
CC.9‐12.A.SSE.3b Complete the square in a quadratic expression to reveal the maximum or minimum value of the function it defines.
CC.9‐12.F.IF.7a Graph linear and quadratic functions and show intercepts, maxima, and minima.
CC.9‐12.F.IF.8a Use the process of factoring and completing the square in a quadratic function to show zeros, extreme values, and symmetry of the graph, and interpret these in terms of a context.
CC.9‐12.F.IF.9 Compare properties of two functions each represented in a different way (algebraically, graphically, numerically in tables, or by verbal descriptions).
CC.9‐12.F.BF.1b Combine standard function types using arithmetic operations. CC.9‐12.F.BF.3 Identify the effect on the graph of replacing f(x) by f(x) + k, k
f(x), f(kx), and f(x + k) for specific values of k (both positive and negative); find the value of k given the graphs. Experiment with cases and illustrate an explanation of the effects on the graph using technology. Include recognizing even and odd functions from their graphs and algebraic expressions for them.
Lesson 4: Solving Quadratic Equations by completing the Square, a=1
9.4 Study Guide and Intervention
CC.9‐12.A.SSE.3b Complete the square in a quadratic expression to reveal the maximum or minimum value of the function it defines.
CC.9‐12.A.CED.2 Create equations in two or more variables to represent relationships between quantities; graph equations on coordinate axes with labels and scales.
CC.9‐12.A.REI.4 Solve quadratic equations in one variable. CC.9‐12.F.IF.8a Use the process of factoring and completing the square in a
quadratic function to show zeros, extreme values, and symmetry of the graph, and interpret these in terms of a context.
Lesson 5: Solving Quadratic Equations by Using the Quadratic Formula
9.5Study Guide and CC.9‐12.A.CED.2 Create equations in two or more variables to represent
relationships between quantities; graph equations on

GRADE 9‐12 MATHEMATICS CURRICULUM ALGEBRAI–SPARTII
Waterford Public Schools 507
Unwrapped Unit Resources (Chapter.Section) Assessment Common Core State Standards
(http://www.corestandards.org/the‐standards/mathematics)
Multiple days Intervention coordinate axes with labels and scales.CC.9‐12.A.REI.4 Solve quadratic equations in one variable.
Lesson 6: Solving Quadratic Equations using any method
Extra Practice 9.4, 9.5 CFA 9.4, 9.5
CC.9‐12.A.SSE.3b Complete the square in a quadratic expression to reveal the maximum or minimum value of the function it defines.
CC.9‐12.A.CED.2 Create equations in two or more variables to represent relationships between quantities; graph equations on coordinate axes with labels and scales.
CC.9‐12.A.REI.4 Solve quadratic equations in one variable. CC.9‐12.F.IF.8a Use the process of factoring and completing the square in a
quadratic function to show zeros, extreme values, and symmetry of the graph, and interpret these in terms of a context.
Unit
Assessment 9.1‐ 9.6

GRADE 9‐12 MATHEMATICS CURRICULUM ALGEBRAII–S
Waterford Public Schools 508
This course develops skill and accuracy in algebraic techniques. Skills covered in Intermediate Algebra are reviewed. There is further work on quadratics. An introduction to negative exponents, logarithms, and matrices is also included. Recommendation: Grade of B‐ or better in Algebra I – S Part II. Essential Questions
1. What are the different types of functions? 2. What are the operations that apply to all functions? 3. How can Geometric and Analytic representations be used to describe the behavior of the function? 4. How are the algebraic, numeric, and graphic representations of functions related? 5. How do you add, subtract, multiply and divide polynomials? 6. How do you factor and solve polynomials? 7. What techniques can you use to solve a system of equations? 8. How are polynomials and their graphs related? 9. Will polynomials ever be used in real life?
Course #: 359 Prerequisite: Successful completion of Algebra I – S, Algebra I – S Part II, and Plan Geometry. Seniors Only. Credit: 1 credit Resources:

GRADE 9‐12 MATHEMATICS CURRICULUM ALGEBRAII–S
Waterford Public Schools 509
QuarterOneI. QuadraticFunctionsandEquations
Unwrapped Unit Resources (Chapter.Section) Assessment Common Core State Standards
(http://www.corestandards.org/the‐standards/mathematics)
Lesson 1: Quadratic functions and transformations 4.1, 4.2
CC.9‐12.A.SSE.1a Interpret parts of an expression, such as terms, factors, and coefficients.
CC.9‐12.A.SSE.1b Interpret complicated expressions by viewing one or more of their parts as a single entity.
CC.9‐12.A.CED.2 Create equations in two or more variables to represent relationships between quantities; graph equations on coordinate axes with labels and scales.
CC.9‐12.F.IF.4 For a function that models a relationship between two quantities, interpret key features of graphs and tables in terms of the quantities, and sketch graphs showing key features given a verbal description of the relationship.
CC.9‐12.F.IF.5 Relate the domain of a function to its graph and, where applicable, to the quantitative relationship it describes.
CC.9‐12.F.IF.8 Write a function defined by an expression in different but equivalent forms to reveal and explain different properties of the function.
CC.9‐12.F.IF.8a Use the process of factoring and completing the square in a quadratic function to show zeros, extreme values, and symmetry of the graph, and interpret these in terms of a context.
CC.9‐12.F.IF.9 Compare properties of two functions each represented in a different way (algebraically, graphically, numerically in tables, or by verbal descriptions).
CC.9‐12.F.BF.3 Identify the effect on the graph of replacing f(x) by f(x) + k, k f(x), f(kx), and f(x + k) for specific values of k (both positive and negative); find the value of k given the graphs. Experiment with cases and illustrate an explanation of the effects on the graph using technology. Include recognizing even and odd functions from their graphs and algebraic expressions for them.

GRADE 9‐12 MATHEMATICS CURRICULUM ALGEBRAII–S
Waterford Public Schools 510
Unwrapped Unit Resources (Chapter.Section) Assessment Common Core State Standards
(http://www.corestandards.org/the‐standards/mathematics)
Lesson 2: Modeling quadratic functions 4.3
CC.9‐12.F.IF.4 For a function that models a relationship between two quantities, interpret key features of graphs and tables in terms of the quantities, and sketch graphs showing key features given a verbal description of the relationship.
CC.9‐12.F.IF.5 Relate the domain of a function to its graph and, where applicable, to the quantitative relationship it describes.
Lesson 3: Solving quadratic equations by factoring, square roots 4.4, 4.5 CFA 2.1 to 2.3
CC.9‐12.A.SSE.2 Use the structure of an expression to identify ways to rewrite it.
CC.9‐12.A.CED.1 Create equations and inequalities in one variable and use them to solve problems.
CC.9‐12.F.IF.8a Use the process of factoring and completing the square in a quadratic function to show zeros, extreme values, and symmetry of the graph, and interpret these in terms of a context.
CC.9‐12.A.APR.1 Understand that polynomials form a system analogous to the integers, namely, they are closed under the operations of addition, subtraction, and multiplication; add, subtract, and multiply polynomials.
CC.9‐12.A.APR.3 Identify zeros of polynomials when suitable factorizations are available, and use the zeros to construct a rough graph of the function defined by the polynomial.
CC.9‐12.A.APR.4 Prove polynomial identities and use them to describe numerical relationships.
Lesson 4: Operations on complex numbers 4.8
CC.9‐12.N.CN.1 Know there is a complex number i such that i2 = –1, and every complex number has the form a + bi with a and b real.
CC.9‐12.N.CN.2 Use the relation i2 = –1 and the commutative, associative, and distributive properties to add, subtract, and multiply complex numbers.
CC.9‐12.N.CN.7 Solve quadratic equations with real coefficients that have complex solutions.
CC.9‐12.N.CN.8 Extend polynomial identities to the complex numbers.
Lesson 5: Completing the square (a>1) 4.6
CC.9‐12.A.REI.4b Solve quadratic equations by inspection (e.g., for x2 = 49), taking square roots, completing the square, the quadratic formula and factoring, as appropriate to the initial form of the equation. Recognize when the quadratic formula gives complex
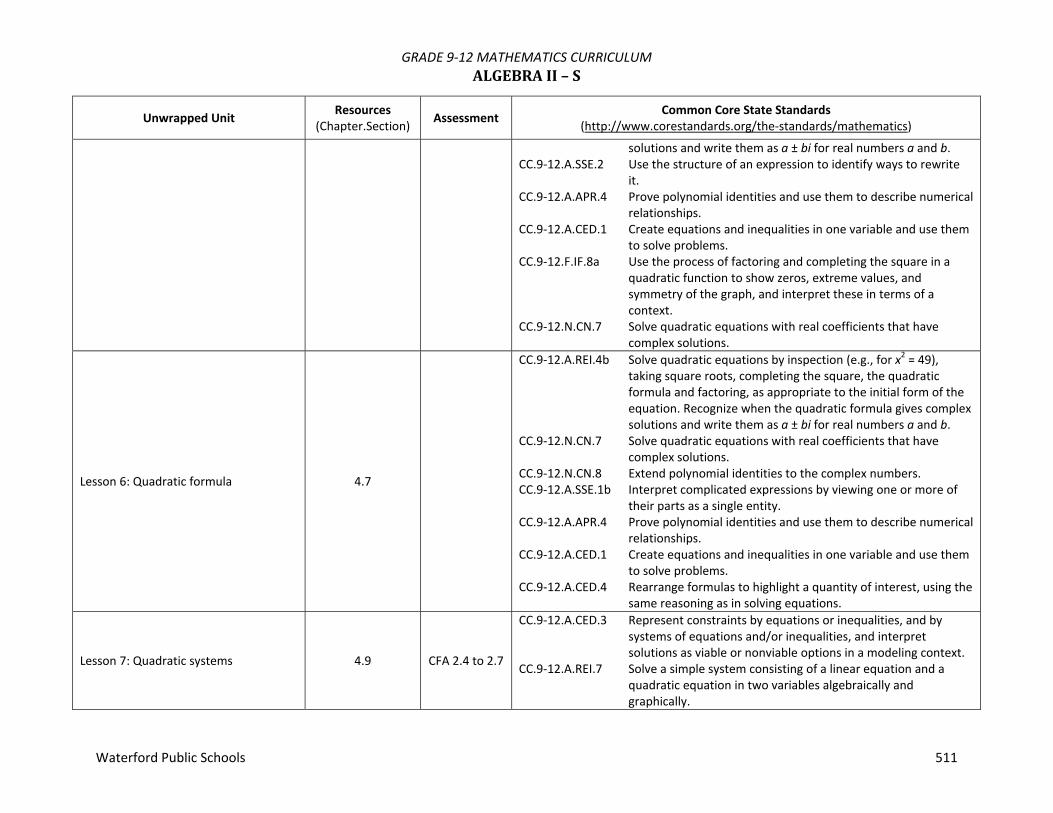
GRADE 9‐12 MATHEMATICS CURRICULUM ALGEBRAII–S
Waterford Public Schools 511
Unwrapped Unit Resources (Chapter.Section) Assessment Common Core State Standards
(http://www.corestandards.org/the‐standards/mathematics)
solutions and write them as a ± bi for real numbers a and b.CC.9‐12.A.SSE.2 Use the structure of an expression to identify ways to rewrite
it. CC.9‐12.A.APR.4 Prove polynomial identities and use them to describe numerical
relationships. CC.9‐12.A.CED.1 Create equations and inequalities in one variable and use them
to solve problems. CC.9‐12.F.IF.8a Use the process of factoring and completing the square in a
quadratic function to show zeros, extreme values, and symmetry of the graph, and interpret these in terms of a context.
CC.9‐12.N.CN.7 Solve quadratic equations with real coefficients that have complex solutions.
Lesson 6: Quadratic formula 4.7
CC.9‐12.A.REI.4b Solve quadratic equations by inspection (e.g., for x2 = 49), taking square roots, completing the square, the quadratic formula and factoring, as appropriate to the initial form of the equation. Recognize when the quadratic formula gives complex solutions and write them as a ± bi for real numbers a and b.
CC.9‐12.N.CN.7 Solve quadratic equations with real coefficients that have complex solutions.
CC.9‐12.N.CN.8 Extend polynomial identities to the complex numbers. CC.9‐12.A.SSE.1b Interpret complicated expressions by viewing one or more of
their parts as a single entity. CC.9‐12.A.APR.4 Prove polynomial identities and use them to describe numerical
relationships. CC.9‐12.A.CED.1 Create equations and inequalities in one variable and use them
to solve problems. CC.9‐12.A.CED.4 Rearrange formulas to highlight a quantity of interest, using the
same reasoning as in solving equations.
Lesson 7: Quadratic systems 4.9 CFA 2.4 to 2.7
CC.9‐12.A.CED.3 Represent constraints by equations or inequalities, and by systems of equations and/or inequalities, and interpret solutions as viable or nonviable options in a modeling context.
CC.9‐12.A.REI.7 Solve a simple system consisting of a linear equation and a quadratic equation in two variables algebraically and graphically.

GRADE 9‐12 MATHEMATICS CURRICULUM ALGEBRAII–S
Waterford Public Schools 512
Unwrapped Unit Resources (Chapter.Section) Assessment Common Core State Standards
(http://www.corestandards.org/the‐standards/mathematics)
CC.9‐12.A.REI.11 Explain why the x‐coordinates of the points where the graphs of the equations y = f(x) and y = g(x) intersect are the solutions of the equation f(x) = g(x); find the solutions approximately, e.g., using technology to graph the functions, make tables of values, or find successive approximations. Include cases where f(x) and/or g(x) are linear, polynomial, rational, absolute value, exponential, and logarithmic functions.
Unit
Assessment Lessons 1 – 7
II. PolynomialsandPolynomialFunctions
Unwrapped Unit Resources (Chapter.Section) Assessment Common Core State Standards
(http://www.corestandards.org/the‐standards/mathematics)
Lesson 1: Polynomial functions 5.1, 5.2
CC.9‐12.A.APR.1 Understand that polynomials form a system analogous to the integers, namely, they are closed under the operations of addition, subtraction, and multiplication; add, subtract, and multiply polynomials.
CC.9‐12.A.APR.3 Identify zeros of polynomials when suitable factorizations are available, and use the zeros to construct a rough graph of the function defined by the polynomial.
CC.9‐12.F.IF.4 For a function that models a relationship between two quantities, interpret key features of graphs and tables in terms of the quantities, and sketch graphs showing key features given a verbal description of the relationship.
CC.9‐12.F.IF.5 Relate the domain of a function to its graph and, where applicable, to the quantitative relationship it describes.
CC.9‐12.F.IF.7c Graph polynomial functions, identifying zeros when suitable factorizations are available, and showing end behavior.
CC.9‐12.F.IF.9 Compare properties of two functions each represented in a different way (algebraically, graphically, numerically in tables, or by verbal descriptions).

GRADE 9‐12 MATHEMATICS CURRICULUM ALGEBRAII–S
Waterford Public Schools 513
Unwrapped Unit Resources (Chapter.Section) Assessment Common Core State Standards
(http://www.corestandards.org/the‐standards/mathematics)
CC.9‐12.A.CED.2 Create equations in two or more variables to represent relationships between quantities; graph equations on coordinate axes with labels and scales.
Lesson 2: Solving polynomial equations 5.3 CFA 3.1 to 3.3
CC.9‐12.A.CED.1 Create equations and inequalities in one variable and use them to solve problems.
CC.9‐12.A.REI.11 Explain why the x‐coordinates of the points where the graphs of the equations y = f(x) and y = g(x) intersect are the solutions of the equation f(x) = g(x); find the solutions approximately, e.g., using technology to graph the functions, make tables of values, or find successive approximations. Include cases where f(x) and/or g(x) are linear, polynomial, rational, absolute value, exponential, and logarithmic functions.
Lesson 3: Dividing polynomials and rational root theorem 5.4, 5.5
CC.9‐12.A.APR.1 Understand that polynomials form a system analogous to the integers, namely, they are closed under the operations of addition, subtraction, and multiplication; add, subtract, and multiply polynomials.
CC.9‐12.A.APR.2 Know and apply the Remainder Theorem: For a polynomial p(x) and a number a, the remainder on division by x – a is p(a), so p(a) = 0 if and only if (x – a) is a factor of p(x).
CC.9‐12.A.APR.6 Rewrite simple rational expressions in different forms; write a(x)/b(x) in the form q(x) + r(x)/b(x), where a(x), b(x), q(x), and r(x) are polynomials with the degree of r(x) less than the degree of b(x), using inspection, long division, or, for the more complicated examples, a computer algebra system.
CC.9‐12.N.CN.7 Solve quadratic equations with real coefficients that have complex solutions.
CC.9‐12.N.CN.8 Extend polynomial identities to the complex numbers.
Lesson 4: Modeling polynomials 5.8
CC.9‐12.F.IF.4 For a function that models a relationship between two quantities, interpret key features of graphs and tables in terms of the quantities, and sketch graphs showing key features given a verbal description of the relationship.
CC.9‐12.F.IF.7c Graph polynomial functions, identifying zeros when suitable factorizations are available, and showing end behavior.
Lesson 5: Transformations of polynomials 5.9 CFA 3.4 to 3.7 CC.9‐12.A.SSE.1b Interpret complicated expressions by viewing one or more of
their parts as a single entity.
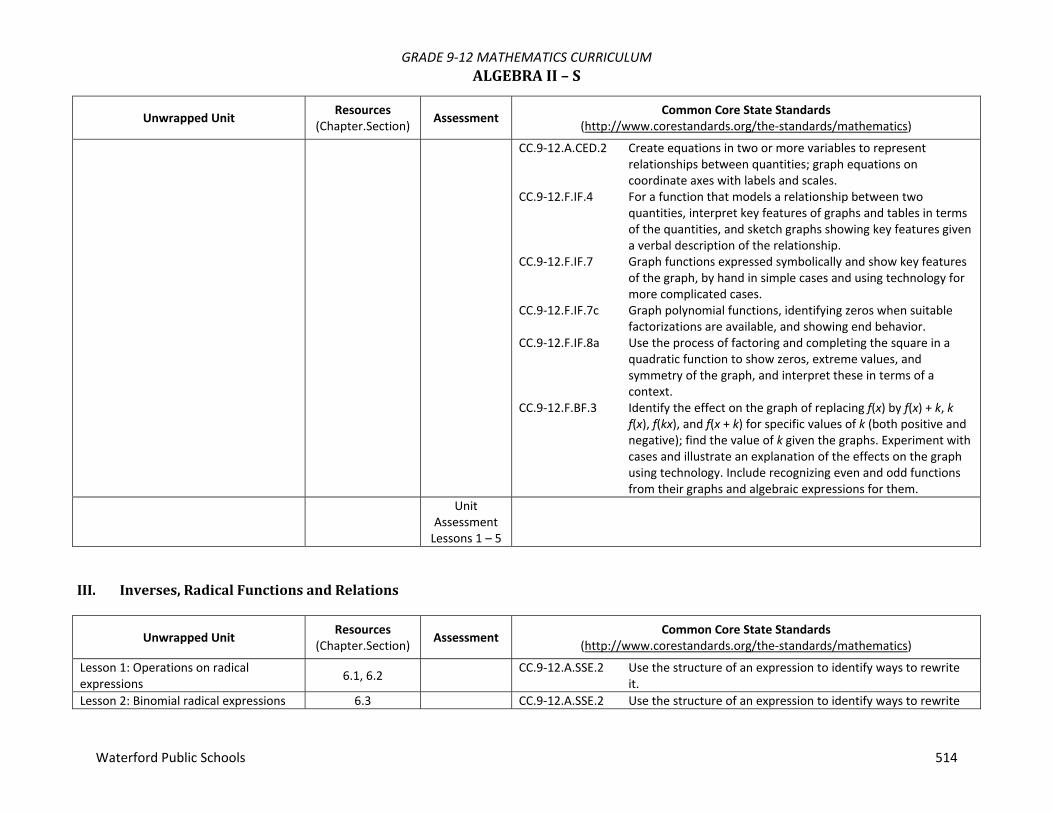
GRADE 9‐12 MATHEMATICS CURRICULUM ALGEBRAII–S
Waterford Public Schools 514
Unwrapped Unit Resources (Chapter.Section) Assessment Common Core State Standards
(http://www.corestandards.org/the‐standards/mathematics)
CC.9‐12.A.CED.2 Create equations in two or more variables to represent relationships between quantities; graph equations on coordinate axes with labels and scales.
CC.9‐12.F.IF.4 For a function that models a relationship between two quantities, interpret key features of graphs and tables in terms of the quantities, and sketch graphs showing key features given a verbal description of the relationship.
CC.9‐12.F.IF.7 Graph functions expressed symbolically and show key features of the graph, by hand in simple cases and using technology for more complicated cases.
CC.9‐12.F.IF.7c Graph polynomial functions, identifying zeros when suitable factorizations are available, and showing end behavior.
CC.9‐12.F.IF.8a Use the process of factoring and completing the square in a quadratic function to show zeros, extreme values, and symmetry of the graph, and interpret these in terms of a context.
CC.9‐12.F.BF.3 Identify the effect on the graph of replacing f(x) by f(x) + k, k f(x), f(kx), and f(x + k) for specific values of k (both positive and negative); find the value of k given the graphs. Experiment with cases and illustrate an explanation of the effects on the graph using technology. Include recognizing even and odd functions from their graphs and algebraic expressions for them.
Unit
Assessment Lessons 1 – 5
III. Inverses,RadicalFunctionsandRelations
Unwrapped Unit Resources (Chapter.Section) Assessment Common Core State Standards
(http://www.corestandards.org/the‐standards/mathematics)
Lesson 1: Operations on radical expressions 6.1, 6.2 CC.9‐12.A.SSE.2 Use the structure of an expression to identify ways to rewrite
it. Lesson 2: Binomial radical expressions 6.3 CC.9‐12.A.SSE.2 Use the structure of an expression to identify ways to rewrite

GRADE 9‐12 MATHEMATICS CURRICULUM ALGEBRAII–S
Waterford Public Schools 515
Unwrapped Unit Resources (Chapter.Section) Assessment Common Core State Standards
(http://www.corestandards.org/the‐standards/mathematics)
it.
Lesson 3: Rational exponents 6.4
CC.9‐12.N.RN.1 Explain how the definition of the meaning of rational exponents follows from extending the properties of integer exponents to those values, allowing for a notation for radicals in terms of rational exponents.
CC.9‐12.N.RN.2 Rewrite expressions involving radicals and rational exponents using the properties of exponents.
Lesson 4: Solving rational equations 6.5 CFA 4.1 to 4.4
CC.9‐12.A.REI.2 Solve simple rational and radical equations in one variable, and give examples showing how extraneous solutions may arise.
CC.9‐12.A.CED.4 Rearrange formulas to highlight a quantity of interest, using the same reasoning as in solving equations.
Lesson 5: Function operations 6.6 CC.9‐12.F.BF.1b Combine standard function types using arithmetic operations.
Lesson 6: Inverse relations and functions 6.7
CC.9‐12.F.BF.4a Solve an equation of the form f(x) = c for a simple function f that has an inverse and write an expression for the inverse.
CC.9‐12.F.BF.4c Read values of an inverse function from a graph or a table, given that the function has an inverse.
Lesson 7: Graphing radical functions 6.8 CFA 4.5 to 4.7
CC.9‐12.F.IF.7b Graph square root, cube root, and piecewise‐defined functions, including step functions and absolute value functions.
CC.9‐12.F.IF.8 Write a function defined by an expression in different but equivalent forms to reveal and explain different properties of the function.
Unit
Assessment Lessons 1 – 7
IV. ExponentialandLogarithmicFunctionsandRelations
Unwrapped Unit Resources (Chapter.Section) Assessment Common Core State Standards
(http://www.corestandards.org/the‐standards/mathematics)
Lesson 1: Exponential Models 7.1
CC.9‐12.F.IF.7e Graph exponential and logarithmic functions, showing intercepts and end behavior, and trigonometric functions, showing period, midline, and amplitude.
CC.9‐12.A.CED.2 Create equations in two or more variables to represent

GRADE 9‐12 MATHEMATICS CURRICULUM ALGEBRAII–S
Waterford Public Schools 516
Unwrapped Unit Resources (Chapter.Section) Assessment Common Core State Standards
(http://www.corestandards.org/the‐standards/mathematics)
relationships between quantities; graph equations on coordinate axes with labels and scales.
CC.9‐12.F.IF.8 Write a function defined by an expression in different but equivalent forms to reveal and explain different properties of the function.
CC.9‐12.A.SSE.1b Interpret complicated expressions by viewing one or more of their parts as a single entity.
Lesson 2: Graphing exponential models 7.2 CFA 5.1 to 5.2
CC.9‐12.F.IF.7e Graph exponential and logarithmic functions, showing intercepts and end behavior, and trigonometric functions, showing period, midline, and amplitude.
CC.9‐12.A.CED.2 Create equations in two or more variables to represent relationships between quantities; graph equations on coordinate axes with labels and scales.
CC.9‐12.F.IF.8 Write a function defined by an expression in different but equivalent forms to reveal and explain different properties of the function.
CC.9‐12.A.SSE.1b Interpret complicated expressions by viewing one or more of their parts as a single entity.
CC.9‐12.F.BF.1b Combine standard function types using arithmetic operations.
Lesson 3: Logarithmic functions 7.3
CC.9‐12.F.BF.4a Solve an equation of the form f(x) = c for a simple function fthat has an inverse and write an expression for the inverse.
CC.9‐12.F.IF.7e Graph exponential and logarithmic functions, showing intercepts and end behavior, and trigonometric functions, showing period, midline, and amplitude.
CC.9‐12.F.IF.8 Write a function defined by an expression in different but equivalent forms to reveal and explain different properties of the function.
CC.9‐12.F.IF.9 Compare properties of two functions each represented in a different way (algebraically, graphically, numerically in tables, or by verbal descriptions).
CC.9‐12.A.SSE.1b Interpret complicated expressions by viewing one or more of their parts as a single entity.
Lesson 4: Solving exponential and logarithmic equations 7.5
CC.9‐12.F.LE.4 For exponential models, express as a logarithm the solution to abct = d where a, c, and d are numbers and the base b is 2, 10, or e; evaluate the logarithm using technology.

GRADE 9‐12 MATHEMATICS CURRICULUM ALGEBRAII–S
Waterford Public Schools 517
Unwrapped Unit Resources (Chapter.Section) Assessment Common Core State Standards
(http://www.corestandards.org/the‐standards/mathematics)
CC.9‐12.A.REI.11 Explain why the x‐coordinates of the points where the graphs of the equations y = f(x) and y = g(x) intersect are the solutions of the equation f(x) = g(x); find the solutions approximately, e.g., using technology to graph the functions, make tables of values, or find successive approximations. Include cases where f(x) and/or g(x) are linear, polynomial, rational, absolute value, exponential, and logarithmic functions.
Lesson 5: Natural logarithms and e 7.6 CFA 5.3 to 5.5 CC.9‐12.F.LE.4 For exponential models, express as a logarithm the solution to
abct = d where a, c, and d are numbers and the base b is 2, 10, or e; evaluate the logarithm using technology.
Unit
Assessment Lessons 1 – 5
QuarterThree
V. RationalFunctionsandRelations
Unwrapped Unit Resources (Chapter.Section) Assessment Common Core State Standards
(http://www.corestandards.org/the‐standards/mathematics)
Lesson 1: Inverse Variation 8.1
CC.9‐12.A.CED.2 Create equations in two or more variables to represent relationships between quantities; graph equations on coordinate axes with labels and scales.
CC.9‐12.A. CED.4 Rearrange formulas to highlight a quantity of interest, using the same reasoning as in solving equations.
Lesson 2: Reciprocal Functions 8.2
CC.9‐12.A.CED.2 Create equations in two or more variables to represent relationships between quantities; graph equations on coordinate axes with labels and scales.
CC.9‐12.F.BF.3 Identify the effect on the graph of replacing f(x) by f(x) + k, k f(x), f(kx), and f(x + k) for specific values of k (both positive and negative); find the value of k given the graphs. Experiment with cases and illustrate an explanation of the effects on the graph using technology. Include recognizing even and odd functions

GRADE 9‐12 MATHEMATICS CURRICULUM ALGEBRAII–S
Waterford Public Schools 518
Unwrapped Unit Resources (Chapter.Section) Assessment Common Core State Standards
(http://www.corestandards.org/the‐standards/mathematics)
from their graphs and algebraic expressions for them.CC.9‐12.A.APR.1 Understand that polynomials form a system analogous to the
integers, namely, they are closed under the operations of addition, subtraction, and multiplication; add, subtract, and multiply polynomials.
Lesson 3: Graphing rational functions 8.3 CFA 6.1 to 6.3
CC.9‐12.A.APR.3 Identify zeros of polynomials when suitable factorizations are available, and use the zeros to construct a rough graph of the function defined by the polynomial.
CC.9‐12.F.BF.1b Combine standard function types using arithmetic operations.
Lesson 4: Simplifying rational expressions 8.4
CC.9‐12.A.SSE.1a Interpret parts of an expression, such as terms, factors, and coefficients.
CC.9‐12.A.SSE.1b Interpret complicated expressions by viewing one or more of their parts as a single entity.
CC.9‐12.A.SSE.2 Use the structure of an expression to identify ways to rewrite it.
Lesson 5: Operations on rational expressions 8.5
CC.9‐12.A.APR.7 Understand that rational expressions form a system analogous to the rational numbers, closed under addition, subtraction, multiplication, and division by a nonzero rational expression; add, subtract, multiply, and divide rational expressions.
Lesson 6: Solving rational equations 8.6 CFA 6.4 to 6.6
CC.9‐12.A.APR.6 Rewrite simple rational expressions in different forms; write a(x)/b(x) in the form q(x) + r(x)/b(x), where a(x), b(x), q(x), and r(x) are polynomials with the degree of r(x) less than the degree of b(x), using inspection, long division, or, for the more complicated examples, a computer algebra system.
CC.9‐12.A.APR.7 Understand that rational expressions form a system analogous to the rational numbers, closed under addition, subtraction, multiplication, and division by a nonzero rational expression; add, subtract, multiply, and divide rational expressions.
CC.9‐12.A.CED.1 Create equations and inequalities in one variable and use them to solve problems.
CC.9‐12.A.REI.11 Explain why the x‐coordinates of the points where the graphs of the equations y = f(x) and y = g(x) intersect are the solutions of the equation f(x) = g(x); find the solutions approximately, e.g., using technology to graph the functions, make tables of values, or find successive approximations. Include cases where

GRADE 9‐12 MATHEMATICS CURRICULUM ALGEBRAII–S
Waterford Public Schools 519
Unwrapped Unit Resources (Chapter.Section) Assessment Common Core State Standards
(http://www.corestandards.org/the‐standards/mathematics)
f(x) and/or g(x) are linear, polynomial, rational, absolute value, exponential, and logarithmic functions.
Unit
Assessment Lessons 1 – 6
VI. ConicSections:CirclesandParabolas
Unwrapped Unit Resources (Chapter.Section) Assessment Common Core State Standards
(http://www.corestandards.org/the‐standards/mathematics)
Lesson 1: Conics 10.1
CC.9‐12.G.GPE.1 Derive the equation of a circle of given center and radius using the Pythagorean Theorem; complete the square to find the center and radius of a circle given by an equation.
CC.9‐12.G.GPE.2 Derive the equation of a parabola given a focus and directrix. Lesson 2: Parabolas 10.2 CC.9‐12.G.GPE.2 Derive the equation of a parabola given a focus and directrix.
Lesson 3: Circles 10.3 CC.9‐12.G.GPE.1 Derive the equation of a circle of given center and radius using
the Pythagorean Theorem; complete the square to find the center and radius of a circle given by an equation.
Lesson 4: Translating Conic Sections 10.6 CFA 7.1 – 7.4
CC.9‐12.G.GPE.1 Derive the equation of a circle of given center and radius using the Pythagorean Theorem; complete the square to find the center and radius of a circle given by an equation.
CC.9‐12.G.GPE.2 Derive the equation of a parabola given a focus and directrix. CC.9‐12.F.IF.8 Write a function defined by an expression in different but
equivalent forms to reveal and explain different properties of the function.
Unit
Assessment Lessons 1 – 4
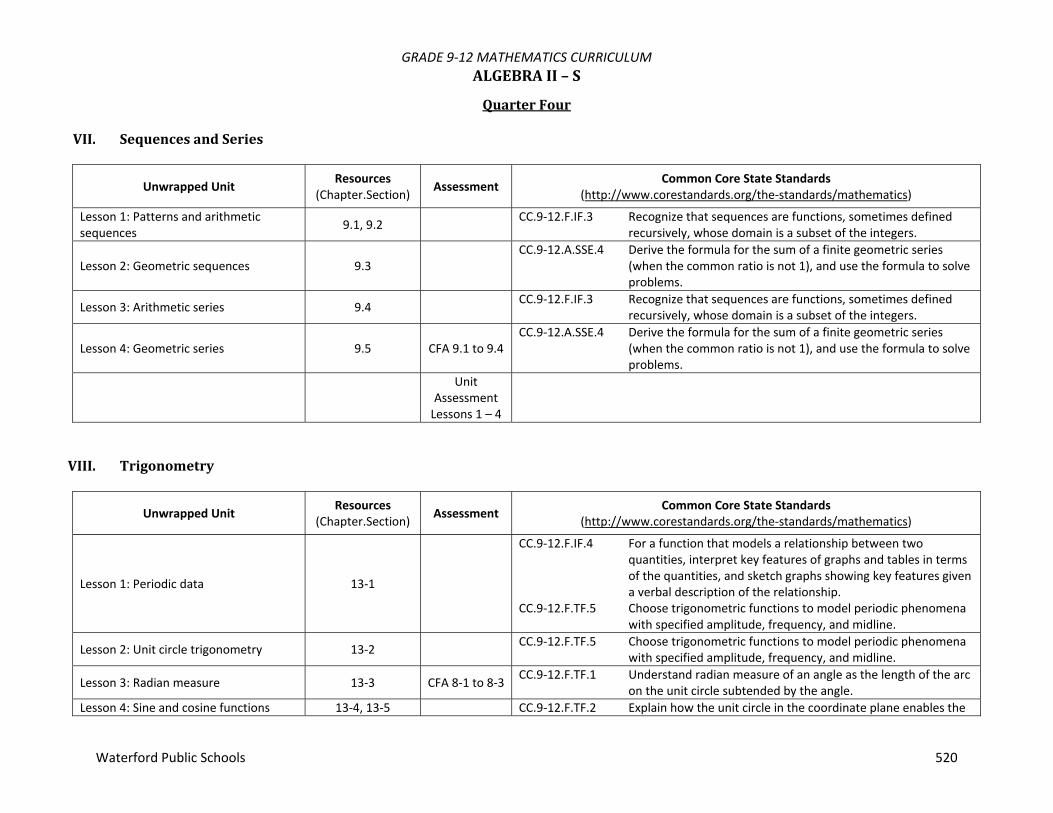
GRADE 9‐12 MATHEMATICS CURRICULUM ALGEBRAII–S
Waterford Public Schools 520
QuarterFour
VII. SequencesandSeries
Unwrapped Unit Resources (Chapter.Section) Assessment Common Core State Standards
(http://www.corestandards.org/the‐standards/mathematics)
Lesson 1: Patterns and arithmetic sequences 9.1, 9.2 CC.9‐12.F.IF.3 Recognize that sequences are functions, sometimes defined
recursively, whose domain is a subset of the integers.
Lesson 2: Geometric sequences 9.3 CC.9‐12.A.SSE.4 Derive the formula for the sum of a finite geometric series
(when the common ratio is not 1), and use the formula to solve problems.
Lesson 3: Arithmetic series 9.4 CC.9‐12.F.IF.3 Recognize that sequences are functions, sometimes defined recursively, whose domain is a subset of the integers.
Lesson 4: Geometric series 9.5 CFA 9.1 to 9.4 CC.9‐12.A.SSE.4 Derive the formula for the sum of a finite geometric series
(when the common ratio is not 1), and use the formula to solve problems.
Unit
Assessment Lessons 1 – 4
VIII. Trigonometry
Unwrapped Unit Resources (Chapter.Section) Assessment Common Core State Standards
(http://www.corestandards.org/the‐standards/mathematics)
Lesson 1: Periodic data 13‐1
CC.9‐12.F.IF.4 For a function that models a relationship between two quantities, interpret key features of graphs and tables in terms of the quantities, and sketch graphs showing key features given a verbal description of the relationship.
CC.9‐12.F.TF.5 Choose trigonometric functions to model periodic phenomena with specified amplitude, frequency, and midline.
Lesson 2: Unit circle trigonometry 13‐2 CC.9‐12.F.TF.5 Choose trigonometric functions to model periodic phenomena with specified amplitude, frequency, and midline.
Lesson 3: Radian measure 13‐3 CFA 8‐1 to 8‐3 CC.9‐12.F.TF.1 Understand radian measure of an angle as the length of the arc on the unit circle subtended by the angle.
Lesson 4: Sine and cosine functions 13‐4, 13‐5 CC.9‐12.F.TF.2 Explain how the unit circle in the coordinate plane enables the

GRADE 9‐12 MATHEMATICS CURRICULUM ALGEBRAII–S
Waterford Public Schools 521
Unwrapped Unit Resources (Chapter.Section) Assessment Common Core State Standards
(http://www.corestandards.org/the‐standards/mathematics)
extension of trigonometric functions to all real numbers, interpreted as radian measures of angles traversed counterclockwise around the unit circle.
CC.9‐12.F.TF.5 Choose trigonometric functions to model periodic phenomena with specified amplitude, frequency, and midline.
CC.9‐12.F.IF.4 For a function that models a relationship between two quantities, interpret key features of graphs and tables in terms of the quantities, and sketch graphs showing key features given a verbal description of the relationship.
CC.9‐12.F.IF.7e Graph exponential and logarithmic functions, showing intercepts and end behavior, and trigonometric functions, showing period, midline, and amplitude.
Lesson 5: Tangent function 13‐6
CC.9‐12.F.TF.2 Explain how the unit circle in the coordinate plane enables the extension of trigonometric functions to all real numbers, interpreted as radian measures of angles traversed counterclockwise around the unit circle.
CC.9‐12.F.IF.7e Graph exponential and logarithmic functions, showing intercepts and end behavior, and trigonometric functions, showing period, midline, and amplitude.
Lesson 6: Transformations of periodic functions 13‐7 CFA 8‐4 to 8‐6
CC.9‐12.F.IF.7e Graph exponential and logarithmic functions, showing intercepts and end behavior, and trigonometric functions, showing period, midline, and amplitude.
CC.9‐12.F.TF.5 Choose trigonometric functions to model periodic phenomena with specified amplitude, frequency, and midline.
Unit
Assessment Lessons 1 – 6

GRADE 9‐12 MATHEMATICS CURRICULUM ALGEBRAII–A
Waterford Public Schools 522
This course develops a high degree of skill and accuracy in algebraic techniques. Skills covered in Algebra I – A are reviewed. There is further work on quadratics, including graphs of linear and quadratic equations. An introduction to negative exponents, logarithms, matrices, and systems with three variables is included. Recommendation: Grade of B‐ or better in Algebra I – A. Grade of A‐ or better in Algebra I – S Part II. Essential Questions
1. What are the different types of functions? 2. What are the operations that apply to all functions? 3. How can Geometric and Analytic representations be used to describe the behavior of the function? 4. How are the algebraic, numeric, and graphic representations of functions related? 5. How do you add, subtract, multiply and divide polynomials? 6. How do you factor and solve polynomials? 7. What techniques can you use to solve a system of equations? 8. How are polynomials and their graphs related? 9. Will polynomials ever be used in real life?
Course #: 330 Prerequisite: Successful completion of Algebra I – A or Algebra I – S Part II and Plane Geometry. Credit: 1 credit Resources:

GRADE 9‐12 MATHEMATICS CURRICULUM ALGEBRAII–A
Waterford Public Schools 523
QuarterOneI. QuadraticFunctionsandEquations
Unwrapped Unit Resources (Chapter.Section) Assessment Common Core State Standards
(http://www.corestandards.org/the‐standards/mathematics)
Lesson 1: Quadratic functions and transformations 4.1, 4.2
CC.9‐12.A.SSE.1a Interpret parts of an expression, such as terms, factors, and coefficients.
CC.9‐12.A.SSE.1b Interpret complicated expressions by viewing one or more of their parts as a single entity.
CC.9‐12.A.CED.2 Create equations in two or more variables to represent relationships between quantities; graph equations on coordinate axes with labels and scales.
CC.9‐12.F.IF.4 For a function that models a relationship between two quantities, interpret key features of graphs and tables in terms of the quantities, and sketch graphs showing key features given a verbal description of the relationship.
CC.9‐12.F.IF.5 Relate the domain of a function to its graph and, where applicable, to the quantitative relationship it describes.
CC.9‐12.F.IF.8 Write a function defined by an expression in different but equivalent forms to reveal and explain different properties of the function.
CC.9‐12.F.IF.8a Use the process of factoring and completing the square in a quadratic function to show zeros, extreme values, and symmetry of the graph, and interpret these in terms of a context.
CC.9‐12.F.IF.9 Compare properties of two functions each represented in a different way (algebraically, graphically, numerically in tables, or by verbal descriptions).
CC.9‐12.F.BF.3 Identify the effect on the graph of replacing f(x) by f(x) + k, k f(x), f(kx), and f(x + k) for specific values of k (both positive and negative); find the value of k given the graphs. Experiment with cases and illustrate an explanation of the effects on the graph using technology. Include recognizing even and odd functions from their graphs and algebraic expressions for them.

GRADE 9‐12 MATHEMATICS CURRICULUM ALGEBRAII–A
Waterford Public Schools 524
Unwrapped Unit Resources (Chapter.Section) Assessment Common Core State Standards
(http://www.corestandards.org/the‐standards/mathematics)
Lesson 2: Modeling quadratic functions 4.3
CC.9‐12.F.IF.4 For a function that models a relationship between two quantities, interpret key features of graphs and tables in terms of the quantities, and sketch graphs showing key features given a verbal description of the relationship.
CC.9‐12.F.IF.5 Relate the domain of a function to its graph and, where applicable, to the quantitative relationship it describes.
Lesson 3: Solving quadratic equations by factoring, square roots 4.4, 4.5 CFA 2.1 to 2.3
CC.9‐12.A.SSE.2 Use the structure of an expression to identify ways to rewrite it.
CC.9‐12.A.CED.1 Create equations and inequalities in one variable and use them to solve problems.
CC.9‐12.F.IF.8a Use the process of factoring and completing the square in a quadratic function to show zeros, extreme values, and symmetry of the graph, and interpret these in terms of a context.
CC.9‐12.A.APR.1 Understand that polynomials form a system analogous to the integers, namely, they are closed under the operations of addition, subtraction, and multiplication; add, subtract, and multiply polynomials.
CC.9‐12.A.APR.3 Identify zeros of polynomials when suitable factorizations are available, and use the zeros to construct a rough graph of the function defined by the polynomial.
CC.9‐12.A.APR.4 Prove polynomial identities and use them to describe numerical relationships.
Lesson 4: Operations on complex numbers 4.8
CC.9‐12.N.CN.1 Know there is a complex number i such that i2 = –1, and every complex number has the form a + bi with a and b real.
CC.9‐12.N.CN.2 Use the relation i2 = –1 and the commutative, associative, and distributive properties to add, subtract, and multiply complex numbers.
CC.9‐12.N.CN.7 Solve quadratic equations with real coefficients that have complex solutions.
CC.9‐12.N.CN.8 Extend polynomial identities to the complex numbers.
Lesson 5: Completing the square (a>1) 4.6
CC.9‐12.A.REI.4b Solve quadratic equations by inspection (e.g., for x2 = 49), taking square roots, completing the square, the quadratic formula and factoring, as appropriate to the initial form of the equation. Recognize when the quadratic formula gives complex

GRADE 9‐12 MATHEMATICS CURRICULUM ALGEBRAII–A
Waterford Public Schools 525
Unwrapped Unit Resources (Chapter.Section) Assessment Common Core State Standards
(http://www.corestandards.org/the‐standards/mathematics)
solutions and write them as a ± bi for real numbers a and b.CC.9‐12.A.SSE.2 Use the structure of an expression to identify ways to rewrite
it. CC.9‐12.A.APR.4 Prove polynomial identities and use them to describe numerical
relationships. CC.9‐12.A.CED.1 Create equations and inequalities in one variable and use them
to solve problems. CC.9‐12.F.IF.8a Use the process of factoring and completing the square in a
quadratic function to show zeros, extreme values, and symmetry of the graph, and interpret these in terms of a context.
CC.9‐12.N.CN.7 Solve quadratic equations with real coefficients that have complex solutions.
Lesson 6: Quadratic formula 4.7
CC.9‐12.A.REI.4b Solve quadratic equations by inspection (e.g., for x2 = 49), taking square roots, completing the square, the quadratic formula and factoring, as appropriate to the initial form of the equation. Recognize when the quadratic formula gives complex solutions and write them as a ± bi for real numbers a and b.
CC.9‐12.N.CN.7 Solve quadratic equations with real coefficients that have complex solutions.
CC.9‐12.N.CN.8 Extend polynomial identities to the complex numbers. CC.9‐12.A.SSE.1b Interpret complicated expressions by viewing one or more of
their parts as a single entity. CC.9‐12.A.APR.4 Prove polynomial identities and use them to describe numerical
relationships. CC.9‐12.A.CED.1 Create equations and inequalities in one variable and use them
to solve problems. CC.9‐12.A.CED.4 Rearrange formulas to highlight a quantity of interest, using the
same reasoning as in solving equations.
Lesson 7: Quadratic systems 4.9 CFA 2.4 to 2.7
CC.9‐12.A.CED.3 Represent constraints by equations or inequalities, and by systems of equations and/or inequalities, and interpret solutions as viable or nonviable options in a modeling context.
CC.9‐12.A.REI.7 Solve a simple system consisting of a linear equation and a quadratic equation in two variables algebraically and graphically.
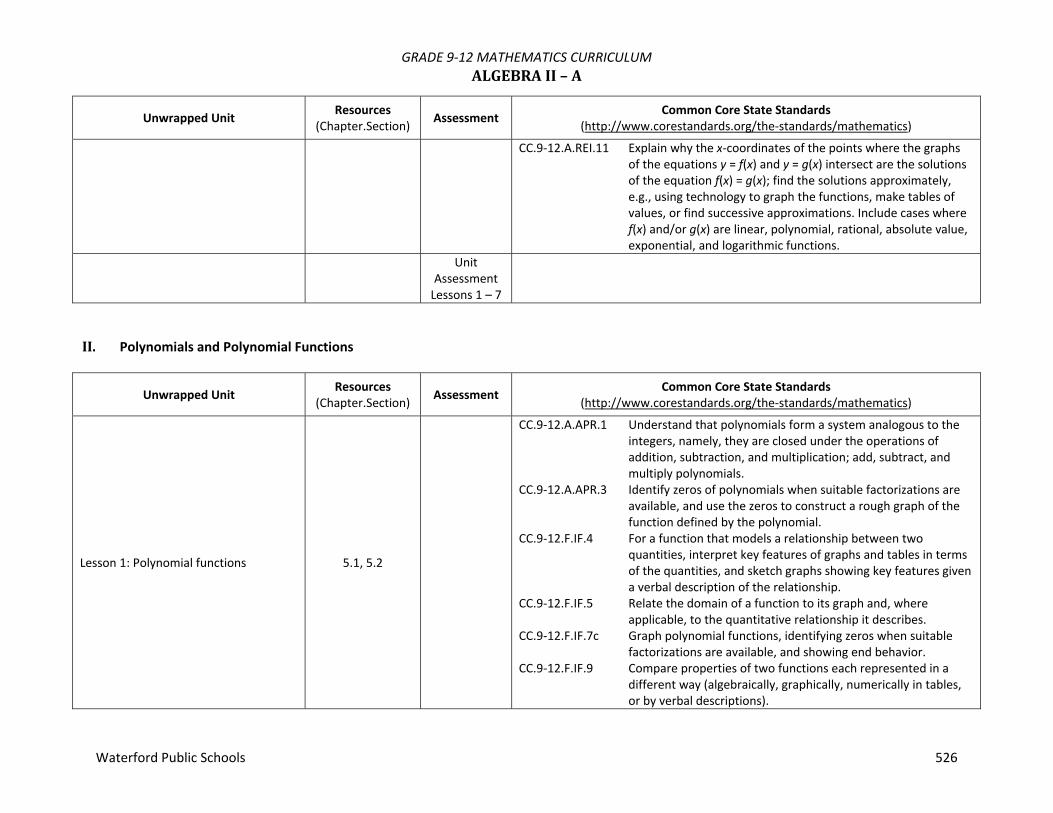
GRADE 9‐12 MATHEMATICS CURRICULUM ALGEBRAII–A
Waterford Public Schools 526
Unwrapped Unit Resources (Chapter.Section) Assessment Common Core State Standards
(http://www.corestandards.org/the‐standards/mathematics)
CC.9‐12.A.REI.11 Explain why the x‐coordinates of the points where the graphs of the equations y = f(x) and y = g(x) intersect are the solutions of the equation f(x) = g(x); find the solutions approximately, e.g., using technology to graph the functions, make tables of values, or find successive approximations. Include cases where f(x) and/or g(x) are linear, polynomial, rational, absolute value, exponential, and logarithmic functions.
Unit
Assessment Lessons 1 – 7
II. Polynomials and Polynomial Functions
Unwrapped Unit Resources (Chapter.Section) Assessment Common Core State Standards
(http://www.corestandards.org/the‐standards/mathematics)
Lesson 1: Polynomial functions 5.1, 5.2
CC.9‐12.A.APR.1 Understand that polynomials form a system analogous to the integers, namely, they are closed under the operations of addition, subtraction, and multiplication; add, subtract, and multiply polynomials.
CC.9‐12.A.APR.3 Identify zeros of polynomials when suitable factorizations are available, and use the zeros to construct a rough graph of the function defined by the polynomial.
CC.9‐12.F.IF.4 For a function that models a relationship between two quantities, interpret key features of graphs and tables in terms of the quantities, and sketch graphs showing key features given a verbal description of the relationship.
CC.9‐12.F.IF.5 Relate the domain of a function to its graph and, where applicable, to the quantitative relationship it describes.
CC.9‐12.F.IF.7c Graph polynomial functions, identifying zeros when suitable factorizations are available, and showing end behavior.
CC.9‐12.F.IF.9 Compare properties of two functions each represented in a different way (algebraically, graphically, numerically in tables, or by verbal descriptions).

GRADE 9‐12 MATHEMATICS CURRICULUM ALGEBRAII–A
Waterford Public Schools 527
Unwrapped Unit Resources (Chapter.Section) Assessment Common Core State Standards
(http://www.corestandards.org/the‐standards/mathematics)
CC.9‐12.A.CED.2 Create equations in two or more variables to represent relationships between quantities; graph equations on coordinate axes with labels and scales.
Lesson 2: Solving polynomial equations 5.3 CFA 3.1 to 3.3
CC.9‐12.A.CED.1 Create equations and inequalities in one variable and use them to solve problems.
CC.9‐12.A.REI.11 Explain why the x‐coordinates of the points where the graphs of the equations y = f(x) and y = g(x) intersect are the solutions of the equation f(x) = g(x); find the solutions approximately, e.g., using technology to graph the functions, make tables of values, or find successive approximations. Include cases where f(x) and/or g(x) are linear, polynomial, rational, absolute value, exponential, and logarithmic functions.
Lesson 3: Dividing polynomials and rational root theorem 5.4, 5.5
CC.9‐12.A.APR.1 Understand that polynomials form a system analogous to the integers, namely, they are closed under the operations of addition, subtraction, and multiplication; add, subtract, and multiply polynomials.
CC.9‐12.A.APR.2 Know and apply the Remainder Theorem: For a polynomial p(x) and a number a, the remainder on division by x – a is p(a), so p(a) = 0 if and only if (x – a) is a factor of p(x).
CC.9‐12.A.APR.6 Rewrite simple rational expressions in different forms; write a(x)/b(x) in the form q(x) + r(x)/b(x), where a(x), b(x), q(x), and r(x) are polynomials with the degree of r(x) less than the degree of b(x), using inspection, long division, or, for the more complicated examples, a computer algebra system.
CC.9‐12.N.CN.7 Solve quadratic equations with real coefficients that have complex solutions.
CC.9‐12.N.CN.8 Extend polynomial identities to the complex numbers.
Lesson 4: Modeling polynomials 5.8
CC.9‐12.F.IF.4 For a function that models a relationship between two quantities, interpret key features of graphs and tables in terms of the quantities, and sketch graphs showing key features given a verbal description of the relationship.
CC.9‐12.F.IF.7c Graph polynomial functions, identifying zeros when suitable factorizations are available, and showing end behavior.

GRADE 9‐12 MATHEMATICS CURRICULUM ALGEBRAII–A
Waterford Public Schools 528
Unwrapped Unit Resources (Chapter.Section) Assessment Common Core State Standards
(http://www.corestandards.org/the‐standards/mathematics)
Lesson 5: Transformations of polynomials 5.9 CFA 3.4 to 3.7
CC.9‐12.A.SSE.1b Interpret parts of an expression, such as terms, factors, and coefficients.
CC.9‐12.A.CED.2 Create equations in two or more variables to represent relationships between quantities; graph equations on coordinate axes with labels and scales.
CC.9‐12.F.IF.4 For a function that models a relationship between two quantities, interpret key features of graphs and tables in terms of the quantities, and sketch graphs showing key features given a verbal description of the relationship.
CC.9‐12.F.IF.7 Graph functions expressed symbolically and show key features of the graph, by hand in simple cases and using technology for more complicated cases.
CC.9‐12.F.IF.7c Graph polynomial functions, identifying zeros when suitable factorizations are available, and showing end behavior.
CC.9‐12.F.IF.8a Write a function defined by an expression in different but equivalent forms to reveal and explain different properties of the function.
CC.9‐12.F.BF.3 Identify the effect on the graph of replacing f(x) by f(x) + k, k f(x), f(kx), and f(x + k) for specific values of k (both positive and negative); find the value of k given the graphs. Experiment with cases and illustrate an explanation of the effects on the graph using technology. Include recognizing even and odd functions from their graphs and algebraic expressions for them.
Unit
Assessment Lessons 1 – 5

GRADE 9‐12 MATHEMATICS CURRICULUM ALGEBRAII–A
Waterford Public Schools 529
QuarterTwo
III. Inverses,RadicalFunctionsandRelations
Unwrapped Unit Resources (Chapter.Section) Assessment Common Core State Standards
(http://www.corestandards.org/the‐standards/mathematics)
Lesson 1: Operations on radical expressions 6.1, 6.2 CC.9‐12.A.SSE.2 Use the structure of an expression to identify ways to rewrite
it.
Lesson 2: Binomial radical expressions 6.3 CC.9‐12.A.SSE.2 Use the structure of an expression to identify ways to rewrite it.
Lesson 3: Rational exponents 6.4
CC.9‐12.N.RN.1 Explain how the definition of the meaning of rational exponents follows from extending the properties of integer exponents to those values, allowing for a notation for radicals in terms of rational exponents.
CC.9‐12.N.RN.2 Rewrite expressions involving radicals and rational exponents using the properties of exponents.
Lesson 4: Solving rational equations 6.5 CFA 4‐. to 4.4
CC.9‐12.A.REI.2 Solve simple rational and radical equations in one variable, and give examples showing how extraneous solutions may arise.
CC.9‐12.A.CED.4 Rearrange formulas to highlight a quantity of interest, using the same reasoning as in solving equations.
Lesson 5: Function operations 6.6 CC.9‐12.F.BF.1b Combine standard function types using arithmetic operations.
Lesson 6: Inverse relations and functions 6.7
CC.9‐12.F.BF.4a Solve an equation of the form f(x) = c for a simple function f that has an inverse and write an expression for the inverse.
CC.9‐12.F.BF.4c Verify by composition that one function is the inverse of another.
Lesson 7: Graphing radical functions 6.8 CFA 4.5 to 4.7
CC.9‐12.F.IF.7b Graph square root, cube root, and piecewise‐defined functions, including step functions and absolute value functions.
CC.9‐12.F.IF.8 Write a function defined by an expression in different but equivalent forms to reveal and explain different properties of the function.
Unit
Assessment Lessons 1 – 7

GRADE 9‐12 MATHEMATICS CURRICULUM ALGEBRAII–A
Waterford Public Schools 530
IV. ExponentialandLogarithmicFunctionsandRelations
Unwrapped Unit Resources (Chapter.Section) Assessment Common Core State Standards
(http://www.corestandards.org/the‐standards/mathematics)
Lesson 1: Exponential Models 7.1
CC.9‐12.F.IF.7e Graph exponential and logarithmic functions, showing intercepts and end behavior, and trigonometric functions, showing period, midline, and amplitude.
CC.9‐12.A.CED.2 Create equations in two or more variables to represent relationships between quantities; graph equations on coordinate axes with labels and scales.
CC.9‐12.F.IF.8 Write a function defined by an expression in different but equivalent forms to reveal and explain different properties of the function.
CC.9‐12.A.SSE.1b Interpret parts of an expression, such as terms, factors, and coefficients.
Lesson 2: Graphing exponential models 7.2 CFA 5.1 to 5.2
CC.9‐12.F.IF.7e Graph exponential and logarithmic functions, showing intercepts and end behavior, and trigonometric functions, showing period, midline, and amplitude.
CC.9‐12.A.CED.2 Create equations in two or more variables to represent relationships between quantities; graph equations on coordinate axes with labels and scales.
CC.9‐12.F.IF.8 Write a function defined by an expression in different but equivalent forms to reveal and explain different properties of the function.
CC.9‐12.A.SSE.1b Interpret parts of an expression, such as terms, factors, and coefficients.
CC.9‐12.F.BF.1b Combine standard function types using arithmetic operations.
Lesson 3: Logarithmic functions 7.3
CC.9‐12.F.BF.4a Solve an equation of the form f(x) = c for a simple function f that has an inverse and write an expression for the inverse.
CC.9‐12.F.IF.7e Graph exponential and logarithmic functions, showing intercepts and end behavior, and trigonometric functions, showing period, midline, and amplitude.
CC.9‐12.F.IF.8 Write a function defined by an expression in different but equivalent forms to reveal and explain different properties of the function.
CC.9‐12.F.IF.9 Compare properties of two functions each represented in a different way (algebraically, graphically, numerically in tables,

GRADE 9‐12 MATHEMATICS CURRICULUM ALGEBRAII–A
Waterford Public Schools 531
Unwrapped Unit Resources (Chapter.Section) Assessment Common Core State Standards
(http://www.corestandards.org/the‐standards/mathematics)
or by verbal descriptions).CC.9‐12.A.SSE.1b Interpret parts of an expression, such as terms, factors, and
coefficients.
Lesson 4: Solving exponential and logarithmic equations 7.5
CC.9‐12.F.LE.4 For exponential models, express as a logarithm the solution to abct = d where a, c, and d are numbers and the base b is 2, 10, or e; evaluate the logarithm using technology.
CC.9‐12.A.REI.11 Explain why the x‐coordinates of the points where the graphs of the equations y = f(x) and y = g(x) intersect are the solutions of the equation f(x) = g(x); find the solutions approximately, e.g., using technology to graph the functions, make tables of values, or find successive approximations. Include cases where f(x) and/or g(x) are linear, polynomial, rational, absolute value, exponential, and logarithmic functions.
Lesson 5: Natural logarithms and e 7.6 CFA 5.3 to 5.5 CC.9‐12.F.LE.4 For exponential models, express as a logarithm the solution to
abct = d where a, c, and d are numbers and the base b is 2, 10, or e; evaluate the logarithm using technology.
Unit
Assessment Lessons 1 – 5
QuarterThree
V. RationalFunctionsandRelations
Unwrapped Unit Resources (Chapter.Section) Assessment Common Core State Standards
(http://www.corestandards.org/the‐standards/mathematics)
Lesson 1: Inverse Variation 8.1
CC.9‐12.A.CED.2 Create equations in two or more variables to represent relationships between quantities; graph equations on coordinate axes with labels and scales.
CC.9‐12.A.CED.4 Rearrange formulas to highlight a quantity of interest, using the same reasoning as in solving equations.

GRADE 9‐12 MATHEMATICS CURRICULUM ALGEBRAII–A
Waterford Public Schools 532
Unwrapped Unit Resources (Chapter.Section) Assessment Common Core State Standards
(http://www.corestandards.org/the‐standards/mathematics)
Lesson 2: Reciprocal Functions 8.2
CC.9‐12.A.CED.2 Create equations in two or more variables to represent relationships between quantities; graph equations on coordinate axes with labels and scales.
CC.9‐12.F.BF.3 Identify the effect on the graph of replacing f(x) by f(x) + k, k f(x), f(kx), and f(x + k) for specific values of k (both positive and negative); find the value of k given the graphs. Experiment with cases and illustrate an explanation of the effects on the graph using technology. Include recognizing even and odd functions from their graphs and algebraic expressions for them.
CC.9‐12.A.APR.1 Understand that polynomials form a system analogous to the integers, namely, they are closed under the operations of addition, subtraction, and multiplication; add, subtract, and multiply polynomials.
Lesson 3: Graphing rational functions 8.3 CFA 6.1 to 6.3
CC.9‐12.A.APR.3 Identify zeros of polynomials when suitable factorizations are available, and use the zeros to construct a rough graph of the function defined by the polynomial.
CC.9‐12.F.BF.1b Combine standard function types using arithmetic operations.
Lesson 4: Simplifying rational expressions 8.4
CC.9‐12.A.SSE.1a Interpret parts of an expression, such as terms, factors, and coefficients.
CC.9‐12.A.SSE.1b Interpret parts of an expression, such as terms, factors, and coefficients.
CC.9‐12.A.SSE.2 Use the structure of an expression to identify ways to rewrite it.
Lesson 5: Operations on rational expressions 8.5
CC.9‐12.A.APR.7 Understand that rational expressions form a system analogous to the rational numbers, closed under addition, subtraction, multiplication, and division by a nonzero rational expression; add, subtract, multiply, and divide rational expressions.
Lesson 6: Solving rational equations 8.6 CFA 6.4 to 6.6
CC.9‐12.A.APR.6 Rewrite simple rational expressions in different forms; write a(x)/b(x) in the form q(x) + r(x)/b(x), where a(x), b(x), q(x), and r(x) are polynomials with the degree of r(x) less than the degree of b(x), using inspection, long division, or, for the more complicated examples, a computer algebra system.
CC.9‐12.A.APR.7 Understand that rational expressions form a system analogous to the rational numbers, closed under addition, subtraction, multiplication, and division by a nonzero rational expression;

GRADE 9‐12 MATHEMATICS CURRICULUM ALGEBRAII–A
Waterford Public Schools 533
Unwrapped Unit Resources (Chapter.Section) Assessment Common Core State Standards
(http://www.corestandards.org/the‐standards/mathematics)
add, subtract, multiply, and divide rational expressions.CC.9‐12.A.CED.1 Create equations and inequalities in one variable and use them
to solve problems. CC.9‐12.A.REI.11 Explain why the x‐coordinates of the points where the graphs
of the equations y = f(x) and y = g(x) intersect are the solutions of the equation f(x) = g(x); find the solutions approximately, e.g., using technology to graph the functions, make tables of values, or find successive approximations. Include cases where f(x) and/or g(x) are linear, polynomial, rational, absolute value, exponential, and logarithmic functions.
Unit
Assessment Lessons 1 – 6
VI. ConicSections:CirclesandParabolas
Unwrapped Unit Resources (Chapter.Section) Assessment Common Core State Standards
(http://www.corestandards.org/the‐standards/mathematics)
Lesson 1: Conics 10.1
CC.9‐12.G.GPE.1 Derive the equation of a circle of given center and radius using the Pythagorean Theorem; complete the square to find the center and radius of a circle given by an equation.
CC.9‐12.G.GPE.2 Derive the equation of a parabola given a focus and directrix. Lesson 2: Parabolas 10.2 CC.9‐12.G.GPE.2 Derive the equation of a parabola given a focus and directrix.
Lesson 3: Circles 10.3 CC.9‐12.G.GPE.1 Derive the equation of a circle of given center and radius using
the Pythagorean Theorem; complete the square to find the center and radius of a circle given by an equation.

GRADE 9‐12 MATHEMATICS CURRICULUM ALGEBRAII–A
Waterford Public Schools 534
Unwrapped Unit Resources (Chapter.Section) Assessment Common Core State Standards
(http://www.corestandards.org/the‐standards/mathematics)
Lesson 4: Translating Conic Sections 10.6 CFA 7.1 to 7.4
CC.9‐12.G.GPE.1 Derive the equation of a circle of given center and radius using the Pythagorean Theorem; complete the square to find the center and radius of a circle given by an equation.
CC.9‐12.G.GPE.2 Derive the equation of a parabola given a focus and directrix. CC.9‐12.F.IF.8 Write a function defined by an expression in different but
equivalent forms to reveal and explain different properties of the function.
Unit
Assessment Lessons 1 – 4
QuarterFour
VII. SequencesandSeries
Unwrapped Unit Resources (Chapter.Section) Assessment Common Core State Standards
(http://www.corestandards.org/the‐standards/mathematics)
Lesson 1: Patterns and arithmetic sequences 9.1, 9.2 CC.9‐12.F.IF.3 Recognize that sequences are functions, sometimes defined
recursively, whose domain is a subset of the integers.
Lesson 2: Geometric sequences 9.3 CC.9‐12.A.SSE.4 Derive the formula for the sum of a finite geometric series
(when the common ratio is not 1), and use the formula to solve problems.
Lesson 3: Arithmetic series 9.4 CC.9‐12.F.IF.3 Recognize that sequences are functions, sometimes defined recursively, whose domain is a subset of the integers.
Lesson 4: Geometric series 9.5 CFA 9.1 to 9.4 CC.9‐12.A.SSE.4 Derive the formula for the sum of a finite geometric series
(when the common ratio is not 1), and use the formula to solve problems.
Unit
Assessment Lessons 1 – 4

GRADE 9‐12 MATHEMATICS CURRICULUM ALGEBRAII–A
Waterford Public Schools 535
VIII. Trigonometry
Unwrapped Unit Resources (Chapter.Section) Assessment Common Core State Standards
(http://www.corestandards.org/the‐standards/mathematics)
Lesson 1: Periodic data 13.1
CC.9‐12.F.IF.4 For a function that models a relationship between two quantities, interpret key features of graphs and tables in terms of the quantities, and sketch graphs showing key features given a verbal description of the relationship.
CC.9‐12.F.TF.5 Choose trigonometric functions to model periodic phenomena with specified amplitude, frequency, and midline.
Lesson 2: Unit circle trigonometry 13.2 CC.9‐12.F.TF.5 Choose trigonometric functions to model periodic phenomena with specified amplitude, frequency, and midline.
Lesson 3: Radian measure 13.3 CFA 8.1 to 8.3 CC.9‐12.F.TF.1 Understand radian measure of an angle as the length of the arc on the unit circle subtended by the angle.
Lesson 4: Sine and cosine functions 13.4, 13.5
CC.9‐12.F.TF.2 Explain how the unit circle in the coordinate plane enables the extension of trigonometric functions to all real numbers, interpreted as radian measures of angles traversed counterclockwise around the unit circle.
CC.9‐12.F.TF.5 Choose trigonometric functions to model periodic phenomena with specified amplitude, frequency, and midline.
CC.9‐12.F.IF.4 For a function that models a relationship between two quantities, interpret key features of graphs and tables in terms of the quantities, and sketch graphs showing key features given a verbal description of the relationship.
CC.9‐12.F.IF.7e Graph exponential and logarithmic functions, showing intercepts and end behavior, and trigonometric functions, showing period, midline, and amplitude.
Lesson 5: Tangent function 13.6
CC.9‐12.F.TF.2 Explain how the unit circle in the coordinate plane enables the extension of trigonometric functions to all real numbers, interpreted as radian measures of angles traversed counterclockwise around the unit circle.
CC.9‐12.F.IF.7e Graph exponential and logarithmic functions, showing intercepts and end behavior, and trigonometric functions, showing period, midline, and amplitude.

GRADE 9‐12 MATHEMATICS CURRICULUM ALGEBRAII–A
Waterford Public Schools 536
Unwrapped Unit Resources (Chapter.Section) Assessment Common Core State Standards
(http://www.corestandards.org/the‐standards/mathematics)
Lesson 6: Transformations of periodic functions 13.7 CFA 8.4 to 8.6
CC.9‐12.F.IF.7e Graph exponential and logarithmic functions, showing intercepts and end behavior, and trigonometric functions, showing period, midline, and amplitude.
CC.9‐12.F.TF.5 Choose trigonometric functions to model periodic phenomena with specified amplitude, frequency, and midline.
Unit
Assessment Lessons 1 – 6

GRADE 9‐12 MATHEMATICS CURRICULUM ALGEBRAII–H
Waterford Public Schools 537
This course develops skill and accuracy in algebraic techniques. There is further work on quadratics, including graphs of linear and quadratic equations. An introduction to negative exponents, logarithms, matrices, and systems with three variables is included. This is a more rigorous treatment of the material than the advanced course. Recommendation: Grade of B‐ or better in Plane Geometry – H. Essential Questions
1. What are the different types of functions? 2. What are the operations that apply to all functions? 3. How can Geometric and Analytic representations be used to describe the behavior of the function? 4. How are the algebraic, numeric, and graphic representations of functions related? 5. How do you add, subtract, multiply and divide polynomials? 6. How do you factor and solve polynomials? 7. What techniques can you use to solve a system of equations? 8. How are polynomials and their graphs related? 9. Will polynomials ever be used in real life?
Course #: 351 Prerequisite: Successful completion of Plane Geometry – H Credit: 1 credit Resources:

GRADE 9‐12 MATHEMATICS CURRICULUM ALGEBRAII–H
Waterford Public Schools 538
QuarterOneI. QuadraticFunctionsandEquations
Unwrapped Unit Resources (Chapter.Section) Assessment Common Core State Standards
(http://www.corestandards.org/the‐standards/mathematics)
Lesson 1: Quadratic functions and transformations 4.1, 4.2
CC.9‐12.A.SSE.1a Interpret parts of an expression, such as terms, factors, and coefficients.
CC.9‐12.A.SSE.1b Interpret complicated expressions by viewing one or more of their parts as a single entity.
CC.9‐12.A.CED.2 Create equations in two or more variables to represent relationships between quantities; graph equations on coordinate axes with labels and scales.
CC.9‐12.F.IF.4 For a function that models a relationship between two quantities, interpret key features of graphs and tables in terms of the quantities, and sketch graphs showing key features given a verbal description of the relationship.
CC.9‐12.F.IF.5 Relate the domain of a function to its graph and, where applicable, to the quantitative relationship it describes.
CC.9‐12.F.IF.8 Write a function defined by an expression in different but equivalent forms to reveal and explain different properties of the function.
CC.9‐12.F.IF.8a Use the process of factoring and completing the square in a quadratic function to show zeros, extreme values, and symmetry of the graph, and interpret these in terms of a context.
CC.9‐12.F.IF.9 Compare properties of two functions each represented in a different way (algebraically, graphically, numerically in tables, or by verbal descriptions).
CC.9‐12.F.BF.3 Identify the effect on the graph of replacing f(x) by f(x) + k, k f(x), f(kx), and f(x + k) for specific values of k (both positive and negative); find the value of k given the graphs. Experiment with cases and illustrate an explanation of the effects on the graph using technology. Include recognizing even and odd functions from their graphs and algebraic expressions for them.

GRADE 9‐12 MATHEMATICS CURRICULUM ALGEBRAII–H
Waterford Public Schools 539
Unwrapped Unit Resources (Chapter.Section) Assessment Common Core State Standards
(http://www.corestandards.org/the‐standards/mathematics)
Lesson 2: Modeling quadratic functions 4.3
CC.9‐12.F.IF.4 For a function that models a relationship between two quantities, interpret key features of graphs and tables in terms of the quantities, and sketch graphs showing key features given a verbal description of the relationship.
CC.9‐12.F.IF.5 Relate the domain of a function to its graph and, where applicable, to the quantitative relationship it describes.
Lesson 3: Solving quadratic equations by factoring, square roots 4.4, 4.5 CFA 2.1 to 2.3
CC.9‐12.A.SSE.2 Use the structure of an expression to identify ways to rewrite it.
CC.9‐12.A.CED.1 Create equations and inequalities in one variable and use them to solve problems.
CC.9‐12.F.IF.8a Use the process of factoring and completing the square in a quadratic function to show zeros, extreme values, and symmetry of the graph, and interpret these in terms of a context.
CC.9‐12.A.APR.1 Understand that polynomials form a system analogous to the integers, namely, they are closed under the operations of addition, subtraction, and multiplication; add, subtract, and multiply polynomials.
CC.9‐12.A.APR.3 Identify zeros of polynomials when suitable factorizations are available, and use the zeros to construct a rough graph of the function defined by the polynomial.
CC.9‐12.A.APR.4 Prove polynomial identities and use them to describe numerical relationships.
Lesson 4: Operations on complex numbers 4.8
CC.9‐12.N.CN.1 Know there is a complex number i such that i2 = –1, and every complex number has the form a + bi with a and b real.
CC.9‐12.N.CN.2 Use the relation i2 = –1 and the commutative, associative, and distributive properties to add, subtract, and multiply complex numbers.
CC.9‐12.N.CN.7 Solve quadratic equations with real coefficients that have complex solutions.
CC.9‐12.N.CN.8 Extend polynomial identities to the complex numbers.

GRADE 9‐12 MATHEMATICS CURRICULUM ALGEBRAII–H
Waterford Public Schools 540
Unwrapped Unit Resources (Chapter.Section) Assessment Common Core State Standards
(http://www.corestandards.org/the‐standards/mathematics)
Lesson 5: Completing the square (a>1) 4.6
CC.9‐12.A.REI.4b Solve quadratic equations by inspection (e.g., for x2 = 49), taking square roots, completing the square, the quadratic formula and factoring, as appropriate to the initial form of the equation. Recognize when the quadratic formula gives complex solutions and write them as a ± bi for real numbers a and b.
CC.9‐12.A.SSE.2 Use the structure of an expression to identify ways to rewrite it.
CC.9‐12.A.APR.4 Prove polynomial identities and use them to describe numerical relationships.
CC.9‐12.A.CED.1 Create equations and inequalities in one variable and use them to solve problems.
CC.9‐12.F.IF.8a Use the process of factoring and completing the square in a quadratic function to show zeros, extreme values, and symmetry of the graph, and interpret these in terms of a context.
CC.9‐12.N.CN.7 Solve quadratic equations with real coefficients that have complex solutions.
Lesson 6: Quadratic formula 4.7
CC.9‐12.A.REI.4b Solve quadratic equations by inspection (e.g., for x2 = 49), taking square roots, completing the square, the quadratic formula and factoring, as appropriate to the initial form of the equation. Recognize when the quadratic formula gives complex solutions and write them as a ± bi for real numbers a and b.
CC.9‐12.N.CN.7 Solve quadratic equations with real coefficients that have complex solutions.
CC.9‐12.N.CN.8 Extend polynomial identities to the complex numbers. CC.9‐12.A.SSE.1b Interpret complicated expressions by viewing one or more of
their parts as a single entity. CC.9‐12.A.APR.4 Prove polynomial identities and use them to describe numerical
relationships. CC.9‐12.A.CED.1 Create equations and inequalities in one variable and use them
to solve problems. CC.9‐12.A.CED.4 Rearrange formulas to highlight a quantity of interest, using the
same reasoning as in solving equations.

GRADE 9‐12 MATHEMATICS CURRICULUM ALGEBRAII–H
Waterford Public Schools 541
Unwrapped Unit Resources (Chapter.Section) Assessment Common Core State Standards
(http://www.corestandards.org/the‐standards/mathematics)
Lesson 7: Quadratic systems 4.9 CFA 2.4 to 2.7
CC.9‐12.A.CED.3 Represent constraints by equations or inequalities, and by systems of equations and/or inequalities, and interpret solutions as viable or nonviable options in a modeling context.
CC.9‐12.A.REI.7 Solve a simple system consisting of a linear equation and a quadratic equation in two variables algebraically and graphically.
CC.9‐12.A.REI.11 Explain why the x‐coordinates of the points where the graphs of the equations y = f(x) and y = g(x) intersect are the solutions of the equation f(x) = g(x); find the solutions approximately, e.g., using technology to graph the functions, make tables of values, or find successive approximations. Include cases where f(x) and/or g(x) are linear, polynomial, rational, absolute value, exponential, and logarithmic functions.
Unit
Assessment Lessons 1 – 7
II. PolynomialsandPolynomialFunctions
Unwrapped Unit Resources (Chapter.Section) Assessment Common Core State Standards
(http://www.corestandards.org/the‐standards/mathematics)
Lesson 1: Polynomial functions 5.1, 5.2
CC.9‐12.A.APR.1 Understand that polynomials form a system analogous to the integers, namely, they are closed under the operations of addition, subtraction, and multiplication; add, subtract, and multiply polynomials.
CC.9‐12.A.APR.3 Identify zeros of polynomials when suitable factorizations are available, and use the zeros to construct a rough graph of the function defined by the polynomial.
CC.9‐12.F.IF.4 For a function that models a relationship between two quantities, interpret key features of graphs and tables in terms of the quantities, and sketch graphs showing key features given a verbal description of the relationship.
CC.9‐12.F.IF.5 Relate the domain of a function to its graph and, where

GRADE 9‐12 MATHEMATICS CURRICULUM ALGEBRAII–H
Waterford Public Schools 542
Unwrapped Unit Resources (Chapter.Section) Assessment Common Core State Standards
(http://www.corestandards.org/the‐standards/mathematics)
applicable, to the quantitative relationship it describes.CC.9‐12.F.IF.7c Graph polynomial functions, identifying zeros when suitable
factorizations are available, and showing end behavior. CC.9‐12.F.IF.9 Compare properties of two functions each represented in a
different way (algebraically, graphically, numerically in tables, or by verbal descriptions).
CC.9‐12.A.CED.2 Create equations in two or more variables to represent relationships between quantities; graph equations on coordinate axes with labels and scales.
Lesson 2: Solving polynomial equations 5.3 CFA 3.1 to 3.3
CC.9‐12.A.CED.1 Create equations and inequalities in one variable and use them to solve problems.
CC.9‐12.A.REI.11 Explain why the x‐coordinates of the points where the graphs of the equations y = f(x) and y = g(x) intersect are the solutions of the equation f(x) = g(x); find the solutions approximately, e.g., using technology to graph the functions, make tables of values, or find successive approximations. Include cases where f(x) and/or g(x) are linear, polynomial, rational, absolute value, exponential, and logarithmic functions.
Lesson 3: Dividing polynomials and rational root theorem 5.4, 5.5
CC.9‐12.A.APR.1 Understand that polynomials form a system analogous to the integers, namely, they are closed under the operations of addition, subtraction, and multiplication; add, subtract, and multiply polynomials.
CC.9‐12.A.APR.2 Know and apply the Remainder Theorem: For a polynomial p(x) and a number a, the remainder on division by x – a is p(a), so p(a) = 0 if and only if (x – a) is a factor of p(x).
CC.9‐12.A.APR.6 Rewrite simple rational expressions in different forms; write a(x)/b(x) in the form q(x) + r(x)/b(x), where a(x), b(x), q(x), and r(x) are polynomials with the degree of r(x) less than the degree of b(x), using inspection, long division, or, for the more complicated examples, a computer algebra system.CC.9‐12.N.CN.7
CC.9‐12.N.CN.8 Extend polynomial identities to the complex numbers.
Lesson 4: Modeling polynomials 5.8 CC.9‐12.F.IF.4 For a function that models a relationship between two
quantities, interpret key features of graphs and tables in terms of the quantities, and sketch graphs showing key features given
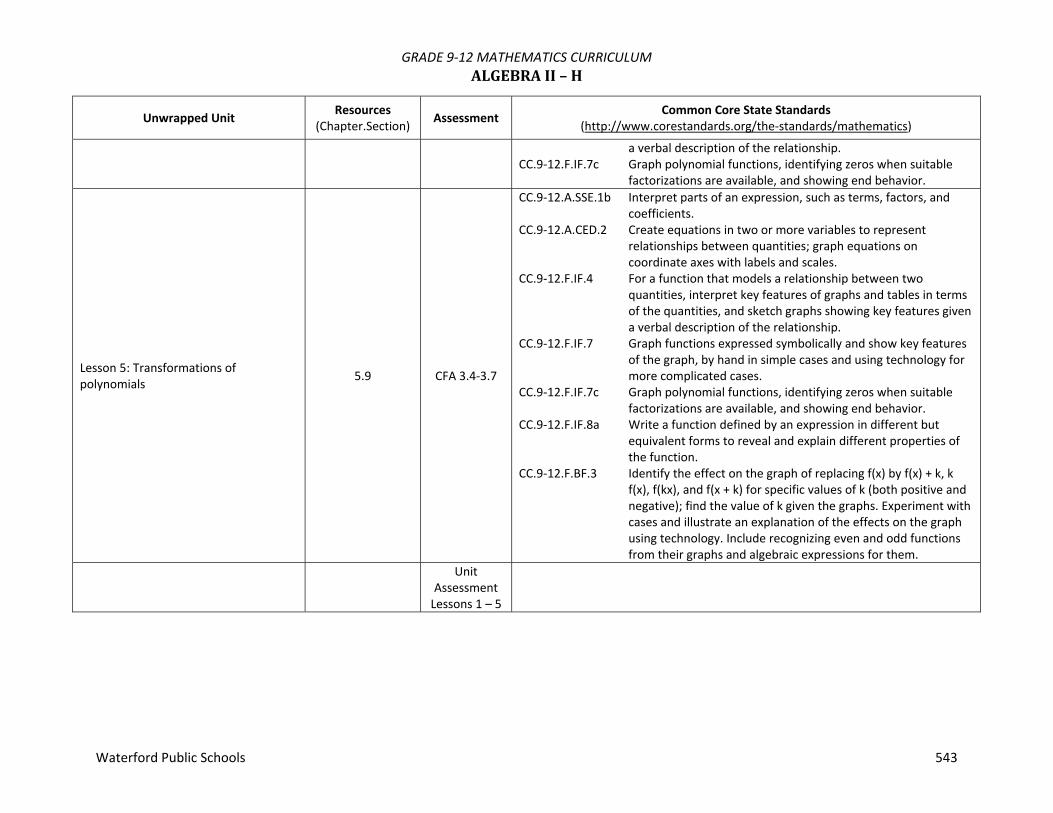
GRADE 9‐12 MATHEMATICS CURRICULUM ALGEBRAII–H
Waterford Public Schools 543
Unwrapped Unit Resources (Chapter.Section) Assessment Common Core State Standards
(http://www.corestandards.org/the‐standards/mathematics)
a verbal description of the relationship.CC.9‐12.F.IF.7c Graph polynomial functions, identifying zeros when suitable
factorizations are available, and showing end behavior.
Lesson 5: Transformations of polynomials 5.9 CFA 3.4‐3.7
CC.9‐12.A.SSE.1b Interpret parts of an expression, such as terms, factors, and coefficients.
CC.9‐12.A.CED.2 Create equations in two or more variables to represent relationships between quantities; graph equations on coordinate axes with labels and scales.
CC.9‐12.F.IF.4 For a function that models a relationship between two quantities, interpret key features of graphs and tables in terms of the quantities, and sketch graphs showing key features given a verbal description of the relationship.
CC.9‐12.F.IF.7 Graph functions expressed symbolically and show key features of the graph, by hand in simple cases and using technology for more complicated cases.
CC.9‐12.F.IF.7c Graph polynomial functions, identifying zeros when suitable factorizations are available, and showing end behavior.
CC.9‐12.F.IF.8a Write a function defined by an expression in different but equivalent forms to reveal and explain different properties of the function.
CC.9‐12.F.BF.3 Identify the effect on the graph of replacing f(x) by f(x) + k, k f(x), f(kx), and f(x + k) for specific values of k (both positive and negative); find the value of k given the graphs. Experiment with cases and illustrate an explanation of the effects on the graph using technology. Include recognizing even and odd functions from their graphs and algebraic expressions for them.
Unit
Assessment Lessons 1 – 5

GRADE 9‐12 MATHEMATICS CURRICULUM ALGEBRAII–H
Waterford Public Schools 544
QuarterTwo
III. Inverses,RadicalFunctionsandRelations
Unwrapped Unit Resources (Chapter.Section) Assessment Common Core State Standards
(http://www.corestandards.org/the‐standards/mathematics)
Lesson 1: Operations on radical expressions 6.1, 6.2 CC.9‐12.A.SSE.2 Use the structure of an expression to identify ways to rewrite
it.
Lesson 2: Binomial radical expressions 6.3 CC.9‐12.A.SSE.2 Use the structure of an expression to identify ways to rewrite it.
Lesson 3: Rational exponents 6.4
CC.9‐12.N.RN.1 Explain how the definition of the meaning of rational exponents follows from extending the properties of integer exponents to those values, allowing for a notation for radicals in terms of rational exponents.
CC.9‐12.N.RN.2 Rewrite expressions involving radicals and rational exponents using the properties of exponents.
Lesson 4: Solving rational equations 6.5 CFA 4.1 to 4.4
CC.9‐12.A.REI.2 Solve simple rational and radical equations in one variable, and give examples showing how extraneous solutions may arise.
CC.9‐12.A.CED.4 Rearrange formulas to highlight a quantity of interest, using the same reasoning as in solving equations.
Lesson 5: Function operations 6.6 CC.9‐12.F.BF.1b Combine standard function types using arithmetic operations.
Lesson 6: Inverse relations and functions 6.7
CC.9‐12.F.BF.4a Solve an equation of the form f(x) = c for a simple function f that has an inverse and write an expression for the inverse.
CC.9‐12.F.BF.4c Verify by composition that one function is the inverse of another.
Lesson 7: Graphing radical functions 6.8 CFA 4.5 to 4.7
CC.9‐12.F.IF.7b Graph square root, cube root, and piecewise‐defined functions, including step functions and absolute value functions.
CC.9‐12.F.IF.8 Write a function defined by an expression in different but equivalent forms to reveal and explain different properties of the function.
Unit Assessment Lessons 1 – 7

GRADE 9‐12 MATHEMATICS CURRICULUM ALGEBRAII–H
Waterford Public Schools 545
IV. ExponentialandLogarithmicFunctionsandRelations
Unwrapped Unit Resources (Chapter.Section) Assessment Common Core State Standards
(http://www.corestandards.org/the‐standards/mathematics)
Lesson 1: Exponential Models 7.1
CC.9‐12.F.IF.7e Graph exponential and logarithmic functions, showing intercepts and end behavior, and trigonometric functions, showing period, midline, and amplitude.
CC.9‐12.A.CED.2 Create equations in two or more variables to represent relationships between quantities; graph equations on coordinate axes with labels and scales.
CC.9‐12.F.IF.8 Write a function defined by an expression in different but equivalent forms to reveal and explain different properties of the function.
CC.9‐12.A.SSE.1b Interpret parts of an expression, such as terms, factors, and coefficients.
Lesson 2: Graphing exponential models 7.2 CFA 5.1 to 5.2
CC.9‐12.F.IF.7e Graph exponential and logarithmic functions, showing intercepts and end behavior, and trigonometric functions, showing period, midline, and amplitude.
CC.9‐12.A.CED.2 Create equations in two or more variables to represent relationships between quantities; graph equations on coordinate axes with labels and scales.
CC.9‐12.F.IF.8 Write a function defined by an expression in different but equivalent forms to reveal and explain different properties of the function.
CC.9‐12.A.SSE.1b Interpret parts of an expression, such as terms, factors, and coefficients.
CC.9‐12.F.BF.1b Combine standard function types using arithmetic operations.
Lesson 3: Logarithmic functions 7.3
CC.9‐12.F.BF.4a Solve an equation of the form f(x) = c for a simple function f that has an inverse and write an expression for the inverse.
CC.9‐12.F.IF.7e Graph exponential and logarithmic functions, showing intercepts and end behavior, and trigonometric functions, showing period, midline, and amplitude.
CC.9‐12.F.IF.8 Write a function defined by an expression in different but equivalent forms to reveal and explain different properties of the function.
CC.9‐12.F.IF.9 Compare properties of two functions each represented in a different way (algebraically, graphically, numerically in tables,

GRADE 9‐12 MATHEMATICS CURRICULUM ALGEBRAII–H
Waterford Public Schools 546
Unwrapped Unit Resources (Chapter.Section) Assessment Common Core State Standards
(http://www.corestandards.org/the‐standards/mathematics)
or by verbal descriptions).CC.9‐12.A.SSE.1b Interpret parts of an expression, such as terms, factors, and
coefficients.
Lesson 4: Solving exponential and logarithmic equations 7.5
CC.9‐12.F.LE.4 For exponential models, express as a logarithm the solution to abct = d where a, c, and d are numbers and the base b is 2, 10, or e; evaluate the logarithm using technology.
CC.9‐12.A.REI.11 Explain why the x‐coordinates of the points where the graphs of the equations y = f(x) and y = g(x) intersect are the solutions of the equation f(x) = g(x); find the solutions approximately, e.g., using technology to graph the functions, make tables of values, or find successive approximations. Include cases where f(x) and/or g(x) are linear, polynomial, rational, absolute value, exponential, and logarithmic functions.
Lesson 5: Natural logarithms and e 7.6 CFA 5.3 to 5.5 CC.9‐12.F.LE.4 For exponential models, express as a logarithm the solution to
abct = d where a, c, and d are numbers and the base b is 2, 10, or e; evaluate the logarithm using technology.
Unit Assessment Lessons 1 – 5
QuarterThree
V. RationalFunctionsandRelations
Unwrapped Unit Resources (Chapter.Section) Assessment Common Core State Standards
(http://www.corestandards.org/the‐standards/mathematics)
Lesson 1: Inverse Variation 8‐.
CC.9‐12.A.CED.2 Create equations in two or more variables to represent relationships between quantities; graph equations on coordinate axes with labels and scales.
CC.9‐12.A.CED.4 Rearrange formulas to highlight a quantity of interest, using the same reasoning as in solving equations.

GRADE 9‐12 MATHEMATICS CURRICULUM ALGEBRAII–H
Waterford Public Schools 547
Unwrapped Unit Resources (Chapter.Section) Assessment Common Core State Standards
(http://www.corestandards.org/the‐standards/mathematics)
Lesson 2: Reciprocal Functions 8.2
CC.9‐12.A.CED.2 Create equations in two or more variables to represent relationships between quantities; graph equations on coordinate axes with labels and scales.
CC.9‐12.F.BF.3 Identify the effect on the graph of replacing f(x) by f(x) + k, k f(x), f(kx), and f(x + k) for specific values of k (both positive and negative); find the value of k given the graphs. Experiment with cases and illustrate an explanation of the effects on the graph using technology. Include recognizing even and odd functions from their graphs and algebraic expressions for them.
CC.9‐12.A.APR.1 Understand that polynomials form a system analogous to the integers, namely, they are closed under the operations of addition, subtraction, and multiplication; add, subtract, and multiply polynomials.
Lesson 3: Graphing rational functions 8.3 CFA 6.1 to 6.3
CC.9‐12.A.APR.3 Identify zeros of polynomials when suitable factorizations are available, and use the zeros to construct a rough graph of the function defined by the polynomial.
CC.9‐12.F.BF.1b Combine standard function types using arithmetic operations.
Lesson 4: Simplifying rational expressions 8.4
CC.9‐12.A.SSE.1a Interpret parts of an expression, such as terms, factors, and coefficients.
CC.9‐12.A.SSE.1b Interpret parts of an expression, such as terms, factors, and coefficients.
CC.9‐12.A.SSE.2 Use the structure of an expression to identify ways to rewrite it.
Lesson 5: Operations on rational expressions 8.5
CC.9‐12.A.APR.7 Understand that rational expressions form a system analogous to the rational numbers, closed under addition, subtraction, multiplication, and division by a nonzero rational expression; add, subtract, multiply, and divide rational expressions.
Lesson 6: Solving rational equations 8.6 CFA 6.4 to 6.6
CC.9‐12.A.APR.6 Rewrite simple rational expressions in different forms; write a(x)/b(x) in the form q(x) + r(x)/b(x), where a(x), b(x), q(x), and r(x) are polynomials with the degree of r(x) less than the degree of b(x), using inspection, long division, or, for the more complicated examples, a computer algebra system.
CC.9‐12.A.APR.7 Understand that rational expressions form a system analogous to the rational numbers, closed under addition, subtraction, multiplication, and division by a nonzero rational expression;
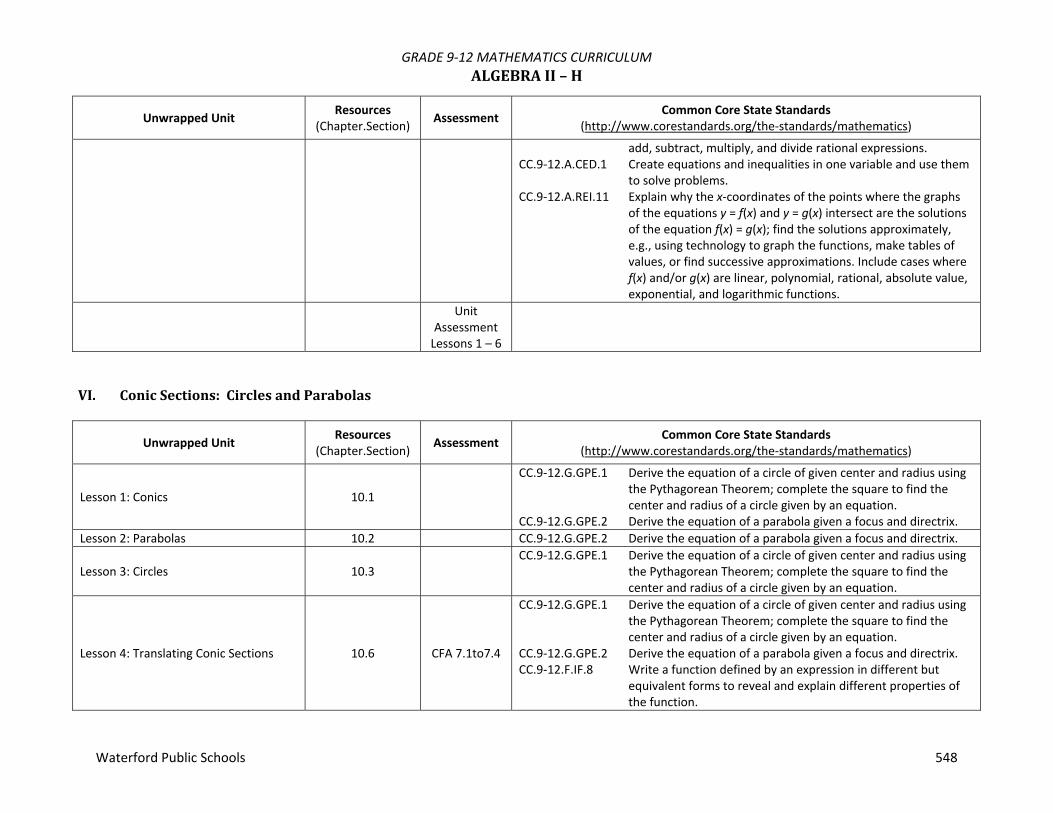
GRADE 9‐12 MATHEMATICS CURRICULUM ALGEBRAII–H
Waterford Public Schools 548
Unwrapped Unit Resources (Chapter.Section) Assessment Common Core State Standards
(http://www.corestandards.org/the‐standards/mathematics)
add, subtract, multiply, and divide rational expressions.CC.9‐12.A.CED.1 Create equations and inequalities in one variable and use them
to solve problems. CC.9‐12.A.REI.11 Explain why the x‐coordinates of the points where the graphs
of the equations y = f(x) and y = g(x) intersect are the solutions of the equation f(x) = g(x); find the solutions approximately, e.g., using technology to graph the functions, make tables of values, or find successive approximations. Include cases where f(x) and/or g(x) are linear, polynomial, rational, absolute value, exponential, and logarithmic functions.
Unit Assessment Lessons 1 – 6
VI. ConicSections:CirclesandParabolas
Unwrapped Unit Resources (Chapter.Section) Assessment Common Core State Standards
(http://www.corestandards.org/the‐standards/mathematics)
Lesson 1: Conics 10.1
CC.9‐12.G.GPE.1 Derive the equation of a circle of given center and radius using the Pythagorean Theorem; complete the square to find the center and radius of a circle given by an equation.
CC.9‐12.G.GPE.2 Derive the equation of a parabola given a focus and directrix. Lesson 2: Parabolas 10.2 CC.9‐12.G.GPE.2 Derive the equation of a parabola given a focus and directrix.
Lesson 3: Circles 10.3 CC.9‐12.G.GPE.1 Derive the equation of a circle of given center and radius using
the Pythagorean Theorem; complete the square to find the center and radius of a circle given by an equation.
Lesson 4: Translating Conic Sections 10.6 CFA 7.1to7.4
CC.9‐12.G.GPE.1 Derive the equation of a circle of given center and radius using the Pythagorean Theorem; complete the square to find the center and radius of a circle given by an equation.
CC.9‐12.G.GPE.2 Derive the equation of a parabola given a focus and directrix. CC.9‐12.F.IF.8 Write a function defined by an expression in different but
equivalent forms to reveal and explain different properties of the function.
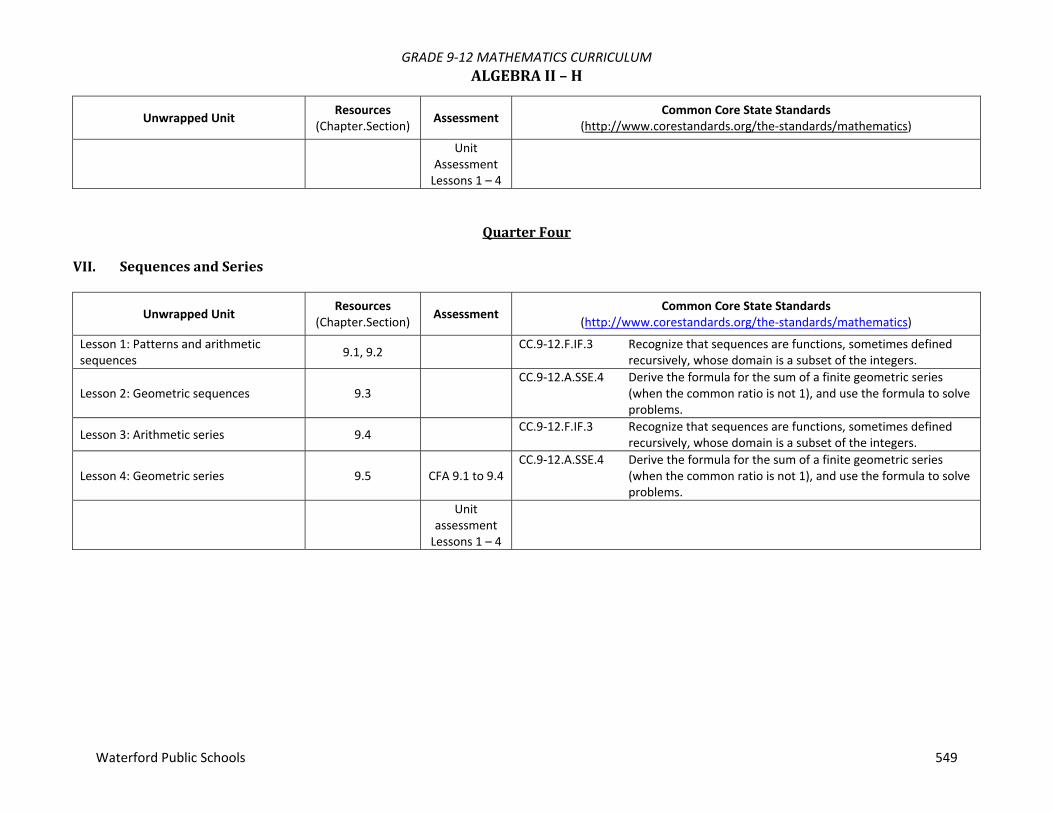
GRADE 9‐12 MATHEMATICS CURRICULUM ALGEBRAII–H
Waterford Public Schools 549
Unwrapped Unit Resources (Chapter.Section) Assessment Common Core State Standards
(http://www.corestandards.org/the‐standards/mathematics)
Unit Assessment Lessons 1 – 4
QuarterFour
VII. SequencesandSeries
Unwrapped Unit Resources (Chapter.Section) Assessment Common Core State Standards
(http://www.corestandards.org/the‐standards/mathematics)
Lesson 1: Patterns and arithmetic sequences 9.1, 9.2 CC.9‐12.F.IF.3 Recognize that sequences are functions, sometimes defined
recursively, whose domain is a subset of the integers.
Lesson 2: Geometric sequences 9.3 CC.9‐12.A.SSE.4 Derive the formula for the sum of a finite geometric series
(when the common ratio is not 1), and use the formula to solve problems.
Lesson 3: Arithmetic series 9.4 CC.9‐12.F.IF.3 Recognize that sequences are functions, sometimes defined recursively, whose domain is a subset of the integers.
Lesson 4: Geometric series 9.5 CFA 9.1 to 9.4 CC.9‐12.A.SSE.4 Derive the formula for the sum of a finite geometric series
(when the common ratio is not 1), and use the formula to solve problems.
Unit assessment Lessons 1 – 4

GRADE 9‐12 MATHEMATICS CURRICULUM ALGEBRAII–H
Waterford Public Schools 550
VIII. Trigonometry
Unwrapped Unit Resources (Chapter.Section) Assessment Common Core State Standards
(http://www.corestandards.org/the‐standards/mathematics)
Lesson 1: Periodic data 13.1
CC.9‐12.F.IF.4 For a function that models a relationship between two quantities, interpret key features of graphs and tables in terms of the quantities, and sketch graphs showing key features given a verbal description of the relationship.
CC.9‐12.F.TF.5 Choose trigonometric functions to model periodic phenomena with specified amplitude, frequency, and midline.
Lesson 2: Unit circle trigonometry 13.2 CC.9‐12.F.TF.5 Choose trigonometric functions to model periodic phenomena with specified amplitude, frequency, and midline.
Lesson 3: Radian measure 13.3 CFA 8.1 to 8.3 CC.9‐12.F.TF.1 Understand radian measure of an angle as the length of the arc on the unit circle subtended by the angle.
Lesson 4: Sine and cosine functions 13.4, 13.5
CC.9‐12.F.TF.2 Explain how the unit circle in the coordinate plane enables the extension of trigonometric functions to all real numbers, interpreted as radian measures of angles traversed counterclockwise around the unit circle.
CC.9‐12.F.TF.5 Choose trigonometric functions to model periodic phenomena with specified amplitude, frequency, and midline.
CC.9‐12.F.IF.4 For a function that models a relationship between two quantities, interpret key features of graphs and tables in terms of the quantities, and sketch graphs showing key features given a verbal description of the relationship.
CC.9‐12.F.IF.7e Graph exponential and logarithmic functions, showing intercepts and end behavior, and trigonometric functions, showing period, midline, and amplitude.
Lesson 5: Tangent function 13.6
CC.9‐12.F.TF.2 Explain how the unit circle in the coordinate plane enables the extension of trigonometric functions to all real numbers, interpreted as radian measures of angles traversed counterclockwise around the unit circle.
CC.9‐12.F.IF.7e Graph exponential and logarithmic functions, showing intercepts and end behavior, and trigonometric functions, showing period, midline, and amplitude.

GRADE 9‐12 MATHEMATICS CURRICULUM ALGEBRAII–H
Waterford Public Schools 551
Unwrapped Unit Resources (Chapter.Section) Assessment Common Core State Standards
(http://www.corestandards.org/the‐standards/mathematics)
Lesson 6: Transformations of periodic functions 13.7 CFA 8.4 to 8.6
CC.9‐12.F.IF.7e Graph exponential and logarithmic functions, showing intercepts and end behavior, and trigonometric functions, showing period, midline, and amplitude.
CC.9‐12.F.TF.5 Choose trigonometric functions to model periodic phenomena with specified amplitude, frequency, and midline.
Unit assessment Lessons 1 – 6

GRADE 9‐12 MATHEMATICS CURRICULUM PROBABILITYANDSTATISTICS–A
Waterford Public Schools 552
This course will include such topics as discrete functions, statistical analysis, probability theory and applications, reasoning, communication, connections and problem solving. Real world applications are used to investigate and apply theory. Calculators are used to organize, analyze and present results. Essential Questions
1. How are samples selected? 2. What are the measures of central tendency, how are they calculated, and what do they mean? 3. What are the measures of variation, how are they calculated, and what do they mean? 4. What are the measures of position, how are they calculated, and what do they mean? 5. What is a permutation and what is a combination and how are they used? 6. If A and B are two events, how do you calculate the probability of A OR B? 7. If A and B are two events, how do you calculate the probability of A AND B? 8. What is a probability distribution? 9. What is a binomial probability distribution and how is it used to calculate probabilities? 10. What is a normal probability distribution and how is it used to calculate probabilities?
Course #: 336 Prerequisite: Successful completion of Algebra II – A Credit: ½ credit Resources: Probability & Statistics, Bluman, 8th Edition

GRADE 9‐12 MATHEMATICS CURRICULUM PROBABILITYANDSTATISTICS–A
Waterford Public Schools 553
QuarterOneI. TheNatureofProbabilityandStatistics
Unwrapped Unit Resources (Chapter.Section) Assessment Common Core State Standards
(http://www.corestandards.org/the‐standards/mathematics)
Lesson 1: Descriptive and Inferential Statistics 1.1
CC.9‐12.S.IC.1 Understand statistics as a process for making inferences about population parameters based on a random sample from that population.
CC.9‐12.S.IC.3 Recognize the purposes of and differences among sample surveys, experiments, and observational studies; explain how randomization relates to each.
CC.9‐12.S.IC.4 Use data from a sample survey to estimate a population mean or proportion; develop a margin of error through the use of simulation models for random sampling.
Lesson 2: Variables and Types of Data 1.2
CC.9‐12.S.IC.1 Understand statistics as a process for making inferences about population parameters based on a random sample from that population.
CC.9‐12.S.IC.3 Recognize the purposes of and differences among sample surveys, experiments, and observational studies; explain how randomization relates to each.
CC.9‐12.S.IC.4 Use data from a sample survey to estimate a population mean or proportion; develop a margin of error through the use of simulation models for random sampling.
Lesson 3: Data Collection and Sampling Techniques 1.3
CC.9‐12.S.IC.1 Understand statistics as a process for making inferences about population parameters based on a random sample from that population.
CC.9‐12.S.IC.3 Recognize the purposes of and differences among sample surveys, experiments, and observational studies; explain how randomization relates to each.
CC.9‐12.S.IC.4 Use data from a sample survey to estimate a population mean or proportion; develop a margin of error through the use of simulation models for random sampling.
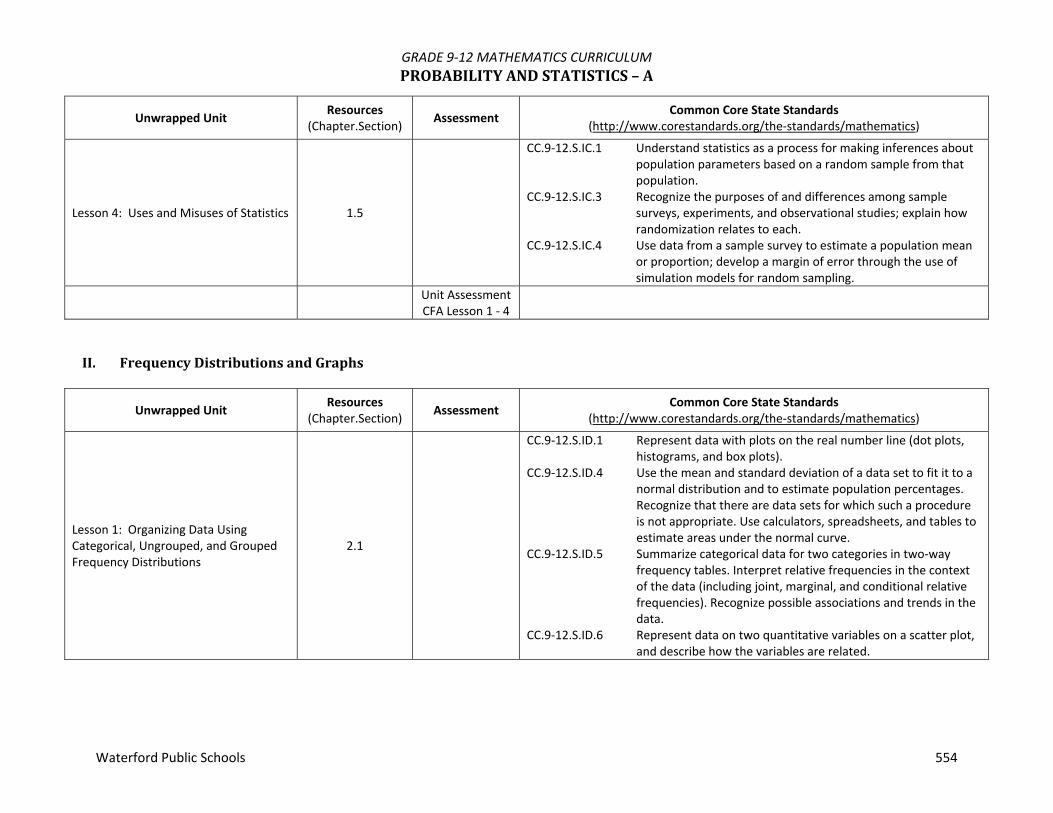
GRADE 9‐12 MATHEMATICS CURRICULUM PROBABILITYANDSTATISTICS–A
Waterford Public Schools 554
Unwrapped Unit Resources (Chapter.Section) Assessment Common Core State Standards
(http://www.corestandards.org/the‐standards/mathematics)
Lesson 4: Uses and Misuses of Statistics 1.5
CC.9‐12.S.IC.1 Understand statistics as a process for making inferences about population parameters based on a random sample from that population.
CC.9‐12.S.IC.3 Recognize the purposes of and differences among sample surveys, experiments, and observational studies; explain how randomization relates to each.
CC.9‐12.S.IC.4 Use data from a sample survey to estimate a population mean or proportion; develop a margin of error through the use of simulation models for random sampling.
Unit Assessment CFA Lesson 1 ‐ 4
II. FrequencyDistributionsandGraphs
Unwrapped Unit Resources (Chapter.Section) Assessment Common Core State Standards
(http://www.corestandards.org/the‐standards/mathematics)
Lesson 1: Organizing Data Using Categorical, Ungrouped, and Grouped Frequency Distributions
2.1
CC.9‐12.S.ID.1 Represent data with plots on the real number line (dot plots, histograms, and box plots).
CC.9‐12.S.ID.4 Use the mean and standard deviation of a data set to fit it to a normal distribution and to estimate population percentages. Recognize that there are data sets for which such a procedure is not appropriate. Use calculators, spreadsheets, and tables to estimate areas under the normal curve.
CC.9‐12.S.ID.5 Summarize categorical data for two categories in two‐way frequency tables. Interpret relative frequencies in the context of the data (including joint, marginal, and conditional relative frequencies). Recognize possible associations and trends in the data.
CC.9‐12.S.ID.6 Represent data on two quantitative variables on a scatter plot, and describe how the variables are related.

GRADE 9‐12 MATHEMATICS CURRICULUM PROBABILITYANDSTATISTICS–A
Waterford Public Schools 555
Unwrapped Unit Resources (Chapter.Section) Assessment Common Core State Standards
(http://www.corestandards.org/the‐standards/mathematics)
Lesson 2: Histograms, Frequency Polygons, and Ogives 2.2
CC.9‐12.S.ID.1 Represent data with plots on the real number line (dot plots, histograms, and box plots).
CC.9‐12.S.ID.4 Use the mean and standard deviation of a data set to fit it to a normal distribution and to estimate population percentages. Recognize that there are data sets for which such a procedure is not appropriate. Use calculators, spreadsheets, and tables to estimate areas under the normal curve.
CC.9‐12.S.ID.5 Summarize categorical data for two categories in two‐way frequency tables. Interpret relative frequencies in the context of the data (including joint, marginal, and conditional relative frequencies). Recognize possible associations and trends in the data.
CC.9‐12.S.ID.6 Represent data on two quantitative variables on a scatter plot, and describe how the variables are related.
Lesson 3: Pareto Charts, Time Series Graphs, and Pie Graphs 2.3
CC.9‐12.S.ID.1 Represent data with plots on the real number line (dot plots, histograms, and box plots).
CC.9‐12.S.ID.4 Use the mean and standard deviation of a data set to fit it to a normal distribution and to estimate population percentages. Recognize that there are data sets for which such a procedure is not appropriate. Use calculators, spreadsheets, and tables to estimate areas under the normal curve.
CC.9‐12.S.ID.5 Summarize categorical data for two categories in two‐way frequency tables. Interpret relative frequencies in the context of the data (including joint, marginal, and conditional relative frequencies). Recognize possible associations and trends in the data.
CC.9‐12.S.ID.6 Represent data on two quantitative variables on a scatter plot, and describe how the variables are related.
Unit Assessment CFA Lesson 1 ‐ 3

GRADE 9‐12 MATHEMATICS CURRICULUM PROBABILITYANDSTATISTICS–A
Waterford Public Schools 556
IV. DataDescription
Unwrapped Unit Resources (Chapter.Section) Assessment Common Core State Standards
(http://www.corestandards.org/the‐standards/mathematics)
Lesson 1: Measures of Central Tendency 3.1
CC.9‐12.S.ID.2 Use statistics appropriate to the shape of the data distribution to compare center (median, mean) and spread (interquartile range, standard deviation) of two or more different data sets.
CC.9‐12.S.ID.3 Interpret differences in shape, center, and spread in the context of the data sets, accounting for possible effects of extreme data points (outliers).
Lesson 2: Measures of Variation 3.2
CC.9‐12.S.ID.2 Use statistics appropriate to the shape of the data distribution to compare center (median, mean) and spread (interquartile range, standard deviation) of two or more different data sets.
CC.9‐12.S.ID.3 Interpret differences in shape, center, and spread in the context of the data sets, accounting for possible effects of extreme data points (outliers).
Lesson 3: Measures of Position 3.3
CC.9‐12.S.ID.2 Use statistics appropriate to the shape of the data distribution to compare center (median, mean) and spread (interquartile range, standard deviation) of two or more different data sets.
CC.9‐12.S.ID.3 Interpret differences in shape, center, and spread in the context of the data sets, accounting for possible effects of extreme data points (outliers).
Lesson 4: Exploratory Data Analysis 3.4
CC.9‐12.S.ID.2 Use statistics appropriate to the shape of the data distribution to compare center (median, mean) and spread (interquartile range, standard deviation) of two or more different data sets.
CC.9‐12.S.ID.3 Interpret differences in shape, center, and spread in the context of the data sets, accounting for possible effects of extreme data points (outliers).
Unit Assessment CFA Lesson 1 ‐ 4

GRADE 9‐12 MATHEMATICS CURRICULUM PROBABILITYANDSTATISTICS–A
Waterford Public Schools 557
QuarterTwo
V. ProbabilityandCountingRules
Unwrapped Unit Resources (Chapter.Section) Assessment Common Core State Standards
(http://www.corestandards.org/the‐standards/mathematics)
Lesson 1: Sample Spaces and Probability 4.1
CC.9‐12.S.IC.2 Decide if a specified model is consistent with results from a given data‐generating process, e.g., using simulation.
CC.9‐12.S.CP.1 Describe events as subsets of a sample space (the set of outcomes) using characteristics (or categories) of the outcomes, or as unions, intersections, or complements of other events (“or,” “and,” “not”).
Lesson 2: Addition Rules for Probability 4.2 CC.9‐12.S.CP.7 Apply the Addition Rule, P(A or B) = P(A) + P(B) – P(A and B), and interpret the answer in terms of the model.
Lesson 3: Multiplication Rules and Conditional Probability 4.3
CC.9‐12.S.CP.2 Understand that two events A and B are independent if the probability of A and B occurring together is the product of their probabilities, and use this characterization to determine if they are independent.
CC.9‐12.S.CP.3 Understand the conditional probability of A given B as P(A and B)/P(B), and interpret independence of A and B as saying that the conditional probability of A given B is the same as the probability of A, and the conditional probability of B given A is the same as the probability of B.
CC.9‐12.S.CP.5 Recognize and explain the concepts of conditional probability and independence in everyday language and everyday situations.
CC.9‐12.S.CP.8 Apply the general Multiplication Rule in a uniform probability model, P(A and B) = P(A)P(B|A) = P(B)P(A|B), and interpret the answer in terms of the model.
Lesson 4: Counting Rules 4.4 CC.9‐12.S.CP.9 Use permutations and combinations to compute probabilities of compound events and solve problems.
Unit Assessment CFA Lesson 1 ‐ 4

GRADE 9‐12 MATHEMATICS CURRICULUM PROBABILITYANDSTATISTICS–A
Waterford Public Schools 558
VII. DiscreteProbabilityDistributions
Unwrapped Unit Resources (Chapter.Section) Assessment Common Core State Standards
(http://www.corestandards.org/the‐standards/mathematics)
Lesson 1: Probability Distributions 5.1
CC.9‐12.S.MD.1 Define a random variable for a quantity of interest by assigning a numerical value to each event in a sample space; graph the corresponding probability distribution using the same graphical displays as for data distributions.
Lesson 2: Mean, Variance, and Expectation 5.2
CC.9‐12.S.MD.2 Calculate the expected value of a random variable; interpret it as the mean of the probability distribution.
CC.9‐12.S.MD.5 Weigh the possible outcomes of a decision by assigning probabilities to payoff values and finding expected values.
CC.9‐12.S.MD.6 Use probabilities to make fair decisions (e.g., drawing by lots, using a random number generator).
CC.9‐12.S.MD.7 Analyze decisions and strategies using probability concepts (e.g., product testing, medical testing, pulling a hockey goalie at the end of a game).
Lesson 3: Binomial Distribution 5.3Lesson 4: Multinomial and Poisson Distributions 5.4
Unit Assessment CFA Lesson 1 ‐ 4
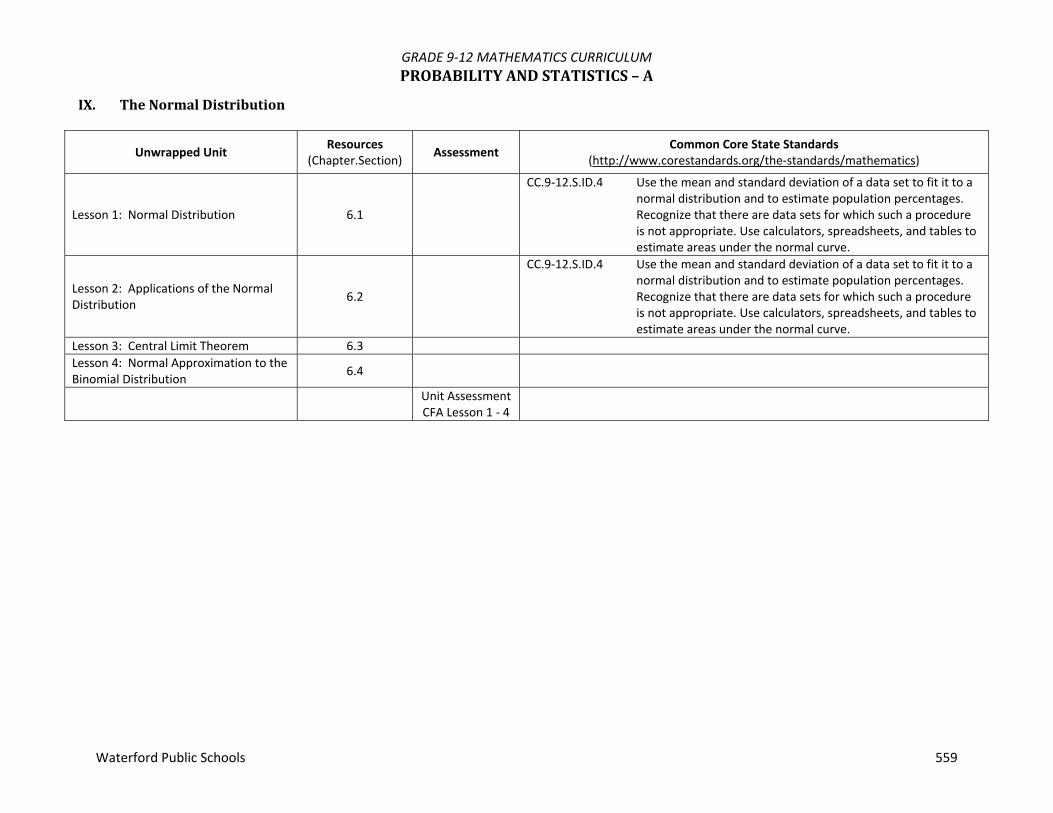
GRADE 9‐12 MATHEMATICS CURRICULUM PROBABILITYANDSTATISTICS–A
Waterford Public Schools 559
IX. TheNormalDistribution
Unwrapped Unit Resources (Chapter.Section) Assessment Common Core State Standards
(http://www.corestandards.org/the‐standards/mathematics)
Lesson 1: Normal Distribution 6.1
CC.9‐12.S.ID.4 Use the mean and standard deviation of a data set to fit it to a normal distribution and to estimate population percentages. Recognize that there are data sets for which such a procedure is not appropriate. Use calculators, spreadsheets, and tables to estimate areas under the normal curve.
Lesson 2: Applications of the Normal Distribution 6.2
CC.9‐12.S.ID.4 Use the mean and standard deviation of a data set to fit it to a normal distribution and to estimate population percentages. Recognize that there are data sets for which such a procedure is not appropriate. Use calculators, spreadsheets, and tables to estimate areas under the normal curve.
Lesson 3: Central Limit Theorem 6.3Lesson 4: Normal Approximation to the Binomial Distribution 6.4
Unit Assessment CFA Lesson 1 ‐ 4

GRADE 9‐12 MATHEMATICS CURRICULUM PRE‐CALCULUSANDTRIGONOMETRY–A
Waterford Public Schools 560
This course will explore the following topics: analytic geometry, linear, quadratic, polynomial and exponential functions and their inverses, conic sections, and trigonometric functions. Essential Questions
1. What are the different types of functions? 2. What are the operations that apply to all functions? 3. How can algebraic and geometric representations be used to describe the behavior of the function? 4. How are the algebraic, numerical, and graphical representations of functions related? 5. How can you use functions to solve real life problems? 6. What are the different types of conic sections and how are they formed? 7. What are the transformations that apply to all conic sections? 8. How can conics be described numerically, algebraically, and graphically? 9. How is sine, cosine, tangent, and their cofunctions used to determine information about a right triangle? 10. How are the trigonometric functions periodic functions? 11. Is the Cartesian coordinate system the only way to plot trigonometric functions? 12. What type of real world problem would use trigonometry to help model and solve it? 13. How can the trigonometric graphs be transformed?
Course #: 361 Prerequisite: Successful completion of Algebra II – A Credit: 1 credit Resources: www.connected.mcgraw‐hill.com

GRADE 9‐12 MATHEMATICS CURRICULUM PRE‐CALCULUSANDTRIGONOMETRY–A
Waterford Public Schools 561
QuarterOneI. FunctionsandEquations
Unwrapped Unit Resources (Chapter.Section) Assessment Common Core State Standards
(http://www.corestandards.org/the‐standards/mathematics)
Lesson 1: Operations with Complex Numbers 0.2
CC.9‐12.N.CN.1 Know there is a complex number i such that i2 = –1, and every complex number has the form a + bi with a and b real.
CC.9‐12.N.CN.2 Use the relation i2 = –1 and the commutative, associative, and distributive properties to add, subtract, and multiply complex numbers.
CC.9‐12.N.CN.8 Extend polynomial identities to the complex numbers.
Lesson 2: Quadratic Functions & Equations 0.3
CC.9‐12.F.IF.4 For a function that models a relationship between two quantities, interpret key features of graphs and tables in terms of the quantities, and sketch graphs showing key features given a verbal description of the relationship.
CC.9‐12.A.SSE.1a Interpret parts of an expression, such as terms, factors, and coefficients.
CC.9‐12.A.SSE.1b Interpret complicated expressions by viewing one or more of their parts as a single entity.
CC.9‐12.CED.2 Use the structure of an expression to identify ways to rewrite it.
CC.9‐12.F.IF.5 Relate the domain of a function to its graph and, where applicable, to the quantitative relationship it describes.
CC.9‐12.F.IF.9 Compare properties of two functions each represented in a different way (algebraically, graphically, numerically in tables, or by verbal descriptions).
Lesson 3: nth Roots; Real Exponents 0.4 CFA 0.2 to 0.4 CC.9‐12.A.SSE.2 Use the structure of an expression to identify ways to rewrite it.

GRADE 9‐12 MATHEMATICS CURRICULUM PRE‐CALCULUSANDTRIGONOMETRY–A
Waterford Public Schools 562
II. Functions
Unwrapped Unit Resources (Chapter.Section) Assessment Common Core State Standards
(http://www.corestandards.org/the‐standards/mathematics)
Lesson 4: Functions 1.1
CC.9‐12.F.IF.4 For a function that models a relationship between two quantities, interpret key features of graphs and tables in terms of the quantities, and sketch graphs showing key features given a verbal description of the relationship.
CC.9‐12.F.IF.5 Relate the domain of a function to its graph and, where applicable, to the quantitative relationship it describes.
Lesson 5: Analyzing Graphs of Functions & Relations 1.2
CC.9‐12.A.SSE.1b Interpret complicated expressions by viewing one or more of their parts as a single entity.
CC.9‐12.F.IF.4 For a function that models a relationship between two quantities, interpret key features of graphs and tables in terms of the quantities, and sketch graphs showing key features given a verbal description of the relationship.
Lesson 6: Continuity, End Behavior & Limits 1.3
CC.9‐12.A.SSE.1b Interpret complicated expressions by viewing one or more of their parts as a single entity.
CC.9‐12.A.CED.2 Create equations in two or more variables to represent relationships between quantities; graph equations on coordinate axes with labels and scales.
CC.9‐12.A.CED.3 Represent constraints by equations or inequalities, and by systems of equations and/or inequalities, and interpret solutions as viable or nonviable options in a modeling context.
CC.9‐12.F.IF.4 For a function that models a relationship between two quantities, interpret key features of graphs and tables in terms of the quantities, and sketch graphs showing key features given a verbal description of the relationship.
CC.9‐12.F.IF.5 Relate the domain of a function to its graph and, where applicable, to the quantitative relationship it describes.
CC.9‐12.F.IF.7b Graph square root, cube root, and piecewise‐defined functions, including step functions and absolute value functions.
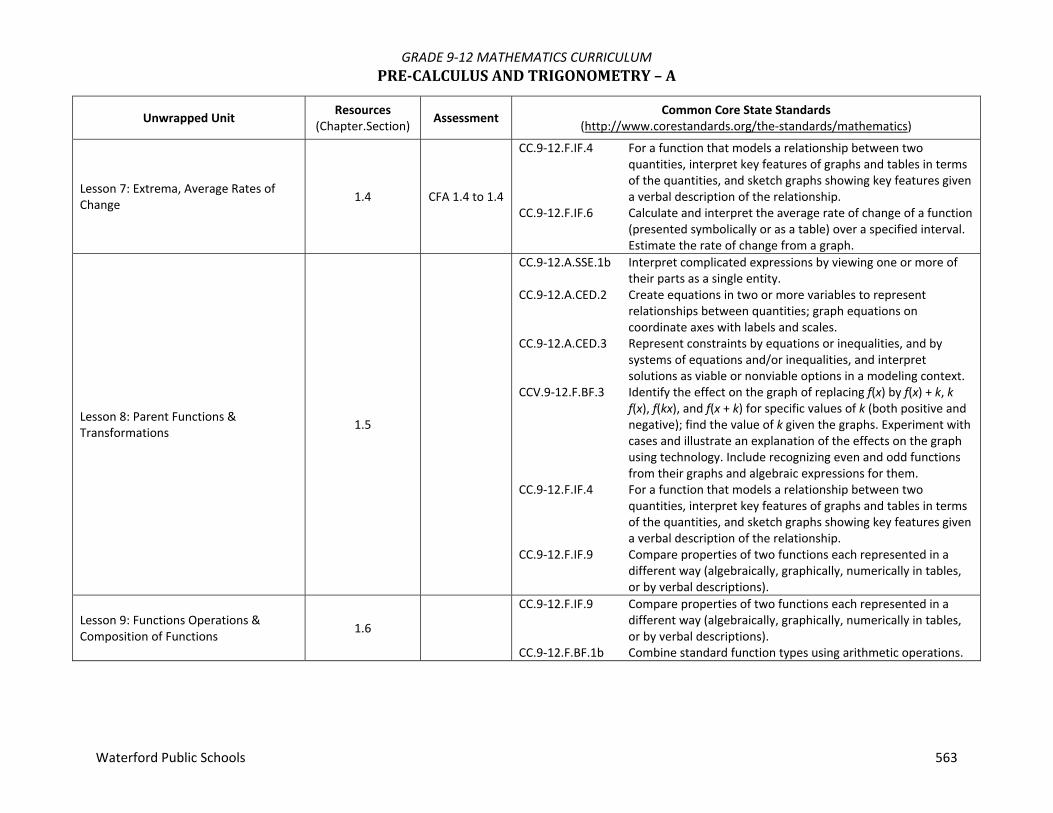
GRADE 9‐12 MATHEMATICS CURRICULUM PRE‐CALCULUSANDTRIGONOMETRY–A
Waterford Public Schools 563
Unwrapped Unit Resources (Chapter.Section) Assessment Common Core State Standards
(http://www.corestandards.org/the‐standards/mathematics)
Lesson 7: Extrema, Average Rates of Change 1.4 CFA 1.4 to 1.4
CC.9‐12.F.IF.4 For a function that models a relationship between two quantities, interpret key features of graphs and tables in terms of the quantities, and sketch graphs showing key features given a verbal description of the relationship.
CC.9‐12.F.IF.6 Calculate and interpret the average rate of change of a function (presented symbolically or as a table) over a specified interval. Estimate the rate of change from a graph.
Lesson 8: Parent Functions & Transformations 1.5
CC.9‐12.A.SSE.1b Interpret complicated expressions by viewing one or more of their parts as a single entity.
CC.9‐12.A.CED.2 Create equations in two or more variables to represent relationships between quantities; graph equations on coordinate axes with labels and scales.
CC.9‐12.A.CED.3 Represent constraints by equations or inequalities, and by systems of equations and/or inequalities, and interpret solutions as viable or nonviable options in a modeling context.
CCV.9‐12.F.BF.3 Identify the effect on the graph of replacing f(x) by f(x) + k, k f(x), f(kx), and f(x + k) for specific values of k (both positive and negative); find the value of k given the graphs. Experiment with cases and illustrate an explanation of the effects on the graph using technology. Include recognizing even and odd functions from their graphs and algebraic expressions for them.
CC.9‐12.F.IF.4 For a function that models a relationship between two quantities, interpret key features of graphs and tables in terms of the quantities, and sketch graphs showing key features given a verbal description of the relationship.
CC.9‐12.F.IF.9 Compare properties of two functions each represented in a different way (algebraically, graphically, numerically in tables, or by verbal descriptions).
Lesson 9: Functions Operations & Composition of Functions 1.6
CC.9‐12.F.IF.9 Compare properties of two functions each represented in a different way (algebraically, graphically, numerically in tables, or by verbal descriptions).
CC.9‐12.F.BF.1b Combine standard function types using arithmetic operations.

GRADE 9‐12 MATHEMATICS CURRICULUM PRE‐CALCULUSANDTRIGONOMETRY–A
Waterford Public Schools 564
Unwrapped Unit Resources (Chapter.Section) Assessment Common Core State Standards
(http://www.corestandards.org/the‐standards/mathematics)
Lesson 10: Inverse Relations & Functions 1.7 CFA 1.5 to 1.7
CC.9‐12.F.IF.4 For a function that models a relationship between two quantities, interpret key features of graphs and tables in terms of the quantities, and sketch graphs showing key features given a verbal description of the relationship.
CC.9‐12.F.IF.5 Relate the domain of a function to its graph and, where applicable, to the quantitative relationship it describes.
CC.9‐12.F.BF.4a Solve an equation of the form f(x) = c for a simple function f that has an inverse and write an expression for the inverse.
Unit Assessment Lessons 1–10
III. PolynomialsandPolynomialFunctions
Unwrapped Unit Resources (Chapter.Section) Assessment Common Core State Standards
(http://www.corestandards.org/the‐standards/mathematics)
Lesson 1: Power & Radical Functions 2.1
CC.9‐12.A.SSE.1b Interpret complicated expressions by viewing one or more of their parts as a single entity.
CC.9‐12.A.CED.2 Create equations in two or more variables to represent relationships between quantities; graph equations on coordinate axes with labels and scales.
CC.9‐12.A.CED.3 Represent constraints by equations or inequalities, and by systems of equations and/or inequalities, and interpret solutions as viable or nonviable options in a modeling context.
CC.9‐12.F.IF.4 For a function that models a relationship between two quantities, interpret key features of graphs and tables in terms of the quantities, and sketch graphs showing key features given a verbal description of the relationship.
CC.9‐12.F.IF.5 Relate the domain of a function to its graph and, where applicable, to the quantitative relationship it describes.
CC.9‐12.F.IF.7b Graph square root, cube root, and piecewise‐defined functions, including step functions and absolute value functions.

GRADE 9‐12 MATHEMATICS CURRICULUM PRE‐CALCULUSANDTRIGONOMETRY–A
Waterford Public Schools 565
Unwrapped Unit Resources (Chapter.Section) Assessment Common Core State Standards
(http://www.corestandards.org/the‐standards/mathematics)
Lesson 2: Polynomial Functions 2.2
CC.9‐12.A.CED.2 Create equations in two or more variables to represent relationships between quantities; graph equations on coordinate axes with labels and scales.
CC.9‐12.F.IF.4 For a function that models a relationship between two quantities, interpret key features of graphs and tables in terms of the quantities, and sketch graphs showing key features given a verbal description of the relationship.
CC.9‐12.F.IF.5 Relate the domain of a function to its graph and, where applicable, to the quantitative relationship it describes.
CC.9‐12.F.IF.7c Graph polynomial functions, identifying zeros when suitable factorizations are available, and showing end behavior.
CC.9‐12.F.IF.9 Compare properties of two functions each represented in a different way (algebraically, graphically, numerically in tables, or by verbal descriptions).
Lesson 3: Remainder and Factor Theorems 2.3
CC.9‐12.A.APR.2 Know and apply the Remainder Theorem: For a polynomial p(x) and a number a, the remainder on division by x – a is p(a), so p(a) = 0 if and only if (x – a) is a factor of p(x).
CC.9‐12.A.CED.1 Create equations and inequalities in one variable and use them to solve problems.
CC.9‐12.F.IF.7c Graph polynomial functions, identifying zeros when suitable factorizations are available, and showing end behavior.
Lesson 4: Zeros of Polynomial Functions 2.4 CFA 2‐1 to 2‐4
CC.9‐12.N.CN.9 Know the Fundamental Theorem of Algebra; show that it is true for quadratic polynomials.
CC.9‐12.A.APR.3 Identify zeros of polynomials when suitable factorizations are available, and use the zeros to construct a rough graph of the function defined by the polynomial.
CC.9‐12.A.CED.1 Create equations and inequalities in one variable and use them to solve problems.
CC.9‐12.F.IF.4 For a function that models a relationship between two quantities, interpret key features of graphs and tables in terms of the quantities, and sketch graphs showing key features given a verbal description of the relationship.
CC.9‐12.F.IF.7c Graph polynomial functions, identifying zeros when suitable factorizations are available, and showing end behavior.

GRADE 9‐12 MATHEMATICS CURRICULUM PRE‐CALCULUSANDTRIGONOMETRY–A
Waterford Public Schools 566
Unwrapped Unit Resources (Chapter.Section) Assessment Common Core State Standards
(http://www.corestandards.org/the‐standards/mathematics)
Lesson 5: Rational Functions (omit rational equations) 2.5
CC.9‐12.A.APR.7 Understand that rational expressions form a system analogous to the rational numbers, closed under addition, subtraction, multiplication, and division by a nonzero rational expression; add, subtract, multiply, and divide rational expressions.
CC.9‐12.A.CED.2 Create equations in two or more variables to represent relationships between quantities; graph equations on coordinate axes with labels and scales.
CC.9‐12.F.IF.4 For a function that models a relationship between two quantities, interpret key features of graphs and tables in terms of the quantities, and sketch graphs showing key features given a verbal description of the relationship.
CC.9‐12.F.IF.5 Relate the domain of a function to its graph and, where applicable, to the quantitative relationship it describes.
CC.9‐12.F.IF.9 Compare properties of two functions each represented in a different way (algebraically, graphically, numerically in tables, or by verbal descriptions).
Lesson 6: Non‐linear Inequalities 2.6
CC.9‐12.APR.7 Understand that rational expressions form a system analogous to the rational numbers, closed under addition, subtraction, multiplication, and division by a nonzero rational expression; add, subtract, multiply, and divide rational expressions.
CC.9‐12.A.CED.1 Create equations and inequalities in one variable and use them to solve problems.
CC.9‐12.A.CED.3 Represent constraints by equations or inequalities, and by systems of equations and/or inequalities, and interpret solutions as viable or nonviable options in a modeling context.
CC.9‐12.A.REI.2 Solve simple rational and radical equations in one variable, and give examples showing how extraneous solutions may arise.
Lesson 7: Partial Fractions 6.4 CFA 2.5 to 6.4
Unit
Assessment Lessons 1 – 7

GRADE 9‐12 MATHEMATICS CURRICULUM PRE‐CALCULUSANDTRIGONOMETRY–A
Waterford Public Schools 567
QuarterTwo
IV. Exponential&LogarithmicFunctions
Unwrapped Unit Resources (Chapter.Section) Assessment Common Core State Standards
(http://www.corestandards.org/the‐standards/mathematics)
Lesson 1: Exponential Functions 3.1
CC.9‐12.A.CED.2 Create equations in two or more variables to represent relationships between quantities; graph equations on coordinate axes with labels and scales.
CC.9‐12.F.IF.4 For a function that models a relationship between two quantities, interpret key features of graphs and tables in terms of the quantities, and sketch graphs showing key features given a verbal description of the relationship.
CC.9‐12.F.IF.5 Relate the domain of a function to its graph and, where applicable, to the quantitative relationship it describes.
CC.9‐12.F.IF.7e Graph exponential and logarithmic functions, showing intercepts and end behavior, and trigonometric functions, showing period, midline, and amplitude.
CC.9‐12.F.IF.8 Write a function defined by an expression in different but equivalent forms to reveal and explain different properties of the function.
CC.9‐12.F.IF.9 Compare properties of two functions each represented in a different way (algebraically, graphically, numerically in tables, or by verbal descriptions).
CC.9‐12.F.BF.3 Identify the effect on the graph of replacing f(x) by f(x) + k, k f(x), f(kx), and f(x + k) for specific values of k (both positive and negative); find the value of k given the graphs. Experiment with cases and illustrate an explanation of the effects on the graph using technology. Include recognizing even and odd functions from their graphs and algebraic expressions for them.

GRADE 9‐12 MATHEMATICS CURRICULUM PRE‐CALCULUSANDTRIGONOMETRY–A
Waterford Public Schools 568
Unwrapped Unit Resources (Chapter.Section) Assessment Common Core State Standards
(http://www.corestandards.org/the‐standards/mathematics)
Lesson 2: Logarithmic Functions 3.2
CC.9‐12.A.SSE.2 Use the structure of an expression to identify ways to rewrite it.
CC.9‐12.A.CED.2 Create equations in two or more variables to represent relationships between quantities; graph equations on coordinate axes with labels and scales.
CC.9‐12.F.IF.4 For a function that models a relationship between two quantities, interpret key features of graphs and tables in terms of the quantities, and sketch graphs showing key features given a verbal description of the relationship.
CC.9‐12.F.IF.5 Relate the domain of a function to its graph and, where applicable, to the quantitative relationship it describes.
CC.9‐12.F.IF.7e Graph exponential and logarithmic functions, showing intercepts and end behavior, and trigonometric functions, showing period, midline, and amplitude.
CC.9‐12.F.BF.3 Identify the effect on the graph of replacing f(x) by f(x) + k, k f(x), f(kx), and f(x + k) for specific values of k (both positive and negative); find the value of k given the graphs. Experiment with cases and illustrate an explanation of the effects on the graph using technology. Include recognizing even and odd functions from their graphs and algebraic expressions for them.
Lesson 3: Properties of Logarithms 3.3 CC.9‐12.A.CED.1 Create equations and inequalities in one variable and use them to solve problems.
Lesson 4: Solving Logarithmic and Exponential Equations 3.4 CFA 3.1 to 3.4
CC.9‐12.A.SSE.2 Use the structure of an expression to identify ways to rewrite it.
CC.9‐12.A.CED.1 Create equations and inequalities in one variable and use them to solve problems.
Unit Assessment Lessons 1 – 4
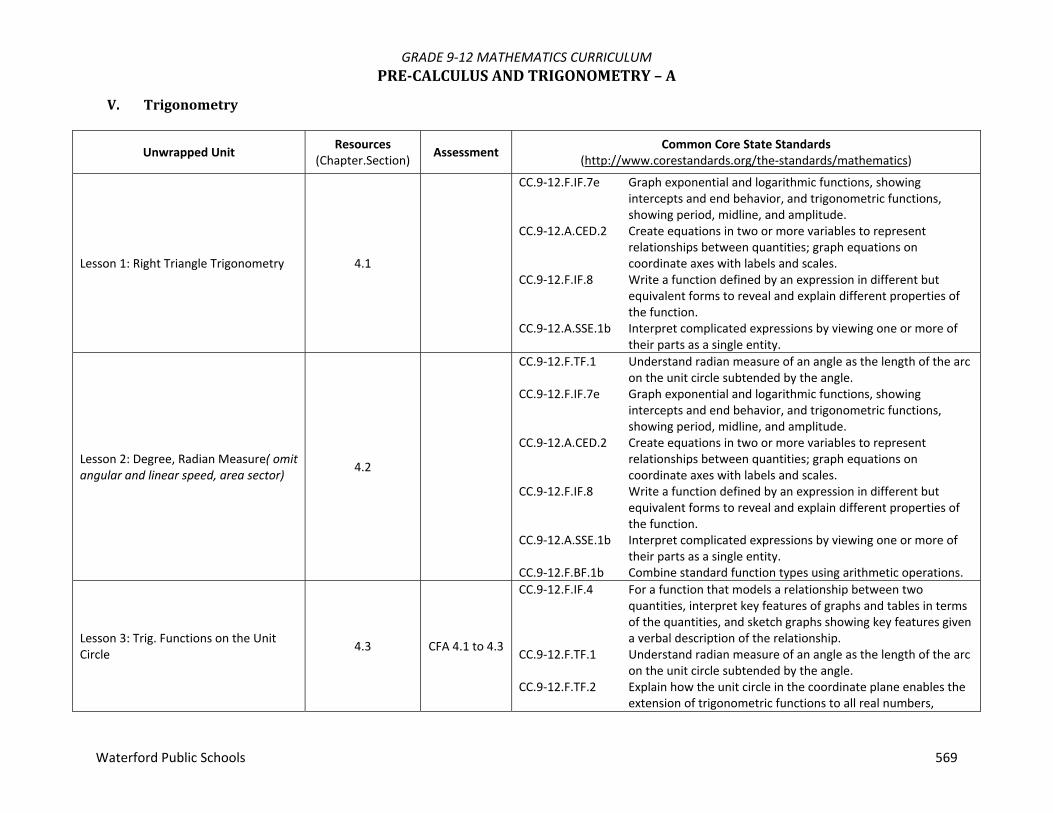
GRADE 9‐12 MATHEMATICS CURRICULUM PRE‐CALCULUSANDTRIGONOMETRY–A
Waterford Public Schools 569
V. Trigonometry
Unwrapped Unit Resources (Chapter.Section) Assessment Common Core State Standards
(http://www.corestandards.org/the‐standards/mathematics)
Lesson 1: Right Triangle Trigonometry 4.1
CC.9‐12.F.IF.7e Graph exponential and logarithmic functions, showing intercepts and end behavior, and trigonometric functions, showing period, midline, and amplitude.
CC.9‐12.A.CED.2 Create equations in two or more variables to represent relationships between quantities; graph equations on coordinate axes with labels and scales.
CC.9‐12.F.IF.8 Write a function defined by an expression in different but equivalent forms to reveal and explain different properties of the function.
CC.9‐12.A.SSE.1b Interpret complicated expressions by viewing one or more of their parts as a single entity.
Lesson 2: Degree, Radian Measure( omit angular and linear speed, area sector) 4.2
CC.9‐12.F.TF.1 Understand radian measure of an angle as the length of the arc on the unit circle subtended by the angle.
CC.9‐12.F.IF.7e Graph exponential and logarithmic functions, showing intercepts and end behavior, and trigonometric functions, showing period, midline, and amplitude.
CC.9‐12.A.CED.2 Create equations in two or more variables to represent relationships between quantities; graph equations on coordinate axes with labels and scales.
CC.9‐12.F.IF.8 Write a function defined by an expression in different but equivalent forms to reveal and explain different properties of the function.
CC.9‐12.A.SSE.1b Interpret complicated expressions by viewing one or more of their parts as a single entity.
CC.9‐12.F.BF.1b Combine standard function types using arithmetic operations.
Lesson 3: Trig. Functions on the Unit Circle 4.3 CFA 4.1 to 4.3
CC.9‐12.F.IF.4 For a function that models a relationship between two quantities, interpret key features of graphs and tables in terms of the quantities, and sketch graphs showing key features given a verbal description of the relationship.
CC.9‐12.F.TF.1 Understand radian measure of an angle as the length of the arc on the unit circle subtended by the angle.
CC.9‐12.F.TF.2 Explain how the unit circle in the coordinate plane enables the extension of trigonometric functions to all real numbers,

GRADE 9‐12 MATHEMATICS CURRICULUM PRE‐CALCULUSANDTRIGONOMETRY–A
Waterford Public Schools 570
Unwrapped Unit Resources (Chapter.Section) Assessment Common Core State Standards
(http://www.corestandards.org/the‐standards/mathematics)
interpreted as radian measures of angles traversed counterclockwise around the unit circle.
CC.9‐12.F.BF.4a Solve an equation of the form f(x) = c for a simple function f that has an inverse and write an expression for the inverse.
CC.9‐12.F.IF.7e Graph exponential and logarithmic functions, showing intercepts and end behavior, and trigonometric functions, showing period, midline, and amplitude.
CC.9‐12.F.IF.8 Write a function defined by an expression in different but equivalent forms to reveal and explain different properties of the function.
CC.9‐12.F.IF.9 Compare properties of two functions each represented in a different way (algebraically, graphically, numerically in tables, or by verbal descriptions).
CC.9‐12.A.SSE.1b Interpret complicated expressions by viewing one or more of their parts as a single entity.
Lesson 4:Graphing Sine, Cosine Functions 4.4
CC.9‐12.A.CED.2 Create equations in two or more variables to represent relationships between quantities; graph equations on coordinate axes with labels and scales.
CC.9‐12.F.IF.4 For a function that models a relationship between two quantities, interpret key features of graphs and tables in terms of the quantities, and sketch graphs showing key features given a verbal description of the relationship.
CC.9‐12.F.IF.5 Relate the domain of a function to its graph and, where applicable, to the quantitative relationship it describes.
CC.9‐12.F.IF.7e Graph exponential and logarithmic functions, showing intercepts and end behavior, and trigonometric functions, showing period, midline, and amplitude.
CC.9‐12.F.TF.5 Choose trigonometric functions to model periodic phenomena with specified amplitude, frequency, and midline.
CC.9‐12.F.LE.4 For exponential models, express as a logarithm the solution to abct = d where a, c, and d are numbers and the base b is 2, 10, or e; evaluate the logarithm using technology.
CC.9‐12.A.REI.11 Explain why the x‐coordinates of the points where the graphs of the equations y = f(x) and y = g(x) intersect are the solutions of the equation f(x) = g(x); find the solutions approximately,

GRADE 9‐12 MATHEMATICS CURRICULUM PRE‐CALCULUSANDTRIGONOMETRY–A
Waterford Public Schools 571
Unwrapped Unit Resources (Chapter.Section) Assessment Common Core State Standards
(http://www.corestandards.org/the‐standards/mathematics)
e.g., using technology to graph the functions, make tables of values, or find successive approximations. Include cases where f(x) and/or g(x) are linear, polynomial, rational, absolute value, exponential, and logarithmic functions.
Lesson 5: Graphing Other Trig. Functions (omit damped and harmonic)
4.5
CC.9‐12.A.CED.2 Create equations in two or more variables to represent relationships between quantities; graph equations on coordinate axes with labels and scales.
CC.9‐12.F.IF.4 For a function that models a relationship between two quantities, interpret key features of graphs and tables in terms of the quantities, and sketch graphs showing key features given a verbal description of the relationship.
CC.9‐12.F.IF.5 Relate the domain of a function to its graph and, where applicable, to the quantitative relationship it describes.
CC.9‐12.F.IF.7e Graph exponential and logarithmic functions, showing intercepts and end behavior, and trigonometric functions, showing period, midline, and amplitude.
CC.9‐12.F.TF.5 Choose trigonometric functions to model periodic phenomena with specified amplitude, frequency, and midline.
CC.9‐12.F.LE.4 For exponential models, express as a logarithm the solution to abct = d where a, c, and d are numbers and the base b is 2, 10, or e; evaluate the logarithm using technology.
CC.9‐12.A.REI.11 Explain why the x‐coordinates of the points where the graphs of the equations y = f(x) and y = g(x) intersect are the solutions of the equation f(x) = g(x); find the solutions approximately, e.g., using technology to graph the functions, make tables of values, or find successive approximations. Include cases where f(x) and/or g(x) are linear, polynomial, rational, absolute value, exponential, and logarithmic functions.
Lesson 6: Inverse Trig. Functions 4.6 CC.9‐12.A.CED.2 Create equations in two or more variables to represent
relationships between quantities; graph equations on coordinate axes with labels and scales.

GRADE 9‐12 MATHEMATICS CURRICULUM PRE‐CALCULUSANDTRIGONOMETRY–A
Waterford Public Schools 572
Unwrapped Unit Resources (Chapter.Section) Assessment Common Core State Standards
(http://www.corestandards.org/the‐standards/mathematics)
Lesson 7: Law of Sines, Cosines & Heron’s Formula 4.7 CFA 4.4 to 4.7
Unit Assessment Lessons 1 – 7
QuarterThree
VI. TrigonometricIdentities
Unwrapped Unit Resources (Chapter.Section) Assessment Common Core State Standards
(http://www.corestandards.org/the‐standards/mathematics)
Lesson 1: Trigonometric Identities 5.1 CC.9‐12.F.TF.8 Prove the Pythagorean identity sin2(θ) + cos2(θ) = 1 and use it
to find sin(θ), cos(θ), or tan(θ) given sin(θ), cos(θ), or tan(θ) and the quadrant of the angle.
Lesson 2: Verifying Identities 5.2
CC.9‐12.F.TF.8 Prove the Pythagorean identity sin2(θ) + cos2(θ) = 1 and use it to find sin(θ), cos(θ), or tan(θ) given sin(θ), cos(θ), or tan(θ) and the quadrant of the angle.
CC.9‐12.A.CED.2 Create equations in two or more variables to represent relationships between quantities; graph equations on coordinate axes with labels and scales.
CC.9‐12.F.BF.3 Identify the effect on the graph of replacing f(x) by f(x) + k, k f(x), f(kx), and f(x + k) for specific values of k (both positive and negative); find the value of k given the graphs. Experiment with cases and illustrate an explanation of the effects on the graph using technology. Include recognizing even and odd functions from their graphs and algebraic expressions for them.
CC.9‐12.A.APR.1 Understand that polynomials form a system analogous to the integers, namely, they are closed under the operations of addition, subtraction, and multiplication; add, subtract, and multiply polynomials.
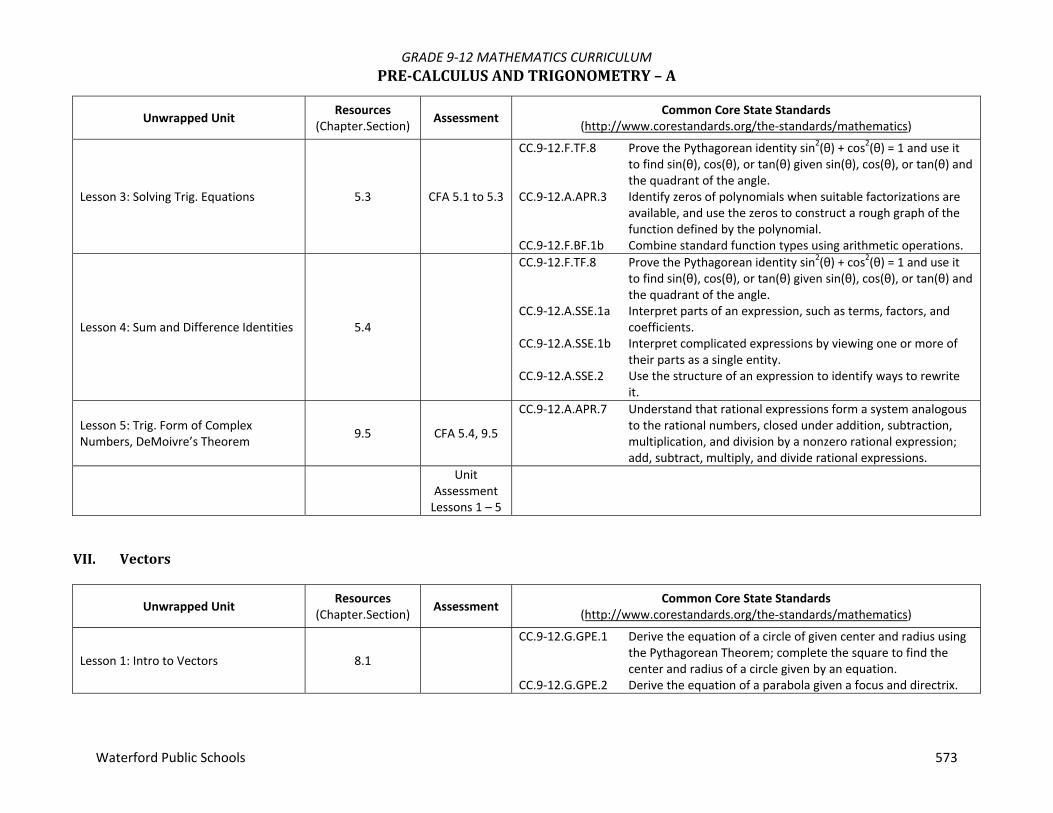
GRADE 9‐12 MATHEMATICS CURRICULUM PRE‐CALCULUSANDTRIGONOMETRY–A
Waterford Public Schools 573
Unwrapped Unit Resources (Chapter.Section) Assessment Common Core State Standards
(http://www.corestandards.org/the‐standards/mathematics)
Lesson 3: Solving Trig. Equations 5.3 CFA 5.1 to 5.3
CC.9‐12.F.TF.8 Prove the Pythagorean identity sin2(θ) + cos2(θ) = 1 and use it to find sin(θ), cos(θ), or tan(θ) given sin(θ), cos(θ), or tan(θ) and the quadrant of the angle.
CC.9‐12.A.APR.3 Identify zeros of polynomials when suitable factorizations are available, and use the zeros to construct a rough graph of the function defined by the polynomial.
CC.9‐12.F.BF.1b Combine standard function types using arithmetic operations.
Lesson 4: Sum and Difference Identities 5.4
CC.9‐12.F.TF.8 Prove the Pythagorean identity sin2(θ) + cos2(θ) = 1 and use it to find sin(θ), cos(θ), or tan(θ) given sin(θ), cos(θ), or tan(θ) and the quadrant of the angle.
CC.9‐12.A.SSE.1a Interpret parts of an expression, such as terms, factors, and coefficients.
CC.9‐12.A.SSE.1b Interpret complicated expressions by viewing one or more of their parts as a single entity.
CC.9‐12.A.SSE.2 Use the structure of an expression to identify ways to rewrite it.
Lesson 5: Trig. Form of Complex Numbers, DeMoivre’s Theorem 9.5 CFA 5.4, 9.5
CC.9‐12.A.APR.7 Understand that rational expressions form a system analogous to the rational numbers, closed under addition, subtraction, multiplication, and division by a nonzero rational expression; add, subtract, multiply, and divide rational expressions.
Unit
Assessment Lessons 1 – 5
VII. Vectors
Unwrapped Unit Resources (Chapter.Section) Assessment Common Core State Standards
(http://www.corestandards.org/the‐standards/mathematics)
Lesson 1: Intro to Vectors 8.1
CC.9‐12.G.GPE.1 Derive the equation of a circle of given center and radius using the Pythagorean Theorem; complete the square to find the center and radius of a circle given by an equation.
CC.9‐12.G.GPE.2 Derive the equation of a parabola given a focus and directrix.

GRADE 9‐12 MATHEMATICS CURRICULUM PRE‐CALCULUSANDTRIGONOMETRY–A
Waterford Public Schools 574
Unwrapped Unit Resources (Chapter.Section) Assessment Common Core State Standards
(http://www.corestandards.org/the‐standards/mathematics)
Lesson 2: Vectors in the Coordinate Plane 8.2 CC.9‐12.G.GPE.2 Derive the equation of a parabola given a focus and directrix.
Lesson 3: Dot Products (omit projections) 8.3 CFA 8.1 to 8.3
CC.9‐12.G.GPE.1 Derive the equation of a circle of given center and radius using the Pythagorean Theorem; complete the square to find the center and radius of a circle given by an equation.
Unit Assessment Lessons 1 – 3
QuarterFour
VIII. Conics
Unwrapped Unit Resources (Chapter.Section) Assessment Common Core State Standards
(http://www.corestandards.org/the‐standards/mathematics)
Lesson 1: Parabolas 7.1
CC.9‐12.F.IF.3 Recognize that sequences are functions, sometimes defined recursively, whose domain is a subset of the integers.
CC.9‐12.A.SSE.1b Interpret complicated expressions by viewing one or more of their parts as a single entity.
CC.9‐12.A.CED.2 Create equations in two or more variables to represent relationships between quantities; graph equations on coordinate axes with labels and scales.
Lesson 2: Ellipses and Circles 7.2
CC.9‐12.A.SSE.1b Interpret complicated expressions by viewing one or more of their parts as a single entity.
CC.9‐12.A.CED.2 Create equations in two or more variables to represent relationships between quantities; graph equations on coordinate axes with labels and scales.

GRADE 9‐12 MATHEMATICS CURRICULUM PRE‐CALCULUSANDTRIGONOMETRY–A
Waterford Public Schools 575
Unwrapped Unit Resources (Chapter.Section) Assessment Common Core State Standards
(http://www.corestandards.org/the‐standards/mathematics)
Lesson 3: Hyperbolas 7.3
CC.9‐12.A.SSE.1b Interpret complicated expressions by viewing one or more of their parts as a single entity.
CC.9‐12.A.CED.2 Create equations in two or more variables to represent relationships between quantities; graph equations on coordinate axes with labels and scales.
CC.9‐12.F.IF.3 Recognize that sequences are functions, sometimes defined recursively, whose domain is a subset of the integers.
Unit Assessment Lessons 1 – 3
IX. SeriesandSequences
Unwrapped Unit Resources (Chapter.Section) Assessment Common Core State Standards
(http://www.corestandards.org/the‐standards/mathematics)
Lesson 1: Sequences, Series and Sigma Notation 10.1
CC.9‐12.F.IF.4 For a function that models a relationship between two quantities, interpret key features of graphs and tables in terms of the quantities, and sketch graphs showing key features given a verbal description of the relationship.
CC.9‐12.F.TF.5 Choose trigonometric functions to model periodic phenomena with specified amplitude, frequency, and midline.
Lesson 2: Arithmetic Sequences and Series 10.2 CC.9‐12.A.CED.4 Rearrange formulas to highlight a quantity of interest, using the
same reasoning as in solving equations.
Lesson 3: Geometric Sequences and Series 10.3 CFA 8.1 to 8.3
CC.9‐12.A.SSE.4 Derive the formula for the sum of a finite geometric series (when the common ratio is not 1), and use the formula to solve problems.
CC.9‐12.F.TF.1 Understand radian measure of an angle as the length of the arc on the unit circle subtended by the angle.
Unit Assessment Lessons 1 – 3

GRADE 9‐12 MATHEMATICS CURRICULUM PRE‐CALCULUSANDTRIGONOMETRY–H
Waterford Public Schools 576
This course includes a comprehensive examination of the following topics: analytic geometry, linear, quadratic, polynomial and exponential functions and their inverses, conic sections and trigonometric functions. Recommendation: Grade of B‐ or better in Algebra II – H. Essential Questions
1. What are the different types of functions? 2. What are the operations that apply to all functions? 3. How can algebraic and geometric representations be used to describe the behavior of the function? 4. How are the algebraic, numerical, and graphical representations of functions related? 5. How can you use functions to solve real life problems? 6. What are the different types of conic sections and how are they formed? 7. What are the transformations that apply to all conic sections? 8. How can conics be described numerically, algebraically, and graphically? 9. How is sine, cosine, tangent, and their cofunctions used to determine information about a right triangle? 10. How are the trigonometric functions periodic functions? 11. Is the Cartesian coordinate system the only way to plot trigonometric functions? 12. What type of real world problem would use trigonometry to help model and solve it? 13. How can the trigonometric graphs be transformed?
Course #: 360 Prerequisite: Successful completion of Algebra II – H Credit: 1 credit Resources: www.connected.mcgraw‐hill.com
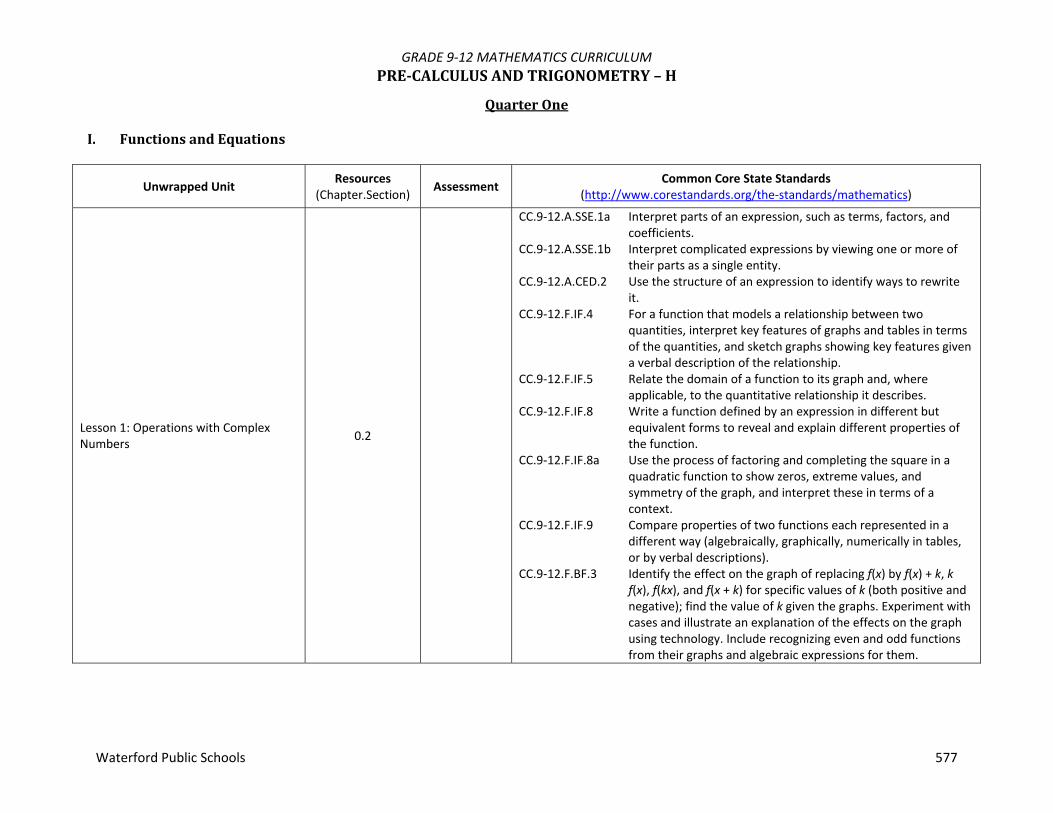
GRADE 9‐12 MATHEMATICS CURRICULUM PRE‐CALCULUSANDTRIGONOMETRY–H
Waterford Public Schools 577
QuarterOneI. FunctionsandEquations
Unwrapped Unit Resources (Chapter.Section) Assessment Common Core State Standards
(http://www.corestandards.org/the‐standards/mathematics)
Lesson 1: Operations with Complex Numbers 0.2
CC.9‐12.A.SSE.1a Interpret parts of an expression, such as terms, factors, and coefficients.
CC.9‐12.A.SSE.1b Interpret complicated expressions by viewing one or more of their parts as a single entity.
CC.9‐12.A.CED.2 Use the structure of an expression to identify ways to rewrite it.
CC.9‐12.F.IF.4 For a function that models a relationship between two quantities, interpret key features of graphs and tables in terms of the quantities, and sketch graphs showing key features given a verbal description of the relationship.
CC.9‐12.F.IF.5 Relate the domain of a function to its graph and, where applicable, to the quantitative relationship it describes.
CC.9‐12.F.IF.8 Write a function defined by an expression in different but equivalent forms to reveal and explain different properties of the function.
CC.9‐12.F.IF.8a Use the process of factoring and completing the square in a quadratic function to show zeros, extreme values, and symmetry of the graph, and interpret these in terms of a context.
CC.9‐12.F.IF.9 Compare properties of two functions each represented in a different way (algebraically, graphically, numerically in tables, or by verbal descriptions).
CC.9‐12.F.BF.3 Identify the effect on the graph of replacing f(x) by f(x) + k, k f(x), f(kx), and f(x + k) for specific values of k (both positive and negative); find the value of k given the graphs. Experiment with cases and illustrate an explanation of the effects on the graph using technology. Include recognizing even and odd functions from their graphs and algebraic expressions for them.

GRADE 9‐12 MATHEMATICS CURRICULUM PRE‐CALCULUSANDTRIGONOMETRY–H
Waterford Public Schools 578
Unwrapped Unit Resources (Chapter.Section) Assessment Common Core State Standards
(http://www.corestandards.org/the‐standards/mathematics)
Lesson 2: Quadratic Functions & Equations 0.3
CC.9‐12.F.IF.4 For a function that models a relationship between two quantities, interpret key features of graphs and tables in terms of the quantities, and sketch graphs showing key features given a verbal description of the relationship.
CC.9‐12.F.IF.5 Relate the domain of a function to its graph and, where applicable, to the quantitative relationship it describes.
Lesson 3: nth Roots; Real Exponents 0.4 CFA 0.2 to 0.4
CC.9‐12.A.SSE.2 Use the structure of an expression to identify ways to rewrite it.
CC.9‐12.A.CED.1 Create equations and inequalities in one variable and use them to solve problems.
CC.9‐12.F.IF.8a Use the process of factoring and completing the square in a quadratic function to show zeros, extreme values, and symmetry of the graph, and interpret these in terms of a context.
CC.9‐12.A.APR.1 Understand that polynomials form a system analogous to the integers, namely, they are closed under the operations of addition, subtraction, and multiplication; add, subtract, and multiply polynomials.
CC.9‐12.A.APR.3 Identify zeros of polynomials when suitable factorizations are available, and use the zeros to construct a rough graph of the function defined by the polynomial.
CC.9‐12.A.APR.4 Prove polynomial identities and use them to describe numerical relationships.
II. Functions
Unwrapped Unit Resources (Chapter.Section) Assessment Common Core State Standards
(http://www.corestandards.org/the‐standards/mathematics)
Lesson 4: Functions 1.1
CC.9‐12.N.CN.1 Know there is a complex number i such that i2 = –1, and every complex number has the form a + bi with a and b real.
CC.9‐12.N.CN.2 Use the relation i2 = –1 and the commutative, associative, and distributive properties to add, subtract, and multiply complex numbers.

GRADE 9‐12 MATHEMATICS CURRICULUM PRE‐CALCULUSANDTRIGONOMETRY–H
Waterford Public Schools 579
Unwrapped Unit Resources (Chapter.Section) Assessment Common Core State Standards
(http://www.corestandards.org/the‐standards/mathematics)
CC.9‐12.N.CN.7 Solve quadratic equations with real coefficients that have complex solutions.
CC.9‐12.N.CN.8 Extend polynomial identities to the complex numbers.
Lesson 5: Analyzing Graphs of Functions & Relations 1.2
CC.9‐12.A.REI.4b Solve quadratic equations by inspection (e.g., for x2 = 49), taking square roots, completing the square, the quadratic formula and factoring, as appropriate to the initial form of the equation. Recognize when the quadratic formula gives complex solutions and write them as a ± bi for real numbers a and b.
CC.9‐12.A.SSE.2 Use the structure of an expression to identify ways to rewrite it.
CC.9‐12.A.APR.4 Prove polynomial identities and use them to describe numerical relationships.
CC.9‐12.A.CED.1 Create equations and inequalities in one variable and use them to solve problems.
CC.9‐12.F.IF.8a Use the process of factoring and completing the square in a quadratic function to show zeros, extreme values, and symmetry of the graph, and interpret these in terms of a context.
CC.9‐12.N.CN.7
Lesson 6: Continuity, End Behavior & Limits 1.3
CC.9‐12.A.REI.4b Solve quadratic equations by inspection (e.g., for x2 = 49), taking square roots, completing the square, the quadratic formula and factoring, as appropriate to the initial form of the equation. Recognize when the quadratic formula gives complex solutions and write them as a ± bi for real numbers a and b.
CC.9‐12.N.CN.7 Solve quadratic equations with real coefficients that have complex solutions.
CC.9‐12.N.CN.8 Extend polynomial identities to the complex numbers. CC.9‐12.A.SSE.1b Interpret complicated expressions by viewing one or more of
their parts as a single entity. CC.9‐12.A.APR.4 Prove polynomial identities and use them to describe numerical
relationships.

GRADE 9‐12 MATHEMATICS CURRICULUM PRE‐CALCULUSANDTRIGONOMETRY–H
Waterford Public Schools 580
Unwrapped Unit Resources (Chapter.Section) Assessment Common Core State Standards
(http://www.corestandards.org/the‐standards/mathematics)
Lesson 7: Extrema, Average Rates of Change 1.4 CFA 1.1 to 1.4
CC.9‐12.A.CED.3 Represent constraints by equations or inequalities, and by systems of equations and/or inequalities, and interpret solutions as viable or nonviable options in a modeling context.
CC.9‐12.A.REI.7 Solve a simple system consisting of a linear equation and a quadratic equation in two variables algebraically and graphically.
CC.9‐12.A.REI.11 Explain why the x‐coordinates of the points where the graphs of the equations y = f(x) and y = g(x) intersect are the solutions of the equation f(x) = g(x); find the solutions approximately, e.g., using technology to graph the functions, make tables of values, or find successive approximations. Include cases where f(x) and/or g(x) are linear, polynomial, rational, absolute value, exponential, and logarithmic functions.
Lesson 8: Parent Functions & Transformations 1.5
Lesson 9: Functions Operations & Composition of Functions 1.6
Lesson 10: Inverse Relations & Functions 1.7 CFA 1.5 to 1.7
Unit Assessment Lessons 1‐10
III. PolynomialsandPolynomialFunctions
Unwrapped Unit Resources (Chapter.Section) Assessment Common Core State Standards
(http://www.corestandards.org/the‐standards/mathematics)
Lesson 1: Power & Radical Functions 2.1
CC.9‐12.A.APR.1 Understand that polynomials form a system analogous to the integers, namely, they are closed under the operations of addition, subtraction, and multiplication; add, subtract, and multiply polynomials.
CC.9‐12.A.APR.3 Identify zeros of polynomials when suitable factorizations are available, and use the zeros to construct a rough graph of the

GRADE 9‐12 MATHEMATICS CURRICULUM PRE‐CALCULUSANDTRIGONOMETRY–H
Waterford Public Schools 581
Unwrapped Unit Resources (Chapter.Section) Assessment Common Core State Standards
(http://www.corestandards.org/the‐standards/mathematics)
function defined by the polynomial.CC.9‐12.F.IF.4 For a function that models a relationship between two
quantities, interpret key features of graphs and tables in terms of the quantities, and sketch graphs showing key features given a verbal description of the relationship.
CC.9‐12.F.IF.5 Relate the domain of a function to its graph and, where applicable, to the quantitative relationship it describes.
CC.9‐12.F.IF.7c Graph polynomial functions, identifying zeros when suitable factorizations are available, and showing end behavior.
CC.9‐12.F.IF.9 Compare properties of two functions each represented in a different way (algebraically, graphically, numerically in tables, or by verbal descriptions).
CC.9‐12.A.CED.2 Create equations in two or more variables to represent relationships between quantities; graph equations on coordinate axes with labels and scales.
Lesson 2: Polynomial Functions 2.2
CC.9‐12.A.CED.1 Create equations and inequalities in one variable and use them to solve problems.
CC.9‐12.A.REI.11 Explain why the x‐coordinates of the points where the graphs of the equations y = f(x) and y = g(x) intersect are the solutions of the equation f(x) = g(x); find the solutions approximately, e.g., using technology to graph the functions, make tables of values, or find successive approximations. Include cases where f(x) and/or g(x) are linear, polynomial, rational, absolute value, exponential, and logarithmic functions.
Lesson 3: Remainder and Factor Theorems 2.3
CC.9‐12.A.APR.1 Understand that polynomials form a system analogous to the integers, namely, they are closed under the operations of addition, subtraction, and multiplication; add, subtract, and multiply polynomials.
CC.9‐12.A.APR.2 Know and apply the Remainder Theorem: For a polynomial p(x) and a number a, the remainder on division by x – a is p(a), so p(a) = 0 if and only if (x – a) is a factor of p(x).
CC.9‐12.A.APR.6 Know and apply the Remainder Theorem: For a polynomial p(x) and a number a, the remainder on division by x – a is p(a), so p(a) = 0 if and only if (x – a) is a factor of p(x).
CC.9‐12.N.CN.7 Solve quadratic equations with real coefficients that have

GRADE 9‐12 MATHEMATICS CURRICULUM PRE‐CALCULUSANDTRIGONOMETRY–H
Waterford Public Schools 582
Unwrapped Unit Resources (Chapter.Section) Assessment Common Core State Standards
(http://www.corestandards.org/the‐standards/mathematics)
complex solutions.CC.9‐12.N.CN.8 Extend polynomial identities to the complex numbers.
Lesson 4: Zeros of Polynomial Functions 2.4 CFA 2.1 to 2.4
CC.9‐12.F.IF.4 For a function that models a relationship between two quantities, interpret key features of graphs and tables in terms of the quantities, and sketch graphs showing key features given a verbal description of the relationship.
CC.9‐12.F.IF.7c Graph polynomial functions, identifying zeros when suitable factorizations are available, and showing end behavior.
Lesson 5: Rational Functions (omit rational equations) 2.5
CC.9‐12.A.SSE.1b Interpret complicated expressions by viewing one or more of their parts as a single entity.
CC.9‐12.A.CED.2 Create equations in two or more variables to represent relationships between quantities; graph equations on coordinate axes with labels and scales.
CC.9‐12.F.IF.4 For a function that models a relationship between two quantities, interpret key features of graphs and tables in terms of the quantities, and sketch graphs showing key features given a verbal description of the relationship.
CC.9‐12.F.IF.7 Graph functions expressed symbolically and show key features of the graph, by hand in simple cases and using technology for more complicated cases.
CC.9‐12.F.IF.7c Graph polynomial functions, identifying zeros when suitable factorizations are available, and showing end behavior.
CC.9‐12.F.IF.8a Use the process of factoring and completing the square in a quadratic function to show zeros, extreme values, and symmetry of the graph, and interpret these in terms of a context.
CC.9‐12.F.BF.3 Identify the effect on the graph of replacing f(x) by f(x) + k, k f(x), f(kx), and f(x + k) for specific values of k (both positive and negative); find the value of k given the graphs. Experiment with cases and illustrate an explanation of the effects on the graph using technology. Include recognizing even and odd functions from their graphs and algebraic expressions for them.

GRADE 9‐12 MATHEMATICS CURRICULUM PRE‐CALCULUSANDTRIGONOMETRY–H
Waterford Public Schools 583
Unwrapped Unit Resources (Chapter.Section) Assessment Common Core State Standards
(http://www.corestandards.org/the‐standards/mathematics)
Lesson 6: Non‐linear Inequalities 2.6Lesson 7: Partial Fractions 6.4 CFA 2.5 to 6.4
Unit
Assessment Lessons 1‐7
QuarterTwo
IV. Exponential&LogarithmicFunctions
Unwrapped Unit Resources (Chapter.Section) Assessment Common Core State Standards
(http://www.corestandards.org/the‐standards/mathematics)
Lesson 1: Exponential Functions 3.1 CC.9‐12.A.SSE.2 Use the structure of an expression to identify ways to rewrite it.
Lesson 2: Logarithmic Functions 3.2 CC.9‐12.A.SSE.2 Use the structure of an expression to identify ways to rewrite it.
Lesson 3: Properties of Logarithms 3.3
CC.9‐12.N.RN.1 Explain how the definition of the meaning of rational exponents follows from extending the properties of integer exponents to those values, allowing for a notation for radicals in terms of rational exponents.
CC.9‐12.N.RN.2 Rewrite expressions involving radicals and rational exponents using the properties of exponents.
Lesson 4: Solving Logarithmic and Exponential Equations 3.4 CFA 3.1 to 3.4
CC.9‐12.A.REI.2 Solve simple rational and radical equations in one variable, and give examples showing how extraneous solutions may arise.
CC.9‐12.A.CED.4 Rearrange formulas to highlight a quantity of interest, using the same reasoning as in solving equations.
Unit Assessment Lessons 1 – 4

GRADE 9‐12 MATHEMATICS CURRICULUM PRE‐CALCULUSANDTRIGONOMETRY–H
Waterford Public Schools 584
V. Trigonometry
Unwrapped Unit Resources (Chapter.Section) Assessment Common Core State Standards
(http://www.corestandards.org/the‐standards/mathematics)
Lesson 1: Right Triangle Trigonometry 4.1
CC.9‐12.F.IF.7e Graph exponential and logarithmic functions, showing intercepts and end behavior, and trigonometric functions, showing period, midline, and amplitude.
CC.9‐12.A.CED.2 Create equations in two or more variables to represent relationships between quantities; graph equations on coordinate axes with labels and scales.
CC.9‐12.F.IF.8 Write a function defined by an expression in different but equivalent forms to reveal and explain different properties of the function.
CC.9‐12.A.SSE.1b Interpret complicated expressions by viewing one or more of their parts as a single entity.
Lesson 2: Degree, Radian Measure( omit angular and linear speed, area sector) 4.2
CC.9‐12.F.IF.7e Graph exponential and logarithmic functions, showing intercepts and end behavior, and trigonometric functions, showing period, midline, and amplitude.
CC.9‐12.A.CED.2 Create equations in two or more variables to represent relationships between quantities; graph equations on coordinate axes with labels and scales.
CC.9‐12.F.IF.8 Write a function defined by an expression in different but equivalent forms to reveal and explain different properties of the function.
CC.9‐12.A.SSE.1b Interpret complicated expressions by viewing one or more of their parts as a single entity.
CC.9‐12.F.BF.1b Interpret complicated expressions by viewing one or more of their parts as a single entity.
Lesson 3: Trig. Functions on the Unit Circle 4.3 CFA 4.1 to 4.3
CC.9‐12.F.BF.4a Solve an equation of the form f(x) = c for a simple function f that has an inverse and write an expression for the inverse.
CC.9‐12.F.IF.7e Graph exponential and logarithmic functions, showing intercepts and end behavior, and trigonometric functions, showing period, midline, and amplitude.
CC.9‐12.F.IF.8 Write a function defined by an expression in different but equivalent forms to reveal and explain different properties of the function.
CC.9‐12.F.IF.9 Compare properties of two functions each represented in a

GRADE 9‐12 MATHEMATICS CURRICULUM PRE‐CALCULUSANDTRIGONOMETRY–H
Waterford Public Schools 585
Unwrapped Unit Resources (Chapter.Section) Assessment Common Core State Standards
(http://www.corestandards.org/the‐standards/mathematics)
different way (algebraically, graphically, numerically in tables, or by verbal descriptions).
CC.9‐12.A.SSE.1b Interpret complicated expressions by viewing one or more of their parts as a single entity.
Lesson 4:Graphing Sine, Cosine Functions 4.4
CC.9‐12.F.LE.4 For exponential models, express as a logarithm the solution to abct = d where a, c, and d are numbers and the base b is 2, 10, or e; evaluate the logarithm using technology.
CC.9‐12.A.REI.11 Explain why the x‐coordinates of the points where the graphs of the equations y = f(x) and y = g(x) intersect are the solutions of the equation f(x) = g(x); find the solutions approximately, e.g., using technology to graph the functions, make tables of values, or find successive approximations. Include cases where f(x) and/or g(x) are linear, polynomial, rational, absolute value, exponential, and logarithmic functions.
Lesson 5: Graphing Other Trig. Functions (omit damped and harmonic)
4.5 CC.9‐12.F.LE.4 For exponential models, express as a logarithm the solution to
abct = d where a, c, and d are numbers and the base b is 2, 10, or e; evaluate the logarithm using technology.
Lesson 6: Inverse Trig. Functions 4.6Lesson 7: Law of Sines, Cosines & Heron’s Formula 4.7 CFA 4.4 to 4.7
Unit Assessment Lessons 1 – 7

GRADE 9‐12 MATHEMATICS CURRICULUM PRE‐CALCULUSANDTRIGONOMETRY–H
Waterford Public Schools 586
QuarterThree
VI. TrigonometricIdentities
Unwrapped Unit Resources (Chapter.Section) Assessment Common Core State Standards
(http://www.corestandards.org/the‐standards/mathematics)
Lesson 1: Trigonometric Identities 5.1
CC.9‐12.A.CED.2 Create equations in two or more variables to represent relationships between quantities; graph equations on coordinate axes with labels and scales.
CC.9‐12.A.CED.4 Rearrange formulas to highlight a quantity of interest, using the same reasoning as in solving equations.
Lesson 2: Verifying Identities 5.2
CC.9‐12.A.CED.2 Create equations in two or more variables to represent relationships between quantities; graph equations on coordinate axes with labels and scales.
CC.9‐12.F.BF.3 Identify the effect on the graph of replacing f(x) by f(x) + k, k f(x), f(kx), and f(x + k) for specific values of k (both positive and negative); find the value of k given the graphs. Experiment with cases and illustrate an explanation of the effects on the graph using technology. Include recognizing even and odd functions from their graphs and algebraic expressions for them.
CC.9‐12.A.APR.1 Understand that polynomials form a system analogous to the integers, namely, they are closed under the operations of addition, subtraction, and multiplication; add, subtract, and multiply polynomials.
Lesson 3: Solving Trig. Equations 5.3
CC.9‐12.A.APR.3 Identify zeros of polynomials when suitable factorizations are available, and use the zeros to construct a rough graph of the function defined by the polynomial.
CC.9‐12.F.BF.1b Combine standard function types using arithmetic operations.
Lesson 4: Sum and Difference Identities 5.4 CFA 5.1 to 5.4
CC.9‐12.A.SSE.1a Interpret parts of an expression, such as terms, factors, and coefficients.
CC.9‐12.A.SSE.1b Interpret complicated expressions by viewing one or more of their parts as a single entity.
CC.9‐12.A.SSE.2 Use the structure of an expression to identify ways to rewrite it.

GRADE 9‐12 MATHEMATICS CURRICULUM PRE‐CALCULUSANDTRIGONOMETRY–H
Waterford Public Schools 587
Unwrapped Unit Resources (Chapter.Section) Assessment Common Core State Standards
(http://www.corestandards.org/the‐standards/mathematics)
Lesson 1: Polar Coordinates 9.1
CC.9‐12.A.APR.7 Understand that rational expressions form a system analogous to the rational numbers, closed under addition, subtraction, multiplication, and division by a nonzero rational expression; add, subtract, multiply, and divide rational expressions.
Lesson 2: Graphs of Polar Equations 9.2
CC.9‐12.A.APR.7 Understand that rational expressions form a system analogous to the rational numbers, closed under addition, subtraction, multiplication, and division by a nonzero rational expression; add, subtract, multiply, and divide rational expressions.
Lesson 3: Polar and Rectangular Forms of Equations 9.3
CC.9‐12.A.APR.7 Understand that rational expressions form a system analogous to the rational numbers, closed under addition, subtraction, multiplication, and division by a nonzero rational expression; add, subtract, multiply, and divide rational expressions.
Lesson 4: Trig. Form of Complex Numbers, DeMoivre’s Theorem 9.5 CFA 9.1 to
9.3, 9.5
CC.9‐12.A.APR.7 Understand that rational expressions form a system analogous to the rational numbers, closed under addition, subtraction, multiplication, and division by a nonzero rational expression; add, subtract, multiply, and divide rational expressions.
Unit Assessment 5.1 – 5.4, 9.1 – 9.3, 9.5
VII. Vectors
Unwrapped Unit Resources (Chapter.Section) Assessment Common Core State Standards
(http://www.corestandards.org/the‐standards/mathematics)
Lesson 1: Intro to Vectors 8.1
CC.9‐12.G.GPE.1 Derive the equation of a circle of given center and radius using the Pythagorean Theorem; complete the square to find the center and radius of a circle given by an equation.
CC.9‐12.G.GPE.2 Derive the equation of a parabola given a focus and directrix. Lesson 2: Vectors in the Coordinate Plane 8.2 CC.9‐12.G.GPE.2 Derive the equation of a parabola given a focus and directrix.

GRADE 9‐12 MATHEMATICS CURRICULUM PRE‐CALCULUSANDTRIGONOMETRY–H
Waterford Public Schools 588
Unwrapped Unit Resources (Chapter.Section) Assessment Common Core State Standards
(http://www.corestandards.org/the‐standards/mathematics)
Lesson 3: Dot Products (omit projections) 8.3 CFA 8.1 to 8.3
CC.9‐12.G.GPE.1 Derive the equation of a circle of given center and radius using the Pythagorean Theorem; complete the square to find the center and radius of a circle given by an equation.
Unit Assessment Lessons 1 – 3
QuarterFour
VIII. Conics
Unwrapped Unit Resources (Chapter.Section) Assessment Common Core State Standards
(http://www.corestandards.org/the‐standards/mathematics)
Lesson 1: Parabolas 7.1 CC.9‐12.F.IF.3 Recognize that sequences are functions, sometimes defined recursively, whose domain is a subset of the integers.
Lesson 2: Ellipses and Circles 7.2 CC.9‐12.A.SSE.4 Derive the formula for the sum of a finite geometric series
(when the common ratio is not 1), and use the formula to solve problems.
Lesson 3: Hyperbolas 7.3 CC.9‐12.F.IF.3 Recognize that sequences are functions, sometimes defined recursively, whose domain is a subset of the integers.
Unit Assessment Lessons 1 – 3

GRADE 9‐12 MATHEMATICS CURRICULUM PRE‐CALCULUSANDTRIGONOMETRY–H
Waterford Public Schools 589
IX. SeriesandSequences
Unwrapped Unit Resources (Chapter.Section) Assessment Common Core State Standards
(http://www.corestandards.org/the‐standards/mathematics)
Lesson 1: Sequences, Series and Sigma Notation 10.1
CC.9‐12.F.IF.4 For a function that models a relationship between two quantities, interpret key features of graphs and tables in terms of the quantities, and sketch graphs showing key features given a verbal description of the relationship.
CC.9‐12.F.TF.5 Choose trigonometric functions to model periodic phenomena with specified amplitude, frequency, and midline.
Lesson 2: Arithmetic Sequences and Series 10.2 CC.9‐12.F.TF.5 Choose trigonometric functions to model periodic phenomena
with specified amplitude, frequency, and midline. Lesson 3: Geometric Sequences and Series 10.3 CFA 8‐1 to 8‐3 CC.9‐12.F.TF.1 Understand radian measure of an angle as the length of the arc
on the unit circle subtended by the angle.
Unit
Assessment Lessons 1 – 3

GRADE 9‐12 MATHEMATICS CURRICULUM CALCULUS–A
Waterford Public Schools 590
This course is an introduction to limits, derivatives, and integrals with an emphasis on the underlying algebraic and pre‐calculus concepts Recommendation: Grade of B‐ or better in Pre‐Calculus – A. Essential Questions
1. How can calculus be used to help describe the behavior of a function? 2. What is the best method to use to find the limit of a function? 3. How do limits approaching infinity help describe the asymptotic behavior of a function? 4. How do limits help determine the continuity of a function? 5. How can calculus be used to help describe the behavior of a function? 6. When a quantity is changing with respect to time, how are associated quantities changing? 7. How can you find the greatest (smallest) value needed to solve a particular problem? 8. How are slope fields and differential equations related? 9. How are position, velocity, and acceleration related? 10. How does the composition of functions tell you how many derivative rules must be applied? 11. How is sigma notation related to integration? 12. How are the derivative and the integral related? 13. What does a definite integral represent? 14. How can you use your knowledge of derivatives to find the integral of a function? 15. How can substitution make an integral simpler to evaluate?
Course #: 349 Prerequisite: Successful completion of Pre‐Calculus Credit: 1 credit Resources: Calculus of a Single Variable, Larson

GRADE 9‐12 MATHEMATICS CURRICULUM CALCULUS–A
Waterford Public Schools 591
QuarterOneI. Pre‐CalculusReview1
Unwrapped Unit Resources (Chapter.Section) Assessment Common Core State Standards
(http://www.corestandards.org/the‐standards/mathematics)
Lesson 1: Quadratics
Supplemental Resources
CC.9‐12.F.IF.4 For a function that models a relationship between two quantities, interpret key features of graphs and tables in terms of the quantities, and sketch graphs showing key features given a verbal description of the relationship.
CC.9‐12.F.IF.5 Relate the domain of a function to its graph and, where applicable, to the quantitative relationship it describes.
Lesson 2: Factoring Cubics and Difference of Two Squares
Supplemental Resources
CC.9‐12.A.CED.1 Create equations and inequalities in one variable and use them to solve problems.
CC.9‐12.A.REI.11 Explain why the x‐coordinates of the points where the graphs of the equations y = f(x) and y = g(x) intersect are the solutions of the equation f(x) = g(x); find the solutions approximately, e.g., using technology to graph the functions, make tables of values, or find successive approximations. Include cases where f(x) and/or g(x) are linear, polynomial, rational, absolute value, exponential, and logarithmic functions.
Lesson 3: Simplifying Rational Expressions
Supplemental Resources
CC.9‐12.A.CED.1 Create equations and inequalities in one variable and use them to solve problems.
CC.9‐12.A.REI.11 Explain why the x‐coordinates of the points where the graphs of the equations y = f(x) and y = g(x) intersect are the solutions of the equation f(x) = g(x); find the solutions approximately, e.g., using technology to graph the functions, make tables of values, or find successive approximations. Include cases where f(x) and/or g(x) are linear, polynomial, rational, absolute value, exponential, and logarithmic functions.

GRADE 9‐12 MATHEMATICS CURRICULUM CALCULUS–A
Waterford Public Schools 592
Unwrapped Unit Resources (Chapter.Section) Assessment Common Core State Standards
(http://www.corestandards.org/the‐standards/mathematics)
Lesson 4: Multiply and Divide Expressions
Supplemental Resources
CC.9‐12.A.CED.1 Create equations and inequalities in one variable and use them to solve problems.
CC.9‐12.A.REI.11 Explain why the x‐coordinates of the points where the graphs of the equations y = f(x) and y = g(x) intersect are the solutions of the equation f(x) = g(x); find the solutions approximately, e.g., using technology to graph the functions, make tables of values, or find successive approximations. Include cases where f(x) and/or g(x) are linear, polynomial, rational, absolute value, exponential, and logarithmic functions.
Lesson 5: Add and Subtract Expressions Supplemental Resources
CC.9‐12.A.CED.1 Create equations and inequalities in one variable and use them to solve problems.
CC.9‐12.A.REI.11 Explain why the x‐coordinates of the points where the graphs of the equations y = f(x) and y = g(x) intersect are the solutions of the equation f(x) = g(x); find the solutions approximately, e.g., using technology to graph the functions, make tables of values, or find successive approximations. Include cases where f(x) and/or g(x) are linear, polynomial, rational, absolute value, exponential, and logarithmic functions.
Lesson 6: Simplifying & Solving Complex Fractions Part 1
Supplemental Resources
CC.9‐12.A.CED.1 Create equations and inequalities in one variable and use them to solve problems.
CC.9‐12.A.REI.11 Explain why the x‐coordinates of the points where the graphs of the equations y = f(x) and y = g(x) intersect are the solutions of the equation f(x) = g(x); find the solutions approximately, e.g., using technology to graph the functions, make tables of values, or find successive approximations. Include cases where f(x) and/or g(x) are linear, polynomial, rational, absolute value, exponential, and logarithmic functions.
Unit Assessment 1.1 – 1.6

GRADE 9‐12 MATHEMATICS CURRICULUM CALCULUS–A
Waterford Public Schools 593
II. Pre‐CalculusReview2
Unwrapped Unit Resources (Chapter.Section) Assessment Common Core State Standards
(http://www.corestandards.org/the‐standards/mathematics)
Lesson 1: Graph Shifting P.3Lesson 2: Compositions P.3Lesson 3: Difference Quotient P.3
Lesson 4: Simplifying Complex Fractions Part 2 P.3
CC.9‐12.A.CED.1 Create equations and inequalities in one variable and use them to solve problems.
CC.9‐12.A.REI.11 Explain why the x‐coordinates of the points where the graphs of the equations y = f(x) and y = g(x) intersect are the solutions of the equation f(x) = g(x); find the solutions approximately, e.g., using technology to graph the functions, make tables of values, or find successive approximations. Include cases where f(x) and/or g(x) are linear, polynomial, rational, absolute value, exponential, and logarithmic functions.
Lesson 5: Simplifying Fractional Expression
Supplemental Resources
CC.9‐12.A.CED.1 Create equations and inequalities in one variable and use them to solve problems.
CC.9‐12.A.REI.11 Explain why the x‐coordinates of the points where the graphs of the equations y = f(x) and y = g(x) intersect are the solutions of the equation f(x) = g(x); find the solutions approximately, e.g., using technology to graph the functions, make tables of values, or find successive approximations. Include cases where f(x) and/or g(x) are linear, polynomial, rational, absolute value, exponential, and logarithmic functions.

GRADE 9‐12 MATHEMATICS CURRICULUM CALCULUS–A
Waterford Public Schools 594
Unwrapped Unit Resources (Chapter.Section) Assessment Common Core State Standards
(http://www.corestandards.org/the‐standards/mathematics)
Lesson 6: Trigonometry Identities Supplemental Resources CFA 2.1 to 2.6
CC.9‐12.A.CED.2 Create equations in two or more variables to represent relationships between quantities; graph equations on coordinate axes with labels and scales.
CC.9‐12.F.BF.3 Identify the effect on the graph of replacing f(x) by f(x) + k, k f(x), f(kx), and f(x + k) for specific values of k (both positive and negative); find the value of k given the graphs. Experiment with cases and illustrate an explanation of the effects on the graph using technology. Include recognizing even and odd functions from their graphs and algebraic expressions for them.
CC.9‐12.A.APR.1 Understand that polynomials form a system analogous to the integers, namely, they are closed under the operations of addition, subtraction, and multiplication; add, subtract, and multiply polynomials.
Unit Assessment 1.1 – 2.6
III. Pre‐CalculusReview3
Unwrapped Unit Resources (Chapter.Section) Assessment Common Core State Standards
(http://www.corestandards.org/the‐standards/mathematics)
Lesson 1: Exponential Growth/Decay Supplemental Resources CC.9‐12.A.SSE.2 Use the structure of an expression to identify ways to rewrite
it.
Lesson 2: Logarithm Properties Supplemental Resources
CC.9‐12.N.RN.1 Explain how the definition of the meaning of rational exponents follows from extending the properties of integer exponents to those values, allowing for a notation for radicals in terms of rational exponents.
CC.9‐12.N.RN.2 Rewrite expressions involving radicals and rational exponents using the properties of exponents.
Lesson 3: Solving Logarithm Equations and Applications
Supplemental Resources
CC.9‐12.A.REI.2 Solve simple rational and radical equations in one variable, and give examples showing how extraneous solutions may arise.
CC.9‐12.A.CED.4 Rearrange formulas to highlight a quantity of interest, using the same reasoning as in solving equations.

GRADE 9‐12 MATHEMATICS CURRICULUM CALCULUS–A
Waterford Public Schools 595
Unwrapped Unit Resources (Chapter.Section) Assessment Common Core State Standards
(http://www.corestandards.org/the‐standards/mathematics)
Lesson 4: Continuous Growth and Decay Supplemental Resources
CC.9‐12.A.REI.2 Solve simple rational and radical equations in one variable, and give examples showing how extraneous solutions may arise.
CC.9‐12.A.CED.4 Rearrange formulas to highlight a quantity of interest, using the same reasoning as in solving equations.
Lesson 5: Natural Logarithm Properties Supplemental Resources
CC.9‐12.A.REI.2 Solve simple rational and radical equations in one variable, and give examples showing how extraneous solutions may arise.
CC.9‐12.A.CED.4 Rearrange formulas to highlight a quantity of interest, using the same reasoning as in solving equations.
Lesson 6: Solving Natural Logarithm Equations and Applications
Supplemental Resources
CC.9‐12.A.REI.2 Solve simple rational and radical equations in one variable, and give examples showing how extraneous solutions may arise.
CC.9‐12.A.CED.4 Rearrange formulas to highlight a quantity of interest, using the same reasoning as in solving equations.
Unit Assessment 3.1 – 3.6
QuarterTwo
IV. LimitsandContinuity
Unwrapped Unit Resources (Chapter.Section) Assessment Common Core State Standards
(http://www.corestandards.org/the‐standards/mathematics)
Lesson 1: Introduction into Calculus and Limits 1.1 CC.9‐12.F.IF.3 Recognize that sequences are functions, sometimes defined
recursively, whose domain is a subset of the integers. Lesson 2: Solving Limits Graphically and Numerically 1.2 CC.9‐12.F.IF.3 Recognize that sequences are functions, sometimes defined
recursively, whose domain is a subset of the integers.
Lesson 3: Solving Limits Analytically 1.3 CC.9‐12.F.IF.3 Recognize that sequences are functions, sometimes defined recursively, whose domain is a subset of the integers.
Lesson 4: Solving One Sided Limits 1.4 CFA 4.1 to 4.4
CC.9‐12.A.REI.4b Solve quadratic equations by inspection (e.g., for x2 = 49), taking square roots, completing the square, the quadratic formula and factoring, as appropriate to the initial form of the equation. Recognize when the quadratic formula gives complex solutions and write them as a ± bi for real numbers a and b.

GRADE 9‐12 MATHEMATICS CURRICULUM CALCULUS–A
Waterford Public Schools 596
Unwrapped Unit Resources (Chapter.Section) Assessment Common Core State Standards
(http://www.corestandards.org/the‐standards/mathematics)
CC.9‐12.N.CN.7 Solve quadratic equations with real coefficients that have complex solutions.
CC.9‐12.N.CN.8 Extend polynomial identities to the complex numbers. CC.9‐12.A.SSE.1b Interpret complicated expressions by viewing one or more of
their parts as a single entity. CC.9‐12.A.APR.4 Prove polynomial identities and use them to describe numerical
relationships.
Lesson 5: Continuity 1.5
CC.9‐12.A.REI.4b Solve quadratic equations by inspection (e.g., for x2 = 49), taking square roots, completing the square, the quadratic formula and factoring, as appropriate to the initial form of the equation. Recognize when the quadratic formula gives complex solutions and write them as a ± bi for real numbers a and b.
CC.9‐12.N.CN.7 Solve quadratic equations with real coefficients that have complex solutions.
CC.9‐12.N.CN.8 Extend polynomial identities to the complex numbers. CC.9‐12.A.SSE.1b Interpret complicated expressions by viewing one or more of
their parts as a single entity. CC.9‐12.A.APR.4 Prove polynomial identities and use them to describe numerical
relationships. Lesson 6: Infinite Limits 1.6Lesson 7: Limits at Infinity 1.7 CFA 4.5 to 4.7
Unit
Assessment 4.1 – 4.7
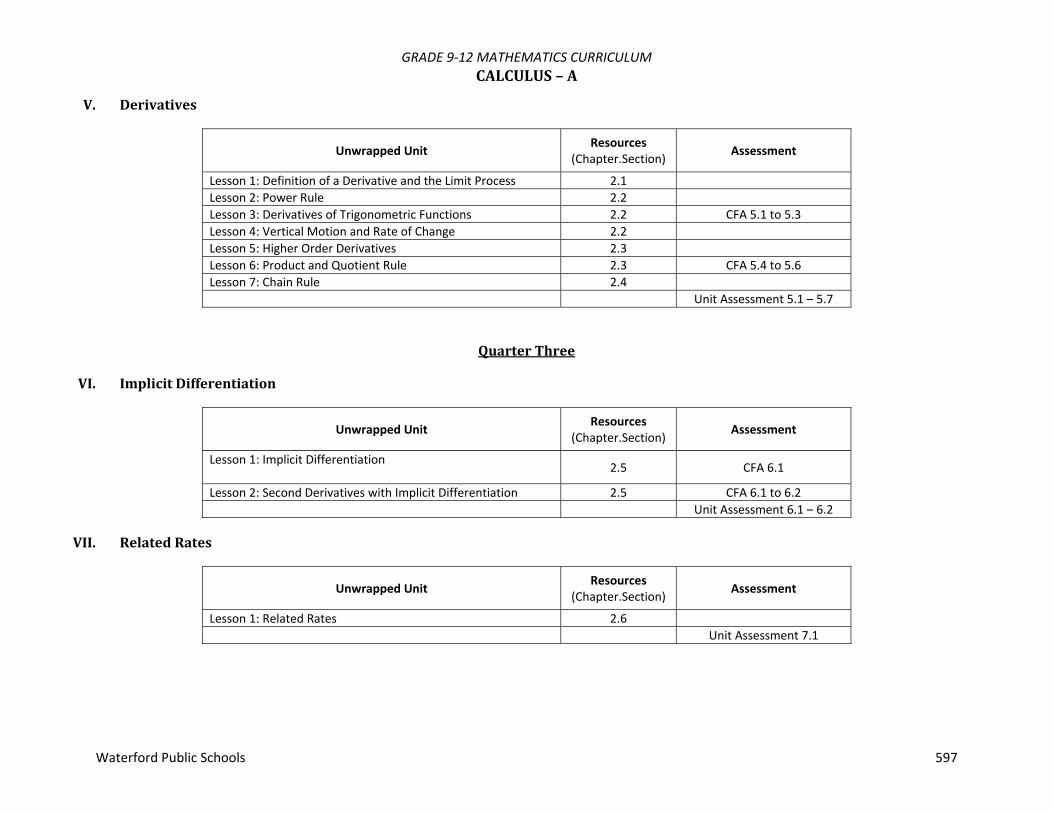
GRADE 9‐12 MATHEMATICS CURRICULUM CALCULUS–A
Waterford Public Schools 597
V. Derivatives
Unwrapped Unit Resources (Chapter.Section) Assessment
Lesson 1: Definition of a Derivative and the Limit Process 2.1 Lesson 2: Power Rule 2.2 Lesson 3: Derivatives of Trigonometric Functions 2.2 CFA 5.1 to 5.3Lesson 4: Vertical Motion and Rate of Change 2.2 Lesson 5: Higher Order Derivatives 2.3 Lesson 6: Product and Quotient Rule 2.3 CFA 5.4 to 5.6Lesson 7: Chain Rule 2.4 Unit Assessment 5.1 – 5.7
QuarterThree
VI. ImplicitDifferentiation
Unwrapped Unit Resources (Chapter.Section) Assessment
Lesson 1: Implicit Differentiation 2.5 CFA 6.1
Lesson 2: Second Derivatives with Implicit Differentiation 2.5 CFA 6.1 to 6.2 Unit Assessment 6.1 – 6.2
VII. RelatedRates
Unwrapped Unit Resources (Chapter.Section) Assessment
Lesson 1: Related Rates 2.6 Unit Assessment 7.1

GRADE 9‐12 MATHEMATICS CURRICULUM CALCULUS–A
Waterford Public Schools 598
QuarterFourVIII. GraphSketching
Unwrapped Unit Resources (Chapter.Section) Assessment
Lesson 1: Extrema on an Interval 3.1
Lesson 2: Increasing & Decreasing Functions (First Derivative Test) 3.3 CFA 8.1 to 8.2
Lesson 3: Concavity (Second Derivative Test) 3.4 Lesson 4: Limits at Infinity 3.5 Lesson 5: Summary of Curve Sketching 3.6 CFA 8.3 to 8.6 Unit Assessment 8.1 – 8.6
IX. Optimization
Unwrapped Unit Resources (Chapter.Section) Assessment
Lesson 1: Optimization 3.7 Unit Assessment 9.1
X. Integration
Unwrapped Unit Resources (Chapter.Section) Assessment
Lesson 1: Area – Integration 4.2 Lesson 2: Area – Upper and Lower Sums 4.2 Lesson 3: Antiderivative – Infinite Limits 4.1 CFA 10.1 to 10.3Lesson 4: Riemann Sums 4.3 Lesson 5: Definite Integrals 4.3 Lesson 6: Fundamental Theorem of Calculus 4.4 Unit Assessment 10.1‐10.6

GRADE 9‐12 MATHEMATICS CURRICULUM CALCULUS–AP
Waterford Public Schools 599
This course includes a comprehensive examination of sequences, functions and their limits, forms the basis for the definitions of the derivative and integrals and their applications. Students taking this course will take the AB Calculus AP Exam Students work in groups to support and extend their learning experience in the class. Students are encouraged to help each other as mentors. After a topic has been presented, students work on “discovery" labs, projects, problem sets or AP sample problems to reinforce that topic. Students are encouraged throughout the course to justify through verbal and written explanations how problems were solved. All topics, where appropriate, are presented graphically, numerically, analytically and verbally. The interrelationship of these various problem views is emphasized. Recommendation: Grade of B‐ or better in Pre‐Calculus – H. Course #: 362/363 Prerequisite: Successful completion of Pre‐Calculus – H Credit: 1 ½ credit Resources:
GRADE 9‐12 MATHEMATICS CURRICULUM CALCULUS–AP
Waterford Public Schools 600
UseofGraphingCalculators Each student in the course has a TI‐83 or TI‐84 calculator. A class set of calculators is also available. The graphing calculator is considered an integral part of the course. Students use this technology on a daily basis to explore, discover, and reinforce the concepts of Calculus. Students utilize the graphing capabilities as well as many of the built‐in functions including: Calc Menu Functions, Zoom, nDeriv, fnInt, Window sizing and the Solver. Programming the calculator is investigated using a simple program to find zeros of a function using Newton's Method. EvaluationFor each unit, there are quizzes and a unit test which include appropriate released AP problems. There are benchmark assessments used each quarter and for the midterm exam. The midterm exam is a comprehensive test including all the work done for the semester. PapersEach quarter, a paper is assigned. Topics include the history and development of Calculus, the Newton‐Leibniz controversy, a murder mystery solved using Newton's law of Cooling and a research paper on a related field of mathematics. LabsLabs (or discovery activities) include both calculator, and paper and pencil problems. Many activities are teacher‐generated or are made up of released AP problems. Some sample activities are:
1. Using the "How Many Licks?"(d) lab, students measure the circumference of their Tootsie Roll Pop after sucking on it for thirty second intervals. They then determine the corresponding radius and model the rate of change of the radius when there is three quarters of the original radius using their sample data.
2. Using the "Is there No Limit to These Labs?" (d), students investigate limits and linearization using graphing calculators, tables of values and using derivatives. They learn how to deal with rational function in indeterminate forms.
3. The continuity, differentiability and other features of a curve are investigated in the "Mystery Curve" (d) lab. Graphing calculators are used to help define a piecewise curve with a variety of specific features.
4. Steve Olson's Fundamental Theorem Packet (a) of problems is used as an extension to the introduction of the two parts of the Fundamental Theorem in the textbook. The problems are presented with verbal, analytic, graphical and tabular formats, requiring the use of the graphing calculator to determine solutions.
5. "Introduction to Slope Fields", "Euler's Method" and "A Predator‐Prey Problem" (b) are used to have students investigate a particular solution to a differential equation graphically and analytically, using separation of variables, and varying initial conditions.
6. “Some Very Special Riemann Sums" (b) is a lab where students find Riemann sums using a variety of methods and make conclusions about how the points to be used were selected.
GRADE 9‐12 MATHEMATICS CURRICULUM CALCULUS–AP
Waterford Public Schools 601
7. "Newton's Method" (c) provides students with an opportunity to program their graphing calculator (learning where to find a variety of functions in the menus, ex. nDeriv, y1, etc.) to find the zeros of a function using Newton's Method. Samples of functions where the method fails are also included. Students draw graphs of their tangent lines which eventually produce the zero of the function.
Resources for these activities include:
a. The Fundamental Theorem of Calculus and Applications of the Definite Integral, Steve Olson, February 2000 b. Calculus Explorations, Paul Foerster, 1998, Key Curriculum Press c. Bringing Calculus to Life, Robert Decker and John Williams, 1992, Prentice Hall d. A Watched Cup Never Cools, Ellen Kamischke, 1999, Key Curriculum Press e. Schaum's Outline Series Differential and Integral Calculus 2/ed, Frank Ayres, Jr., 1978, McGraw Hill f. Preparing for the (AB) AP Calculus Examination, George Best and J. Richard Lux, 2000, Venture Publishing g. Multiple Choice Questions in Preparation for the AP Calculus (AB)Examination Fifth Edition, David Lederman, 1991, D&S Marketing
Systems, Inc. ProjectsStudents are asked to do at least one presentation/project during the year.
a. Students are randomly assigned a function. They must find the volume of the solid of revolution using both disks (washers) and shells, or explain why a method fails. They present their results using a poster presentation and create a model of the solid.
b. Students find the volume of a Margarita glass using their own technique for defining the function for the glass. An excellent activity using technology to help with the regression.
c. Research paper, activity and presentation on a field of mathematics beyond Calculus such as Chaos Theory, Fractals, Topology, Knot Theory or Non‐Euclidean Geometry.
Outline
I. Pre‐Calculus Review (2 weeks) A. Functions and Graphs
i. Symmetry, Even and Odd Functions ii. Domain and Range iii. Function Notation iv. Transformations v. Piecewise Functions vi. Composite Functions vii. Graphs, Discontinuities and Asymptotes viii. Slope as a Rate of Change

GRADE 9‐12 MATHEMATICS CURRICULUM CALCULUS–AP
Waterford Public Schools 602
B. Exponential and Logarithmic Functions i. Exponential Growth and Decay ii. Inverse Functions iii. Logarithmic functions iv. Properties of Logarithms
C. Trigonometric functions i. Graphs of Trigonometric functions
1. Domain and Range 2. Transformations 3. Inverse Trigonometric Functions
ii. Applications II. Limits and Continuity (3 weeks)
A. Rates of Change B. Limits at a Point
i. Properties of Limits ii. Two‐sided Limits iii. One‐sided Limits iv. Estimating Limits from Graphs or Tables of Values v. Calculating Limits Using Algebra vi. Use of the Graphing Calculator to Visualize Limits
C. Limits Involving Infinity i. Asymptotic Behavior ii. End Behavior iii. Properties of Limits iv. Use of the Graphing Calculator to Visualize Limits
D. Continuity i. Continuous Functions ii. Discontinuous Functions
1. Removable Discontinuity 2. Jump Discontinuities
III. Derivatives ( 6 weeks) A. Definition of the Derivative
i. Forms of the Difference Quotient ii. Algebraic Techniques

GRADE 9‐12 MATHEMATICS CURRICULUM CALCULUS–AP
Waterford Public Schools 603
B. Instantaneous Rates of Change C. Average Rate of Change D. Differentiability
i. Local Linearity 1. Zoom Function 2. Tangent Approximation
ii. Numerical Derivatives with and without a calculator iii. Differentiability and Continuity
E. Basic Differentiation Rules i. Sum and Difference Rules ii. Product and Quotient Rules iii. Chain Rule
F. Derivatives of Functions i. Power ii. Exponential iii. Logarithmic iv. Trigonometric v. Inverse Trigonometric
G. Implicit Differentiation H. Logarithmic Differentiation I. Higher Derivatives J. Instantaneous Rates of Change
IV. Applications of the Derivative (4 weeks) A. Mean Value Theorem B. Intermediate Value Theorem C. Rolle’s Theorem D. Vertical Motion Applications E. Related Rates F. Graph Analysis
i. Local Extrema ii. Global Extrema iii. Increasing and Decreasing Intervals iv. Concavity v. Newton’s Methods with Graphing Calculator
GRADE 9‐12 MATHEMATICS CURRICULUM CALCULUS–AP
Waterford Public Schools 604
vi. Curve Sketching vii. Slope Fields
G. Optimization Problems H. Linearization
V. Integrals (6 weeks) A. Numerical Approximations
i. Riemann Sums ii. Limits of Riemann Sums iii. Inscribed or Circumscribed Rectangles iv. Midpoint Rectangles v. Trapezoidal Rule vi. Simpson’s Rule
B. The Fundamental Theorem of Calculus (Part 1) C. Indefinite Integrals
i. Known Functions ii. Using u‐substitutions
D. The Fundamental Theorem of Calculus (Part 2) E. Differential Equations
i. Antiderivatives ii. Separation of Variables iii. General Solution iv. Slope Fields
VI. Applications of Integration (5 weeks) A. Summing Rates of Change B. Motion Along a Curve C. Areas Under and Between Curves D. Volumes
i. Volumes of Solid by Revolution 1. Disk Methods 2. Washer Method 3. Shell Method
ii. Volumes of Solids with Known Cross Sections E. Arc Length* F. Surface Area*

GRADE 9‐12 MATHEMATICS CURRICULUM CALCULUS–AP
Waterford Public Schools 605
G. Work* H. Moments and Centers of Mass* I. Fluid Pressure* J. Integration by Parts* K. Integration by Partial Fractions*
* Topics That May Be Covered after the AP Exam followed by a Research Project and Presentation The schedule leaves 2‐3 weeks for flexibility with teaching/time management.