WATERBOUWKUNDIG LABORATORIUM FLANDERS HYDRAULICS RESEARCH ... · Waterbouwkundig Laboratorium...
77
2008 CLIMAR EVALUATION OF CLIMATE CHANGE IMPACTSAND ADAPTATION RESPONSES FOR MARINE ACTIVITIES WATERBOUWKUNDIG LABORATORIUM FLANDERS HYDRAULICS RESEARCH MOD 814/1 SUBDOCUMENT COASTAL FLOODING
Transcript of WATERBOUWKUNDIG LABORATORIUM FLANDERS HYDRAULICS RESEARCH ... · Waterbouwkundig Laboratorium...
2008
CLIMAREVALUATION OF CLIMATE CHANGE IMPACTS AND
ADAPTATION RESPONSES FOR MARINE ACTIVITIES
WATERBOUWKUNDIG
LABORATORIUM
FLANDERS HYDRAULICS
RESEARCH
MOD 814/1
SUBDOCUMENT COASTAL FLOODING
FORM: F-WL-PP10-2 Version 01 VALID AS FROM: 08/07/2008
CLIMAR – Evaluation of climate change impacts and adaptation responses
for marine activities
Subdocument Coastal Flooding
Van der Biest K., Verwaest T., Vanneuville W., Reyns J. & Mostaert F.
March 2008
WL2008R814_01rev2_0
FORM: F-WL-PP10-2 Version 01 VALID AS FROM: 08/07/2008
This publication must be cited as follows: Van der Biest K., Verwaest T., Vanneuville W., Reyns J. & Mostaert F. (2008). CLIMAR - Evaluation of climate change impacts and adaptation responses for marine activities. Subdocument Coastal Flooding. WL Rapporten, 814/01. Flanders Hydraulics Research: Antwerp, Belgium
Waterbouwkundig Laboratorium Flanders Hydraulics Research Berchemlei 115 B-2140 Antwerp Tel. +32 (0)3 224 60 35 Fax +32 (0)3 224 60 36 E-mail: [email protected] http://www.watlab.be Nothing from this publication may be duplicated and/or published by means of print, photocopy, microfilm or otherwise, without the written consent of the publisher.
FORM: F-WL-PP10-2 Version 01 VALID AS FROM: 08/07/2008
Document identification
Title: CLIMAR - Evaluation of climate change impacts and adaptation responses for marine activities. Subdocument Coastal Flooding
Customer: BELSPO Ref.: WL2008R814_01rev2_0
Keywords (3-5): Coastal flooding, risks, impacts Text (p.): 64 Tables (p.): 22
Appendices (p.): Figures (p.): 35
Customer
Internal Exceptions
Flemish government
Yes
Released as from March 2008
Confidentiality:
No Approval Author Katrien Van der Biest
Reviser Toon Verwaest, Wouter Vanneuville, Johan Reyns
Project leader Katrien Van der Biest
Division Head Frank Mostaert
Revisions Nr. Date Description Author 1_0 March 2008 Concept version Katrien Van der Biest
1_1 March 2008 Substantive revision Toon Verwaest, Wouter Vanneuville, Johan Reyns
1_2 Revision customer 2_0 March 2008 Final version Katrien Van der Biest
Abstract Within the project CLIMAR an attempt is made to develop an evaluation framework for adaptation responses to climate change induced impacts within the North Sea environment. The identification and quantification of all the possible secondary impacts of climate change is handled on a sectoral level. The different case-studies investigated in the framework of the research are fishery, tourism, sand and gravel extraction, the port of Zeebrugge and flood risks. This document gives an overview of all the different types of land occupation and infrastructure within the coastal zone that might be subject to flood risks as a consequence of primary climate change impacts.
i
EVALUATION OF CLIMATE CHANGE IMPACTS AND
ADAPTATION RESPONSES FOR MARINE ACTIVITIES
(CLIMAR)
INTERMEDIARY REPORT
SUBDOCUMENT COASTAL FLOODING
General study and evaluation of potential impacts of climate change on the
Belgian Part of the North Sea
Date: March 2008
Author: Katrien Van der Biest (WL)
Report Number:
Coordination: Management Unit of the North Sea Mathematical Models – MUMM
Research contract n° SD/NS/01A
PROJECT WEBSITE: HTTP://WWW.ARCADISBELGIUM.BE/CLIMAR
ii
EVALUATION OF CLIMATE CHANGE IMPACTS AND ADAPTATION RESPONSES FOR
MARINE ACTIVITIES ................................................................................................................................. I
1 COASTAL INFRASTRUCTURE.........................................................................................................1
1.1 DEFENSE STRUCTURES ......................................................................................................................3
1.1.1 Intensity ...................................................................................................................................4
1.1.1.1 Dikes .............................................................................................................................................. 4
1.1.1.2 Dune foot strengthening ............................................................................................................. 9
1.1.1.3 Jetties, quay walls, weirs and locks ......................................................................................... 10
1.1.1.4 Groynes........................................................................................................................................ 10
1.1.1.5 Sand nourishments .................................................................................................................... 10
1.1.1.6 Marram grass and brush wood................................................................................................. 12
1.1.1.7 Managed retreat ......................................................................................................................... 12
1.1.2 Economical importance ........................................................................................................14
1.1.3 Social importance ..................................................................................................................19
1.2 NATURE..........................................................................................................................................21
1.2.1 Intensity .................................................................................................................................21
1.2.1.1 Beach ........................................................................................................................................... 21
1.2.1.2 Dunes ........................................................................................................................................... 22
1.2.1.3 Wetland........................................................................................................................................ 23
1.2.1.4 Forest ........................................................................................................................................... 23
1.2.2 Economical importance ........................................................................................................23
1.2.3 Social importance ..................................................................................................................24
1.3 BUILDINGS .....................................................................................................................................27
1.3.1 Intensity .................................................................................................................................27
1.3.2 Economical importance ........................................................................................................28
1.3.3 Social importance ..................................................................................................................32
1.4 INDUSTRY AND BUSINESS ................................................................................................................33
1.4.1 Intensity .................................................................................................................................33
1.4.2 Economical importance ........................................................................................................35
1.4.3 Social importance ..................................................................................................................37
1.5 AGRICULTURE .................................................................................................................................39
1.5.1 Intensity .................................................................................................................................39
1.5.2 Economical importance ........................................................................................................40
1.5.3 Social importance ..................................................................................................................42
1.6 TRANSPORT AND SERVICE NETWORKS ..............................................................................................43
1.6.1 Intensity .................................................................................................................................43
1.6.1.1 Roads, railroads and tramways ................................................................................................ 43
1.6.1.2 Service networks ........................................................................................................................ 44
1.6.2 Economical importance ........................................................................................................44
1.6.3 Social importance ..................................................................................................................46
2 EXTERNAL FACTORS ......................................................................................................................49
2.1 DEMOGRAPHIC DEVELOPMENTS........................................................................................................49
2.2 ECONOMIC DEVELOPMENTS .............................................................................................................50
2.2.1 Port of Zeebrugge .................................................................................................................50
2.2.2 Port of Oostende ...................................................................................................................51
2.3 BUDGET FOR NEW DEFENCE STRUCTURES.........................................................................................53
iii
2.4 CHANGES IN CIRCULATION PATTERNS...............................................................................................53
2.4.1 North Sea sand and gravel extraction................................................................................53
2.4.2 Offshore economic constructions........................................................................................54
3 SECUNDARY IMPACTS OF CLIMATE CHANGE ON COASTAL FLOODING RISKS AND
COASTAL INFRASTRUCTURE ................................................................................................................55
3.1 ECOLOGICAL EFFECT CATEGORIES ....................................................................................................55
3.1.1 Water quality .........................................................................................................................55
3.1.2 Habitat change ......................................................................................................................56
3.1.3 Biodiversity.............................................................................................................................56
3.2 ECONOMICAL EFFECT CATEGORIES ...................................................................................................57
3.2.1 Change in production ...........................................................................................................57
3.2.2 Production value....................................................................................................................57
3.2.3 Damage costs ........................................................................................................................57
3.2.4 New opportunities .................................................................................................................58
3.3 SOCIAL EFFECT CATEGORIES............................................................................................................58
3.3.1 Attractiveness coastal & marine area.................................................................................58
3.3.2 Employment ...........................................................................................................................59
3.3.3 Safety......................................................................................................................................59
3.3.4 Accessibility ............................................................................................................................59
3.3.5 Welfare ...................................................................................................................................59
4 LITERATURE......................................................................................................................................61
iv
LIST OF FIGURES
FIG. 1 - LEVEL DIFFERENCE BETWEEN LAND AND NORTH SEA DURING AN AVERAGE
YEARLY STORM OF 5,5M TAW (EDITED FROM VERWAEST ET AL., 2005) 1
FIG. 2 - STUDY AREA FOR THE CASE-STUDY OF COASTAL FLOODING RISKS 2
FIG. 3 - OVERVIEW OF COASTAL DEFENCE TECHNIQUES ALONG THE BELGIAN COASTLINE
(BELPAEME & KONINGS, 2004) 3
FIG. 4 - DIKE MADE UP OF BRICKS (L), RUBBLES (R) 4
FIG. 5 - DIKE MADE UP OF TOURNAISIAN LIMESTONE 4
FIG. 6 - DIKE MADE UP OF CONCRETE STONES 5
FIG. 7 - SMALL VERTICAL WALL AT THE TOP OF THE DIKE 5
FIG. 8 - EXAMPLE OF DIKE CONSTRUCTION (AFDELING KUST) 5
FIG. 9 - CONSTRUCTION DESIGN OF DUNE FOOT STRENGTHENING OFF DE PANNE
(AFDELING KUST) 9
FIG. 10 - DUNE FOOT STRENGTHENING OFF LOMBARDSIJDE (VAN DER BIEST K., 2007) 9
FIG. 11 - MARRAM GRASS PLANTATION (WWW.VLIZ.BE) 12
FIG. 12 - BRUSH WOOD (WWW.VLIZ.BE) 12
FIG. 13 - FUTURE PLAN OF ZWIN (WWW.BNDESTEM.NL, 2006) 13
FIG. 14 - TWO SEA INLETS (SLUFTERS) AT RESERVE WESTHOEK 14
FIG. 15 - FLOODING DAMAGE FACTORS IN FUNCTION OF WATER DEPTH (VANNEUVILLE ET
AL., 2006) 18
FIG. 16 - NATURAL AREAS ALONG THE BELGIAN COASTLINE (BASED ON CORINE LAND
COVER 1996 AND MERCATOR DATABASE: DUINENDECREET 1997,
NATUURRESERVATEN 1997, HABITATRICHTLIJNGEBIEDEN 2001) 21
FIG. 17 - DRINKING-WATER AREAS AT KNOKKE-HEIST, PUMPING-UP FROM DUNES AT GOLF
(VANDEN BULCK, 2004) 25
FIG. 18 - DRINKING-WATER COLLECTION AREA AT BREDENE (VANDEN BULCK, 2004) 25
FIG. 19 - SIMULATION IMAGE OF SALT WATER INTRUSION INTO FRESH WATER SUPPLIES
ALONG COASTLINES (IBARAKI & MIZUNO, 2007) 26
FIG. 20 - BUILT-UP AREA IN THE BELGIAN COASTAL ZONE (KBG, 2007) 27
FIG. 21 – DAMAGE FACTOR FOR HOUSES AND MOVEABLES (VANNEUVILLE ET AL., 2006) 30
FIG. 22 - DAMAGE FACTOR TO VEHICLES (VANNEUVILLE ET AL, 2006) 31
FIG. 23 - INDUSTRIAL AREAS IN THE BELGIAN COASTAL ZONE (KBG, 2001) 33
FIG. 24 - DAMAGE FACTOR Α FOR INDUSTRY (EMPLOYEES AND SURFACE AREA),
VANNEUVILLE ET AL. (2006) 36
FIG. 25 - PERCENTAGE AGRICULTURAL AREA / TOTAL SURFACE AREA PER TOWN IN 2006
(BASED ON VRIESACKER ET AL., 2007) 39
FIG. 26 - AGRICULTURE IN THE BELGIAN COASTAL ZONE (KBG, 2007) 40
FIG. 27 - CULTIVATION STRUCTURE OF AGRICULTURAL CROPS IN THE POLDERS
(BELPAEME & KONINGS, 2004) 40
FIG. 28 - DAMAGE FUNCTION TO AGRICULTURE (VANNEUVILLE ET AL., 2006) 41
FIG. 29 - OVERLAND TRANSPORT FACILITIES IN THE BELGIAN COASTAL ZONE (MERCATOR
DATABASE: VERKEER 2006) 43
FIG. 30 - SERVICE NETWORKS IN THE BELGIAN COASTAL ZONE (MERCATOR DATABASE:
HOOGSPANNINGSKABELS 2006, GSM PYLONEN 2005, WINDTURBINES 2005) 44
FIG. 31 - DAMAGE FACTOR FOR ROADS AND RAILROADS (VANNEUVILLE ET AL., 2006) 45
FIG. 32 - DAMAGE FACTOR FOR TRANSMITTING STATIONS AND WIND TURBINES
(VANNEUVILLE ET AL., 2006) 46
v
FIG. 33 - INTERACTION BETWEEN COASTAL HAZARDS, HUMAN ACTIVITY AND RISK
(MCINNES R., 2006), 49
FIG. 34 - FUTURE DEVELOPMENT OF THE PORT OF OOSTENDE (WWW.PORTOFOOSTENDE.BE,
2008) 51
FIG. 35 - MAP OF PERMITTED EXTRACTION AREAS ON THE BCP (ICES, 2007) 54
vi
LIST OF TABLES
TABLE 1 - INVENTORY OF BELGIAN DIKES (TROUW ET AL., 2005) 8
TABLE 2 - OVERVIEW OF EFFECTUATED SAND NOURISHMENTS ALONG THE BELGIAN
COASTLINE. YEARLY AVERAGES ROUNDED OFF TO THOUSANDS, MOST RECENT
DATA ROUNDED OFF TO HUNDREDS. IN BOLD DATA ABOUT LARGE-SCALE
NOURISHMENTS (DE RONDE ET AL., 2007) 11
TABLE 3 - MAXIMAL DAMAGE VALUES PER LAND COVER TYPE OR OBJECT (TRANSLATED
AND ADAPTED FROM VANNEUVILLE ET AL., 2006) 17
TABLE 4 - POPULATION OF BELGIAN TOWNS LOCATED WITHIN STUDY AREA (NIS, 2007). *
BASED ON ASSUMPTION THAT AVERAGE # OF PEOPLE LIVING IN APARTMENTS IS 1,76
(O&S, 2008) (ITALIC: WIKIPEDIA, 2008. * POPULATION BY 01/01/2004) 20
TABLE 5 - TOTAL NUMBER OF PEOPLE WORKING WITHIN THE STUDY AREA (SWSE, 2005)
(ITALIC: ESTIMATION BASED ON VALUE AMALGAMATED MUNICIPALITY) 20
TABLE 6 - DRINKING-WATER PROVISION FROM BELGIAN DUNES (*IWVA, 2006; ** VANDEN
BULCK, 2004) 25
TABLE 7 - AVERAGE VALUE OF A HOUSE AND ITS MOVEABLES (STADIM, 2006; BVVO)
(ITALIC: VALUE OF AMALGAMATED MUNICIPALITY) 28
TABLE 8 - NUMBER OF BUILDINGS AND NUMBER OF APARTMENT BUILDINGS (2 OR MORE
RESIDENCES PER BUILDING) WITHIN THE STUDY-AREA (FOD, 2001) 29
TABLE 9 - NUMBER OF VEHICLES IN THE BELGIAN COASTAL ZONE (SVR, 2007). (ITALIC:
ESTIMATION BASED ON VALUE AMALGAMATED MUNICIPALITY) 31
TABLE 10 - NUMBER OF HOUSEHOLDS LIVING IN THE COASTAL ZONE (SVR, 2007) (ITALIC:
ESTIMATION BASED ON VALUE AMALGAMATED MUNICIPALITY) 32
TABLE 11 - TOTAL HANDLED CARGO VOLUME IN TONS OF THE PORT OF ZEEBRUGGE
(COENS J., 2008) 34
TABLE 12 - TRAFFIC DATA OF OOSTENDE PORT IN 2006 (HAVEN OOSTENDE, 2008) 34
TABLE 13 - TRAFFIC DATA OF OSTENDE- BRUGES INTERNATIONAL AIRPORT (OSTEND-
BRUGES INTERNATIONAL AIRPORT, 2008) 35
TABLE 14 - ECONOMICAL DATA ON PORTS AND AIRPORT IN THE FLEMISH COASTAL
REGION 35
TABLE 15 - NUMBER OF EMPLOYEES AND COMPANIES CREATED BY PORT ACTIVITIES
WITHIN THE STUDY AREA (*NBB, 2007; **COENS J., 2008; °HAVEN OOSTENDE, 2008;
°°OSTEND-BRUGES INTERNATIONAL AIRPORT, 2008) 37
TABLE 16 - NUMBER OF PEOPLE WORKING IN SECONDARY, TERTIARY, QUATERNARY AND
INDEPENDENT SECTOR IN THE STUDY-AREA IN 2005 (SVR, 2008). ZEEBRUGGE IS
DISCUSSED SEPARATELY ABOVE. (ITALIC: ESTIMATION BASED ON VALUE
AMALGAMATED MUNICIPALITY) 37
TABLE 17 - NUMBER OF ACTIVE COMPANIES IN 2005 (SVR, 2008). ZEEBRUGGE IS DISCUSSED
SEPARATELY ABOVE. (ITALIC: ESTIMATION BASED ON VALUE AMALGAMATED
MUNICIPALITY) 38
TABLE 18 - NUMBER OF PEOPLE WORKING IN AGRICULTURE AND NUMBER OF FARMS IN
2005 (SVR, 2008) (ITALIC: ESTIMATION BASED ON VALUE AMALGAMATED
MUNICIPALITY) 42
TABLE 19 - DAILY AVERAGES OF NUMBER OF VEHICLES ON HIGHWAYS IN THE COASTAL
ZONE BETWEEN 6AM AND 10PM, FOR THE YEAR 2006. KMPT= KILOMETRE POINT OF
THE COUNTER (VERKEERSTELLINGEN, 2006) 47
vii
TABLE 20 - DAILY AVERAGES OF NUMBER OF VEHICLES ON DISTRICT ROADS IN THE
COASTAL ZONE BETWEEN 6AM AND 10PM, FOR THE YEAR 2006
(VERKEERSTELLINGEN, 2006) 48
TABLE 21 - ESTIMATED POPULATION BY 2025 (SVR, 2007) (ITALIC: ESTIMATION BASED ON
VALUE AMALGAMATED MUNICIPALITY) 50
TABLE 22 - COMPANIES AT PLASSENDALE, ALREADY ESTABLISHED AND WITH
AGREEMENT FOR ESTABLISHMENT (PLASSENDALE NV, 2008) 53
1
1 COASTAL INFRASTRUCTURE
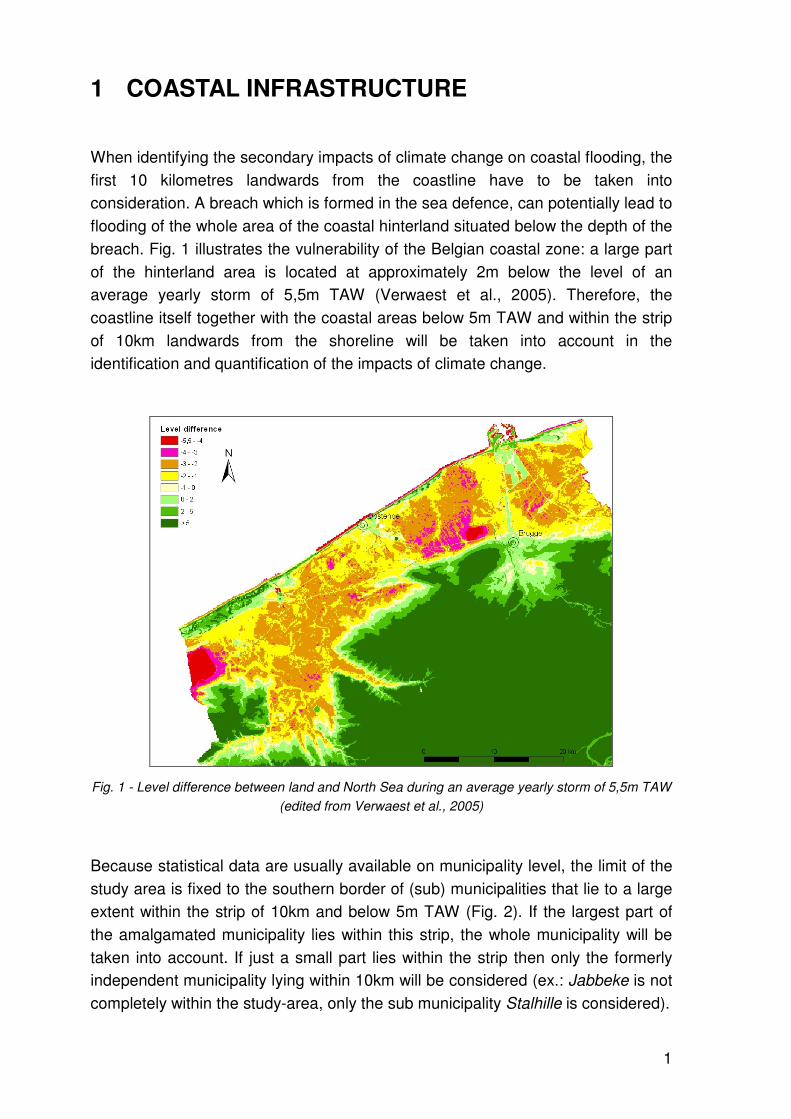
When identifying the secondary impacts of climate change on coastal flooding, the
first 10 kilometres landwards from the coastline have to be taken into
consideration. A breach which is formed in the sea defence, can potentially lead to
flooding of the whole area of the coastal hinterland situated below the depth of the
breach. Fig. 1 illustrates the vulnerability of the Belgian coastal zone: a large part
of the hinterland area is located at approximately 2m below the level of an
average yearly storm of 5,5m TAW (Verwaest et al., 2005). Therefore, the
coastline itself together with the coastal areas below 5m TAW and within the strip
of 10km landwards from the shoreline will be taken into account in the
identification and quantification of the impacts of climate change.
Fig. 1 - Level difference between land and North Sea during an average yearly storm of 5,5m TAW
(edited from Verwaest et al., 2005)
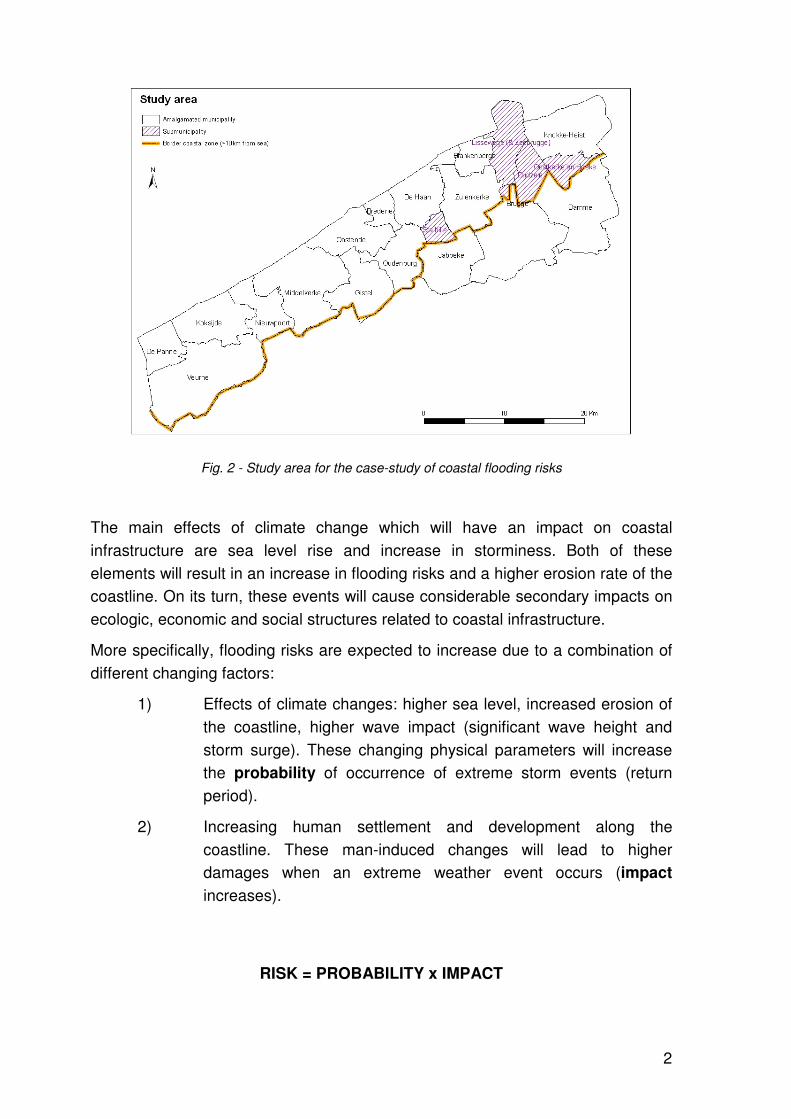
Because statistical data are usually available on municipality level, the limit of the
study area is fixed to the southern border of (sub) municipalities that lie to a large
extent within the strip of 10km and below 5m TAW (Fig. 2). If the largest part of
the amalgamated municipality lies within this strip, the whole municipality will be
taken into account. If just a small part lies within the strip then only the formerly
independent municipality lying within 10km will be considered (ex.: Jabbeke is not
completely within the study-area, only the sub municipality Stalhille is considered).
2
Fig. 2 - Study area for the case-study of coastal flooding risks
The main effects of climate change which will have an impact on coastal
infrastructure are sea level rise and increase in storminess. Both of these
elements will result in an increase in flooding risks and a higher erosion rate of the
coastline. On its turn, these events will cause considerable secondary impacts on
ecologic, economic and social structures related to coastal infrastructure.
More specifically, flooding risks are expected to increase due to a combination of
different changing factors:
1) Effects of climate changes: higher sea level, increased erosion of
the coastline, higher wave impact (significant wave height and
storm surge). These changing physical parameters will increase
the probability of occurrence of extreme storm events (return
period).
2) Increasing human settlement and development along the
coastline. These man-induced changes will lead to higher
damages when an extreme weather event occurs (impact
increases).
RISK = PROBABILITY x IMPACT
3
1.1 DEFENSE STRUCTURES
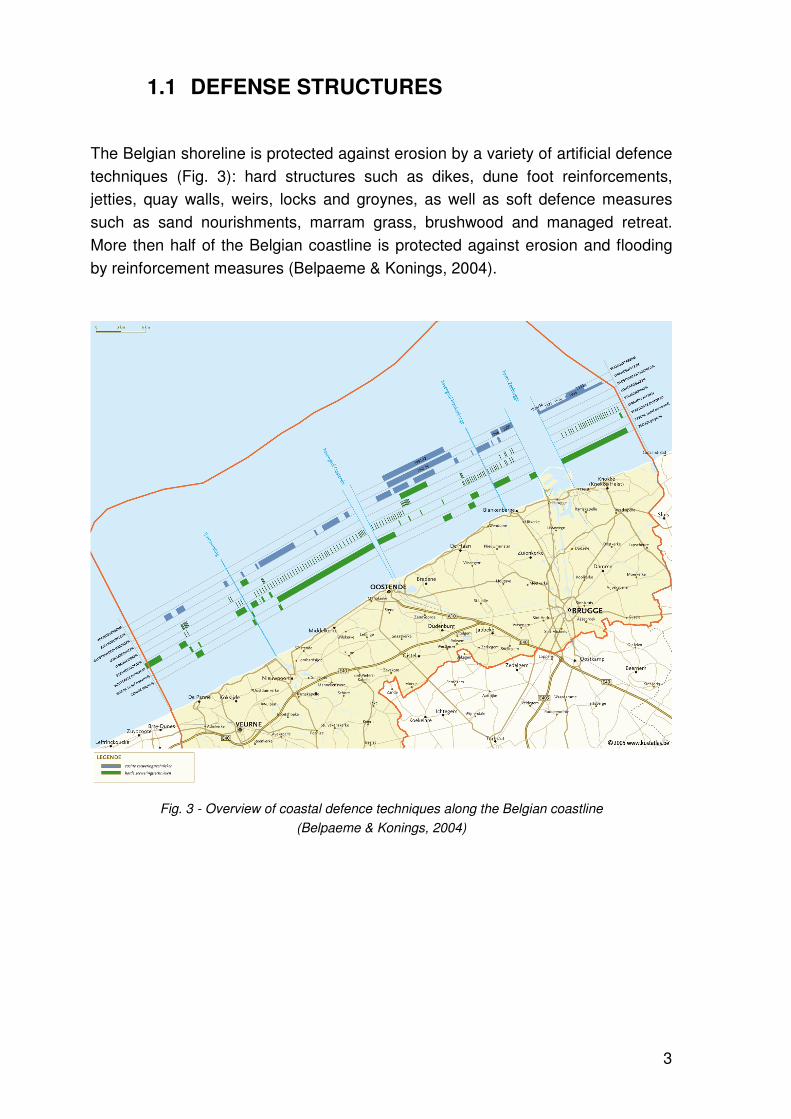
The Belgian shoreline is protected against erosion by a variety of artificial defence
techniques (Fig. 3): hard structures such as dikes, dune foot reinforcements,
jetties, quay walls, weirs, locks and groynes, as well as soft defence measures
such as sand nourishments, marram grass, brushwood and managed retreat.
More then half of the Belgian coastline is protected against erosion and flooding
by reinforcement measures (Belpaeme & Konings, 2004).
Fig. 3 - Overview of coastal defence techniques along the Belgian coastline
(Belpaeme & Konings, 2004)
4
1.1.1 Intensity
1.1.1.1 Dikes
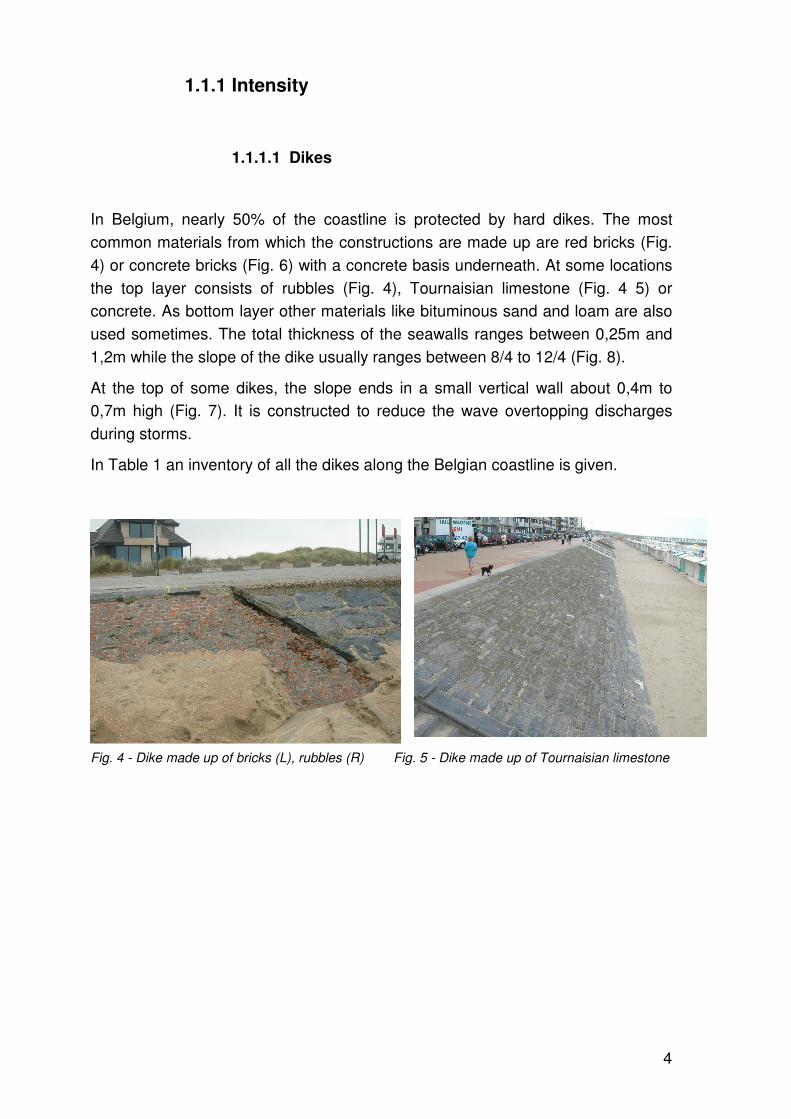
In Belgium, nearly 50% of the coastline is protected by hard dikes. The most
common materials from which the constructions are made up are red bricks (Fig.
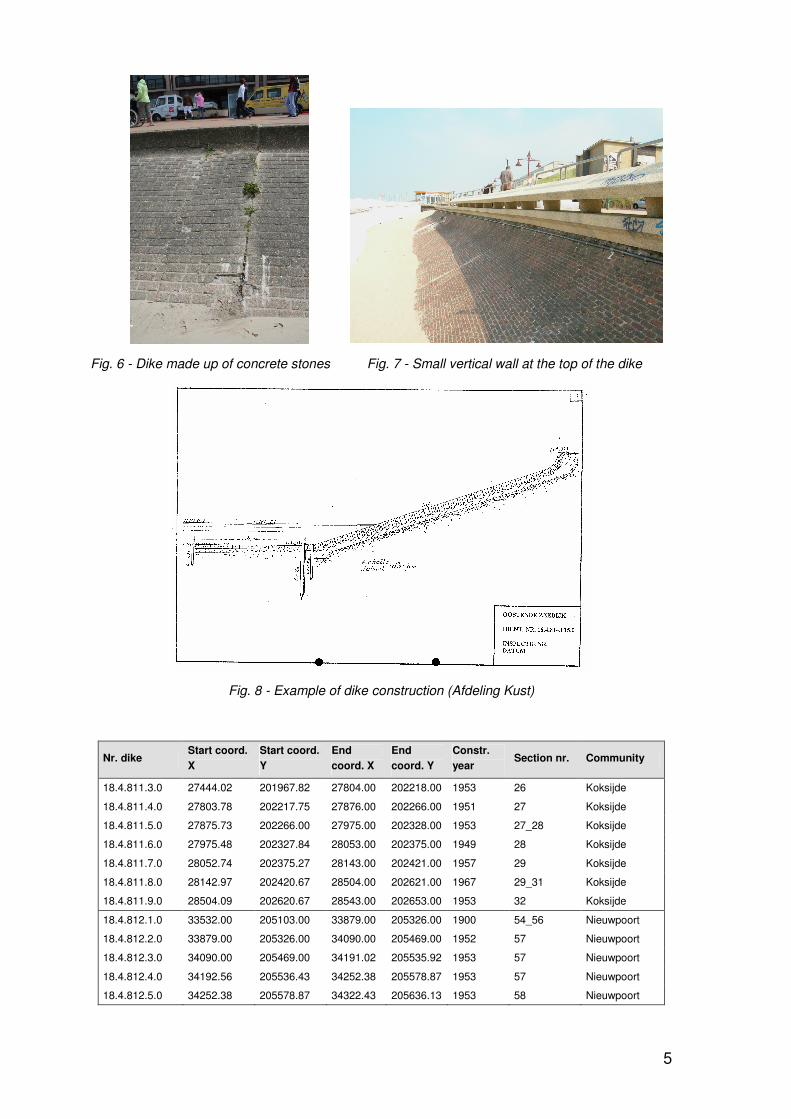
4) or concrete bricks (Fig. 6) with a concrete basis underneath. At some locations
the top layer consists of rubbles (Fig. 4), Tournaisian limestone (Fig. 4 5) or
concrete. As bottom layer other materials like bituminous sand and loam are also
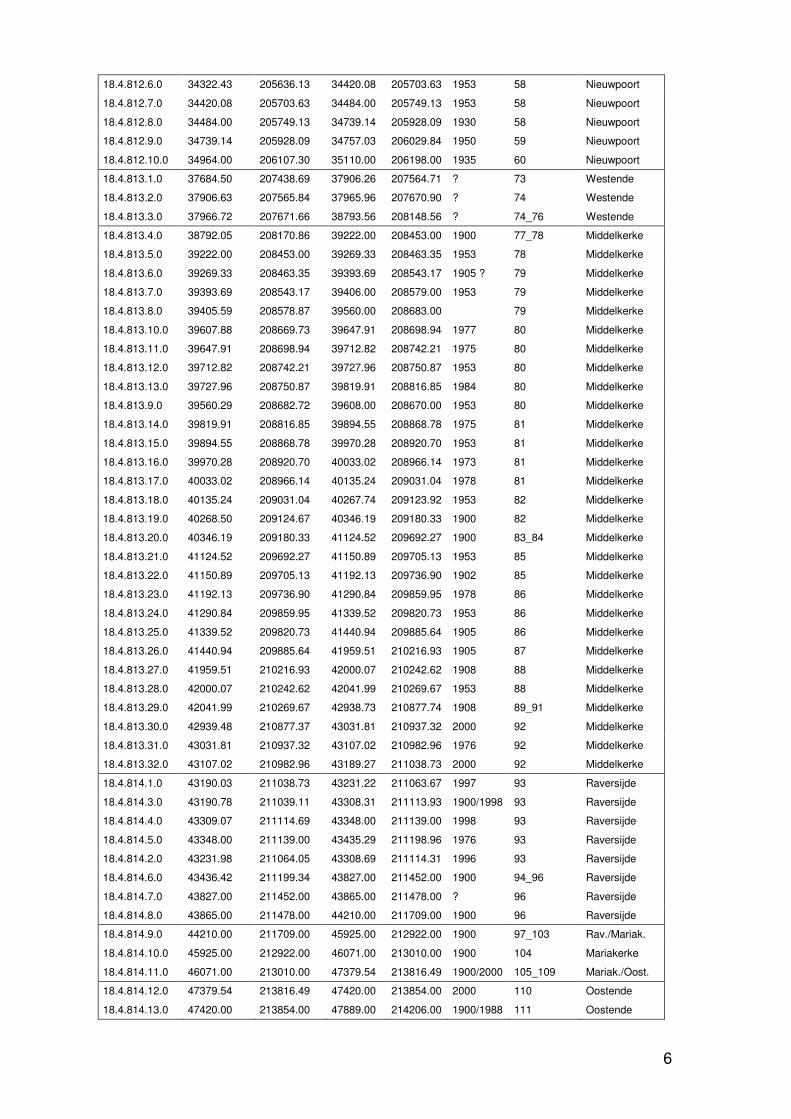
used sometimes. The total thickness of the seawalls ranges between 0,25m and
1,2m while the slope of the dike usually ranges between 8/4 to 12/4 (Fig. 8).
At the top of some dikes, the slope ends in a small vertical wall about 0,4m to
0,7m high (Fig. 7). It is constructed to reduce the wave overtopping discharges
during storms.
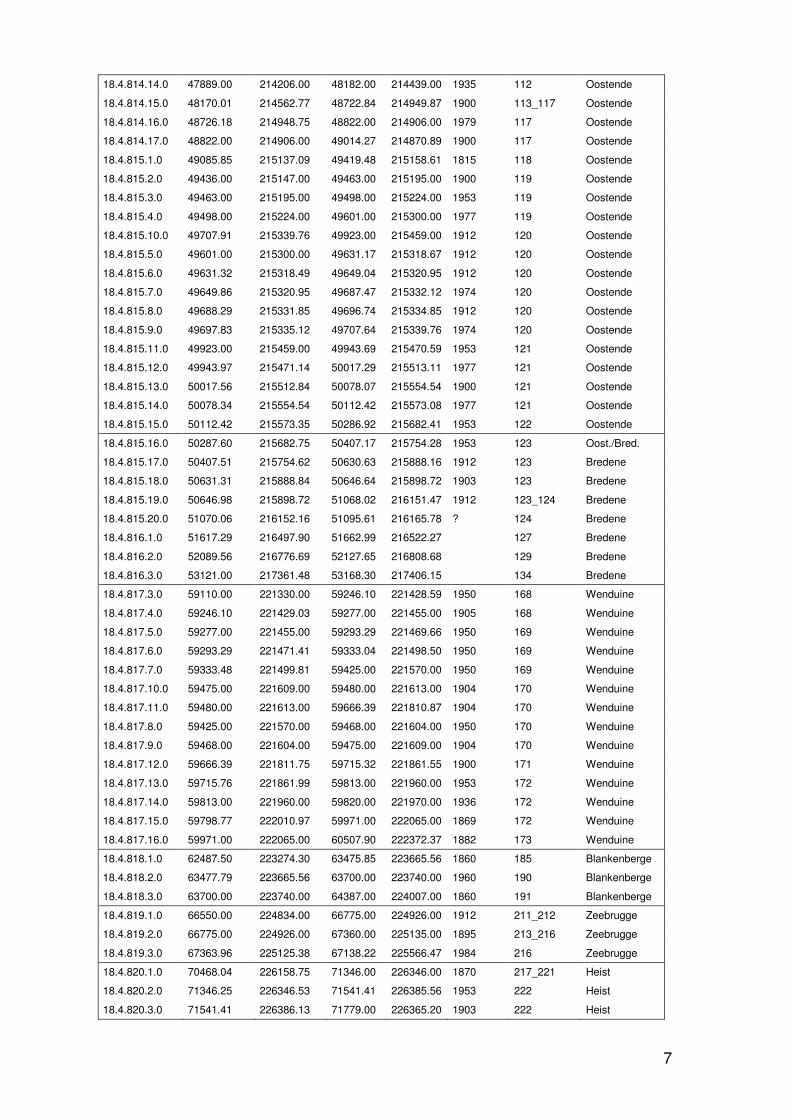
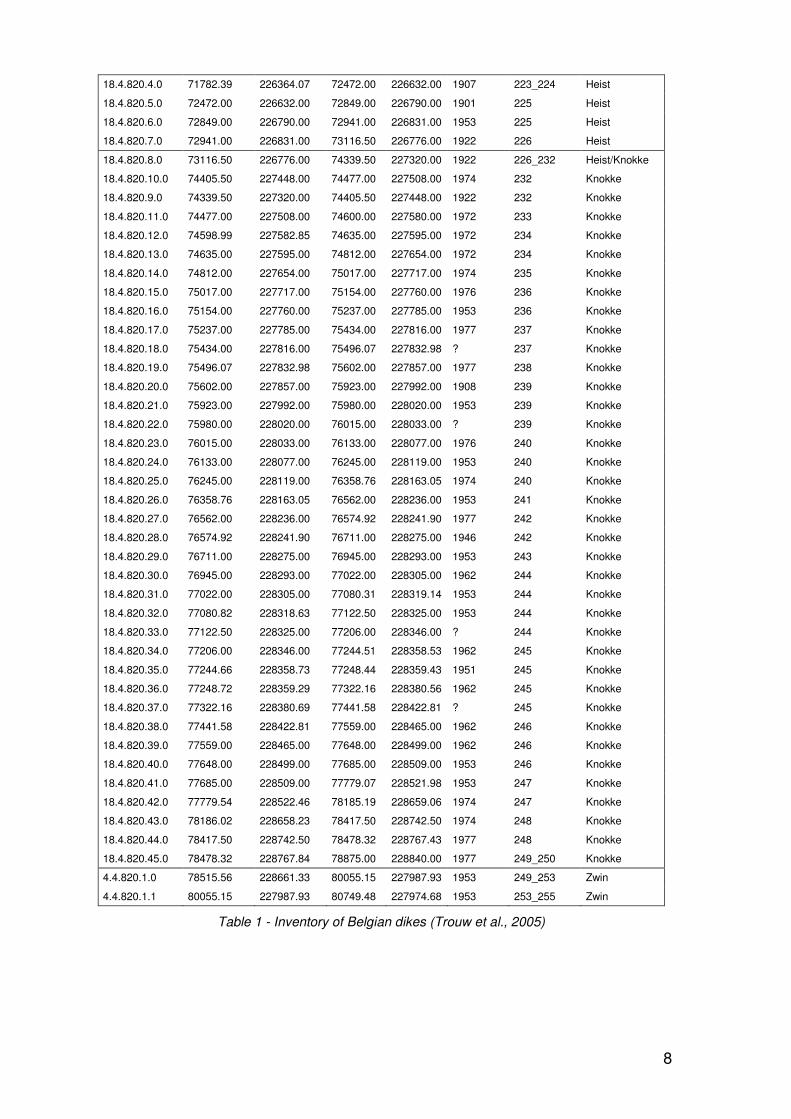
In Table 1 an inventory of all the dikes along the Belgian coastline is given.
Fig. 4 - Dike made up of bricks (L), rubbles (R) Fig. 5 - Dike made up of Tournaisian limestone
5
Fig. 6 - Dike made up of concrete stones Fig. 7 - Small vertical wall at the top of the dike
Fig. 8 - Example of dike construction (Afdeling Kust)
Nr. dike Start coord.
X
Start coord.
Y
End
coord. X
End
coord. Y
Constr.
year Section nr. Community
18.4.811.3.0 27444.02 201967.82 27804.00 202218.00 1953 26 Koksijde
18.4.811.4.0 27803.78 202217.75 27876.00 202266.00 1951 27 Koksijde
18.4.811.5.0 27875.73 202266.00 27975.00 202328.00 1953 27_28 Koksijde
18.4.811.6.0 27975.48 202327.84 28053.00 202375.00 1949 28 Koksijde
18.4.811.7.0 28052.74 202375.27 28143.00 202421.00 1957 29 Koksijde
18.4.811.8.0 28142.97 202420.67 28504.00 202621.00 1967 29_31 Koksijde
18.4.811.9.0 28504.09 202620.67 28543.00 202653.00 1953 32 Koksijde
18.4.812.1.0 33532.00 205103.00 33879.00 205326.00 1900 54_56 Nieuwpoort
18.4.812.2.0 33879.00 205326.00 34090.00 205469.00 1952 57 Nieuwpoort
18.4.812.3.0 34090.00 205469.00 34191.02 205535.92 1953 57 Nieuwpoort
18.4.812.4.0 34192.56 205536.43 34252.38 205578.87 1953 57 Nieuwpoort
18.4.812.5.0 34252.38 205578.87 34322.43 205636.13 1953 58 Nieuwpoort
6
18.4.812.6.0 34322.43 205636.13 34420.08 205703.63 1953 58 Nieuwpoort
18.4.812.7.0 34420.08 205703.63 34484.00 205749.13 1953 58 Nieuwpoort
18.4.812.8.0 34484.00 205749.13 34739.14 205928.09 1930 58 Nieuwpoort
18.4.812.9.0 34739.14 205928.09 34757.03 206029.84 1950 59 Nieuwpoort
18.4.812.10.0 34964.00 206107.30 35110.00 206198.00 1935 60 Nieuwpoort
18.4.813.1.0 37684.50 207438.69 37906.26 207564.71 ? 73 Westende
18.4.813.2.0 37906.63 207565.84 37965.96 207670.90 ? 74 Westende
18.4.813.3.0 37966.72 207671.66 38793.56 208148.56 ? 74_76 Westende
18.4.813.4.0 38792.05 208170.86 39222.00 208453.00 1900 77_78 Middelkerke
18.4.813.5.0 39222.00 208453.00 39269.33 208463.35 1953 78 Middelkerke
18.4.813.6.0 39269.33 208463.35 39393.69 208543.17 1905 ? 79 Middelkerke
18.4.813.7.0 39393.69 208543.17 39406.00 208579.00 1953 79 Middelkerke
18.4.813.8.0 39405.59 208578.87 39560.00 208683.00 79 Middelkerke
18.4.813.10.0 39607.88 208669.73 39647.91 208698.94 1977 80 Middelkerke
18.4.813.11.0 39647.91 208698.94 39712.82 208742.21 1975 80 Middelkerke
18.4.813.12.0 39712.82 208742.21 39727.96 208750.87 1953 80 Middelkerke
18.4.813.13.0 39727.96 208750.87 39819.91 208816.85 1984 80 Middelkerke
18.4.813.9.0 39560.29 208682.72 39608.00 208670.00 1953 80 Middelkerke
18.4.813.14.0 39819.91 208816.85 39894.55 208868.78 1975 81 Middelkerke
18.4.813.15.0 39894.55 208868.78 39970.28 208920.70 1953 81 Middelkerke
18.4.813.16.0 39970.28 208920.70 40033.02 208966.14 1973 81 Middelkerke
18.4.813.17.0 40033.02 208966.14 40135.24 209031.04 1978 81 Middelkerke
18.4.813.18.0 40135.24 209031.04 40267.74 209123.92 1953 82 Middelkerke
18.4.813.19.0 40268.50 209124.67 40346.19 209180.33 1900 82 Middelkerke
18.4.813.20.0 40346.19 209180.33 41124.52 209692.27 1900 83_84 Middelkerke
18.4.813.21.0 41124.52 209692.27 41150.89 209705.13 1953 85 Middelkerke
18.4.813.22.0 41150.89 209705.13 41192.13 209736.90 1902 85 Middelkerke
18.4.813.23.0 41192.13 209736.90 41290.84 209859.95 1978 86 Middelkerke
18.4.813.24.0 41290.84 209859.95 41339.52 209820.73 1953 86 Middelkerke
18.4.813.25.0 41339.52 209820.73 41440.94 209885.64 1905 86 Middelkerke
18.4.813.26.0 41440.94 209885.64 41959.51 210216.93 1905 87 Middelkerke
18.4.813.27.0 41959.51 210216.93 42000.07 210242.62 1908 88 Middelkerke
18.4.813.28.0 42000.07 210242.62 42041.99 210269.67 1953 88 Middelkerke
18.4.813.29.0 42041.99 210269.67 42938.73 210877.74 1908 89_91 Middelkerke
18.4.813.30.0 42939.48 210877.37 43031.81 210937.32 2000 92 Middelkerke
18.4.813.31.0 43031.81 210937.32 43107.02 210982.96 1976 92 Middelkerke
18.4.813.32.0 43107.02 210982.96 43189.27 211038.73 2000 92 Middelkerke
18.4.814.1.0 43190.03 211038.73 43231.22 211063.67 1997 93 Raversijde
18.4.814.3.0 43190.78 211039.11 43308.31 211113.93 1900/1998 93 Raversijde
18.4.814.4.0 43309.07 211114.69 43348.00 211139.00 1998 93 Raversijde
18.4.814.5.0 43348.00 211139.00 43435.29 211198.96 1976 93 Raversijde
18.4.814.2.0 43231.98 211064.05 43308.69 211114.31 1996 93 Raversijde
18.4.814.6.0 43436.42 211199.34 43827.00 211452.00 1900 94_96 Raversijde
18.4.814.7.0 43827.00 211452.00 43865.00 211478.00 ? 96 Raversijde
18.4.814.8.0 43865.00 211478.00 44210.00 211709.00 1900 96 Raversijde
18.4.814.9.0 44210.00 211709.00 45925.00 212922.00 1900 97_103 Rav./Mariak.
18.4.814.10.0 45925.00 212922.00 46071.00 213010.00 1900 104 Mariakerke
18.4.814.11.0 46071.00 213010.00 47379.54 213816.49 1900/2000 105_109 Mariak./Oost.
18.4.814.12.0 47379.54 213816.49 47420.00 213854.00 2000 110 Oostende
18.4.814.13.0 47420.00 213854.00 47889.00 214206.00 1900/1988 111 Oostende
7
18.4.814.14.0 47889.00 214206.00 48182.00 214439.00 1935 112 Oostende
18.4.814.15.0 48170.01 214562.77 48722.84 214949.87 1900 113_117 Oostende
18.4.814.16.0 48726.18 214948.75 48822.00 214906.00 1979 117 Oostende
18.4.814.17.0 48822.00 214906.00 49014.27 214870.89 1900 117 Oostende
18.4.815.1.0 49085.85 215137.09 49419.48 215158.61 1815 118 Oostende
18.4.815.2.0 49436.00 215147.00 49463.00 215195.00 1900 119 Oostende
18.4.815.3.0 49463.00 215195.00 49498.00 215224.00 1953 119 Oostende
18.4.815.4.0 49498.00 215224.00 49601.00 215300.00 1977 119 Oostende
18.4.815.10.0 49707.91 215339.76 49923.00 215459.00 1912 120 Oostende
18.4.815.5.0 49601.00 215300.00 49631.17 215318.67 1912 120 Oostende
18.4.815.6.0 49631.32 215318.49 49649.04 215320.95 1912 120 Oostende
18.4.815.7.0 49649.86 215320.95 49687.47 215332.12 1974 120 Oostende
18.4.815.8.0 49688.29 215331.85 49696.74 215334.85 1912 120 Oostende
18.4.815.9.0 49697.83 215335.12 49707.64 215339.76 1974 120 Oostende
18.4.815.11.0 49923.00 215459.00 49943.69 215470.59 1953 121 Oostende
18.4.815.12.0 49943.97 215471.14 50017.29 215513.11 1977 121 Oostende
18.4.815.13.0 50017.56 215512.84 50078.07 215554.54 1900 121 Oostende
18.4.815.14.0 50078.34 215554.54 50112.42 215573.08 1977 121 Oostende
18.4.815.15.0 50112.42 215573.35 50286.92 215682.41 1953 122 Oostende
18.4.815.16.0 50287.60 215682.75 50407.17 215754.28 1953 123 Oost./Bred.
18.4.815.17.0 50407.51 215754.62 50630.63 215888.16 1912 123 Bredene
18.4.815.18.0 50631.31 215888.84 50646.64 215898.72 1903 123 Bredene
18.4.815.19.0 50646.98 215898.72 51068.02 216151.47 1912 123_124 Bredene
18.4.815.20.0 51070.06 216152.16 51095.61 216165.78 ? 124 Bredene
18.4.816.1.0 51617.29 216497.90 51662.99 216522.27 127 Bredene
18.4.816.2.0 52089.56 216776.69 52127.65 216808.68 129 Bredene
18.4.816.3.0 53121.00 217361.48 53168.30 217406.15 134 Bredene
18.4.817.3.0 59110.00 221330.00 59246.10 221428.59 1950 168 Wenduine
18.4.817.4.0 59246.10 221429.03 59277.00 221455.00 1905 168 Wenduine
18.4.817.5.0 59277.00 221455.00 59293.29 221469.66 1950 169 Wenduine
18.4.817.6.0 59293.29 221471.41 59333.04 221498.50 1950 169 Wenduine
18.4.817.7.0 59333.48 221499.81 59425.00 221570.00 1950 169 Wenduine
18.4.817.10.0 59475.00 221609.00 59480.00 221613.00 1904 170 Wenduine
18.4.817.11.0 59480.00 221613.00 59666.39 221810.87 1904 170 Wenduine
18.4.817.8.0 59425.00 221570.00 59468.00 221604.00 1950 170 Wenduine
18.4.817.9.0 59468.00 221604.00 59475.00 221609.00 1904 170 Wenduine
18.4.817.12.0 59666.39 221811.75 59715.32 221861.55 1900 171 Wenduine
18.4.817.13.0 59715.76 221861.99 59813.00 221960.00 1953 172 Wenduine
18.4.817.14.0 59813.00 221960.00 59820.00 221970.00 1936 172 Wenduine
18.4.817.15.0 59798.77 222010.97 59971.00 222065.00 1869 172 Wenduine
18.4.817.16.0 59971.00 222065.00 60507.90 222372.37 1882 173 Wenduine
18.4.818.1.0 62487.50 223274.30 63475.85 223665.56 1860 185 Blankenberge
18.4.818.2.0 63477.79 223665.56 63700.00 223740.00 1960 190 Blankenberge
18.4.818.3.0 63700.00 223740.00 64387.00 224007.00 1860 191 Blankenberge
18.4.819.1.0 66550.00 224834.00 66775.00 224926.00 1912 211_212 Zeebrugge
18.4.819.2.0 66775.00 224926.00 67360.00 225135.00 1895 213_216 Zeebrugge
18.4.819.3.0 67363.96 225125.38 67138.22 225566.47 1984 216 Zeebrugge
18.4.820.1.0 70468.04 226158.75 71346.00 226346.00 1870 217_221 Heist
18.4.820.2.0 71346.25 226346.53 71541.41 226385.56 1953 222 Heist
18.4.820.3.0 71541.41 226386.13 71779.00 226365.20 1903 222 Heist
8
18.4.820.4.0 71782.39 226364.07 72472.00 226632.00 1907 223_224 Heist
18.4.820.5.0 72472.00 226632.00 72849.00 226790.00 1901 225 Heist
18.4.820.6.0 72849.00 226790.00 72941.00 226831.00 1953 225 Heist
18.4.820.7.0 72941.00 226831.00 73116.50 226776.00 1922 226 Heist
18.4.820.8.0 73116.50 226776.00 74339.50 227320.00 1922 226_232 Heist/Knokke
18.4.820.10.0 74405.50 227448.00 74477.00 227508.00 1974 232 Knokke
18.4.820.9.0 74339.50 227320.00 74405.50 227448.00 1922 232 Knokke
18.4.820.11.0 74477.00 227508.00 74600.00 227580.00 1972 233 Knokke
18.4.820.12.0 74598.99 227582.85 74635.00 227595.00 1972 234 Knokke
18.4.820.13.0 74635.00 227595.00 74812.00 227654.00 1972 234 Knokke
18.4.820.14.0 74812.00 227654.00 75017.00 227717.00 1974 235 Knokke
18.4.820.15.0 75017.00 227717.00 75154.00 227760.00 1976 236 Knokke
18.4.820.16.0 75154.00 227760.00 75237.00 227785.00 1953 236 Knokke
18.4.820.17.0 75237.00 227785.00 75434.00 227816.00 1977 237 Knokke
18.4.820.18.0 75434.00 227816.00 75496.07 227832.98 ? 237 Knokke
18.4.820.19.0 75496.07 227832.98 75602.00 227857.00 1977 238 Knokke
18.4.820.20.0 75602.00 227857.00 75923.00 227992.00 1908 239 Knokke
18.4.820.21.0 75923.00 227992.00 75980.00 228020.00 1953 239 Knokke
18.4.820.22.0 75980.00 228020.00 76015.00 228033.00 ? 239 Knokke
18.4.820.23.0 76015.00 228033.00 76133.00 228077.00 1976 240 Knokke
18.4.820.24.0 76133.00 228077.00 76245.00 228119.00 1953 240 Knokke
18.4.820.25.0 76245.00 228119.00 76358.76 228163.05 1974 240 Knokke
18.4.820.26.0 76358.76 228163.05 76562.00 228236.00 1953 241 Knokke
18.4.820.27.0 76562.00 228236.00 76574.92 228241.90 1977 242 Knokke
18.4.820.28.0 76574.92 228241.90 76711.00 228275.00 1946 242 Knokke
18.4.820.29.0 76711.00 228275.00 76945.00 228293.00 1953 243 Knokke
18.4.820.30.0 76945.00 228293.00 77022.00 228305.00 1962 244 Knokke
18.4.820.31.0 77022.00 228305.00 77080.31 228319.14 1953 244 Knokke
18.4.820.32.0 77080.82 228318.63 77122.50 228325.00 1953 244 Knokke
18.4.820.33.0 77122.50 228325.00 77206.00 228346.00 ? 244 Knokke
18.4.820.34.0 77206.00 228346.00 77244.51 228358.53 1962 245 Knokke
18.4.820.35.0 77244.66 228358.73 77248.44 228359.43 1951 245 Knokke
18.4.820.36.0 77248.72 228359.29 77322.16 228380.56 1962 245 Knokke
18.4.820.37.0 77322.16 228380.69 77441.58 228422.81 ? 245 Knokke
18.4.820.38.0 77441.58 228422.81 77559.00 228465.00 1962 246 Knokke
18.4.820.39.0 77559.00 228465.00 77648.00 228499.00 1962 246 Knokke
18.4.820.40.0 77648.00 228499.00 77685.00 228509.00 1953 246 Knokke
18.4.820.41.0 77685.00 228509.00 77779.07 228521.98 1953 247 Knokke
18.4.820.42.0 77779.54 228522.46 78185.19 228659.06 1974 247 Knokke
18.4.820.43.0 78186.02 228658.23 78417.50 228742.50 1974 248 Knokke
18.4.820.44.0 78417.50 228742.50 78478.32 228767.43 1977 248 Knokke
18.4.820.45.0 78478.32 228767.84 78875.00 228840.00 1977 249_250 Knokke
4.4.820.1.0 78515.56 228661.33 80055.15 227987.93 1953 249_253 Zwin
4.4.820.1.1 80055.15 227987.93 80749.48 227974.68 1953 253_255 Zwin
Table 1 - Inventory of Belgian dikes (Trouw et al., 2005)
9
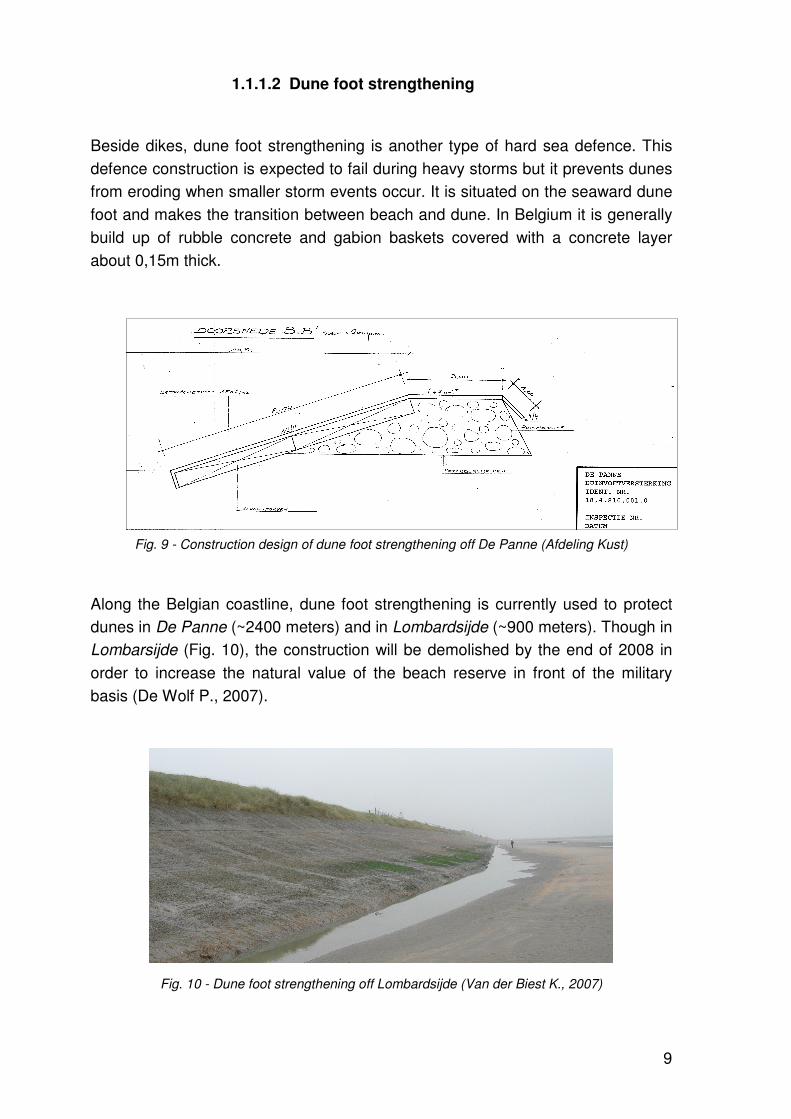
1.1.1.2 Dune foot strengthening
Beside dikes, dune foot strengthening is another type of hard sea defence. This
defence construction is expected to fail during heavy storms but it prevents dunes
from eroding when smaller storm events occur. It is situated on the seaward dune
foot and makes the transition between beach and dune. In Belgium it is generally
build up of rubble concrete and gabion baskets covered with a concrete layer
about 0,15m thick.
Fig. 9 - Construction design of dune foot strengthening off De Panne (Afdeling Kust)
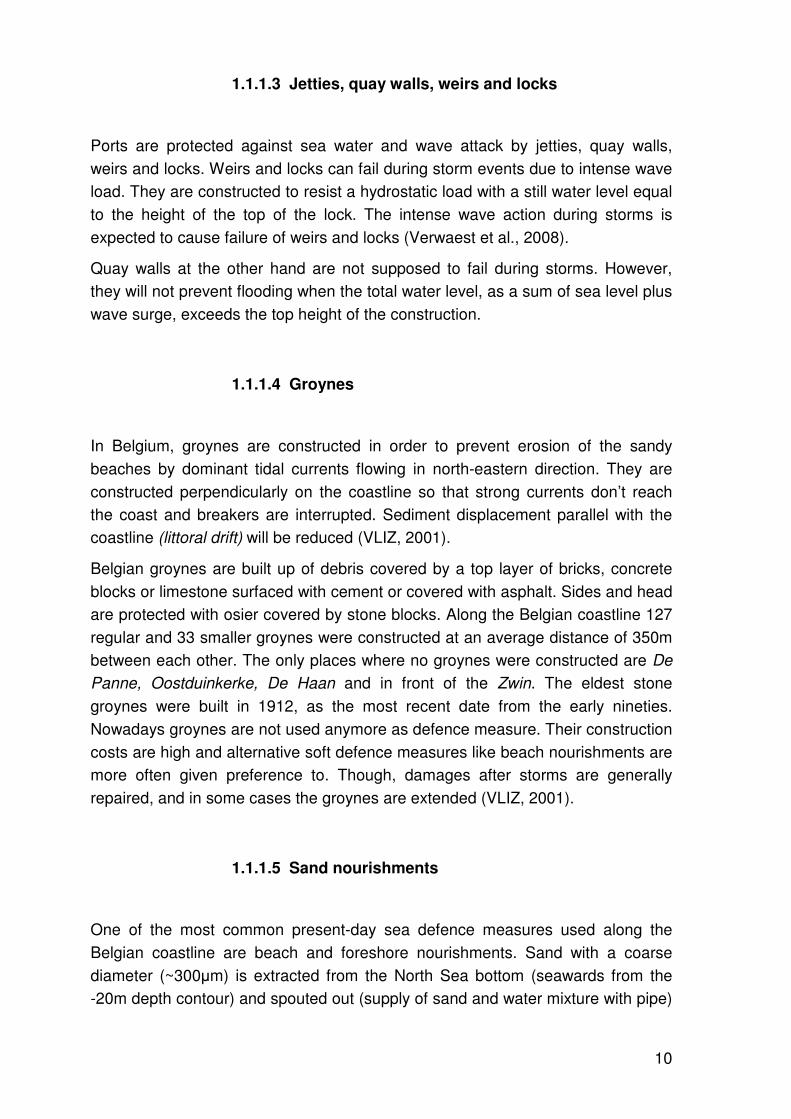
Along the Belgian coastline, dune foot strengthening is currently used to protect
dunes in De Panne (~2400 meters) and in Lombardsijde (~900 meters). Though in
Lombarsijde (Fig. 10), the construction will be demolished by the end of 2008 in
order to increase the natural value of the beach reserve in front of the military
basis (De Wolf P., 2007).
Fig. 10 - Dune foot strengthening off Lombardsijde (Van der Biest K., 2007)
10
1.1.1.3 Jetties, quay walls, weirs and locks
Ports are protected against sea water and wave attack by jetties, quay walls,
weirs and locks. Weirs and locks can fail during storm events due to intense wave
load. They are constructed to resist a hydrostatic load with a still water level equal
to the height of the top of the lock. The intense wave action during storms is
expected to cause failure of weirs and locks (Verwaest et al., 2008).
Quay walls at the other hand are not supposed to fail during storms. However,
they will not prevent flooding when the total water level, as a sum of sea level plus
wave surge, exceeds the top height of the construction.
1.1.1.4 Groynes
In Belgium, groynes are constructed in order to prevent erosion of the sandy
beaches by dominant tidal currents flowing in north-eastern direction. They are
constructed perpendicularly on the coastline so that strong currents don’t reach
the coast and breakers are interrupted. Sediment displacement parallel with the
coastline (littoral drift) will be reduced (VLIZ, 2001).
Belgian groynes are built up of debris covered by a top layer of bricks, concrete
blocks or limestone surfaced with cement or covered with asphalt. Sides and head
are protected with osier covered by stone blocks. Along the Belgian coastline 127
regular and 33 smaller groynes were constructed at an average distance of 350m
between each other. The only places where no groynes were constructed are De
Panne, Oostduinkerke, De Haan and in front of the Zwin. The eldest stone
groynes were built in 1912, as the most recent date from the early nineties.
Nowadays groynes are not used anymore as defence measure. Their construction
costs are high and alternative soft defence measures like beach nourishments are
more often given preference to. Though, damages after storms are generally
repaired, and in some cases the groynes are extended (VLIZ, 2001).
1.1.1.5 Sand nourishments
One of the most common present-day sea defence measures used along the
Belgian coastline are beach and foreshore nourishments. Sand with a coarse
diameter (~300µm) is extracted from the North Sea bottom (seawards from the
-20m depth contour) and spouted out (supply of sand and water mixture with pipe)
11
or levelled up (supply of sand with trucks) on the beach in front of the dike. This
technique is used to compensate the erosion of beaches due to tidal currents and
wave impact. Less frequently in Belgium, sand nourishments also take place on
foreshore (underwater). Foreshore nourishments are longer lasting and cheaper
then beach nourishments though the latter have quicker results: as soon as the
sand is deposited, beaches are larger and broader.
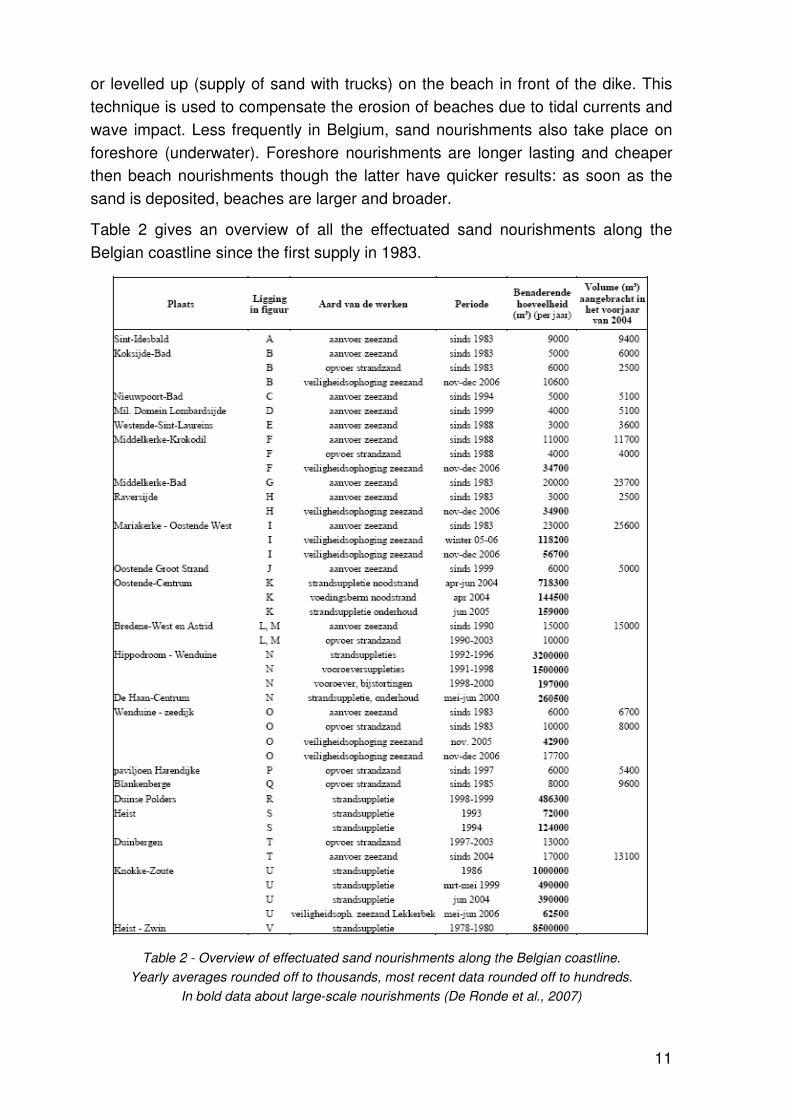
Table 2 gives an overview of all the effectuated sand nourishments along the
Belgian coastline since the first supply in 1983.
Table 2 - Overview of effectuated sand nourishments along the Belgian coastline.
Yearly averages rounded off to thousands, most recent data rounded off to hundreds.
In bold data about large-scale nourishments (De Ronde et al., 2007)
12
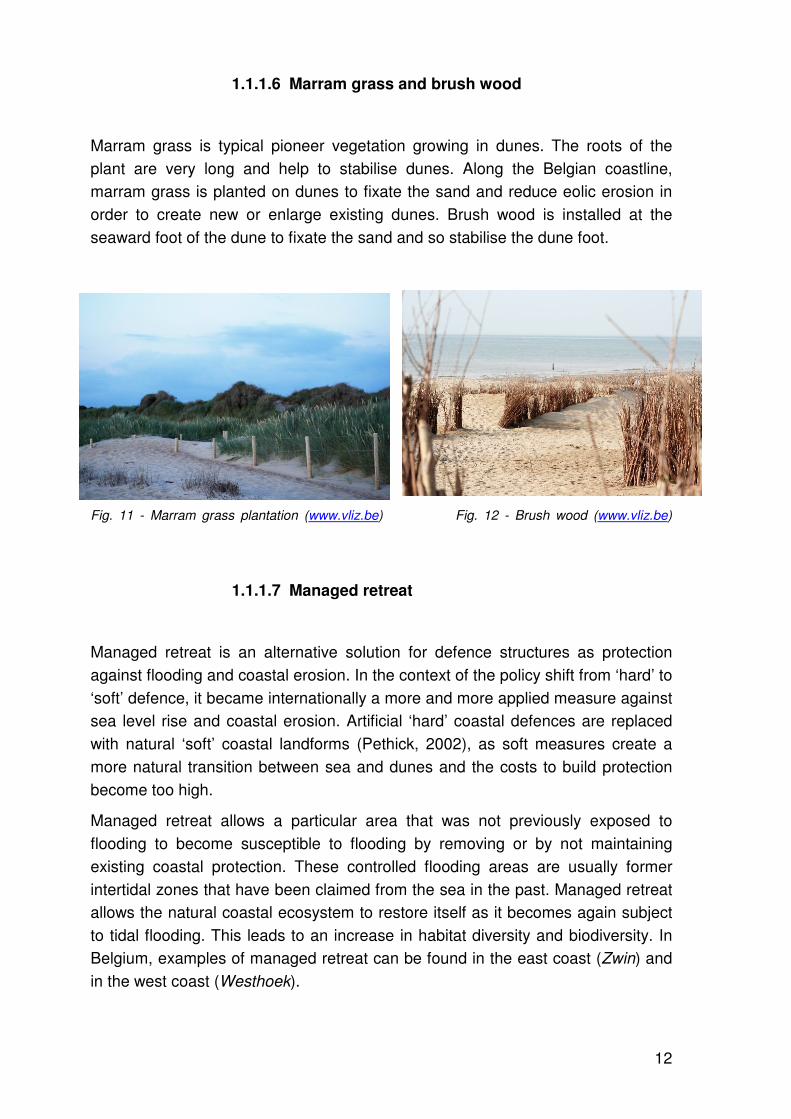
1.1.1.6 Marram grass and brush wood
Marram grass is typical pioneer vegetation growing in dunes. The roots of the
plant are very long and help to stabilise dunes. Along the Belgian coastline,
marram grass is planted on dunes to fixate the sand and reduce eolic erosion in
order to create new or enlarge existing dunes. Brush wood is installed at the
seaward foot of the dune to fixate the sand and so stabilise the dune foot.
Fig. 11 - Marram grass plantation (www.vliz.be) Fig. 12 - Brush wood (www.vliz.be)
1.1.1.7 Managed retreat
Managed retreat is an alternative solution for defence structures as protection
against flooding and coastal erosion. In the context of the policy shift from ‘hard’ to
‘soft’ defence, it became internationally a more and more applied measure against
sea level rise and coastal erosion. Artificial ‘hard’ coastal defences are replaced
with natural ‘soft’ coastal landforms (Pethick, 2002), as soft measures create a
more natural transition between sea and dunes and the costs to build protection
become too high.
Managed retreat allows a particular area that was not previously exposed to
flooding to become susceptible to flooding by removing or by not maintaining
existing coastal protection. These controlled flooding areas are usually former
intertidal zones that have been claimed from the sea in the past. Managed retreat
allows the natural coastal ecosystem to restore itself as it becomes again subject
to tidal flooding. This leads to an increase in habitat diversity and biodiversity. In
Belgium, examples of managed retreat can be found in the east coast (Zwin) and
in the west coast (Westhoek).
13
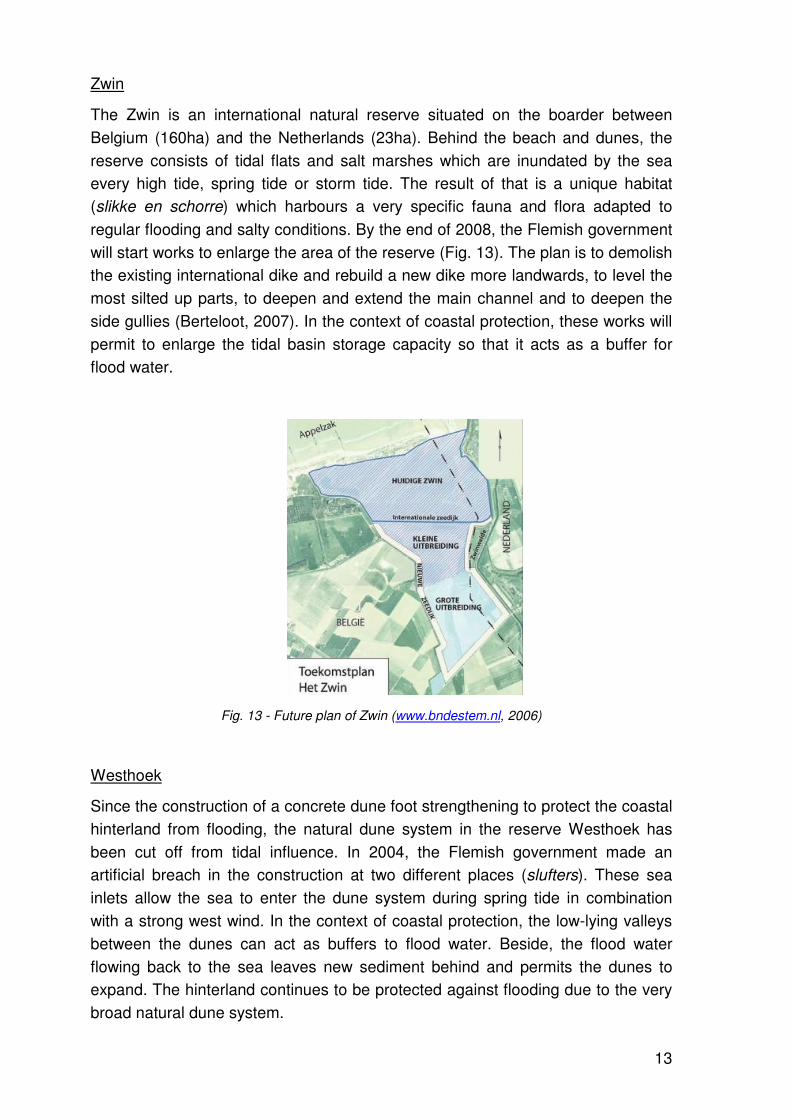
Zwin
The Zwin is an international natural reserve situated on the boarder between
Belgium (160ha) and the Netherlands (23ha). Behind the beach and dunes, the
reserve consists of tidal flats and salt marshes which are inundated by the sea
every high tide, spring tide or storm tide. The result of that is a unique habitat
(slikke en schorre) which harbours a very specific fauna and flora adapted to
regular flooding and salty conditions. By the end of 2008, the Flemish government
will start works to enlarge the area of the reserve (Fig. 13). The plan is to demolish
the existing international dike and rebuild a new dike more landwards, to level the
most silted up parts, to deepen and extend the main channel and to deepen the
side gullies (Berteloot, 2007). In the context of coastal protection, these works will
permit to enlarge the tidal basin storage capacity so that it acts as a buffer for
flood water.
Fig. 13 - Future plan of Zwin (www.bndestem.nl, 2006)
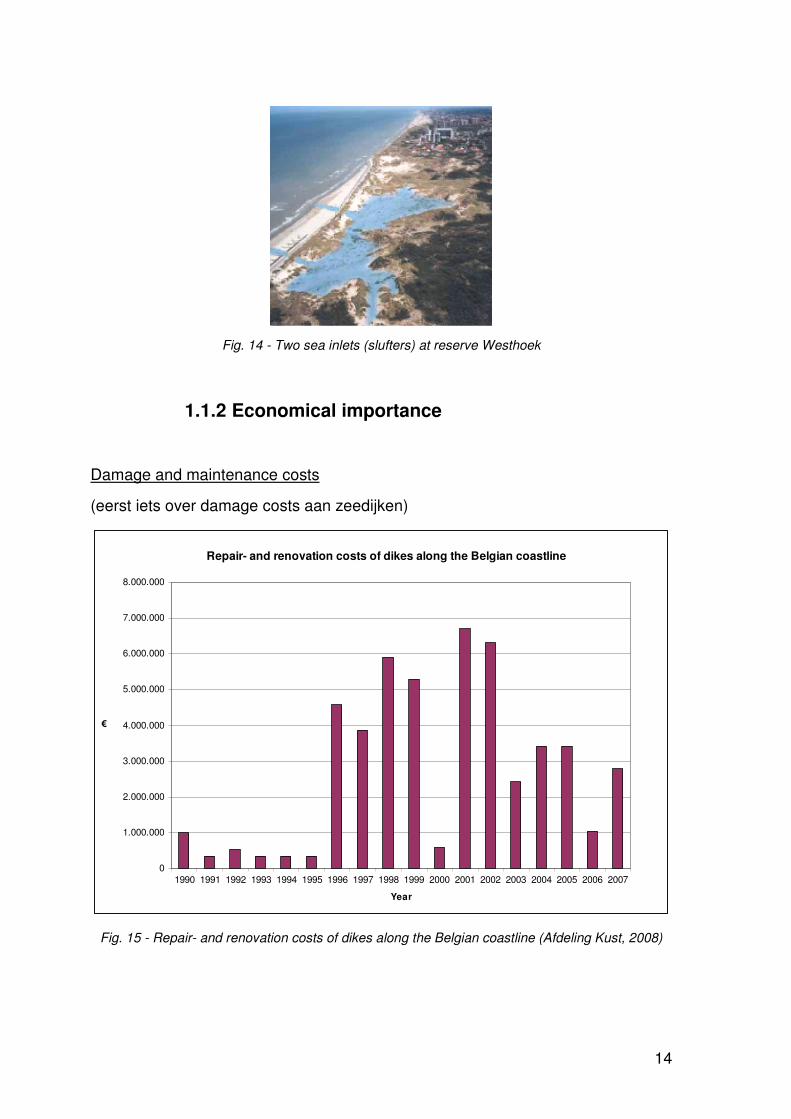
Westhoek
Since the construction of a concrete dune foot strengthening to protect the coastal
hinterland from flooding, the natural dune system in the reserve Westhoek has
been cut off from tidal influence. In 2004, the Flemish government made an
artificial breach in the construction at two different places (slufters). These sea
inlets allow the sea to enter the dune system during spring tide in combination
with a strong west wind. In the context of coastal protection, the low-lying valleys
between the dunes can act as buffers to flood water. Beside, the flood water
flowing back to the sea leaves new sediment behind and permits the dunes to
expand. The hinterland continues to be protected against flooding due to the very
broad natural dune system.
14
Fig. 14 - Two sea inlets (slufters) at reserve Westhoek
1.1.2 Economical importance
Damage and maintenance costs
(eerst iets over damage costs aan zeedijken)
Repair- and renovation costs of dikes along the Belgian coastline
0
1.000.000
2.000.000
3.000.000
4.000.000
5.000.000
6.000.000
7.000.000
8.000.000
1990 1991 1992 1993 1994 1995 1996 1997 1998 1999 2000 2001 2002 2003 2004 2005 2006 2007
Year
€
Fig. 15 - Repair- and renovation costs of dikes along the Belgian coastline (Afdeling Kust, 2008)

15
Volume of sand nourishments along the Belgian coastline
0
200000
400000
600000
800000
1000000
1200000
1400000
1600000
1800000
1983 1984 1985 1986 1987 1988 1989 1990 1991 1992 1993 1994 1995 1996 1997 1998 1999 2000 2001 2002 2003 2004 2005 2006
Year
m³
Sand volume (m³)
trend
Fig. 16 - Effectuated sand nourishments along the Belgian coastline (De Ronde et al., 2007).
Large-scale nourishments equally spread over the whole period (cfr. Table 2)
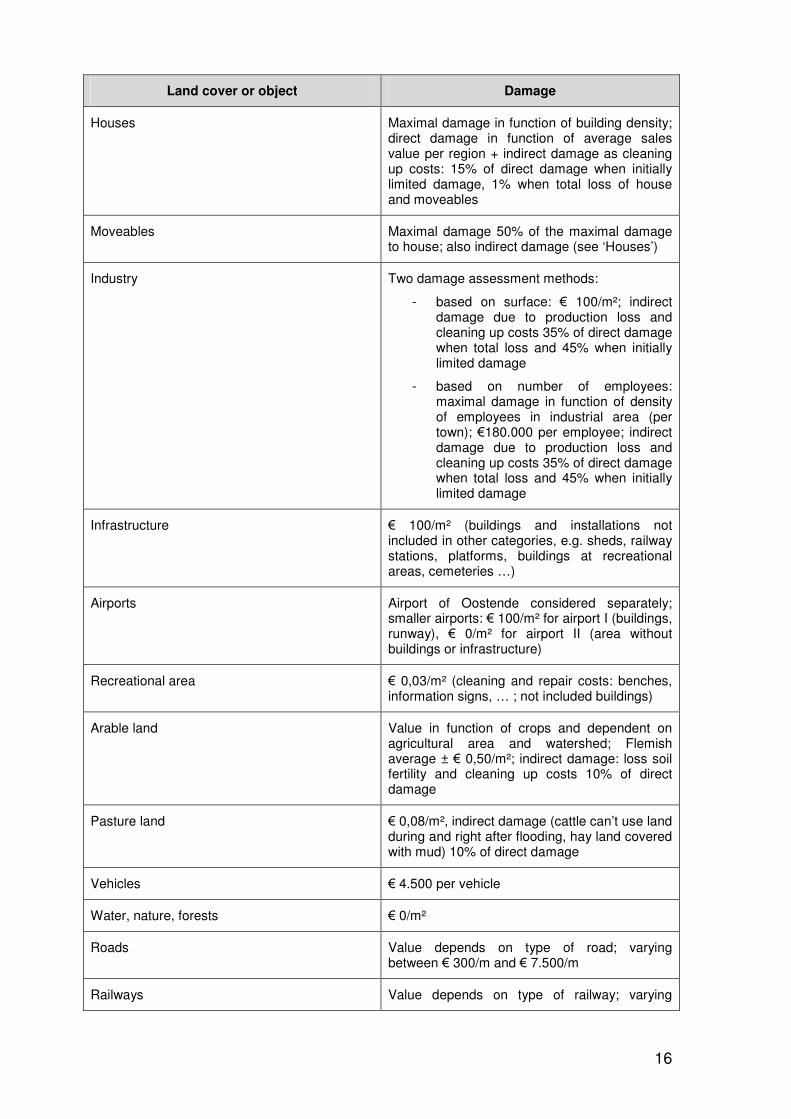
The methodology developed by WL and Ugent to estimate the total amount of
damage costs caused by flooding makes a distinction between different types of
land cover. For each of the following land cover types an estimation of the
maximal monetary assessable damage is made (Vanneuville et al., 2006):
houses; industry; infrastructure and airports; recreational areas; arable and
pasture land; vehicles; water, nature and forests; roads; railways; water supply
zones, purification plants and reservoirs; churches, convents, abbeys, mills,
hospitals, town halls, schools and castles; power stations, transmitting
installations and wind turbines; underground parking garages and subway
stations; gas stations, shopping malls and rest homes; train stations; fire stations,
police stations, prisons and museums; amusement parks and zoos.
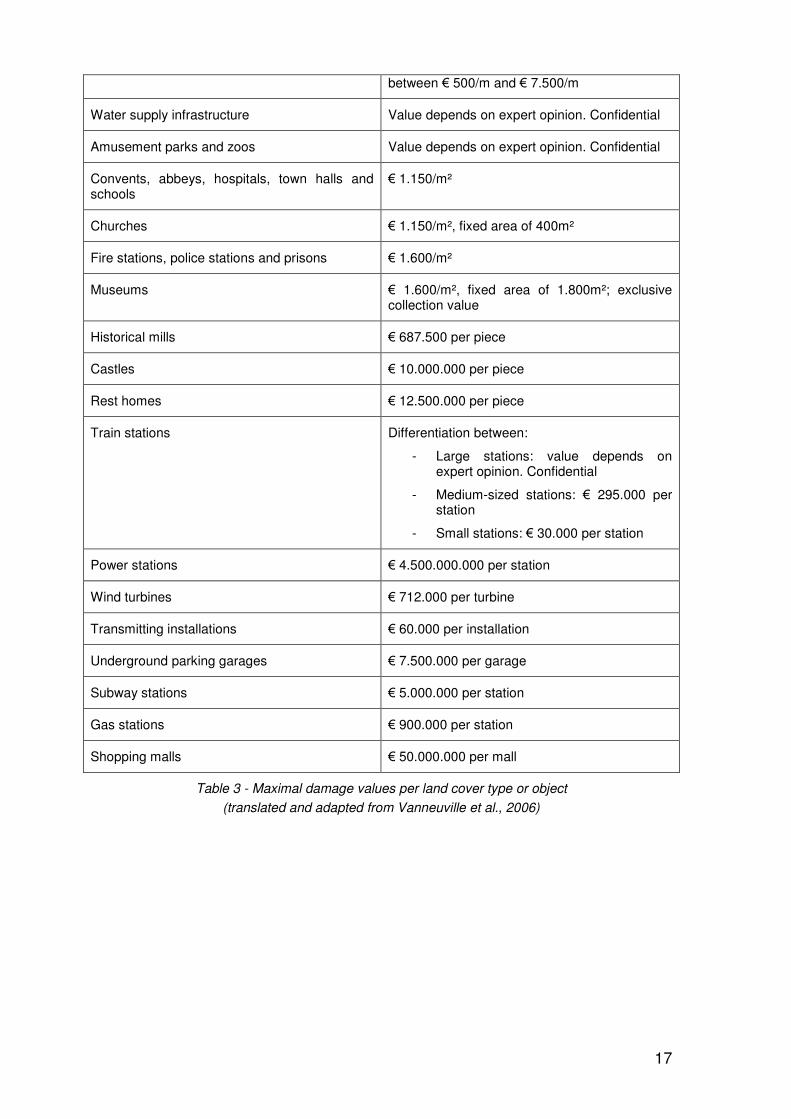
In the table below the estimated monetary value for each land cover or object at
risk of flooding is given.
16
Land cover or object Damage
Houses Maximal damage in function of building density; direct damage in function of average sales value per region + indirect damage as cleaning up costs: 15% of direct damage when initially limited damage, 1% when total loss of house and moveables
Moveables Maximal damage 50% of the maximal damage to house; also indirect damage (see ‘Houses’)
Industry Two damage assessment methods:
- based on surface: € 100/m²; indirect damage due to production loss and cleaning up costs 35% of direct damage when total loss and 45% when initially limited damage
- based on number of employees: maximal damage in function of density of employees in industrial area (per town); €180.000 per employee; indirect damage due to production loss and cleaning up costs 35% of direct damage when total loss and 45% when initially limited damage
Infrastructure € 100/m² (buildings and installations not included in other categories, e.g. sheds, railway stations, platforms, buildings at recreational areas, cemeteries …)
Airports Airport of Oostende considered separately; smaller airports: € 100/m² for airport I (buildings, runway), € 0/m² for airport II (area without buildings or infrastructure)
Recreational area € 0,03/m² (cleaning and repair costs: benches, information signs, … ; not included buildings)
Arable land Value in function of crops and dependent on agricultural area and watershed; Flemish average ± € 0,50/m²; indirect damage: loss soil fertility and cleaning up costs 10% of direct damage
Pasture land € 0,08/m², indirect damage (cattle can’t use land during and right after flooding, hay land covered with mud) 10% of direct damage
Vehicles € 4.500 per vehicle
Water, nature, forests € 0/m²
Roads Value depends on type of road; varying between € 300/m and € 7.500/m
Railways Value depends on type of railway; varying
17
between € 500/m and € 7.500/m
Water supply infrastructure Value depends on expert opinion. Confidential
Amusement parks and zoos Value depends on expert opinion. Confidential
Convents, abbeys, hospitals, town halls and schools
€ 1.150/m²
Churches € 1.150/m², fixed area of 400m²
Fire stations, police stations and prisons € 1.600/m²
Museums € 1.600/m², fixed area of 1.800m²; exclusive collection value
Historical mills € 687.500 per piece
Castles € 10.000.000 per piece
Rest homes € 12.500.000 per piece
Train stations Differentiation between:
- Large stations: value depends on expert opinion. Confidential
- Medium-sized stations: € 295.000 per station
- Small stations: € 30.000 per station
Power stations € 4.500.000.000 per station
Wind turbines € 712.000 per turbine
Transmitting installations € 60.000 per installation
Underground parking garages € 7.500.000 per garage
Subway stations € 5.000.000 per station
Gas stations € 900.000 per station
Shopping malls € 50.000.000 per mall
Table 3 - Maximal damage values per land cover type or object
(translated and adapted from Vanneuville et al., 2006)
18
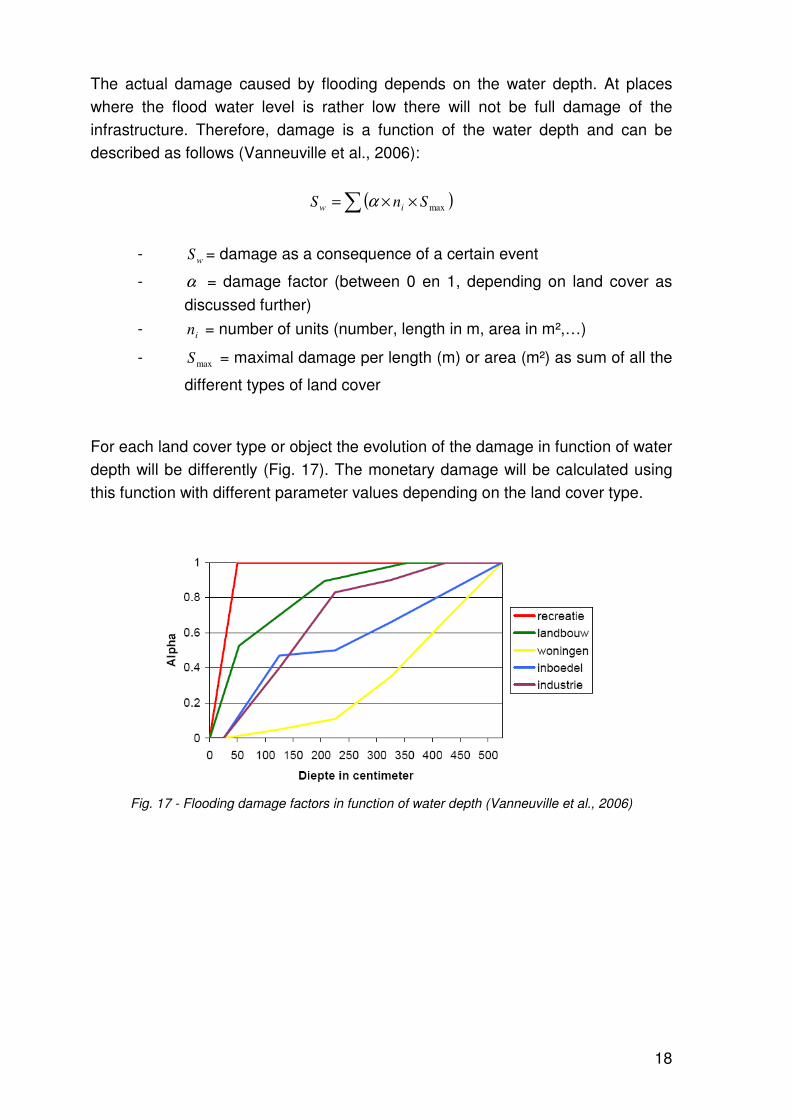
The actual damage caused by flooding depends on the water depth. At places
where the flood water level is rather low there will not be full damage of the
infrastructure. Therefore, damage is a function of the water depth and can be
described as follows (Vanneuville et al., 2006):
( )∑ ××= maxSnSiw
α
- w
S = damage as a consequence of a certain event
- α = damage factor (between 0 en 1, depending on land cover as
discussed further)
- i
n = number of units (number, length in m, area in m²,…)
- maxS = maximal damage per length (m) or area (m²) as sum of all the
different types of land cover
For each land cover type or object the evolution of the damage in function of water
depth will be differently (Fig. 17). The monetary damage will be calculated using
this function with different parameter values depending on the land cover type.
Fig. 17 - Flooding damage factors in function of water depth (Vanneuville et al., 2006)
19
1.1.3 Social importance
Casualties
Failure and/or erosion of the sea defence will potentially lead to casualties on the
shoreline and in the low-lying areas susceptible to flooding. WL and UGent are
together developing a methodology to assess damages and casualties caused by
flooding. The total number of casualties that may occur depends on different
factors (Jonkman and Cappendijk, 2006):
- Characteristics of the flooding event (water depth, rising velocity)
- Number of persons present in the flooded area (depending on evacuation)
- Number of victims among the persons present
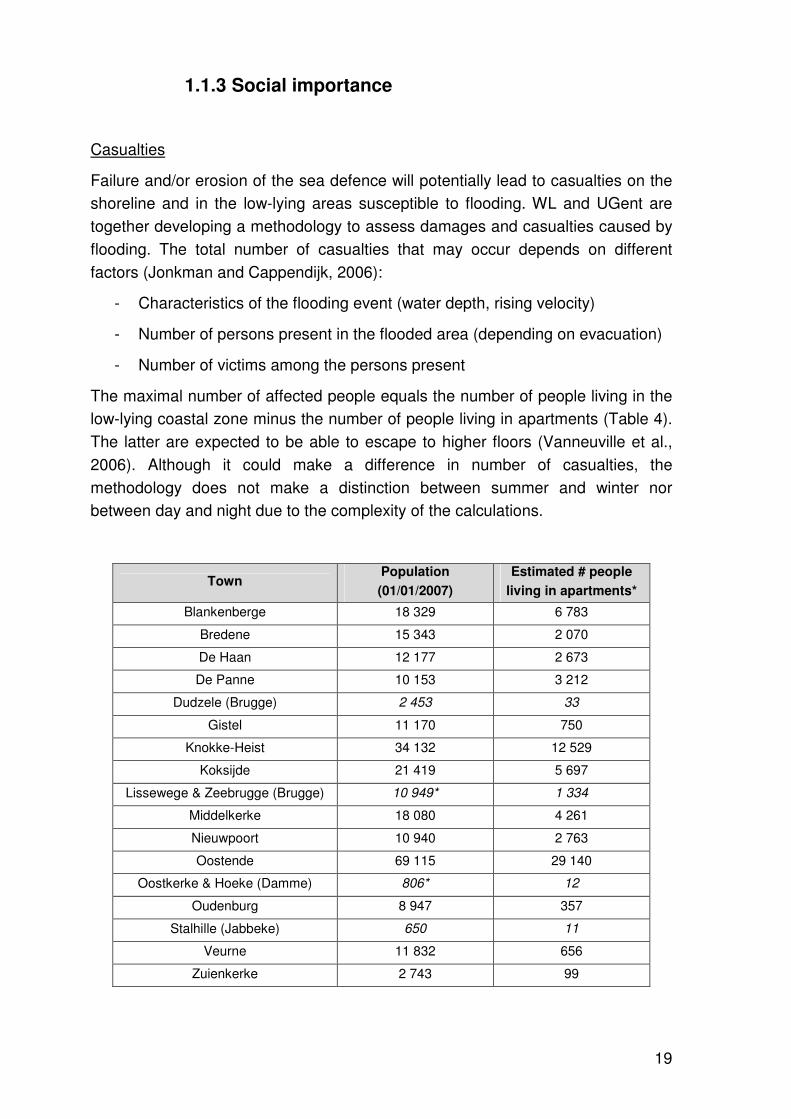
The maximal number of affected people equals the number of people living in the
low-lying coastal zone minus the number of people living in apartments (Table 4).
The latter are expected to be able to escape to higher floors (Vanneuville et al.,
2006). Although it could make a difference in number of casualties, the
methodology does not make a distinction between summer and winter nor
between day and night due to the complexity of the calculations.
Town Population
(01/01/2007)
Estimated # people
living in apartments*
Blankenberge 18 329 6 783
Bredene 15 343 2 070
De Haan 12 177 2 673
De Panne 10 153 3 212
Dudzele (Brugge) 2 453 33
Gistel 11 170 750
Knokke-Heist 34 132 12 529
Koksijde 21 419 5 697
Lissewege & Zeebrugge (Brugge) 10 949* 1 334
Middelkerke 18 080 4 261
Nieuwpoort 10 940 2 763
Oostende 69 115 29 140
Oostkerke & Hoeke (Damme) 806* 12
Oudenburg 8 947 357
Stalhille (Jabbeke) 650 11
Veurne 11 832 656
Zuienkerke 2 743 99
20
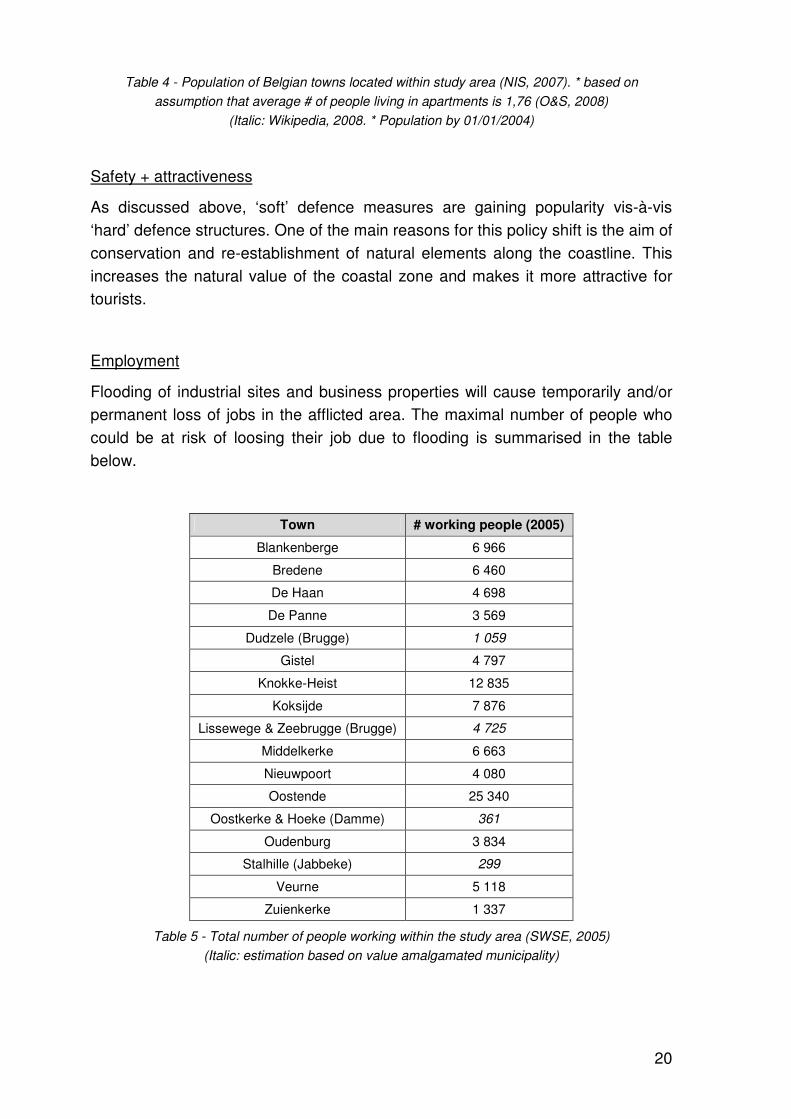
Table 4 - Population of Belgian towns located within study area (NIS, 2007). * based on
assumption that average # of people living in apartments is 1,76 (O&S, 2008)
(Italic: Wikipedia, 2008. * Population by 01/01/2004)
Safety + attractiveness
As discussed above, ‘soft’ defence measures are gaining popularity vis-à-vis
‘hard’ defence structures. One of the main reasons for this policy shift is the aim of
conservation and re-establishment of natural elements along the coastline. This
increases the natural value of the coastal zone and makes it more attractive for
tourists.
Employment
Flooding of industrial sites and business properties will cause temporarily and/or
permanent loss of jobs in the afflicted area. The maximal number of people who
could be at risk of loosing their job due to flooding is summarised in the table
below.
Town # working people (2005)
Blankenberge 6 966
Bredene 6 460
De Haan 4 698
De Panne 3 569
Dudzele (Brugge) 1 059
Gistel 4 797
Knokke-Heist 12 835
Koksijde 7 876
Lissewege & Zeebrugge (Brugge) 4 725
Middelkerke 6 663
Nieuwpoort 4 080
Oostende 25 340
Oostkerke & Hoeke (Damme) 361
Oudenburg 3 834
Stalhille (Jabbeke) 299
Veurne 5 118
Zuienkerke 1 337
Table 5 - Total number of people working within the study area (SWSE, 2005)
(Italic: estimation based on value amalgamated municipality)
21
Besides direct loss of jobs in flooded areas, there will also be indirect loss of jobs
in companies which depend on the stricken companies. However, due to the
complexity of this indirect effect it will not be taken into account in the flooding
damage calculations within the scope of this project.
1.2 NATURE
1.2.1 Intensity
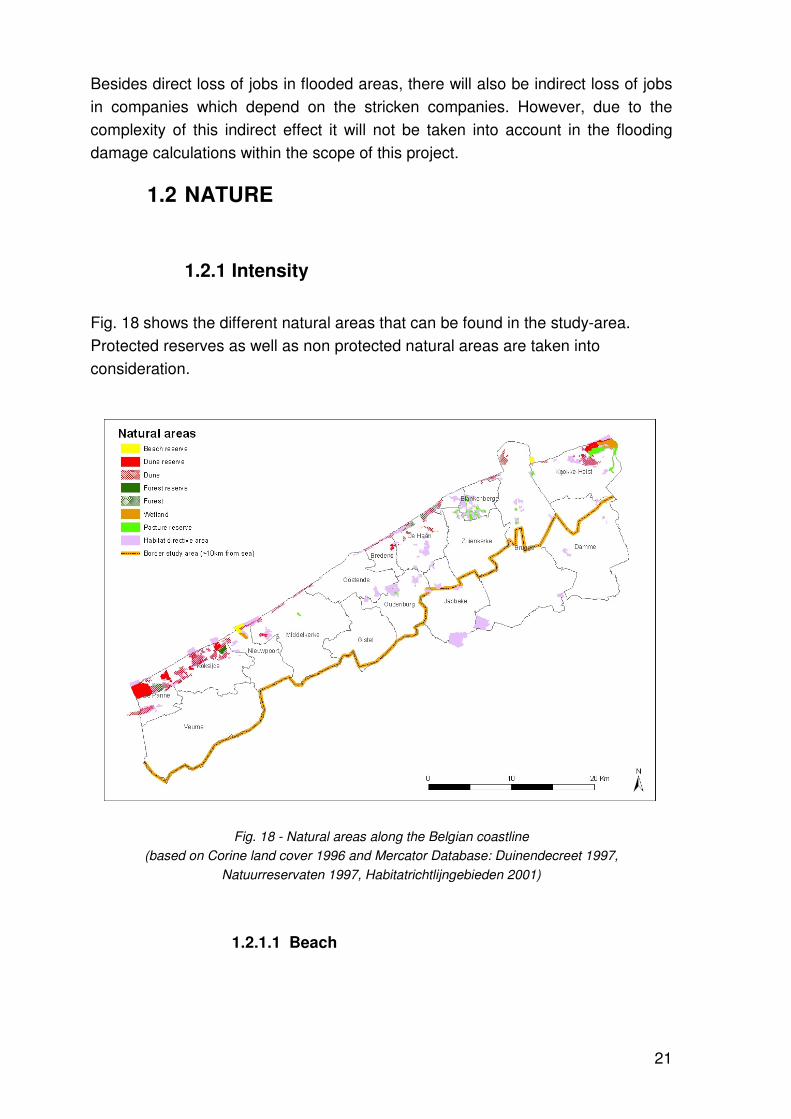
Fig. 18 shows the different natural areas that can be found in the study-area.
Protected reserves as well as non protected natural areas are taken into
consideration.
Fig. 18 - Natural areas along the Belgian coastline
(based on Corine land cover 1996 and Mercator Database: Duinendecreet 1997,
Natuurreservaten 1997, Habitatrichtlijngebieden 2001)
1.2.1.1 Beach
22
Along the Belgian coastline only two protected beach reserves can be found, Baai
van Heist and Ijzermonding (Fig. 18).
Baai van Heist, at Knokke-Heist, is a 54ha big beach plain located in the lee of the
breakwater of the port of Zeebrugge (Belpaeme & Konings, 2004). The plain is
built up of sand and silt deposits from the prevailing flood current in north-eastern
direction. The breakwater intersects the easterly longshore flow and causes
sedimentation in the calmer water behind the construction. The sedimentation
continues at a rate of averagely 3 to 5 cm/year (Verwaest, 2007). The reserve,
protected since 1997, harbours embryonic dunes, mud flats and salt marshes. It
also constitutes an important nesting place for birds (Herrier JL., 2002).
One other beach reserve is located at Lombardsijde, at the estuary of the river
IJzer. In 2008, the reserve of 98ha (Herrier JL., 2002) will be modified in order to
create more natural value. The dune foot strengthening and groynes will be
removed and the beach will be enlarged and given a gentler slope. These
interventions will increase the amount of nesting sites available for birds. The
beach will be protected against sand-drift by rows of piles (De Wolf P., 2007).
1.2.1.2 Dunes
The Belgian coastline consists of 800ha dunes. The largest system is found at De
Panne in the western part of the country. Since 1957 the area is protected by the
government as natural reserve Westhoek (340ha). At its broadest, the dune strip
reaches up to 2200m. The reserve harbours almost all the different phases of
dune formation: walking dunes, blowholes, dune slacks, blond, grey and black
dunes. The highest dune along the Belgian coastline is Hoge Blekker at Koksijde
(35m TAW). The oldest dunes can be found at the reserve Cabourduinen at De
Panne (55ha on Belgian territory). They originated about 5000 years ago. Due to
their distance from the sea, the dune formation processes came to an end. Other
important protected dune reserves are Oosthoekduinen and Houtsaegerduinen at
De Panne; Doornpanne, Schipgatduinen and Ter Yde at Koksijde;
Schuddebeurze at Middelkerke; d’Heye at Bredene and Fonteintjes at
Blankenberge. The latter being partly an artificial reserve made up of wet dune
slacks, reed-lands and dune scrub (Natuurpunt, 2008). Besides the protected
dune reserves there are also several smaller dune strips along the Belgian
coastline (Fig. 18).
23
1.2.1.3 Wetland
The total area of wetlands along the Belgian coastline reaches up to about 180ha.
The IJzermonding wetland (38ha) at the estuary of the Ijzer makes part of the
100ha reserve consisting of salt marshes, mudflats, beach, dunes and grassland.
The reserve constitutes an important nesting site for birds.
The Zwin reserve consists of salt marshes and mudflats (152ha) separated from
the sea by a dune strip. At the Belgian-Dutch border a wide breach in the dunes
allows the sea to penetrate the reserve during flood tide. The water flows through
the main channel that branches off in smaller gullies and creeks. The ebbing
water is then prevented from flowing back by 3 one-way valves. This avoids the
lakes to dry out during periods with low water level. The reserve also constitutes
an important nesting site for birds.
1.2.1.4 Forest
The most important coastal forests along the Belgian coastline are Calmeynbos at
De Panne (60ha), Hannecartbos at Koksijde (47ha) and the dune forests at De
Haan (152ha). They can be found between the dunes and at the transition
between dune and polder. The initial aim of planting the forests was to protect the
agricultural lands in the hinterland from wind and drifting sand. They also have the
advantage of fixating migrating dunes. Nowadays, the forests are being planted to
enhance the touristy value of the coastline. New forests have recently been
planted near Oostende (Keignaertbos), Blankenberge (Zeebos), Nieuwpoort and
Knokke (Belpaeme & Konings, 2004).
1.2.2 Economical importance
In most of the Belgian coastal towns the shoreline is intensely built-up. The
original natural sea defences, the dunes, are levelled in favour of the construction
of buildings and roads. They are directly adjacent to the beaches and artificially
protected against the sea by hard defence structures such as groynes and dikes.
The oldest existing dikes where constructed at the beginning of the 19th century
(Table 1). Since a few decades, beach (re)nourishments are more and more
24
frequently used as protection measure against coastal erosion and flooding. Only
a few coastal settlements are situated behind dune areas and so are naturally
protected against the sea. It concerns the built-up area between Bredene and De
Haan, Lombardsijde, some holiday villages west of Westende and the area west
of De Panne (apartment buildings, Vissersdorp).
In terms of economical significance, the most important roles of the natural
elements along the coastline are:
- Protection against damages to houses, roads, industry, infrastructure, …
due to sea level rise and coastal erosion (see 1.1.2)
- Tourist activities such as walking, nature exploration, sports, … (see
Subdocument Tourism for information on importance of nature as tourist
attraction)
The absolute economical value of damages to nature is assumed to be €0,00/m².
Small facilities in the nature reserves such as information panels and benches are
attributed a maximal damage value of €0,03/m². Natural and sentimental values
are not taken into account. However, degradation of natural reserves due to
flooding will (temporarily) decrease the amount of tourists in the area. Damage to
nature can thus indirectly lead to a decrease in the overall income of the tourist
sector (Vanneuville et al., 2006).
1.2.3 Social importance
As discussed in the Subdocument Tourism and pointed out in chapter 1.2.1, the
natural elements on the Belgian shoreline have an important attraction value for
coastal tourism.
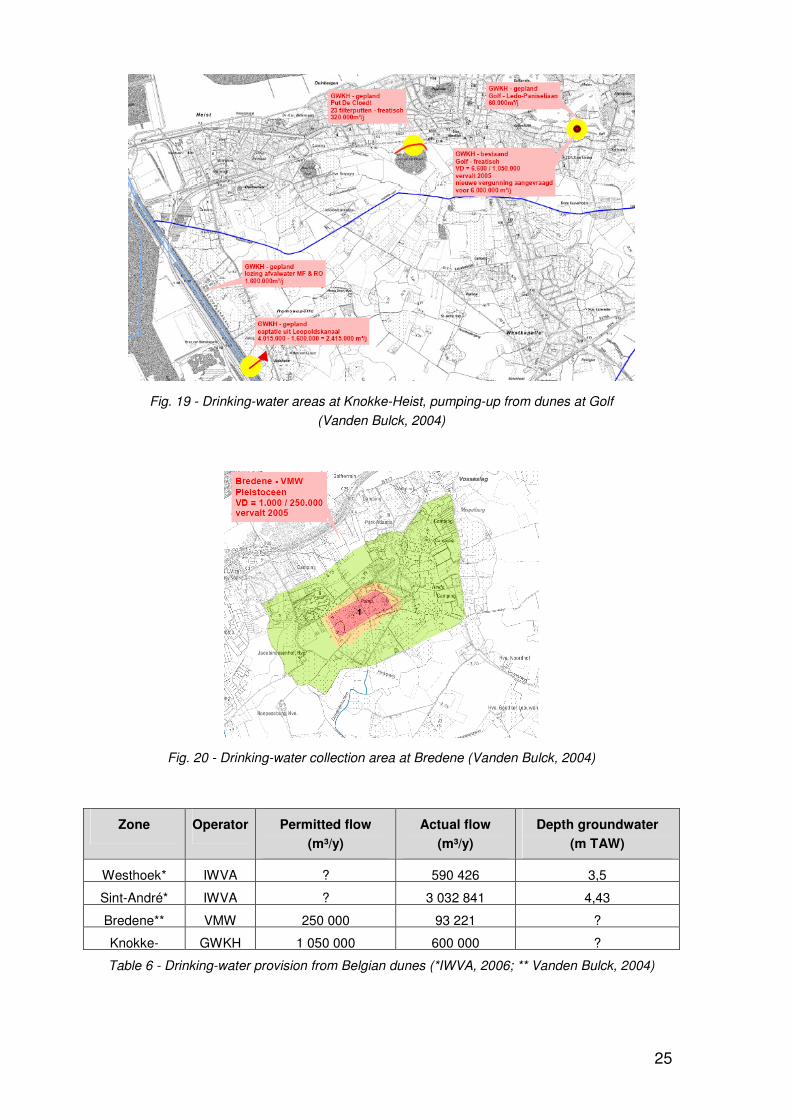
Besides their recreational value and the protection against flooding, dunes are
also significant sources for freshwater provision. Precipitation water infiltrates into
the sand and forms a freshwater lens inside of the dune. Under natural
circumstances the freshwater drains off to the sea and the polders, preventing the
more dense salty water to flow into the dunes. In Belgium, drinking-water is
pumped up from coastal dunes in De Panne, reserve Westhoek 94ha; Koksijde,
Sint-André 124ha; Knokke-Heist, golfcourse (Fig. 19) and Bredene (Fig. 20).
25
Fig. 19 - Drinking-water areas at Knokke-Heist, pumping-up from dunes at Golf
(Vanden Bulck, 2004)
Fig. 20 - Drinking-water collection area at Bredene (Vanden Bulck, 2004)
Zone Operator Permitted flow
(m³/y)
Actual flow
(m³/y)
Depth groundwater
(m TAW)
Westhoek* IWVA ? 590 426 3,5
Sint-André* IWVA ? 3 032 841 4,43
Bredene** VMW 250 000 93 221 ?
Knokke- GWKH 1 050 000 600 000 ?
Table 6 - Drinking-water provision from Belgian dunes (*IWVA, 2006; ** Vanden Bulck, 2004)
26
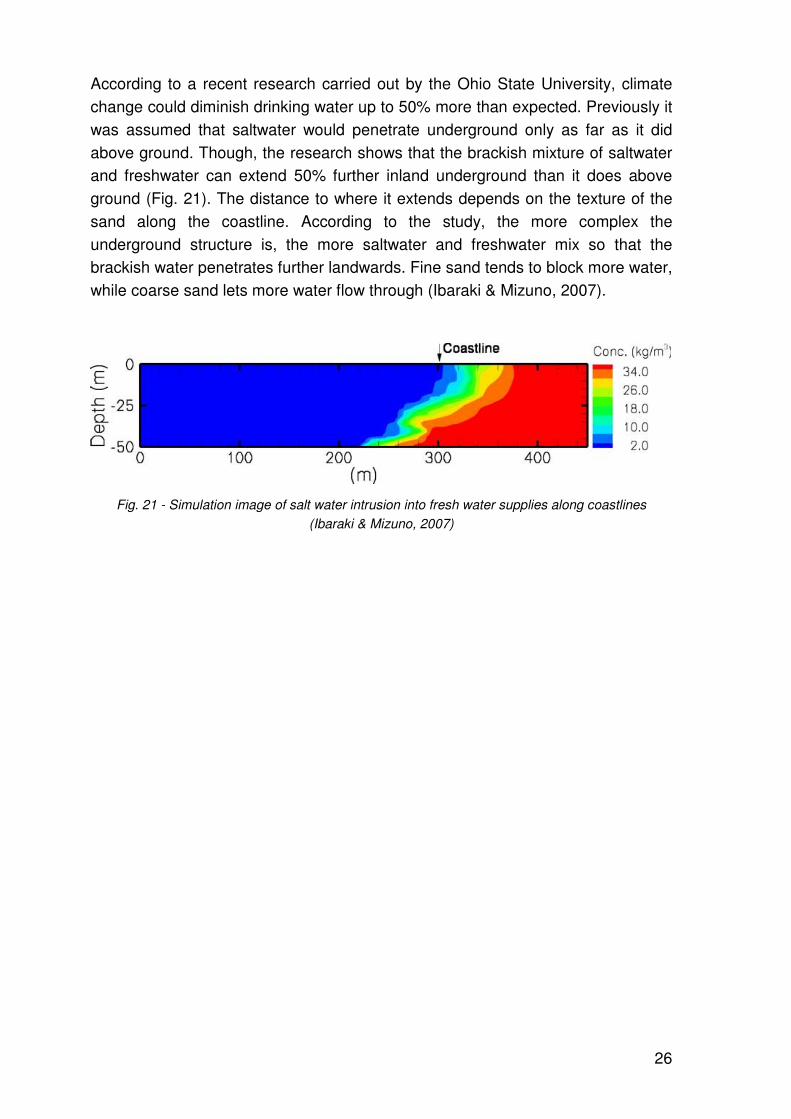
According to a recent research carried out by the Ohio State University, climate
change could diminish drinking water up to 50% more than expected. Previously it
was assumed that saltwater would penetrate underground only as far as it did
above ground. Though, the research shows that the brackish mixture of saltwater
and freshwater can extend 50% further inland underground than it does above
ground (Fig. 21). The distance to where it extends depends on the texture of the
sand along the coastline. According to the study, the more complex the
underground structure is, the more saltwater and freshwater mix so that the
brackish water penetrates further landwards. Fine sand tends to block more water,
while coarse sand lets more water flow through (Ibaraki & Mizuno, 2007).
Fig. 21 - Simulation image of salt water intrusion into fresh water supplies along coastlines
(Ibaraki & Mizuno, 2007)
27
1.3 BUILDINGS
1.3.1 Intensity
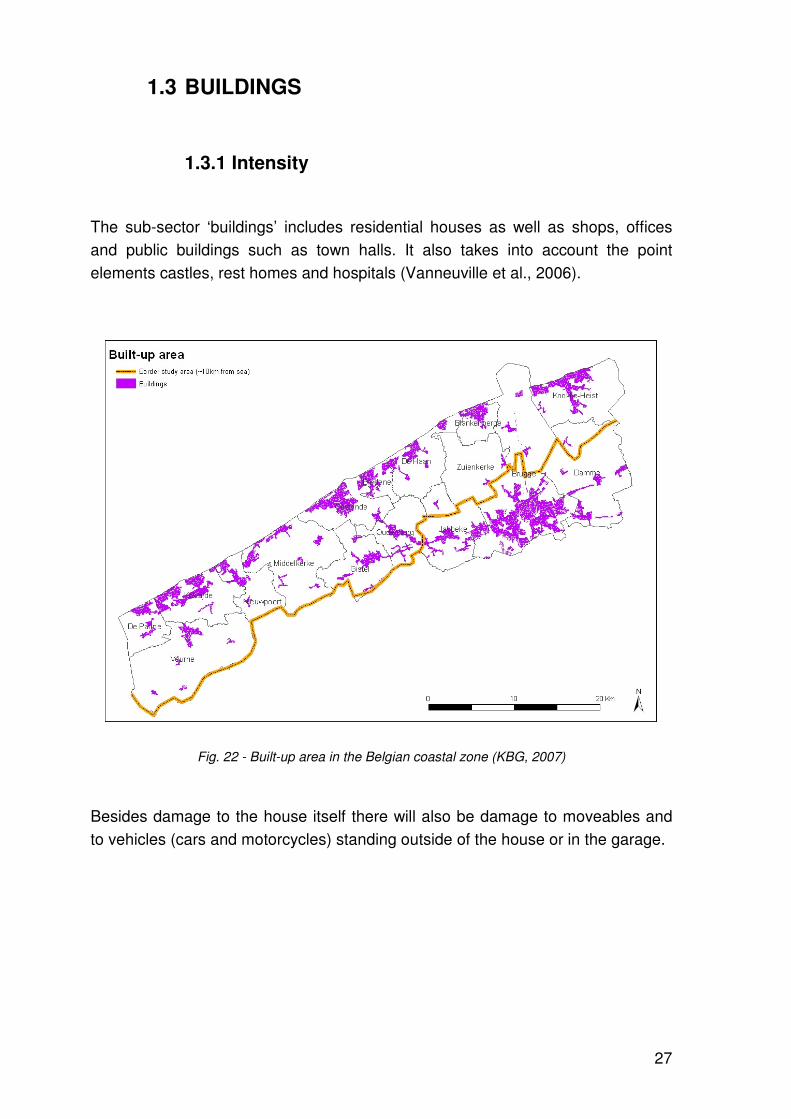
The sub-sector ‘buildings’ includes residential houses as well as shops, offices
and public buildings such as town halls. It also takes into account the point
elements castles, rest homes and hospitals (Vanneuville et al., 2006).
Fig. 22 - Built-up area in the Belgian coastal zone (KBG, 2007)
Besides damage to the house itself there will also be damage to moveables and
to vehicles (cars and motorcycles) standing outside of the house or in the garage.
28
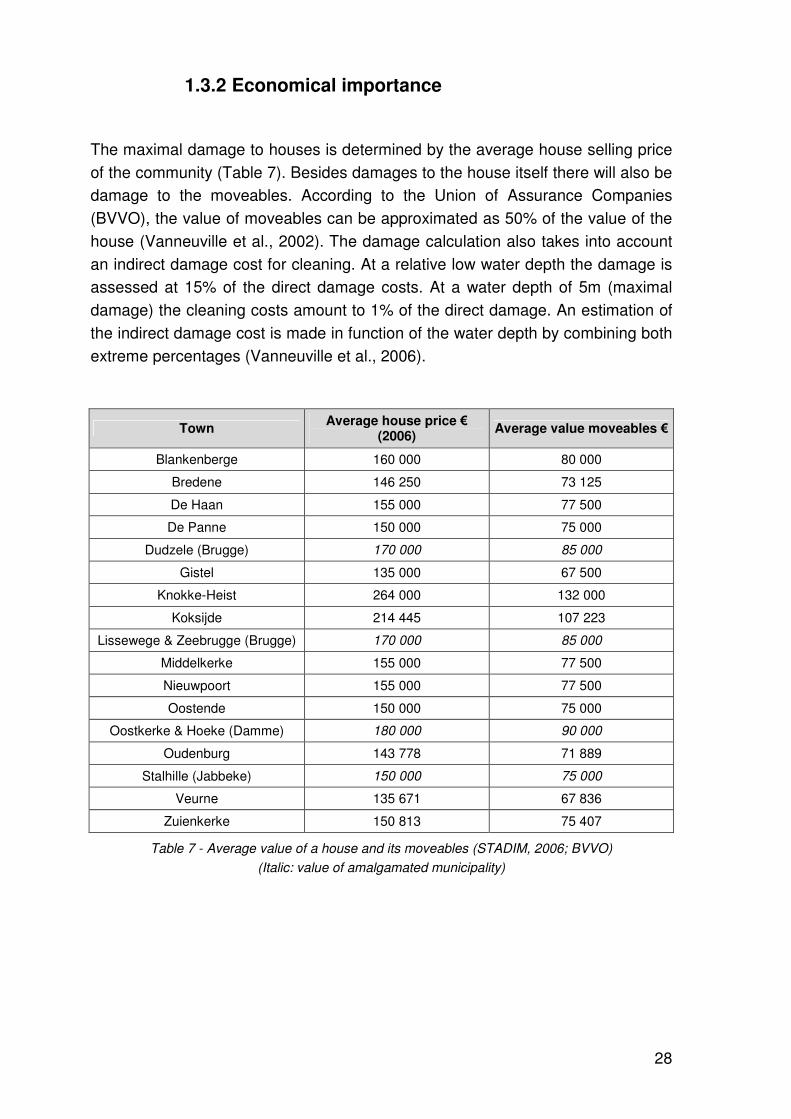
1.3.2 Economical importance
The maximal damage to houses is determined by the average house selling price
of the community (Table 7). Besides damages to the house itself there will also be
damage to the moveables. According to the Union of Assurance Companies
(BVVO), the value of moveables can be approximated as 50% of the value of the
house (Vanneuville et al., 2002). The damage calculation also takes into account
an indirect damage cost for cleaning. At a relative low water depth the damage is
assessed at 15% of the direct damage costs. At a water depth of 5m (maximal
damage) the cleaning costs amount to 1% of the direct damage. An estimation of
the indirect damage cost is made in function of the water depth by combining both
extreme percentages (Vanneuville et al., 2006).
Town Average house price €
(2006) Average value moveables €
Blankenberge 160 000 80 000
Bredene 146 250 73 125
De Haan 155 000 77 500
De Panne 150 000 75 000
Dudzele (Brugge) 170 000 85 000
Gistel 135 000 67 500
Knokke-Heist 264 000 132 000
Koksijde 214 445 107 223
Lissewege & Zeebrugge (Brugge) 170 000 85 000
Middelkerke 155 000 77 500
Nieuwpoort 155 000 77 500
Oostende 150 000 75 000
Oostkerke & Hoeke (Damme) 180 000 90 000
Oudenburg 143 778 71 889
Stalhille (Jabbeke) 150 000 75 000
Veurne 135 671 67 836
Zuienkerke 150 813 75 407
Table 7 - Average value of a house and its moveables (STADIM, 2006; BVVO)
(Italic: value of amalgamated municipality)
29
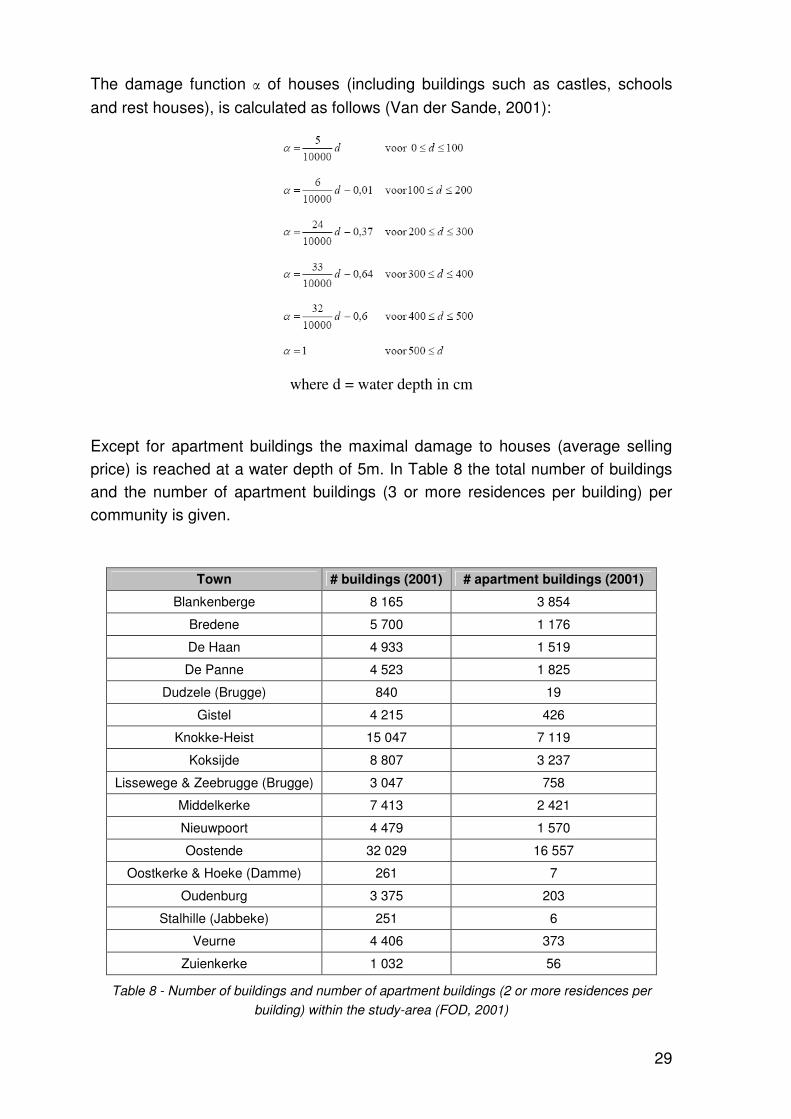
The damage function α of houses (including buildings such as castles, schools
and rest houses), is calculated as follows (Van der Sande, 2001):
where d = water depth in cm
Except for apartment buildings the maximal damage to houses (average selling
price) is reached at a water depth of 5m. In Table 8 the total number of buildings
and the number of apartment buildings (3 or more residences per building) per
community is given.
Town # buildings (2001) # apartment buildings (2001)
Blankenberge 8 165 3 854
Bredene 5 700 1 176
De Haan 4 933 1 519
De Panne 4 523 1 825
Dudzele (Brugge) 840 19
Gistel 4 215 426
Knokke-Heist 15 047 7 119
Koksijde 8 807 3 237
Lissewege & Zeebrugge (Brugge) 3 047 758
Middelkerke 7 413 2 421
Nieuwpoort 4 479 1 570
Oostende 32 029 16 557
Oostkerke & Hoeke (Damme) 261 7
Oudenburg 3 375 203
Stalhille (Jabbeke) 251 6
Veurne 4 406 373
Zuienkerke 1 032 56
Table 8 - Number of buildings and number of apartment buildings (2 or more residences per
building) within the study-area (FOD, 2001)
30
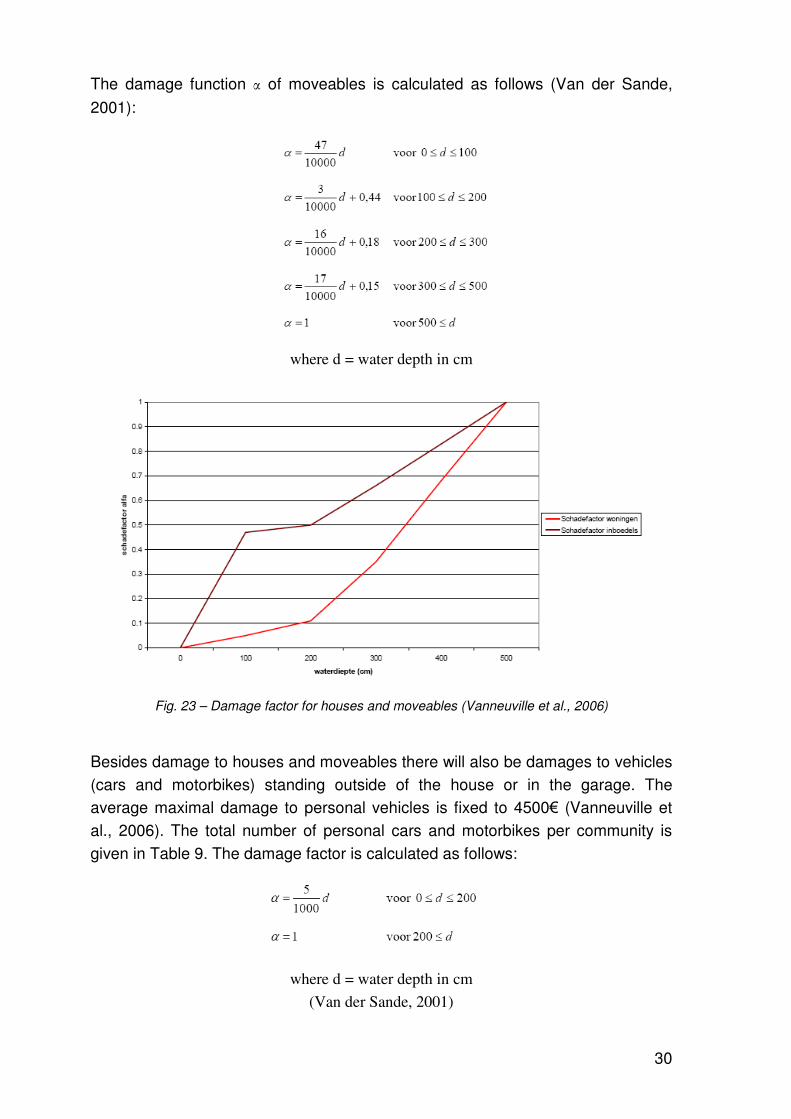
The damage function α of moveables is calculated as follows (Van der Sande,
2001):
where d = water depth in cm
Fig. 23 – Damage factor for houses and moveables (Vanneuville et al., 2006)
Besides damage to houses and moveables there will also be damages to vehicles
(cars and motorbikes) standing outside of the house or in the garage. The
average maximal damage to personal vehicles is fixed to 4500€ (Vanneuville et
al., 2006). The total number of personal cars and motorbikes per community is
given in Table 9. The damage factor is calculated as follows:
where d = water depth in cm
(Van der Sande, 2001)
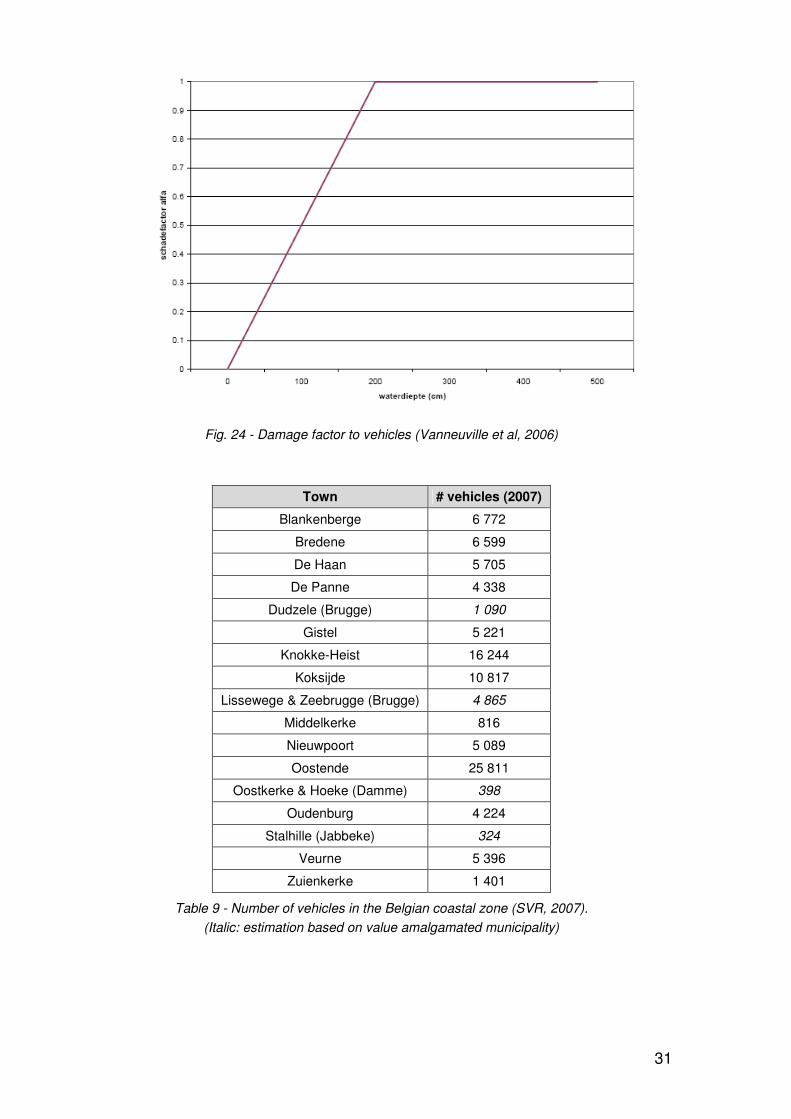
31
Fig. 24 - Damage factor to vehicles (Vanneuville et al, 2006)
Town # vehicles (2007)
Blankenberge 6 772
Bredene 6 599
De Haan 5 705
De Panne 4 338
Dudzele (Brugge) 1 090
Gistel 5 221
Knokke-Heist 16 244
Koksijde 10 817
Lissewege & Zeebrugge (Brugge) 4 865
Middelkerke 816
Nieuwpoort 5 089
Oostende 25 811
Oostkerke & Hoeke (Damme) 398
Oudenburg 4 224
Stalhille (Jabbeke) 324
Veurne 5 396
Zuienkerke 1 401
Table 9 - Number of vehicles in the Belgian coastal zone (SVR, 2007).
(Italic: estimation based on value amalgamated municipality)
32
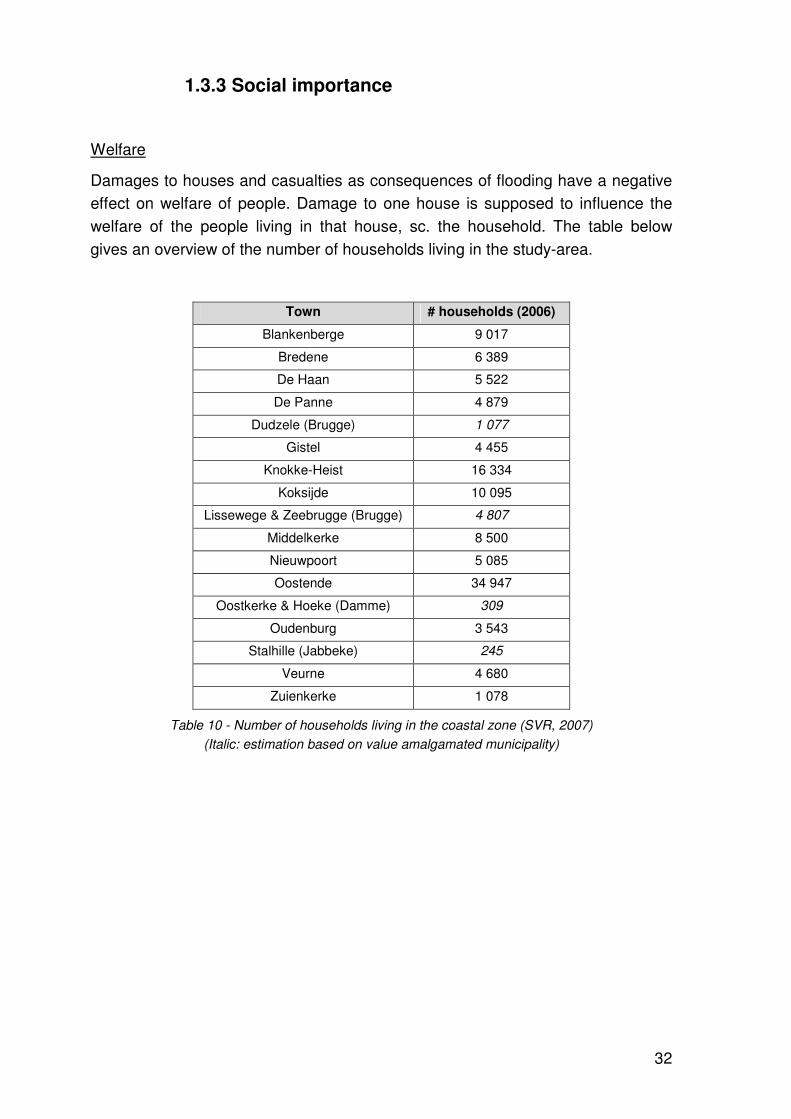
1.3.3 Social importance
Welfare
Damages to houses and casualties as consequences of flooding have a negative
effect on welfare of people. Damage to one house is supposed to influence the
welfare of the people living in that house, sc. the household. The table below
gives an overview of the number of households living in the study-area.
Town # households (2006)
Blankenberge 9 017
Bredene 6 389
De Haan 5 522
De Panne 4 879
Dudzele (Brugge) 1 077
Gistel 4 455
Knokke-Heist 16 334
Koksijde 10 095
Lissewege & Zeebrugge (Brugge) 4 807
Middelkerke 8 500
Nieuwpoort 5 085
Oostende 34 947
Oostkerke & Hoeke (Damme) 309
Oudenburg 3 543
Stalhille (Jabbeke) 245
Veurne 4 680
Zuienkerke 1 078
Table 10 - Number of households living in the coastal zone (SVR, 2007)
(Italic: estimation based on value amalgamated municipality)
33
1.4 INDUSTRY AND BUSINESS
1.4.1 Intensity
According to Belpaeme & Konings (2004), the main economic asset of the Belgian
coastal region is its geo-economic central location between the economic poles of
the European core area. In addition, the extensive transport facilities enhance the
possibilities for economic developments in the coastal zone.
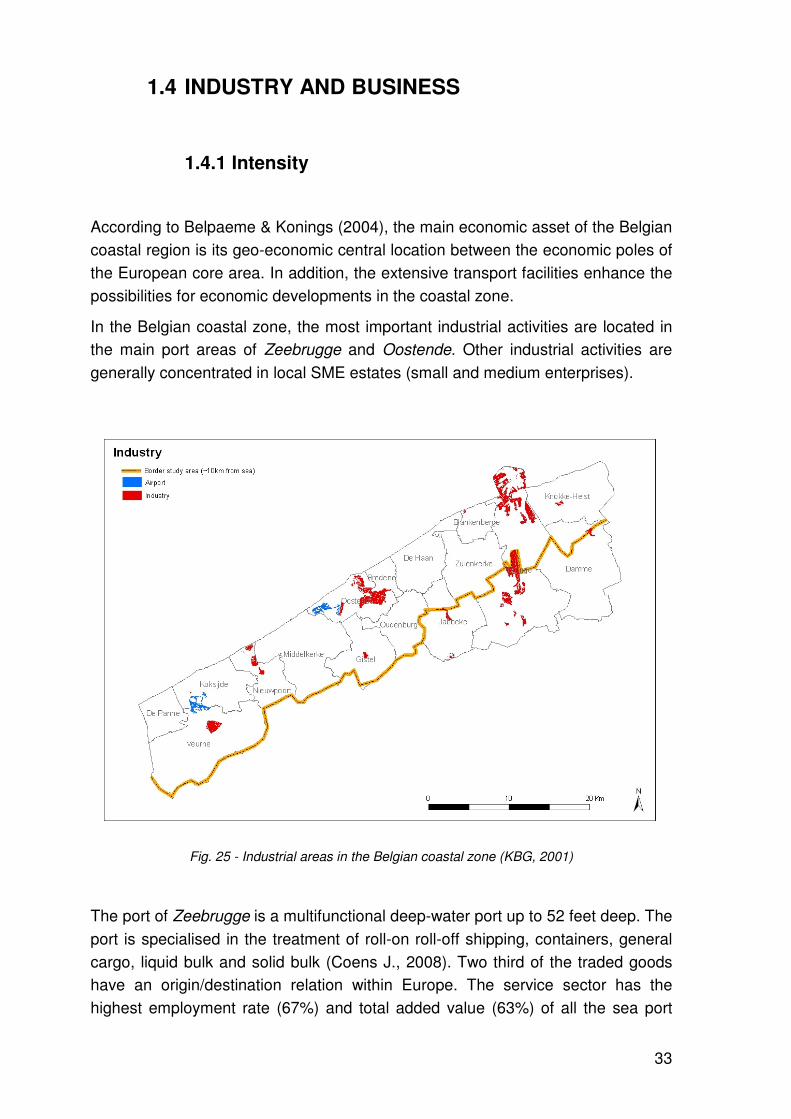
In the Belgian coastal zone, the most important industrial activities are located in
the main port areas of Zeebrugge and Oostende. Other industrial activities are
generally concentrated in local SME estates (small and medium enterprises).
Fig. 25 - Industrial areas in the Belgian coastal zone (KBG, 2001)
The port of Zeebrugge is a multifunctional deep-water port up to 52 feet deep. The
port is specialised in the treatment of roll-on roll-off shipping, containers, general
cargo, liquid bulk and solid bulk (Coens J., 2008). Two third of the traded goods
have an origin/destination relation within Europe. The service sector has the
highest employment rate (67%) and total added value (63%) of all the sea port
34
activities carried out by the private sector. In the inland port extension towards
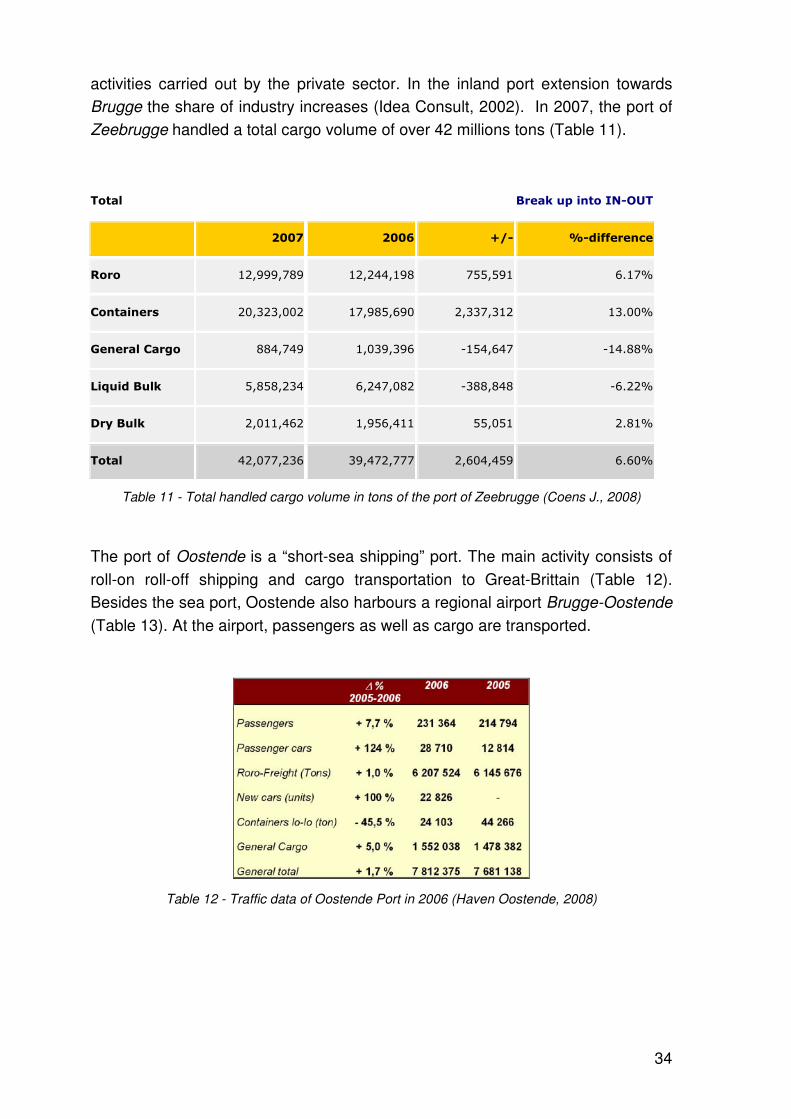
Brugge the share of industry increases (Idea Consult, 2002). In 2007, the port of
Zeebrugge handled a total cargo volume of over 42 millions tons (Table 11).
Total Break up into IN-OUT
2007 2006 +/- %-difference
Roro 12,999,789 12,244,198 755,591 6.17%
Containers 20,323,002 17,985,690 2,337,312 13.00%
General Cargo 884,749 1,039,396 -154,647 -14.88%
Liquid Bulk 5,858,234 6,247,082 -388,848 -6.22%
Dry Bulk 2,011,462 1,956,411 55,051 2.81%
Total 42,077,236 39,472,777 2,604,459 6.60%
Table 11 - Total handled cargo volume in tons of the port of Zeebrugge (Coens J., 2008)
The port of Oostende is a “short-sea shipping” port. The main activity consists of
roll-on roll-off shipping and cargo transportation to Great-Brittain (Table 12).
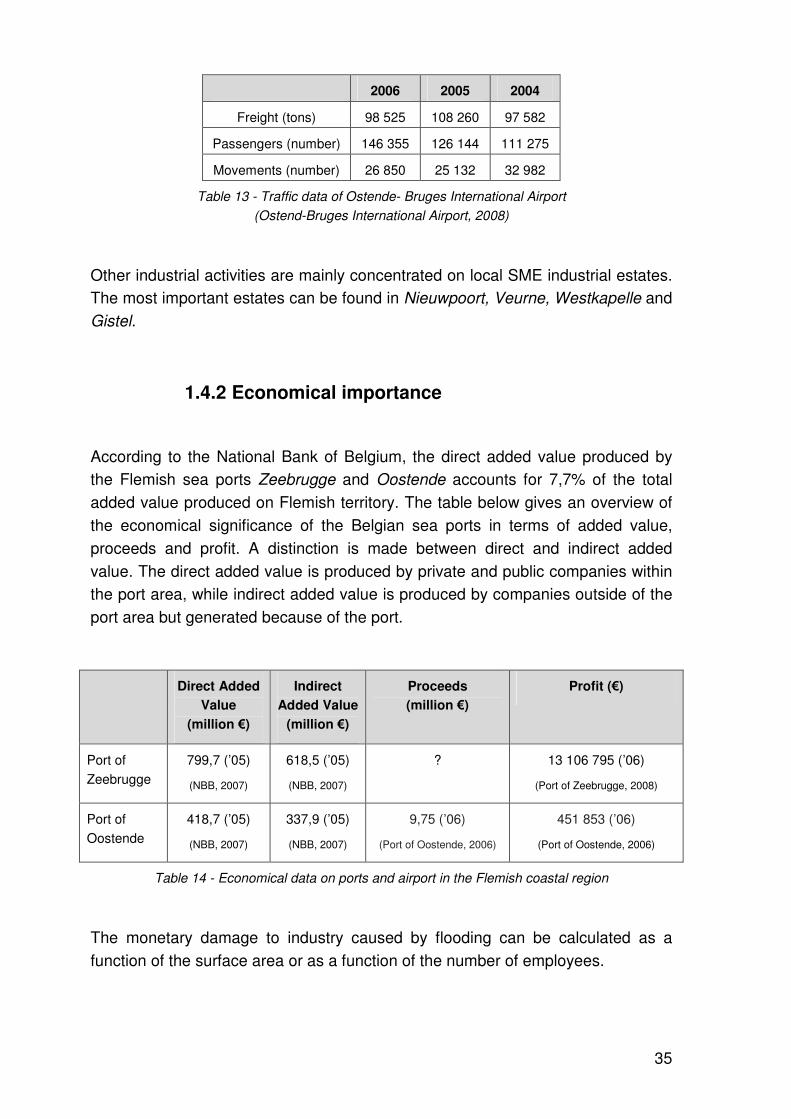
Besides the sea port, Oostende also harbours a regional airport Brugge-Oostende
(Table 13). At the airport, passengers as well as cargo are transported.
Table 12 - Traffic data of Oostende Port in 2006 (Haven Oostende, 2008)
35
2006 2005 2004
Freight (tons) 98 525 108 260 97 582
Passengers (number) 146 355 126 144 111 275
Movements (number) 26 850 25 132 32 982
Table 13 - Traffic data of Ostende- Bruges International Airport
(Ostend-Bruges International Airport, 2008)
Other industrial activities are mainly concentrated on local SME industrial estates.
The most important estates can be found in Nieuwpoort, Veurne, Westkapelle and
Gistel.
1.4.2 Economical importance
According to the National Bank of Belgium, the direct added value produced by
the Flemish sea ports Zeebrugge and Oostende accounts for 7,7% of the total
added value produced on Flemish territory. The table below gives an overview of
the economical significance of the Belgian sea ports in terms of added value,
proceeds and profit. A distinction is made between direct and indirect added
value. The direct added value is produced by private and public companies within
the port area, while indirect added value is produced by companies outside of the
port area but generated because of the port.
Direct Added
Value
(million €)
Indirect
Added Value
(million €)
Proceeds
(million €)
Profit (€)
Port of
Zeebrugge
799,7 (’05)
(NBB, 2007)
618,5 (’05)
(NBB, 2007)
? 13 106 795 (’06)
(Port of Zeebrugge, 2008)
Port of
Oostende
418,7 (’05)
(NBB, 2007)
337,9 (’05)
(NBB, 2007)
9,75 (’06)
(Port of Oostende, 2006)
451 853 (’06)
(Port of Oostende, 2006)
Table 14 - Economical data on ports and airport in the Flemish coastal region
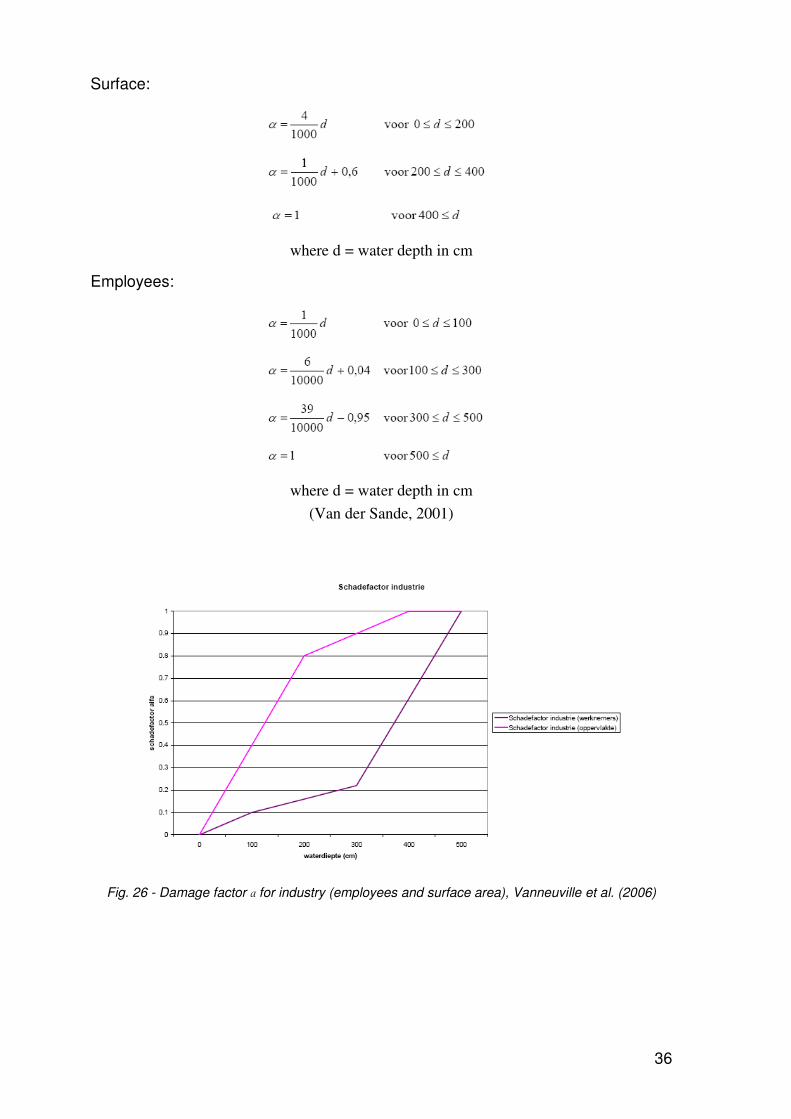
The monetary damage to industry caused by flooding can be calculated as a
function of the surface area or as a function of the number of employees.
36
Surface:
where d = water depth in cm
Employees:
where d = water depth in cm
(Van der Sande, 2001)
Fig. 26 - Damage factor α for industry (employees and surface area), Vanneuville et al. (2006)
37
1.4.3 Social importance
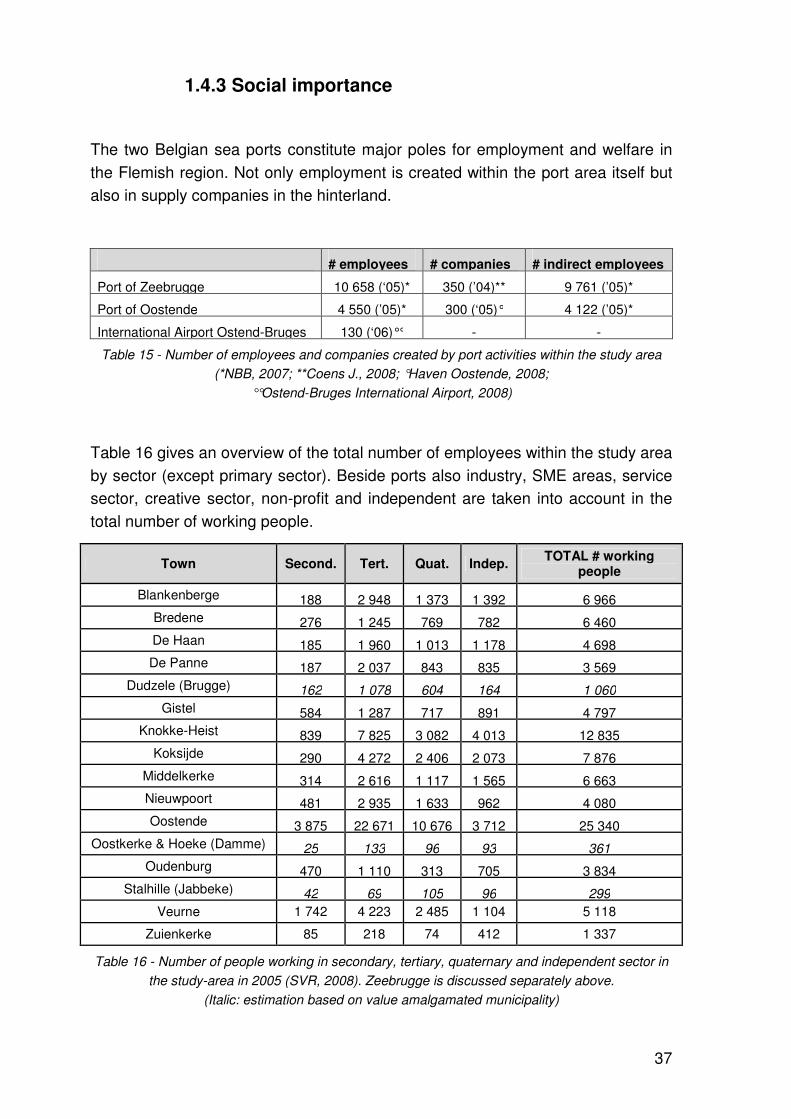
The two Belgian sea ports constitute major poles for employment and welfare in
the Flemish region. Not only employment is created within the port area itself but
also in supply companies in the hinterland.
# employees # companies # indirect employees
Port of Zeebrugge 10 658 (‘05)* 350 (’04)** 9 761 (’05)*
Port of Oostende 4 550 (’05)* 300 (‘05)° 4 122 (’05)*
International Airport Ostend-Bruges 130 (‘06)°° - -
Table 15 - Number of employees and companies created by port activities within the study area
(*NBB, 2007; **Coens J., 2008; °Haven Oostende, 2008;
°°Ostend-Bruges International Airport, 2008)
Table 16 gives an overview of the total number of employees within the study area
by sector (except primary sector). Beside ports also industry, SME areas, service
sector, creative sector, non-profit and independent are taken into account in the
total number of working people.
Town Second. Tert. Quat. Indep. TOTAL # working
people
Blankenberge 188 2 948 1 373 1 392 6 966
Bredene 276 1 245 769 782 6 460
De Haan 185 1 960 1 013 1 178 4 698
De Panne 187 2 037 843 835 3 569
Dudzele (Brugge) 162 1 078 604 164 1 060
Gistel 584 1 287 717 891 4 797
Knokke-Heist 839 7 825 3 082 4 013 12 835
Koksijde 290 4 272 2 406 2 073 7 876
Middelkerke 314 2 616 1 117 1 565 6 663
Nieuwpoort 481 2 935 1 633 962 4 080
Oostende 3 875 22 671 10 676 3 712 25 340
Oostkerke & Hoeke (Damme) 25 133 96 93 361
Oudenburg 470 1 110 313 705 3 834
Stalhille (Jabbeke) 42 69 105 96 299
Veurne 1 742 4 223 2 485 1 104 5 118
Zuienkerke 85 218 74 412 1 337
Table 16 - Number of people working in secondary, tertiary, quaternary and independent sector in
the study-area in 2005 (SVR, 2008). Zeebrugge is discussed separately above.
(Italic: estimation based on value amalgamated municipality)
38
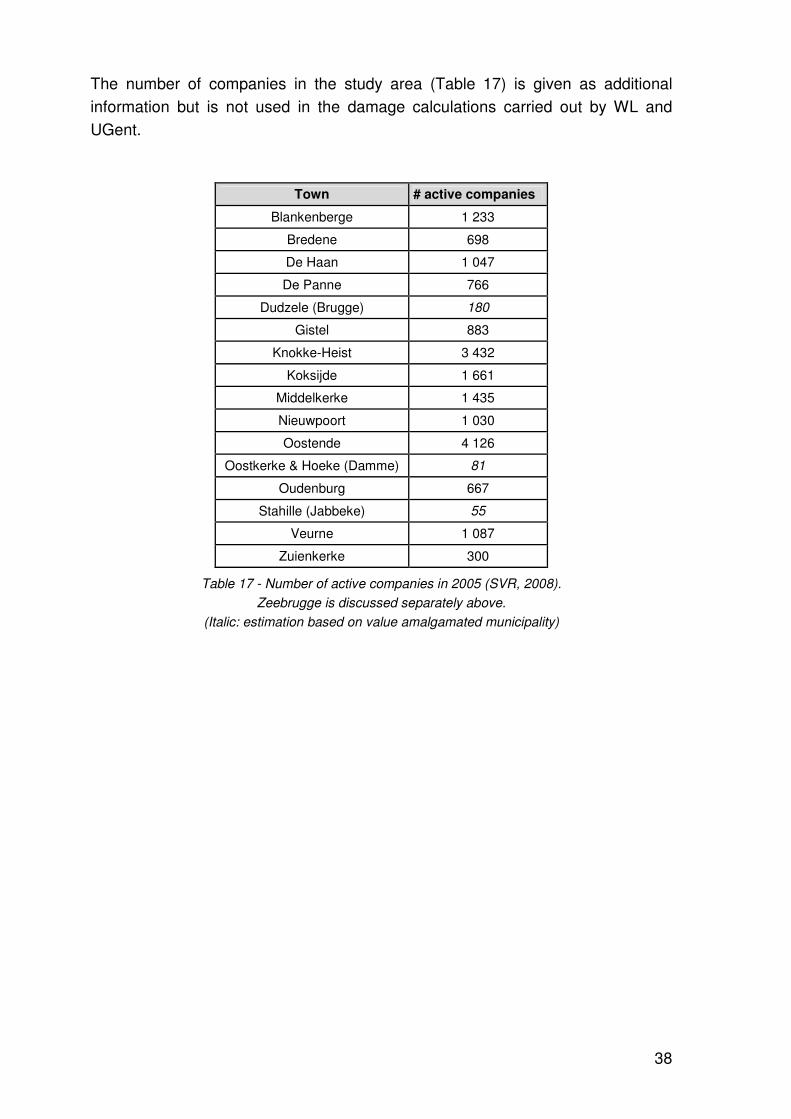
The number of companies in the study area (Table 17) is given as additional
information but is not used in the damage calculations carried out by WL and
UGent.
Town # active companies
Blankenberge 1 233
Bredene 698
De Haan 1 047
De Panne 766
Dudzele (Brugge) 180
Gistel 883
Knokke-Heist 3 432
Koksijde 1 661
Middelkerke 1 435
Nieuwpoort 1 030
Oostende 4 126
Oostkerke & Hoeke (Damme) 81
Oudenburg 667
Stahille (Jabbeke) 55
Veurne 1 087
Zuienkerke 300
Table 17 - Number of active companies in 2005 (SVR, 2008).
Zeebrugge is discussed separately above.
(Italic: estimation based on value amalgamated municipality)
39
1.5 AGRICULTURE
1.5.1 Intensity
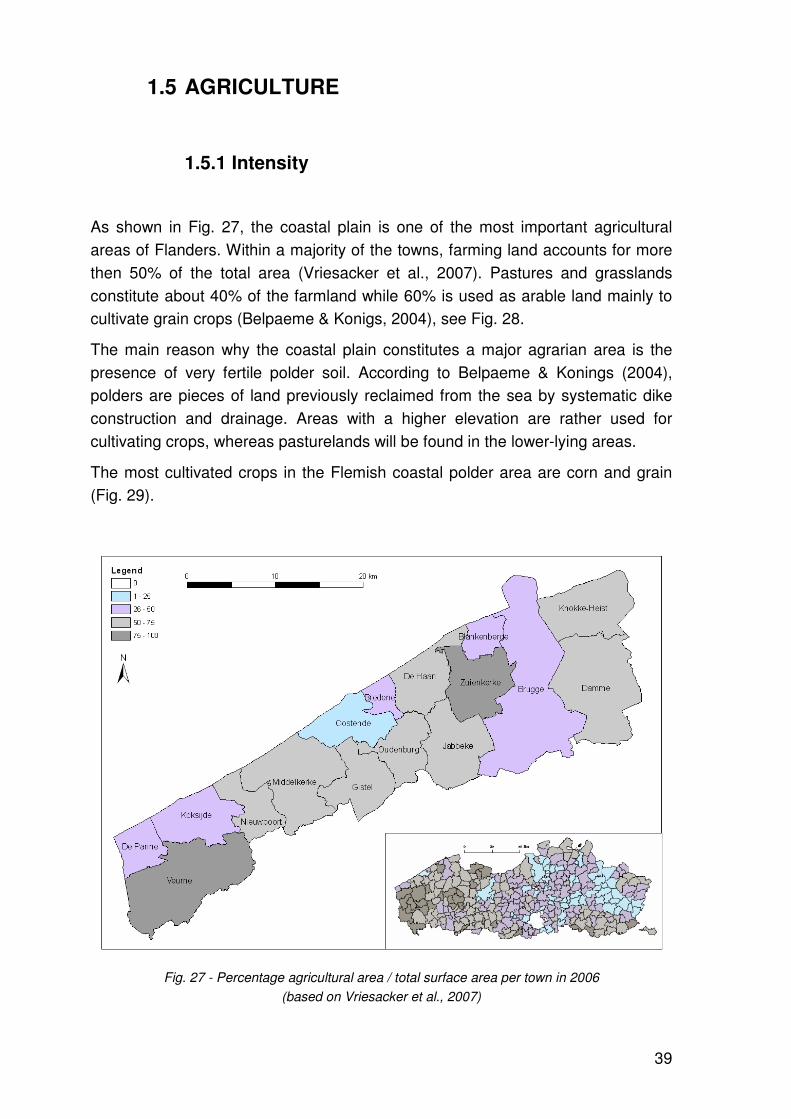
As shown in Fig. 27, the coastal plain is one of the most important agricultural
areas of Flanders. Within a majority of the towns, farming land accounts for more
then 50% of the total area (Vriesacker et al., 2007). Pastures and grasslands
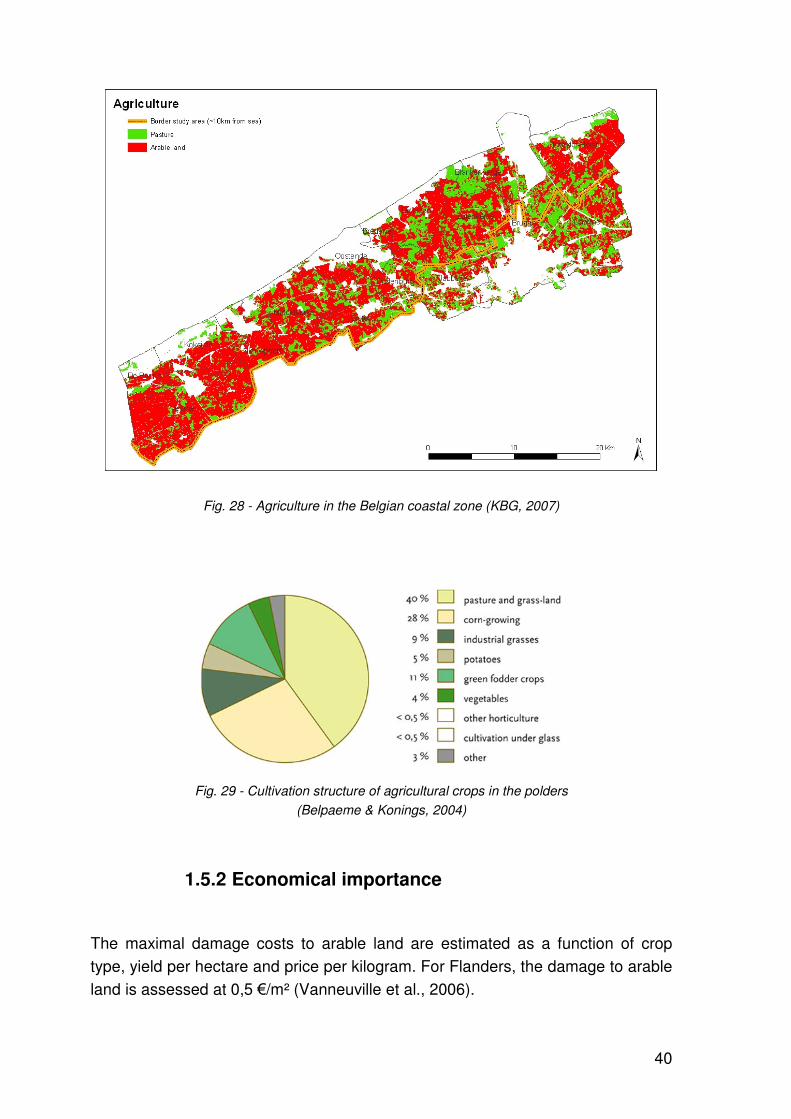
constitute about 40% of the farmland while 60% is used as arable land mainly to
cultivate grain crops (Belpaeme & Konigs, 2004), see Fig. 28.
The main reason why the coastal plain constitutes a major agrarian area is the
presence of very fertile polder soil. According to Belpaeme & Konings (2004),
polders are pieces of land previously reclaimed from the sea by systematic dike
construction and drainage. Areas with a higher elevation are rather used for
cultivating crops, whereas pasturelands will be found in the lower-lying areas.
The most cultivated crops in the Flemish coastal polder area are corn and grain
(Fig. 29).
Fig. 27 - Percentage agricultural area / total surface area per town in 2006
(based on Vriesacker et al., 2007)
40
Fig. 28 - Agriculture in the Belgian coastal zone (KBG, 2007)
Fig. 29 - Cultivation structure of agricultural crops in the polders
(Belpaeme & Konings, 2004)
1.5.2 Economical importance
The maximal damage costs to arable land are estimated as a function of crop
type, yield per hectare and price per kilogram. For Flanders, the damage to arable
land is assessed at 0,5 €/m² (Vanneuville et al., 2006).
41
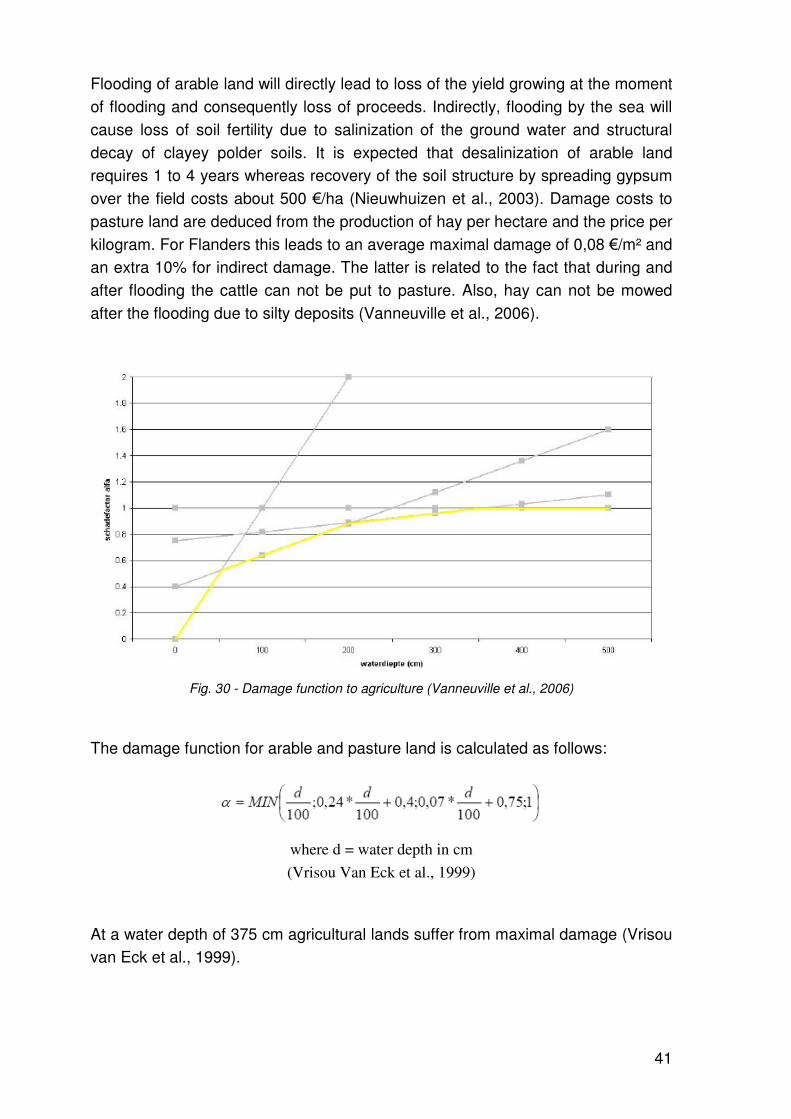
Flooding of arable land will directly lead to loss of the yield growing at the moment
of flooding and consequently loss of proceeds. Indirectly, flooding by the sea will
cause loss of soil fertility due to salinization of the ground water and structural
decay of clayey polder soils. It is expected that desalinization of arable land
requires 1 to 4 years whereas recovery of the soil structure by spreading gypsum
over the field costs about 500 €/ha (Nieuwhuizen et al., 2003). Damage costs to
pasture land are deduced from the production of hay per hectare and the price per
kilogram. For Flanders this leads to an average maximal damage of 0,08 €/m² and
an extra 10% for indirect damage. The latter is related to the fact that during and
after flooding the cattle can not be put to pasture. Also, hay can not be mowed
after the flooding due to silty deposits (Vanneuville et al., 2006).
Fig. 30 - Damage function to agriculture (Vanneuville et al., 2006)
The damage function for arable and pasture land is calculated as follows:
where d = water depth in cm
(Vrisou Van Eck et al., 1999)
At a water depth of 375 cm agricultural lands suffer from maximal damage (Vrisou
van Eck et al., 1999).
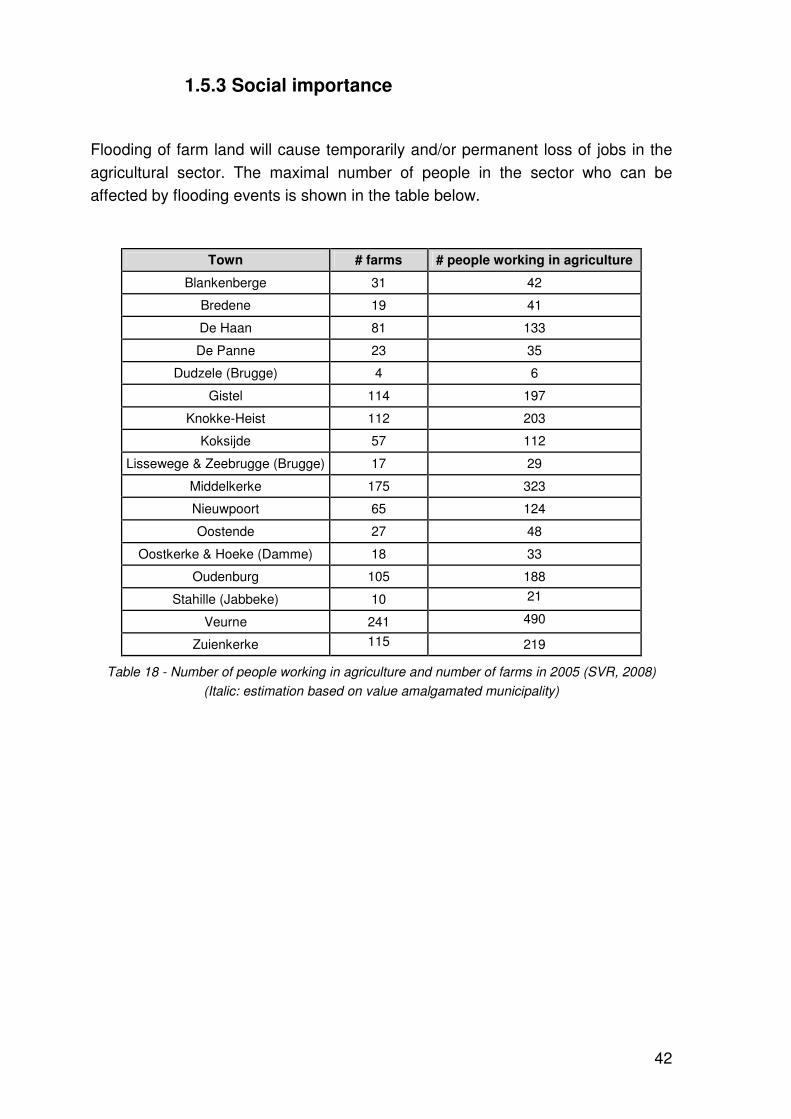
42
1.5.3 Social importance
Flooding of farm land will cause temporarily and/or permanent loss of jobs in the
agricultural sector. The maximal number of people in the sector who can be
affected by flooding events is shown in the table below.
Town # farms # people working in agriculture
Blankenberge 31 42
Bredene 19 41
De Haan 81 133
De Panne 23 35
Dudzele (Brugge) 4 6
Gistel 114 197
Knokke-Heist 112 203
Koksijde 57 112
Lissewege & Zeebrugge (Brugge) 17 29
Middelkerke 175 323
Nieuwpoort 65 124
Oostende 27 48
Oostkerke & Hoeke (Damme) 18 33
Oudenburg 105 188
Stahille (Jabbeke) 10 21
Veurne 241 490
Zuienkerke 115
219
Table 18 - Number of people working in agriculture and number of farms in 2005 (SVR, 2008)
(Italic: estimation based on value amalgamated municipality)
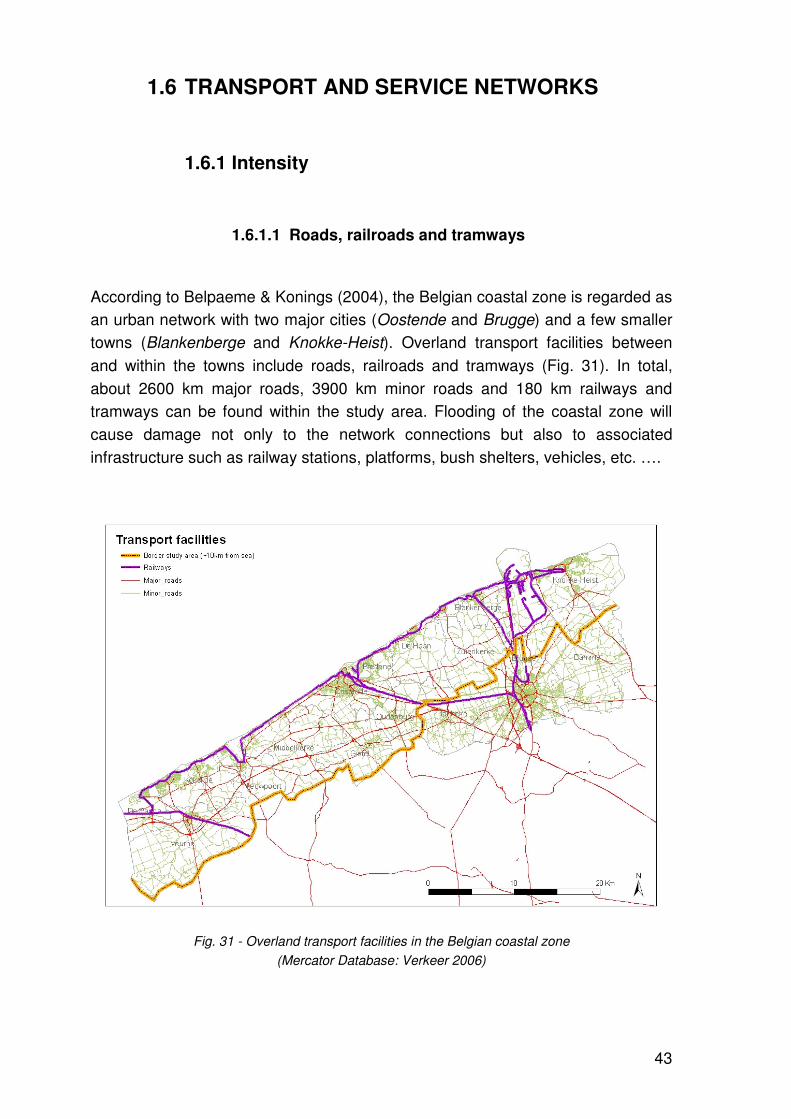
43
1.6 TRANSPORT AND SERVICE NETWORKS
1.6.1 Intensity
1.6.1.1 Roads, railroads and tramways
According to Belpaeme & Konings (2004), the Belgian coastal zone is regarded as
an urban network with two major cities (Oostende and Brugge) and a few smaller
towns (Blankenberge and Knokke-Heist). Overland transport facilities between
and within the towns include roads, railroads and tramways (Fig. 31). In total,
about 2600 km major roads, 3900 km minor roads and 180 km railways and
tramways can be found within the study area. Flooding of the coastal zone will
cause damage not only to the network connections but also to associated
infrastructure such as railway stations, platforms, bush shelters, vehicles, etc. ….
Fig. 31 - Overland transport facilities in the Belgian coastal zone
(Mercator Database: Verkeer 2006)
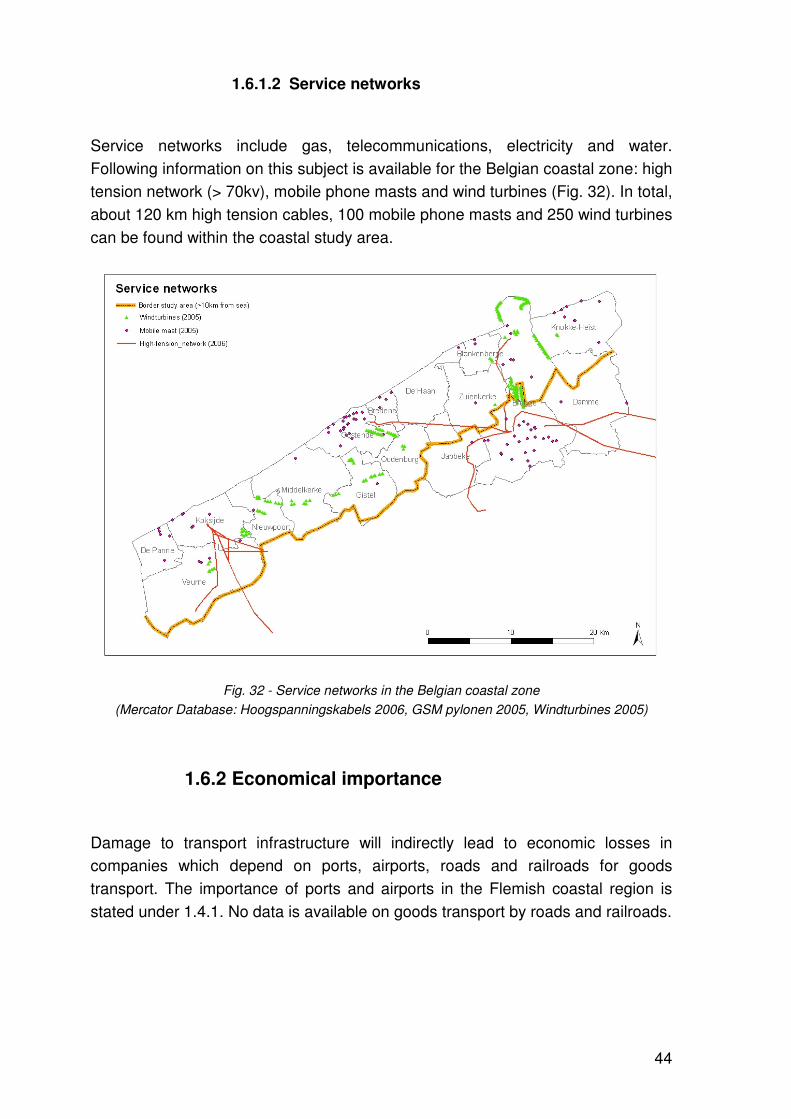
44
1.6.1.2 Service networks
Service networks include gas, telecommunications, electricity and water.
Following information on this subject is available for the Belgian coastal zone: high
tension network (> 70kv), mobile phone masts and wind turbines (Fig. 32). In total,
about 120 km high tension cables, 100 mobile phone masts and 250 wind turbines
can be found within the coastal study area.
Fig. 32 - Service networks in the Belgian coastal zone
(Mercator Database: Hoogspanningskabels 2006, GSM pylonen 2005, Windturbines 2005)
1.6.2 Economical importance
Damage to transport infrastructure will indirectly lead to economic losses in
companies which depend on ports, airports, roads and railroads for goods
transport. The importance of ports and airports in the Flemish coastal region is
stated under 1.4.1. No data is available on goods transport by roads and railroads.
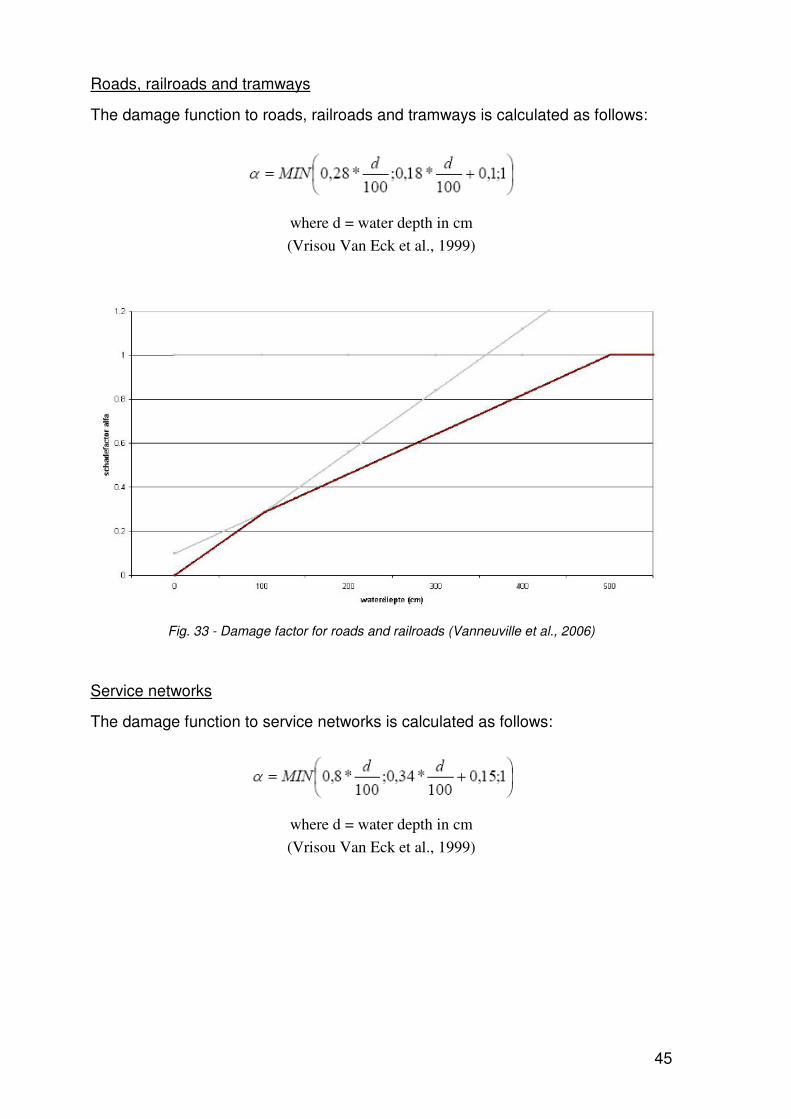
45
Roads, railroads and tramways
The damage function to roads, railroads and tramways is calculated as follows:
where d = water depth in cm
(Vrisou Van Eck et al., 1999)
Fig. 33 - Damage factor for roads and railroads (Vanneuville et al., 2006)
Service networks
The damage function to service networks is calculated as follows:
where d = water depth in cm
(Vrisou Van Eck et al., 1999)
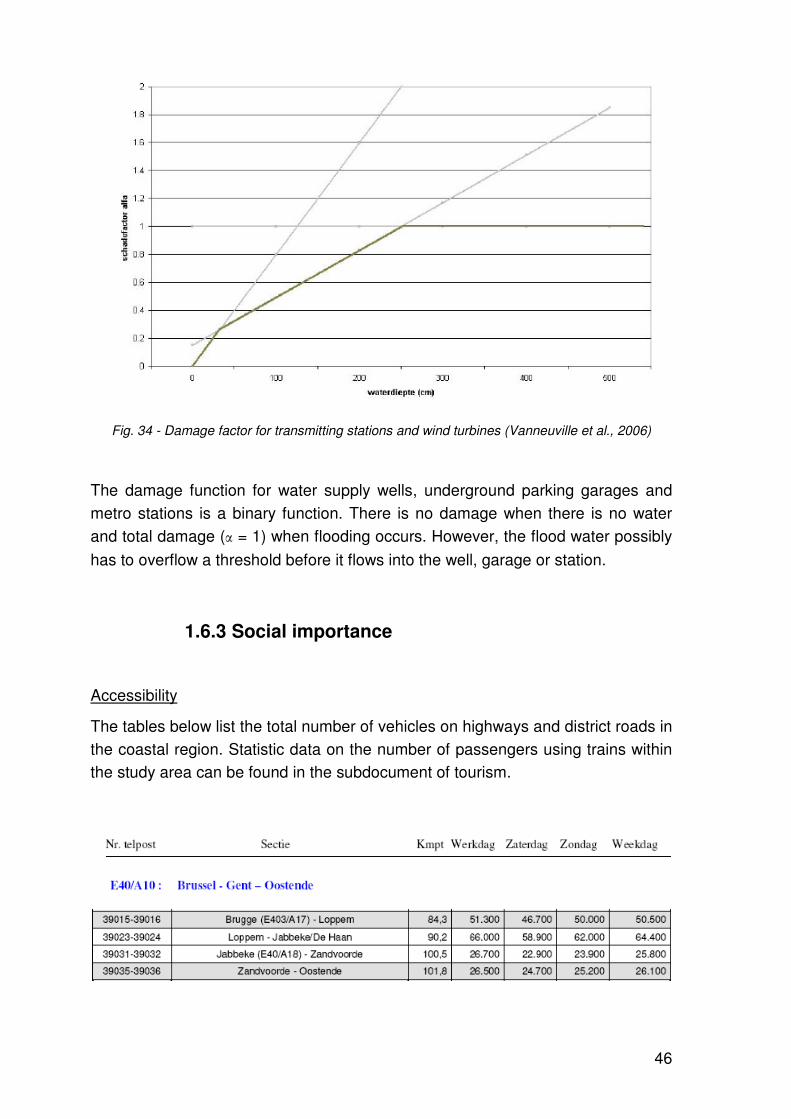
46
Fig. 34 - Damage factor for transmitting stations and wind turbines (Vanneuville et al., 2006)
The damage function for water supply wells, underground parking garages and
metro stations is a binary function. There is no damage when there is no water
and total damage (α = 1) when flooding occurs. However, the flood water possibly
has to overflow a threshold before it flows into the well, garage or station.
1.6.3 Social importance
Accessibility
The tables below list the total number of vehicles on highways and district roads in
the coastal region. Statistic data on the number of passengers using trains within
the study area can be found in the subdocument of tourism.
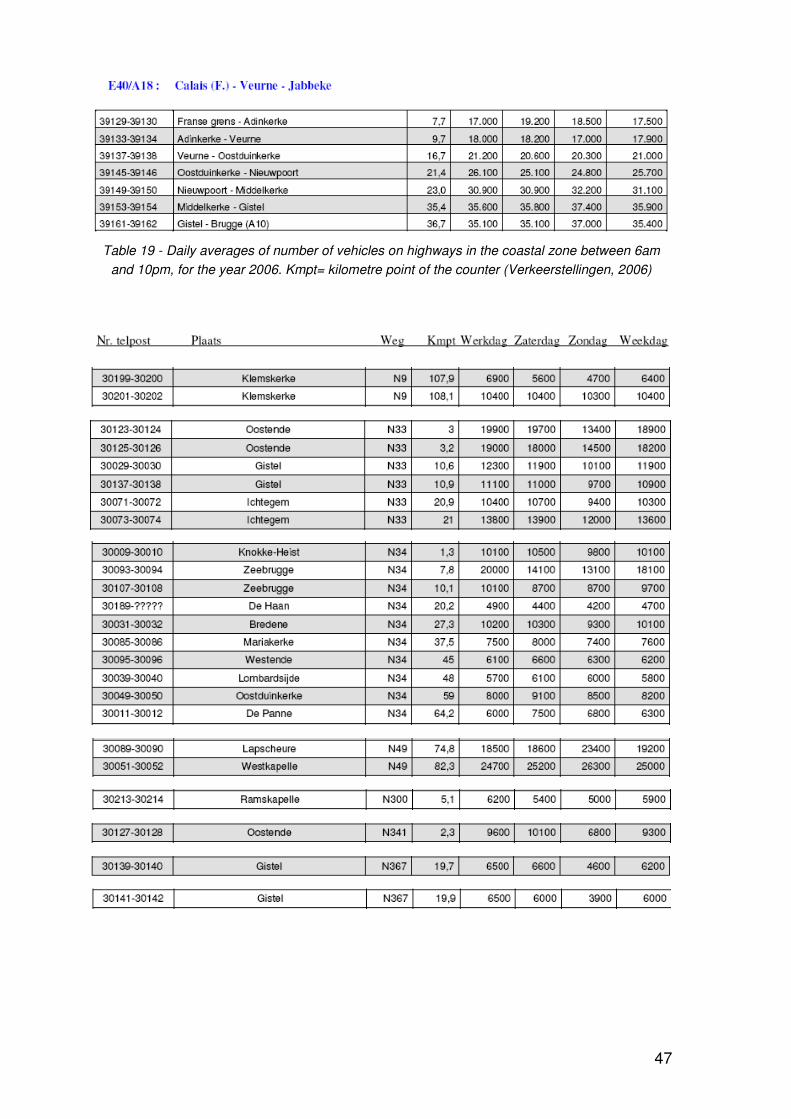
47
Table 19 - Daily averages of number of vehicles on highways in the coastal zone between 6am
and 10pm, for the year 2006. Kmpt= kilometre point of the counter (Verkeerstellingen, 2006)
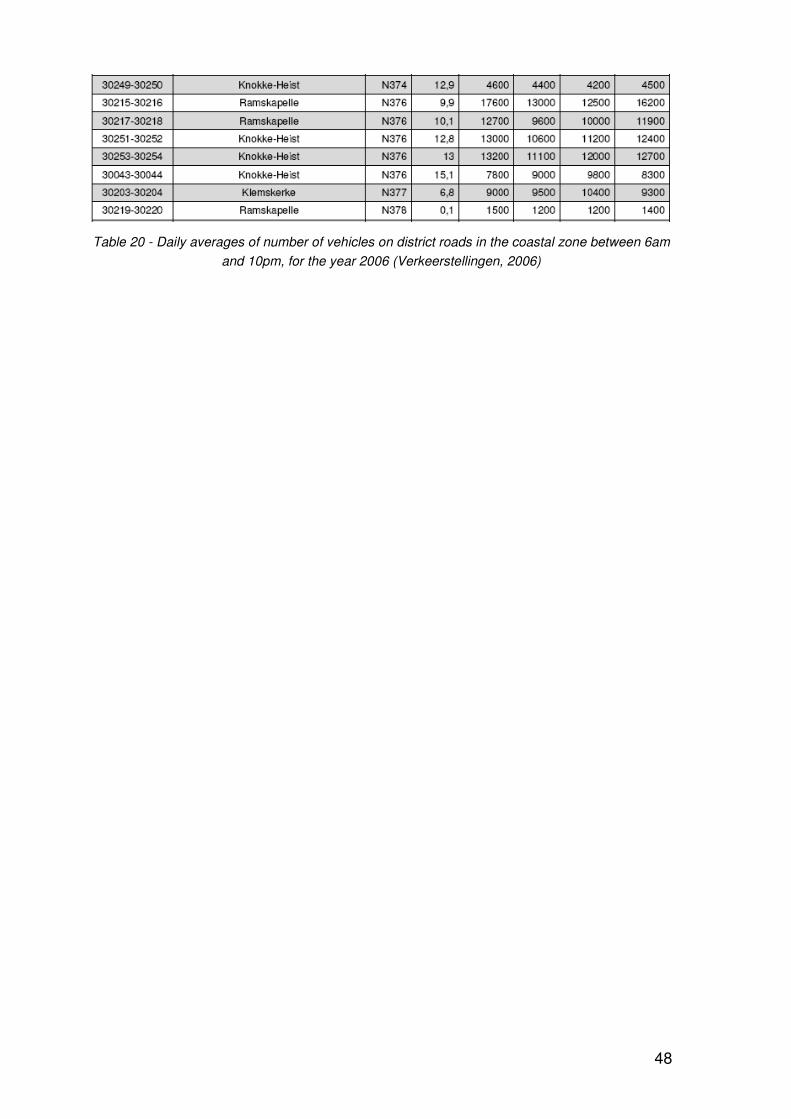
48
Table 20 - Daily averages of number of vehicles on district roads in the coastal zone between 6am
and 10pm, for the year 2006 (Verkeerstellingen, 2006)
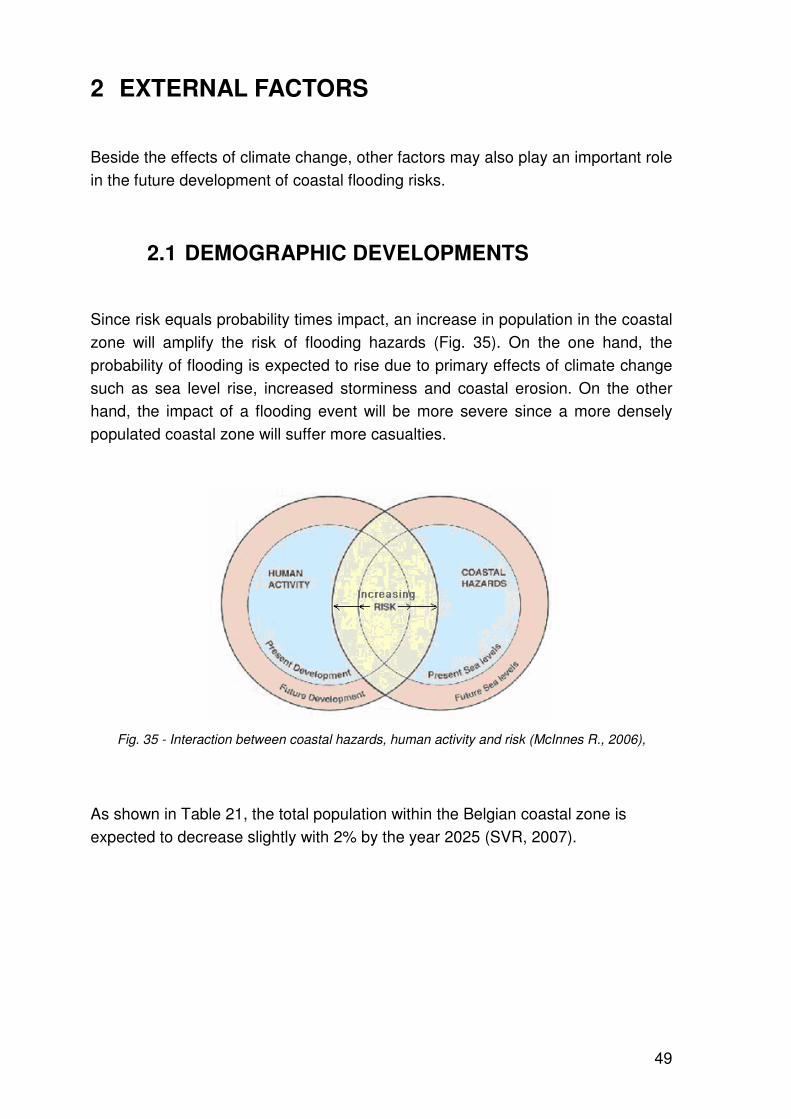
49
2 EXTERNAL FACTORS
Beside the effects of climate change, other factors may also play an important role
in the future development of coastal flooding risks.
2.1 DEMOGRAPHIC DEVELOPMENTS
Since risk equals probability times impact, an increase in population in the coastal
zone will amplify the risk of flooding hazards (Fig. 35). On the one hand, the
probability of flooding is expected to rise due to primary effects of climate change
such as sea level rise, increased storminess and coastal erosion. On the other
hand, the impact of a flooding event will be more severe since a more densely
populated coastal zone will suffer more casualties.
Fig. 35 - Interaction between coastal hazards, human activity and risk (McInnes R., 2006),
As shown in Table 21, the total population within the Belgian coastal zone is
expected to decrease slightly with 2% by the year 2025 (SVR, 2007).
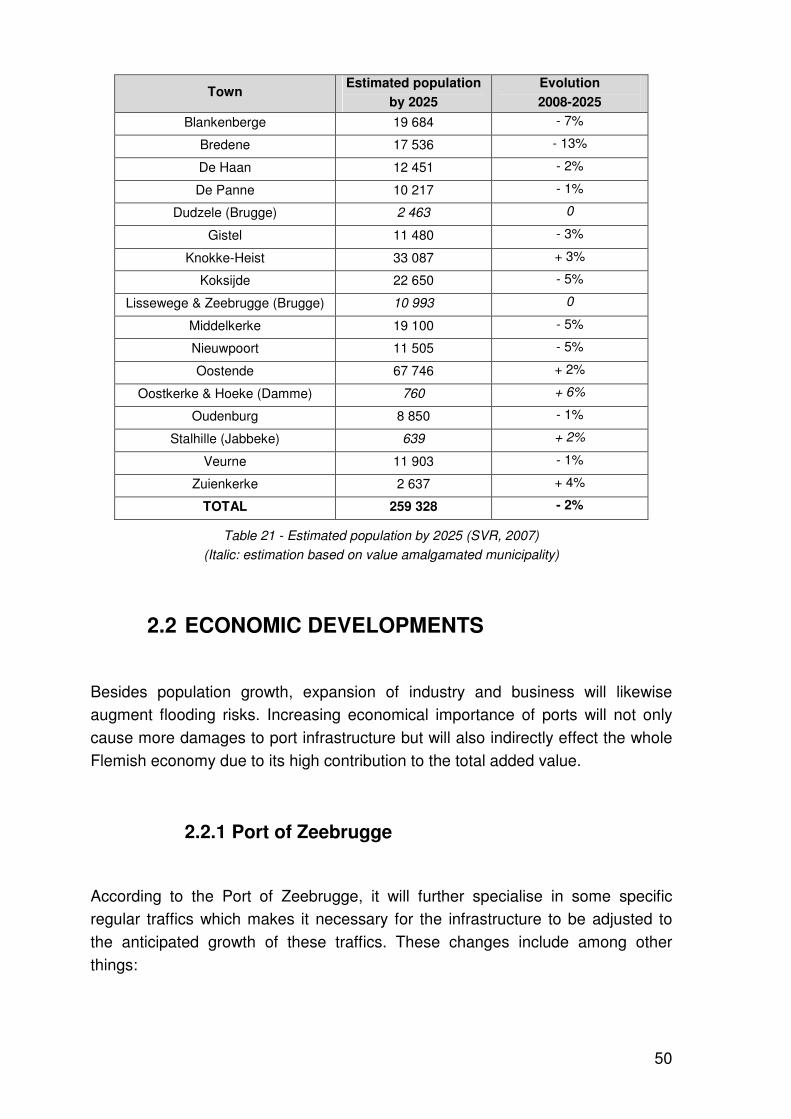
50
Town Estimated population
by 2025
Evolution
2008-2025
Blankenberge 19 684 - 7%
Bredene 17 536 - 13%
De Haan 12 451 - 2%
De Panne 10 217 - 1%
Dudzele (Brugge) 2 463 0
Gistel 11 480 - 3%
Knokke-Heist 33 087 + 3%
Koksijde 22 650 - 5%
Lissewege & Zeebrugge (Brugge) 10 993 0
Middelkerke 19 100 - 5%
Nieuwpoort 11 505 - 5%
Oostende 67 746 + 2%
Oostkerke & Hoeke (Damme) 760 + 6%
Oudenburg 8 850 - 1%
Stalhille (Jabbeke) 639 + 2%
Veurne 11 903 - 1%
Zuienkerke 2 637 + 4%
TOTAL 259 328 - 2%
Table 21 - Estimated population by 2025 (SVR, 2007)
(Italic: estimation based on value amalgamated municipality)
2.2 ECONOMIC DEVELOPMENTS
Besides population growth, expansion of industry and business will likewise
augment flooding risks. Increasing economical importance of ports will not only
cause more damages to port infrastructure but will also indirectly effect the whole
Flemish economy due to its high contribution to the total added value.
2.2.1 Port of Zeebrugge
According to the Port of Zeebrugge, it will further specialise in some specific
regular traffics which makes it necessary for the infrastructure to be adjusted to
the anticipated growth of these traffics. These changes include among other
things:
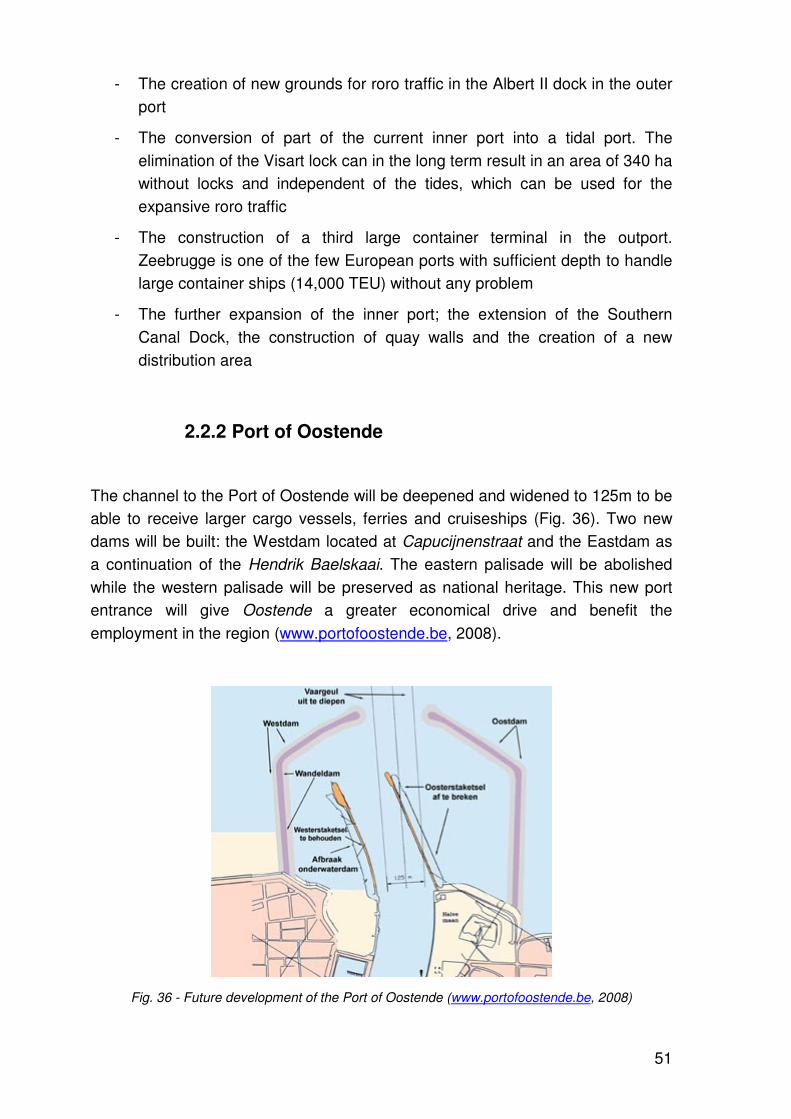
51
- The creation of new grounds for roro traffic in the Albert II dock in the outer
port
- The conversion of part of the current inner port into a tidal port. The
elimination of the Visart lock can in the long term result in an area of 340 ha
without locks and independent of the tides, which can be used for the
expansive roro traffic
- The construction of a third large container terminal in the outport.
Zeebrugge is one of the few European ports with sufficient depth to handle
large container ships (14,000 TEU) without any problem
- The further expansion of the inner port; the extension of the Southern
Canal Dock, the construction of quay walls and the creation of a new
distribution area
2.2.2 Port of Oostende
The channel to the Port of Oostende will be deepened and widened to 125m to be
able to receive larger cargo vessels, ferries and cruiseships (Fig. 36). Two new
dams will be built: the Westdam located at Capucijnenstraat and the Eastdam as
a continuation of the Hendrik Baelskaai. The eastern palisade will be abolished
while the western palisade will be preserved as national heritage. This new port
entrance will give Oostende a greater economical drive and benefit the
employment in the region (www.portofoostende.be, 2008).
Fig. 36 - Future development of the Port of Oostende (www.portofoostende.be, 2008)
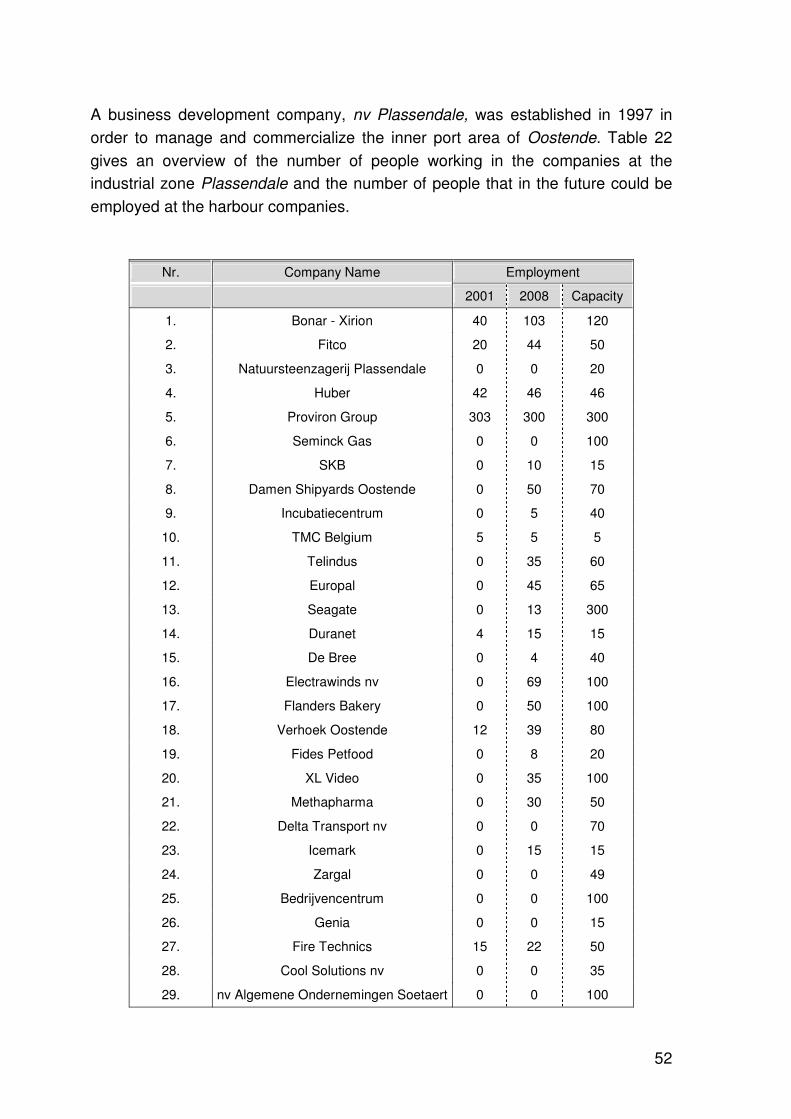
52
A business development company, nv Plassendale, was established in 1997 in
order to manage and commercialize the inner port area of Oostende. Table 22
gives an overview of the number of people working in the companies at the
industrial zone Plassendale and the number of people that in the future could be
employed at the harbour companies.
Nr. Company Name Employment
2001 2008 Capacity
1. Bonar - Xirion 40 103 120
2. Fitco 20 44 50
3. Natuursteenzagerij Plassendale 0 0 20
4. Huber 42 46 46
5. Proviron Group 303 300 300
6. Seminck Gas 0 0 100
7. SKB 0 10 15
8. Damen Shipyards Oostende 0 50 70
9. Incubatiecentrum 0 5 40
10. TMC Belgium 5 5 5
11. Telindus 0 35 60
12. Europal 0 45 65
13. Seagate 0 13 300
14. Duranet 4 15 15
15. De Bree 0 4 40
16. Electrawinds nv 0 69 100
17. Flanders Bakery 0 50 100
18. Verhoek Oostende 12 39 80
19. Fides Petfood 0 8 20
20. XL Video 0 35 100
21. Methapharma 0 30 50
22. Delta Transport nv 0 0 70
23. Icemark 0 15 15
24. Zargal 0 0 49
25. Bedrijvencentrum 0 0 100
26. Genia 0 0 15
27. Fire Technics 15 22 50
28. Cool Solutions nv 0 0 35
29. nv Algemene Ondernemingen Soetaert 0 0 100
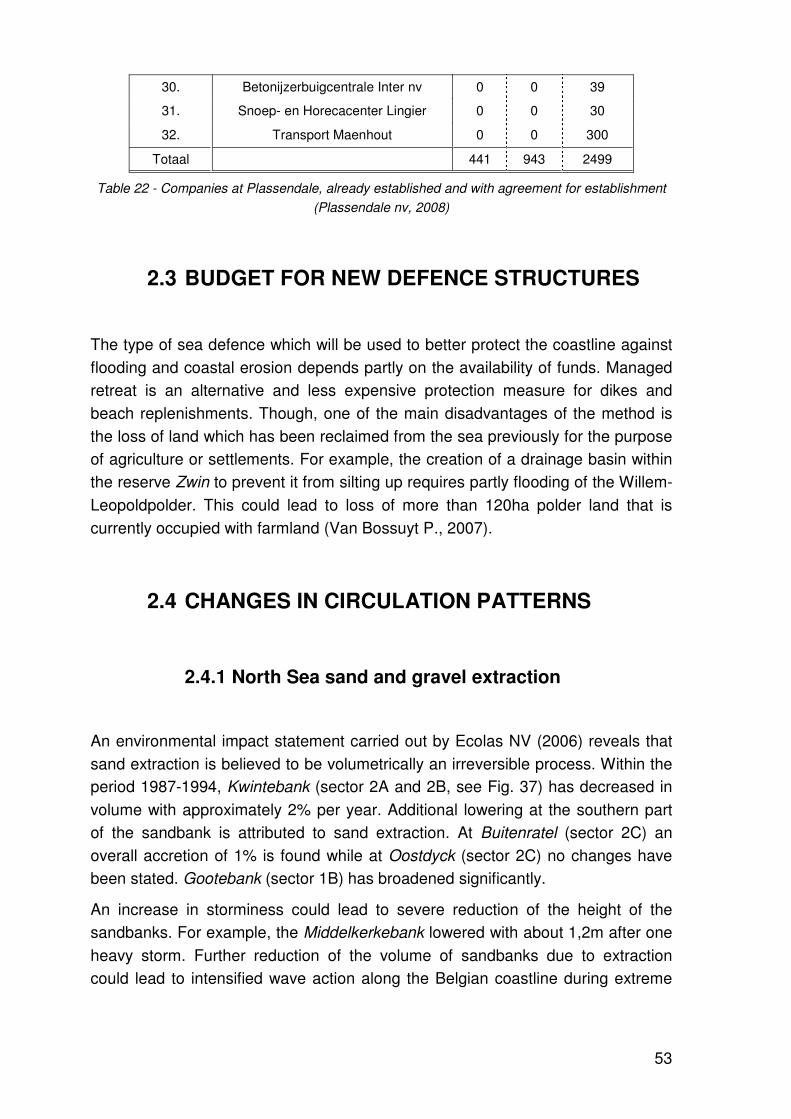
53
30. Betonijzerbuigcentrale Inter nv 0 0 39
31. Snoep- en Horecacenter Lingier 0 0 30
32. Transport Maenhout 0 0 300
Totaal 441 943 2499
Table 22 - Companies at Plassendale, already established and with agreement for establishment
(Plassendale nv, 2008)
2.3 BUDGET FOR NEW DEFENCE STRUCTURES
The type of sea defence which will be used to better protect the coastline against
flooding and coastal erosion depends partly on the availability of funds. Managed
retreat is an alternative and less expensive protection measure for dikes and
beach replenishments. Though, one of the main disadvantages of the method is
the loss of land which has been reclaimed from the sea previously for the purpose
of agriculture or settlements. For example, the creation of a drainage basin within
the reserve Zwin to prevent it from silting up requires partly flooding of the Willem-
Leopoldpolder. This could lead to loss of more than 120ha polder land that is
currently occupied with farmland (Van Bossuyt P., 2007).
2.4 CHANGES IN CIRCULATION PATTERNS
2.4.1 North Sea sand and gravel extraction
An environmental impact statement carried out by Ecolas NV (2006) reveals that
sand extraction is believed to be volumetrically an irreversible process. Within the
period 1987-1994, Kwintebank (sector 2A and 2B, see Fig. 37) has decreased in
volume with approximately 2% per year. Additional lowering at the southern part
of the sandbank is attributed to sand extraction. At Buitenratel (sector 2C) an
overall accretion of 1% is found while at Oostdyck (sector 2C) no changes have
been stated. Gootebank (sector 1B) has broadened significantly.
An increase in storminess could lead to severe reduction of the height of the
sandbanks. For example, the Middelkerkebank lowered with about 1,2m after one
heavy storm. Further reduction of the volume of sandbanks due to extraction
could lead to intensified wave action along the Belgian coastline during extreme
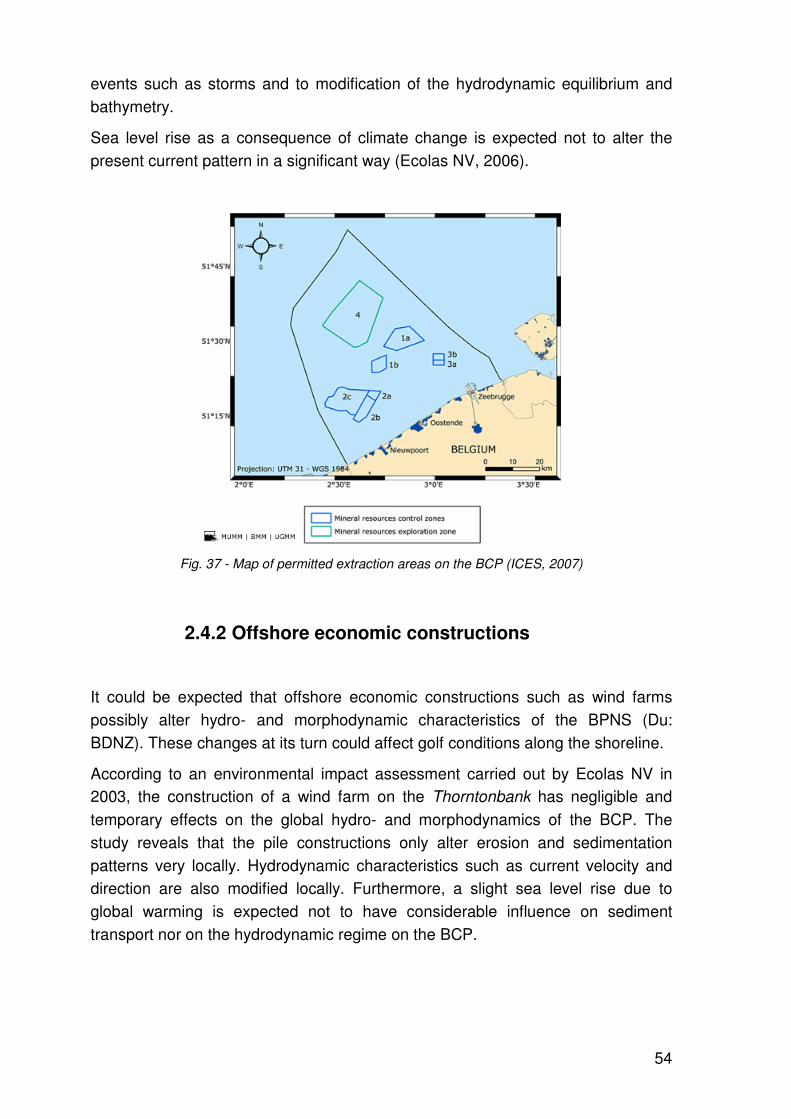
54
events such as storms and to modification of the hydrodynamic equilibrium and
bathymetry.
Sea level rise as a consequence of climate change is expected not to alter the
present current pattern in a significant way (Ecolas NV, 2006).
Fig. 37 - Map of permitted extraction areas on the BCP (ICES, 2007)
2.4.2 Offshore economic constructions
It could be expected that offshore economic constructions such as wind farms
possibly alter hydro- and morphodynamic characteristics of the BPNS (Du:
BDNZ). These changes at its turn could affect golf conditions along the shoreline.
According to an environmental impact assessment carried out by Ecolas NV in
2003, the construction of a wind farm on the Thorntonbank has negligible and
temporary effects on the global hydro- and morphodynamics of the BCP. The
study reveals that the pile constructions only alter erosion and sedimentation
patterns very locally. Hydrodynamic characteristics such as current velocity and
direction are also modified locally. Furthermore, a slight sea level rise due to
global warming is expected not to have considerable influence on sediment
transport nor on the hydrodynamic regime on the BCP.
55
3 SECUNDARY IMPACTS OF CLIMATE CHANGE
ON COASTAL FLOODING RISKS AND COASTAL
INFRASTRUCTURE
The most important primary effects of climate change that have a determinant
influence on flood risks along the Belgian coastline are sea level rise, changes in
hydrodynamic climate (increase in storminess), changes in wave climate
(increased wave height) and changes in circulation patterns (orientation and
velocity of ocean currents).
These primary physical effects will directly result in flooding of the coastline and
the lower coastal hinterland and to increasing coastal erosion due to increasing
frequency and severity of storms.
3.1 ECOLOGICAL EFFECT CATEGORIES
3.1.1 Water quality
In order to protect the Belgian coastal zone against flooding due to sea level rise
and increasing coastal erosion, there will be a need for better and more regular
maintenance of existing defence structure. Beside, it will be necessary to build
new and/or greater defence structures. One of the most common present-day
protection measures along the Belgian coastline are sand nourishments. Sand is
extracted from the bottom of the North Sea and deposited on the beach to make it
higher, broader and/or larger. In some cases the sand can also be deposited on
foreshore, though in Belgium this is a less common technique. The sand
nourishments act as buffers for wave action and prevent further erosion from
beach and dune. Though, dredging of sand causes changes of the North Sea
bathymetry, which lead to alteration of water circulation patterns. Beside,
foreshore nourishment itself leads to changes in circulation patterns.
The construction of offshore defence structures (e.g. breakwaters) can also cause
moderation of water and sediment transport patterns.
Regular dredging on the same location may also cause increase in turbidity of the
sea water. This will negatively influence the marine ecosystem and associated
fauna and flora.
56
3.1.2 Habitat change
Due to the construction of hard defence structures to prevent the coastal zone
from flooding, natural geomorphologic processes and ecosystems are interrupted
and will eventually degrade. For example, dune slacks (‘duinpannen’) can only be
formed when the sea enters the low laying dune area during spring tide.
On the other hand, an increase in sea level will lead to a permanent loss of certain
specific coastal habitats like e.g. wetlands (‘slikke en schorre’). This loss could be
compensated by allowing the sea and coastal habitats to advance landward under
managed retreat like e.g. the natural reserve ‘Zwin’.
The usage of sand nourishment as protection measure leads to disturbance of
benthic ecosystems and loss of associated fauna and flora at the location of sand
extraction in the North Sea. The deposition of sand on foreshore also disturbs the
benthic habitat at the location of nourishment and buries besides benthic fauna
and flora also fishes. On the other hand, the total beach area increases because
of sand nourishments.
A new ecological opportunity can be found in the creation of new marine habitat
on offshore defence structure. This habitat is characterised by intense wave
action, high oxygen rates in the water and tidal influence. These conditions are
particularly suitable for e.g. mussels, barnacles, certain types of algae, …
The construction of greater and new defence structures to protect ports against
the consequences of climate change leads to erosion or accretion of beaches in
the vicinity of these constructions (e.g. Bay of Heist, Knokke).
3.1.3 Biodiversity
Due to sea level rise and extremer weather conditions, certain specific coastal
habitats will be lost by flooding and increased erosion. This can locally lead to
permanent loss of rare fauna and flora restricted to these habitats, and so loss of
biodiversity. On the other hand, landward migration of coastal habitats under
managed retreat can lead to an increase in biodiversity due to creation of new
coastal habitats.
57
3.2 ECONOMICAL EFFECT CATEGORIES
3.2.1 Change in production
Due to the increase of frequency and intensity of storms, coastal erosion rates will
be higher, leading to more damage to offshore infrastructure of aquaculture, wind
turbines etc. On its turn, this damage can lead to temporary lower production
rates.
3.2.2 Production value
Due to the necessity for greater defence structures around offshore infrastructure
for economical activities (aquaculture, energy sector etc.), the exploitation costs
will increase, leading to a higher price of the product (ex.: price of mussels, wind
energy). This secondary effect is indirectly a consequence of sea level rise and
increased storminess. Beside, ports will also need to be protected by new and
greater defence structures. This will increase the price of products transported by
shipping.
3.2.3 Damage costs
Flooding and coastal erosion lead to many types of damages: to coastal defence
structures, service networks, transport infrastructure, private and public buildings,
industry, aquaculture and agriculture. These higher damage and maintenance
costs are a direct consequence of the primary effects of climate change. Indirectly,
these damages also lead to economic losses: due to the permanent or temporary
closure of companies, other companies (customers, suppliers) can experience
economic difficulties and losses.
The construction of new and greater defence structures around ports to protect
against sea level rise and increased coastal erosion lead to silting up of channels
and port entrances. The regular need for dredging increases the maintenance
costs of port infrastructure. This effect is an indirect secondary result of the
adaptation measures to the primary effects of climate change (flooding, coastal
erosion).
58
3.2.4 New opportunities
The adaptation measures to protect the Belgian coastline from flooding as a result
of climate change can clear the way for new opportunities. The construction of
new innovative offshore defence structures can be coupled with diverse
economical or ecological activities. For example, hard constructions built to
absorb the wave energy before they reach the beach could be used to breed
mussels or oysters. Also, the developing of man-made islands in front of the coast
could create new opportunities, as example for agriculture or wind energy.
Another innovative adaptation strategy to sea level rise which offers new
opportunities is managed retreat. This measure allows a low-laying area to
become flooded in a controlled way by removing coastal protection. In these areas
susceptible to flooding, the natural intertidal ecosystem can restore itself or
expand (ex.: Zwin).
At the other hand, already existing defence measure types like beach
nourishments give the opportunity to the recreational sector to expand their
activities on the new or broadened beaches. Another example are the artificial
reefs built to protect the shoreline on which also recreational diving could be
organised.
3.3 SOCIAL EFFECT CATEGORIES
3.3.1 Attractiveness coastal & marine area
Due to sea level rise and increased coastal erosion, a certain amount of beach
area and thus space for leisure activities will be lost. At the other hand, sand
nourishments create new and broader beaches. Though, sand nourishments have
different disturbing social effects. The sand that is used for the nourishments is
generally coarser and darker then the original beach sand. It can make the beach
less attractive. Also, during summer beach cabins will be at a higher level
because of the nourishment, so that the sea view for people on the dike terraces
is disturbed. Tourists and residents can also find the Belgian coastline less
attractive due to the presence of concrete dikes which interrupt the natural
ecosystem or due to the presence of offshore defence structures.
59
The attraction value of the coastline can increase in account of the alternative
defence strategy of managed retreat. The creation or restoration of particular
intertidal habitats can attract more tourists.
3.3.2 Employment
Due to the necessity of building greater and new defence structures and the
maintenance of existing infrastructure to protect against sea level rise and
increased storminess, there can be expected more jobs available in the
construction and dredging sector.
At the other hand, damages to business properties caused by flooding will lead to
a permanent or temporary loss of jobs in the affected areas.
3.3.3 Safety
Flooding of the coastal zone can directly result in casualties on the coastline and
in the hinterland. Casualties can also occur on the coastline due to wave
overtopping during less intense storms.
3.3.4 Accessibility
Due to the presence of hard defence structures around ports, the navigation of
ships through the channels can be hampered.
When coastal transport infrastructure is damaged due to flooding, wave
overtopping or coastal erosion, the accessibility to the coastal zone will be
obstructed.
3.3.5 Welfare
Damages to properties and casualties resulting from flooding and/or coastal
erosion will indirectly influence the life quality of people. The deceasing of
economical active people leads to a decrease of the financial status of families.
60
Damage to business properties due to flooding will also lead to temporary or
permanent loss of employment in the affected areas.
61
4 LITERATURE
Afdeling Kust van Maritieme Dienstverlening en Kust IVA, Vlaams Ministerie voor
Mobiliteit en Openbare Werken.
Belpaeme K. & Konings Ph. (eds.), 2004. The Coastal Atlas Flanders-Belgium.
Publication of the Co-ordination Center for Coatsal Zone Management, 100
pages.
Berteloot M., 2007. (Afdeling Kust, Vlaams Ministerie van Mobiliteit en Openbare
Werken) http://www.bndestem.nl/ , ‘Uitbreiding moet Zwin redden’,
07/09/2006.
Bonte, D. & Provoost, S., 2005. Laat het zand maar waaien – waarom stuivende
duinen onze kust zo bijzonder maken. De Grote Rede 14, november 2005.
Coens J., 2008. Jaarresultaten 2007. Zeebrugge Port Authority.
www.portofzeebrugge.be
CORINE Landcover Map, 1996. Coordination of Information on the Environment
Programme of the European Commission.
De Wolf P., 2007. Celhoofd Afdeling Kust van Maritieme Dienstverlening en Kust,
Vlaams Ministerie voor Mobiliteit en Openbare Werken, IVA. Interview met
De Gentenaar, Strand Lombardsijde wordt reservaat, //www.gentenaar.be/,
31/10/2007.
De Ronde B., Houthuys R., Kempeneers P. & Fransaer D., 2007. Bepaling van
het middellange-termijn zandtransport op het Vlaamse strand op basis van
geklasseerde hyperspectrale registraties en laserscan data. Studie in
opdracht van het Vlaamse Ministerie voor Mobiliteit en Openbare Werken,
IVA. Maritieme Dienstverlening en Kust, Afdeling Kust, 2007/TAP/R/043.
Ecolas NV, 2003. Milieueffectenrapport voor een offshore windturbinepark op de
Thorntonbank. Deel 2: Hoofddocument MER. In opdracht van C-Power NV.
Ecolas NV, 2006. Milieueffectenrapport voor de extractie van mariene aggregaten
op het BDNZ. Studie in opdracht van Zeegra vzw en Afdeling Kust en
Maritieme Toegang.
FOD, 2001. FOD Economie, KMO, Middenstand en Energie. Tabel 30.49 A - folio
2. Vervoermiddelen waarover het huishouden beschikt.
Haven Oostende, 2008. Jaarverslag 2006, www.portofoostende.be (06/02/08)
Herrier J.-L., 2002. De Baai van Heist: van verloren hoek tot eerste Vlaamse
strandreservaat. www.maritieminstituut.be (07/02/08)
62
Ibaraki M. & Mizuno J., 2007. Climate change could diminish drinking water more
than expected. OSU News Research Archive 11/06/2007, Ohio State
University
ICES, 2007. Report of the working group on the effects of extraction of marine
sediments on the marine ecosystem (WGEXT). 17-20 April 2007, Helsinki,
Finland. ICES CM 2007/MCH:08. 96 pp.
Idea Consult nv, 2002. Economische positionering van de haven van Brugge-
Zeebrugge. Opgemaakt op vraag van WES, Economisch en
Maatschappelijk Studie- en Adviesbureau, in het kader van de opmaak van
het Strategisch Plan voor de haven van Brugge-Zeebrugge.
IWVA, 2008. Intercommunale Waterleidingsmaatschappij van Veurne-Ambacht.
Jaarverslag 2006. www.IWVA.be.
Jonkman B. & Cappendijk P., 2006. Veiligheid Nederland in Kaart – Inschatting van
het aantal slachtoffers ten gevolge van overstroming, Ministerie van Verkeer
en Waterstaat, Rijkswaterstaat DWW.
KBG, 2001. Kleinschalig Bodemgebruikbestand van Vlaanderen en Brussel,
Ondersteunend Centrum GIS Vlaanderen
Mercator Database, 2008. Referentiedatabank voor geografische data binnen het
Ministerie van de Vlaamse Gemeenschap.
McInnes R., 2006. Responding to the risks from climate change in coastal zones – A
good practice guide. Centre for the Coastal Environment, Isle of Wight
Council, UK. Output from the European Commission’s LIFE Environment
Programme Project ‘Response’
Natuurpunt, 2008. http://www.studiokontrast.com/studiokontrast/nr/ (07/02/08)
NBB, 2007. Nationale Bank van België, Referentie op www.vlaamsezeehavens.be
(13/03/2008)
Nieuwenhuizen W., Wolfert H., Highler L., Dijkman M., Huizinga H., Kopinga J.,
Makaske A., Nijhof B., Olsthoorn A. & Wösten J., 2003. Standaardmethode
Schade aan LNC-waarden als gevolg van overstromingen; methode voor het
bepalen van de gevolgen van overstromingen voor de aspecten opgaande
begroeiing, vegetatie, aquatische ecosystemen en historische bouwkunde.
Wageningen, Alterra, Research Instituut voor de Groene Ruimte. Alterra-
rapport 709.
NIS, 2004. Aantal werknemers per gemeente.
NIS, 2007. Bevolking per gemeente op 01/01/2007. http://www.statbel.fgov.be/
(31/01/08)
63
O&S, 2005. Dienst Onderzoek en Statistiek Nederland. Referentie op
http://zoetermeer.nl
Ostend-Bruges International Airport, 2008. Jaarverslag 2006. www.ost.aero
(06/02/08).
Pethick J., 2002. Estuarine and Tidal Wetland Restoration in the United Kingdom:
Policy Versus Practice. Restoration Ecology 10:431-437.
Plassendale NV, 2008. www.portofoostende/plassendale/
Port of Zeebrugge, 2008. Jaarverslag 2006. www.zeebruggeport.be
SAIL, 2004. Schéma d’Aménagement Intégré du Littoral. Indicators of sustainable
development in the SAIL coastal region.
STADIM, 2006. Gemiddelde woningprijzen Vlaanderen en Brussel 2006. Studies en
Advies in Immobiliën.
SVR, 2007. Gemeentelijke profielschetsen. Studiedienst van de Vlaamse Regering.
SVR, 2008. Lokale statistieken. Studiedienst van de Vlaamse Regering.
SWSE, 2005. Steunpunt Werk en Sociale Economie, Leuven.
Trouw K., van de Walle B., Suykens K., Wauters P., Keppers CH. & Martens C.,
2005. COMRISK – Flood Risk in Flanders/Zeeuws-Vlaanderen. CD-ROM GIS-
data, ‘overzicht_dijken.dbf’.
Van Bossuyt P., 2007. Kennisgeving MER Duurzaam Zwin - Bedenkingen vanuit de
landbouw in het kader van het openbaar onderzoek. Studiedienst
Boerenbond, Leuven.
Vanden Bulcke M., 2004. Bekkenbeheerplan Brugse Polders. Drinkwater &
Watervoorziening - situering - Sectorale Analyse. www.circa.vlaanderen.be.
Van der Biest K., 2007. Fotodatabank terreinbezoeken kust juni-oktober 2007.
Van der Sande C., 2001. River Flood Damage Assessment using IKONOS Imagery.
In cooperation with European Commission, JRC, Space Applications Institute,
EGEO Unit, Natural Hazards Project, Flood Damage and Flood Hazard
Assessment, Ispra (Italy).
Vanneuville W., Maeghe K., De Mayer Ph., Mostaert F. & Bogaert P., 2002.
Risicobenadering bij waterbeheersplanning. Methodologie en case-study
Denderbekken. In opdracht van Ministerie van de Vlaamse Gemeenschap
LIN-AWZ, Afdeling Waterbouwkundig Laboratorium en Hydrologisch
Onderzoek.
Vanneuville W., Maddens R., Collard Ch., Bogaert P., De Maeyer Ph. & Antrop M.,
2006. Impact op mens en economie t.g.v. overstromingen bekeken in het licht
64
van wijzigende hydraulische condities, omgevingsfactoren en klimatologische
omstandigheden, studie uitgevoerd in opdracht van de Vlaamse
Milieumaatschappij, MIRA, MIRA/2006/02, UGent.
Verkeerstellingen, 2006. Verkeerstellingen in Vlaanderen met automatische
telapparaten, nr. 213. Agentschap voor Infrastructuur, Afdeling
Verkeerskunde, Vlaamse Overheid.
Verwaest T., Viaene P., Verstraeten, J. & Mostaert F., 2005. De zeespiegelstijging
meten, begrijpen en afblokken. De Grote Rede 15, december 2005.
Verwaest T., 2007. Zandbank ter hoogte van de Baai van Heist – Langjarige
Sedimentatie. Seminarie De zandbank te Heist, een boeiend fenomeen,
19/10/07, Knokke-Heist.
Verwaest T., Van Poucke Ph., Vanderkimpen P., Van der Biest K., Reyns J., Kellens
W. & Vanneuville W., 2008. Overstromingsrisico’s aan de Vlaamse kust –
evaluatie van de zeewering. Deel 1: Methodologie. WL Rapporten, 718/2A.
Waterbouwkundig Laboratorium & Universiteit Gent & Soresma-Haecon:
Borgerhout, België.
VLIZ Nieuwsbrieven, http://ww.vliz.be/ , 2001. Nieuwsbrief 4, december 2001.
“Strandhoofden als studieobjecten van ingenieurs en biologen”.
VLIZ Fotogallerij, 2007. www.vliz.be Fig.8: “Bescherming van de duinvoet in De
Haan”. Fig. 9: “Duinen te Vosseslag”
Vriesacker M., Platteau J. & Van Gijseghem D., 2007. Landbouw in zakformaat.
Land- en tuinbouw in Vlaanderen 2007. Beleidsdomein Landbouw en Visserij,
afdeling Monitoring en Studie Brussel.
Wikipedia, 2008. Artikels ‘Dudzele’, ‘Lissewege’, ‘Oostkerke’, ‘Stalhille’.
Waterbouwkundig Laboratorium Flanders Hydraulics Research Berchemlei 115 B-2140 Antwerp Tel. +32 (0)3 224 60 35 Fax +32 (0)3 224 60 36 E-mail: [email protected] http://www.watlab.be
Vlaamse overheidDepartement Mobiliteit en Openbare Werken
Berchemlei 115 - B-2140 Antwerpenafdeling Waterbouwkundig Laboratorium
FLA
ND
ER
SH
YD
RA
ULIC
SR
ES
EA
RC
H WATERBOUWKUNDIGLABORATORIUM
FLANDERSHYDRAULICSRESEARCH
HYDRAULICA
NAUTICA
WATERBEHEER


![Freshwater management in the Scheldt basin and ...WATERBOUWKUNDIG LABORATORIUM MINISTERIE VAN DE VLAAMSE GEMEENSCHAP 0 2 4 6 8 10 12 14 16 0,1 1 10 1 Herhalingsperiode [jaar] Afvoer](https://static.fdocuments.in/doc/165x107/60fbbee82812b2472d770390/freshwater-management-in-the-scheldt-basin-and-waterbouwkundig-laboratorium.jpg)