Kosinksi & Lipsky (2010) - Current Medical Management of Diabetic Foot Infections
Upload
trinhkhanhCategory
view
220download
5
New York City Department of Health and Mental Hygiene Bureau of Communicable Disease
and
New York City Department of Environmental Protection
Bureau of Water Supply
Waterborne Disease Risk Assessment Program
2010 Annual Report
March 31, 2011
Prepared in accordance with Section 8.1 of the July 2007 United States Environmental Protection Agency Filtration Avoidance Determination
Prepared by: Lisa Alleyne, MPA (DOHMH)
Sharon Balter, MD (DOHMH/DEP) Daniel Cimini, RN, CPH (DOHMH) Anne Seeley, MPH (DEP)
With: David Lipsky, Nimi Kadar, Trang Nguyen, Marc Paladini, Stacey Wright-Woolcock, and other members of the Waterborne Disease Risk Assessment Program Team

THE WATERBORNE DISEASE RISK ASSESSMENT PROGRAM TEAM
The Waterborne Disease Risk Assessment Program (WDRAP) is an interagency program involving the New York City Departments of Environmental Protection and Health and Mental Hygiene
New York City Department of Health and Mental Hygiene (DOHMH) Bureau of Communicable Disease
125 Worth Street, CN-22A, New York, NY 10013 Marcelle Layton, M.D., Assistant Commissioner Don Weiss, M.D., M.P.H., Medical Director, Surveillance & Data Analysis Unit Sharon Balter, M.D., Medical Director (WDRAP Coordinator for DOHMH) Daniel Cimini, R.N., C.P.H., City Research Scientist (WDRAP Asst. Coordinator) Lisa Alleyne, M.P.A., Public Health Epidemiologist Bureau of Communicable Disease: Erlinda Amoroso, Michael Antwi, Fazlul Chowdhury, Paula Del Rosso, Marie Dorsinville, Muhammad Iftekharuddin, Lucretia Jones, Nimi Kadar, Yin Ling Leung, Michelle Middleton, Ann Murray, Trang Nguyen, Daniel Osuagwu, Marc Paladini, Jose Poy, Anna Smorodina, Rajmohan Sunkara, Stacey Wright-Woolcock
New York City Department of Environmental Protection (DEP) Bureau of Water Supply
59-17 Junction Blvd., 20th Floor, Flushing, NY 11373-5108.
David Lipsky, Ph.D., Chief, Distribution Water Quality Science & Research Division Anne Seeley, M.P.H., Section Chief, Health Assessment & Policy Coordination (WDRAP Coordinator for DEP)
========================================================= Additional copies of WDRAP reports are available from Anne Seeley at the DEP address listed above, by phone (718-595-5346), or E-mail: [email protected] Copies of the questionnaires used for disease surveillance are available from Daniel Cimini at the DOHMH address listed above, by phone (212-788-4233), or E-mail: [email protected] The authors wish to acknowledge the dedication of the other members of the Waterborne Disease Risk Assessment Program Team, and the assistance of Fran Guerriero (DEP) and Giselle Merizalde (DOHMH).
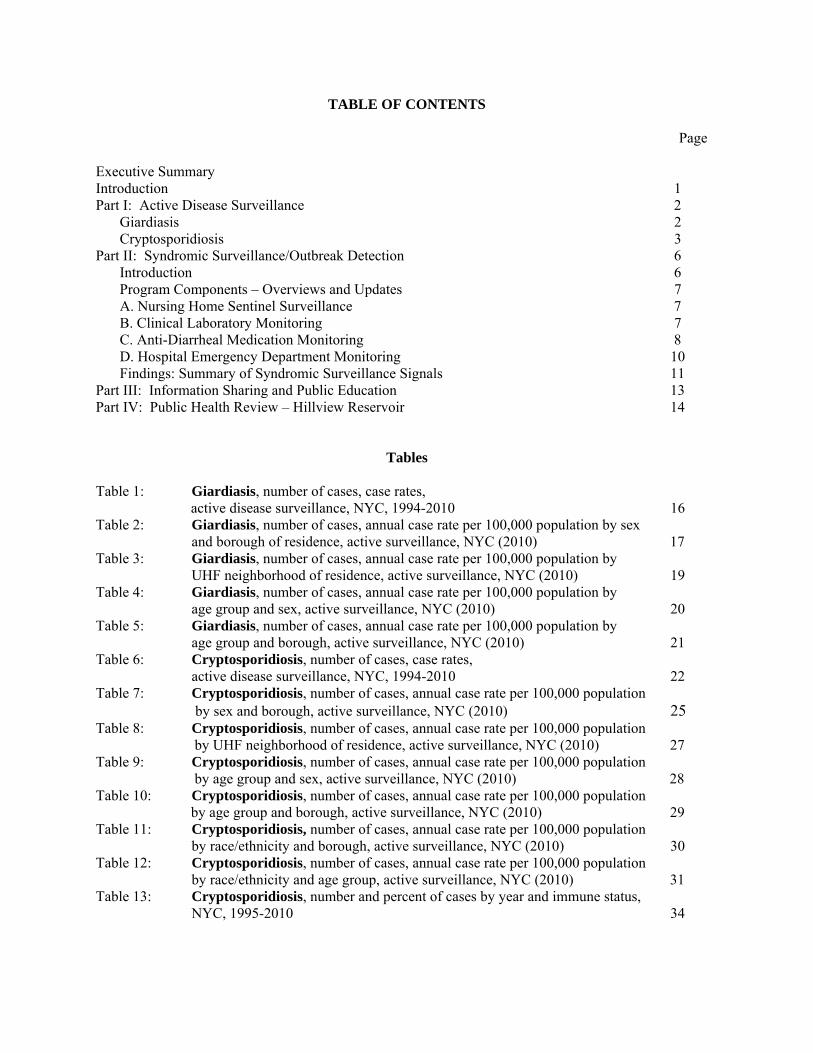
TABLE OF CONTENTS Page Executive Summary Introduction 1 Part I: Active Disease Surveillance 2 Giardiasis 2 Cryptosporidiosis 3 Part II: Syndromic Surveillance/Outbreak Detection 6 Introduction 6 Program Components – Overviews and Updates 7 A. Nursing Home Sentinel Surveillance 7 B. Clinical Laboratory Monitoring 7 C. Anti-Diarrheal Medication Monitoring 8 D. Hospital Emergency Department Monitoring 10 Findings: Summary of Syndromic Surveillance Signals 11 Part III: Information Sharing and Public Education 13 Part IV: Public Health Review – Hillview Reservoir 14
Tables Table 1: Giardiasis, number of cases, case rates, active disease surveillance, NYC, 1994-2010 16 Table 2: Giardiasis, number of cases, annual case rate per 100,000 population by sex and borough of residence, active surveillance, NYC (2010) 17 Table 3: Giardiasis, number of cases, annual case rate per 100,000 population by
UHF neighborhood of residence, active surveillance, NYC (2010) 19 Table 4: Giardiasis, number of cases, annual case rate per 100,000 population by
age group and sex, active surveillance, NYC (2010) 20 Table 5: Giardiasis, number of cases, annual case rate per 100,000 population by age group and borough, active surveillance, NYC (2010) 21 Table 6: Cryptosporidiosis, number of cases, case rates,
active disease surveillance, NYC, 1994-2010 22 Table 7: Cryptosporidiosis, number of cases, annual case rate per 100,000 population by sex and borough, active surveillance, NYC (2010) 25 Table 8: Cryptosporidiosis, number of cases, annual case rate per 100,000 population by UHF neighborhood of residence, active surveillance, NYC (2010) 27 Table 9: Cryptosporidiosis, number of cases, annual case rate per 100,000 population by age group and sex, active surveillance, NYC (2010) 28 Table 10: Cryptosporidiosis, number of cases, annual case rate per 100,000 population by age group and borough, active surveillance, NYC (2010) 29 Table 11: Cryptosporidiosis, number of cases, annual case rate per 100,000 population by race/ethnicity and borough, active surveillance, NYC (2010) 30 Table 12: Cryptosporidiosis, number of cases, annual case rate per 100,000 population by race/ethnicity and age group, active surveillance, NYC (2010) 31 Table 13: Cryptosporidiosis, number and percent of cases by year and immune status, NYC, 1995-2010 34

Table 14: Percentage of interviewed cryptosporidiosis case-patients reporting selected potential risk exposures before disease onset, persons with HIV/AIDS, NYC, 1995-2010 35 Table 15: Percentage of interviewed cryptosporidiosis case-patients reporting selected potential risk exposures before disease onset, immunocompetent persons, NYC, 1995-2010 36 Table 16: Percentage of interviewed cryptosporidiosis case-patients by type of tap water exposure before disease onset, persons with HIV/AIDS, NYC, 1995-2010 37 Table 17: Percentage of interviewed cryptosporidiosis case-patients by type of tap water exposure before disease onset, immunocompetent persons, NYC, 1995-2010 38
Figures
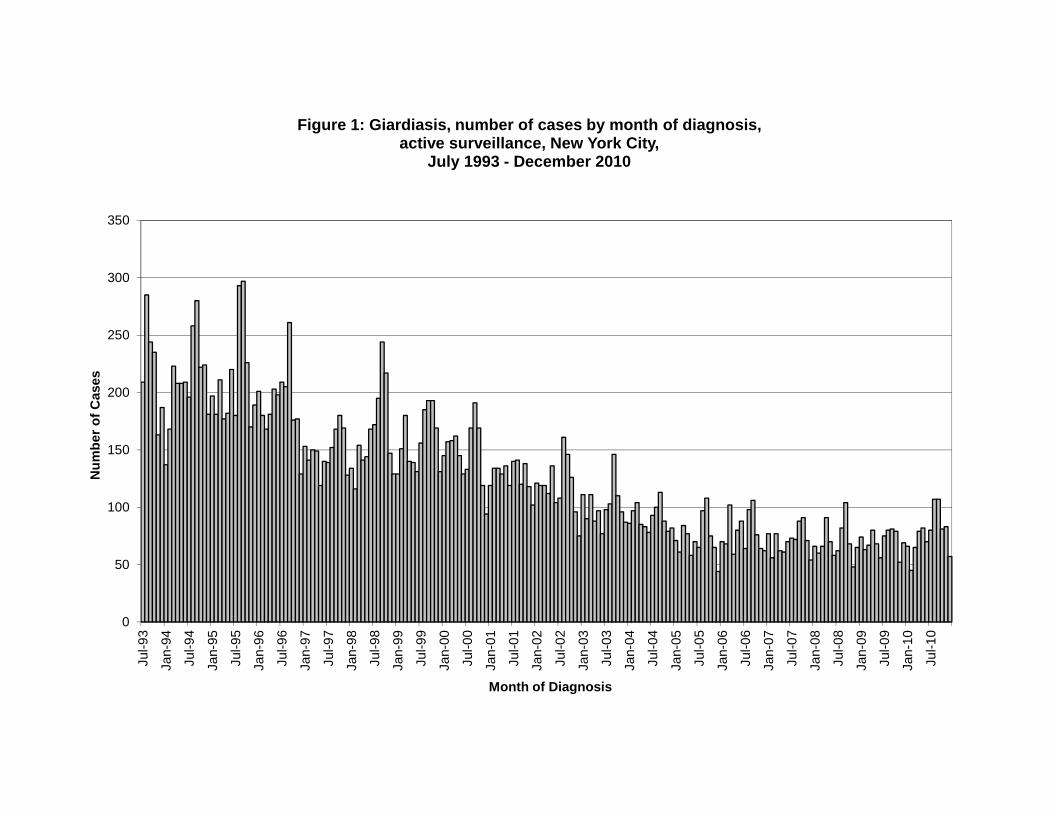
Figure 1: Giardiasis, number of cases by month of diagnosis, active surveillance, NYC, July 1993 - Dec. 2010 15 Figure 2: Cryptosporidiosis, number of cases by month of diagnosis, active surveillance, NYC, Nov. 1994 - Dec. 2010 23 Figure 3: Cryptosporidiosis, number of cases by month of onset, active surveillance, NYC, Jan. 1995 - Dec. 2010 24 Figure 4: Cryptosporidiosis, number of cases among persons living with HIV/AIDS by month of diagnosis, NYC, Jan. 1995 - Dec. 2010 32 Figure 5: Cryptosporidiosis, number of cases among immunocompetent persons by month of diagnosis, NYC, Jan. 1995 - Dec. 2010 33 Figure 6: Emergency Department Syndromic Surveillance, trends, visits for vomiting syndrome, NYC, Jan. 1 – Dec. 31, 2010 39 Figure 7: Emergency Department Syndromic Surveillance, trends, visits for diarrhea syndrome, NYC, Jan. 1 – Dec. 31, 2010 40 Figure 8: Signals for gastrointestinal illness, Syndromic Surveillance Systems, NYC, Jan. 1– June 30, 2010 41 Figure 9: Signals for gastrointestinal illness, Syndromic Surveillance Systems, NYC, July 1 – Dec. 31, 2010 42
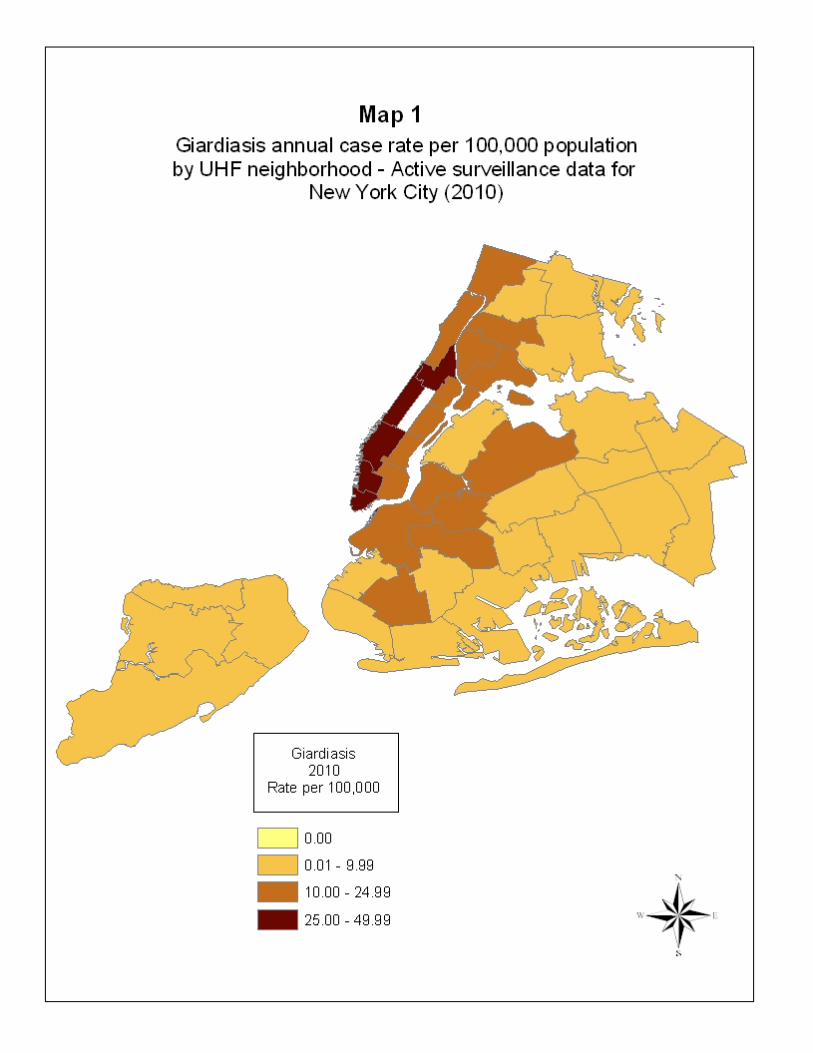
Maps Map 1: Giardiasis annual case rate per 100,000 population by UHF neighborhood, Active surveillance data, NYC (2010) 18 Map 2: Cryptosporidiosis annual case rate per 100,000 population by UHF neighborhood, Active surveillance data, NYC (2010) 26
Attachments
Attachment 1: DOHMH/CDC Recreational Water Illness Prevention Poster, “Healthy Swimming,” Distributed 2010 43
EXECUTIVE SUMMARY New York City’s Waterborne Disease Risk Assessment Program was established to: (a) obtain data on the rates of giardiasis and cryptosporidiosis, along with demographic and risk factor information on case-patients; (b) provide a system to track diarrheal illness to ensure rapid detection of any outbreaks; and (c) attempt to determine the contribution (if any) of tap water consumption to gastrointestinal disease. The program, jointly administered by the Department of Health and Mental Hygiene and the Department of Environmental Protection, began in 1993. This report provides an overview of program progress, and data collected, during 2010. ACTIVE DISEASE SURVEILLANCE Active disease surveillance for giardiasis and cryptosporidiosis began in July 1993 and November 1994, respectively, and continued through 2010. This report presents the number of cases and case rates for both diseases in 2010 (and includes data from past years for comparison). Also, demographic information for cases of giardiasis and cryptosporidiosis was gathered and is summarized in this report. Telephone interviews of cryptosporidiosis case-patients to gather potential risk exposure information continued, and selected results are presented. Giardiasis and cryptosporidiosis rates have been on a general downward trend over the years of this surveillance program. However, from 2009 to 2010 the giardiasis case rate increased from 10.1 per 100,000 population to 11.0 per 100,000 (922 cases), and the cryptosporidiosis case rate increased from 1.0 per 100,000 to 1.3 per 100,000 (107 cases). SYNDROMIC SURVEILLANCE / OUTBREAK DETECTION The tracking of sentinel populations or surrogate indicators of disease (“syndromic surveillance”) can be useful in assessing gastrointestinal (GI) disease trends in the general population. Such tracking programs provide greater assurance against the possibility that a citywide outbreak would remain undetected. In addition, such programs can potentially play a role in limiting the extent of an outbreak by providing an early indication of a problem so that control measures may be rapidly implemented.
The City maintains a number of distinct and complementary outbreak detection systems. One system monitors and assists in the investigation of GI outbreaks in sentinel nursing homes. Another system tracks the number of stool specimens submitted to participating clinical laboratories for microbiological testing. In March 2010, one of the two laboratories participating in this program discontinued operations. A third syndromic surveillance system utilizes hospital Emergency Department chief complaint logs to monitor for outbreaks. The City also utilizes two separate systems for monitoring sales of anti-diarrheal medications: one is known as the ADM system and the other as the OTC system. In March 2010 a number of enhancements were implemented in the ADM system. One outcome is that now both of NYC’s medication monitoring programs track anti-diarrheal medication sales daily, rather than one tracking sales daily and the other tracking sales weekly. A summary of syndromic surveillance findings for 2010 pertaining to GI illness is presented. One GI outbreak in a sentinel nursing home in January, apparently due to human calicivirus, and sustained citywide signals in the ED system in January and again in November and December, are consistent with annual gastrointestinal viral trends. There was no evidence of a drinking water-related outbreak in New York City.
INFORMATION SHARING AND PUBLIC EDUCATION Outreach and education efforts have continued. A presentation was made to graduate students at a school of public health in April 2010. Information on Cryptosporidium and Giardia continues to be available on New York City Department of Environmental Protection’s and New York City Department of Health and Mental Hygiene’s websites, including annual reports on program activities, fact sheets on giardiasis and cryptosporidiosis, and results from the Department of Environmental Protection’s source water protozoa monitoring program. Also, in 2010 the Department of Health and Mental Hygiene expanded upon Recreational Water Illness Prevention actions initially undertaken in 2008, including the development of a second “Healthy Swimming” poster that was distributed to NYC swimming pools during Health Department pool inspections and revision of a Recreational Water Illness Prevention webpage. PUBLIC HEALTH REVIEW – HILLVIEW RESERVOIR In September 2010, the Department of Health and Mental Hygiene Bureau of Communicable Disease and Bureau of Environmental Sciences and Engineering completed a review of public health issues related to the Hillview Reservoir, at the request of the Department of Environmental Protection. The topics covered in this review are summarized in Part IV of this report.

1
INTRODUCTION
New York City’s Waterborne Disease Risk Assessment Program (WDRAP) was developed and implemented to:
obtain data on the rates of giardiasis and cryptosporidiosis, along with demographic and risk factor information on case-patients;
provide a system to track diarrheal illness to ensure rapid detection of any outbreaks; and
attempt to determine the contribution (if any) of tap water consumption to gastrointestinal disease.
Two City agencies are involved in this effort: the Department of Environmental Protection (DEP) and the Department of Health and Mental Hygiene (DOHMH). In addition to participation by staff from both agencies, a special interagency unit, the Parasitic Disease Surveillance Unit, was established to implement major components of this program. In the year 2001, the staff of the Parasitic Disease Surveillance Unit was merged with staff from the DOHMH Bureau of Communicable Disease (BCD). Staff members employed by DEP and DOHMH now jointly work on WDRAP activities as well as on other communicable disease activities. This merger increases the efficiency of the DOHMH BCD but does not affect WDRAP operations. Following below is a summary of program highlights and data for the year 2010. For this report the population denominators used to calculate rates were obtained utilizing intercensal population estimates. For the years 1994 through 1999, intercensal population estimates per year were used based upon linear interpolation between the 1990 and 2000 US Census.1 For the years 2000 through 2009, intercensal population estimates for each year were used from data produced by DOHMH based on the US Census Bureau Population Estimate Program and housing unit data obtained from the NYC Department of City Planning.2 For 2010, the year 2009 intercensal population estimate was used because 2009 was the most recent year for which an intercensal population estimate was available. Because rates for the years 2000 through 2010 were calculated for this report using intercensal population estimates, they may differ from previously reported rates based on year 2000 US Census data. Other variations in data between this report and previous reports may be due to factors such as disease reporting delays, correction of errors, and refinements in data processing (for example, the removal of duplicate disease reports). All rates in this report are annual case rates. Caution must be exercised when interpreting rates based on very small case numbers.
Year 2000 US Census data included two race/ethnicity categories which had not been used in DOHMH disease surveillance data at that time. These race/ethnicity categories were: "Non-Hispanic of Single Race, other than White, Black/African American, Asian, Pacific Islander, American Indian and Alaskan Native" and "Non-Hispanic of Two or More Races." When determining intercensal estimates since 2000, the US Census Bureau Population Estimate Program retained the race/ethnicity category "Non-Hispanic of Two or More Races" but did not include the category "Non-Hispanic of Single Race, other than White, Black/African American, 1 See http://sasebiweb100.health.dohmh.nycnet/EpiQuery/Census/index.html 2 See http://sasebiweb100.health.dohmh.nycnet/EpiQuery/Census/index2001.html

2
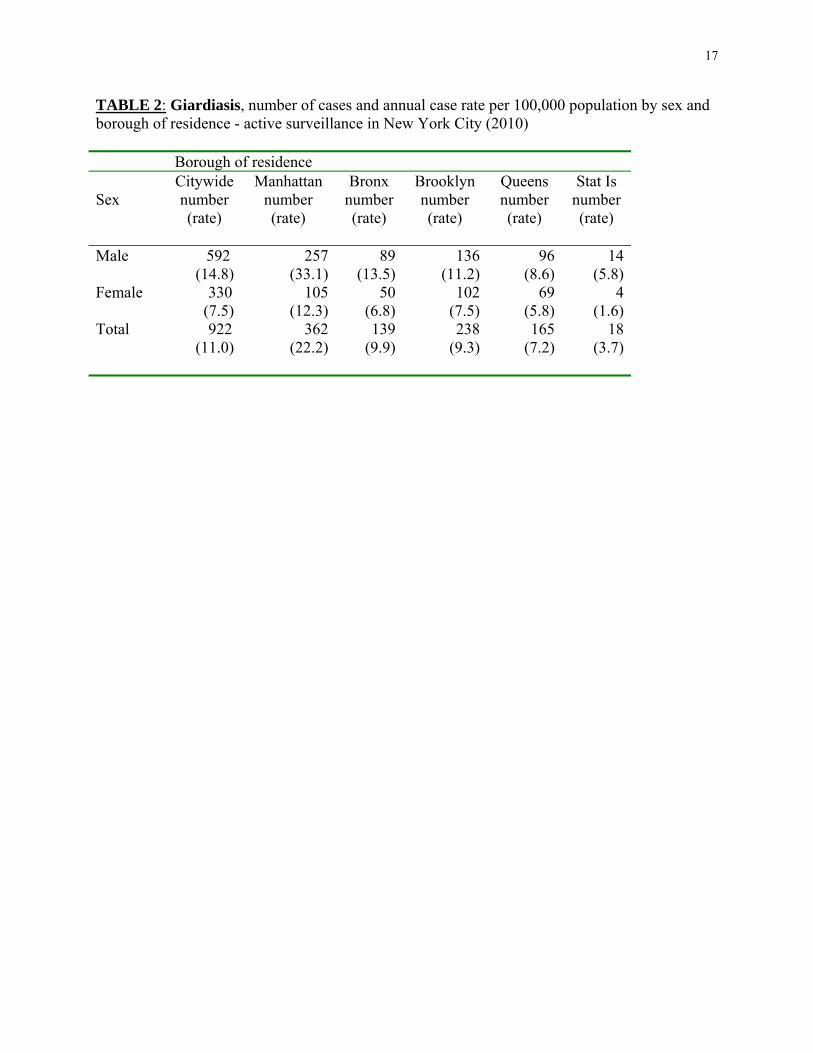
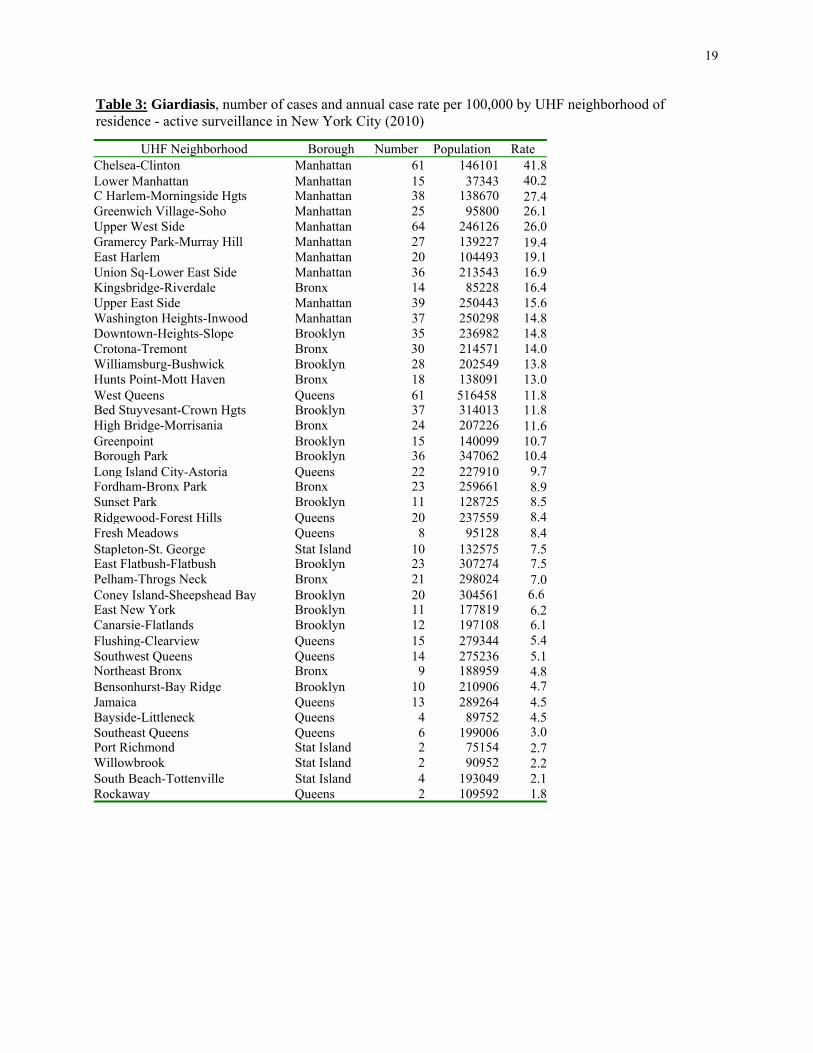
Asian, Pacific Islander, American Indian and Alaskan Native." In this report, race/ethnicity-specific case rates are based upon intercensal population estimates and include the race/ethnicity categories used by the US Census Bureau Population Estimate Program. For presentation of geographic data, United Hospital Fund (UHF) neighborhood of case-patient residence was used. New York City is divided on the basis of zip code into 42 UHF neighborhoods. Maps illustrating annual rates by UHF neighborhood are included in this report. PART I: ACTIVE DISEASE SURVEILLANCE Giardiasis New York City implemented a program of active surveillance for giardiasis in July 1993 to ensure complete reporting of all laboratory-diagnosed cases. Active laboratory surveillance (regular site visits or telephone contact with laboratories) continued in 2010. Also, mailings or telephone calls continued to be made to health care providers and laboratories to obtain basic demographic information missing from case reports. Case rates and basic demographic findings were compiled and reported on a quarterly basis through July 2002. Beginning January 2003, rates and demographic findings have been compiled on a semi-annual basis. In January 2011, active laboratory surveillance for giardiasis and cryptosporidiosis was discontinued. This program change occurred after the time frame covered by this annual report; however, it is mentioned here for informational purposes. By January 2011 almost all NYC clinical laboratories were fully enrolled in the Electronic Clinical Laboratory Reporting System (ECLRS), which was developed in order to ensure complete and rapid reporting of conditions such as giardiasis and cryptosporidiosis. Additionally, staffing was reduced this past year and, given the implementation of ECLRS, DOHMH and DEP decided to discontinue active disease surveillance (site visits or telephone contact with laboratories to obtain cases). We do not anticipate that this change will have a significant impact on the program or the completeness or quality of surveillance data. Data in this report were collected using active surveillance concurrent with ECLRS. During 2010, a total of 922 cases of giardiasis were reported to DOHMH and the annual case rate was 11.0 per 100,000. Although annual case numbers increased 9.2% from 2009 to 2010, overall from 1994 to 2010 annual case numbers declined 63.3% (see Table 1 & Figure 1). The following provides some highlights from the active surveillance data for giardiasis among New York City residents from January 1 through December 31, 2010. Additional data are presented in the tables, figures and maps that appear later in this report. Borough of case-patient residence Borough of case-patient residence was known for all 922 giardiasis case-patients who resided in New York City. In addition, there was 1 giardiasis case-patient for whom city of residence was unknown, and that case-patient was not included in this report. Manhattan had the highest borough-specific annual case rate (22.2 cases per 100,000) (Table 2). The highest UHF
3
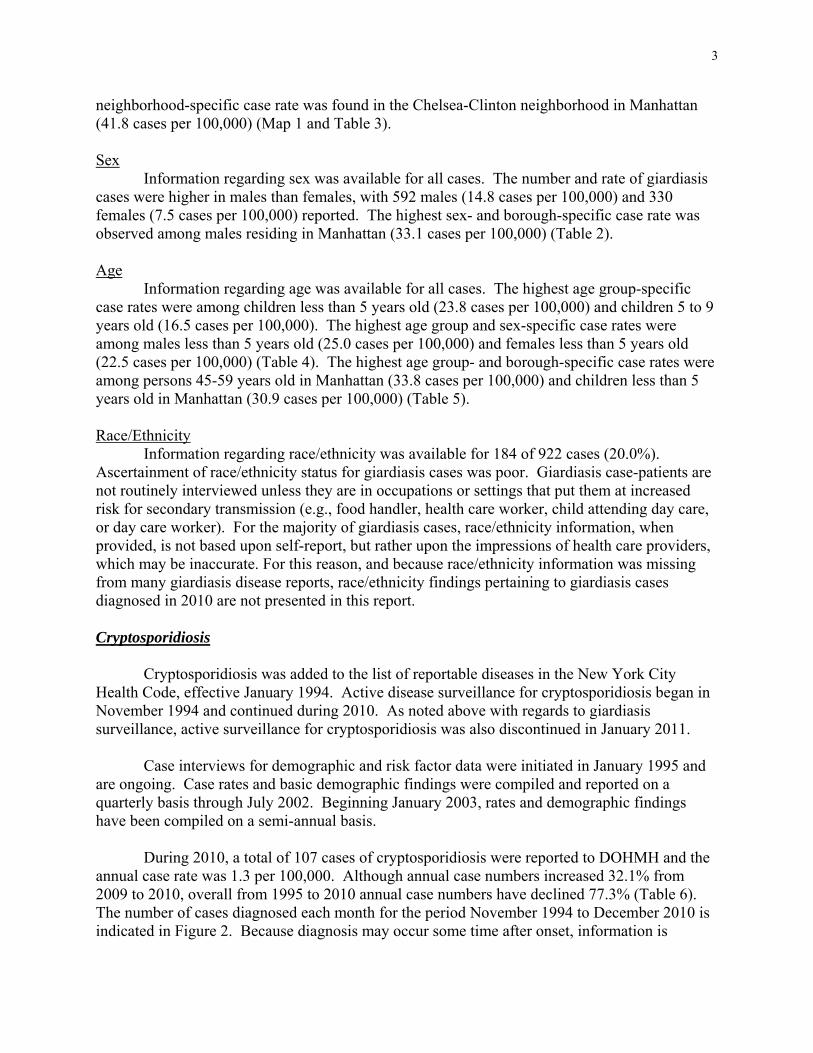
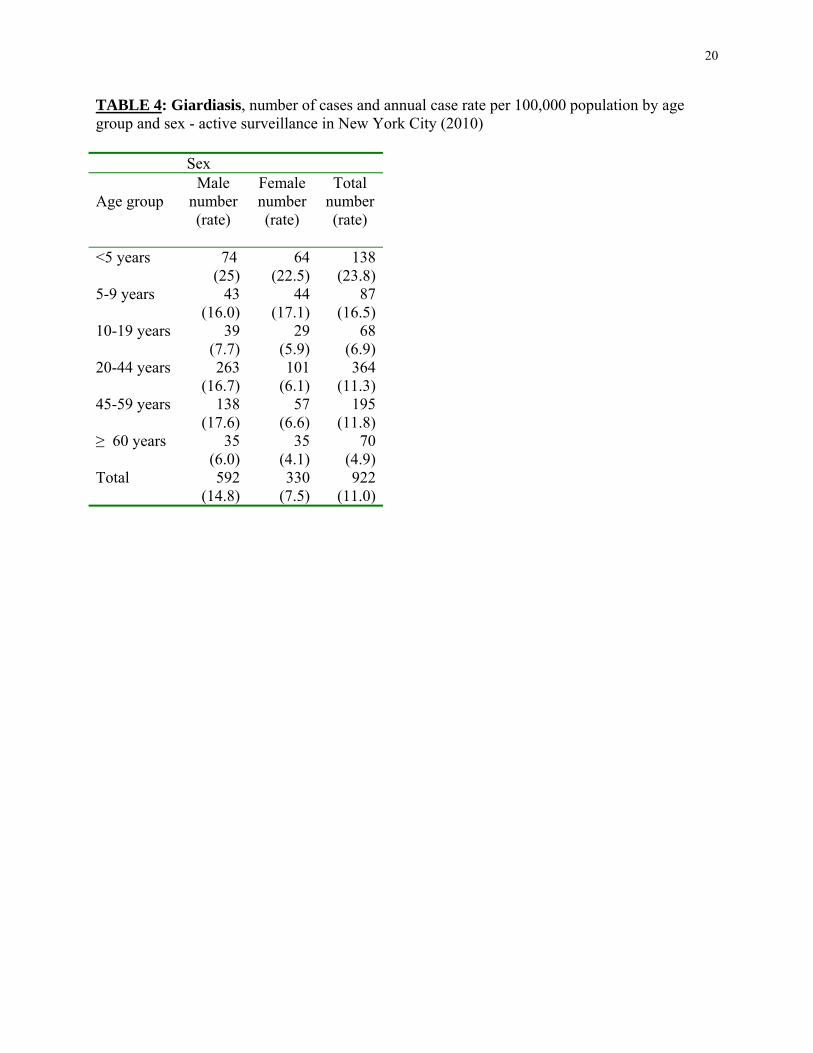
neighborhood-specific case rate was found in the Chelsea-Clinton neighborhood in Manhattan (41.8 cases per 100,000) (Map 1 and Table 3). Sex Information regarding sex was available for all cases. The number and rate of giardiasis cases were higher in males than females, with 592 males (14.8 cases per 100,000) and 330 females (7.5 cases per 100,000) reported. The highest sex- and borough-specific case rate was observed among males residing in Manhattan (33.1 cases per 100,000) (Table 2). Age Information regarding age was available for all cases. The highest age group-specific case rates were among children less than 5 years old (23.8 cases per 100,000) and children 5 to 9 years old (16.5 cases per 100,000). The highest age group and sex-specific case rates were among males less than 5 years old (25.0 cases per 100,000) and females less than 5 years old (22.5 cases per 100,000) (Table 4). The highest age group- and borough-specific case rates were among persons 45-59 years old in Manhattan (33.8 cases per 100,000) and children less than 5 years old in Manhattan (30.9 cases per 100,000) (Table 5). Race/Ethnicity Information regarding race/ethnicity was available for 184 of 922 cases (20.0%). Ascertainment of race/ethnicity status for giardiasis cases was poor. Giardiasis case-patients are not routinely interviewed unless they are in occupations or settings that put them at increased risk for secondary transmission (e.g., food handler, health care worker, child attending day care, or day care worker). For the majority of giardiasis cases, race/ethnicity information, when provided, is not based upon self-report, but rather upon the impressions of health care providers, which may be inaccurate. For this reason, and because race/ethnicity information was missing from many giardiasis disease reports, race/ethnicity findings pertaining to giardiasis cases diagnosed in 2010 are not presented in this report. Cryptosporidiosis Cryptosporidiosis was added to the list of reportable diseases in the New York City Health Code, effective January 1994. Active disease surveillance for cryptosporidiosis began in November 1994 and continued during 2010. As noted above with regards to giardiasis surveillance, active surveillance for cryptosporidiosis was also discontinued in January 2011. Case interviews for demographic and risk factor data were initiated in January 1995 and are ongoing. Case rates and basic demographic findings were compiled and reported on a quarterly basis through July 2002. Beginning January 2003, rates and demographic findings have been compiled on a semi-annual basis. During 2010, a total of 107 cases of cryptosporidiosis were reported to DOHMH and the annual case rate was 1.3 per 100,000. Although annual case numbers increased 32.1% from 2009 to 2010, overall from 1995 to 2010 annual case numbers have declined 77.3% (Table 6). The number of cases diagnosed each month for the period November 1994 to December 2010 is indicated in Figure 2. Because diagnosis may occur some time after onset, information is

4
collected in the interview regarding date of symptom onset. The date of onset can be used more accurately than date of diagnosis to estimate when case-patients were likely exposed to Cryptosporidium. The number of cryptosporidiosis cases by month of onset for the period January 1995 to December 2010 is presented in Figure 3.
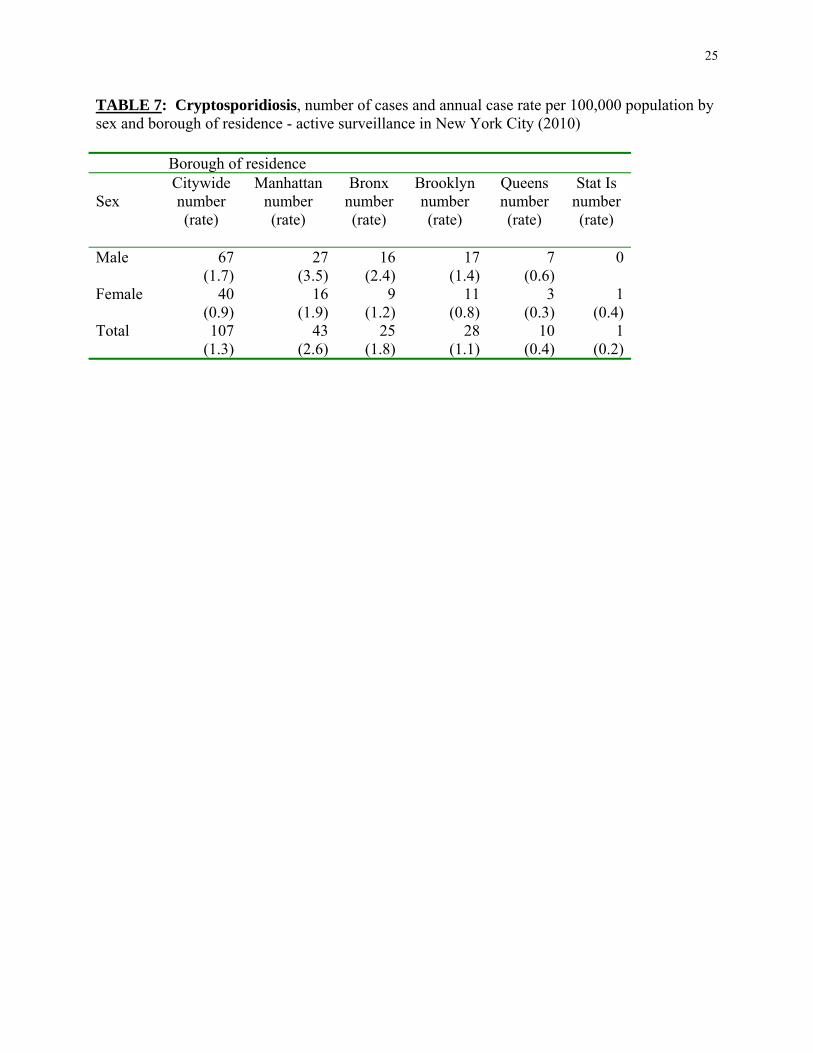
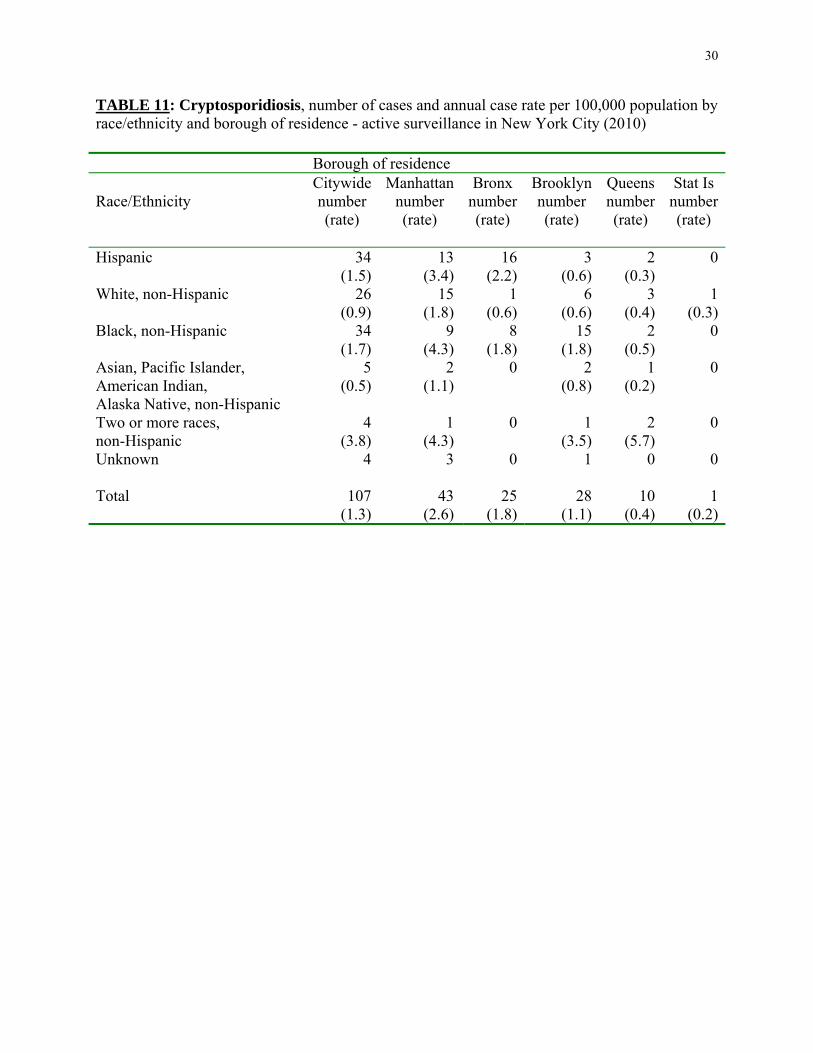
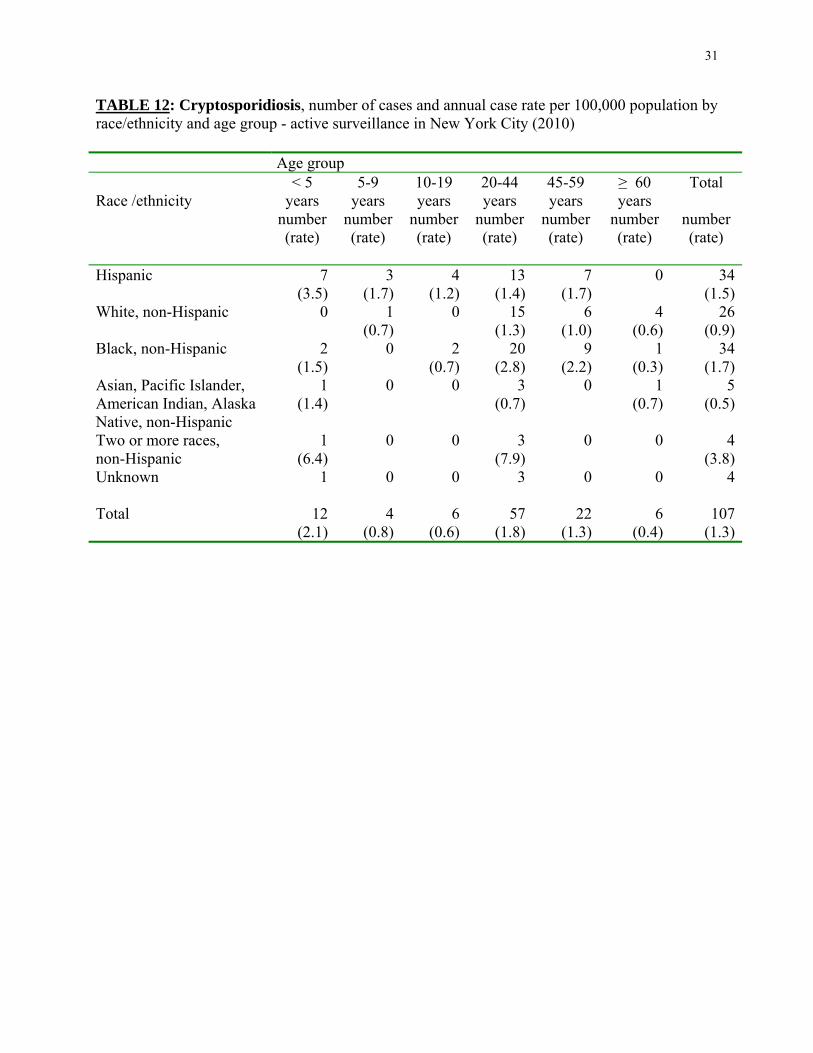
The following provides some highlights from the active surveillance data for cryptosporidiosis among New York City residents from January 1 through December 31, 2010. Additional data are presented in the tables, figures and maps that appear later in this report. Borough of case-patient residence Information on borough of residence was available for all cases of cryptosporidiosis. Manhattan had the highest borough-specific annual case rate (2.6 cases per 100,000) (Table 7). The highest UHF neighborhood-specific case rate was in the Central Harlem-Morningside Heights neighborhood in Manhattan (4.3 cases per 100,000) (Map 2 and Table 8). Sex Information regarding sex was available for all cases. The number and rate of cryptosporidiosis cases were higher in males than females, with 67 males (1.7 cases per 100,000) and 40 females (0.9 cases per 100,000) reported. The borough- and sex-specific case rate was highest for males in Manhattan (3.5 cases per 100,000) (Table 7). Age Information regarding age was available for all cases. The highest age group-specific case rates were observed in children less than 5 years old (2.1 cases per 100,000) and in persons 20-44 years old (1.8 cases per 100,000). The highest age group- and sex-specific case rates were in males less than 5 years old (2.4 cases per 100,000) and males 20-44 years old (2.3 cases per 100,000) (Table 9). The highest age group and borough-specific case rates occurred in children less than 5 years old in the Bronx (4.5 cases per 100,000), in children less than 5 years old in Manhattan (4.3 cases per 100,000) and in children 5-9 years old in Manhattan (4.0 cases per 100, 000) (Table 10). Race/Ethnicity Race/ethnicity information was available for 103 of 107cases (96.3%). The racial/ethnic group-specific case rate was highest among non-Hispanics of two or more races (3.8 cases per 100,000); however, there were only 4 cases in this race/ethnicity group. The next highest racial/ethnic group-specific case rate occurred among Black non-Hispanics (1.7 cases per 100,000, 34 cases). Non-Hispanics of two or more races in the Queens had the highest race/ethnicity- and borough-specific case rate (2 cases, 5.7 cases per 100,000), followed by non-Hispanics of two or more races in Manhattan (1 case, 4.3 cases per 100,000), and Black non-Hispanics in Manhattan (9 cases, 4.3 cases per 100, 000) (Table 11). The highest age group- and race/ethnicity-specific case rates occurred among 20-44 year old non-Hispanics of two or more races (3 cases, 7.9 cases per 100,000), non-Hispanic children less than 5 years old of two or more races (1 case, 6.4 cases per 100,000), Hispanic children less than 5 years old (7 cases, 3.5 cases per 100,000), and 20-44 year old Black non-Hispanics (20 cases, 2.8 cases per 100,000). (Table 12).
5
Cryptosporidiosis and Immune Status
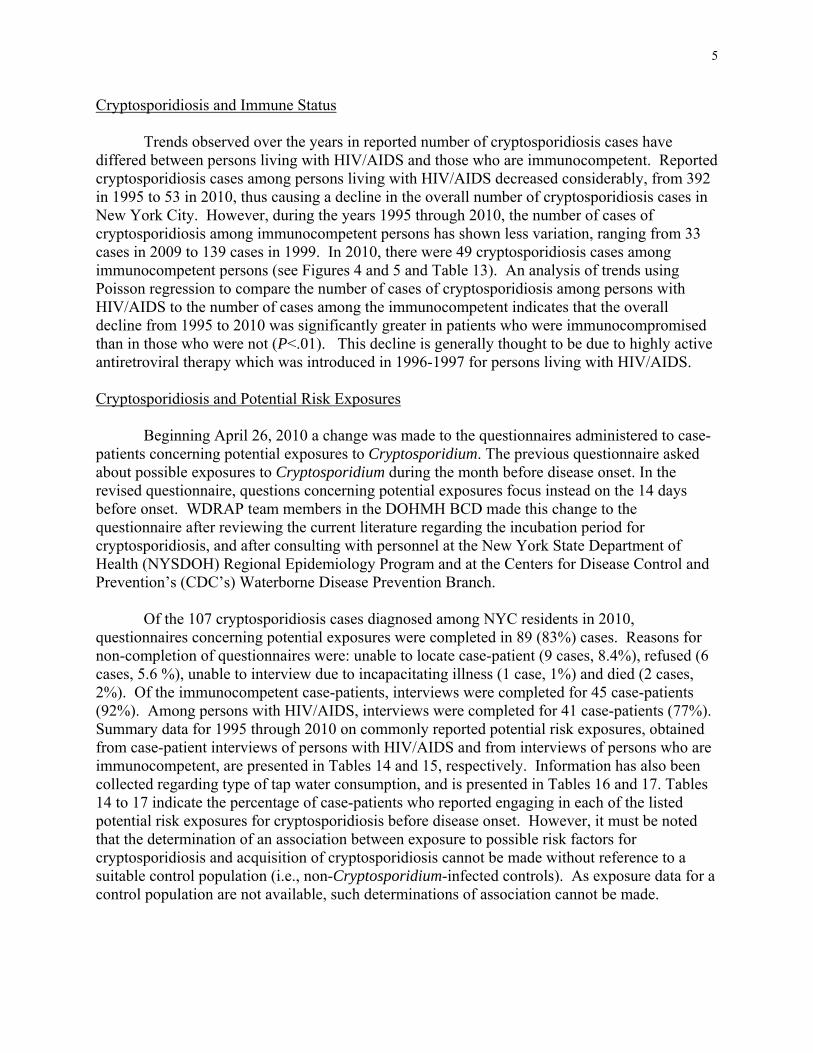
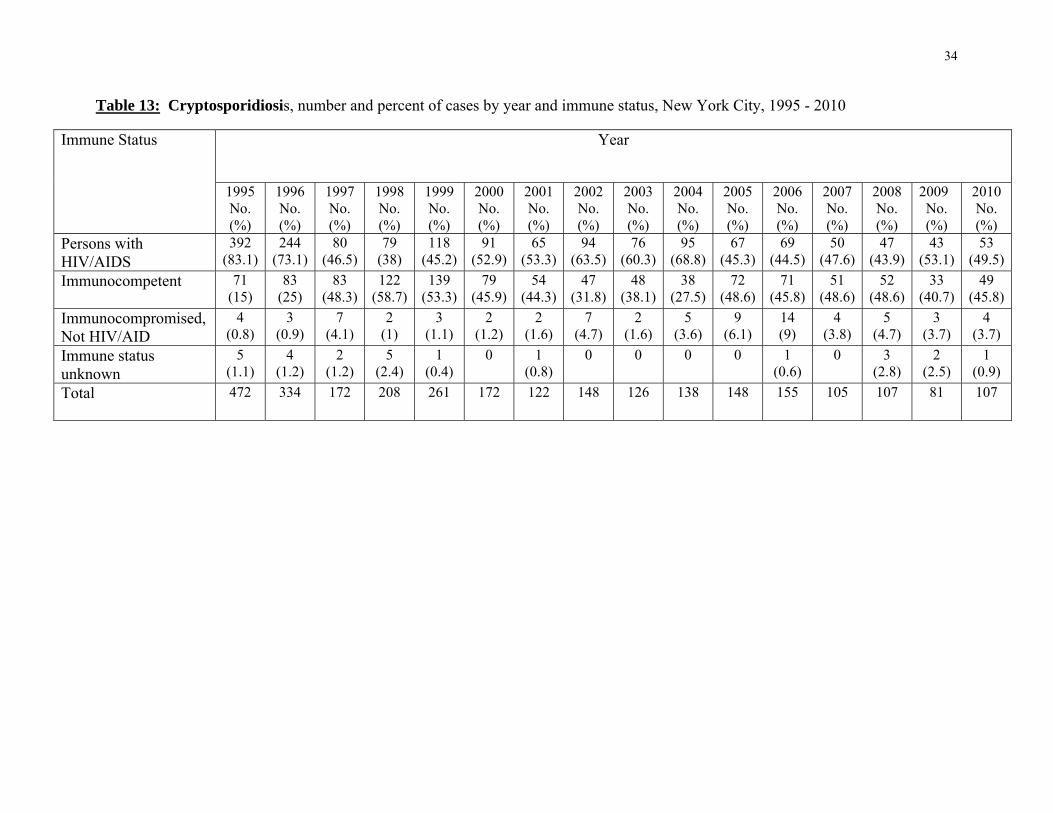
Trends observed over the years in reported number of cryptosporidiosis cases have differed between persons living with HIV/AIDS and those who are immunocompetent. Reported cryptosporidiosis cases among persons living with HIV/AIDS decreased considerably, from 392 in 1995 to 53 in 2010, thus causing a decline in the overall number of cryptosporidiosis cases in New York City. However, during the years 1995 through 2010, the number of cases of cryptosporidiosis among immunocompetent persons has shown less variation, ranging from 33 cases in 2009 to 139 cases in 1999. In 2010, there were 49 cryptosporidiosis cases among immunocompetent persons (see Figures 4 and 5 and Table 13). An analysis of trends using Poisson regression to compare the number of cases of cryptosporidiosis among persons with HIV/AIDS to the number of cases among the immunocompetent indicates that the overall decline from 1995 to 2010 was significantly greater in patients who were immunocompromised than in those who were not (P<.01). This decline is generally thought to be due to highly active antiretroviral therapy which was introduced in 1996-1997 for persons living with HIV/AIDS.
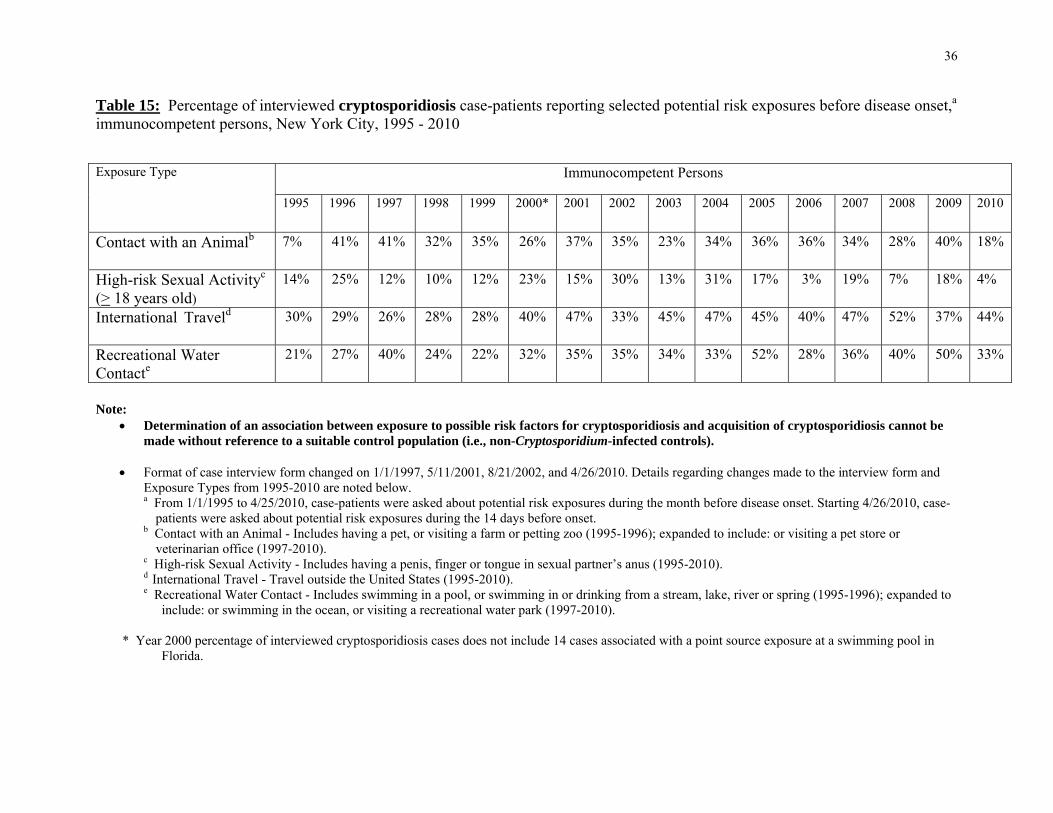
Cryptosporidiosis and Potential Risk Exposures Beginning April 26, 2010 a change was made to the questionnaires administered to case-patients concerning potential exposures to Cryptosporidium. The previous questionnaire asked about possible exposures to Cryptosporidium during the month before disease onset. In the revised questionnaire, questions concerning potential exposures focus instead on the 14 days before onset. WDRAP team members in the DOHMH BCD made this change to the questionnaire after reviewing the current literature regarding the incubation period for cryptosporidiosis, and after consulting with personnel at the New York State Department of Health (NYSDOH) Regional Epidemiology Program and at the Centers for Disease Control and Prevention’s (CDC’s) Waterborne Disease Prevention Branch.
Of the 107 cryptosporidiosis cases diagnosed among NYC residents in 2010,
questionnaires concerning potential exposures were completed in 89 (83%) cases. Reasons for non-completion of questionnaires were: unable to locate case-patient (9 cases, 8.4%), refused (6 cases, 5.6 %), unable to interview due to incapacitating illness (1 case, 1%) and died (2 cases, 2%). Of the immunocompetent case-patients, interviews were completed for 45 case-patients (92%). Among persons with HIV/AIDS, interviews were completed for 41 case-patients (77%). Summary data for 1995 through 2010 on commonly reported potential risk exposures, obtained from case-patient interviews of persons with HIV/AIDS and from interviews of persons who are immunocompetent, are presented in Tables 14 and 15, respectively. Information has also been collected regarding type of tap water consumption, and is presented in Tables 16 and 17. Tables 14 to 17 indicate the percentage of case-patients who reported engaging in each of the listed potential risk exposures for cryptosporidiosis before disease onset. However, it must be noted that the determination of an association between exposure to possible risk factors for cryptosporidiosis and acquisition of cryptosporidiosis cannot be made without reference to a suitable control population (i.e., non-Cryptosporidium-infected controls). As exposure data for a control population are not available, such determinations of association cannot be made.
6
Though no conclusions about association can be reached, in an attempt to assess if there are any patterns of interest, data has been compared between patients who are immunocompromised due to HIV/AIDS and patients who are immunocompetent. Looking at four potential risk categories from Tables 14 and 15 using the chi-square test for comparison of data since 2001, the following results were observed. Patients who were immunocompetent were significantly more likely to report international travel (P<.01 all years except 2009, P<.05), and to report exposure to recreational water in all years except 2003, 2006, and 2007 (2001-2002, P<.01; 2003, P=.17; 2004, P<.05; 2005, P<.01; 2006, P=.24; 2007, P=.06; 2008, P<.05; 2009-2010, P<.01). There was no statistically significant difference between these two groups in the proportion of cases reporting animal contact in 2001 to 2010, or reporting high-risk sex in 2001 to 2005, 2007, and 2009 to 2010. In 2006 and 2008, the proportion of cases reporting high-risk sex was significantly higher among persons with HIV/AIDS than among immunocompetent persons (P<.01). It should be noted that high-risk sex in this context refers to having a penis, finger or tongue in a partner’s anus. Information about sexual practices is gathered via phone interview and may not be reliable. These data indicate that immunocompetent case-patients are more likely to travel internationally and have recreational water exposure than immunocompromised case-patients. International travel and exposure to recreational water may be more likely risk factors for the acquisition of cryptosporidiosis in the immunocompetent group. However, as noted above, the extent to which these risk factors may have been associated with cryptosporidiosis cannot be determined without comparison to a control population. PART II: SYNDROMIC SURVEILLANCE / OUTBREAK DETECTION Introduction
The tracking of sentinel populations or surrogate indicators of disease (“syndromic surveillance”) can be useful in assessing gastrointestinal (GI) disease trends in the general population. Such tracking programs provide greater assurance against the possibility that a citywide outbreak would remain undetected. In addition, such programs can potentially play a role in limiting the extent of an outbreak by providing an early indication of a problem so that control measures may be rapidly implemented. Over the past several years, the City has established and maintained a number of distinct and complementary outbreak detection systems. One system monitors and assists in the investigation of GI outbreaks in sentinel nursing homes. Another monitors the number of stool specimens submitted to participating clinical laboratories for microbiological testing, and a third system utilizes hospital Emergency Department chief complaint logs to monitor for outbreaks. The City also utilizes two separate systems for monitoring sales of anti-diarrheal medications: one is known as the ADM system and the other as the OTC system. In March 2010 a number of enhancements were implemented in the ADM system. One outcome is that now both of NYC’s medication monitoring programs track anti-diarrheal medication sales daily, rather than one tracking sales daily and the other tracking sales weekly. The enhancements implemented to NYC’s ADM system are summarized below under “Program Components – Overviews and Updates,” Section C. All systems rely upon the voluntary participation of the organizations providing the syndromic data. A summary of syndromic surveillance findings pertaining to GI illness for 2010 is provided in the final section of this part, on pages 11 to 13.
7
Program Components – Overviews and Updates
A. Nursing Home Sentinel Surveillance The nursing home surveillance system began in March 1997 and was significantly
modified in August 2002. Under the current protocol, when a participating nursing home notes an outbreak of gastrointestinal illness that is legally reportable to the New York State Department of Health (NYSDOH), the nursing home also notifies designated WDRAP team members working in the DOHMH BCD. Such an outbreak is defined as onset of diarrhea and/or vomiting involving 3 or more patients on a single ward/unit within a 7-day period, or more than the expected (baseline) number of cases within a single facility. All participating nursing homes have been provided with stool collection kits in advance. When such an outbreak is noted, specimens are to be collected for testing for bacterial culture and sensitivity, ova and parasites, Cryptosporidium and viruses.
Beginning April 19, 2010, a change was made to the sentinel nursing home protocol,
allowing for the collection of stool specimens for Clostridium difficile toxin testing. Though C. difficile is not a waterborne pathogen, the addition of this testing option addressed a need expressed by infection control practitioners in the nursing homes, and was intended to help ensure compliance with the sentinel nursing home protocol.
DOHMH BCD staff facilitates transportation of the specimens to the City’s Public Health
Laboratory. Testing for culture and sensitivity, ova and parasites, and Cryptosporidium occurs at the Public Health Laboratory. If preliminary tests for bacteria and parasites are negative, or if indicated by the clinical and epidemiological characteristics of the outbreak, specimens are sent to the NYSDOH Wadsworth Center laboratories for viral testing and C. difficile toxin testing. There are currently eight nursing homes participating in the program. Three are in Manhattan, two are in the Bronx, two are in Queens, and one is in Brooklyn. As feedback for their role in outbreak detection, participating nursing homes are provided with copies of Waterborne Disease Risk Assessment Program semi-annual and annual reports.
In November and December 2010, a WDRAP team member from DOHMH BCD made site visits to all eight nursing homes participating in the Nursing Home Sentinel Surveillance system. During the site visits, the DOHMH staff member reviewed with nursing administration or infection control staff the rationale for the program and program protocol. In addition, the DOHMH staff member verified that the nursing homes had adequate stool collection supplies on hand. All participating nursing homes are visited at least once a year to help ensure compliance with the program protocol. B. Clinical Laboratory Monitoring
The number of stool specimens submitted to clinical laboratories for bacterial and parasitic testing also provides information on gastrointestinal illness trends in the population. Participating laboratories transmit data by fax or by telephone report to DOHMH’s BCD indicating the number of stool specimens examined per day for: (a) bacterial culture and sensitivity, (b) ova and parasites, and (c) Cryptosporidium.
8
Two clinical laboratories (identified here as “Laboratory A” and “Laboratory B”) were participating in this program until March 10, 2010. On that day, Laboratory B discontinued operations. The last day Laboratory B submitted bacterial stool specimen data was on March 3, and the last day of parasitology submission data was on March 9. Laboratory B closed because the health maintenance organization (HMO) which submitted the vast majority of specimens to the laboratory merged with another HMO in order to create a single for-profit public company. The other HMO submitted stool specimens to a different clinical laboratory. That laboratory is Laboratory A, the other lab participating in the Clinical Laboratory Monitoring Program. After the two HMOs merged to form one company, the decision was made to have all specimens go to Laboratory A. It was therefore no longer financially feasible for Laboratory B to continue to test clinical specimens. Clinical Laboratory Monitoring stool specimen submission data which previously would have been received from Laboratory B is now included in data received from Laboratory A. Therefore we believe that the data is essentially the same although it comes from a single laboratory. Data analysis methods for Clinical Laboratory Monitoring, described below, did not change in 2010 after Laboratory B closed. The number of days in 2010 during which there was a statistically significant increase in stool specimen submissions at Laboratory A did not increase with the closure of Laboratory B and routing of specimens to Laboratory A. Participation of Laboratory A in the Clinical Laboratory Monitoring Program continued through the period of this report. Frequency of data transmission by Laboratory A was daily to three times per week.
Clinical Laboratory Monitoring results are reviewed upon receipt. Beginning in August
2004, DOHMH started implementation of a computer model to establish statistical cut-offs for significant increases in clinical laboratory submissions. The model uses the entire historical dataset, that is, since November 1995 for Laboratory A and since January 1997 for Laboratory B. Sundays and holidays are removed because the laboratories do not test specimens on those days. Linear regression is used to adjust for average day-of-week and day-after-holiday effects as certain days routinely have higher volumes than other days. The cumulative sums (CUSUM) method is applied to a two-week baseline to identify statistically significant aberrations (or “signals”) in submissions for ova and parasites and for bacterial culture and sensitivity. CUSUM is a quality control method that has been adapted for aberration-detection in public health surveillance. (CUSUM is described further in: Hutwagner L, Maloney E, Bean N, Slutsker L, Martin S. Using Laboratory-Based Surveillance Data for Prevention: An Algorithm for Detecting Salmonella Outbreaks. Emerging Infectious Diseases. 1997; 3[3]: 395-400.) C. Anti-Diarrheal Medication Monitoring
The tracking of sales of anti-diarrheal medications is a potentially useful source of information about the level of diarrheal illness in the community. NYC began tracking anti-diarrheal drug sales as a public health indicator in 1995.3 Modifications to NYC’s anti-diarrheal surveillance program have been made over the years, and in 2002 NYC’s program was enhanced by two additional drug-tracking systems, the OTC system and the National Retail Data Monitor 3 The first NYC anti-diarrheal medication tracking system, involving data from a regional distributor serving independent pharmacies, was implemented in 1995. This system was discontinued in 2000 due to a diminishing data stream. This summary of NYC anti-diarrheal medication monitoring programs therefore begins with discussion of the ADM system which was implemented in 1996 and is ongoing.
9
(NRDM) system. The participation of DOHMH in the NRDM system was discontinued in November 2007. Currently NYC utilizes two separate systems to monitor sales of anti-diarrheal medications: the ADM system and the OTC system. (NOTE: the program names “ADM” and “OTC” are abbreviations for “Anti-diarrheal Medications” and “Over-the-Counter.” Both systems involve the tracking of over-the-counter or non-prescription anti-diarrheal medications, but the program names were chosen simply as a way to distinguish the two systems.) Several enhancements to the ADM system were implemented on a pilot basis during 2010.
The ADM System
In 1996, NYC’s ADM system was established, utilizing volume-of-sales information of non-prescription anti-diarrheal medications obtained weekly from a major drug store chain. Until March 2010, this program was operated as follows: weekly sales volume data reports for loperamide and non-loperamide anti-diarrheal medications from electronic store scanners were sent to DEP where the data was entered into a database, sorted into drug formulation category, graphed and visually compared to historic data. Sales volume data was examined citywide, by borough, and by drug formulation category. Information was also obtained on promotional sales of ADM products, with the aim that such information could be considered in interpreting the sales volume data (though difficulties with promotional sales data were encountered at one point, as has been previously reported).
As discussed in previous WDRAP reports, a number of significant enhancements and transitions in the ADM system were worked on in 2008 and 2009. In March 2010, DEP implemented its enhanced ADM system as a pilot program. The enhanced program includes the following features:
ADM data is received in digital format on a daily basis, and is analyzed and reported out on a 5 days/week schedule.
More data is included (more anti-diarrheal products, and from more stores). Data is now run through CDC’s Early Aberration Reporting System (EARS) for analysis
of signals. EARS uses three aberration detection methods which are based on a one-sided positive CUSUM calculation. Data is analyzed in terms of citywide sales and sales by borough.
Also, in addition to ADM sales volume data, data are now also received on Health and Beauty (H&B) products sales volume. The H&B data are used in our analysis with the aim of helping to “normalize” the data (e.g., to help account for changing store traffic on different days of the week).
Data on promotional sales vs. non-promotional sales is provided directly by the data provider. With regard to program staffing, the ADM program continued operating with assistance
of staff from another DEP unit due to a staff reduction in the DEP Health Assessment and Policy Coordination unit (effective March 31, 2010). During 2010, the ADM system experienced some reporting delays. DEP and DOHMH are working together to explore options to improve ADM system operations and to enhance data analysis.
10
The OTC System The second of the currently operating drug monitoring systems, the OTC system, was
started in 2002 by DOHMH. This system involves the monitoring of anti-diarrheal medication sales at a second large store chain. In developing the new OTC system, the goal was to develop a system that would provide more timely and detailed data than the ADM tracking system in place at the time. Also, the OTC system collects data on other medicines, including fever and allergy medications, for broader bioterrorism and emerging infectious disease surveillance purposes. Each daily electronic file contains data for, on average, 32,000 nonprescription medication sales. A separate file is also sent daily by the same data provider which contains 7,100 prescription medication sales. However, the prescription medications have not been found to be as useful as the non-prescription medications for monitoring diarrheal illness in the OTC system, and therefore the prescription sales data of diarrheal medications are not routinely analyzed. Routine daily analyses began in mid-December 2002. Drugs are categorized into key syndromes, and trends are analyzed for citywide increases in sales of non-prescription anti-diarrheal medications. The gastrointestinal category includes generic and brand name loperamide-containing agents and bismuth subsalicylate agents.
D. Hospital Emergency Department Monitoring
NYC initiated monitoring of hospital emergency department visits as a public health surveillance system in 2001. At the start of 2010, DOHMH received electronic data from 50 of New York City’s 55 Emergency Departments (EDs). By the end of the year, 49 of 54 EDs operating in NYC were participating in ED Syndromic Surveillance, reporting approximately 11,000 visits per day, roughly 95% of all ED visits citywide. Hospitals transmit electronic files each morning containing chief complaint and demographic information for patient visits during the previous 24 hours. Patients are classified into syndrome categories, and daily analyses are conducted to detect any unusual patterns, or signals. The two syndromes used to track gastrointestinal illness are vomiting syndrome and diarrhea syndrome. Temporal citywide analyses assess whether the frequency of ED visits for the syndrome has increased in the last one, two or three days compared to the previous fourteen days. Spatial analyses scan the data for geographic clustering in syndrome visits on the most recent day compared to the previous 14 days. Clustering is examined by both hospital location and residential zip code. Statistical significance is based on Monte Carlo probability estimates that adjust for the multiple comparisons inherent in examining many candidate clusters each day. The threshold of significance for citywide and spatial signals was set at P<.01, indicating that fewer than 1 out of every 100 analyses would generate a cluster due to chance alone. Beginning March 11, 2005, the threshold of significance for spatial signals was changed to P<.005, while the threshold of significance for citywide signals remained at P<.01. (The system is described further in: Hefferman R, Mostashari F, Das D, Karpati A, Kulldorf M, Weiss D. Syndromic Surveillance in Public Health Practice, New York City. Emerging Infectious Diseases. 2004; 10[5]: 858-864.)
There was an interruption in the ED Syndromic Surveillance system from September 23
to September 27. The interruption occurred due to a temporary loss of connectivity between the DOHMH data processing system and the Public Health Information Network Messaging System, which receives data from participating hospitals. The system was back in operation on September 28, and data was received through that date. On retrospective analysis, the only GI

11
illness signal that occurred from September 23 to September 27 was a spatial hospital signal for the diarrhea syndrome on September 23 that was not sustained on subsequent days. Findings: Summary of Syndromic Surveillance Signals
Syndromic surveillance signals alone cannot be used to determine etiologic diagnoses. Also, experience has shown that most signals, especially localized spatial signals in the emergency department system or signals in the laboratory or OTC systems, may be statistical aberrations and not related to public health events. The systems are therefore used in concert. A signal in one system is compared to other systems to see whether or not there are concurrent signals. Since 2001, when the ED system was initiated, NYC syndromic surveillance data show annual, citywide increases in the vomiting and diarrheal signals consistent with seasonal trends in norovirus and other enteric viruses.
In this report we present a summary of signals from NYC’s syndromic surveillance systems in four figures: Figures 6 to 9. Figures 6 and 7 summarize ED system trends and signals for 2010. Figures 8 and 9 summarize signal results from all syndromic surveillance systems operated by DOHMH and DEP during 2010.
Figure 6 shows a graphic representation of the ratio of daily ED visits for the vomiting
syndrome to all other daily ED visits for syndromes not tracked by ED syndromic surveillance (“other visits”) from January 1 to December 31, 2010. The graph also includes an indication of citywide signals and of the spatial residential zipcode and hospital signals. Figure 7 is the same graph for the syndrome of diarrhea. Figures 6 and 7 indicate that there were citywide diarrhea signals from January 11-12 and from January 17-19, and citywide vomiting signals from January 10-11, from January 15-18, and on January 24 and February 7. Citywide signals for diarrhea and vomiting next occurred in April. There were citywide diarrhea signals from April 18-20, and a single day citywide vomiting signal on April 18. The citywide diarrhea signals that occurred from April 18-20 were primarily due to a single day increase in visits for the diarrhea syndrome that occurred on April 18.
Sustained citywide signals for vomiting and diarrhea in the ED system next occurred in
November and December. There were citywide diarrhea signals from November 14-16, November 21-22 and from November 28-December 1, and citywide vomiting signals from November 14-16, November 21-23, and from November 25-29. In December, there were additional citywide vomiting signals from December 12-14, on December 20, and from December 25-27. There were hospital location vomiting signals from December 4-5, occurring in the same UHF neighborhood, Sunset Park, Brooklyn. ED signals for vomiting and diarrhea occurring in January and February and again in November and December are consistent with NYC’s historical experience with seasonal norovirus and rotavirus outbreaks.
Figures 8 and 9 are time-series plots of signals from NYC syndromic surveillance systems for the gastrointestinal syndrome covering the period January 1 to June 30, and July 1 to December 31, 2010, respectively. The systems included are the emergency department system, the clinical laboratory monitoring system, the OTC anti-diarrheal medication system operated by DOHMH, the ADM anti-diarrheal medication system operated by DEP, and the nursing home sentinel surveillance system. For the ED system and for the ADM system, only citywide signals

12
have been included. As discussed above, there was sustained citywide ED system signaling in January, most likely representing the seasonality of rotavirus and calicivirus (specifically, the genus norovirus). There was one GI outbreak in a sentinel nursing home in January that appears to have been caused by human calicivirus. Details concerning that outbreak are presented below. In the clinical laboratory system, there were two signals in January for each of the two participating laboratories. Neither lab reported a positive Cryptosporidium result in January. For Laboratory A, there was sustained signaling from July 22-24, during which time no Cryptosporidium-positive specimens were identified. Otherwise, there was sporadic signaling for this laboratory during the year. As noted previously, data for Laboratory B were no longer available after March 10 because this laboratory closed. In the OTC system, there were signals from January 18-20, and from February 9-10. In both instances sustained signaling occurred as a result of a single day elevation in medication sales (i.e., on January 18 and on February 9). Signals next occurred in the OTC system from April 28-29. Signaling on these days was related to an increase in sales of bismuth products on April 28. There were two single-day OTC signals for the remainder of the year, occurring on July 1 and December 20.
The sentinel nursing home GI outbreak occurred in a facility in Manhattan, beginning on January 4. Thirteen patients on two units and two staff members were affected. The symptoms were vomiting and diarrhea, and there were no deaths or hospitalizations. The facility sent three stool specimens from one patient to the Public Health Laboratory for testing. One specimen was tested for ova and parasites, including Cryptosporidium, one for bacterial pathogens, and one for viruses. The specimens tested for ova and parasites and for pathogenic bacteria were negative. The viral specimen was sent to the NYSDOH Wadsworth Virology Laboratory and was found to be positive for human calicivirus by polymerase chain reaction.
With regard to the ADM system, the results are summarized below in terms of “Pre-
Transition” and “Post-Transition” to reflect the transition from the earlier data analysis system that was in operation until March 2010 (which involved a visual examination of trends), to NYC’s enhanced ADM system (which involves aberration detection via EARS analysis, as well as other program modifications as described above under “Program Components – Overviews and Updates,” Section C).
Pre-Transition (January 1 – March 27, 2010): During this period, levels of citywide total ADM sales did not appear to be above background range. During the week ending March 6, citywide sales of non-loperamide products were at the higher end of the background range; however, citywide loperamide and total ADM sales appeared to be within background range for that week.
Post-Transition to EARS (March 10 – December 31, 2010): Figures 8 and 9 include citywide signals from the EARS analysis for March 10 through June 2010, and July through December 2010, respectively. As indicated in the figures, there were forty-three days of citywide EARS signals during this period (borough signals are also monitored but are not included in Figures 8 and 9). A preliminary evaluation was done of the ADM data to assess when these citywide signals coincided with increases in product sales at promotional prices (as opposed to sales at regular prices). Signaling during promotional events may reflect the impact of price reductions rather than an increase in community GI illness or other factors. The 43 days of ADM EARS signals were grouped into 19 “signal periods” (i.e., consecutive days of signals became one “signal period”). Of these 19 signal periods, 13 coincided with days on which promotional sales were observed (dates
13
are not listed here for brevity). Six of the 19 signal periods did not coincide with promotional events: March 26-27, September 21, November 5, November 16, December 16-19, and December 21-25. The period of heaviest EARS signaling during this reporting period was the second half of December. (Note that an adjustment to the ADM data set was needed to account for closings of most of the participating stores on Christmas Day, to enable EARS analysis to be run.)
Upon completion of ADM data analysis, results are shared with DOHMH, and when
signals or other unusual results are seen, DOHMH checks for concurrent signals appearing in the other syndromic systems. Some signals observed in the ADM system during the period of this report coincided with signals in other syndromic systems (for example, in late November and December).
In summary, for the period January through December 2010, there were multiple
citywide signals for gastrointestinal illness in the ED system in January and again in November and December. One GI outbreak in a sentinel nursing home in January, which appears to have been caused by human calicivirus, along with sustained citywide signals in the ED system in the beginning and end of the year, were consistent with annual gastrointestinal viral trends. There was no evidence of a drinking water-related outbreak in New York City.
PART III: INFORMATION SHARING AND PUBLIC EDUCATION Information sharing and education efforts continued during 2010. Educational outreach in 2010 included a presentation given by a DOHMH WDRAP team member to graduate students at a school of public health. Such talks serve to enhance awareness of waterborne diseases, and also may lead to more complete disease diagnosis and reporting. Additionally, the program continued to revise and improve our Recreational Water Illness (RWI) Prevention Program materials. DOHMH initially partnered with the CDC in the development of health promotion materials for NYC pool users and operators in 2008. Actions taken at that time are detailed in the WDRAP 2008 Annual Report. This effort was undertaken in response to increasing numbers of RWI outbreaks in the US caused by Cryptosporidium. In 2010 a second “Health Swimming” poster (see Attachment 1) was developed, implementing changes recommended to DOHMH through a survey of pool operators who had received the first poster. Both posters are now available, and the DOHMH Public Health Engineering group arranged to have the materials delivered to pools during annual inspections. In addition, significant revisions were made to the Recreational Water Illness Prevention webpage which outlines measures to prevent recreational water illness, and which includes links to other DOHMH, CDC and US Environmental Protection Agency websites for additional information for members of the public, for aquatics staff members, and for health care providers. This webpage can be found at: http://www.nyc.gov/html/doh/html/cd/rwn.shtml

14
Information pertaining to NYC’s Waterborne Disease Risk Assessment Program and related issues continue to be available on both the DEP and DOHMH websites, including results from the City’s source water protozoa monitoring program. Documents on the websites include: DOHMH Webpages:
Giardiasis fact sheet http://www.nyc.gov/html/doh/html/cd/cdgia.shtml
Cryptosporidiosis fact sheet
http://www.nyc.gov/html/doh/html/cd/cdcry.shtml
DEP Webpages: DEP Water Supply Testing Results for Giardia and Cryptosporidium
(Data are collected and entered on the website each week. Historical data are also included.) http://www.nyc.gov/html/dep/html/drinking_water/pathogen.shtml
Waterborne Disease Risk Assessment Program’s Annual Reports, 1997-2010
http://www.nyc.gov/html/dep/html/drinking_water/wdrap.shtml
New York City Drinking Water Supply and Quality Statement, 1997-2009 (Planned posting date for the 2010 report is May 31, 2011.) http://www.nyc.gov/html/dep/html/drinking_water/wsstate.shtml
PART IV: PUBLIC HEALTH REVIEW – HILLVIEW RESERVOIR
In September 2010, the DOHMH BCD and Bureau of Environmental Sciences and Engineering (BESE) completed a public health review of the Hillview Reservoir. The public health review was completed at the request of DEP, as part of DEP’s reassessment of capital priorities impacting the schedule for covering the Hillview Reservoir. DOHMH BCD summarized the epidemiology of cryptosporidiosis in NYC from 1999 to 2008 and submitted a review of the literature concerning Cryptosporidiosis species infectious for humans and animal hosts. The DOHMH BESE completed a review of historical pathogen data in NYC drinking water, an analysis of Hillview reservoir as a possible source of Cryptosporidium, and an analysis of Hillview reservoir Cryptosporidium sampling data.
0
50
100
150
200
250
300
350
Jul-9
3
Jan-
94
Jul-9
4
Jan-
95
Jul-9
5
Jan-
96
Jul-9
6
Jan-
97
Jul-9
7
Jan-
98
Jul-9
8
Jan-
99
Jul-9
9
Jan-
00
Jul-0
0
Jan-
01
Jul-0
1
Jan-
02
Jul-0
2
Jan-
03
Jul-0
3
Jan-
04
Jul-0
4
Jan-
05
Jul-0
5
Jan-
06
Jul-0
6
Jan-
07
Jul-0
7
Jan-
08
Jul-0
8
Jan-
09
Jul-0
9
Jan-
10
Jul-1
0
Num
ber o
f Cas
es
Month of Diagnosis
Figure 1: Giardiasis, number of cases by month of diagnosis, active surveillance, New York City,
July 1993 - December 2010
16
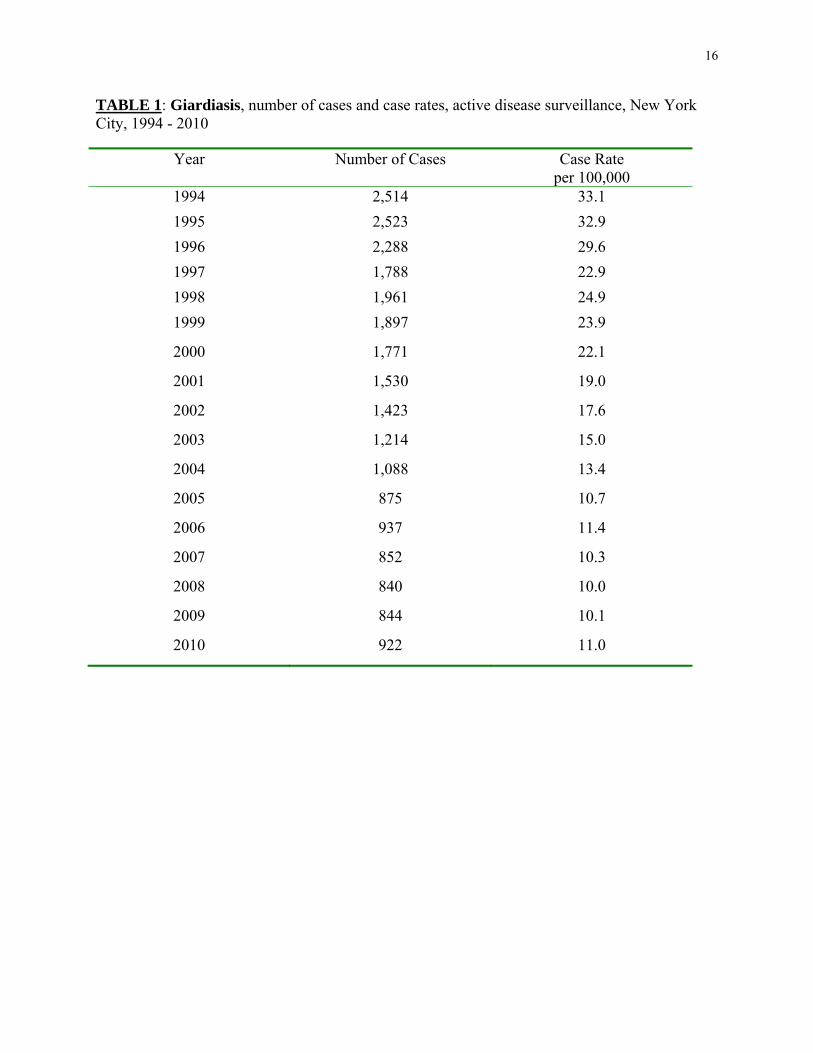
TABLE 1: Giardiasis, number of cases and case rates, active disease surveillance, New York City, 1994 - 2010
Year Number of Cases Case Rate per 100,000
1994 2,514 33.1
1995 2,523 32.9
1996 2,288 29.6
1997 1,788 22.9
1998 1,961 24.9
1999 1,897 23.9
2000 1,771 22.1
2001 1,530 19.0
2002 1,423 17.6
2003 1,214 15.0
2004 1,088 13.4
2005 875 10.7
2006 937 11.4
2007 852 10.3
2008 840 10.0
2009 844 10.1
2010 922 11.0
17
TABLE 2: Giardiasis, number of cases and annual case rate per 100,000 population by sex and borough of residence - active surveillance in New York City (2010) Borough of residence Sex
Citywide number (rate)
Manhattan number (rate)
Bronx number (rate)
Brooklyn number (rate)
Queens number (rate)
Stat Is number (rate)
Male 592
(14.8) 257
(33.1) 89
(13.5)136
(11.2)96
(8.6) 14
(5.8) Female 330
(7.5) 105
(12.3) 50
(6.8) 102
(7.5) 69
(5.8) 4
(1.6) Total
922 (11.0)
362 (22.2)
139 (9.9)
238(9.3)
165 (7.2)
18 (3.7)
19
Table 3: Giardiasis, number of cases and annual case rate per 100,000 by UHF neighborhood of residence - active surveillance in New York City (2010)
UHF Neighborhood Borough Number Population Rate Chelsea-Clinton Manhattan 61 146101 41.8Lower Manhattan Manhattan 15 37343 40.2C Harlem-Morningside Hgts Manhattan 38 138670 27.4Greenwich Village-Soho Manhattan 25 95800 26.1Upper West Side Manhattan 64 246126 26.0Gramercy Park-Murray Hill Manhattan 27 139227 19.4East Harlem Manhattan 20 104493 19.1Union Sq-Lower East Side Manhattan 36 213543 16.9Kingsbridge-Riverdale Bronx 14 85228 16.4Upper East Side Manhattan 39 250443 15.6Washington Heights-Inwood Manhattan 37 250298 14.8Downtown-Heights-Slope Brooklyn 35 236982 14.8Crotona-Tremont Bronx 30 214571 14.0Williamsburg-Bushwick Brooklyn 28 202549 13.8Hunts Point-Mott Haven Bronx 18 138091 13.0West Queens Queens 61 516458 11.8Bed Stuyvesant-Crown Hgts Brooklyn 37 314013 11.8High Bridge-Morrisania Bronx 24 207226 11.6Greenpoint Brooklyn 15 140099 10.7Borough Park Brooklyn 36 347062 10.4Long Island City-Astoria Queens 22 227910 9.7Fordham-Bronx Park Bronx 23 259661 8.9Sunset Park Brooklyn 11 128725 8.5Ridgewood-Forest Hills Queens 20 237559 8.4Fresh Meadows Queens 8 95128 8.4Stapleton-St. George Stat Island 10 132575 7.5East Flatbush-Flatbush Brooklyn 23 307274 7.5Pelham-Throgs Neck Bronx 21 298024 7.0Coney Island-Sheepshead Bay Brooklyn 20 304561 6.6East New York Brooklyn 11 177819 6.2Canarsie-Flatlands Brooklyn 12 197108 6.1Flushing-Clearview Queens 15 279344 5.4Southwest Queens Queens 14 275236 5.1Northeast Bronx Bronx 9 188959 4.8Bensonhurst-Bay Ridge Brooklyn 10 210906 4.7Jamaica Queens 13 289264 4.5Bayside-Littleneck Queens 4 89752 4.5Southeast Queens Queens 6 199006 3.0Port Richmond Stat Island 2 75154 2.7Willowbrook Stat Island 2 90952 2.2South Beach-Tottenville Stat Island 4 193049 2.1Rockaway Queens 2 109592 1.8
20
TABLE 4: Giardiasis, number of cases and annual case rate per 100,000 population by age group and sex - active surveillance in New York City (2010) Sex Age group
Male number (rate)
Female number (rate)
Total number (rate)
<5 years 74 (25)
64 (22.5)
138(23.8)
5-9 years 43 (16.0)
44 (17.1)
87(16.5)
10-19 years 39 (7.7)
29 (5.9)
68(6.9)
20-44 years 263 (16.7)
101 (6.1)
364(11.3)
45-59 years 138 (17.6)
57 (6.6)
195(11.8)
≥ 60 years 35 (6.0)
35 (4.1)
70(4.9)
Total 592 (14.8)
330 (7.5)
922(11.0)

21
TABLE 5: Giardiasis, number of cases and annual case rate per 100,000 population by age group and borough of residence - active surveillance in New York City (2010)
Borough of residence Age group
Citywide number (rate)
Manhattan number (rate)
Bronx number (rate)
Brooklyn number (rate)
Queens number (rate)
Stat Is number (rate)
<5 years 138
(23.8) 29
(30.9)28
(25.1)53
(27)27
(18.1)1
(3.4) 5-9 years 87
(16.5) 13
(17.4)30
(28.3)27
(15.4)17
(12.2)0
10-19 years
68 (6.9)
15(11.9)
16(7.3)
18 (5.5)
18(7.0)
1 (1.5)
20-44 years
364 (11.3)
171(23.5)
38(7.7)
95 (9.9)
52 (6.0)
8 (4.8)
45-59 years
195 (11.8)
106(33.8)
16(6.2)
32 (6.6)
38(7.9)
3 (2.7)
≥ 60 years
70 (4.9)
28(9.6)
11(5.3)
13 (3.1)
13(3.1)
5 (5.6)
Total 922 (11.0)
362(22.2)
139(9.9)
238 (9.3)
165(7.2)
18 (3.7)

22
Table 6: Cryptosporidiosis, number of cases and case rates, active disease surveillance, New York City, 1994 – 2010
Year Number of Cases Case Rate per 100,000
1994 297* 3.9*
1995 472 6.2
1996 334 4.3
1997 172 2.2
1998 208 2.6
1999 261 3.3
2000 172 2.1
2001 122 1.5
2002 148 1.8
2003 126 1.6
2004 138 1.7
2005 148 1.8
2006 155 1.9
2007 105 1.3
2008 107 1.3
2009 81 1.0
2010 107 1.3
* Active disease surveillance began in November 1994.

0
10
20
30
40
50
60
No
v-94
Ma
y-9
5
No
v-95
Ma
y-9
6
No
v-96
Ma
y-9
7
No
v-97
Ma
y-9
8
No
v-98
Ma
y-9
9
No
v-99
Ma
y-0
0
No
v-00
Ma
y-0
1
No
v-01
Ma
y-0
2
No
v-02
Ma
y-0
3
No
v-03
Ma
y-0
4
No
v-04
Ma
y-0
5
No
v-05
Ma
y-0
6
No
v-06
Ma
y-0
7
No
v-07
Ma
y-0
8
No
v-08
Ma
y-0
9
No
v-09
Ma
y-1
0
No
v-10
Num
ber o
f Cas
es
Month of Diagnosis
Figure 2: Cryptosporidiosis, number of cases by month of diagnosis, active surveillance, New York City, November 1994 - December 2010
See notes in Figure 3
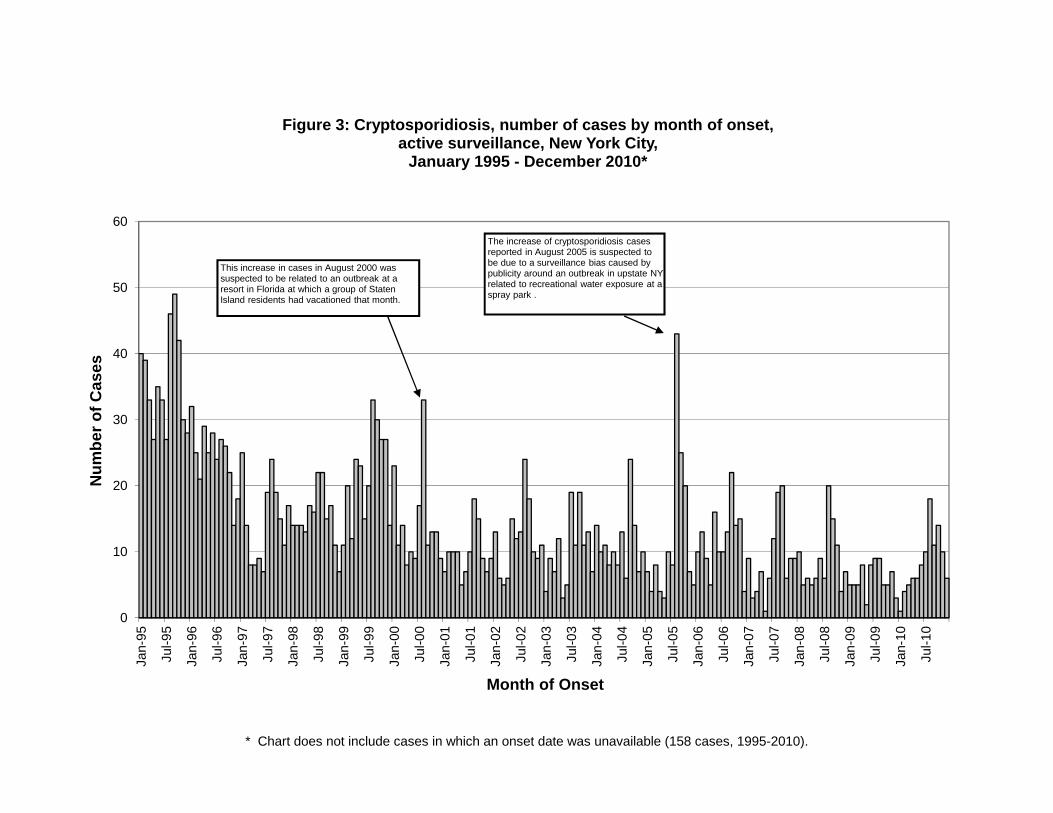
* Chart does not include cases in which an onset date was unavailable (158 cases, 1995-2010).
0
10
20
30
40
50
60
Jan-
95
Jul-9
5
Jan-
96
Jul-9
6
Jan-
97
Jul-9
7
Jan-
98
Jul-9
8
Jan-
99
Jul-9
9
Jan-
00
Jul-0
0
Jan-
01
Jul-0
1
Jan-
02
Jul-0
2
Jan-
03
Jul-0
3
Jan-
04
Jul-0
4
Jan-
05
Jul-0
5
Jan-
06
Jul-0
6
Jan-
07
Jul-0
7
Jan-
08
Jul-0
8
Jan-
09
Jul-0
9
Jan-
10
Jul-1
0
Num
ber o
f Cas
es
Month of Onset
Figure 3: Cryptosporidiosis, number of cases by month of onset, active surveillance, New York City,
January 1995 - December 2010*
This increase in cases in August 2000 was suspected to be related to an outbreak at a resort in Florida at which a group of Staten Island residents had vacationed that month.
The increase of cryptosporidiosis cases reported in August 2005 is suspected to be due to a surveillance bias caused by publicity around an outbreak in upstate NY related to recreational water exposure at a spray park .
25
TABLE 7: Cryptosporidiosis, number of cases and annual case rate per 100,000 population by sex and borough of residence - active surveillance in New York City (2010) Borough of residence Sex
Citywide number (rate)
Manhattan number (rate)
Bronx number (rate)
Brooklyn number (rate)
Queens number (rate)
Stat Is number (rate)
Male 67
(1.7) 27
(3.5)16
(2.4)17
(1.4)7
(0.6)0
Female 40 (0.9)
16(1.9)
9(1.2)
11(0.8)
3 (0.3)
1 (0.4)
Total 107 (1.3)
43(2.6)
25(1.8)
28(1.1)
10 (0.4)
1 (0.2)


27
TABLE 8: Cryptosporidiosis, number of cases and annual case rate per 100,000 population by UHF neighborhood of residence - active surveillance in New York City (2010)
UHF Neighborhood
Borough Number Population Rate C Harlem-Morningside Hgts Manhattan 6 138670 4.3Greenwich Village-Soho Manhattan 4 95800 4.2East Harlem Manhattan 4 104493 3.8Upper West Side Manhattan 8 246126 3.3Fordham-Bronx Park Bronx 8 259661 3.1Hunts Point-Mott Haven Bronx 4 138091 2.9Chelsea-Clinton Manhattan 4 146101 2.7Lower Manhattan Manhattan 1 37343 2.7Washington Heights-Inwood Manhattan 6 250298 2.4Kingsbridge-Riverdale Bronx 2 85228 2.3East New York Brooklyn 4 177819 2.2East Flatbush-Flatbush Brooklyn 6 307274 2.0Union Sq-Lower East Side Manhattan 4 213543 1.9Crotona-Tremont Bronx 4 214571 1.9Upper East Side Manhattan 4 250443 1.6 Bed Stuyvesant-Crown Hgts Brooklyn 5 314013 1.6High Bridge-Morrisania Bronx 3 207226 1.4Gramercy Park-Murray Hill Manhattan 2 139227 1.4Long Island City-Astoria Queens 3 227910 1.3Downtown Heights-Slope Brooklyn 3 236982 1.3Southwest Queens Queens 3 275236 1.1Fresh Meadows Queens 1 95128 1.1Pelham-Throgs Neck Bronx 3 298024 1.0Williamsburg-Bushwick Brooklyn 2 202549 1.0Bensonhurst-Bay Ridge Brooklyn 2 210906 0.9Borough Park Brooklyn 3 347062 0.9Sunset Park Brooklyn 1 128725 0.8Stapleton – St. George Stat Is 1 132575 0.8Greenpoint Brooklyn 1 140099 0.7Coney Island-Sheepshead Bay Brooklyn 2 304561 0.7Southeast Queens Queens 1 199006 0.5Flushing-Clearview Queens 1 279344 0.4Jamaica Queens 1 289264 0.3

28
TABLE 9: Cryptosporidiosis, number of cases and annual case rate per 100,000 population by age group and sex - active surveillance in New York City (2010) Sex Age group
Male number (rate)
Female number (rate)
Total number (rate)
<5 years 7 (2.4)
5 (1.8)
12 (2.1)
5-9 years 2 (0.7)
2 (0.8)
4(0.8)
10-19 years 4 (0.8)
2 (0.4)
6(0.6)
20-44 years 36 (2.3)
21 (1.3)
57(1.8)
45-59 years 15 (1.9)
7 (0.8)
22(1.3)
≥ 60 years 3 (0.5)
3 (0.4)
6 (0.4)
Total 67 (1.7)
40 (0.9)
107(1.3)

29
TABLE 10: Cryptosporidiosis, number of cases and annual case rate per 100,000 population by age group and borough – active surveillance in New York City (2010) Borough of residence Age group
Citywide number (rate)
Manhattan number (rate)
Bronx number (rate)
Brooklyn number (rate)
Queens number (rate)
Stat Is number (rate)
<5 years
12 (2.1)
4 (4.3)
5(4.5)
2 (1.0)
1(0.7)
0
5-9 years
4 (0.8)
3 (4.0)
1(0.9)
0 0 0
10-19 years
6 (0.6)
2 (1.6)
1(0.5)
2 (0.6)
1(0.4)
0
20-44 years
57 (1.8)
25 (3.4)
10(2.0)
18 (1.9)
4(0.5)
0
45-59 years
22 (1.3)
8 (2.6)
8(3.1)
5 (1.0)
0 1 (0.9)
≥ 60 years
6 (0.4)
1 (0.3)
0 1 (0.2)
4(1.0)
0
Total 107 (1.3)
43 (2.6)
25(1.8)
28 (1.1)
10(0.4)
1 (0.2)
30
TABLE 11: Cryptosporidiosis, number of cases and annual case rate per 100,000 population by race/ethnicity and borough of residence - active surveillance in New York City (2010) Borough of residence Race/Ethnicity
Citywidenumber (rate)
Manhattan number (rate)
Bronx number (rate)
Brooklyn number (rate)
Queens number(rate)
Stat Is number (rate)
Hispanic 34
(1.5)13
(3.4)16
(2.2)3
(0.6) 2
(0.3)0
White, non-Hispanic 26(0.9)
15(1.8)
1(0.6)
6 (0.6)
3(0.4)
1(0.3)
Black, non-Hispanic 34(1.7)
9(4.3)
8(1.8)
15 (1.8)
2(0.5)
0
Asian, Pacific Islander, American Indian, Alaska Native, non-Hispanic
5(0.5)
2(1.1)
0 2 (0.8)
1(0.2)
0
Two or more races, non-Hispanic
4(3.8)
1(4.3)
0 1 (3.5)
2(5.7)
0
Unknown
4 3 0 1 0 0
Total 107(1.3)
43(2.6)
25(1.8)
28 (1.1)
10(0.4)
1(0.2)
31
TABLE 12: Cryptosporidiosis, number of cases and annual case rate per 100,000 population by race/ethnicity and age group - active surveillance in New York City (2010) Age group Race /ethnicity
< 5 years
number (rate)
5-9 years
number (rate)
10-19 years
number (rate)
20-44 years
number (rate)
45-59 years
number (rate)
≥ 60 years
number (rate)
Total
number (rate)
Hispanic 7(3.5)
3(1.7)
4(1.2)
13(1.4)
7 (1.7)
0 34(1.5)
White, non-Hispanic 0 1(0.7)
0 15(1.3)
6 (1.0)
4(0.6)
26(0.9)
Black, non-Hispanic 2(1.5)
0 2(0.7)
20(2.8)
9 (2.2)
1(0.3)
34(1.7)
Asian, Pacific Islander, American Indian, Alaska Native, non-Hispanic
1(1.4)
0 0 3(0.7)
0 1(0.7)
5(0.5)
Two or more races, non-Hispanic
1(6.4)
0 0 3(7.9)
0 0 4(3.8)
Unknown
1 0 0 3 0 0 4
Total 12(2.1)
4(0.8)
6(0.6)
57(1.8)
22 (1.3)
6(0.4)
107(1.3)

0
10
20
30
40
50
60
Jan-
95
Jul-9
5
Jan-
96
Jul-9
6
Jan-
97
Jul-9
7
Jan-
98
Jul-9
8
Jan-
99
Jul-9
9
Jan-
00
Jul-0
0
Jan-
01
Jul-0
1
Jan-
02
Jul-0
2
Jan-
03
Jul-0
3
Jan-
04
Jul-0
4
Jan-
05
Jul-0
5
Jan-
06
Jul-0
6
Jan-
07
Jul-0
7
Jan-
08
Jul-0
8
Jan-
09
Jul-0
9
Jan-
10
Jul-1
0
Num
ber o
f Cas
es
Month of Diagnosis
Figure 4: Cryptosporidiosis, number of cases among persons living with HIV/AIDS by month of diagnosis, New York City,
January 1995-December 2010

0
10
20
30
40
50
60
Jan-
95
Jul-9
5
Jan-
96
Jul-9
6
Jan-
97
Jul-9
7
Jan-
98
Jul-9
8
Jan-
99
Jul-9
9
Jan-
00
Jul-0
0
Jan-
01
Jul-0
1
Jan-
02
Jul-0
2
Jan-
03
Jul-0
3
Jan-
04
Jul-0
4
Jan-
05
Jul-0
5
Jan-
06
Jul-0
6
Jan-
07
Jul-0
7
Jan-
08
Jul-0
8
Jan-
09
Jul-0
9
Jan-
10
Jul-1
0
Num
ber o
f Cas
es
Month of Diagnosis
Figure 5: Cryptosporidiosis, number of cases among immunocompetent persons by month of diagnosis, New York City,
January 1995-December 2010
See notes in Figure 3
34
Table 13: Cryptosporidiosis, number and percent of cases by year and immune status, New York City, 1995 - 2010
Immune Status Year
1995 No. (%)
1996 No. (%)
1997 No. (%)
1998 No. (%)
1999 No. (%)
2000 No. (%)
2001 No. (%)
2002 No. (%)
2003 No. (%)
2004 No. (%)
2005 No. (%)
2006 No. (%)
2007 No. (%)
2008 No. (%)
2009 No. (%)
2010 No. (%)
Persons with HIV/AIDS
392 (83.1)
244 (73.1)
80 (46.5)
79 (38)
118 (45.2)
91 (52.9)
65 (53.3)
94 (63.5)
76 (60.3)
95 (68.8)
67 (45.3)
69 (44.5)
50 (47.6)
47 (43.9)
43 (53.1)
53 (49.5)
Immunocompetent
71 (15)
83 (25)
83 (48.3)
122 (58.7)
139 (53.3)
79 (45.9)
54 (44.3)
47 (31.8)
48 (38.1)
38 (27.5)
72 (48.6)
71 (45.8)
51 (48.6)
52 (48.6)
33 (40.7)
49 (45.8)
Immunocompromised, Not HIV/AID
4 (0.8)
3 (0.9)
7 (4.1)
2 (1)
3 (1.1)
2 (1.2)
2 (1.6)
7 (4.7)
2 (1.6)
5 (3.6)
9 (6.1)
14 (9)
4 (3.8)
5 (4.7)
3 (3.7)
4 (3.7)
Immune status unknown
5 (1.1)
4 (1.2)
2 (1.2)
5 (2.4)
1 (0.4)
0
1 (0.8)
0
0
0
0
1 (0.6)
0
3 (2.8)
2 (2.5)
1 (0.9)
Total
472
334 172 208 261 172 122 148 126 138 148 155 105 107 81 107

35
Table 14: Percentage of interviewed cryptosporidiosis case-patients reporting selected potential risk exposures before disease onset,a persons with HIV/AIDS, New York City, 1995 - 2010 Exposure Type Persons with HIV/AIDS
1995 1996 1997 1998 1999 2000 2001 2002 2003 2004 2005 2006 2007 2008 2009 2010
Contact with an Animalb
35% 35% 33% 36% 35% 43% 24% 42% 40% 31% 33% 38% 31% 44% 42% 20%
High-risk Sexual Activityc (> 18 years old)
22% 22% 9% 15% 20% 25% 16% 23% 24% 34% 27% 31% 21% 39% 35% 7%
International Traveld
9% 9% 9% 13% 18% 14% 10% 11% 13% 15% 17% 9% 6% 7% 8% 7%
Recreational Water Contacte
16% 8% 16% 12% 16% 15% 8% 10% 21% 13% 5% 18% 17% 14% 8% 10%
Note:
Determination of an association between exposure to possible risk factors for cryptosporidiosis and acquisition of cryptosporidiosis cannot be made without reference to a suitable control population (i.e., non-Cryptosporidium-infected controls).
Format of case interview form changed on 1/1/1997, 5/11/2001, 8/21/2002, and 4/26/2010. Details regarding changes made to the interview form and
Exposure Types from 1995-2010 are noted below. a From 1/1/1995 to 4/25/2010, case-patients were asked about potential risk exposures during the month before disease onset. Starting 4/26/2010, case-
patients were asked about potential risk exposures during the 14 days before onset. b Contact with an Animal - Includes having a pet, or visiting a farm or petting zoo (1995-1996); expanded to include: or visiting a pet store or
veterinarian office (1997-2010). c High-risk Sexual Activity - Includes having a penis, finger or tongue in sexual partner’s anus (1995-2010). d International Travel - Travel outside the United States (1995-2010).
e Recreational Water Contact - Includes swimming in a pool, or swimming in or drinking from a stream, lake, river or spring (1995-1996); expanded to include: or swimming in the ocean, or visiting a recreational water park (1997-2010).
36
Table 15: Percentage of interviewed cryptosporidiosis case-patients reporting selected potential risk exposures before disease onset,a immunocompetent persons, New York City, 1995 - 2010 Exposure Type Immunocompetent Persons
1995 1996 1997 1998 1999 2000* 2001 2002 2003 2004 2005 2006 2007 2008 2009 2010
Contact with an Animalb 7% 41% 41% 32% 35% 26% 37% 35% 23% 34% 36% 36% 34% 28% 40% 18%
High-risk Sexual Activityc (> 18 years old)
14% 25% 12% 10% 12% 23% 15% 30% 13% 31% 17% 3% 19% 7% 18% 4%
International Traveld
30% 29% 26% 28% 28% 40% 47% 33% 45% 47% 45% 40% 47% 52% 37% 44%
Recreational Water Contacte
21% 27% 40% 24% 22% 32% 35% 35% 34% 33% 52% 28% 36% 40% 50% 33%
Note:
Determination of an association between exposure to possible risk factors for cryptosporidiosis and acquisition of cryptosporidiosis cannot be made without reference to a suitable control population (i.e., non-Cryptosporidium-infected controls).
Format of case interview form changed on 1/1/1997, 5/11/2001, 8/21/2002, and 4/26/2010. Details regarding changes made to the interview form and
Exposure Types from 1995-2010 are noted below. a From 1/1/1995 to 4/25/2010, case-patients were asked about potential risk exposures during the month before disease onset. Starting 4/26/2010, case-
patients were asked about potential risk exposures during the 14 days before onset. b Contact with an Animal - Includes having a pet, or visiting a farm or petting zoo (1995-1996); expanded to include: or visiting a pet store or
veterinarian office (1997-2010). c High-risk Sexual Activity - Includes having a penis, finger or tongue in sexual partner’s anus (1995-2010). d International Travel - Travel outside the United States (1995-2010).
e Recreational Water Contact - Includes swimming in a pool, or swimming in or drinking from a stream, lake, river or spring (1995-1996); expanded to include: or swimming in the ocean, or visiting a recreational water park (1997-2010).
* Year 2000 percentage of interviewed cryptosporidiosis cases does not include 14 cases associated with a point source exposure at a swimming pool in
Florida.

37
Table 16: Percentage of interviewed cryptosporidiosis case-patients by type of tap water exposure before disease onset,a persons with HIV/AIDS, New York City, 1995 - 2010 Exposure Type
Persons with HIV/AIDS
1995 1996 1997 1998 1999 2000 2001 2002 2003 2004 2005 2006 2007 2008 2009 2010
Plain Tapb
69% 70% 71% 64% 66% 63% 55% 54% 77% 49% 76% 67% 67% 64% 58% 63%
Filtered Tapc
12% 9% 10% 18% 20% 20% 14% 22% 13% 21% 7% 18% 11% 14% 15% 12%
Boiled Tapd
7% 7% 3% 5% 3% 6% 6% 0% 4% 6% 5% 7% 0% 11% 8% 2%
Incidental Plain Tap Onlye
11% 15% 16% 15% 8% 12% 16% 19% 4% 15% 10% 4% 17% 7% 15% 15%
No Tapf
3% 2% 2% 0% 5% 4% 6% 4% 2% 5% 2% 2% 6% 4% 0% 3%
Note: Determination of an association between exposure to possible risk factors for cryptosporidiosis and acquisition of cryptosporidiosis cannot be made without
reference to a suitable control population (i.e., non-Cryptosporidium-infected controls).
Format of case interview form changed on 1/1/1997, 5/11/2001, 8/21/200, and 4/26/2010. Details regarding changes made to the interview form and Tap Water Exposure Types from 1995-2010 are noted below. a From 1/1/1995 to 4/25/2010, case-patients were asked about Tap Water Exposure during the month before disease onset. Starting 4/26/2010, case-patients were asked about Tap Water Exposure during the 14 days before onset. b Plain Tap - Drank unboiled/unfiltered NYC tap water (1995-5/10/2001); or drank greater than 0 cups of unboiled/unfiltered NYC tap water (5/11/2001-12/31/2010). c Filtered Tap - Drank filtered NYC tap water (1995-5/10/2001); or drank greater than 0 cups of filtered NYC tap water, and 0 or more cups of boiled NYC tap water, and no unboiled /unfiltered NYC tap water (5/11/2001-12/31/2010). d Boiled Tap - Drank boiled NYC tap water (1995-5/10/2001); or drank greater than 0 cups of boiled NYC tap water, and no unboiled /unfiltered NYC tap water, and no filtered NYC tap water (5/11/2001-12/31/2010). e Incidental Plain Tap Only - Did not drink any NYC tap water but did use unboiled/unfiltered NYC tap water to brush teeth, or to wash vegetables/fruits, or to make ice (1995-1996); expanded to include: or to make juice from concentrate (1997-2010) f No Tap - Did not drink any NYC tap water and did not use unboiled/unfiltered NYC tap water to brush teeth, or to wash vegetables/fruits, or to make ice (1995-1996); expanded to include: or to make juice from concentrate (1997-2010).
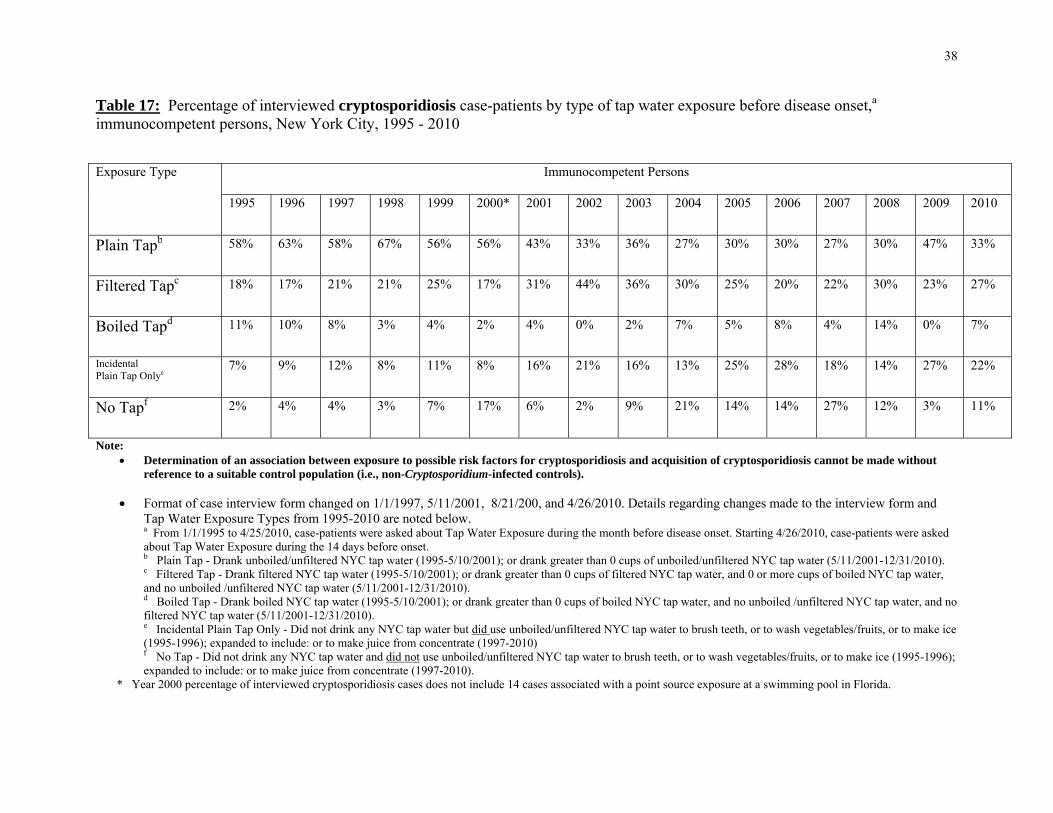
38
Table 17: Percentage of interviewed cryptosporidiosis case-patients by type of tap water exposure before disease onset,a immunocompetent persons, New York City, 1995 - 2010 Exposure Type
Immunocompetent Persons
1995 1996 1997 1998 1999 2000* 2001 2002 2003 2004 2005 2006 2007 2008 2009 2010
Plain Tapb
58% 63% 58% 67% 56% 56% 43% 33% 36% 27% 30% 30% 27% 30% 47% 33%
Filtered Tapc
18% 17% 21% 21% 25% 17% 31% 44% 36% 30% 25% 20% 22% 30% 23% 27%
Boiled Tapd
11% 10% 8% 3% 4% 2% 4% 0% 2% 7% 5% 8% 4% 14% 0% 7%
Incidental Plain Tap Onlye
7% 9% 12% 8% 11% 8% 16% 21% 16% 13% 25% 28% 18% 14% 27% 22%
No Tapf
2% 4% 4% 3% 7% 17% 6% 2% 9% 21% 14% 14% 27% 12% 3% 11%
Note: Determination of an association between exposure to possible risk factors for cryptosporidiosis and acquisition of cryptosporidiosis cannot be made without
reference to a suitable control population (i.e., non-Cryptosporidium-infected controls).
Format of case interview form changed on 1/1/1997, 5/11/2001, 8/21/200, and 4/26/2010. Details regarding changes made to the interview form and Tap Water Exposure Types from 1995-2010 are noted below. a From 1/1/1995 to 4/25/2010, case-patients were asked about Tap Water Exposure during the month before disease onset. Starting 4/26/2010, case-patients were asked about Tap Water Exposure during the 14 days before onset. b Plain Tap - Drank unboiled/unfiltered NYC tap water (1995-5/10/2001); or drank greater than 0 cups of unboiled/unfiltered NYC tap water (5/11/2001-12/31/2010). c Filtered Tap - Drank filtered NYC tap water (1995-5/10/2001); or drank greater than 0 cups of filtered NYC tap water, and 0 or more cups of boiled NYC tap water, and no unboiled /unfiltered NYC tap water (5/11/2001-12/31/2010). d Boiled Tap - Drank boiled NYC tap water (1995-5/10/2001); or drank greater than 0 cups of boiled NYC tap water, and no unboiled /unfiltered NYC tap water, and no filtered NYC tap water (5/11/2001-12/31/2010). e Incidental Plain Tap Only - Did not drink any NYC tap water but did use unboiled/unfiltered NYC tap water to brush teeth, or to wash vegetables/fruits, or to make ice (1995-1996); expanded to include: or to make juice from concentrate (1997-2010) f No Tap - Did not drink any NYC tap water and did not use unboiled/unfiltered NYC tap water to brush teeth, or to wash vegetables/fruits, or to make ice (1995-1996); expanded to include: or to make juice from concentrate (1997-2010).
* Year 2000 percentage of interviewed cryptosporidiosis cases does not include 14 cases associated with a point source exposure at a swimming pool in Florida.
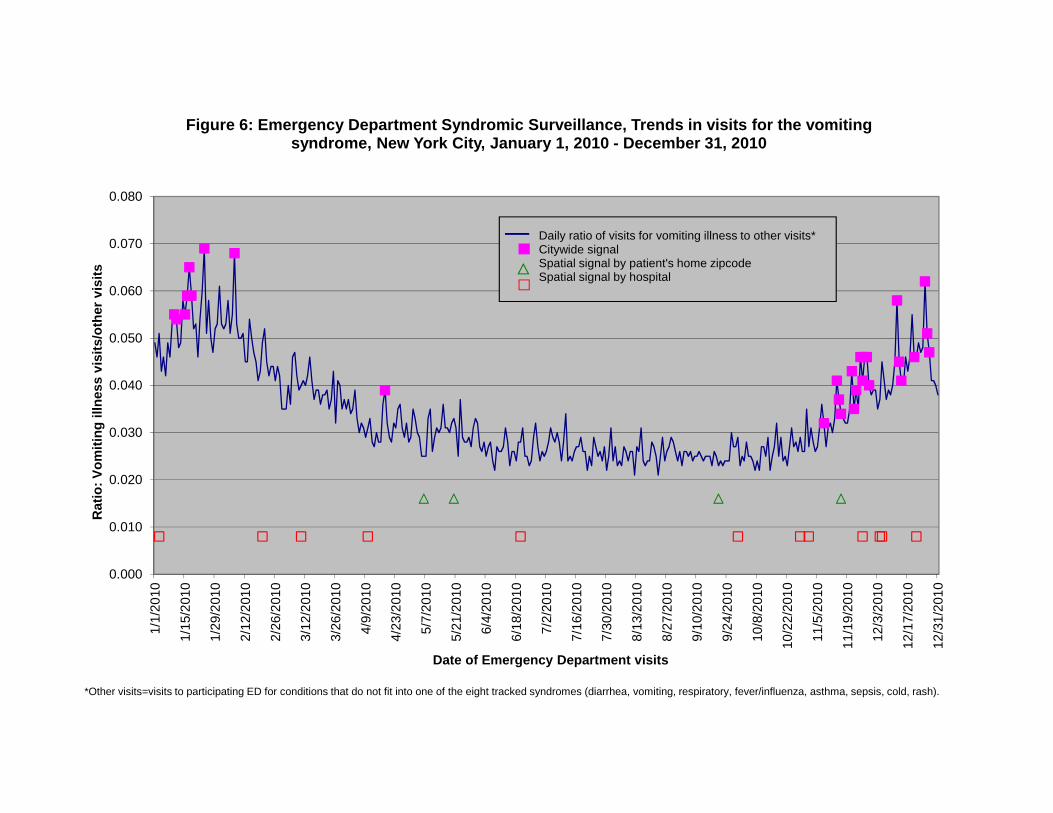
0.000
0.010
0.020
0.030
0.040
0.050
0.060
0.070
0.080
1/1/
2010
1/15
/201
0
1/29
/201
0
2/12
/201
0
2/26
/201
0
3/12
/201
0
3/26
/201
0
4/9/
2010
4/23
/201
0
5/7/
2010
5/21
/201
0
6/4/
2010
6/18
/201
0
7/2/
2010
7/16
/201
0
7/30
/201
0
8/13
/201
0
8/27
/201
0
9/10
/201
0
9/24
/201
0
10/8
/201
0
10/2
2/2
010
11/5
/201
0
11/1
9/2
010
12/3
/201
0
12/1
7/2
010
12/3
1/2
010
Rat
io: V
omiti
ng il
lnes
s vi
sits
/oth
er v
isits
Date of Emergency Department visits
Figure 6: Emergency Department Syndromic Surveillance, Trends in visits for the vomiting syndrome, New York City, January 1, 2010 - December 31, 2010
*Other visits=visits to participating ED for conditions that do not fit into one of the eight tracked syndromes (diarrhea, vomiting, respiratory, fever/influenza, asthma, sepsis, cold, rash).
Daily ratio of visits for vomiting illness to other visits*Citywide signalSpatial signal by patient's home zipcodeSpatial signal by hospital

0.000
0.005
0.010
0.015
0.020
0.025
0.030
0.035
0.040
1/1/
2010
1/15
/201
0
1/29
/201
0
2/12
/201
0
2/26
/201
0
3/12
/201
0
3/26
/201
0
4/9/
2010
4/23
/201
0
5/7/
2010
5/21
/201
0
6/4/
2010
6/18
/201
0
7/2/
2010
7/16
/201
0
7/30
/201
0
8/13
/201
0
8/27
/201
0
9/10
/201
0
9/24
/201
0
10/8
/201
0
10/2
2/2
010
11/5
/201
0
11/1
9/2
010
12/3
/201
0
12/1
7/2
010
12/3
1/2
010
Rat
io: D
iarr
heal
illn
ess
visi
ts/o
ther
vis
its
Date of Emergency Department visits
Figure 7: Emergency Department Syndromic Surveillance, Trends in visits for the diarrhea syndrome, New York City, January 1, 2010 - December 31, 2010
*Other visits=visits to participating ED for conditions that do not fit into one of the eight tracked syndromes (diarrhea, vomiting, respiratory, fever/influenza, asthma, sepsis, cold, rash).
Daily ratio of visits for diarrhea to other visits*Citywide signalSpatial signal by patient's home zipcodeSpatial signal by hospital

Figure 8: Signals for Gastrointestinal Illness, Syndromic Surveillance Systems,New York City, January 1, 2010 - June 30, 2010
Surv
eilla
nce S
yste
ms
EDCityDiar EDCityVomLab ALab BADMOTCNHome
- - - - - - - - - - - - - - - - - - - - - - - - - - - - - - - - - - - - - - - - - - - - - - - - - - - - - - - - - - - - - - - - - - - - - - - - - - - - - - - - - - - - - - - - - - - - - - - - - - - - - - - - - - - - - - - - - - - - - - - - - - - - - - - - - - - - - - - - - - - - - - - - - - - - - - - - - - - - - - - - - - - - - - - - - - - - - - - - - - - - - - - - - - - - -
Date of Signal
1/1/
10
1/7/
10
1/13
/10
1/19
/10
1/25
/10
1/31
/10
2/6/
10
2/12
/10
2/18
/10
2/24
/10
3/2/
10
3/8/
10
3/14
/10
3/20
/10
3/26
/10
4/1/
10
4/7/
10
4/13
/10
4/19
/10
4/25
/10
5/1/
10
5/7/
10
5/13
/10
5/19
/10
6/18
/10
6/24
/10
6/30
/10
5/25
/10
5/31
/10
6/6/
10
6/12
/10
ED CityDiar: Emergency Department Citywide signal for diarrhea ED CityVom: Emergency Department Citywide signal for vomiting Lab A: Clinical Laboratory Monitoring signal for submissions for ova and parasites or bacterial culture and sensitivity Lab B: Clinical Laboratory Monitoring signal for submissions for ova and parasites or bacterial culture and sensitivity Note: Lab B discontinued operations 3/10/2010. See text for details. ADM: Citywide signal for daily antidiarrheal medication sales in DEP system. Note: ADM signal system began 3/10/2010 with EARS implementation. See text for details. OTC: Signal for daily antidiarrheal medication sales in DOHMH system. NHome: Sentinel Nursing Home Gastrointestinal Outbreak. Indicates the first day of the outbreak.

Figure 9: Signals for Gastrointestinal Illness, Syndromic Surveillance Systems,New York City, July 1, 2010 - December 31, 2010
Su
rvei
llanc
e S
yste
ms
EDCityDiarEDCityVomLab AADMOTCNHome
- - - - - - - - - - - - - - - - - - - - - - - - - - - - - - - - - - - - - - - - - - - - - - - - - - - - - - - - - - - - - - - - - - - - - - - - - - - - - - - - - - - - - - - - - - - - - - - - - - - - - - - - - - - - - - - - - - - - - - - - - - - - - - - - - - - - - - - - - - - - - - - - - - - - - - - - - - - - - - - - - - - - - - - - - - - - - - - - - - - - - - -
Date of Signal
7/1/
10
7/7/
10
7/13
/10
7/19
/10
7/25
/10
7/31
/10
8/6/
10
8/12
/10
8/18
/10
8/24
/10
8/30
/10
9/5/
10
9/11
/10
9/17
/11
9/23
/10
9/29
/10
10/5
/10
10/1
1/10
10/1
7/10
10/2
3/10
10/2
9/10
11/4
/10
11/1
0/10
11/1
6/10
12/1
6/10
12/2
2/10
12/2
8/10
11/2
2/10
11/2
8/10
12/4
/10
12/1
0/10
ED CityDiar: Emergency Department Citywide signal for diarrhea ED CityVom: Emergency Department Citywide signal for vomiting Lab A: Clinical Laboratory Monitoring signal for submissions for ova and parasites or bacterial culture and sensitivity ADM: Citywide signal for daily antidiarrheal medication sales in DEP system Note: ADM signal system began 3/10/2010 with EARS implementation. See text for details. OTC: Signal for daily antidiarrheal medication sales in the DOHMH system NHome: Sentinel Nursing Home Gastrointestinal Outbreak. Indicates the first day of the outbreak

• Wash your children well (especially therear end) with soap and water beforethey go in the pool.
• Don’t allow kids in the pool if theyhave diarrhea.
• Take your kids to the bathroom often.When your child says “I have to go” it maybe too late.
• Change swim diapers in the bathroom–notby the pool.
• Wash hands well with soap and water afterchanging diapers or using the bathroom.
Special thanks to the Centers for Disease Control and PreventionHealthy Swimming • www.cdc.gov/healthyswimming
Healthy
Even in the best maintainedpools, germs can get inthe water and makepeople sick.
Parents with Young Kids:
Swimming
• Don’t go in the pool if you have diarrhea.Don’t go back in the pool until 2 weeksafter you stop having diarrhea.
• Shower with soap before going in the pool.• Wash your hands well with soap andwater after using the bathroom.
• Don’t swallow pool water.
All Swimmers:


![Waterborne Disease [FINAL]](https://static.fdocuments.in/doc/165x107/55a6e1d11a28ab9a558b4647/waterborne-disease-final.jpg)