Water Year Book 2012-13
133
1 1.0 Introduction 1.1 General This water year book presents data of seven hydrological observation stations, alongwith general information about basins and trend analysis for annual runoff, for the water year 2012-13 in Purna, Vaitarna, Ambica, Dhadhar, Kim, Wagh and Damanganga rivers. The data of 07 sites which are included in this book are collected by Tapi division, Central Water Commission, Surat under Hydrological Observation Circle, Gandhinagar. Jurisdiction map of Tapi division, CWC, Surat is enclosed at Plate-1. Central Water commission is conducting hydrological observations on major west flowing river basins under various schemes viz national network (NNW), 80-key stations, 163- key stations and flood forecasting (FF). The scheme wise distributions of sites are shown in the table-1. Table-1: Scheme wise distributions of sites Sl. No. Name of Site Station Code Scheme Type 1. Purna at Mahuwa 01 02 19 001 NNW GDS WQ 2. Vaitarna At Durvesh 01 02 25 001 NNW GDS WQ 3. Ambica at Gadat 01 02 20 001 80 Key stations GDSWQ 4. Dhadhar At Pingalwada 01 02 14 001 163 Key stations GD WQ 5. Kim at Motinaroli 01 02 16 001 163 Key stations GDWQ 6. Wagh at Ozerkheda 01 02 24 002 FF GD 7. Damanganga at Nanipalsan 01 02 24 001 FF GD 2.0 Description of River Basins There are 6 independent river basins as given below under the jurisdiction of Tapi Division, Central Water Commission, Surat, 1. Purna Basin 2. Ambica Basin 3. Vaitarna Basin 4. Dhadhar Basin 5. Damanganga Basin 6. Kim Basin Description of these river basin is given in subsequent sections of this year book.
Transcript of Water Year Book 2012-13

1
1.0 Introduction
1.1 General
This water year book presents data of seven hydrological observation stations,
alongwith general information about basins and trend analysis for annual runoff, for
the water year 2012-13 in Purna, Vaitarna, Ambica, Dhadhar, Kim, Wagh and
Damanganga rivers. The data of 07 sites which are included in this book are collected
by Tapi division, Central Water Commission, Surat under Hydrological Observation
Circle, Gandhinagar. Jurisdiction map of Tapi division, CWC, Surat is enclosed at
Plate-1. Central Water commission is conducting hydrological observations on major
west flowing river basins under various schemes viz national network (NNW), 80-key
stations, 163- key stations and flood forecasting (FF). The scheme wise distributions
of sites are shown in the table-1.
Table-1: Scheme wise distributions of sites
Sl. No. Name of Site Station Code Scheme Type
1. Purna at Mahuwa 01 02 19 001 NNW GDS WQ
2. Vaitarna At Durvesh 01 02 25 001 NNW GDS WQ
3. Ambica at Gadat 01 02 20 001 80 Key stations GDSWQ
4. Dhadhar At Pingalwada 01 02 14 001 163 Key stations GD WQ
5. Kim at Motinaroli 01 02 16 001 163 Key stations GDWQ
6. Wagh at Ozerkheda 01 02 24 002 FF GD
7. Damanganga at Nanipalsan 01 02 24 001 FF GD
2.0 Description of River Basins
There are 6 independent river basins as given below under the jurisdiction of Tapi
Division, Central Water Commission, Surat,
1. Purna Basin
2. Ambica Basin
3. Vaitarna Basin
4. Dhadhar Basin
5. Damanganga Basin
6. Kim Basin
Description of these river basin is given in subsequent sections of this year book.

2
1.2 Jurisdiction Map of Tapi division, CWC, Surat.
Plate – 1

49
2.1 Purna Basin
2.1.1 Geographical setting of Purna Bain
Purna River is an important west flowing river with its catchment lying in
Ahwaa,Valsad and Navsari districts of Gujarat and in Nasik district of Maharashtra.
The Purna basin can be divided into three prominent physiographic regions, i.e.
i) eastern parts, (ii) the middle reaches and (iii) the coastal zones.
The eastern parts of the basin cover a chain of rugged mountain ranges of the Western
Ghats running at an elevation of above 1300 m and descending to an elevation of
about 100 m at the edges of uplands of the Surat district. The middle reaches of the
basin area are marked by high relief zone with ridges and valleys. The hilly zone then
merges into the plains through an undulating piedmont coastal zone running parallel
to the sea. Basin map of Purna River is shown in Plate-2.1.1.
2.1.2 River System
The river Purna rises in the Saputara hills of the Western Ghats near the village
Chinchi in Maharashtra. The length of the river from its source to outflow in the
Arabian Sea is about 180 km.
Plate-2.1.1
50
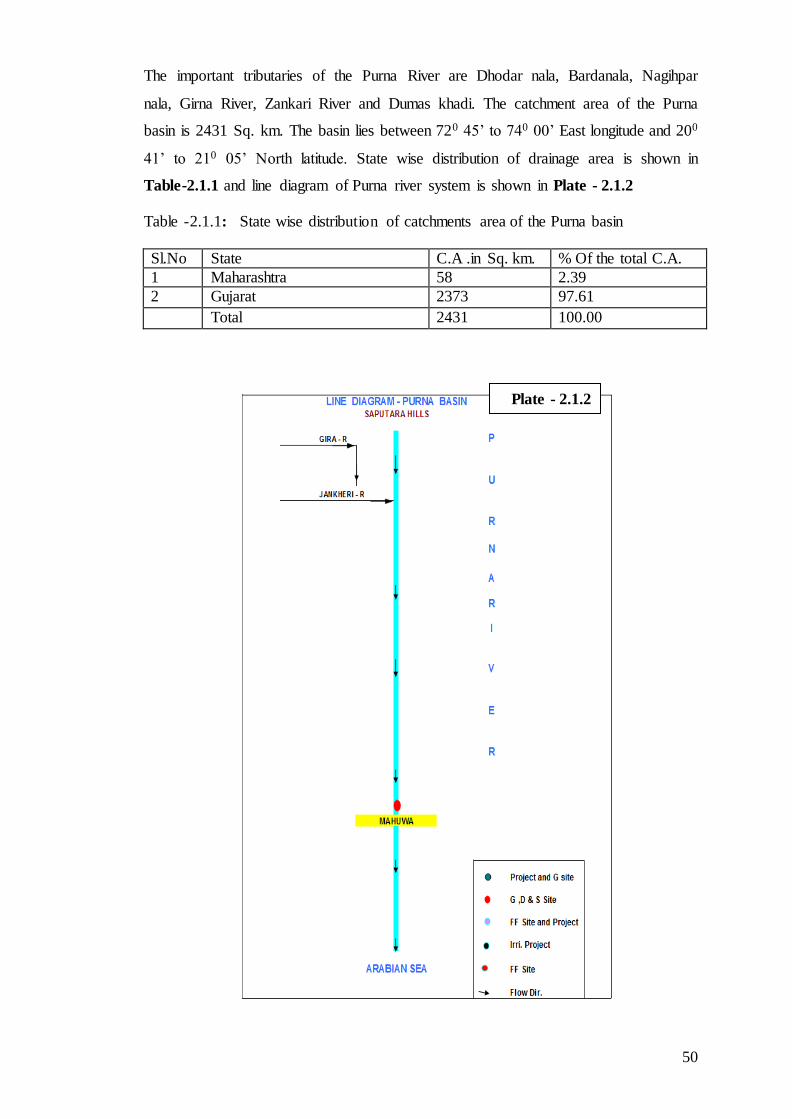
The important tributaries of the Purna River are Dhodar nala, Bardanala, Nagihpar
nala, Girna River, Zankari River and Dumas khadi. The catchment area of the Purna
basin is 2431 Sq. km. The basin lies between 720 45’ to 740 00’ East longitude and 200
41’ to 210 05’ North latitude. State wise distribution of drainage area is shown in
Table-2.1.1 and line diagram of Purna river system is shown in Plate - 2.1.2
Table -2.1.1: State wise distribution of catchments area of the Purna basin
Sl.No State C.A .in Sq. km. % Of the total C.A.
1 Maharashtra 58 2.39
2 Gujarat 2373 97.61
Total 2431 100.00
Plate - 2.1.2

51
2.1.3 Purna Basin as per Watershed Atlas of India
As per Watershed Atlas of India, Published by Department of Agriculture and
Cooperation, Ministry of agriculture, Krishi Bhavan New Delhi (1990), the sub
catchments under 5B2D pertain to Purna Basin.
2.1.3.1 Subcatchment -5B2D (5B2D7 & 5B2D8)
This Sub Catchment is situated in the plain and hilly region of Gujarat, and
Maharashtra drained by Dhodar nala, Bardanala, Nagihpar nala, Girna River, Zankari
River and Dumas khadi. The total area of this Sub-Catchment is 2431 Sqkm.
Subcatchment area of Purna Basin is shown in Fig.-2.1.1
Fig-2.1.1: Sub catchment area of Purna Basin as per water shed Atlas of India.
Source: Watershed Atlas of India, Published by Department of Agriculture and Cooperation, Ministry
of agriculture, Krishi Bhavan New Delhi (1990)
2.1.4 Climate
Accordingly to Koeppan’s Scheme, the climate of the basin is classified as AW-
Tropical Savannah as most of the peninsular plateau, south of Tropic of Cancer is
classified. In the initial reaches, the climate is influenced by the Western Ghats which
becomes continued as the river reaches the coastal plains. The climatic variations are
experienced in the patterns of temperature, rainfall & winds, rhythm of seasons and
degree of wetness or dryness. These are described as follows:
2.1.4.1 Temperature
The Temperature is maximum in the month of May and Minimum in the month of
December to January. The maximum, minimum temperatures observed at site

52
Mahuwa varies from 270 C to 460 C and 300 C to 100 C respectively. The temperature
profile in the basin is given in the Table -2.1.2
Table-2.1.2: Mean monthly Temperature (0C) during water year at site Mahuwa
Month Mean Monthly Maximum Temperature (oC)
Mean Monthly Minimum Temperature (oC)
Jun-12 33.4 26.8
Jul-12 29.4 25.3
Aug-12 29.3 24.4
Sep-12 29.3 24.0
Oct-12 32.6 23.2
Nov-12 33.4 17.2
Dec-12 32.1 17.2
Jan-13 31.2 14.7
Feb-13 32.9 18.0
Mar-13 38.2 20.2
Apr-13 35.7 23.9
May-13 37.6 26.1
Annual mean 32.9 21.8
2.1.4.2 Rainfall
The basin receives most of the rainfall from the South West monsoon from June to
September. Average annual rainfall in the basin is 1584 mm. The rainfall at site
Mahuwa in Purna Basin shown in Table - 2.1.3.
Table -2.1.3 Mean annual rainfall at site Mahuwa in Purna Basin
Sl.No Name of Site
Data available
(No of
Years )
Average Annual
Rainfall (mm)
Average no of
rainy days
Rainfall in the
year 2012-13
No of rainy
days in
2012-13
1 Mahuwa 27 1583.8 73 1081.2 72
Table-2.1.4: Seasonal Rainfall during Water Year 2012-13 at Mahuwa in Purna basin
Sl
No
Name of Site
Seasonal Rainfall (mm) in 2012-13 Total
Annual
Rainfall
Winter
monsoon
Pre
monsoon
South-West
monsoon
Post
monsoon
(Jan-
Feb)
(Mar-
May)
(June-Sept) (Oct-
Dec)
1 Mahuwa 0 0 1068.8 12.4 1081.2
2.1.4.3 Wind

53
The wind speed and direction profile at site Mahuwa, based on collected data is given
in table -2.1.5. The average monthly wind speed varies from 2.9 km/h to 0.2 km/h .In
the pre and post-monsoon period, the wind speed is generally higher. The pre
dominant wind direction is NE followed by SE and W.
Table 2.1.5: Wind Speed at site Mahuwa in Purna basin during Water Year 2012-13
Month Mean monthly wind Speed (km/h)
June 2.1
July 0.5
August No data
September 0.2
October 0.2
November 0.2
December 0.2
January 0.6
February 0.6
March 0.6
April 0.8
May 1.2
2.1.4.4 Humidity
The relative Humidity in Purna basin at site Mahuwa varies between 97.7% and
81.2% depending upon the season. It is naturally maximum in the monsoon period and
is around 84.2 to 97.7%. In the winter months of November and December, the
relative humidity decreases. The relative humidity profile at station Mahuwa in Purna
Basin is given in table -2.1.6
Table 2.1.6: Mean monthly Relative Humidity at site Mahuwa in Purna Basin
during Water Year 2012-13
Month Relative Humidity (%)
June 90.2
July 96.8
August 97.7
September 96.7
October 89.0
November 79.1
December 80.4
January 76.1
February 81.0
March 75.2
April 82.0
May 82.8
Annual Mean 85.6

54
2.1.5 Geology
The whole basin can be divided in to three prominent physiographic zones viz. i) the
Eastern zone ii) the middle zone and ii) the coastal zone. The Eastern zone of the
basin covers a chain of rugged mountain ranges of the Western Ghats. The middle
zone of the basin is marked by high relief zone with ridges and valleys. The hilly
region then merges in to the plains through a coastal piedmont coastal zone running
parallel to the sea. Deccan traps occupy the most parts of the basin. In the East there
are high ridges and deep valleys and towards the west, they merge into the lower reach
composed of recent and sub recent alluvium and blown sand. The straight graphical
sequences of the rocks found in the basin are Neogene’s, Palaeogene and early
Palaeogene.
2.1.6 Soil
Soils of Purna basin can be classified into three groups viz lateritic soils, deep black
soils and coastal alluvial soils.

55
2.2 Ambica Basin
2.2.1 Geographical setting of Ambica Basin
Ambica River is one of the important west flowing rivers with its catchment in
Gujarat and Maharashtra. The Ambica basin which is adjacent to the Auranga basin
can be divided in to two prominent physiographic zones. The eastern part comes under
a rugged mountain chain of the Sahyadri Western Ghats and descending on the
western side to the edge of the uplands of Surat district. This region is situated at
general elevation ranging from 1050 m to 100 m. The western part consists of hills
and valleys which generally lie below 100 m elevation. Its basin map is shown in
Plate -2.2.1.
2.2.2 River System
It originates from Saputara Hill ranges near village Kotambi of Surgana taluka in the
Nasik district of Maharashtra. After flowing for a length of 136 km it drains in to the
Arabian Sea. The important tributaries of the Ambica River are Kapri, Wallan, Kaveri
and Kharera. The river Ambica basin lies between 20 31’ and 20 57’ North latitude
Plate -2.2.1

56
and 72 48’ and 73 52’ East longitude with a drainage area of 2715 Sq.km. The
Valsad, Dangs and Surat Districts of Gujarat and a small portion of the Nasik district
of Maharashtra falls in the basin, drainage area of Ambica River basin is shown in
Table-2.2.1 and line diagram of Ambica river system is shown in Plate - 2.2.2.
Table -2.2.1: State wise distribution of catchments area of the Ambica basin
Sl.No State Catchment Area (sq km) % Of the total C.A.
1 Maharashtra 102 3.76
2 Gujarat 2613 97.24
Total 2715 100.00
Plate - 2.2.2

57
2.2.3 Ambica Basin as per Watershed Atlas of India
As per Watershed Atlas of India, Published by Department of Agriculture and
Cooperation, Ministry of agriculture, Krishi Bhavan New Delhi (1990), the sub
catchments from 5B2D pertain to Ambica Basin, as shown in Fig.-2.2.1.
2.2.3.1 Sub-catchment -5B2D (5B2D3, 5B2D4 & 5B2D5)
This Sub Catchment is situated in the plain and hilly region of Gujarat, and
Maharashtra drained by Kapri, Wallan, Kaveri and Kharera. The total area of this
Sub-Catchment is 2715 Sqkm. Subcatchment area of Ambica Basin is shown in Fig.
2.2.1
Fig-2.2.1: Sub- catchment area of Ambica Basin as per water shed Atlas of India.
Source: Watershed Atlas of India, Published by Department of Agriculture and Cooperation, Ministry
of agriculture, Krishi Bhavan New Delhi (1990)
2.2.4 Climate
Accordingly to Koeppan’s Scheme, the climate of the basin is classified as AW-
Tropical Savannah, as most of the peninsular plateau, south of Tropic of Cancer, is
classified. In the initial reaches, the climate is influenced by the Western Ghats which
gradually changes as the river reaches the coastal plains. The climatic variations are
experienced in the patterns of temperature, rainfall & winds, rhythm of seasons and
degree of wetness or dryness. These are described as follows.
2.2.4.1 Temperature
The Temperature is maximum in the month of May and Minimum in the month of
December to January. The maximum, minimum temperatures observed vary from
320C to 400C and 250C to 80 C respectively. The temperature profile in the basin is
given in the table 2.2.2

58
Table-2.2.2: Mean monthly Temperature (0C) during water year at site Gadat
Month Mean Monthly Maximum
Temperature (oC)
Mean Monthly Minimum
Temperature (oC)
Jun-12 33.7 26.7
Jul-12 29.8 26.3
Aug-12 29.5 25.5
Sep-12 30.1 25.3
Oct-12 34.2 22.6
Nov-12 32.0 16.4
Dec-12 30.9 15.4
Jan-13 27.8 12.2
Feb-13 30.0 15.3
Mar-13 35.5 18.4
Apr-13 33.6 22.1
May-13 36.4 26.6
Annual mean 32.0 21.1
2.2.4.2 Rainfall
The basin receives most of the rainfall from the South West monsoon from June to
September. Average annual rainfall in the basin is 1737 mm. The rainfall at site in
Ambica Basin shown in Table -2.2.3 & 2.2.4.
Table -2.2.3: Mean annual rainfall of Ambica Basin at site Gadat
Sl.
No
Name of
Site
Data available
(No of Years )
Average
Rainfall (mm)
Average
no of rainy days
Rainfall
in the year
2012-13
No of
rainy days in
2012-13
1 Gadat 30 1737.3 74 1176.1 67
Table-2.2.4: Seasonal Rainfall during Water Year 2012-13 at site Gadat in
Ambica Basin
Sl No
Name of Site
Seasonal Rainfall (mm) in 2012-13 Total Annual
Rainfall Winter
monsoon
Pre
monsoon
South-West
monsoon
Post
monsoon
(Jan-Feb) (Mar-May) (June-Sept) (Oct-Dec)
1 Gadat 0 0 1164.7 11.4 1176.1

59
2.2.4.3 Wind
The wind speed and direction profile at site Gadat based on collected data is given in
Table -2.2.5.The average monthly wind speed varies from 0.5 km/h to 2.5 km/h .In
the pre and post-monsoon period, the wind speed is generally higher. The pre
dominant wind direction is S/SE.
Table 2.2.5: Wind Speed and Direction at site Gadat in Ambica basin during Water
Year 2012-13
Month Mean monthly wind Speed
(km/h) Dominant Direction
June 2.9 S
July 2.0 S
August 1.6 S
September 1.0 S
October 0.5 SE
November 0.3 SE
December 0.4 SW
January 0.6 SE
February 0.7 SW
March 0.8 N/SW
April 1.2 NE
May 2.0 N
Annual Mean 1.2 -
2.2.4.4 Humidity
The relative Humidity in Ambica basin varies between 92 % to 82.0 % depending
upon the season the humidity is naturally maximum in the monsoon period and is
around 90 to 92 %. In the winter months of November and December the relative
humidity comes down. The relative humidity at station of CWC representative of
Purna Basin is given in Table- 2.2.6

60
Table -2.2.6: Mean monthly Relative Humidity at site Gadat in Ambica Basin
during Water Year 2012-13
Month Relative Humidity (%)
June 92.0
July 92.0
August 92.0
September 92.0
October 91.3
November 89.6
December 89.0
January 88.4
February 89.2
March 90.3
April 91.3
May 82.0
Annual Mean 89.9
2.2.5 Geology
The basin can be divided into two prominent physiographic zones. The eastern part
comes under rugged mountain chains of the Saputara Hills and descends on the
western side to the edge of the uplands of Surat district. This region is placed at a
general elevation of 1050 m to 100 m. The western part, barring the coastal plain, is
essentially in the sub Sahyadrin zone of hills and valleys generally below 100 m
elevation. Deccan traps and intermediate amphitheatres have developed out of the
alluvial debris washed from the hills. The lower reaches of the basin upto the coastal
margins are mainly alluvial plains
2.2.6 Soil
Soil of Ambica basin can be broadly classified into three group viz. Laterite soil, deep
black soil and alluvial soil.

61
2.3 Vaitarna Basin
2.3.1 Geographical setting of Vaitarna Basin
The river Vaitarna is one of the west flowing rivers in the region North of Mumbai
and South of the Tapi River. The river rises in the Sahyadri hill range in the Nasik
district of Maharashtra State and after traversing a distance of about 120 km in
Maharashtra joins the Arabian Sea. Basin map is shown in Plate -2.3.1. The Vaitarna
basin lies between East longitude of 720 45’ to 730 35’ and North latitude of 190 25’to
200 20’.
Plate -2.3.1
2.3.2 River System
The headstreams of the Vaitarna rise on the southern slopes of the Triambak-Anjaneri
range and combine into three southward flowing streams which unite to form the
Vaitarna a little north of Dapure. The Vaitarna from here has a very winding course
southwards and goes round Zarwad (Jarwar) Budruk.
Due south of it, the river is joined by its tributary Alvand nadi, whose headstreams
rise in the same Triambak Anjaneri range on the southern slopes of the Bhaskargad,
Phani dongar and Harish dongar, which form the divide between these and those of
the Val river flowing northwards. After the confluence with the Alvand river, the
Vaitarna turns and flows nearly straight in a south-south-west direction cutting a deep

62
gorge in the scarp of the Sahyadris. A small tributary from the northwest to south-east
in a gorge continues the course of the Vaitarna in a remarkably deeply cut valley.
The main tributaries of Vaitarna river are Pinjal, Ganjai, Surya, Daharji, Tansa. The
catchment area of Vaitarna basin completely lies in Thane and Nasik districts of
Maharashtra. The Vaitarna drains an area of 2019 sq km before it falls in Gulf of
Khambhat. A line diagram of Vaitarna river system is shown in Plate -2.3.2.
Plate-2.3.2

63
2.3.3 Vaitarna Basin as per Watershed Atlas of India
As per Watershed Atlas of India, Published by Department of Agriculture and
Cooperation, Ministry of agriculture, Krishi Bhavan New Delhi (1990), the sub
catchments from 5B2C pertain to Vaitarna Basin as shown in Fig 2.3.1.
2.3.3.1 Sub-catchment -5B2C (5B2C2 to 5B2C5)
This Sub Catchment is situated in the plain region of Maharashtra. Drained by main
tributaries of Vaitarana River , Pinjal, Surya, Daharji, Tansa. The total area of this
Sub-Catchment is 2019 sq km.
Fig 2.3.1 Sub catchment area of Vaitarna Basin as per water shed Atlas of India.
Source: Watershed Atlas of India, Published by Department of Agriculture and Cooperation, Ministry
of agriculture, Krishi Bhavan New Delhi (1990)
2.3.4 Climate
Accordingly to Koeppan’s Scheme, the climate of the basin is classified as AW-
Tropical Savannah, as most of the peninsular plateau, south of Tropic of Cancer is
classified. In the initial reaches, the climate is influenced by the Western Ghats that
becomes coastal as the river reaches coastal plains. The climatic variations are
64
experienced in the patterns of temperature, rainfall & winds, rhythm of seasons and
degree of wetness or dryness. These are described as follows.
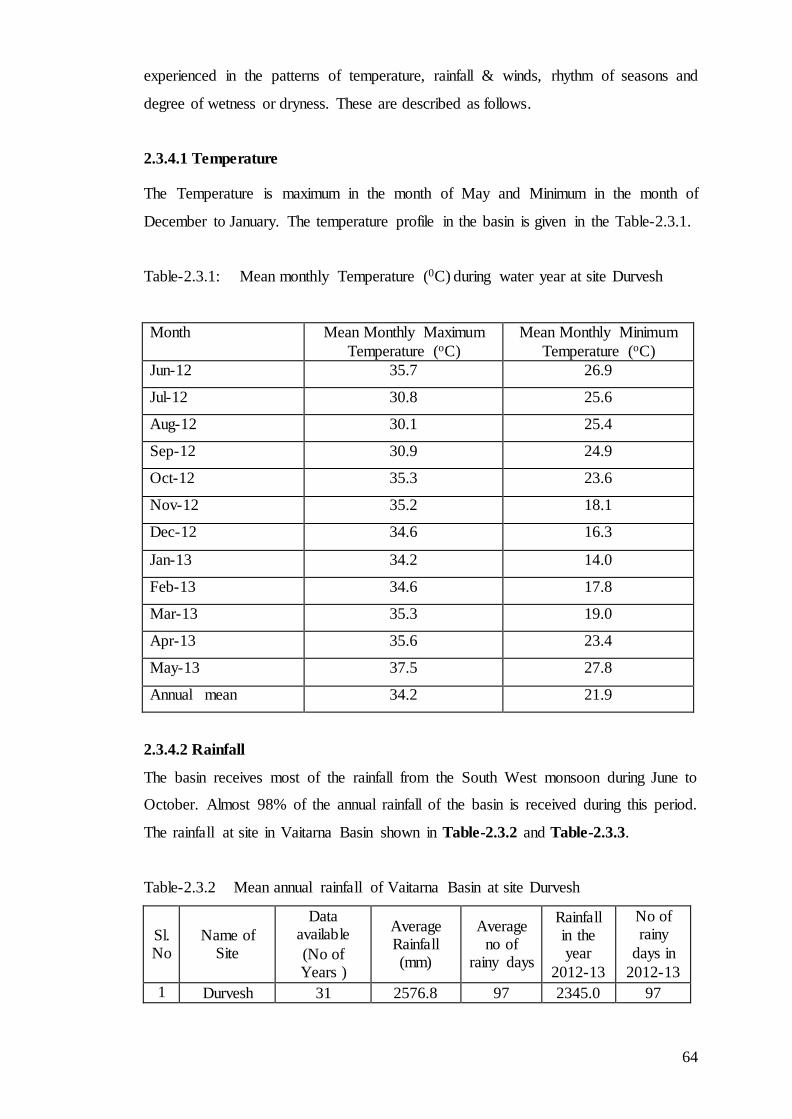
2.3.4.1 Temperature
The Temperature is maximum in the month of May and Minimum in the month of
December to January. The temperature profile in the basin is given in the Table-2.3.1.
Table-2.3.1: Mean monthly Temperature (0C) during water year at site Durvesh
Month Mean Monthly Maximum
Temperature (oC)
Mean Monthly Minimum
Temperature (oC)
Jun-12 35.7 26.9
Jul-12 30.8 25.6
Aug-12 30.1 25.4
Sep-12 30.9 24.9
Oct-12 35.3 23.6
Nov-12 35.2 18.1
Dec-12 34.6 16.3
Jan-13 34.2 14.0
Feb-13 34.6 17.8
Mar-13 35.3 19.0
Apr-13 35.6 23.4
May-13 37.5 27.8
Annual mean 34.2 21.9
2.3.4.2 Rainfall
The basin receives most of the rainfall from the South West monsoon during June to
October. Almost 98% of the annual rainfall of the basin is received during this period.
The rainfall at site in Vaitarna Basin shown in Table-2.3.2 and Table-2.3.3.
Table-2.3.2 Mean annual rainfall of Vaitarna Basin at site Durvesh
Sl.No
Name of Site
Data available
(No of Years )
Average Rainfall (mm)
Average no of
rainy days
Rainfall in the year
2012-13
No of rainy
days in
2012-13
1 Durvesh 31 2576.8 97 2345.0 97

65
Table-2.3.3: Seasonal Rainfall during Water Year 2012-13 at site Durvesh in
Vaitarna basin
Sl
No
Name of
Site
Seasonal Rainfall (mm) in 2012-13 Total
Annual
Rainfall
Winter
monsoon
Pre
monsoon
South-West
monsoon
Post
monsoon
(Jan-Feb) (Mar-May) (June-Sept) (Oct-Dec)
1 Durvesh 0 0 2302.4 42.6 2345.0
2.3.4.3 Wind
The wind speed and direction profile at site Gadat based on collected data is given in
Table-2.3.4. The average wind speed in the Vaitarna basin varies about 1.7 km/h to
6.8 km/h. In the pre and post-monsoon period, the wind speed is generally higher. The
predominant wind direction is SW.
Table-2.3.4:Wind Speed at site Durvesh inVaitarna basin during Water Year 2012-13
Month Mean monthly wind Speed (km/h)
June 5.6
July *
August 4.2
September 3.5
October 2.2
November 2.0
December 2.0
January 1.8
February 2.2
March 3.1
April 3.7
May 4.4
Annual Mean 2.9
2.3.4.4 Humidity
The relative Humidity in Vaitarna basin varies between 92% and 70% depending upon
the season. Humidity is maximum in the monsoon period about 89 to 92 %. In the
winter months of November and December, it decreases. Relative humidity at
Durvesh station of CWC is given in Table-2.3.5.

66
Table-2.3.5: Mean monthly Relative Humidity at site Durvesh in Vaitarna Basin
during Water Year 2012-13
Month Relative Humidity (%)
June 89.0
July 91.1
August 91.5
September 92.0
October 85.7
November 80.8
December 82.4
January 78.6
February 73.5
March 70.4
April 85.9
May 86.3
Annual Mean 83.9
2.3.5 Geology
The Great Trap region of the Deccan covers the maximum part of the Basin. It is
entirely of volcanic formation. The volcanic portion consists of compact, stratified
basalts, and an earthy trap. The basalts are the most conspicuous geological feature.
To the west they lie in flat-topped ranges, separated by valleys, trending from west to
east. In some flows the- basalt is columnar and then it weathers into the fantastic
shapes. The formation at the base of the traps is chiefly amygdaloidal, containing
quartz in vertical veins, crystals and zeolitic minerals, especially apophyllite
weathering into a gray soil. The absence of laterite, which caps the summits of the
hills to the south, is a curious feature in the geology of the area. The basalt is either
fine textured or it is coarse and nodular.
2.3.6 Soil
The valleys are filled with disintegrated basalt of various shades from gray to black,
washed down by rain. It is of argillaceous nature. This soil is not favorable to the
growth of large trees but it is very fertile for cereals and pulses. The black soil
contains high alumina and carbonates of calcium and magnesium with variable
67
amounts of potash, low nitrogen and phosphorus. There are broadly two groups of
soils: 1) Red coarse soil & 2) Alluvial soil
The red soil is less common and is suitable for cultivation under a heavy and
consistent rainfall. Red coarse soil derived from disintegration of basaltic rock
fragments under heavy rainfall. The rock fragments have undergone intensive
weathering and beaching with the surface weathered and fragmented materials being
carried away with the heavy run off in the monsoon period. The residual soil left
behind is usually reddish yellow in colour, shallow in depth, coarse sandy loam to
sandy loam in texture, rapidly drained and low in fertility. Alluvial soil formed with
the deposition of transported materials brought out by heavy run off. This soil is deep
to very deep yellowish brown to grayish brown in colour and clay loam to salty loam
in texture. This soil is normally free from salinity and alkalinity.
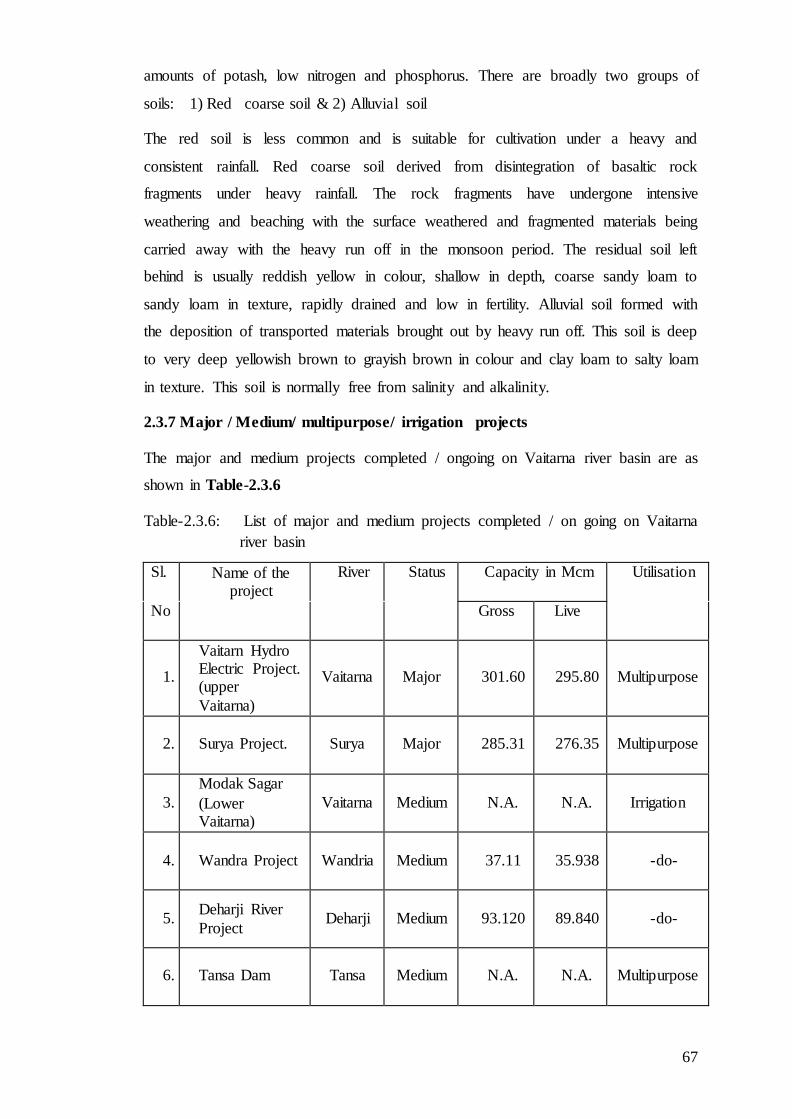
2.3.7 Major / Medium/ multipurpose/ irrigation projects
The major and medium projects completed / ongoing on Vaitarna river basin are as
shown in Table-2.3.6
Table-2.3.6: List of major and medium projects completed / on going on Vaitarna
river basin
Sl. Name of the project
River Status Capacity in Mcm Utilisation
No Gross Live
1.
Vaitarn Hydro Electric Project. (upper
Vaitarna)
Vaitarna Major 301.60 295.80 Multipurpose
2. Surya Project. Surya Major 285.31 276.35 Multipurpose
3.
Modak Sagar
(Lower Vaitarna)
Vaitarna Medium N.A. N.A. Irrigation
4. Wandra Project Wandria Medium 37.11 35.938 -do-
5. Deharji River
Project Deharji Medium 93.120 89.840 -do-
6. Tansa Dam Tansa Medium N.A. N.A. Multipurpose

68
2.3.7.1 Vaitarna hydropower project
Vaitarna hydropower project is located near Vaitarna and Alwandi masonry and
earthen dam on Vaitarna and Alwandi Rivers, 30 km from Ghoti, in Nashik District,
Maharashtra. The catchment area at the dam is 160.8 km2. The height and length of
the dam is 47 m and 555 m respectively. The reservoir has a live storage capacity of
35 MCM at FRL 603.5 m and the MDDL is at 580 m. The power house has a unit of
60 MW. It has a firm power of 11 MW with mean annual inflow of 635 MCM. MSEB
commissioned the project in 1976.

69
2.4 Dhadhar Basin
2.4.1 Geographical setting of Dhadhar Basin
The Dhadhar River is one of the west flowing rivers in Gujarat state. It originates from
the Pavagadh Hills of Gujarat state and flows through Vadodara and Bharuch districts.
The river Dhadhar after flowing 87 km receives Vishwamitri tributary from right bank
at Pingalwada village 500 m upstream of Gauge and Discharge site. After flowing
another 55 km it falls into the Gulf of Khambhat. The total length of the river from its
source to outfall in the Gulf of Khambhat is about 142 km.
Basin map is shown in Plate -2.4.1.
Plate- 2.4.1
2.4.2 River System
The important tributaries of the Dhadhar River are Vishwamitri, Jambuoriver, Dev
and Surya River. The catchment area of the Dhadhar basin is 3423 Sq.km. and
catchment area up to the site is 2400 Sq.km. It lies between east longitude 72 30’ and
73 45’ and North latitude 21 45’ and 22 45’. Line diagram of Dhadhar river system
is shown in Plate -2.4.2.

70
Plate -2.4.2.
2.4.3 Dhadhar Basin as per Water Shed Atlas of India
As per Watershed Atlas of India, Published by Department of Agriculture and
Cooperation, Ministry of agriculture, Krishi Bhavan New Delhi (1990), the sub
catchments from 5E1A pertain to Dhadhar Basin as shown in Fig 2.4.1.
2.4.3.1 Subcatchment -5E1A (5E1A1 to 5E1A6)
This Sub Catchment is situated in the plain region of Gujarat, The important
tributaries of the Dhadhar River are Vishwamitri, Jambuo river, Dev and Surya river.
The total area of this Sub-Catchment is 3423 sqkm.

71
Fig 2.4.1: Sub catchment area of Dhadhar Basin as per water shed Atlas of India.
Source: Watershed Atlas of India, Published by Department of Agriculture and Cooperation, Ministry of Agriculture, Krishi
Bhavan New Delhi (1990)
2.4.4 Climate
The Dhadar basin experiences seasons – summer (Mar-May), Monsoon (June-Sep) &
winter (Oct-Feb). The major part of basin comprises tropical wet climate, caused
mainly due to existence of the Western Ghats. Due to relatively high elevation in
forest land, the area of the basin near the origin of the river experiences relatively
cooler climate.
Accordingly to Koeppan’s Scheme, the climate of the basin is classified as AW-
Tropical Savannah as most of the peninsular plates, south of Tropic of Cancer are
classified. The climatic variations are experienced in the patterns of temperature,
rainfall & winds, whether of seasons and degree of wetness or dryness. These are
described as follows.
2.4.4.1 Temperature
The Temperature is maximum in the month of May and Minimum in the month of
December to January. The temperature profile in the basin is given in the table -2.4.1

72
Table-2.4.1: Mean monthly Temperature (0C) during water year at site Pingalwada
Month Mean Monthly Maximum
Temperature (oC)
Mean Monthly Minimum
Temperature (oC)
Jun-12 37.7 27.5
Jul-12 33.0 26.2
Aug-12 30.2 25.5
Sep-12 29.5 25.2
Oct-12 30.2 23.6
Nov-12 28.0 15.1
Dec-12 26.8 13.9
Jan-13 24.7 11.0
Feb-13 29.3 15.6
Mar-13 33.0 17.4
Apr-13 36.8 22.4
May-13 38.8 26.9
Annual mean 31.5 20.9
2.4.4.2 Rainfall
The basin receives most of the rainfall from the South West monsoon during June to
October. Almost 98% of the annual rainfall of the basin is received during this period.
The average annual rainfall in the Dhadar basin is 860 mm. The South - West
monsoon sets in by the middle of June and withdraws by the first week of October.
The rainfall is mainly influenced by the southwest monsoon. The effect is most
pronounced in Vadodara lying on the windward side of the Western Ghats.
The rainfall at site Pingalwada in Dhadhar Basin is shown in Table -2.4.2 and Table-
2.4.3.
Table-2.4.2 Mean annual rainfall of Dhadhar Basin at site Pingalwada
Sl.No
Name of Site
Data available
(No of Years )
Average Annual
Rainfall (mm)
Average no of
rainy days
Rainfall in the
year 2012-13
No of rainy
days in
2012-13
1 Pingalwada 22 859.5 43 670.9 46

73
Table-2.4.3 Seasonal Rainfall during Water Year 2012-13 at site Pingalwada
Sl
No
Name of
Site
Seasonal Rainfall (mm) in 2012-13 Total
Annual
Rainfall
Winter
monsoon
Pre
monsoon
South-West
monsoon
Post
monsoon
(Jan-Feb) (Mar-May) (June-Sept) (Oct-Dec)
1 Pingalwada 0 0 670.9 0 670.9
2.4.4.3 Wind
The wind speed data of the Dhadhar basin is given in table -2.4.4. The monthly
average wind speed in the Dhadhar basin varies about 1.7 km/h and 6.8 km/h. in the
pre and post monsoon period. During monsoon the monthly average wind speed is
generally higher than 4.2 km/h.
In general, wind speed is the lowest in post monsoon period (Oct-Nov) & the highest
in June. The pre dominant wind direction is NE/SE. The wind direction remains
uniform from post monsoon till early winter i.e. Oct – Feb. Change of direction takes
place in March/April. It is observed at site that the dominant wind direction is from
North east and east respectively during post monsoon and in winter changes to
Westerly and South westerly.
Table-2.4.4: Wind Speed and Direction at site Pingalwada in Dhadhar basin basin
during Water Year 2012-13
Month Mean monthly wind Speed
(km/h)
June No data
July No data
August No data
September No data
October No data
November No data
December No data
January No data
February No data
March No data
April No data
May No data
Annual Mean 2011-12 3.3

74
2.4.4.4 Humidity
The relative Humidity in Dhadhar basin varies between 89.7 % to 66.8 % depending
upon the season. Humidity is maximum in the monsoon period and is around 89.7 to
73.8 %. In the winter months of November and December, it decreases. Relative
humidity at station Pingalwada in Dhadhar Basin is given in table -2.4.5.
Table-2.4.5: Mean monthly Relative Humidity at site Pingalwada in Dhadhar Basin
during Water Year 2012-13
Month Relative Humidity (%)
June 73.8
July 85.8
August 86.5
September 89.7
October 85.1
November 75.5
December 81.1
January 78.3
February 74.4
March 66.8
April 72.2
May 68.5
Annual Mean 78.1
2.4.5 Geology
The Late Pleistocene fluvial succession is exposed as 18–20 m high incised vertical
cliffs all along the Dhadhar River basin in western India. The major fluvial
sedimentary facies of the Late Pleistocene deposits in the Dhadhar River basin have
preserved evidence of palaeo-drainage and could provide an important link between
the sub-humid Narmada basin in the south and the semi-arid Mahi basin in the north.
The sedimentary facies documented include overbank fines, which are associated with
crevasse splays. Fine grained overbank sediments are interpreted as having formed by
sheet flow of sediments over the banks of minor distributary channels during the flood
stage. The overlying thinly stratified fluvial sands and silts, at the top of the exposed
sediment succession show a thin cap of aeolian sediments suggesting less intense
aeolian activity than that observed in Sabarmati, Mahi and Orsang basins, though a

75
significant reduction in fluvial activity is suggested during the arid phase of the LGM.
However, the river may still have been perennial assuming that it retained the larger
part of the catchment.
2.4.6 Major/Medium/Multipurpose/Irrigation projects
Ajwa tank, Pratap pura, Uma Bhariara, Dhanora, Ghansarva, Haripura, Vadodara, Deo
Dam are the medium existing/ongoing projects in the basin.

76
2.5 Damanganga Basin
2.5.1 Geographical setting of Damanganga Basin
The Damanganga river rises in the Sahyadri hill ranges near village Ambegaon in
Dindori taluka of Nasik district of Maharashtra State at an elevation of 950 m above
MSL and traverses a total distance of about 131.30 km before it drains into the
Arabian Sea at Daman. Damanganga along with its tributaries mainly flows through
the hilly areas of Maharashtra, Gujarat and Union Territory Dadra and Nagar Haveli
and Daman. Basin map is shown in Plate-2.5.1. It drains total area of 2318 sq km in
Maharashtra State, Gujarat State and the Union Territories of Dadra, Nagar Haveli
(DNH) and Daman & Diu before it drains into the Arabian Sea. The Damanganga
River flows through Maharashtra State, Gujarat State and U.Ts. of DNH and Daman
& Diu, while Vagh river up to Khargihill dam entirely lies in Maharashtra State.
Plate-2.5.1
2.5.2 River System
The catchment of the river is fan shaped and the river is prone to severe flashy floods
The important tributaries of the Damanganga river are Dawan, Shrimant, Val, Rayte,
Lendi, Vagh, Sakartond, Dongarkhadi, Roshni and Dudhni. The Damanganga river

77
drains total 2318 sq km. Drainage area of Damanganga River basin is shown in
Table-2.5.1 and line diagram of Damanganga river system is shown in Plate-2.5.2.
Table -2.5.1: State wise Distribution of drainage area of Damanganga River
Sl.
No
Name of District / State Catchment area
(Sq km)
% of total
catchment area
1 Nasik / Maharashtra 1408 60.74
2 Valsad / Gujarat 495 21.36
3 Dadara & Nagar Havali & Daman U.T. 415 17.90
Total 2318 100.00
Plate-2.5.2

78
2.5.3 Damanganga Basin as per Watershed Atlas of India
As per Watershed Atlas of India, Published by Department of Agriculture and
Cooperation, Ministry of agriculture, Krishi Bhavan New Delhi (1990), the sub
catchments from 5B2C pertain to Damanganga Basin. Shown in Fig-2.5.1.
2.5.3.1 Sub catchment -5B2C (5B2C7 & 5B2C8)
This Sub Catchment is situated in the plain and hilly region of Gujarat, Maharashtra
and Union territory (DNH) drained by Lendi, Sakkartond, Rashni, Val, Vagh, Donger
Khadi, Pipariya, and Varai. The total area of this Sub-Catchment is 2318 sq km.
Fig-2.5.1: Sub-catchment area of Damanganga Basin as per watershed Atlas of
India.
Source: Watershed Atlas of India, Published by Department of Agriculture and Cooperation, Ministry of agriculture, Krishi Bhavan New Delhi (1990)
2.5.4 The Climate
The entire Damanganga Basin lies in the Western Ghats region. It is bound on the
west by Arabian Sea and on the east by Sahyadri ranges. The climate of the basin is
characterised by a hot summer, which is generally dry except the southwest monsoon
during June to September.
Accordingly to Koeppan’s Scheme, the climate of the basin is classified as AW-
Tropical Savannah as most of the peninsular plateau, south of Tropic of Cancer, is

79
classified. The climatic variations are experienced in the patterns of temperature,
rainfall & winds, whether of seasons and degree of wetness or dryness. These are
described as follows
2.5.4.1 Temperature
The Temperature is maximum in the month of May and Minimum in the month of
December to January. The temperature profile in the basin is given in the Table-2.5.2
Table-2.5.2; Mean monthly Temperature (0C) during water year at site Nanipalsan
& Ozerkheda in Damanganga Basin
Name of Site Nanipalsan Ozerkheda
Month Mean Monthly Maximum
Temperature (oC)
Mean Monthly Minimum
Temperature (oC)
Mean Monthly Maximum
Temperature (oC)
Mean Monthly Minimum
Temperature (oC)
Jun-12 33.9 25.6 33.5 24.5
Jul-12 28.9 24.4 27.6 23.4
Aug-12 28.1 24.1 26.6 23.2
Sep-12 29.3 23.4 27.3 23.3
Oct-12 33.7 20.5 29.8 20.9
Nov-12 33.1 14.8 27.8 13.9
Dec-12 32.5 13.7 26.9 11.6
Jan-13 31.9 11.7 28.8 9.2
Feb-13 33.5 15.8 31.2 14.4
Mar-13 38.8 17.3 35.8 18.5
Apr-13 37.7 21.0 35.9 20.9
May-13 37.6 25.5 39.3 24.9
Annual mean 33.3 19.8 30.9 19.1
2.5.4.2 Rainfall
The basin receives most of the rainfall from the South West monsoon during June to
October. Almost 98% of the annual rainfall of the basin is received during this period.
The rainfall at site in Damanganga Basin as shown in Table -2.5.3. & table 2.5.4
Table -2.5.3: Mean annual rainfall of Damanganga Basin
Sl.No
Name of Site
Data available
(No of
Years )
Average Rainfall
(mm)
Average no of
rainy days
Rainfall in the
year 2012-13
No of rainy
days in
2012-13
1 Ozerkheda 27 2116.0 91 1722.8 92

80
2 Nanipalsan 27 2145.2 90 1809.6 103
Table-2.5.4: Seasonal Rainfall during Water Year 2012-13 at site Nanipalsan &
Ozerkheda in Damanganga Basin
Sl
No
Name of
Site
Seasonal Rainfall (mm) in 2012-13 Total
Annual
Rainfall
Winter
monsoon
Pre
monsoon
South-West
monsoon
Post
monsoon
(Jan-Feb) (Mar-May) (June-Sept) (Oct-Dec)
1 Nanipalsan 0 0 1581.8 141.0 1722.8
2 Ozerkheda 0 0 1718.8 90.8 1809.6
2.5.4.3 Wind
The wind speed data of the Damanganga basin at two sites viz Ozerkheda and
Nanipalsan are given in Table -2.5.5. The average wind speed in the Damanganga
basin varies about 0.8 km/h to 4.3 km/h. in the pre and post monsoon period.
Table -2.5.5: Wind Speed at site Ozerkheda & Nanipalsan in Damanganga basin
basin during Water Year 2012-13
Month
Mean monthly wind Speed
(km/h)
Ozerkheda Nanipalsan
June 4.0 3.8
July 1.7 2.2
August 1.7 2.1
September 1.1 1.3
October 0.8 1.1
November 0.9 1.0
December 1.1 1.1
January 1.5 1.5
February 2.1 2.2
March 2.8 2.8
April 3.1 3.5
May 4.1 4.3
Annual Mean 2.1 2.2
2.5.4.4 Humidity

81
The relative Humidity in Damanganga basin varies between 65.5 % and 91.9 %,
depending upon the season. Humidity reaches maximum value during the monsoon
period in the range of about 91.9to 81.8 %. In the winter months of November and
December, it decreases. Relative humidity at Ozerkheda and Nanipalsan stations of
CWC in Damanganga Basin is given in Table-2.5.6.
Table-2.5.6: Mean monthly Relative Humidity at site Ozerkheda & Nanipalsan in
Damanganga Basin during Water Year 2012-13
Month Relative Humidity (%)
Name of Site Ozerkheda Nanipalsan
June 81.8 No data
July 90.0 90.6
August 91.5 91.4
September 91.6 91.9
October 91.0 90.3
November 85.0 88.6
December 85.1 88.1
January 83.4 84.8
February 85.1 86.3
March 83.7 77.1
April 65.6 77.5
May 81.0 83.6
Annual Mean 84.6 86.1
2.5.5 Geology
The Great Trap region of the Deccan covers substantial part of the Basin. It is entirely
of volcanic formation. The volcanic portion consists of compact, stratified basalts, and
an earthy trap. The basalts are the most conspicuous geological feature. To the west
they lie in flat-topped ranges, separated by valleys, trending from west to east. In
some flows the basalt is columnar and then it weathers into the fantastic shapes. The
formation at the base of the traps is chiefly amygdaloidal, containing quartz in vertical
veins, crystals and zeolitic minerals, especially apophyllite weathering into a gray soil.

82
The absence of laterite, which caps the summits of the hills to the south, is a curious
feature in the geology of the area. The basalt is either fine textured or it is coarse and
nodular.
2.5.6 Soil
Soils found in Damanganga basin can broadly be divided in three groups:
1) Red coarse soil
2) Coastal Alluvial soil
3) Black soil
The red soil is less common and is suitable for cultivation under a heavy and
consistent rainfall. Red coarse soil is derived from disintegration of basaltic rock
fragments under heavy rainfall. It is shallow in depth, coarse sandy loam to sandy
loam in texture, rapidly drained and low in fertility. The alluvium is deep to very deep
yellowish brown to grayish brown in colour and clay loam to salty loam in texture.
This soil is normally free from salinity and alkalinity. The black soil is very fertile for
cereals and pulses. The black soil contains high alumina and carbonates of calcium
and magnesium with variable amounts of potash, low nitrogen and phosphorus.
2.5.7 Major / Medium/multipurpose/irrigation projects
The important project of this basin is Damanganga project. The salient features of the
important components of Madhuban dam of Damanganga projects are as follows.
2.5.7.1 Madhuban Dam
This is a composite dam constructed across the river Damanganga near village
Madhuban of Dharampur Taluka, Valsad district of Gujarat state. The main purpose
of the project is irrigation, other being water supply for domestic and industrial use
and for generation of 2.0 MW of power. The project has a network of canal system on
either bank of the river to provide irrigation to an area of 56630-ha of land. The dam
has height of 50 m above the deepest foundation to store 567 Mm3 of water.

83
2.6 Kim Basin
2.6.1 Geographical setting of Kim Basin
Kim River is one of the west flowing rivers in Gujarat state. It originates from
Saputara Hill ranges in Bharuch district and falls in Gulf of Khambhat near village
Kantiajal of Hansot taluka of Bharuch district after flowing south west direction for a
length of 107 km. The river Kim, for the first 80 km of its course passes through
Rajpipala and Valia talukas. For the remaining part, the river flows in a western
direction between Ankleshwar and Olpad taluka of Surat District. Basin map is shown
in Plate -2.6.1.
Plate -2.6.1
2.6.2 River System
The main tributaries of Kim river are Ghanta river and Tokri river. The river basin
extends over an area of 1286 sq km of which the catchment area up to the site is 804
sq km. The river basin lies between21 19’ to 21 38’ North latitude and 72 40’ to
73 27’ East longitude. A line diagram of Kim basin is shown in Plate -2.6.2.

84
Plate -2.6.2

85
2.6.3 Kim Basin as per Water Shed Atlas of India
As per Watershed Atlas of India, Published by Department of Agriculture and
Cooperation, Ministry of agriculture, Krishi Bhavan New Delhi (1990), the sub
catchments from 5C1B pertain to Kim Basin as shown in Fig.-2.6.1.
2.6.3.1 Subcatchment -5C1B (5C1B2 & 5C1B3)
This Sub Catchment is situated in the plain region of Gujarat, drained by Ghanta and
Tokri River. The total area of this Sub-Catchment is 1286 Sqkm.
Fig.-2.6.1: Kim Basin as per water shed Atlas of India.
Source: Watershed Atlas of India, Published by Department of Agriculture and Cooperation, Ministry of agriculture, Krishi
Bhavan New Delhi (1990)
2.6.4 The Climate
Most of the Kim Basin lies in coastal plains near the sea, where the climate is
moderate and humid. The month of May is the hottest and January is the generally
coldest month of the Basin.
Accordingly to Kocppan’s Scheme, the climate of the basin is classified as AW-
Tropical Savannah, as most of the peninsular plateau, south of Tropic of Cancer, is
classified. The climatic variations are experienced in the patterns of temperature,

86
rainfall & winds, rhythm of seasons and degree of wetness or dryness. These are
described as follows
2.6.4.1 Temperature
Temperature is maximum in the month of May and Minimum in the month of
December to January. The temperature profile in the basin is given in the Table-2.6.1.
Table-2.6.1: Mean monthly Temperature (0C) during water year at site Kim at
Motinaroli
Month Mean Monthly Maximum Temperature
Mean Monthly Minimum Temperature
Jun-12 32.7 26.7
Jul-12 30.1 26.0
Aug-12 29.2 25.3
Sep-12 29.2 24.4
Oct-12 33.7 22.7
Nov-12 35.0 16.9
Dec-12 33.9 15.5
Jan-13 31.9 12.0
Feb-13 33.6 16.1
Mar-13 37.8 18.9
Apr-13 37.2 21.7
May-13 37.3 26.4
Annual mean 33.5 20.1
2.3.4.2 Rainfall
The basin receives most of the rainfall from the South West monsoon during June to
October. Almost 98% of the annual rainfall of the basin is received during this period.
The rainfall at site in Kim Basin shown in Table-2.6.2 & Table-2.6.3.
Table-2.6.2: Mean annual rainfall of site Kim at Motinaroli
Sl.
No
Name of
Site
Data
available
(No of Years )
Average
Annual Rainfall (mm)
Average
no of rainy days
Rainfall
in the year
2012-13
No of
rainy days in
2012-13
1 Motinaroli 21 1091.6 52 1377.5 66

87
Table-2.6.3: Seasonal Rainfall during Water Year 2011-12 at site Motinaroli
Sl
No
Name of
Site
Seasonal Rainfall (mm) in 2012-13 Total
Annual
Rainfall
Winter
monsoon
Pre
monsoon
South-West
monsoon
Post
monsoon
(Jan-Feb) (Mar-May) (June-Sept) (Oct-Dec)
1 Motinaroli 0 22.0 1354.5 1.0 1377.5
2.6.4.3 Wind
The wind speed data of the Kim basin is given in Table-2.6.4. The average wind speed
in the Kim basin varies about 1.1 km/h to 7.9 km/h. The pre dominant wind direction
is NE/ SW
Table-2.6.4: Wind Speed at site Motinaroli in Kim basin during Water Year 2012-
13
Month Mean monthly wind Speed
(km/h)
June 6.4
July 5.0
August 4.6
September 2.8
October 0.8
November 1.0
December 1.1
January 1.3
February 1.9
March 2.3
April 3.7
May 6.0
Annual Mean 3.1
2.6.4.4 Humidity
The relative Humidity in Kim basin varies between 97.1% to 78.7% depending upon
the season. It is maximum in the monsoon period and is about 78.7to 97.1 %. In the

88
winter months of November and December, relative humidity comes down. Relative
humidity at station Motinaroli of CWC in the Kim Basin is given in Table-2.6.5.
Table-2.6.5: Mean monthly Relative Humidity at site Motinaroli in Kim Basin
during Water Year 2012-13
Month Relative Humidity (%)
June 78.7
July 91.7
August 92.1
September 97.1
October 84.7
November 78.8
December 82.9
January 84.3
February 83.1
March 79.0
April 82.5
May 80.2
Annual Mean 84.6
2.6.5 Soil
The soil found in Kim basin can be broadly classified into three groups i.e.Lateritic
soils, deep black soils and coastal alluvial soils.
2.6.6 Major / Medium/multipurpose/irrigation projects
The major and medium projects completed / ongoing on Kim river basin are as shown
in Table-2.6.6.
Table-2.6.6: Major and medium projects completed / ongoing in Kim basin
Sl.No. Name of the project River Status Capacity in Mm3 Utilisation
Gross Live Irrigation
1 Baldeva Irrigation
Scheme
Tokri Medium 8.15 7.84 Domestic
2 Pigut Irrigation S
Scheme
Tokri Medium 7.52 7.27 -do-

89
Hydrological observations by State government Source of information
Apart from the sites maintained by central water commission the state government of
Gujarat, Madhya Pradesh, Rajasthan and Maharashtra are also conducting gauge and
discharge observations in among 14 Basins. The Basin wise list of sites and the
authority maintaining the sites are listed in the following para.
Basin wise list of sites
1 Purna Basin 1 Purna 2 Purna
3 Purna 4 Zankhari
5 Zankhari 6 Zankhari
At Wankla At Navsari
At Kalibel At Malotha
At Ghat At ZanKhari
Sup. Engineer, WRI Circle LD Engg. College campus,
near Gujarat university, Ahmedabad &
Executive engineer WRI Divn., Bhadra fort, Laldarwaja, Ahmedabad
2 Ambica
Basin
1 Ambica
2 Ambica 3 Khapri
4 Kharera 5 Kharera 6 Kaveri
7 Valam 8 Valam
At Unai
At Bilimora At Kundkas
At Kavdej At Lalia Dam At Vansda
At Wankla At Dholka
Sup. Engineer, WRI Circle
LD Engg. College campus, near Gujarat university,
Ahmedabad & Executive engineer WRI Divn., Bhadra fort,
Laldarwaja, Ahmedabad
3 Vaitarna Basin No state govt. Sites in this Basin
4 Dhadhar Basin
1 Dhadhar 2 Dhadhar 3 Dhadhar
4 Deo 5 Deo
6 Vishwamitri 7 Vishwamitri 8 Surya
At Bhilapur At Por At Pingalwada
At Vejalpur At Shivrajpur
At Pilol At Harni At Bhaniyara
Sup. Engineer, WRI Circle LD Eengg. College campus, near Gujarat university,
Ahmedabad &
Executive engineer WRI Divn., Bhadra fort, Laldarwaja, Ahmedabad
5 Damanganga Basin
1 Damanganga 2 Sakertond
At Vapi Bridge At Khanvel
Water resources investigation Sub Division,
Navsari
6 Kim Basin 1 Kim At Vellachha Water resources investigation Sub Division, Navsari

90
3.0 Methodology: Stream flow measurement
3.1 Gauge measurement
Water level or stage of the River is measured as its elevation above the g t s datum.
Water level measurement was conducted by reading non-recording gauges. A series of
vertical staff gauges as per the specifications laid down in is 4080-1977 have been
fixed at three sections at each site i.e. Upstream, station gauge and downstream. The
gauge posts are of RCC/wooden/ metallic with cut and edge waters and are fixed
securely in position by installing them in m-150 concrete blocks of suitable size.
Enameled gauge plate with marking in metric unit is fixed on the gauge posts with
least count 0.005 m. Out of the three gauge lines the central line is used as station
gauge line and readings of the other two lines are used for calculating the surface
slope. The gauges were read hourly during Monsoon season and three hourly i.e.
0800, 1300 and 1800 Hrs during non Monsoon season at station gauge line.
3.2 Discharge observation
Discharge observation is conducted once a day at 0800 Hrs, at all the sites by area
velocity method except on Sunday and holidays in non Monsoon period. However
additional observations were conducted during floods to cover different stages,
irrespective of holidays. The River width is generally divided into 15 to 25 segments
based on the degree of accuracy as outlined in is: 1192-1981. The width of the River
is measured by steel/metallic tape or wire rope stretched across the River with
segment markings indicated thereon, when the River width is quite small and the flow
depths permit wading. For larger width and deeper flow conditions and in
unmanageable flood conditions segment points vertically are located by measuring the
navigation craft with reference to pivot point and segment blocks constructed at
sites.the depth measurement is carried out by using sounding rod for depths up to 3
meter and by using long bamboos for depths between 3 meter and 6 meter. For depths
exceeding 6 meter sounding reel measurements at segment points are resorted to, and
in Some cases, the depths are measured by echo sounder or are computed from the
most recent x-sections of the River. The velocity is measured as per is 3918 - 1976 by
using a cup type current meter conforming to is 3910 - 1976. The current meter is
lowered to the requisite depth i.e. 0.6 of total depth down the vertical at every segment
point by suspension equipment as specified in is 6064 - 1981 and where the depth is
less than 0.3 meters, the velocity is observed just below the water surface. In medium
and high stages with significant flow velocities, boats fitted with power engines are

91
used. Measurements of velocity are sometimes carried out from the bridges when the
River flow condition does not permit the boat to be kept stable for velocity
observation. When none of the above procedures are possible, the velocity is
measured by float observations.
The data observed as above at the site is entered in the prescribed standard format to
compute the total River discharge and it is further scrutinised at various levels before
finalisation.
The daily observed/estimated discharge data is presented in this book.
Table-3.1.1 : Equipment used for observation
Sl. No Name of equipment By
wading
By boat Bridge By float
1 Current meter √ √ √ X
2 Pigmy current meter √ X X X
3 Stop watch √ √ √ √
4 Wading rod √ X X X
5 Nylon rope & tag √ X X X
6 Measuring tape √ X X X
7 Protractor √ √ √ X
8 Ranging rod √ √ X √
9 Sounding rod √ √ X X
10 Automatic battery counter
√ √ √ X
11 Thermometer √ √ √ √
12 Prismatic compass X X X √
13 Balloon X X X √
14 Sounding cable with fish weight
X √ X X
15 Echo sounder X √ √ X
16 Bridge out fit X X √ X
17 Boat out fit X √ X X

92
3.3 Explanatory notes
Explanatory notes given here have been designed to assist in the data interpretation of
hydrological parameters contained in the data presented. The notes are therefore, applicable in so far as the data presented in this book.
1. Water Year covers the period from June 1st of one calendar year to may 31st of
next calendar year and includes one complete hydrological cycle.
2. Discharge is given in cubic meters per second.
3. Discharges given are daily observed / estimated discharges.
4. The zero of gauge is a datum level / RL Fixed for a given site, which is kept 1
or 2 m lower than the lowest water level recorded in a perennial stream. In a
non - perennial stream, it is kept 1 or 2 m lower than the lowest bed level of
the stream.
5. Maximum and minimum discharges are taken from the daily observed flows /
estimated.
6. Runoff in “mm” is the notional depth of water in millimeters over the
catchment area equivalent to annual runoff calculated at the discharge
measurement station.
Annual runoff (Mm3)
Runoff (mm) = -------------------------------------- x 1000
Catchment area (km2)
7. Peak and lowest flows correspond to the highest and lowest water levels
recorded during the period of record.
8. Measuring authority refers to the field division responsible for the operation of
the gauge station. The name of the division is abbreviated by taking first
alphabet of the River name followed by alphabets “DN” for division. For
example Mahi division is denoted by MDN and Tapi division is denoted as
TDN. These abbreviations are given cross-reference in the list of
abbreviations and symbols.

93
9. Gauging station code number is a unique nine-digit reference number, which
facilitates retrieval of flow data in data bank. The first two digits denote the
measuring authority. The third and fourth digits are the Basin/zone identifier
and fifth and sixth digits are the independent River Basin identifier. The last
three digits of the code number indicate gauging site no. which is given from
origin to mouth.
11. The month and the year from which data are available in the data bank are
indicated against the record available.
3.4 Method of presentation
The data presented in this book is processed discharge data obtained from application
of SWDES/HYMOS software.
The station wise hydrological data is presented comprising history sheet, daily flow
table and pictorial summary. The sequence of hydrological station arranged from its
outfall to origin giving inter-priority to an intermediate tributary station.
4.0 Hydrological data
The hydrological data presented hereby mainly consist of the following
History sheet
Its manly consist of some salient features of particular site as Site name, state, district,
River Basin, tributary, catchment area, latitude / longitude, opening / closing date for
various types of data& maximum –minimum discharge values.
Data sheet
It consists of stage- discharge data (both observed & estimated from stage discharge
curve for the season), for the current year with mean water level during the discharge
observation and peak observed and computed discharge with corresponding water
level with date during the year, Lowest discharge with corresponding water level with
date during the year, Peak discharge with corresponding water level with date since
inception, Lowest discharge with corresponding water level with date since inception.
Stage discharge curve

94
It gives a relationship between the stage of the river and the corresponding discharge.
Annual run-off
It gives the value of Annual run off in MCM for all the years from the opening of the site.
Water level v/s time graph
Hourly observed water level for one to three important highest peak flood events of
current Water Year covering the period well before the start and upto well beyond the
completion of these flood events.
Charts / Maps
Basin map showing sites / projects
The site-wise pre – Monsoon and post – Monsoon cross sections
The site-wise pie chart
Site-wise bar charts
The site-wise hydrographs (flood events)

95
Chapter-4: Hydrological data
4.1 Purna Basin
4.1.1 History sheet
HISTORY SHEET
Water Year : 2012-13
Site : Purna at Mahuwa Code : 01 02 19 001
State : Gujarat District Surat
Basin : WFR South of Tapi Independent River : Purna
Tributary : Sub Tributary :
Sub-Sub Tributary : Local River :
Division : Tapi Division, Surat Sub-Division : LTSD,CWC,Surat
Drainage Area : 1995 Sq. Km. Bank : Right
Latitude : 21°00'52" Longitude : 73°08'25"
Zero of Gauge (m) : 9 (m.s.l) 04/10/1970
Opening Date Closing Date
Gauge : 04/10/1970
Discharge : 12/11/1970
Sediment : 18/06/1973
Water Quality : 15/06/1977

96
Annual Maximum / Minimum discharge with corresponding water Level (m.s.l)
Maximum Minimum
Year Q (cumecs)
WL (m)
Date Q (cumecs)
WL (m) Date
1971-1972 682.3 13.655 13/08/1971 0.099 10.055 30/04/1972
1972-1973 454.6 12.800 19/08/1972 0.020 9.895 31/05/1973 1973-1974 1550 13.914 25/09/1973 0.026 9.930 09/06/1973
1974-1975 183.0 11.225 01/10/1974 0.071 10.095 31/05/1975
1975-1976 964.3 13.730 13/08/1975 0.030 10.055 12/06/1975
1976-1977 4380 20.550 31/07/1976 0.040 10.150 02/06/1976
1977-1978 4020 19.765 03/09/1977 0.100 10.060 07/06/1977
1978-1979 1692 15.252 09/07/1978 0.200 10.110 10/06/1978
1979-1980 3378 20.100 10/08/1979 0.200 10.110 13/06/1979
1980-1981 775.0 13.667 02/08/1980 0.480 10.190 15/05/1981
1981-1982 1572 16.430 10/07/1981 0.000 10.050 01/04/1982
1982-1983 2815 20.390 25/07/1982 0.100 10.065 09/05/1983
1983-1984 1818 15.666 20/07/1983 0.100 10.010 02/06/1983
1984-1985 846.3 13.955 13/09/1984 0.500 10.310 08/06/1984
1985-1986 3255 20.560 01/08/1985 0.300 10.060 13/04/1986
1986-1987 527.2 12.775 16/08/1986 0.300 10.125 08/03/1987
1987-1988 873.7 15.260 07/07/1987 0.100 10.035 29/01/1988 1988-1989 1526 15.700 27/07/1988 0.200 9.970 18/04/1989
1989-1990 2362 17.920 25/07/1989 0.600 10.020 07/06/1989
1990-1991 1396 17.625 17/08/1990 1.420 9.870 27/03/1991
1991-1992 300.8 10.970 24/07/1991 0.600 9.850 29/05/1992
1992-1993 1386 17.100 03/09/1992 0.280 9.720 30/05/1993
1993-1994 1254 15.250 10/07/1993 0.385 9.635 13/05/1994
1994-1995 3078 20.470 16/06/1994 0.286 9.755 19/04/1995
1995-1996 404.6 11.995 25/07/1995 0.100 9.720 09/06/1995
1996-1997 781.5 13.330 09/09/1996 0.600 9.720 10/06/1996
1997-1998 2174 17.410 25/08/1997 0.430 9.370 27/05/1998
1998-1999 2359 17.720 08/07/1998 0.350 9.355 08/06/1998
1999-2000 695.6 13.030 16/07/1999 0.598 9.320 17/02/2000
2000-2001 782.8 13.250 14/07/2000 0.061 9.160 27/04/2001
2001-2002 1233 14.400 16/08/2001 0.085 9.075 30/04/2002
2002-2003 2517 17.550 25/08/2002 0.089 9.150 05/06/2002 2003-2004 2946 18.365 28/07/2003 0.071 9.075 05/06/2003
2004-2005 8836 23.490 04/08/2004 0.779 9.230 31/01/2005
2005-2006 5437 21.280 29/06/2005 0.500 9.180 16/06/2005
2006-2007 3273 19.050 05/07/2006 0.827 9.140 26/05/2007
2007-2008 3058 18.350 02/07/2007 1.116 9.160 01/06/2007
2008-2009 1853 16.360 19/09/2008 2.163 9.170 06/06/2008
2009-2010 667.2 12.900 07/09/2009 0.000 9.050 01/06/2009
2010-2011 744.5 13.330 09/09/2010 0.007 9.010 27/03/2011
2011-2012 607.5 12.750 29/08/2011 0.000 9.010 10/06/2011

97
2012-2013 692.4 13.030 13/08/2012 0.000 9.020 01/06/2012
4.1.2 Annual Maximum flood Peaks
Year Highest Flood Level (m) Date Hour
1970 9.780 13/10/1970 08:00:00
1971 13.655 13/08/1971 08:00:00
1972 14.805 06/07/1972 18:00:00
1973 18.215 25/09/1973 16:00:00
1974 12.035 15/07/1974 03:00:00
1975 18.680 12/08/1975 18:00:00
1976 21.200 12/07/1976 19:00:00
1977 20.550 03/09/1977 11:00:00
1978 17.700 29/08/1978 22:00:00
1979 20.210 10/08/1979 19:00:00
1980 15.330 02/08/1980 15:00:00
1981 16.440 10/07/1981 17:00:00
1982 20.710 25/07/1982 15:00:00
1983 17.130 13/08/1983 18:00:00
1984 22.550 18/07/1984 19:00:00
1985 21.050 01/08/1985 04:00:00
1986 13.120 19/07/1986 21:00:00
1987 15.680 07/07/1987 11:00:00
1988 18.185 29/07/1988 01:00:00
1989 19.890 24/07/1989 07:00:00
1990 19.500 17/08/1990 06:00:00
1991 13.670 24/07/1991 18:00:00
1992 17.810 03/09/1992 07:00:00
1993 19.400 14/07/1993 02:00:00
1994 24.800 16/06/1994 17:00:00
1995 13.660 28/07/1995 15:00:00
1996 17.500 23/07/1996 15:00:00
1997 18.000 31/07/1997 21:00:00
1998 17.840 08/07/1998 10:00:00
1999 13.500 19/07/1999 18:00:00
2000 14.640 14/07/2000 02:00:00
2001 19.300 17/06/2001 22:00:00
2002 19.500 26/06/2002 19:00:00
2003 19.880 28/07/2003 06:00:00
2004 23.900 04/08/2004 00:00:00
2005 21.280 29/06/2005 08:00:00
2006 20.300 05/07/2006 12:00:00

98
2007 20.500 02/07/2007 12:00:00
2008 18.800 19/09/2008 15:00:00
2009 14.740 22/07/2009 21:00:00
2010 14.400 07/08/2010 15:00:00
2011 14.140 14/08/2011 21:00:00
2012 13.800 13/08/2012 05:00:00

99
4.1.3 Summary of Discharge Data
Stage –Discharge data for the period 2012-13
Station Name: Purna at Mahuwa (010219001) Division : Tapi Division Surat Local River: Purna Sub -Division : LTSD, CWC, Surat
Day Jun Jul Aug Sep Oct Nov
W.L Q W.L Q W.L Q W.L Q W.L Q W.L Q
1 9.020 0.000 9.030 0.690 * 12.100 447.6 11.700 340.4 9.590 10.02 9.300 7.841
2 9.020 0.000 9.030 0.711 10.780 176.3 10.220 66.08 * 9.590 9.872 9.290 6.392
3 9.020 0.000 9.030 0.716 10.050 60.64 10.080 71.27 9.580 16.74 * 9.290 6.441
4 9.030 0.000 9.030 0.719 9.840 40.77 10.020 50.21 9.620 11.71 9.280 5.180 *
5 9.030 0.000 9.030 0.708 9.700 23.37 * 10.000 50.03 9.580 9.850 9.270 3.578
6 9.030 0.000 9.040 1.006 9.660 21.18 10.520 131.8 9.480 9.338 9.260 3.051
7 9.030 0.000 9.040 0.417 9.660 19.85 10.620 134.7 9.490 12.53 * 9.250 2.929
8 9.030 0.000 9.050 0.890 * 9.660 19.14 10.160 73.97 9.480 8.848 9.250 2.911
9 9.020 0.000 9.060 1.206 9.640 15.26 10.020 46.91 * 9.470 8.665 9.260 3.061
10 9.020 0.000 9.060 1.257 11.360 244.5 * 10.100 72.68 9.460 8.345 9.260 3.062
11 9.020 0.000 9.505 8.851 10.590 135.0 10.160 74.66 9.460 8.283 9.250 4.400 *
12 9.020 0.000 9.460 8.764 11.340 240.3 * 10.830 163.5 9.440 8.235 9.240 2.540
13 9.230 3.920 * 9.320 6.316 # 13.030 692.4 10.330 90.25 9.430 8.134 9.240 4.160 *
14 9.450 10.86 * 9.230 5.848 11.230 242.7 10.240 80.51 9.430 10.08 * 9.240 2.543
15 9.380 8.250 * 9.220 3.690 * 10.760 135.6 * 10.160 74.49 9.420 7.675 9.210 1.888
16 9.280 5.170 * 9.240 6.007 10.510 146.9 10.120 56.06 * 9.420 7.370 9.210 1.885
17 9.270 4.910 * 9.200 3.255 # 10.200 78.02 9.980 47.30 9.410 7.282 9.200 1.752
18 9.260 4.650 * 9.190 5.046 10.080 70.84 9.880 38.23 9.400 7.262 9.200 3.260 *
19 9.210 3.470 * 9.300 7.648 9.980 43.49 * 9.800 31.13 9.390 7.254 9.210 1.830
20 9.490 5.618 9.480 9.174 10.040 48.67 * 9.740 21.04 9.370 7.198 9.210 1.870

100
21 9.360 4.157 9.460 7.717 9.880 38.64 9.800 31.07 9.340 6.930 * 9.200 1.790
22 9.220 3.692 # 9.460 11.27 * 9.800 31.10 9.700 20.88 9.320 7.183 9.190 1.744
23 9.090 1.910 9.430 7.181 9.740 21.20 9.660 21.03 * 9.320 7.167 9.180 1.566
24 9.050 0.890 * 9.360 6.837 9.700 20.84 9.620 18.82 # 9.320 6.320 * 9.170 1.464
25 9.040 1.008 9.440 8.208 9.680 20.75 9.600 10.72 9.300 6.981 9.160 2.470 *
26 9.040 0.981 9.730 20.65 9.660 21.03 * 9.620 18.82 # 9.300 6.982 9.160 1.385
27 9.040 0.893 9.520 11.00 9.700 20.98 9.600 17.76 # 9.290 5.450 * 9.150 1.361
28 9.030 0.820 9.410 7.832 9.680 20.81 9.600 17.76 # 9.290 5.450 * 9.160 2.470 *
29 9.030 0.752 9.350 7.250 * 10.050 60.76 9.600 17.76 # 9.280 5.883 9.170 1.490
30 9.030 0.740 9.300 7.821 9.840 41.48 9.600 17.76 * 9.270 3.532 9.180 1.579
31 9.450 8.532 10.620 131.7 9.250 2.671
Ten-Daily Mean
I Ten-Daily 9.025 0.000 9.040 0.832 10.245 106.9 10.344 103.8 9.534 10.59 9.271 4.444
II Ten-Daily 9.261 4.685 9.315 6.460 10.776 183.4 10.124 67.72 9.417 7.877 9.221 2.613
III Ten-Daily 9.093 1.584 9.446 9.481 9.850 39.03 9.640 19.24 9.298 5.868 9.172 1.732
Monthly
Min. 9.020 0.000 9.030 0.417 9.640 15.26 9.600 10.72 9.250 2.671 9.150 1.361
Max. 9.490 10.86 9.730 20.65 13.030 692.4 11.700 340.4 9.620 16.74 9.300 7.841
Mean 9.126 2.09 9.273 5.717 10.276 107.5 10.036 63.59 9.413 8.04 9.221 2.93
Annual Runoff in MCM = 525 Annual Runoff in mm = 263
Peak Observed Discharge = 692.4 cumecs on 13/08/2012 Corres. Water Level :13.03 m
Lowest Observed Discharge = 0.000 cumecs on 01/06/2012 Corres. Water Level :9.02 m
Water Level(m.s.l) in m *:Computed Discharge #:Discarded Discharge (values changed as per rating curve)
Note: River remained in pooling/ no flow condition w.e.f. 01/06/12 to 12/06/12.

101
Stage –Discharge data for the period 2012-13 Station Name: Purna at Mahuwa (010219001) Division: Tapi Division Surat Local River: Purna Sub -Division: LTSD, CWC, Surat
Day Dec Jan Feb Mar Apr May
W.L Q WL Q WL Q WL Q WL Q WL Q
1 9.180 1.562 9.150 1.174 9.120 1.790 * 9.070 1.100 * 9.080 1.200 * 9.100 1.500 *
2 9.180 2.850 * 9.150 1.164 9.120 1.790 * 9.060 1.000 * 9.070 1.100 * 9.100 1.500 *
3 9.180 2.850 * 9.160 1.254 9.130 1.960 * 9.060 1.000 * 9.070 1.100 * 9.100 1.500 *
4 9.200 3.260 * 9.160 1.216 9.130 1.960 * 9.060 1.000 * 9.070 1.100 * 9.100 1.500 *
5 9.200 1.609 9.170 1.407 9.130 1.960 * 9.060 1.000 * 9.080 1.200 * 9.100 1.500 *
6 9.200 1.601 9.170 2.660 * 9.120 1.790 * 9.070 1.100 * 9.080 1.200 * 9.090 1.360 *
7 9.210 1.740 9.170 1.395 9.120 1.790 * 9.070 1.100 * 9.080 1.200 * 9.090 1.360 *
8 9.210 1.731 9.160 1.212 9.120 1.790 * 9.070 1.100 * 9.080 1.200 * 9.090 1.360 *
9 9.210 3.470 * 9.160 1.188 9.110 1.600 * 9.080 1.200 * 9.070 1.100 * 9.080 1.200 *
10 9.210 1.723 9.140 0.938 9.110 1.600 * 9.080 1.200 * 9.070 1.100 * 9.080 1.200 *
11 9.210 1.716 9.140 0.935 9.100 1.500 * 9.080 1.200 * 9.070 1.100 * 9.080 1.200 *
12 9.210 1.707 9.140 0.930 9.100 1.500 * 9.090 1.360 * 9.070 1.100 * 9.090 1.360 *
13 9.200 3.260 * 9.130 1.960 * 9.100 1.500 * 9.090 1.360 * 9.060 1.000 * 9.090 1.360 *
14 9.200 1.652 9.130 0.854 9.090 1.360 * 9.100 1.500 * 9.060 1.000 * 9.100 1.500 *
15 9.200 1.661 9.130 0.848 9.090 1.360 * 9.100 1.500 * 9.060 1.000 * 9.100 1.500 *
16 9.200 3.260 * 9.130 0.844 9.100 1.500 * 9.110 1.600 * 9.060 1.000 * 9.100 1.500 *
17 9.200 1.652 9.120 1.790 * 9.100 1.500 * 9.110 1.600 * 9.080 1.200 * 9.100 1.500 *
18 9.190 1.646 9.120 1.790 * 9.110 1.600 * 9.120 1.790 * 9.080 1.200 * 9.090 1.360 *
19 9.190 1.636 9.110 1.600 * 9.110 1.600 * 9.120 1.790 * 9.080 1.200 * 9.060 1.000 *
20 9.190 1.631 9.110 1.600 * 9.110 1.600 * 9.110 1.600 * 9.070 1.100 * 9.060 1.000 *

102
21 9.190 1.624 9.110 1.600 * 9.100 1.500 * 9.110 1.600 * 9.070 1.100 * 9.060 1.000 *
22 9.180 1.563 9.110 1.600 * 9.100 1.500 * 9.100 1.500 * 9.070 1.100 * 9.050 0.900 *
23 9.180 2.850 * 9.110 1.600 * 9.080 1.200 * 9.100 1.500 * 9.070 1.100 * 9.050 0.900 *
24 9.180 1.553 9.100 1.500 * 9.080 1.200 * 9.100 1.500 * 9.090 1.360 * 9.030 0.700 *
25 9.180 2.850 * 9.100 1.500 * 9.080 1.200 * 9.100 1.500 * 9.090 1.360 * 9.030 0.700 *
26 9.180 1.533 9.100 1.500 * 9.070 1.100 * 9.090 1.360 * 9.100 1.500 * 9.020 0.600 *
27 9.160 1.225 9.110 1.600 * 9.070 1.100 * 9.090 1.360 * 9.100 1.500 * 9.020 0.600 *
28 9.160 1.219 9.110 1.600 * 9.070 1.100 * 9.090 1.360 * 9.110 1.600 * 9.020 0.600 *
29 9.160 1.224 9.110 1.600 * 9.080 1.200 * 9.110 1.600 * 9.020 0.600 *
30 9.160 1.200 * 9.110 1.600 * 9.080 1.200 * 9.110 1.600 * 9.010 0.500 *
31 9.150 1.178 9.120 1.790 * 9.080 1.200 * 9.010 0.500 *
Ten-Daily Mean
I Ten-Daily 9.198 2.240 9.159 1.361 9.121 1.803 9.068 1.080 9.075 1.150 9.093 1.398
II Ten-Daily 9.199 1.982 9.126 1.315 9.101 1.502 9.103 1.530 9.069 1.090 9.087 1.328
III Ten-Daily 9.171 1.638 9.108 1.590 9.081 1.238 9.093 1.389 9.092 1.382 9.029 0.691
Monthly
Min. 9.150 1.178 9.100 0.844 9.070 1.100 9.060 1.000 9.060 1.000 9.010 0.500
Max. 9.210 3.470 9.170 2.660 9.130 1.960 9.120 1.790 9.110 1.600 9.100 1.500
Mean 9.189 1.943 9.130 1.427 9.102 1.534 9.088 1.335 9.079 1.21 9.068 1.13
Peak Computed Discharge = 244.5 cumecs on 10/08/2012 Corres. Water Level :11.36 m
Lowest Computed Discharge = 0.500 cumecs on 30/05/2013 Corres. Water Level :9.01 m
Water Level(m.s.l) in m *:Computed Discharge #:Discarded Discharge (values changed as per rating curve)
Note: River remained in pooling/ no flow condition w.e.f. 01/06/12 to 12/06/12.

103
4.1.4 Stage Discharge Curve
Station Name: Purna at Mahuwa (010219001) Division: Tapi Division Surat Local River: Purna Sub -Division: LTSD, CWC, Surat
Stage Discharge Curve of river Purna at site Mahuwa for the period 01/06/2012 to 31/05/2013
Calculated Observed
Discharge in Cumec900850800750700650600550500450400350300250200150100500
Sta
ge in
m
13.75
13.5
13.25
13
12.75
12.5
12.25
12
11.75
11.5
11.25
11
10.75
10.5
10.25
10
9.75
9.5
9.25
9
Procedure : Standard Equation type : Power Q=C(h+a)^b
LB UB a b C
9.000 13.500 -8.870 2.137 34.797

104
4.1.5 Annual runoff
Annual Runoff Values Runoff Based on period 1971 to 2013 Station Name: Purna at Mahuwa (010219001) Division: Tapi Division Surat Local River: Purna Sub -Division: LTSD, CWC, Surat

105
4.1.6 Monthly Average Runoff
Station Name: Purna at Mahuwa (010219001) Division: Tapi Division, Surat Local River: Purna Sub -Division: LTSD, CWC, Surat
Monthly Average Runoff Based on period: 1971 -2012
Monthly Average Runoff Based on period: 2012-13

106
4.1.7 Superimposed cross section
Station Name: Purna at Mahuwa (010219001) Division: Tapi Division Surat Local River:Purna Sub -Division: LTSD, CWC, Surat
Superimposed cross section at SG line
Max. WL 14.140 m on 14/08/2011 at 2100 hours
Historical Flood Level observed so far 24.800m on date 16/09/1994 at 17:00 hrs

107
4.1.8 Water Level vs. Time- Graph of Highest Flood Peaks during 2012-13
Station Name: Purna at Mahuwa (010219001) Division : Tapi Division Surat
Local River : Purna Sub -Division : LTSD, CWC, Surat
Water Level Vs. Time –Graph of I peak during the year 2012-13
Water Leel Vs. Time –Graph of II peak during the year 2012-13
Water Level Vs. Time –Graph of III peak during the year 2012-13

108
4.2 Ambica Basin
4.2.1 History sheet
HISTORY SHEET
Water Year : 2012-13
Site : Ambica at Gadat Code : 01 02 20 001
State : Gujarat District Valsad
Basin : WFR South of Tapi Independent River : Ambika
Tributary : Sub Tributary :
Sub-Sub Tributary : Local River :
Division : Surat Sub-Division : Surat
Drainage Area : 1510 Sq. Km. Bank :
Latitude : 20°51'22" Longitude : 72°59'05"
Zero of Gauge (m) : 1.5 (m.s.l) 14/01/1979
Opening Date Closing Date
Gauge : 14/01/1979
Discharge : 12/03/1979
Sediment : 01/02/1985
Water Quality : 01/04/1980

109
Annual Maximum / Minimum discharge with corresponding Water Level (m.s.l)
Maximum Minimum Year Q
(cumecs) WL (m) Date Q
(cumecs) WL (m) Date
1979-1980 1686 9.900 10/08/1979 0.180 3.350 16/06/1979
1980-1981 1492 9.160 02/08/1980 0.700 3.460 03/06/1980
1981-1982 1449 8.950 02/07/1981 0.000 3.500 13/06/1981
1982-1983 1537 9.400 25/07/1982 0.000 3.410 13/05/1983
1983-1984 1881 10.500 16/08/1983 0.000 1.500 07/06/1983
1984-1985 1551 9.430 06/07/1984 0.390 3.410 13/06/1984
1985-1986 1876 10.255 01/08/1985 0.100 3.315 17/04/1986
1986-1987 658.7 7.005 19/07/1986 0.100 3.315 13/06/1986
1987-1988 825.7 7.955 26/08/1987 0.000 3.200 05/04/1988
1988-1989 2308 10.110 27/07/1988 0.700 3.340 30/04/1989
1989-1990 2508 11.025 24/07/1989 0.456 3.285 08/06/1989
1990-1991 1385 10.220 17/08/1990 1.070 3.240 23/03/1991
1991-1992 450.7 6.440 28/07/1991 0.000 2.940 28/04/1992
1992-1993 1898 11.550 03/09/1992 0.000 3.020 14/06/1992
1993-1994 1245 5.185 25/06/1993 0.433 2.945 09/06/1993
1994-1995 2764 11.500 16/06/1994 0.364 2.940 03/05/1995
1995-1996 750.0 6.900 03/09/1995 0.091 2.810 16/04/1996
1996-1997 1255 8.425 24/07/1996 0.274 2.700 10/06/1996
1997-1998 1350 8.730 25/08/1997 0.465 2.200 30/05/1998
1998-1999 1200 8.800 08/07/1998 0.446 2.190 08/06/1998
1999-2000 2989 11.395 16/07/1999 0.783 2.130 26/04/2000
2000-2001 910.8 8.450 14/07/2000 0.748 2.425 13/01/2001
2001-2002 1873 9.810 20/07/2001 2.385 2.255 06/11/2001
2002-2003 1217 8.605 28/06/2002 2.210 3.955 21/10/2002
2003-2004 3650 10.075 28/07/2003 0.000 3.020 10/06/2003
2004-2005 2700 12.170 04/08/2004 1.812 3.700 30/10/2004
2005-2006 2894 13.010 29/06/2005 0.000 6.465 25/02/2006
2006-2007 1783 9.840 29/07/2006 0.000 6.460 02/03/2007
2007-2008 1601 9.400 02/07/2007 5.400 3.710 29/10/2007
2008-2009 1295 9.640 12/08/2008 40.43 3.840 30/08/2008
2009-2010 599 7.090 21/07/2009 0.000 4.820 01/06/2009
2010-2011 870.2 7.815 09/09/2010 0.000 4.590 01/06/2010
2011-2012 1594 9.67 29/08/2011 0.000 3.550 07/07/2011
2012-2013 548.7 6.930 13/08/2012 0.000 4.930 01/06/2012

110
4.2.2 Annual Maximum Flood Peak
Year Highest Flood
Level (m) Date Hour
1979 12.180 11/08/1979 01:00:00
1980 10.690 02/08/1980 16:00:00
1981 9.980 10/07/1981 15:00:00
1982 10.950 25/07/1982 14:00:00
1983 11.070 16/08/1983 06:00:00
1984 13.470 18/07/1984 20:00:00
1985 13.020 01/08/1985 00:00:00
1986 7.780 19/07/1986 00:00:00
1987 9.870 26/08/1987 03:00:00
1988 11.650 27/07/1988 16:00:00
1989 11.490 24/07/1989 13:00:00
1990 10.270 17/08/1990 09:00:00
1991 6.710 28/07/1991 18:00:00
1992 11.950 03/09/1992 12:00:00
1993 11.710 25/06/1993 18:00:00
1994 13.985 16/06/1994 18:00:00
1995 7.970 20/07/1995 12:00:00
1996 10.400 23/07/1996 16:00:00
1997 12.400 31/07/1997 21:00:00
1998 10.760 08/07/1998 11:00:00
1999 12.760 16/07/1999 02:00:00
2000 10.550 14/07/2000 03:00:00
2001 11.570 20/07/2001 15:00:00
2002 12.360 26/06/2002 22:00:00
2003 13.520 28/07/2003 04:00:00
2004 13.980 04/08/2004 02:00:00
2005 13.450 29/06/2005 16:00:00
2006 12.900 05/07/2006 14:00:00
2007 10.200 02/07/2007 13:00:00
2008 11.420 12/08/2008 13:00:00
2009 9.300 21/07/2009 13:00:00
2010 7.980 09/09/2010 04:00:00
2011 11.800 29/08/2011 06:00:00
2012 8.100 10/08/2012 01:00:00

111
4.2.3 Summary of Data
Stage –Discharge data for the period 2012-13 Station Name: Ambica at Gadat (01 02 20 001) Division : Tapi Division Surat Local River: Ambica Sub -Division : LTSD, CWC, Surat
Day Jun Jul Aug Sep Oct Nov
W.L Q W.L Q W.L Q W.L Q W.L Q W.L Q 1 4.930 0.000 3.580 0.000 5.765 203.5 4.890 222.6 3.820 13.34 5.000 0.000 2 4.920 0.000 3.570 0.000 4.950 120.8 4.460 99.18 * 3.800 14.13 * 5.000 0.000 3 4.920 0.000 3.570 0.000 4.120 71.74 4.300 70.27 3.830 16.18 * 5.000 0.000 4 4.920 0.000 3.560 0.000 4.105 54.24 4.500 105.8 * 3.830 16.18 * 5.000 0.000
5 4.920 0.000 3.560 0.000 4.010 35.45 * 4.930 185.8 * 3.850 18.61 * 5.000 0.000 6 4.900 0.000 3.550 0.000 4.010 48.68 5.300 265.9 # 3.850 18.61 * 5.000 0.000 7 4.880 0.000 3.580 0.000 4.045 51.70 5.180 238.9 * 3.850 18.61 * 5.000 0.000 8 4.820 0.000 3.580 0.000 4.015 44.57 4.600 123.1 * 3.850 18.61 * 5.000 0.000 9 4.820 0.000 3.580 0.000 3.950 28.71 * 4.390 87.90 * 3.850 19.72 5.000 0.000
10 4.810 0.000 3.580 0.000 6.300 525.7 * 4.585 102.5 3.850 18.84 5.000 0.000 11 4.820 0.000 3.690 0.000 4.950 93.90 4.820 164.0 # 3.850 18.87 5.000 0.000 12 4.830 0.000 3.690 0.000 5.750 375.5 * 5.130 210.6 3.840 17.57 5.000 0.000 13 4.840 0.000 3.670 0.000 6.930 548.7 4.630 104.2 3.810 15.33 5.000 0.000 14 4.850 0.000 3.670 0.000 5.650 350.0 # 4.500 105.8 * 3.780 12.46 * 5.000 0.000
15 4.860 0.000 3.660 0.000 4.900 179.8 * 4.475 142.7 3.770 12.71 5.000 0.000 16 4.870 0.000 3.660 0.000 4.650 132.0 # 4.410 91.08 * 3.760 10.87 * 5.000 0.000 17 4.570 0.000 3.660 0.000 4.420 85.74 4.260 68.22 * 3.760 0.000 5.000 0.000 18 3.700 0.000 3.660 0.000 4.295 74.29 4.160 55.39 3.760 0.000 5.000 0.000 19 3.400 0.000
3.740 0.000
4.240 65.34 * 4.100 49.73
3.760 0.000
5.000 0.000
20 3.700 0.000
3.860 0.000
4.220 62.50 * 4.060 41.42 * 4.300 0.000
5.000 0.000

112
21 3.700 0.000
3.890 0.000
4.140 41.24
4.090 45.80
4.620 0.000
5.000 0.000 22 3.680 0.000
3.840 0.000
4.100 35.39
4.050 39.33
4.800 0.000
5.000 0.000
23 3.600 0.000
3.810 0.000
4.070 29.76
4.020 36.62 * 5.000 0.000
5.000 0.000 24 3.600 0.000
3.790 0.000
4.070 29.29
3.990 33.34
5.000 0.000
5.000 0.000
25 3.600 0.000
3.790 0.000
4.040 29.33
3.970 29.47
5.000 0.000
5.000 0.000 26 3.600 0.000
3.980 0.000
4.010 35.45 * 3.960 26.71
5.000 0.000
5.000 0.000
27 3.600 0.000
3.890 0.000
4.160 57.42
3.925 22.74
5.000 0.000
5.000 0.000 28 3.590 0.000
3.820 0.000
4.890 186.5
3.870 18.85
5.000 0.000
5.000 0.000
29 3.580 0.000
3.810 0.000
5.365 272.8
3.840 17.33
5.000 0.000
5.000 0.000 30 3.590 0.000
3.800 0.000
4.425 155.0
3.840 17.68 * 5.000 0.000
5.000 0.000
31
4.000 0.000
5.000 246.0
5.000 0.000 Ten-Daily Mean
I Ten-Daily 4.884 0.000
3.571 0.000
4.527 118.5
4.714 150.2
3.838 17.28
5.000 0.000 II Ten-Daily 4.444 0.000
3.696 0.000
5.000 196.8
4.455 103.3
3.839 8.781
5.000 0.000
III Ten-Daily 3.614 0.000
3.856 0.000
4.388 101.6
3.955 28.79
4.947 0.000
5.000 0.000 Monthly
Min. 3.400 0.000
3.550 0.000
3.950 28.71
3.840 17.33
3.760 0.000
5.000 0.000 Max. 4.930 0.000
4.000 0.000
6.930 548.7
5.300 265.9
5.000 19.72
5.000 0.000
Mean 4.314 0.000
3.713 0.000
4.630 137.8
4.374 94.10
4.232 8.407
5.000 0.000
Annual Runoff in MCM = 635 Annual Runoff in mm = 421
Peak Observed Discharge = 548.7 cumecs on 13/08/2012 Corres. Water Level :6.93 m
Lowest Observed Discharge = 0.000 cumecs on 01/06/2012 Corres. Water Level :4.93 m
Q: Observed/Computed discharge in cumecs WL: Corresponding Mean Water Level (m.s.l) in m * : Computed Discharge #:Discarded Discharge (values
changed as per rating curve)
Note: River remained in pooling/ no flow condition w.e.f. 01/06/12 to 31/07/12 and from 17/10/2012 to 31/05/2013.Back water effect form Dewadha Dam exists at site during this period.

113
Stage –Discharge data for the period 2012-13
Station Name: Ambica at Gadat (01 02 20 001) Division : Tapi Division Surat Local River: Ambica Sub -Division : LTSD, CWC, Surat
Day Dec Jan Feb Mar Apr May W.L Q WL Q WL Q WL Q WL Q WL Q
1 5.000 0.000 5.000 0.000 4.890 0.000 4.960 0.000 4.950 0.000 4.930 0.000 2 5.000 0.000 5.000 0.000 4.870 0.000 4.960 0.000 4.950 0.000 4.930 0.000
3 5.000 0.000 4.970 0.000 4.870 0.000 4.960 0.000 4.940 0.000 4.930 0.000
4 5.000 0.000 4.970 0.000 4.870 0.000 4.960 0.000 4.940 0.000 4.930 0.000 5 5.000 0.000 4.970 0.000 4.870 0.000 4.960 0.000 4.940 0.000 4.930 0.000
6 5.000 0.000 4.970 0.000 4.880 0.000 4.960 0.000 4.940 0.000 4.930 0.000 7 5.000 0.000 4.970 0.000 4.880 0.000 4.970 0.000 4.940 0.000 4.930 0.000
8 5.000 0.000 4.930 0.000 4.880 0.000 4.970 0.000 4.940 0.000 4.930 0.000
9 5.000 0.000 4.930 0.000 4.880 0.000 4.970 0.000 4.940 0.000 4.930 0.000 10 5.000 0.000 4.920 0.000 4.880 0.000 4.970 0.000 4.940 0.000 4.930 0.000
11 5.000 0.000 4.920 0.000 4.880 0.000 4.970 0.000 4.940 0.000 4.930 0.000 12 5.000 0.000 4.920 0.000 4.880 0.000 4.970 0.000 4.940 0.000 4.930 0.000
13 5.000 0.000 4.920 0.000 4.890 0.000 4.970 0.000 4.940 0.000 4.930 0.000
14 5.000 0.000 4.900 0.000 4.890 0.000 4.960 0.000 4.940 0.000 4.930 0.000 15 5.000 0.000 4.900 0.000 4.890 0.000 4.960 0.000 4.940 0.000 4.930 0.000
16 5.000 0.000 4.890 0.000 4.890 0.000 4.960 0.000 4.940 0.000 4.910 0.000 17 5.000 0.000 4.880 0.000 4.890 0.000 4.960 0.000 4.940 0.000 4.910 0.000
18 5.000 0.000 4.880 0.000 4.900 0.000 4.960 0.000 4.940 0.000 4.910 0.000
19 5.000 0.000 4.880 0.000 4.980 0.000 4.960 0.000 4.950 0.000 4.910 0.000 20 5.000 0.000 4.870 0.000 4.980 0.000 4.960 0.000 4.950 0.000 4.910 0.000

114
21 5.000 0.000 4.870 0.000 4.980 0.000 4.960 0.000 4.950 0.000 4.900 0.000
22 5.000 0.000 4.870 0.000 4.980 0.000 4.960 0.000 4.950 0.000 4.920 0.000
23 5.000 0.000 4.870 0.000 4.980 0.000 4.960 0.000 4.950 0.000 4.920 0.000
24 5.000 0.000 4.860 0.000 4.980 0.000 4.960 0.000 4.950 0.000 4.920 0.000
25 5.000 0.000 4.860 0.000 4.980 0.000 4.960 0.000 4.950 0.000 4.920 0.000
26 5.000 0.000 4.850 0.000 4.970 0.000 4.960 0.000 4.950 0.000 4.920 0.000
27 5.000 0.000 4.850 0.000 4.970 0.000 4.950 0.000 4.950 0.000 4.920 0.000
28 5.000 0.000 4.850 0.000 4.960 0.000 4.950 0.000 4.950 0.000 4.920 0.000
29 5.000 0.000 4.860 0.000 4.950 0.000 4.950 0.000 4.920 0.000
30 5.000 0.000 4.870 0.000 4.950 0.000 4.950 0.000 4.920 0.000
31 5.000 0.000 4.890 0.000 4.950 0.000 4.930 0.000
Ten-Daily Mean
I Ten-Daily 5.000 0.000 4.963 0.000 4.877 0.000 4.964 0.000 4.942 0.000 4.930 0.000
II Ten-Daily 5.000 0.000 4.896 0.000 4.907 0.000 4.963 0.000 4.942 0.000 4.920 0.000
III Ten-Daily 5.000 0.000 4.864 0.000 4.975 0.000 4.955 0.000 4.950 0.000 4.919 0.000
Monthly
Min. 5.000 0.000 4.850 0.000 4.870 0.000 4.950 0.000 4.940 0.000 4.900 0.000
Max. 5.000 0.000 5.000 0.000 4.980 0.000 4.970 0.000 4.950 0.000 4.930 0.000
Mean 5.000 0.000 4.906 0.000 4.916 0.000 4.961 0.000 4.945 0.000 4.923 0.000
Peak Computed Discharge = 525.7 cumecs on 10/08/2012 Corres. Water Level :6.3 m
Lowest Computed Discharge = 10.87 cumecs on 16/10/2012 Corres. Water Level :3.76 m
Q: Observed/Computed discharge in cumec WL: Corresponding Mean Water Level (m.s.l) in m * : Computed Discharge
#:Discarded Discharge (values changed as per rating curve) Note: River remained in pooling/ no flow condition w.e.f. 01/06/12 to 31/07/12 and from 17/10/2012 to 31/05/2013.Back water effect form Dewadha Dam exists at site during this period.

115
4.2.4 Stage Discharge Curve
Station Name: Ambica at Gadat (01 02 20 001) Division : Tapi Division Surat Local River: Ambica Sub -Division : LTSD, CWC, Surat
Stage Discharge Curves of site Ambica at Gadat for the Year2012-13
Stage Discharge Curve of river Ambica at Gadat for the period 01/06/2012 to 31/05/2013
Calculated Observed
Discharge in cumec1,1001,0009008007006005004003002001000
Sta
ge in
m
8.5
8.25
8
7.75
7.5
7.25
7
6.75
6.5
6.25
6
5.75
5.5
5.25
5
4.75
4.5
4.25
4
3.75
3.5
Procedure : Standard Equation type : Power Q=C(h+a)^b LB UB a b C
3.600 8.100 -3.550 1.508 114.337

116
4.2.5 Annual runoff
Annual Runoff Values Runoff Based on period 1979 to 2013
Station Name: Ambica at Gadat (01 02 20 001) Division : Tapi Division, Surat Local River: Ambica Sub -Division : LTSD, CWC, Surat

117
4.2.6 Monthly average Runoff
Station Name: Ambica at Gadat (01 02 20 001) Division : Tapi Division, Surat Local River: Ambica Sub -Division : LTSD, CWC, Surat
Monthly Average Runoff Based on period: 1979 -2012
Monthly Average Runoff Based on period: 2012-13

118
4.2.7 Superimposed Cross section
Station Name: Ambica at Gadat (01 02 20 001) Division: Tapi Division, Surat Local River: Ambica Sub -Division: LTSD, CWC, Surat
Historical Flood Level observed so far 13.985 m on date 16/06/1994 at 18:00 hrs

119
4.2.8 Water Level vs. Time- Graph of Highest Flood Peaks during 2012-13
Station Name: Ambica at Gadat (01 02 20 001) Division : Tapi Division Surat
Local River: Ambica Sub -Division : LTSD, CWC, Surat
Water level vs. Time graph of 1st flood peak during the year 2012-13
Water level vs. Time graph of 2nd flood peak during the year 2012-13
Water level vs. Time graph of 3rd flood peak during the year 2012-13

120
4.3 Vaitarna at Durvesh
4.3.1 History sheet
HISTORY SHEET
Water Year : 2012-13
Site : Vaitarna at Durvesh Code : 01 02 25 001
State : Maharashtra District Thane
Basin : WFR South of Tapi Independent River : Vaitarna
Tributary : Sub Tributary :
Sub-Sub Tributary : Local River :
Division : Tapi Division, Surat Sub-Division : DGSD,CWC,Silvassa
Drainage Area : 2019 Sq. Km. Bank :
Latitude : 19°42'45" Longitude : 72°55'50"
Zero of Gauge (m) : 0 (m.s.l) 26/10/1970
Opening Date Closing Date
Gauge : 26/10/1970
Discharge : 26/01/1971
Sediment : 26/01/1971
Water Quality : 01/06/1977

121
Annual Maximum / Minimum discharge with corresponding Water Level (m.s.l)
Maximum Minimum Year Q
(cumecs) WL (m) Date Q
(cumecs) WL (m)
Date
1971-1972 4386 11.330 30/09/1971 0.000 1.975 21/06/1971
1972-1973 1543 6.463 02/07/1972 0.000 0.680 03/06/1972
1973-1974 3826 10.950 23/09/1973 0.000 0.890 09/05/1974
1974-1975 1655 6.743 04/07/1974 0.000 0.880 09/05/1975
1975-1976 3303 8.437 11/08/1975 0.000 0.855 29/04/1976
1976-1977 7744 14.250 31/07/1976 0.000 0.975 09/05/1977
1977-1978 4374 11.522 03/09/1977 0.020 0.825 14/06/1977
1978-1979 1796 7.277 21/06/1978 0.000 0.800 03/05/1979
1979-1980 5000 9.060 11/08/1979 0.000 1.045 19/06/1979
1980-1981 2460 9.025 04/08/1980 0.000 1.010 13/02/1981
1981-1982 1748 8.675 10/07/1981 0.000 1.400 17/12/1981
1982-1983 1140 8.900 22/08/1982 2.000 1.620 08/11/1982
1983-1984 2249 9.635 13/08/1983 0.000 0.920 14/06/1983
1984-1985 3180 12.900 19/07/1984 0.100 1.250 15/06/1984
1985-1986 1032 7.155 03/08/1985 0.000 1.440 05/07/1985
1986-1987 1293 7.850 19/07/1986 0.000 1.240 30/10/1986
1987-1988 1287 7.065 07/07/1987 0.000 1.954 02/07/1987
1988-1989 3396 11.000 16/07/1988 0.000 0.000 02/02/1989
1989-1990 1672 9.075 25/07/1989 0.000 1.610 30/06/1989
1990-1991 1761 7.690 18/08/1990 0.000 0.000 03/01/1991
1991-1992 1361 8.800 28/07/1991 0.000 0.000 26/01/1992
1992-1993 1405 8.675 12/08/1992 0.000 0.000 27/01/1993
1993-1994 1497 6.045 16/07/1993 0.000 0.000 15/02/1994
1994-1995 2340 12.550 13/07/1994 0.000 0.000 05/02/1995
1995-1996 1039 7.250 21/07/1995 0.000 0.000 02/02/1996
1996-1997 1611 7.380 23/07/1996 0.900 1.120 10/12/1996
1997-1998 4100 12.330 31/07/1997 0.000 1.200 14/06/1997
1998-1999 8000 15.220 17/09/1998 0.000 1.200 26/04/1999
1999-2000 4536 12.180 16/07/1999 0.000 1.190 14/05/2000
2000-2001 1749 8.440 13/07/2000 0.000 1.140 30/12/2000
2001-2002 1469 7.200 04/07/2001 0.000 1.140 31/12/2001
2002-2003 4400 10.830 27/06/2002 0.000 1.100 24/12/2002
2003-2004 6038 12.350 28/07/2003 0.000 1.090 28/12/2003
2004-2005 5080 12.050 03/08/2004 0.000 1.080 20/04/2005
2005-2006 4997 10.450 28/07/2005 0.000 1.030 13/04/2006
2006-2007 4086 10.680 07/08/2006 0.659 1.060 26/12/2006
2007-2008 2034 7.530 03/07/2007 0.853 1.070 24/12/2007
2008-2009 2941 9.830 20/09/2008 0.470 1.060 22/12/2008
2009-2010 1633 7.750 23/07/2009 0.000 1.000 01/06/2009
2010-2011 1422 7.060 02/08/2010 13.48 0.700 10/06/2010
2011-2012 3408 9.930 29/08/2011 0.000 0.950 03/06/2011
2012-2013 1394 6.460 04/09/2012 0.000 0.840 01/06/2012

122
4.3.2 Annual Maximum Flood Peak
Year Highest Flood Level (m) Date Hour
1974 7.690 04/07/1974 15:00:00
1975 9.860 30/07/1975 03:00:00
1976 14.700 31/07/1976 15:00:00
1977 12.075 03/09/1977 06:00:00
1978 7.720 21/06/1978 10:00:00
1979 9.510 11/08/1979 06:00:00
1980 10.830 04/08/1980 00:00:00
1981 10.500 10/07/1981 20:00:00
1982 9.200 22/08/1982 09:00:00
1983 12.000 15/08/1983 19:00:00
1984 14.460 18/07/1984 18:00:00
1985 8.050 03/08/1985 18:00:00
1986 8.300 15/07/1986 20:00:00
1987 10.800 20/08/1987 15:00:00
1988 13.800 16/07/1988 16:00:00
1989 11.540 25/07/1989 01:00:00
1990 10.250 03/07/1990 20:00:00
1991 10.500 28/07/1991 00:00:00
1992 10.500 03/09/1992 21:00:00
1993 11.900 17/07/1993 00:00:00
1994 12.800 13/07/1994 08:00:00
1995 8.100 21/07/1995 18:00:00
1996 8.220 23/07/1996 18:00:00
1997 12.920 31/07/1997 13:00:00
1998 16.130 17/09/1998 13:00:00
1999 12.500 16/07/1999 09:00:00
2000 8.670 13/07/2000 14:00:00
2001 8.300 09/07/2001 18:00:00
2002 14.500 26/06/2002 18:00:00
2003 12.400 28/07/2003 09:00:00
2004 15.120 02/08/2004 22:00:00
2005 11.340 02/08/2005 14:00:00
2006 11.300 08/08/2006 16:00:00
2007 9.680 05/08/2007 19:00:00
2008 14.220 11/08/2008 20:00:00
2009 9.600 22/07/2009 15:00:00
2010 8.160 31/08/2010 19:00:00
2011 12.720 28/08/2011 19:00:00
2012 7.480 04/09/2012 18:00:00

123
4.3.1 Summary of Data Stage –Discharge data for the period 2012-13
Station Name: Vaitarna at Durvesh (01 02 25 001) Division : Tapi Division Surat Sub -Division : DGSD, CWC, Silvasa
Local River: Vaitarna
Day Jun Jul Aug Sep Oct Nov
W.L Q W.L Q W.L Q W.L Q W.L Q W.L Q
1 0.840 0.000 1.030 0.000 5.270 907.0 # 3.340 330.2 1.920 43.00 1.520 6.788
2 0.870 0.000 1.070 0.000 3.940 394.7 3.070 244.4 * 1.920 47.20 * 1.500 6.156
3 0.920 0.000 1.130 0.000 3.230 263.0 3.620 402.6 2.140 78.78 1.500 6.082
4 0.970 0.000 1.190 0.000 3.090 245.3 6.460 1394 # 2.320 131.0 1.490 8.960 *
5 1.010 0.000 1.180 0.000 2.980 224.8 * 6.040 1213 # 2.280 122.9 1.490 5.814
6 1.050 0.000 1.240 0.000 2.910 225.0 3.970 535.7 2.200 104.7 1.480 5.449
7 1.030 0.000 1.290 0.618 * 3.150 241.0 4.450 665.0 2.290 97.14 * 1.470 4.973
8 0.980 0.000 1.270 0.264 * 2.940 218.7 3.620 378.5 2.560 157.1 1.450 4.314
9 0.900 0.000 1.270 0.264 * 3.100 247.0 3.320 302.3 * 2.240 109.7 1.430 3.854
10 0.870 0.000 1.300 0.800 * 3.300 297.5 * 3.830 483.3 2.110 73.32 1.400 3.355
11 0.850 0.000 2.170 123.7 3.800 433.1 5.200 881.0 # 2.050 68.56 1.390 3.830 *
12 0.850 0.000 3.850 450.6 3.790 424.1 * 4.500 637.7 # 2.000 63.61 1.390 2.871
13 0.840 0.000 3.300 316.0 3.770 419.7 3.420 316.9 1.950 48.29 1.380 3.420 *
14 0.840 0.000 3.120 250.3 3.440 307.7 3.250 267.5 1.890 43.80 * 1.380 2.584
15 0.840 0.000 2.850 197.6 * 3.120 255.6 * 2.990 251.1 1.850 39.96 1.360 2.255
16 0.860 0.000 2.560 154.3 2.810 212.3 2.720 171.8 * 1.810 37.64 1.350 2.030
17 0.920 0.000 2.510 148.5 2.720 194.5 2.620 170.3 1.800 35.04 1.340 1.653
18 0.940 0.000 3.180 258.9 2.580 157.5 2.390 139.8 1.780 31.31 1.340 1.960 *
19 0.980 0.000 5.450 975.3 # 2.860 199.6 * 2.360 131.3 1.760 31.20 1.330 1.547
20 1.040 0.000 5.180 873.6 # 3.500 347.0 * 2.300 118.6 1.740 28.48 1.320 1.395

124
21 1.080 0.000 3.740 419.6 3.280 286.4 2.300 127.2 1.740 28.33 * 1.310 1.274
22 1.120 0.000 2.830 193.5 * 2.940 227.8 2.220 108.2 1.700 25.88 1.300 1.074
23 1.040 0.000 2.630 161.0 3.180 266.1 2.180 80.83 * 1.670 14.28 1.280 1.002
24 1.040 0.000 2.620 159.0 2.790 207.7 2.120 76.14 1.650 13.00 * 1.260 0.764
25 1.020 0.000 3.250 303.0 2.570 168.4 2.060 70.58 1.630 11.26 1.230 0.000 *
26 0.970 0.000 3.000 227.7 2.450 122.9 * 2.000 65.25 1.610 10.11 1.200 0.483
27 1.120 0.000 2.790 199.9 3.510 322.3 1.980 62.52 1.590 15.66 * 1.180 0.404
28 1.190 0.000 2.570 156.7 4.640 683.9 # 1.960 60.09 1.580 14.93 * 1.170 0.340 *
29 1.140 0.000 2.460 124.6 * 4.660 690.6 # 1.940 53.67 1.580 9.104 1.160 0.284
30 1.040 0.000 4.100 513.1 # 3.700 354.9 1.940 49.53 * 1.560 8.403 1.160 0.278
31 4.630 680.5 # 4.630 680.5 # 1.540 7.690
Ten-Daily Mean
I Ten-Daily 0.944 0.000 1.197 0.195 3.391 326.4 4.172 594.9 2.198 96.47 1.473 5.574
II Ten-Daily 0.896 0.000 3.417 374.9 3.239 295.1 3.175 308.6 1.863 42.79 1.358 2.354
III Ten-Daily 1.076 0.000 3.147 285.3 3.486 364.7 2.070 75.40 1.623 14.42 1.225 0.590
Monthly
Min. 0.840 0.000 1.030 0.000 2.450 122.9 1.940 49.53 1.540 7.690 1.160 0.000
Max. 1.190 0.000 5.450 975.3 5.270 907.0 6.460 1394 2.560 157.1 1.520 8.960
Mean 0.972 0.000 2.605 222.2 3.376 329.9 3.139 326.3 1.886 50.04 1.352 2.840
Annual Runoff in MCM = 2466 Annual Runoff in mm = 1221
Peak Observed Discharge = 1394 cumecs on 04/09/2012 Corres. Water Level :6.46 m
Lowest Observed Discharge = 0.000 cumecs on 01/06/2012 Corres. Water Level :0.84 m
Q: Observed/Computed discharge in cumec WL: Corresponding Mean Water Level (m.s.l) in m * : Computed Discharge
#:Discarded Discharge (values changed as per rating curve) Note: River remained in pooling/ no flow condition w.e.f. 01/06/12 to 06/07/12 & from 01/12/12 to 31/05/13 .

125
Stage –Discharge data for the period 2012-13 Station Name: Vaitarna at Durvesh (01 02 25 001) Division : Tapi Division, Surat Sub -Division : DGSD, CWC, Silvassa Local River: Vaitarna
Day Dec Jan Feb Mar Apr May
W.L Q WL Q WL Q WL Q WL Q WL Q
1 1.150 0.216 1.240 0.000 0.980 0.000 1.130 0.000 1.140 0.000 1.010 0.000
2 1.140 0.000 1.040 0.000 0.980 0.000 1.070 0.000 1.000 0.000 0.920 0.000
3 1.130 0.000 1.000 0.000 0.980 0.000 1.020 0.000 0.900 0.000 0.840 0.000
4 1.120 0.000 1.000 0.000 0.970 0.000 1.000 0.000 0.840 0.000 0.810 0.000
5 1.110 0.000 1.000 0.000 0.970 0.000 0.980 0.000 0.820 0.000 0.810 0.000
6 1.110 0.000 0.990 0.000 0.970 0.000 0.980 0.000 0.820 0.000 0.820 0.000
7 1.100 0.000 0.990 0.000 0.970 0.000 0.970 0.000 0.810 0.000 0.840 0.000
8 1.090 0.000 1.020 0.000 1.030 0.000 0.950 0.000 0.840 0.000 0.890 0.000
9 1.090 0.000 1.120 0.000 1.150 0.000 0.920 0.000 1.000 0.000 0.950 0.000
10 1.100 0.000 1.250 0.000 1.250 0.000 0.890 0.000 1.200 0.000 1.020 0.000
11 1.110 0.000 1.220 0.000 1.320 0.000 0.920 0.000 1.200 0.000 1.100 0.000
12 1.150 0.000 1.200 0.000 1.290 0.000 1.050 0.000 1.120 0.000 1.180 0.000
13 1.170 0.000 1.180 0.000 1.200 0.000 1.190 0.000 1.050 0.000 1.170 0.000
14 1.190 0.000 1.160 0.000 1.110 0.000 1.200 0.000 1.000 0.000 1.100 0.000
15 1.210 0.000 1.140 0.000 1.020 0.000 1.040 0.000 0.970 0.000 1.020 0.000
16 1.190 0.000 1.000 0.000 0.980 0.000 0.960 0.000 0.930 0.000 0.960 0.000
17 1.170 0.000 1.000 0.000 0.970 0.000 0.890 0.000 0.890 0.000 0.890 0.000
18 1.100 0.000 1.000 0.000 0.970 0.000 0.860 0.000 0.830 0.000 0.830 0.000
19 1.100 0.000 0.990 0.000 0.960 0.000 0.840 0.000 0.810 0.000 0.800 0.000
20 1.100 0.000 0.990 0.000 0.960 0.000 0.850 0.000 0.810 0.000 0.810 0.000

126
21 1.090 0.000 0.990 0.000 0.950 0.000 0.830 0.000 0.800 0.000 0.840 0.000
22 1.090 0.000 0.980 0.000 0.950 0.000 0.820 0.000 0.800 0.000 0.890 0.000
23 1.080 0.000 0.980 0.000 0.970 0.000 0.820 0.000 0.830 0.000 0.980 0.000
24 1.080 0.000 1.020 0.000 1.050 0.000 0.840 0.000 0.920 0.000 1.100 0.000
25 1.110 0.000 1.130 0.000 1.130 0.000 0.910 0.000 1.000 0.000 1.180 0.000
26 1.200 0.000 1.210 0.000 1.220 0.000 0.970 0.000 1.100 0.000 1.170 0.000
27 1.240 0.000 1.190 0.000 1.300 0.000 1.060 0.000 1.160 0.000 1.090 0.000
28 1.330 0.000 1.150 0.000 1.200 0.000 1.150 0.000 1.190 0.000 0.980 0.000
29 1.340 0.000 1.090 0.000 1.240 0.000 1.130 0.000 0.850 0.000
30 1.300 0.000 1.030 0.000 1.310 0.000 1.080 0.000 0.790 0.000
31 1.260 0.000 0.990 0.000 1.300 0.000 0.780 0.000
Ten-Daily Mean
I Ten-Daily 1.114 0.022 1.065 0.000 1.025 0.000 0.991 0.000 0.937 0.000 0.891 0.000
II Ten-Daily 1.149 0.000 1.088 0.000 1.078 0.000 0.980 0.000 0.961 0.000 0.986 0.000
III Ten-Daily 1.193 0.000 1.069 0.000 1.096 0.000 1.023 0.000 1.001 0.000 0.968 0.000
Monthly
Min. 1.080 0.000 0.980 0.000 0.950 0.000 0.820 0.000 0.800 0.000 0.780 0.000
Max. 1.340 0.216 1.250 0.000 1.320 0.000 1.310 0.000 1.200 0.000 1.180 0.000
Mean 1.153 0.007 1.074 0.000 1.064 0.000 0.999 0.000 0.966 0.000 0.949 0.000
Peak Computed Discharge = 424.1 cumecs on 12/08/2012 Corres. Water Level :3.79 m
Lowest Computed Discharge = 0.000 cumecs on 25/11/2012 Corres. Water Level :1.23 m
Q: Observed/Computed discharge in cumec WL: Corresponding Mean Water Level (m.s.l) in m * : Computed Discharge
#:Discarded Discharge (values changed as per rating curve) Note: River remained in pooling/ no flow condition w.e.f. 01/06/12 to 06/07/12 & from 01/12/12 to 31/05/13 .

127
4.3.4 Stage Discharge Curve
Station Name: Vaitarna at Durvesh (01 02 25 001) Division : Tapi Division Surat Local River: Vaitarna Sub -Division : DGSD, CWC, Silvassa
Stage Discharge Curves of site Vaitarna at Durvesh for the Year2012-13
Stage Discharge Curve of river Vaitarna at site Durvesh for the period 01.06.2012 to 31.05.2013
Calculated Observed
Discharge in cumec1,8001,6001,4001,2001,0008006004002000
Stag
e in
m
8
7.75
7.5
7.25
7
6.75
6.5
6.25
6
5.75
5.5
5.25
5
4.75
4.5
4.25
4
3.75
3.5
3.25
3
2.75
2.5
2.25
2
1.75
1.5
1.25
1
0.75
Procedure : Standard Equation type : Power Q=C(h+a)^b
LB UB a b c
1.000 7.500 -1.240 1.661 89.575

128
Annual Runoff
Annual Runoff Values- Runoff Based on period 1971 to 2013
Station Name: Vaitarna at Durvesh (01 02 25 001) Division : Tapi Division Surat Local River: Vaitrana Sub -Division : DGSD, CWC, Silvassa

129
4.3.6 Monthly Average Runoff
Station Name: Vaitarna at Durvesh (01 02 25 001) Division : Tapi Division Surat Local River: Vaitarna Sub -Division : DGSD, CWC, Silvassa
Monthly Average Runoff Based on period: 1971 -2012
Monthly Average Runoff Based on period: 2012 -2013

130
4.3.7 Superimposed Cross section
Station Name: Vaitarna at Durvesh (01 02 25 001) Division : Tapi Division Surat Local River: Vaitarna Sub -Division : DGSD, CWC, Silvassa
Historical Flood Level observed so far 16.130 m on date 17/09/1998 at 13:00 hrs

131
4.3.8 Water Level vs. Time- Graph of Highest Flood Peaks during 2012-13
Station Name: Vaitarna at Durvesh (01 02 25 001) Division : Tapi Division Surat
Local River: Vaitarna Sub -Division : DGSD, CWC, Silvassa
Water level vs. Time graph of I flood peak during the year 2012-13
Water level vs. Time graph of II flood peak during the year 2012-13
Water level vs. Time graph of III flood peak during the year 2012-13

132
4.4 Dhadhar Basin
4.4.1 History Sheet
HISTORY SHEET
Water Year : 2012-13
Site : Pingalwada Code : 01 02 14 001
State : Gujarat District Vadodara
Basin : Narmada Independent River : Dhadhar
Tributary : - Sub Tributary : -
Sub-Sub Tributary : - Local River : Dhadhar
Division : Tapi Dvision, Surat Sub-Division : LNSD Bharuch
Drainage Area : 2400 Sq. Km. Bank : Right
Latitude : 22°06'37" N Longitude : 73°04'44" E
Zero of Gauge
(m) : 2 (m.s.l) 07/04/1989
Opening Date Closing Date
Gauge : 07/04/1989
Discharge : 30/06/1989
Sediment :
Water Quality : 15/03/1990

133
Annual Maximum / Minimum discharge with corresponding Water Level (m.s.l)
Maximum Minimum
Year Q
(cumecs)
WL (m) Date Q
(cumecs)
WL
(m)
Date
1989-1990 334.9 10.768 21/08/1989 0.185 4.840 08/05/1990
1990-1991 985.4 18.200 25/08/1990 0.002 5.050 01/04/1991
1991-1992 424.3 13.025 25/07/1991 0.053 5.320 29/05/1992
1992-1993 197.7 10.368 04/09/1992 0.152 5.110 22/01/1993
1993-1994 674.5 15.300 18/07/1993 0.350 5.000 19/03/1994
1994-1995 1056 19.050 09/09/1994 0.280 5.040 12/06/1994
1995-1996 442.0 12.700 23/07/1995 0.650 5.000 30/05/1996
1996-1997 641.7 15.390 30/07/1996 0.500 5.000 25/11/1996
1997-1998 1014 17.400 26/08/1997 0.500 5.120 11/01/1998
1998-1999 602.0 16.835 18/09/1998 0.356 5.120 12/05/1999
1999-2000 23.02 6.500 14/10/1999 0.500 5.040 19/12/1999
2000-2001 503.1 15.425 15/07/2000 0.231 4.980 20/04/2001
2001-2002 418.2 13.500 12/08/2001 0.302 4.990 09/06/2001
2002-2003 427.1 13.700 05/09/2002 0.690 5.050 20/04/2003
2003-2004 839.9 15.710 26/08/2003 0.712 5.060 20/03/2004
2004-2005 681.5 15.260 16/08/2004 0.765 5.070 12/06/2004
2005-2006 807.5 18.450 02/07/2005 0.995 5.180 26/02/2006
2006-2007 759.0 18.245 31/07/2006 0.000 5.000 06/04/2007
2007-2008 586.9 15.250 03/07/2007 2.134 5.050 31/05/2008
2008-2009 682.7 15.750 13/08/2008 1.250 5.110 08/05/2009
2009-2010 21.98 6.745 31/08/2009 0.000 5.090 13/06/2009
2010-2011 655 15.850 09/08/2010 0.000 5.210 01/06/2010
2011-2012 250.1 13.200 14/08/2011 0.000 5.370 27/11/2011
2012-13 148.2 12.090 12/09/2012 0.000 5.230 01/06/2012

134
4.4.2 Annual Maximum Flood Peak
Year Highest Flood Level
(m) Date Hour
1989 7.860 01/09/1989 08:00:00
1990 18.870 25/08/1990 16:00:00
1991 13.250 25/07/1991 14:00:00
1992 10.500 04/09/1992 23:00:00
1993 15.300 18/07/1993 08:00:00
1994 19.700 08/09/1994 18:00:00
1995 13.300 22/07/1995 23:00:00
1996 15.750 29/07/1996 23:00:00
1997 17.400 26/08/1997 00:00:00
1998 16.950 18/09/1998 02:00:00
1999 7.000 21/07/1999 17:00:00
2000 15.430 15/07/2000 09:00:00
2001 13.500 11/08/2001 21:00:00
2002 13.850 05/09/2002 17:00:00
2003 15.840 26/08/2003 17:00:00
2004 15.260 15/08/2004 22:00:00
2005 18.450 02/07/2005 17:00:00
2006 18.500 31/07/2006 16:00:00
2007 15.350 02/07/2007 21:00:00
2008 17.700 14/08/2008 07:00:00
2009 7.000 29/08/2009 19:00:00
2010 16.300 09/08/2010 19:00:00
2011 13.200 14/08/2011 07:00:00
2012 12.800 12/09/2012 08:00:00

135
4.4.3 Summary of Data
Stage discharge data for the period of 2012-13
Station Name: Dhadar at Pingalwada(01 02 14 001) Division : Tapi Division, Surat Local River: Pingalwada Sub -Division : LNSD, CWC, Bharuch
Day Jun Jul Aug Sep Oct Nov W.L Q W.L Q W.L Q W.L Q W.L Q W.L Q 1 5.230 0.000 5.300 0.000 5.430 4.007 6.200 14.12 6.200 14.10 5.700 6.425 2 5.210 0.000 5.300 0.000 5.430 4.259 6.500 18.09 * 5.900 9.250 * 5.690 6.246 3 5.200 0.000 5.290 0.000 5.450 4.428 6.300 15.32 5.850 10.42 5.690 6.204
4 5.200 0.000 5.350 2.504 * 5.410 3.961 6.400 16.22 5.850 10.08 5.680 6.350 * 5 5.200 0.000 6.000 10.64 * 5.400 3.040 * 7.500 29.82 5.800 9.944 5.680 6.179 6 5.190 0.000 6.000 10.64 * 5.390 3.014 8.450 51.14 5.800 9.952 5.680 4.853 7 5.190 0.000 5.800 7.910 * 5.380 2.645 8.860 62.90 5.800 7.910 * 5.650 4.755 8 5.200 0.000 5.700 6.610 * 5.380 2.642 9.000 66.49 5.850 10.34 5.650 4.752
9 5.200 0.000 5.600 5.360 * 5.400 3.342 9.110 65.85 * 5.850 10.32 5.640 4.622 10 5.190 0.000 6.000 11.25 5.550 4.750 * 8.500 52.73 5.800 9.883 5.640 4.618 11 5.200 0.000 6.200 12.66 6.000 11.21 11.200 110.9 # 5.800 9.839 5.630 5.730 * 12 5.190 0.000 6.100 11.83 6.100 12.06 * 12.800 148.2 # 5.800 9.609 5.620 4.156 13 5.190 0.000 6.000 11.18 6.650 20.08 12.100 131.6 # 5.800 9.530 5.630 5.730 *
14 5.210 0.000 5.800 8.748 11.100 108.6 # 10.800 101.9 # 5.850 8.580 * 5.640 4.601 15 5.200 0.000 5.700 6.610 * 11.750 123.5 # 8.300 49.81 # 5.800 9.409 5.620 5.600 * 16 5.200 0.000 5.600 6.160 10.900 104.2 # 7.200 29.65 * 5.750 8.667 5.620 5.600 * 17 5.320 0.000 5.600 6.273 8.450 50.59 6.800 22.90 # 5.750 8.520 5.620 4.128 18 5.340 0.000 5.895 9.321 7.305 27.06 6.780 22.58 # 5.750 8.471 5.610 5.480 *
19 5.330 0.000 6.200 12.71 6.780 22.58 * 6.560 19.12 5.720 8.021 5.610 3.744 20 5.320 0.000 6.000 11.24 6.500 18.09 * 6.500 18.88 5.720 7.484 5.620 3.963

136
21 5.320 0.000 5.800 8.719 6.350 15.80 6.400 18.16 5.720 6.860 * 5.620 3.963
22 5.310 0.000 5.750 7.250 * 6.300 15.18 6.300 16.00 5.700 6.721 5.640 4.648
23 5.300 0.000 5.700 6.494 6.280 15.08 6.420 16.84 * 5.680 6.371 5.630 4.509
24 5.300 0.000 5.700 6.500 6.200 14.06 6.350 16.51 5.680 6.350 * 5.630 4.099
25 5.300 0.000 5.600 5.931 6.200 13.97 6.320 16.18 5.680 6.347 5.630 5.730 *
26 5.310 0.000 5.500 5.302 6.180 13.23 * 6.300 15.86 5.700 6.619 5.620 3.956
27 5.300 0.000 5.450 5.002 6.220 14.27 6.220 15.15 5.690 6.480 * 5.620 3.964
28 5.300 0.000 5.430 4.235 6.220 14.22 6.210 14.44 5.680 6.350 * 5.620 5.600 *
29 5.300 0.000 5.430 3.370 * 6.170 13.31 6.200 14.16 5.680 6.283 5.610 3.648
30 5.290 0.000 5.430 4.194 6.240 14.47 6.190 13.38 * 5.700 6.545 5.610 3.777
31 5.440 4.451 6.200 14.08 5.700 6.500
Ten-Daily Mean
I Ten-Daily 5.201 0.000 5.634 5.492 5.422 3.609 7.682 39.27 5.870 10.22 5.670 5.500
II Ten-Daily 5.250 0.000 5.909 9.672 8.154 49.80 8.904 65.55 5.774 8.813 5.622 4.873
III Ten-Daily 5.303 0.000 5.566 5.586 6.233 14.33 6.291 15.67 5.692 6.493 5.623 4.389
Monthly
Min. 5.190 0.000 5.290 0.000 5.380 2.642 6.190 13.38 5.680 6.283 5.610 3.648
Max. 5.340 0.000 6.200 12.71 11.750 123.5 12.800 148.2 6.200 14.10 5.700 6.425
Mean 5.251 0.000
5.699 6.874
6.591 22.31
7.626 40.16
5.776 8.444
5.638 4.921
Annual Runoff in MCM = 293 Annual Runoff in mm = 122
Peak Observed Discharge = 148.2 cumecs on 12/09/2012 Corres. Water Level :12.8 m
Lowest Observed Discharge = 0.000 cumecs on 01/06/2012 Corres. Water Level :5.23 m
Q: Observed/Computed discharge in cumec WL: Corresponding Mean Water Level (m.s.l) in m * : Computed Discharge
#:Discarded Discharge (values changed as per rating curve) Note: River remained in pooling/ no flow condition w.e.f. 01/06/12 to 03/07/12 .

137
Stage discharge data for the period of 2012-13
Station Name: Dhadar at Pingalwada (01 02 14 001) Division: Tapi Division, Surat Local River: Pingalwada Sub-Division:LNSD, CWC, Bharuch
Day Dec Jan Feb Mar Apr May
W.L Q WL Q WL Q WL Q WL Q WL Q 1 5.600 3.658 5.610 6.261 5.610 5.874 5.580 5.294 5.560 4.649 5.530 3.998
2 5.600 5.360 * 5.650 6.910 5.610 5.762 5.590 5.335 5.550 4.357 5.530 3.981 3 5.600 5.360 * 5.650 6.838 5.620 5.600 * 5.590 5.240 * 5.550 4.496 5.520 3.738
4 5.600 5.360 * 5.640 6.929 5.620 6.205 5.590 5.335 5.540 4.351 5.520 3.764
5 5.610 5.480 * 5.640 6.986 5.610 5.992 5.580 5.271 5.570 4.954 5.510 4.280 * 6 5.610 3.770 5.610 5.480 * 5.610 5.997 5.570 5.091 5.560 4.793 5.520 3.732
7 5.600 3.659 5.630 6.854 5.600 5.808 5.570 5.101 5.560 4.870 * 5.510 3.340 8 5.600 3.668 5.620 6.567 5.600 5.763 5.580 5.263 5.550 4.721 5.500 3.238
9 5.610 5.480 * 5.620 6.480 5.600 5.720 5.580 5.266 5.550 4.665 5.500 3.292
10 5.610 3.772 5.640 6.931 5.620 5.600 * 5.570 4.990 * 5.560 4.860 5.510 3.404 11 5.600 3.679 5.630 6.768 5.620 6.202 5.580 5.266 5.550 4.734 5.500 3.292
12 5.610 3.770 5.620 6.465 5.630 6.458 5.580 5.298 5.530 4.678 5.400 3.040 * 13 5.630 4.351 5.630 5.730 * 5.620 6.186 5.580 5.282 5.540 4.343 5.300 1.998
14 5.610 3.768 5.630 6.777 5.620 6.075 5.570 5.166 5.540 4.640 * 5.250 1.699
15 5.620 3.880 5.620 6.429 5.600 5.688 5.570 5.140 5.540 4.314 5.220 1.590 16 5.610 5.480 * 5.620 6.398 5.610 5.767 5.560 4.939 5.530 4.401 5.200 1.525
17 5.600 3.668 5.610 6.184 5.610 5.480 * 5.560 4.870 * 5.560 4.482 5.200 1.050 * 18 5.640 7.118 5.620 6.271 5.600 5.573 5.570 5.188 5.560 4.478 5.200 1.050 *
19 5.620 6.723 5.610 5.957 5.600 5.566 5.560 4.912 5.560 4.463 5.200 1.050 *
20 5.620 6.575 5.610 5.480 * 5.600 5.533 5.570 4.958 5.550 4.304 5.210 1.140 *

138
21 5.610 6.346 5.630 6.389 5.580 5.300 5.570 4.913 5.560 4.870 * 5.210 1.140 *
22 5.610 6.261 5.620 6.215 5.590 5.351 5.560 4.638 5.560 4.478 5.200 1.050 * 23 5.620 5.600 * 5.630 6.361 5.590 5.342 5.560 4.640 5.560 4.468 5.200 1.050 * 24 5.620 6.554 5.620 6.204 5.600 5.360 * 5.560 4.870 * 5.550 4.750 * 5.210 1.140 * 25 5.610 5.480 * 5.620 5.600 * 5.600 5.588 5.550 4.451 5.540 4.323 5.200 1.050 *
26 5.610 6.282 5.610 5.480 * 5.590 5.319 5.550 4.446 5.540 4.305 5.220 1.230 * 27 5.620 6.546 5.610 5.480 * 5.590 5.308 5.550 4.750 * 5.530 4.022 5.220 1.230 * 28 5.600 5.985 5.600 5.742 5.580 5.311 5.560 4.637 5.530 4.520 * 5.200 1.050 *
29 5.600 5.959 5.610 5.872 5.550 4.750 * 5.540 4.103 5.210 1.140 * 30 5.620 5.600 * 5.610 5.840 5.550 4.450 5.530 4.006 5.200 1.050 * 31 5.620 6.583 5.600 5.711 5.540 4.640 * 5.200 1.050 *
Ten-Daily Mean
I Ten-Daily 5.604 4.557 5.631 6.624 5.610 5.832 5.580 5.219 5.555 4.672 5.515 3.677 II Ten-Daily 5.616 4.901 5.620 6.246 5.611 5.853 5.570 5.102 5.546 4.484 5.268 1.743 III Ten-Daily 5.613 6.109 5.615 5.900 5.590 5.360 5.555 4.653 5.544 4.385 5.206 1.107
Monthly
Min. 5.600 3.658
5.600 5.480
5.580 5.300
5.540 4.446
5.530 4.006
5.200 1.050 Max. 5.640 7.118
5.650 6.986
5.630 6.458
5.590 5.335
5.570 4.954
5.530 4.280
Mean 5.611 5.218
5.622 6.245
5.605 5.705
5.568 4.98
5.548 4.513
5.326 2.141
Peak Computed Discharge = 65.85 cumecs on 09/09/2012 Corres. Water Level :9.11 m
Lowest Computed Discharge = 1.050 cumecs on 17/05/2013 Corres. Water Level :5.2 m
Q: Observed/Computed discharge in cumec WL: Corresponding Mean Water Level (m.s.l) in m * : Computed Discharge
#:Discarded Discharge (values changed as per rating curve)
Note: River remained in pooling/ no flow condition w.e.f. 01/06/12 to 03/07/12 .

139
4.4.4 Stage Discharge curve
Station Name: Dhadar at Pingalwada(01 02 14 001) Division : Tapi Division, Surat Local River: Pingalwada Sub -Division : LNSD, CWC, Bharuch
Stage Discharge Curves of site Dhadhar at Pingalwada for the Year 2012-13
Stage Discharge Curve of river Dhadar at site Pingalwada for the period 01.06.2012 to 31.05.2013
Calculated Observed
Discharge in cumec1301201101009080706050403020100
Stag
e in
m
12
11.75
11.5
11.25
11
10.75
10.5
10.25
10
9.75
9.5
9.25
9
8.75
8.5
8.25
8
7.75
7.5
7.25
7
6.75
6.5
6.25
6
5.75
5.5
5.25
5
Procedure : Standard Equation type: Power Q=C(h+a)^b
LB UB a b C
5.100 11.000 -5.050 1.255 11.347
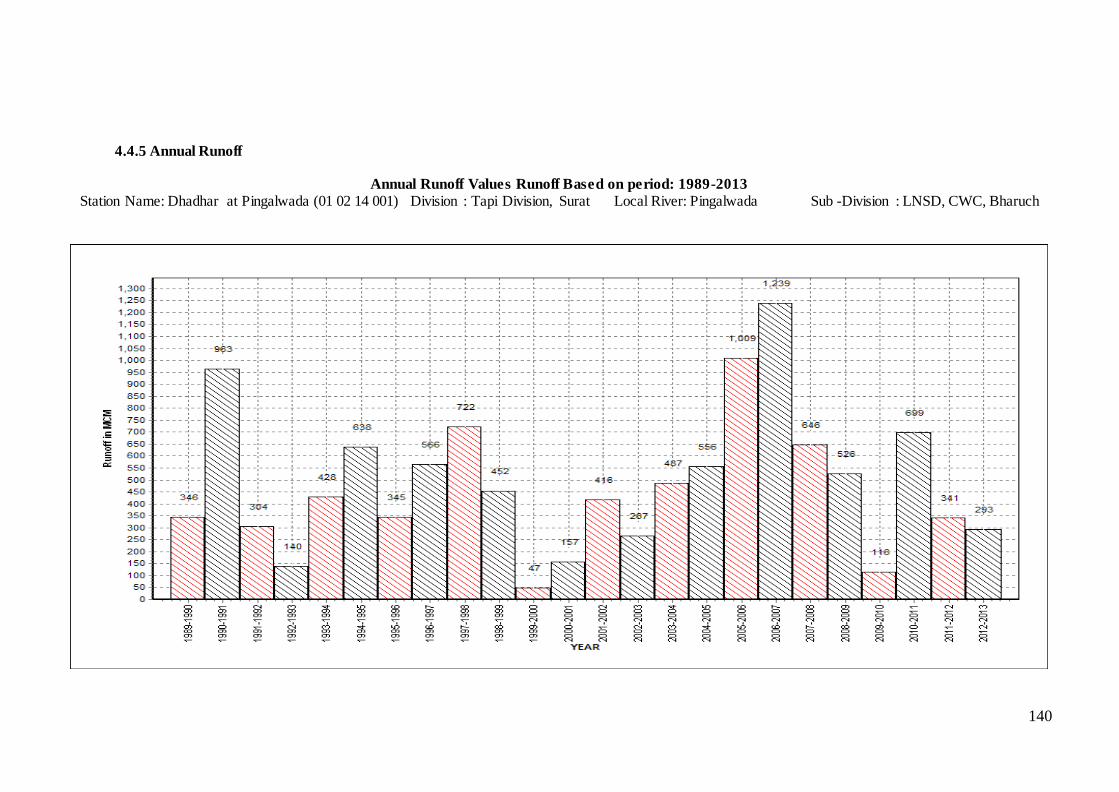
140
4.4.5 Annual Runoff
Annual Runoff Values Runoff Based on period: 1989-2013
Station Name: Dhadhar at Pingalwada (01 02 14 001) Division : Tapi Division, Surat Local River: Pingalwada Sub -Division : LNSD, CWC, Bharuch

141
4.4.6 Monthly Average Runoff
Station Name: Dhadar at Pingalwada(01 02 14 001) Division : Tapi Division, Surat Local River: Pingalwada Sub -Division : LNSD, CWC, Bharuch
Monthly Average Runoff Based on period: 1989-2012
Monthly Average Runoff Based on period: 2012-13

142
4.4.7 Superimposed Cross section
Station Name: Dhadar at Pingalwada (01 02 14 001) Division : Tapi Division, Surat Local River: Pingalwada Sub -Division : LNSD, CWC, Bharuch
Highest flood level observed so far 16.130 on dt 17/09/1998 at 1300hrs

143
4.4.8 Water Level vs. Time- Graph of Highest Flood Peaks during 2012-13
Station Name: Dhadar at Pingalwada Division : Tapi Division, Surat
Local River: Pingalwada Sub -Division : LNSD, CWC, Bharuch
Water level vs. Time graph of I flood peak during the year 2012-13
Water level vs. Time graph of II flood peak during the year 2012-13
Water level vs. Time graph of III flood peak during the year 2012-13

144
4.5 Wagh Basin
4.5.1.1 History Sheet
HISTORY SHEET
Water Year : 2012-13
Site : Wagh at Ozerkheda Code : 01 02 24 002
State : Maharashtra District Nashik
Basin : WFR South of Tapi Independent River : Daman Ganga
Tributary : Wagh Sub Tributary :
Sub-Sub Tributary : Local River :
Division : Tapi Division, Surat Sub-Division : DGSD,CWC,Silvassa
Drainage Area : 640 Sq. Km. Bank :
Latitude : 20°06'01" Longitude : 73°16'16"
Zero of Gauge
(m) : 80.1 (m.s.l) 15/06/1983
Opening Date Closing Date
Gauge : 28/06/1983
Discharge : 01/06/1984 Seasonal
01/06/1991 (Regular)

145
Annual Maximum / Minimum discharge with corresponding Water Level (m.s.l)
Maximum Minimum
Year
Q
(cumecs) WL (m) Date
Q
(cumecs) WL (m) Date
1991-1992 878.8 86.950 27/07/1991 0.000 81.400 17/05/1992
1992-1993 770.9 86.285 12/08/1992 0.000 81.080 22/05/1993
1993-1994 1117 87.100 13/07/1993 0.000 80.980 18/05/1994
1994-1995 1306 88.300 13/07/1994 0.000 81.340 10/02/1995
1995-1996 650.0 85.450 03/09/1995 0.000 80.610 04/03/1996
1996-1997 264.0 84.430 24/07/1996 0.000 80.410 04/02/1997
1997-1998 635.5 86.330 31/07/1997 0.000 80.860 18/03/1998
1998-1999 477.9 85.700 17/09/1998 0.000 80.650 05/05/1999
1999-2000 1144 87.175 16/07/1999 0.000 81.070 14/04/2000
2000-2001 774.8 85.750 13/07/2000 0.000 81.460 22/05/2001
2001-2002 284.0 84.620 16/08/2001 0.000 81.190 05/05/2002
2002-2003 1414 88.050 29/06/2002 0.000 81.110 07/05/2003
2003-2004 1145 87.200 28/07/2003 0.000 81.330 15/02/2004
2004-2005 2700 90.390 03/08/2004 0.000 81.670 20/04/2005
2005-2006 1660 88.550 29/06/2005 0.000 81.140 20/02/2006
2006-2007 1080 86.740 08/08/2006 0.042 81.210 13/01/2007
2007-2008 934.6 86.690 09/08/2007 0.100 81.130 09/01/2008
2008-2009 1421 87.855 12/08/2008 0.072 81.140 15/12/2008
2009-2010 1687 88.595 23/07/2009 0.000 81.090 01/06/2009
2010-2011 578.7 85.320 23/07/2010 0.000 81.080 01/06/2010
2011-2012 1289 87.2 29/08/2011 0.000 81.260 02/12/2011
2012-2013 1365 85.95 11/09/2012 0.000 81.140 01/06/2012

146
4.5.1.2 Annual Maximum Flood Peak
Year Highest Flood Level (m) Date Hour
1991 87.400 17/07/1991 11:00:00
1992 86.600 12/08/1992 13:00:00
1993 89.700 13/07/1993 16:00:00
1994 88.400 13/07/1994 07:00:00
1995 86.230 02/09/1995 16:00:00
1996 85.720 27/08/1996 19:00:00
1997 89.650 31/07/1997 18:00:00
1998 85.900 17/09/1998 09:00:00
1999 87.350 16/07/1999 07:00:00
2000 85.980 13/07/2000 18:00:00
2001 84.660 16/08/2001 12:00:00
2002 89.200 29/06/2002 13:00:00
2003 87.320 27/07/2003 12:00:00
2004 96.100 04/08/2004 01:00:00
2005 90.000 29/06/2005 05:00:00
2006 87.100 10/08/2006 16:00:00
2007 87.680 08/08/2007 16:00:00
2008 91.000 11/08/2008 17:00:00
2009 88.700 23/07/2009 09:00:00
2010 85.320 23/07/2010 08:00:00
2011 89.500 28/08/2011 16:00:00
2012 86.700 11/09/2012 12:00:00

147
4.5.1.3 Summary of Data
Stage Discharge Data for The period 2012-13 Station Name: Wagh at Ozerkheda (01 02 24 002) Division: Tapi Division, Surat Local River: Wagh Sub -Division: DGSD, CWC, Silvasssa
Day Jun Jul Aug Sep Oct Nov
W.L Q W.L Q W.L Q W.L Q W.L Q W.L Q
1 81.140 0.000 81.130 0.000 84.200 298.4 82.800 99.81 82.590 96.06 82.440 76.14
2 81.140 0.000 81.130 0.000 83.100 116.4 82.750 108.9 * 82.580 86.40 * 82.440 75.87
3 81.130 0.000 81.150 0.000 82.850 119.4 82.730 81.18 82.400 63.65 # 82.440 75.54
4 81.130 0.000 81.150 0.000 82.750 108.2 82.700 77.05 82.400 67.55 82.400 63.65 *
5 81.130 0.000 81.180 0.000 82.750 108.9 * 83.750 255.9 # 82.625 100.1 81.930 11.99 #
6 81.130 0.000 81.180 0.000 82.750 109.8 84.300 294.1 82.650 103.3 81.930 11.99 #
7 81.130 0.000 81.200 0.000 82.730 104.2 84.350 302.9 82.670 98.20 * 81.930 11.99 #
8 81.130 0.000 81.200 0.000 82.850 119.8 83.150 129.0 82.800 109.9 81.930 11.99 #
9 81.130 0.000 81.220 0.000 82.850 116.6 82.900 129.5 * 82.700 104.8 81.950 4.047
10 81.130 0.000 82.500 83.77 83.800 263.8 * 83.175 132.0 82.600 86.39 81.930 3.964
11 81.130 0.000 82.495 82.14 83.100 134.0 85.950 1365 82.550 97.47 81.930 11.99 *
12 81.130 0.000 82.520 92.07 83.100 157.8 * 84.200 328.2 * 82.500 89.26 81.930 3.981
13 81.130 0.000 82.500 83.98 83.350 176.9 83.100 157.8 * 82.480 78.37 81.930 11.99 *
14 81.130 0.000 82.500 84.34 83.150 140.5 83.200 144.8 82.480 73.61 * 81.930 3.953
15 81.130 0.000 82.450 69.84 * 82.880 126.7 * 83.000 130.5 82.480 85.51 81.920 3.894
16 81.130 0.000 82.430 74.10 82.800 118.6 82.940 135.1 * 82.480 80.97 81.920 3.888
17 81.130 0.000 82.400 73.23 82.760 112.5 82.860 117.4 82.480 84.83 81.920 4.242
18 81.130 0.000 82.550 108.4 82.700 106.7 82.810 112.4 82.480 89.25 81.910 10.18 *
19 81.130 0.000 84.700 411.9 # 82.650 105.0 * 82.750 109.0 82.450 80.94 81.910 3.743
20 81.130 0.000 84.200 298.7 82.650 95.55 * 82.700 105.4 82.450 80.62 81.910 3.687

148
21 81.130 0.000 83.100 144.0 82.750 110.2 82.700 104.4 82.450 69.84 * 81.910 3.669
22 81.130 0.000 82.980 140.7 * 82.700 105.6 82.680 94.33 82.450 80.10 81.900 3.567
23 81.130 0.000 82.700 111.2 82.650 99.82 82.680 99.53 * 82.450 79.90 81.850 3.232
24 81.130 0.000 82.600 96.49 82.650 97.44 82.670 104.3 82.450 69.84 * 81.800 2.746
25 81.130 0.000 82.700 104.5 82.640 95.34 82.660 103.7 82.450 79.90 81.800 1.520 *
26 81.130 0.000 82.800 117.8 82.630 95.92 * 82.650 98.10 82.450 78.54 81.750 2.454
27 81.130 0.000 82.700 104.2 82.620 92.48 82.640 100.6 82.450 69.84 * 81.740 2.414
28 81.130 0.000 82.650 87.04 84.200 328.2 # 82.630 98.15 82.450 69.84 * 81.720 2.300 *
29 81.130 0.000 82.630 92.92 * 83.000 107.2 82.620 96.84 82.450 77.71 81.700 2.107
30 81.130 0.000 82.950 139.4 82.950 99.60 82.600 88.99 * 82.450 94.40 81.670 1.904
31 84.300 344.7 # 82.930 96.95 82.450 77.11
Ten-Daily Mean
I Ten-Daily 81.132 0.000 81.304 8.377 83.063 146.6 83.260 161.0 82.601 91.63 82.132 34.72
II Ten-Daily 81.130 0.000 82.875 137.9 82.914 127.4 83.351 270.6 82.483 84.08 81.921 6.155
III Ten-Daily 81.130 0.000 82.919 134.8 82.884 120.8 82.653 98.90 82.450 77.00 81.784 2.591
Monthly
Min. 81.130 0.000 81.130 0.000 82.620 92.48 82.600 77.05 82.400 63.65 81.670 1.520
Max. 81.140 0.000 84.700 411.9 84.200 328.2 85.950 1365 82.800 109.9 82.440 76.14
Mean 81.131 0 82.384 95.02 82.951 131.2 83.088 176.8 82.510 84 81.946 14.49
Annual Runoff in MCM = 1328 Annual Runoff in mm = 2076
Peak Observed Discharge = 1365 cumecs on 11/09/2012 Corres. Water Level :85.95 m
Lowest Observed Discharge = 0.000 cumecs on 01/06/2012 Corres. Water Level :81.14 m
Q: Observed/Computed discharge in cumec WL: Corresponding Mean Water Level (m.s.l) in m * : Computed Discharge
#:Discarded Discharge (values changed as per rating curve)
Note: River remained in pooling/ no flow condition w.e.f. 01/06/12 to 09/07/12 & 21/12/2012 to 31/05/2013.

149
Stage Discharge Data for the period 2012-13
Station Name: Wagh at Ozerkheda (01 02 24 002) Division : Tapi Division, Surat Local River: Wagh Sub -Division : DGSD, CWC, Silvasa
Day Dec Jan Feb Mar Apr May
W.L Q WL Q WL Q WL Q WL Q WL Q
1 81.650 1.780 81.470 0.000 81.410 0.000 81.380 0.000 81.360 0.000 81.320 0.000
2 81.650 0.000 * 81.470 0.000 81.410 0.000 81.380 0.000 81.360 0.000 81.320 0.000
3 81.650 1.780 81.470 0.000 81.410 0.000 81.380 0.000 81.360 0.000 81.320 0.000
4 81.650 1.762 81.470 0.000 81.410 0.000 81.380 0.000 81.350 0.000 81.320 0.000
5 81.630 1.515 81.460 0.000 81.410 0.000 81.380 0.000 81.350 0.000 81.320 0.000
6 81.630 1.564 81.460 0.000 81.400 0.000 81.380 0.000 81.350 0.000 81.320 0.000
7 81.600 1.357 81.460 0.000 81.400 0.000 81.380 0.000 81.350 0.000 81.320 0.000 8 81.600 1.338 81.460 0.000 81.400 0.000 81.360 0.000 81.350 0.000 81.320 0.000
9 81.600 0.000 * 81.460 0.000 81.400 0.000 81.360 0.000 81.350 0.000 81.320 0.000
10 81.550 1.091 81.460 0.000 81.400 0.000 81.360 0.000 81.340 0.000 81.320 0.000
11 81.550 1.073 81.450 0.000 81.400 0.000 81.360 0.000 81.340 0.000 81.320 0.000
12 81.530 0.933 81.450 0.000 81.400 0.000 81.360 0.000 81.340 0.000 81.320 0.000
13 81.530 0.919 81.450 0.000 81.400 0.000 81.360 0.000 81.340 0.000 81.320 0.000
14 81.510 0.796 81.450 0.000 81.400 0.000 81.360 0.000 81.340 0.000 81.320 0.000
15 81.500 0.555 81.450 0.000 81.390 0.000 81.360 0.000 81.340 0.000 81.320 0.000
16 81.500 0.500 * 81.450 0.000 81.390 0.000 81.360 0.000 81.340 0.000 81.320 0.000
17 81.490 0.100 * 81.430 0.000 81.390 0.000 81.360 0.000 81.340 0.000 81.320 0.000
18 81.490 0.100 * 81.430 0.000 81.390 0.000 81.360 0.000 81.340 0.000 81.320 0.000
19 81.490 0.100 * 81.430 0.000 81.390 0.000 81.360 0.000 81.340 0.000 81.300 0.000
20 81.490 0.100 * 81.430 0.000 81.390 0.000 81.350 0.000 81.340 0.000 81.300 0.000

150
21 81.480 0.000 81.420 0.000 81.380 0.000 81.350 0.000 81.340 0.000 81.300 0.000
22 81.480 0.000 81.420 0.000 81.380 0.000 81.360 0.000 81.340 0.000 81.300 0.000
23 81.480 0.000 81.420 0.000 81.380 0.000 81.360 0.000 81.340 0.000 81.300 0.000
24 81.480 0.000 81.420 0.000 81.380 0.000 81.360 0.000 81.320 0.000 81.300 0.000
25 81.480 0.000 81.420 0.000 81.380 0.000 81.360 0.000 81.320 0.000 81.300 0.000
26 81.480 0.000 81.420 0.000 81.380 0.000 81.360 0.000 81.320 0.000 81.300 0.000
27 81.470 0.000 81.420 0.000 81.380 0.000 81.360 0.000 81.320 0.000 81.300 0.000
28 81.470 0.000 81.420 0.000 81.380 0.000 81.360 0.000 81.320 0.000 81.300 0.000
29 81.470 0.000 81.420 0.000 81.360 0.000 81.320 0.000 81.300 0.000
30 81.470 0.000 81.410 0.000 81.360 0.000 81.320 0.000 81.300 0.000
31 81.470 0.000 81.410 0.000 81.360 0.000 81.300 0.000
Ten-Daily Mean
I Ten-Daily 81.621 1.219 81.464 0.000 81.405 0.000 81.374 0.000 81.352 0.000 81.320 0.000
II Ten-Daily 81.508 0.518 81.442 0.000 81.394 0.000 81.359 0.000 81.340 0.000 81.316 0.000
III Ten-Daily 81.475 0.000 81.418 0.000 81.380 0.000 81.359 0.000 81.326 0.000 81.300 0.000
Monthly
Min. 81.470 0.000
81.410 0.000
81.380 0.000
81.350 0.000
81.320 0.000
81.300 0.000
Max. 81.650 1.780
81.470 0.000
81.410 0.000
81.380 0.000
81.360 0.000
81.320 0.000
Mean 81.533 0.560
81.441 0.000
81.394 0.000
81.364 0.000
81.339 0.000
81.312 0.000
Peak Computed Discharge = 328.2 cumecs on 12/09/2012 Corres. Water Level :84.2 m
Lowest Computed Discharge = 0.000 cumecs on 02/12/2012 Corres. Water Level :81.65 m
Q: Observed/Computed discharge in cumec WL: Corresponding Mean Water Level (m.s.l) in m * : Computed Discharge
#:Discarded Discharge (values changed as per rating curve)
Note: River remained in pooling/ no flow condition w.e.f. 01/06/12 to 09/07/12 & 21/12/2012 to 31/05/2013.

151
4.5.1.4 Stage Discharge Curve
Station Name: Wagh at Ozerkheda (01 02 24 002) Division: Tapi Division, Surat Local River: Wagh Sub -Division: DGSD, CWC, Silvasssa
Stage Discharge Curve of river Wagh at site Ozerkheda for the period 01.06.2012 to 31.05.2013
Calculated Observed
Discharge in cumec800750700650600550500450400350300250200150100500
Stag
e in
m
87
86.8
86.6
86.4
86.2
86
85.8
85.6
85.4
85.2
85
84.8
84.6
84.4
84.2
84
83.8
83.6
83.4
83.2
83
82.8
82.6
82.4
82.2
82
81.8
81.6
81.4
81.2
Procedure : Standard Equation type : Power Q=C(h+a)^b
LB UB a b C
81.800 87.000 -81.771 1.214 111.748

152
4.5.1.5 Annual Runoff
Annual Runoff Values Runoff Based on period 1991-2013
Station Name: Wagh at Ozerkheda (01 02 24 002) Division: Tapi Division, Surat Local River: Wagh Sub -Division: DGSD, CWC, Silvasssa

153
4.5.1.6 Monthly Average Runoff
Station Name: Wagh at Ozerkheda (01 02 24 002) Division: Tapi Division, Surat Local River: Wagh Sub -Division: DGSD, CWC, Silvasa
Monthly Average Runoff Based on period 1991-2012
Monthly Average Runoff Based on period 2012-13

154
4.5.1.7 Superimposed cross section
Station Name: Wagh at Ozerkheda (01 02 24 002) Division: Tapi Division, Surat Local River: Wagh Sub -Division: DGSD, CWC, Silvasa
Highest flood level observed so far 96.100 on dt 04/08/2004 at 0100hrs

155
4.5.1.8 Water Level vs. Time- Graph of Highest Flood Peaks during 2012-13
Station Name: Wagh at Ozerkheda Division : Tapi Division, Surat
Local River: Wagh Sub -Division : DGSD, CWC, Silvasssa
Water level vs. Time graph of I flood peak during the year 2012-13
Water level vs. Time graph of II flood peak during the year 2012-13
Water level vs. Time graph of III flood peak during the year 2012-13

156
4.5 Damanganga Basin
4.5.2.1 History sheet
History Sheet
Water Year : 2012-13
Site : Damanganga at Nanipalsan Code : 01 02 24 001
State : Gujarat District Valsad
Basin : WFR South of Tapi
Independent River : Daman Ganga
Tributary : Sub Tributary :
Sub-Sub Tributary : Local River :
Division : Tapi Division, Surat Sub-Division : DGSD,CWC,Silvasa
Drainage Area : 764 Sq. Km. Bank :
Latitude : 20°12'00" N Longitude : 73°17'00" E
Zero of
Gauge (m) : 95 (m.s.l) 6/15/1982
Opening Date Closing Date
Gauge : 15/06/1982
Discharge : 13/10/1983
01/06/1991
Seasonal
regular

157
Annual Maximum / Minimum discharge with corresponding Water Level (m.s.l)
Year
Maximum Minimum
Q
(cumecs) WL (m) Date
Q
(cumecs) WL (m) Date
1991-1992 1018 101.200 28/07/1991 0.000 96.120 26/01/1992
1992-1993 703.1 99.875 12/08/1992 0.000 96.340 22/02/1993
1993-1994 1393 101.485 13/07/1993 0.000 96.100 18/04/1994
1994-1995 1184 102.040 13/07/1994 0.000 96.020 27/04/1995
1995-1996 440.1 99.700 03/09/1995 0.000 96.070 09/03/1996
1996-1997 219.6 99.650 09/08/1996 0.000 96.320 13/03/1997
1997-1998 340.0 100.480 25/08/1997 0.000 96.260 12/03/1998
1998-1999 902.5 102.490 17/09/1998 0.000 96.230 27/06/1998
1999-2000 360.0 100.600 15/07/1999 0.000 96.250 13/06/1999
2000-2001 997.5 102.375 14/07/2000 0.000 96.250 03/03/2001
2001-2002 252.5 99.250 18/06/2001 0.000 96.580 19/02/2002
2002-2003 300.8 99.850 25/08/2002 0.521 96.670 30/11/2002
2003-2004 362.0 100.110 28/07/2003 0.716 96.710 10/12/2003
2004-2005 3173 103.925 03/08/2004 0.290 96.540 31/12/2004
2005-2006 1439 102.050 29/06/2005 0.000 96.420 28/02/2006
2006-2007 2728 103.590 09/08/2006 0.000 96.370 19/02/2007
2007-2008 895.1 100.900 09/08/2007 0.393 96.600 06/01/2008
2008-2009 1304 102.100 11/08/2008 0.000 96.400 25/04/2009
2009-2010 972.5 101.380 05/09/2009 0.000 96.460 19/02/2010
2010-2011 309.9 99.300 02/08/2010 0.000 96.320 01/06/2010
2011-2012 692.8 100.4 29/08/2011 0.000 96.580 24/12/2011
2012-2013 617.7 99.800 11/09/2012 0.000 96.300 01/06/2012

158
4.5.2.2 Annual Maximum Flood Peak
Year Highest Flood Level (m) Date Hour
1982 100.000 16/08/1982 07:00:00
1983 102.300 15/08/1983 10:00:00
1984 99.700 18/07/1984 13:00:00
1985 99.900 31/07/1985 15:00:00
1986 99.500 19/07/1986 06:00:00
1987 104.000 07/07/1987 13:00:00
1988 100.170 26/07/1988 14:00:00
1989 100.250 24/07/1989 06:00:00
1990 101.000 20/08/1990 03:00:00
1991 101.660 28/07/1991 00:00:00
1992 101.670 12/08/1992 16:00:00
1993 107.890 13/07/1993 13:00:00
1994 103.700 13/07/1994 06:00:00
1995 99.840 21/07/1995 21:00:00
1996 99.980 08/08/1996 19:00:00
1997 104.000 31/07/1997 14:00:00
1998 103.020 17/09/1998 13:00:00
1999 103.200 15/07/1999 13:00:00
2000 103.010 14/07/2000 01:00:00
2001 99.280 18/06/2001 03:00:00
2002 101.850 02/09/2002 18:00:00
2003 100.990 27/07/2003 17:00:00
2004 110.030 03/08/2004 18:00:00
2005 102.200 03/07/2005 15:00:00
2006 104.580 09/08/2006 12:00:00
2007 102.860 08/08/2007 23:00:00
2008 102.100 11/08/2008 08:00:00
2009 101.600 22/07/2009 18:00:00
2010 100.550 24/07/2010 23:00:00
2011 100.580 28/08/2011 01:00:00
2012 101.650 31/07/2012 13:00:00

159
4.5.2.3 Summary of Data
Stage Discharge Data for the period 2012-13 Station Name: Damanganga at Nanipalsan (01 02 24 001) Division : Tapi Division, Surat Local River: Damanganga Sub-Division:DGSD,CWC, Silvasssa
Day Jun Jul Aug Sep Oct Nov W.L Q W.L Q W.L Q W.L Q W.L Q W.L Q 1 96.300 0.000 96.300 0.000 98.600 210.4 98.100 135.1 97.240 25.79 96.950 6.096
2 96.290 0.000 96.300 0.000 97.950 121.8 97.850 90.73 * 97.240 25.30 * 96.920 5.832 3 96.290 0.000 96.350 0.000 97.800 109.0 97.770 104.3 97.490 36.82 96.900 5.667 4 96.290 0.000 96.370 0.000 97.770 106.0 97.765 95.66 97.630 62.09 # 96.880 6.297 *
5 96.290 0.000 96.390 0.000 97.700 70.57 * 98.000 123.4 97.680 68.08 # 96.850 5.462 6 96.280 0.000 96.410 0.000 97.720 92.53 98.000 122.7 97.710 71.83 # 96.830 5.360 7 96.280 0.000 96.420 0.000 97.780 100.3 98.250 154.8 98.350 178.1 * 96.830 3.928
8 96.280 0.000 96.430 0.000 97.700 90.22 98.050 132.7 97.750 102.5 96.830 3.743 9 96.280 0.000 96.440 0.000 97.765 97.94 97.950 105.7 * 97.530 77.85 96.820 3.575
10 96.280 0.000 96.460 0.000 98.500 210.5 * 98.250 152.7 97.470 36.21 96.820 3.530
11 96.280 0.000 97.280 28.28 # 98.250 156.6 99.800 617.7 # 97.430 32.12 96.820 4.428 * 12 96.280 0.000 97.200 25.43 98.450 199.3 * 98.300 160.7 97.360 34.76 # 96.820 3.496 13 96.280 0.000 97.130 22.67 98.100 137.0 98.100 137.1 97.340 33.00 # 96.810 4.151 *
14 96.280 0.000 97.140 23.17 97.900 112.6 98.000 122.9 97.330 32.25 * 96.810 3.328 15 96.280 0.000 97.200 22.51 * 97.850 90.73 * 97.850 106.8 97.300 18.98 96.810 3.336 16 96.280 0.000 97.170 23.45 97.750 95.56 97.800 83.71 * 97.250 17.63 96.810 3.250
17 96.280 0.000 97.150 22.67 97.700 90.08 97.740 94.23 97.200 15.82 96.800 3.210 18 96.280 0.000 97.180 24.44 97.620 73.79 97.650 85.31 97.180 15.60 96.800 3.880 * 19 96.280 0.000 98.160 123.7 97.660 65.65 * 97.600 78.74 97.150 12.45 96.790 3.072
20 96.280 0.000 97.900 100.7 97.640 63.27 * 97.560 71.58 97.140 11.69 96.780 2.924

160
21 96.280 0.000 97.550 77.62 97.690 88.70 97.540 69.05 97.120 17.44 * 96.750 1.897
22 96.280 0.000 97.360 34.77 * 97.610 72.61 97.500 40.43 97.120 9.876 96.740 1.850
23 96.280 0.000 97.220 18.57 97.600 71.15 97.510 48.90 * 97.100 10.40 96.740 1.831
24 96.280 0.000 97.870 110.6 97.570 68.61 97.450 37.08 97.080 15.16 * 96.720 1.746
25 96.280 0.000 97.560 69.05 97.510 40.07 97.410 34.37 97.070 9.630 96.700 1.724 *
26 96.280 0.000 97.500 39.39 97.500 47.88 * 97.370 26.81 96.990 7.162 96.700 1.683
27 96.280 0.000 97.460 35.79 97.560 66.80 97.300 27.93 96.980 10.21 * 96.680 1.399
28 96.280 0.000 97.450 34.31 98.330 161.2 97.260 26.94 96.980 10.21 * 96.680 1.402 *
29 96.280 0.000 97.700 70.57 * 98.000 125.2 97.250 24.16 96.980 6.989 96.680 1.364 30 96.280 0.000 97.850 102.0 97.820 106.5 97.250 26.03 * 96.960 6.584 96.670 1.309
31 98.300 166.7 98.500 183.7 96.950 6.222
Ten-Daily Mean
I Ten-Daily 96.286 0.000 96.387 0.000 97.928 120.9 97.998 121.8 97.609 68.46 96.863 4.949
II Ten-Daily 96.280 0.000 97.351 41.70 97.892 108.5 98.040 155.9 97.268 22.43 96.805 3.508
III Ten-Daily 96.280 0.000 97.620 69.03 97.790 93.86 97.384 36.17 97.030 9.990 96.706 1.620
Monthly
Min. 96.280 0.000
96.300 0.000
97.500 40.07
97.250 24.16
96.950 6.222
96.670 1.309
Max. 96.300 0.000
98.300 166.7
98.600 210.5
99.800 617.7
98.350 178.1
96.950 6.297
Mean 96.282 0.000
97.135 37.95
97.868 107.3
97.808 104.6
97.294 32.86
96.791 3.359
Annual Runoff in MCM = 758 Annual Runoff in mm = 993
Peak Observed Discharge = 617.7 cumecs on 11/09/2012 Corres. Water Level :99.8 m
Lowest Observed Discharge = 0.000 cumecs on 01/06/2012 Corres. Water Level :96.3 m
Q: Observed/Computed discharge in cumec WL: Corresponding Mean Water Level (m.s.l) in m * : Computed Discharge
#:Discarded Discharge (values changed as per rating curve)
Note: River remained in pooling/ no flow condition w.e.f. 01/06/12 to 10/07/12 & 01/01/2013 to 31/05/2013.

161
Stage Discharge Data for The period 2012-13
Station Name: Damanganga at Nanipalsan (01 02 24 001) Division : Tapi Division, Surat Local River: Damanganga Sub -Division: DGSD, CWC, Silvasssa
Day Dec Jan Feb Mar Apr May
W.L Q WL Q WL Q WL Q WL Q WL Q
1 96.670 1.277 96.530 0.000 96.500 0.000 96.480 0.000 96.460 0.000 96.430 0.000
2 96.660 1.116 * 96.530 0.000 96.500 0.000 96.480 0.000 96.460 0.000 96.430 0.000
3 96.660 1.232 96.530 0.000 96.500 0.000 96.480 0.000 96.460 0.000 96.430 0.000
4 96.650 1.012 96.530 0.000 96.500 0.000 96.480 0.000 96.460 0.000 96.430 0.000
5 96.650 0.964 96.520 0.000 96.500 0.000 96.480 0.000 96.460 0.000 96.430 0.000
6 96.640 0.906 96.520 0.000 96.500 0.000 96.470 0.000 96.460 0.000 96.430 0.000
7 96.640 0.868 96.520 0.000 96.500 0.000 96.470 0.000 96.450 0.000 96.430 0.000
8 96.630 0.807 96.520 0.000 96.500 0.000 96.470 0.000 96.450 0.000 96.430 0.000
9 96.630 0.752 * 96.520 0.000 96.490 0.000 96.470 0.000 96.450 0.000 96.430 0.000
10 96.620 0.781 96.520 0.000 96.490 0.000 96.470 0.000 96.450 0.000 96.420 0.000
11 96.600 0.687 96.520 0.000 96.490 0.000 96.470 0.000 96.450 0.000 96.420 0.000
12 96.600 0.741 96.520 0.000 96.490 0.000 96.470 0.000 96.450 0.000 96.420 0.000
13 96.600 0.659 96.520 0.000 96.490 0.000 96.470 0.000 96.450 0.000 96.420 0.000
14 96.600 0.653 96.520 0.000 96.490 0.000 96.470 0.000 96.450 0.000 96.420 0.000
15 96.590 0.621 96.520 0.000 96.490 0.000 96.470 0.000 96.450 0.000 96.420 0.000
16 96.590 0.384 * 96.520 0.000 96.490 0.000 96.470 0.000 96.450 0.000 96.420 0.000
17 96.580 0.499 96.520 0.000 96.490 0.000 96.470 0.000 96.450 0.000 96.420 0.000
18 96.580 0.477 96.520 0.000 96.480 0.000 96.470 0.000 96.450 0.000 96.420 0.000
19 96.580 0.438 96.520 0.000 96.480 0.000 96.470 0.000 96.450 0.000 96.420 0.000
20 96.570 0.249 * 96.520 0.000 96.480 0.000 96.470 0.000 96.450 0.000 96.420 0.000

162
21 96.570 0.249 * 96.520 0.000 96.480 0.000 96.460 0.000 96.450 0.000 96.420 0.000
22 96.570 0.249 * 96.510 0.000 96.480 0.000 96.460 0.000 96.450 0.000 96.410 0.000
23 96.560 0.193 * 96.510 0.000 96.480 0.000 96.460 0.000 96.450 0.000 96.410 0.000
24 96.560 0.190 * 96.510 0.000 96.480 0.000 96.460 0.000 96.430 0.000 96.410 0.000
25 96.560 0.190 * 96.510 0.000 96.480 0.000 96.460 0.000 96.430 0.000 96.410 0.000
26 96.550 0.140 * 96.510 0.000 96.480 0.000 96.460 0.000 96.430 0.000 96.410 0.000
27 96.550 0.140 * 96.510 0.000 96.480 0.000 96.460 0.000 96.430 0.000 96.410 0.000
28 96.540 0.100 * 96.510 0.000 96.480 0.000 96.460 0.000 96.430 0.000 96.400 0.000
29 96.540 0.100 * 96.510 0.000 96.460 0.000 96.430 0.000 96.400 0.000
30 96.540 0.100 * 96.510 0.000 96.460 0.000 96.430 0.000 96.400 0.000
31 96.540 0.100 * 96.510 0.000 96.460 0.000 96.400 0.000
Ten-Daily Mean
I Ten-Daily 96.645 0.972 96.524 0.000 96.498 0.000 96.475 0.000 96.456 0.000 96.429 0.000
II Ten-Daily 96.589 0.541 96.520 0.000 96.487 0.000 96.470 0.000 96.450 0.000 96.420 0.000
III Ten-Daily 96.553 0.159 96.511 0.000 96.480 0.000 96.460 0.000 96.436 0.000 96.407 0.000
Monthly
Min. 96.540 0.100 96.510 0.000 96.480 0.000 96.460 0.000 96.430 0.000 96.400 0.000
Max. 96.670 1.277 96.530 0.000 96.500 0.000 96.480 0.000 96.460 0.000 96.430 0.000
Mean 96.594 0.544 96.518 0 96.489 0 96.468 0 96.447 0 96.418 0
Peak Computed Discharge = 210.5 cumecs on 10/08/2012 Corres. Water Level :98.5 m
Lowest Computed Discharge = 0.100 cumecs on 28/12/2012 Corres. Water Level :96.54 m Q: Observed/Computed discharge in cumec WL: Corresponding Mean Water Level (m.s.l) in m * : Computed Discharge #:Discarded Discharge (values changed as per rating curve)
Note: River remained in pooling/ no flow condition w.e.f. 01/06/12 to 10/07/12 & 01/01/2013 to 31/05/2013.

163
4.5.2.4 Stage Discharge Curve
Station Name: Damanganga at Nanipalsan (01 02 24 001) Division : Tapi Division, Surat Local River: Damanganga Sub -Division: DGSD, CWC, Silvassa
Stage Discharge Curve of river Damanganga at site Nanipalsan for the period 01.06.2012 to 31.05.2013
Calculated Observed
Discharge in Cumec900850800750700650600550500450400350300250200150100500
Sta
ge in
m
101
100.5
100
99.5
99
98.5
98
97.5
97
96.5
Procedure: Unsteady flow correction Equation type: Power Q=C(h+a)^b
LB UB a b C
96.500 100.500 -96.480 2.167 45.866

164
4.5.2.5 Annual runoff
Annual Runoff values for the year 1991-2013
Station Name: Damanganga at Nanipalsan (01 02 24 001) Division : Tapi Division, Surat Local River: Damanganaga Sub -Division : DGSD, CWC, Silvassa

165
5.2.6 Monthly Average Runoff
Station Name: Damanganga at Nanipalsan (01 02 24 001) Division : Tapi Division, Surat Local River: Damanganga Sub -Division : DGSD, CWC, Silvasa
Monthly Average Runoff Based on period 1991-2012
Monthly Average Runoff Based on period 2012-13

166
4.5.2.7 Superimposed cross section
Station Name: Damanganga at Nanipalsan (01 02 24 001) Division : Tapi Division, Surat Local River: Damanganga Sub-Division:DGSD, CWC, Silvasa
Highest flood level observed so far 110.030 on dt 03/08/2004 at 18 : 00hrs

167
4.5.2.8 Water Level vs. Time- Graph of Highest Flood Peaks during 2012-13
Station Name: Damanganga at Nanipalsan (01 02 24 001) Division: Tapi Division, Surat
Local River: Damanganga Sub -Division: DGSD, CWC, Silvasa
Water level vs. Time graph of I flood peak during the year 2012-13
Water level vs. Time graph of II flood peak during the year 2012-
13
Water level vs. Time graph of III flood peak during the year 2012-13

168
4.6 Kim basin
4.6.1 History sheet
HISTORY SHEET
Water Year : 2012-13
Site : Motinaroli Code : 01 02 16 001
State : Gujarat District Surat
Basin : Narmada Independent River : Kim
Tributary : - Sub Tributary : -
Sub-Sub Tributary : - Local River : Kim
Division : Tapi Dvision, Surat Sub-Division : LNSD Bharuch
Drainage Area : 804 Sq. Km. Bank : Right
Latitude : 21°24’16” Longitude : 72°57’48”
Zero of Gauge m : 5 (m.s.l) 17/10/1990
Opening Date Closing Date
Gauge : 17/10/1990
Discharge : 17/10/1990
Sediment :
Water Quality : 1/7/1991

169
Annual maximum/minimum discharge with corresponding Water level (above m.s.l)
Year
Maximum Minimum
Q
(cumecs) WL (m) Date
Q
(cumecs) WL (m) Date
1991-1992 58.73 36.980 01/08/1991 0.000 6.245 06/05/1992
1992-1993 736.4 17.510 22/06/1992 0.191 7.515 30/03/1993
1993-1994 426.3 13.890 16/07/1993 0.170 7.520 17/05/1994
1994-1995 700.5 13.750 22/07/1994 0.000 7.350 04/04/1995
1995-1996 668.6 15.700 21/07/1995 0.240 7.280 05/04/1996
1996-1997 676.0 16.800 24/07/1996 0.112 7.470 23/04/1997
1997-1998 372.0 16.355 24/08/1997 0.080 7.300 10/03/1998
1998-1999 404.0 15.900 16/09/1998 0.099 7.230 26/03/1999
1999-2000 282.5 13.500 20/07/1999 0.170 7.360 26/03/2000
2000-2001 296.2 13.625 14/07/2000 0.041 7.200 28/05/2001
2001-2002 377.1 14.650 16/08/2001 0.000 7.220 07/05/2002
2002-2003 526.8 14.930 04/09/2002 0.000 7.100 13/04/2003
2003-2004 649.0 14.640 25/07/2003 0.000 7.190 29/05/2004
2004-2005 1288 17.200 04/08/2004 0.000 7.340 14/02/2005
2005-2006 720.2 16.380 30/06/2005 0.000 7.310 22/06/2005
2006-2007 923.2 17.650 29/07/2006 0.956 7.710 27/02/2007
2007-2008 851.7 16.815 02/07/2007 0.280 7.530 08/03/2008
2008-2009 735.6 15.985 12/08/2008 0.500 7.440 25/03/2009
2009-2010 206.8 13.660 07/09/2009 0.000 7.550 25/01/2010
2010-2011 384.2 14.625 10/09/2010 0.770 7.620 04/01/2011
2011-2012 497.8 14.425 26/08/2011 0.000 7.630 19/12/2012
2012-2013 47.640 13.480 04/09/2012 0.000 7.720 07/01/2013

170
4.6.2 Annual Maximum Flood peak
Year Highest Flood Level (m) Date Hour
1990 7.320 20/11/1990 08:00:00
1991 37.000 01/08/1991 08:00:00
1992 44.500 22/06/1992 11:00:00
1993 15.480 18/07/1993 22:00:00
1994 18.150 16/06/1994 23:00:00
1995 15.850 21/07/1995 15:00:00
1996 16.800 24/07/1996 03:00:00
1997 16.550 24/08/1997 11:00:00
1998 16.600 16/09/1998 13:00:00
1999 16.480 20/07/1999 19:00:00
2000 14.000 14/07/2000 06:00:00
2001 14.800 16/08/2001 08:00:00
2002 15.080 04/09/2002 13:00:00
2003 16.630 25/07/2003 20:00:00
2004 17.400 04/08/2004 12:00:00
2005 17.500 29/06/2005 18:00:00
2006 18.225 29/07/2006 21:00:00
2007 18.090 02/07/2007 20:00:00
2008 16.400 12/08/2008 15:00:00
2009 18.000 19/02/2009 08:00:00
2010 16.130 10/09/2010 05:00:00
2011 14.630 26/08/2011 11:00:00
2012 13.500 04/09/2012 10:00:00

171
4.6.3 Summary of data
Stage Discharge Data for the period 2012-13
Station Name: Kim at Motinaroli (01 02 16 001) Division : Tapi Division, Surat Local River:Kim Sub -Division : LNSD, CWC, Bharuch
Day Jun Jul Aug Sep Oct Nov
W.L Q W.L Q W.L Q W.L Q W.L Q W.L Q
1 7.850 0.726 * 7.960 1.416 * 8.460 7.253 9.820 15.20 # 8.310 3.771 # 8.120 3.149
2 7.770 0.300 * 7.970 1.539 8.380 7.118 9.450 12.17 * 8.270 3.490 * 8.110 3.156
3 7.770 0.300 * 8.080 2.585 8.200 4.839 8.950 4.714 8.250 4.280 8.140 3.363
4 7.730 0.040 # 8.190 3.821 8.120 2.253 13.480 47.64 8.490 6.136 8.140 2.604 *
5 7.810 0.487 * 8.200 4.339 8.080 2.202 * 9.660 13.78 # 8.430 7.017 8.140 3.792
6 7.840 0.666 # 8.270 4.409 8.060 2.069 # 9.245 7.896 8.400 6.848 8.150 4.739
7 7.880 0.910 # 8.280 4.386 8.050 2.003 # 9.275 9.393 8.340 3.980 * 8.130 3.211
8 8.090 1.157 8.200 3.012 * 8.030 1.870 # 9.105 8.333 8.340 5.135 8.110 3.166
9 8.160 2.275 8.200 4.529 8.020 1.805 # 8.960 8.466 * 8.310 3.771 # 8.110 3.165
10 8.190 2.940 * 8.075 0.881 8.040 1.937 * 8.800 5.946 8.290 5.048 8.110 3.174
11 8.150 1.938 8.160 1.427 8.130 2.954 9.485 10.12 8.220 4.070 8.100 2.335 *
12 8.130 1.868 8.080 0.260 8.290 3.632 * 9.900 15.65 # 8.220 3.586 8.090 3.072
13 8.060 2.069 # 8.060 2.069 # 8.360 5.914 9.410 11.86 # 8.230 3.640 8.070 2.135 *
14 8.170 2.807 # 8.170 2.807 8.320 4.991 9.300 8.287 8.220 3.149 * 8.070 2.638
15 8.230 3.508 8.190 2.943 * 8.250 3.355 * 9.405 10.08 8.200 3.416 8.040 2.513
16 8.210 3.675 8.220 2.017 8.200 4.437 9.360 11.47 * 8.170 3.483 8.000 2.340
17 8.190 2.943 * 8.220 2.039 8.190 4.339 9.080 7.568 8.170 3.450 7.970 1.954
18 8.180 3.787 8.210 4.475 8.210 4.467 8.920 8.169 # 8.170 3.444 7.970 1.480 *
19 8.170 3.641 10.570 22.35 8.270 3.490 * 8.580 5.683 # 8.190 5.233 7.980 1.998
20 8.865 6.433 9.050 6.990 8.290 3.632 * 8.785 7.860 8.160 3.567 8.010 2.347

172
21 8.370 5.192 8.440 6.662 8.380 6.454 8.495 6.200 8.150 2.670 * 8.040 2.509
22 8.220 4.182 8.300 3.701 * 8.340 4.314 8.410 6.771 8.140 2.948 8.020 2.394
23 8.150 3.206 8.280 4.521 8.330 1.732 9.360 11.47 * 8.130 3.224 8.060 2.617
24 8.120 2.469 * 8.290 4.721 8.280 4.507 9.340 8.350 8.150 2.670 * 8.060 2.617
25 8.120 2.939 8.350 6.942 8.270 4.404 9.410 8.405 8.180 3.419 8.050 2.003 *
26 8.080 2.053 8.350 6.948 8.260 3.424 * 9.590 10.01 8.150 3.492 8.090 3.077
27 8.080 2.570 8.320 4.824 8.270 3.797 9.115 8.466 8.150 2.670 * 8.080 3.008
28 8.050 2.001 8.290 4.565 8.270 4.480 8.820 7.041 8.110 2.400 * 8.090 2.268 *
29 8.030 1.900 8.290 3.630 * 8.310 5.919 8.510 7.138 8.130 3.222 8.080 2.944
30 8.000 1.604 8.300 6.143 8.975 5.973 8.410 4.471 * 8.110 3.162 8.090 3.080
31 8.310 6.293 8.425 7.021 8.130 3.181
Ten-Daily Mean
I Ten-Daily 7.909 0.980 8.142 3.092 8.144 3.335 9.675 13.35 8.343 4.948 8.126 3.352
II Ten-Daily 8.235 3.267 8.493 4.737 8.251 4.121 9.222 9.675 8.195 3.704 8.030 2.281
III Ten-Daily 8.122 2.812 8.320 5.359 8.374 4.729 8.946 7.833 8.139 3.005 8.066 2.652
Monthly
Min. 7.730 0.040
7.960 0.260
8.020 1.732
8.410 4.471
8.110 2.400
7.970 1.480 Max. 8.865 6.433
10.570 22.35
8.975 7.253
13.480 47.64
8.490 7.017
8.150 4.739
Mean 8.089 2.353
8.319 4.427
8.260 4.083
9.281 10.29
8.223 3.857
8.074 2.762
Annual Runoff in MCM = 87 Annual Runoff in mm = 108
Peak Observed Discharge = 47.64 cumecs on 04/09/2012 Corres. Water Level :13.48 m
Lowest Observed Discharge = 0.000 cumecs on 07/01/2013 Corres. Water Level :7.72 m
Q: Observed/Computed discharge in cumec WL: Corresponding Mean Water Level (m.s.l) in m * : Computed Discharge
#:Discarded Discharge (values changed as per rating curve)

173
Stage Discharge Data for The period 2012-13
Station Name: Kim at Motinaroli (01 02 16 001) Division : Tapi Division, Surat Local River: Kim Sub -Division : LNSD, CWC, Bharuch
Day Dec Jan Feb Mar Apr May
W.L Q WL Q WL Q WL Q WL Q WL Q
1 8.090 3.084 7.760 0.201 * 7.920 1.161 * 8.060 1.316 7.600 0.000 7.660 0.000
2 8.090 2.268 * 7.790 0.370 * 7.920 1.161 * 7.980 1.297 7.580 0.000 7.650 0.000
3 8.090 3.084 7.780 0.313 * 8.020 1.805 * 7.800 0.450 * 7.550 0.000 7.600 0.000
4 8.100 3.112 7.790 0.370 * 8.120 1.322 7.720 0.000 7.520 0.000 7.530 0.000
5 8.100 3.127 7.790 0.370 * 8.170 1.541 7.700 0.000 7.490 0.000 7.510 0.000
6 8.100 3.087 7.800 0.428 * 8.240 1.256 7.680 0.000 7.470 0.000 7.480 0.000
7 8.090 3.075 7.720 0.000 8.240 1.260 7.660 0.000 7.450 0.000 7.560 0.000
8 8.090 3.075 7.720 0.000 8.330 3.515 7.650 0.000 7.420 0.000 7.670 0.000
9 8.080 2.202 * 7.710 0.000 8.340 3.566 7.650 0.000 7.400 0.000 7.650 0.000
10 8.100 3.123 7.760 0.201 * 8.330 3.910 * 7.640 0.000 7.390 0.000 7.650 0.000
11 8.100 3.116 7.760 0.201 * 8.380 3.718 7.640 0.000 7.380 0.000 7.650 0.000
12 8.090 3.084 7.750 0.147 * 8.380 3.723 7.640 0.000 7.410 0.000 7.700 0.000
13 8.070 2.639 7.740 0.095 * 8.390 3.773 7.640 0.000 7.360 0.000 7.740 0.000
14 8.100 3.107 7.730 0.044 * 8.350 3.584 7.640 0.000 7.200 0.000 7.740 0.000
15 8.140 3.789 7.710 0.000 8.410 3.814 7.640 0.000 7.080 0.000 7.750 0.000
16 8.150 2.670 * 7.710 0.000 8.420 3.827 7.640 0.000 7.070 0.000 7.760 0.000
17 8.140 3.818 7.700 0.000 8.370 4.190 * 7.650 0.000 7.030 0.000 7.700 0.000
18 8.140 3.840 7.700 0.000 8.490 4.142 7.640 0.000 7.010 0.000 7.650 0.000
19 8.140 3.830 7.710 0.000 8.390 3.763 7.640 0.000 7.000 0.000 7.660 0.000
20 8.120 3.153 7.720 0.000 8.380 3.709 7.780 0.310 * 7.010 0.000 7.670 0.000

174
21 8.070 2.926 7.720 0.000 8.330 3.523 7.820 0.540 * 7.020 0.000 7.740 0.000 22 7.960 1.919 7.710 0.000 8.180 1.526 7.840 0.666 * 7.150 0.000 7.740 0.000 23 7.850 0.726 * 7.710 0.000 8.200 1.596 7.850 0.726 * 7.500 0.000 7.740 0.000
24 7.810 0.487 * 7.710 0.000 8.180 2.870 * 7.820 0.546 * 7.520 0.000 7.790 0.000 25 7.780 0.313 * 7.720 0.000 8.130 1.399 7.810 0.487 * 7.490 0.000 7.830 0.000 26 7.840 0.666 * 7.720 0.000 8.210 1.624 7.830 0.600 * 7.520 0.000 7.830 0.000 27 7.850 0.726 * 7.820 0.546 * 8.150 1.468 7.830 0.600 * 7.540 0.000 7.900 0.000 28 7.820 0.546 * 7.870 0.849 * 8.150 1.461 7.710 0.000 7.580 0.000 7.900 0.000
29 7.810 0.487 * 7.870 0.849 * 7.640 0.000 7.600 0.000 7.910 0.000 30 7.780 0.313 * 7.890 0.973 * 7.610 0.000 7.620 0.000 7.910 0.000 31 7.780 0.313 * 7.900 1.035 * 7.620 0.000 7.910 0.000
Ten-Daily Mean I Ten-Daily 8.093 2.924 7.762 0.225 8.163 2.050 7.754 0.306 7.487 0.000 7.596 0.000
II Ten-Daily 8.119 3.305 7.723 0.049 8.396 3.824 7.655 0.031 7.155 0.000 7.702 0.000 III Ten-Daily 7.850 0.857 7.785 0.387 8.191 1.933 7.762 0.379 7.454 0.000 7.836 0.000
Monthly Min. 7.780 0.313
7.700 0.000
7.920 1.161
7.610 0.000
7.000 0.000
7.480 0.000
Max. 8.150 3.840
7.900 1.035
8.490 4.190
8.060 1.316
7.620 0.000
7.910 0.000
Mean 8.015 2.313
7.758 0.226
8.254 2.650
7.725 0.243
7.365 0.000
7.715 0.000
Peak Computed Discharge = 12.17 cumecs on 02/09/2012 Corres. Water Level :9.45 m
Lowest Computed Discharge = 0.044 cumecs on 14/01/2013 Corres. Water Level :7.73 m
Q: Observed/Computed discharge in cumec WL: Corresponding Mean Water Level (m.s.l) in m * : Computed Discharge
#:Discarded Discharge (values changed as per rating curve)
Note: River in pooling or no flow condition w.e.f. 28/03/2013 to 31/05/2013

175
4.6.4 Stage Discharge Curve
Station Name: Kim at Motinaroli (01 02 16 001) Division : Tapi Division, Surat Local River: Kim Sub -Division : LNSD, CWC, Bharuch
Stage Discharge Curve of river Kim at site Motinaroli for the period 1.06.2012 to 31.05.2013
Calculated Observed
Discharge in cumec605550454035302520151050
Sta
ge in
m
13.5
13.25
13
12.75
12.5
12.25
12
11.75
11.5
11.25
11
10.75
10.5
10.25
10
9.75
9.5
9.25
9
8.75
8.5
8.25
8
7.75
7.5
Procedure : Standard Equation type : Power Q=C(h+a)^b
LB UB a b C
7.700 13.500 -7.720 1.089 6.698

176
4.6.5 Annual runoff
Annual Runoff values for the period 1991-2013
Station Name: Kim at Motinaroli (01 02 16 001) Division: Tapi Division, Surat Local River: Kim Sub -Division: LNSD, CWC, Bharuch

177
4.6.6 Monthly average Runoff Station Name: Kim at Motinaroli (01 02 16 001) Division : Tapi Division, Surat Local River: Kim Sub -Division : LNSD, CWC, Bharuch
Monthly Average Runoff on period 1991-2012
Monthly Average Runoff on period 2012-13

178
4.6.7 Superimposed cross section
Station Name: Kim at Motinaroli (01 02 16 001) Division : Tapi Division, Surat Local River: Kim Sub -Division : LNSD, CWC, Bharuch
Highest flood level recorded so far 18.225 m on 27/07/2006 at 21:00 hrs

179
4.6.8 Water Level vs. Time Graph of highest flood peaks during 2012-13
Station Name: Kim at Motinaroli (01 02 16 001) Division : Tapi Division, Surat Local River: Kim Sub -Division : LNSD, CWC, Bharuch
Water level vs. Time graph of 1st flood peak during the year 2012-13
Water level vs. Time graph of 2nd flood peak during the year 2012-13
Water level vs. Time graph of 3rd flood peak during the year 2012-13