Water Supply for Irrigation of Balda Lupaxi Bajo...
51
UPTEC W04 009 Examensarbete 20 p Februari 2004 Water Supply for Irrigation of Balda Lupaxi Bajo, Chimborazo, Ecuador Vattentillgång för bevattning av Balda Lupaxi Bajo, Chimborazo, Ecuador Sonja Halmstad
Transcript of Water Supply for Irrigation of Balda Lupaxi Bajo...

UPTEC W04 009
Examensarbete 20 pFebruari 2004
Water Supply for Irrigation of Balda Lupaxi Bajo, Chimborazo, Ecuador Vattentillgång för bevattning av Balda Lupaxi
Bajo, Chimborazo, Ecuador
Sonja Halmstad

i
ABSTRACTThis report is a part of a prefeasiblity study to investigate the possibilities to introduce anirrigation system in a rural part of the Andes in Ecuador. The report concentrates on the watersupply for the prefeasability study called Estudio de Prefacitbilidad de un Proyecto de Riegoen los Andes – el Caso de Balda Lupaxi Bajo, Chimborazo, Ecuador. The field study wascarried out in March to May 2003 in the indigenous village of Balda Lupaxi Bajo situated inthe province of Chimborazo. In this area the precipitation is inferior throughout the year.Consequently the harvest is poor and it is not possible to cultivate during parts of the year.The project was initiated by UNASAC, an indigenous organization for farmers. UNASACwould use this report for finding finances to complete further studies and finally implement anirrigation system.
The main aims of this report are to identify a suitable site for water supply and to determinethe size of the area possible to irrigate. Further, a distribution design of the water supply hasbeen investigated. This was carried out by field studies, water analyses, interviews andprocessing of hydrological and meteorological data.
Four alternatives of water supply were studied, both river and ground water. The mostappropriate water supply according to the study is the Llinllin River. The other investigatedalternatives were rejected due to lack of water, insufficient water quality and high costs. TheLlinllin River alternative consists of a direct abstraction, open channels and a siphon. Thisalternative can support 250 hectares under the constraints taken in this study.
In order to continue this project the farmers need to solve the social problems within andbetween the villages. An improvement of the communication with the nearby villages isnecessary. There are many stakeholders involved in the usage of the Llinllin River andtherefore it is of great importance to find a sustainable solution for the water abstraction.
Keywords: prefeasability study, irrigation, water supply, MFS, Andes, Columbe

ii
SAMMANFATTNINGDenna rapport är en del av en förstudie som syftar att undersöka möjligheterna för ettbevattningsprojekt i de ecuadorianska Anderna. Rapport koncentrerar sig på vatten-tillgångenför förstudien Estudio de Prefacitbilidad de un Proyecto de Riego en los Andes – el Caso deBalda Lupaxi Bajo, Chimborazo, Ecuador. Fältundersökningarna gjordes under mars till ochmed maj 2003 i Balda Lupaxi Bajo, en indian-by i provinsen Chimobrazo. I detta område ärnederbörden bristfällig och följaktligen är skörden dålig och det är inte möjligt att brukajorden under delar av året. Idén till projektet initierades av en bonde-förening som kallasUNASAC. UNASAC kommer att använda rapporten i sitt sökande efter finansiellt stöd förfördjupande studier och slutligen ett genomförande av projektet.
Målet med denna delrapport är att identifiera en lämplig plats för vattenuttag och attbestämma hur många hektar som kan bevattnas. Vidare presenteras ett förslag till utformningav vattenavledningen. Studien har gjorts genom fältstudier, vattenanalyser, intervjuer ochbearbetning av hydrologiska och meteorologiska data.
Fyra vattenuttagsalternativ undersöktes, både flod- och grundvatten. Det mest lämpligaalternativet enligt denna studie är floden Llinllin. De andra undersökta alternativenförkastades på grund av brist på vatten, otillräcklig vattenkvalitet och höga kostnader.Llinllin-alternativet består av en direkt avledning, en öppen kanal och en sifon. Alternativetkan försörja 250 hektar av bevattnad odlingsmark under de antaganden som är gjorda irapporten.
För att fortsätta med detta projekt måste bönderna lösa de sociala problem som finns i ochmellan byarna. Kommunicationen med de närliggande byarna är nödvändig. Det finns mångaintressenter av Llinllin floden och det är nödvändigt att finna en hållbar lösning förvattenuttaget.
Nyckelord: förstudie, bevattning, vattentillgång, MFS, Anderna, Columbe

iii
PREFACE
This study is a part of the report “Prefeasability Study of an Irrigation Project in the Andes –Case study of Balda Lupaxi Bajo, Chimborazo, Ecuador” by Halmstad and Lindell (2004) andis a Master’s Thesis report at the Aquatic and Environmental program at Uppsala Universityin Sweden. The field study was carried out together with Lina Lindell in Ecuador in the springof 2003 and the writing of the report during the fall of 2003. The study is financed by theSwedish International Development Cooperation Agency (Sida) as a Minor Field Study(MFS) and Göransson and Sandvikens travel scholarship. The MFS was received through theCommittee of Tropical Ecology at the Uppsala University.
The Swedish supervisor was Allan Rodhe, professor in Hydrology at Uppsala University,who also was the examiner. The supervisor in Ecuador was Oswaldo Pérez, mechanicalengineer at the University in Riobamba, ESPOCH.
To get a more comprehensive view it is recommended to read the whole prefeasablility studythat also include social aspects and the determination of the water demand.
This report would not have been possible without the help and support of the people I havemet during my work both in Ecuador and Sweden. There are some I would like to give aspecial thank you to…
… the employees at the hydrology department of INAMHI in Quito, especially Javier Roura.… Susana Nuñez and coworkers at MAG in Quito.… Luis Pilatsig at the Ministry of Energy and Mines for his help with the geology.… Marybell Montenegro G. at CNRH for her enthusiasm.… Marco Vivar, Angel Baño and David Flores at DCF for the fieldtrips.… Sonia Rosera, José Franklin Arcos Torres and Jorge Segovia at ESPOCH.… the Coro’s family and the people of Balda that assisted the fieldwork.… Anders Gustafsson and Lennart Strömquist at SWECO with their families for their supportand inspiration.
… PO Hårdén and Andreas Gyllenhammar at Uppsala University for their help with the GIS.… Chong-Yu Xu at Uppsala University for his help with processing the meteorology andhydrology data.… my supervisor Allan Rodhe at Uppsala University.… my supervisor Oswaldo Pérez at ESPOCH with family for their support andunderstanding.… Lina Lindell for good companionship.…my mother and father for their help with the revision of the language.
Uppsala, the 20th of January 2004
Copyright © Sonja HalmstadUPTEC W 04 009, ISSN 1401-5765Department of Earth Sciences, Air and Water Science, Uppsala University.Printed at the Department of Earth Sciences, Uppsala University, Uppsala, Sweden 2004

iv
ACRONYMS
English SpanishCLIMAN Climatic Monthly AnalysisCNRH National Council of Hydrologic
Resources , EcuadorConsejo Nacional de RecursosHídricos
CODERECH Regional Corporation ofDevelopment in Chimborazo,Ecuador
Corporación de Desarrollo Regionalde Chimborazo,
DFC Agricultural Forestry Development Desarrollo Forestal CampesinoESPOCH The University in Riobamba,
EcuadorEscuela Superior Politécnica delChimborazo
FAO Food and Agriculture Organizationof the United Nations
GIS Geographical Information SystemGPS Global Positioning SystemIGM The Military Institute of Geography,
EcuadorInstituto Geográfico Militar
INAMHI The National Institute ofMeteorology and Hydrology,Ecuador
Instituto Nacional de Meteorología eHidrología
INDA National Agrarian Institute, Ecuador Instituto National de DesarrolloAgrario
INERHI The National Institute of HydraulicResources, Ecuador
Instituto Ecuatoriano de RecursosHidráulicos
MAG The Ministry of Agriculture,Ecuador
Miniterio de Agricultura yGranadería
MFS Minor Field StudyORSTROM French Institute for Scientific
Research for DevelopmentSida Swedish International Development
Cooperation AgencyUNASAC Agricultural Organization in
ColumbeUnión de Asociaciones deTrabajadores Agrícolas de Columbe

v
TABLE OF CONTENTS
ABSTRACT i
SAMMANFATTNING i
PREFACE iii
ACRONYMS iv
TABLE OF CONTENTS v
1 INTRODUCTION 1
2 THE STUDY AREA 3
3 WATER DEMAND AND PRESENTATION OF THE WATER SUPPLYALTERNATIVES 5
3.1 Suitable zones to irrigate 6
3.2 Water demand 7
3.3 Water supply and distribution alternatives 7
4 HYDROLOGY 9
4.1 Surface water 94.1.1 The Guamote River 104.1.2 Precipitation 104.1.3 Field observations and river water quality 144.1.4 Conclusion on surface water 15
4.2 Ground water 154.2.1 Hydraulic characteristics of the aquifer 15
Slugtest - Hvorslev method 15Results of the slug test 16
4.2.2 Current use and variation of ground water 184.2.3 Ground water quality 184.2.4 Conclusions on ground water 19
5 THE WATER SUPPLY ALTERNATIVES 21
5.1 Water rights 21
5.2 River water 215.2.1 Water Balance Model 215.2.2 The Columbe River 22
Water balance 23
vi
Engineering 24Conclusions on the Columbe River 24
5.2.3 The Llinllin River 24Water balance 25Engineering 26
Selection of channel cross-section and freeboard 26Siphon 28
Rough cost calculations 29Conclusion on the Llinllin River 30
5.3 Ground water 30
6 CONCLUSIONS AND RECOMMENDATIONS 31
REFERENCES
APPENDIX
1 WATER DEMAND
2 AVERAGE PRECIPITATION OF STATIONS USED IN THE THEISSENPOLYGON METHOD
3 FIELD MEASUREMENTS AND RESULTS OF SLUG TEST
4 GROUND WATER VARIATIONS AT THE PASTURAGE
5 IRRIGATION WATER QUALITY GUIDELINES
6 SCHEMATIC SKETCH OF THE SIPHON IN THE LLINLLIN RIVERALTERNATIVE

1
1 INTRODUCTION
This project was initiated by UNASAC, Unión de Asociaciones de Trabajadores Agrícolas deColumbe, an organization for some indigenous communities located in the Andes of Ecuador.UNASAC is active in the rural parish of Columbe, a part of the province of Chimborazo,situated in the central part of the country. Columbe is located about 3 100 meter above the sealevel (m a.s.l.) in a very dry part of the Andes. The area is often affected by frosts, hail andwinds. The inhabitants of the parish are farmers and are mostly indigenous. The cultivatedland is situated on 3 100 to 3 300 m a.s.l. and a number of different crops are cultivated todaysuch as wheat, corn, peas and potatoes. The agricultural land is mainly dry, sandy and short oforganic material. This means that the water holding capacity is low. Consequently the harvestis very poor and according to some locals it is impossible to cultivate between July andJanuary. The pastureland has become less productive than before and for that reason theamount of cattle has decreased. The situation for the farmers in the area is insecure as thechance of achieving a good harvest depends on when the frost occurs and when the unreliablerain falls. To secure the food production in the area UNASAC wishes to implement anirrigation system. Today there is no irrigation in the Columbe area. An irrigation systemwould be very helpful for the communities, as it would increase the value and the productivityof the land. Today the farmers harvest once a year but with irrigation they could harvesttwice.
Throughout the Andean history irrigation has been a fundamental natural resource. There aretechnical evidences of irrigation activities from the time before the Hispanics and the Incas.During the prehispanic and preinca ages the irrigation technologies were based on the socialstructure of the community (Noordholland de Jong et. al., 1999). The most common way ofirrigation was gravity fed systems. Another way of dealing with the water shortage was tobring the field to the source of water. Some of these methods were fields watered by thehumidity of low clouds and fields dug close to the water table (Boelens et. al., 1998). Duringthe Inca age (12th to 15th century) the amount of arable land increased by intensive terracing ofmountain slopes to improve irrigation and decrease erosion. The Incas also built irrigationsystems in warm and dry valleys where framing previously had been difficult. During theSpanish colonization the social structure changed and therefore also the way of irrigation. TheHispanics brought along their water laws and regulations from Spain. The Spanish waterregulations ignored the traditional rights and customs (Noordholland de Jong et. al., 1999).
Today it is still common with irrigation in the Andes. Two irrigation projects were visitduring the fieldwork in Ecuador: San Juan and Licto, both in the province of Chimborazo .San Juan is a small project that started as a soil conservation project. The project includesirrigation with minisprinklers, terraces, composting, greenhouse cultivation and a guinea pigfarm. The site is about 0.5 ha and is located at 3 450 m a.s.l.. The irrigation water is collectedfrom rivers at higher elevation and transported to a small tank close to the field. The Lictoproject involves irrigation of 1 100 ha in 17 villages. Most irrigation is done by furrows. Thewater intake in this project is also from rivers at a higher elevation and transported by openchannels and siphons to the fields.
UNASAC is an umbrella organization for the agricultural workers in Columbe. Theorganization includes 16 communities and works for improving the situation of the farmers.At present time UNASAC is less active than earlier and there are only a few membersinvolved in the organization. There is hope that an irrigation project could bring theorganization to life again.

2
The aim of this project is to make a part of a prefeasibility study to find out if it is possible toimplement an irrigation system in Balda Lupaxi Bajo, Chimborazo, Ecuador. UNASAC willuse the prefeasablility study to apply for financial aid from national organizations or thegovernment. Therefore this document is aimed at local water ministries and organizations andis intended to support the development of agriculture in the region.The specific goals of this study are:
• to investigate water supply and distribution alternatives• to determine possible acreage to irrigate
This is accomplished by analyzing data and information gathered in Ecuador during April andMay 2003. Fieldwork such as interviewing and hydrological investigations including watersampling was also carried out during this period. The university of Riobamba analyzed thesamples regarding both physical and chemical parameters.

3
2 THE STUDY AREA
Columbe is a parish 30 km south of Riobamba in the Chimborazo province (Figure 2.1 and2.2). The capital, also called Columbe, is situated a couple of kilometers off the Pan AmericanHighway. The parish holds 16 169 inhabitants in 80 different villages (Ministerio delAmbiente, 2000). The climate is affected by the high altitude. The average temperature inColumbe, at a height between 3 100 - 4 200 m a.s.l., is 13ºC and the average yearlyprecipitation is less than 400 mm. The precipitation is uneven and has tended to graduallydecrease (Comité National sobre el Clima, 2001).
Figure 2.1 Ecuador and its provinces
Balda Lupaxi Bajo is an indigenous community in the parish of Columbe. 150 families live inthe village and totally the village has about 1 000 inhabitants. The main occupation isagriculture. There is no other source of income in the village. There are piped water andelectricity in the village even though these domestic services are not reliable. There is nosanitary service. A dirt road runs though the village that becomes damaged during the rainyseasons. Most of the cultivation is carried out on the hillsides and the cattle are kept on apasturage land. The land of Balda Lupaxi Bajo with surroundings belonged to a hacienda untilthe land reforms in the 1970s. The hacienda in Balda Lupaxi Bajo had a water tank forirrigation of their pasturage. A national law in the 1970s made the hacienda owners move outand sell their land quite peacefully. The farmers could now buy the land from the NationalAgrarian Institute, INDA, which was responsible for legalization and expropriation of land inEcuador. Two groups were formed in the village. One group thought that a communal form offarming was to be preferred and the other wanted each farmer to have his own land. In realitythe latter occurred. Each farmer got plots in different parts of the Columbe parish, not onlywithin the village of Balda Lupaxi Bajo. Today these plots have been divided into evensmaller parts when parents share the land among their children.

4
Henceforward the abbreviation Balda will represent Balda Lupaxi Bajo if nothing else ismentioned. There is a village called Balda Alto about 4 kilometers east of Balda Lupaxi Bajothat should not be mistaken for Balda Lupaxi Bajo.
Figure 2.2 Chimborazo province

5
Figure 2.3 Columbe with surroundings. A, B and C are discharge stations.

6
3 WATER DEMAND AND PRESENTATION OF THE WATERSUPPLY ALTERNATIVES
In this part of the report the water demand and choices of water supply and distribution willbe presented. The choices of alternatives were based on the study of suitable zones forirrigation, discussions with the locals, observations in the area, studies of the topographicmaps and the economical constraints. Investigations of the soil, crop use, climate and socio-economics were done to find the water demand and suitable zones to irrigate. The waterdemand and suitable zones to irrigate is represented in the Estudio de Prefactibilidad de unProyecto de Riego en los Andes – el Caso de Balda Lupaxi Bajo, Chimborazo, Ecuador(Halmstad & Lindell, 2004). The areas that were studied are the parts of Columbe parish thatbelong to the people of Balda. As mentioned before, the property of the people of Baldaspreads out in different parts in the Columbe parish, not necessary physically connected to thevillage of Balda. The areas that were investigated, Loma Gaushi, Gampala and the Pasturage,are shown in Figure 3.1.
Figure 3.1 The zones of investigation
3.1 Suitable zones to irrigateThe conclusions made by Halmstad & Lindell (2004) were that the most suitable area toirrigate are the slopes of Gampala. The pasturage between Balda and San Martin Bajo is

7
saturated with water during parts of the year. It would be difficult and expensive to drain thezone to achieve land suitable to cultivate. The pH is high in this part and that could limit thechoice of crops. Loma Gaushi has the problem of severe erosion. The soil has poor waterholding capacity due to its shallowness and texture. Because the erosion is advanced it isnecessary to take actions to regain the soil. Planting eucalyptus trees that have the capacity topercolate the hard ground could be one option. The last alternative is Gampala. Even this parthas problems with erosion but not as severe as Loma Gaushi. In order to create optimalcultivation at Gampala improvements of the soil texture and nutrition level together withconstructing terraces are needed. The erosion of the slopes is a problem that could worsenedby irrigation if proper soil conserving techniques are not used. (Halmstad & Lindell, 2003)
3.2 Water demandAccording to the local farmers they would grow vegetables and alphalpha if they hadirrigation. The water demand for potatoes, carrots and alphalpha were calculated in order torepresent the variety of possible crops. The average water demand is presented in Table 3.1.Monthly calculated water demand for the years of 1964-1967 and 1971-1978 is shown inAppendix 1. The average maximum water demand during the calculated years was 0.25l/(s ha). (Halmstad & Lindell, 2004)
Table 3.1 Calculated water demand in millimeters for potatoes, carrots and alphalpha. Source:Halmstad & Lindell, 2004.
3.3 Water supply and distribution alternativesThe farmers of Balda have some irrigation alternatives that they wish to have investigated.One of those is pumping water from the Columbe River to a large tank on Loma Gaushi.From there the water could be led in pipes to fields at Gampala and in open channels bygravitation to the pasturage. According to the locals the Columbe River never dries out.Another alternative of interest is to pump ground water from the pasturage to the fields onLoma Gaushi and Gampala. Previously the hacienda used a water hole called La Victoria forirrigation purposes and pumped water to a tank. The water was used for pasturage plants. Thepeople of Balda now wish to investigate the possibility of using the ground water as a sourcefor irrigation water. Both the Columbe River and the pasturage options would involvepumping.
The zone chosen to irrigate in this study was Gampala according to the soil investigations.The fields at Gampala vary in elevation between 3 200 and 3 400 m a.s.l.. The type ofirrigation design chosen for the water supply calculations was furrow irrigation. Furrowirrigation is widely used in the Andes and the method is easily used and maintained by thefarmers. The alternatives of sprinkler and drip irrigation are still under introduction in thearea. With time and increased experiences sprinklers may be a future option of irrigationdesign. The application efficiency of furrow irrigation design is assumed to be 60% (FAO,2000). In this project the farmers would have their own small water reservoir next to theirfield to store water according to a schedule made by the users. Dividing the water at the fieldwill not be discussed further in this report.
Jan Feb Mar Apr May Jun Jul Aug Sep Oct Nov DecPotatoes 68 46 44 27 - - - - - - 24 39Carrots - 5 19 34 65 48 - 27 33 41 64 52Alphalpha 57 32 31 32 55 47 59 68 48 39 50 54

8
The Columbe River and shallow ground water at the pasturage were chosen as alternatives forwater supply to meet the wish of the locals. The idea of building a reservoir at the top of theLoma Gaushi was rejected as a reservoir would increase the cost considerably. Consequentlythe Columbe River alternative would involve a direct abstraction by pumping water from theriver to the fields at Gampala. The ground water alternative would also involve pumping fromthe shallow ground water at the pasturage to the fields at Gampala. Other water supplies in thearea were investigated by studying the topographic map of the nearby area (Map: IGM, 1971,Map: IGM, 1991, a, b, c, Map: IGM, 1992). Two river alternatives for water supply werefound from the topographic information; the Llinllin River and the Pulucate Creek. Bothalternatives would involve river diversion with open channel distribution using gravity as thetransportation force. The Llinllin River alternative would include direct abstraction from theriver and a siphon. The Pulucate Creek alternative would include a storage reservoir to collectwater during rainy seasons. The discussion above results in the four alternatives that will beexamined in this report. The four alternatives are shown in Figure 3.2.
Alternative 1. Direct abstraction by pumping from the Columbe River at 3 146m a.s.l. to fields at Gampala
Alternative 2. Direct abstraction by pumping ground water from the pasturage at3 160 m a.s.l. to fields at Gampala.
Alternative 3. Direct abstraction by gravity from the Llinllin River at 3 400m a.s.l. to fields at Gampala
Alternative 4. Abstration by gravity from the Pulucate Creek at 3 320 m a.s.l. to areservoir at Gampala
The alternatives will be the basis for the studies in the next two chapters and presented inmore detail in chapter 5.
Figure 3.2 The four alternatives of water supply

9
4 HYDROLOGY
4.1 Surface waterThree of the alternatives presented in previous chapter involve river water as a water supplyfor irrigation. No water discharge measurements or quality samples have been previouslydone in Columbe River, Llinllin River or the Pulucate Creek. A river with known dischargedata was needed as a reference river. Water samples had to be taken to give some guidanceabout the water quality. Discharge data was gathered at the National Institute of Meteorologyand Hydrology (INAMHI) in Quito. Other information such as the catchment areas wasobtained by processing GIS information from MAG. The precipitation data was needed toestimate the variation of rainfall in the area. The variation was used for calculating thedischarge of the rivers. The precipitation information was gathered at INAMHI and in digitalform at MAG.
The closest river found that could be used as a reference river was the Guamote River at adischarge station at the junction with the Cebadas River. Other close rivers were alsoinvestigated. The plots of the specific discharge for the Guargualla River and the CebadasRiver showed different hydrologic regimes for the rivers (plot in Figure 4.1 and locations inFigure 2.3). When the Guamote River has its dry period in the late summer the others havetheir peak discharge. There are two factors that mainly influence the climate in the Andes.The air mass from the east carries rain that falls in July to September. The influences from thewest are affected by the mountain range with rainy period in December to March. TheColumbe parish is close to the border between these regimes, but the meteorology in thecatchment of the Guamote River follows the occidental regime. There are great variations inprecipitation within the area because of conditions such as altitude, slope orientation amongother things (MAG, 1976).
Figure 4.1 Comparison of the specific runoff for the Cebadas River, the Guargualla River andthe Guamote River.
The Guamote River was chosen as a reference river because the Columbe River, LlinllinRiver and Quebrada Pulucate all belonged to the catchment system of the Guamote River.
0
0,01
0,02
0,03
0,04
0,05
0,06
0,07
Jan FebMarc
hApri
lMay Jun
eJul
yAug Sept Oct
Nov Dec
Month
Spec
ific r
unof
f [m
3/(s
km
2)]
The Guargualla RiverThe Guamote RiverThe Cebadas River

10
According to the locals in Columbe all the rivers also have their high peaks in the spring likethe Guamote River.
4.1.1 The Guamote RiverThe catchment area of the Guamote River at the confluence with the Cebadas River is604 km2 and is situated in the valley between Riobamba and Palmira. It is a part of theChambo River system. INAMHI has daily recorded the discharge of the Guamote River from1965 to 1978. The measuring point was upstream the Cebadas River at the coordinates01 52 38 S, 78 38 06 W. The station has the INAMHI cod H786. During the 14 years there isone month lacking data (June 1969). The monthly and yearly averages are shown in Figures4.2 and 4.3.
Figure 4.2 Monthly average discharges for the Guamote River, 1966-1978.Figure 4.3 Annual average discharges for the Guamote River 1966-1978.
4.1.2 PrecipitationThe variations in precipitations in the river catchments were needed to transform the GuamoteRiver’s catchment to the rivers of interest. INAMHI has several precipitation stations aroundthe Columbe parish and the ones used are listed in Table 4.1. INAMHI has together withORSTROM developed a statistic model called CLIMAN that homogenizes and criticizesprecipitation data and defines homogenous regions of annual precipitation (Erazo, 1999).The homogenous zones that CLIMAN has defined could not be use due to that the dischargeareas included several zones and there were lack of information for some of these zones.Another way of finding the precipitation variation was needed. INAMHI has severalprecipitation stations around the Columbe parish and the ones used are listed in Table 4.1.
The CLIMAN report presents periods of good quality data, which are used in this section. TheJuan de Velasco station was not treated in the CLIMAN report and consequently all data wasused. The INAMHI data was represented as monthly values of precipitation.
0
1
2
3
4
5
6
7
1966 1967 1968 1969 1970 1971 1972 1973 1974 1975 1976 1977 1978
Year
Disc
harg
e [m
3/s]
00,5
11,5
22,5
33,5
44,5
Jan Feb Mar Apr May Jun Jul Aug Sep Okt Nov Dec
Month
Disc
harg
e [m
3/se
c]

11
Table 4.1 The INAMHI station
The years that all stations had good quality data were 1977-78, 1980 and 1987-88. Evenduring these years there were months lacking information. These years of good quality wereused to find any relation between elevation and precipitation. The result is shown in Figure4.4 and no relationship could be found.
Figure 4.4 Relation between yearly average precipitation and elevation.
Guamote Cebadas Juan deVelasco Cajabamba Guaslan Palmira
INAMHIcode M134 M395 M409 M394 M133 M398
Location 01°56’00’’S78°43’00’’W
01°54’28’’S78°38’27’’W
01°49’30’’S78°52’53’’W
01°41’05’’S78°45’47’’W
01°43’15’’S78°39’40’’W
02°03’26’’S78°44’20’’W
Altitude[m a.s.l.] 3020 2930 3109 3160 2850 3180
Averageyearlyprecipitation[mm]
450 442 1300 830 618 545
Period 1964-94 1964-96 1970-78,1980-93 1963-96 1964-98 1935-92
Period ofgood qualitydata
1964-67,1971-73,1976-94
1968-88,1993-96 No info
1963-70,1972, 1977-
81, 1984,1987-96
1964-98
1935-68,1971-73,1976-80,1987-92
0
100
200
300
400
500
600
700
800
2400 2500 2600 2700 2800 2900 3000 3100 3200 3300
Elevation [masl]
Yea
rly a
vera
ge P
reci
pita
tion
[mm
]

12
Since no relationship between precipitation and elevation was found the method of Thiessenpolygons was used. The polygons and stations were presented in the GIS data received fromMAG and can be viewed in Figure 4.5.
Figure 4.5. Map of the precipitation station and Thiessen polygons Source: MAG
A Thiessen network is constructed by locating the stations at a map and drawingperpendicular bisectors to the lines connecting the stations. In this way each point of the areais ascribed to the nearest precipitation station. The polygons formed around the stations arethe boundaries of the areas assumed to be controlled by the station in each polygon. Theweighted average of the precipitation, P, over an area, A, is determined according to Eq 4.1where A1…An is the areas of the polygons and P1…Pn the precipitation of the stationsrepresenting the polygons. (Linsley et al, 1949):

13
€
P =A1AP1 +
A2AP2 + ...+ An
APn (Eq. 4.1)
The monthly average precipitation for each station (P1…Pn) was calculated for the six stationswith the goal to find averages from years when all stations had data. This was somewhattroublesome because of lacking information and because some monthly averages consist onlyof one year. The results of the station monthly averages are presented in Appendix 2. Thecatchment areas of the rivers and elevation of abstraction are presented in Table 4.2 andFigure 4.6. The area proportion of the total catchment areas inside the different polygons arepresented in Table 4.3. The catchment areas were defined by using GIS (Other: MAG). ThePulucate Creek alternative was not investigated since there was no water flow and the salinitywas high (see section 4.2.4).
Table 4.2. Catchment areas estimated at the point of elevation
Table 4.3 The area proportions of the catchment areas inside the following Thiessenpolygons.
ThiessenPolygon
Area proportion of theGuamote Rivercatchment area
€
APolygonAGuamoteRiver
Area proportion of theColumbe Rivercatchment area
€
APolygonAColumbeRiver
Area proportion of theLlinllin River
catchment area
€
APolygonALlinllinRiver
Guamote 0.44 0.32 0.46Palmira 0.17 - -Juan de Velasco 0.19 0.38 0.54Guaslan 0.10 0.21 -Cajabamba 0.05 0.09 -Cebadas 0.06 0.01 -
The ColumbeRiver
The LlinllinRiver
The GuamoteRiver
Elevation [m a.s.l.] 3 146 4 300 2 840Catchment area, ARiver [km2] 305 58 604

14
Figure 4.6. Catchment areas from left: The Guamote River,The Columbe River and TheLlinllin River. For more map details see Figure 4.5
4.1.3 Field observations and river water qualityThe planned water abstraction locations at the Columbe River, the Llinllin River and thePulucate Creek were visited and some discharge measurements were done. The time for thefieldwork was during the rainier season. The discharge was measured by a simple stick testand water samples were taken. For some of the alternatives it was not possible to carry out themeasurement at the planned location of abstraction. In the Llinllin River the measurementscould not be done because of communication problems with and between the locals and in thePulucate alternative it was not possible because no water was found. According to the localsthere are only water in the Pulucate Creek after heavy rainfalls at the chosen point ofabstraction. The measurements in those cases were done at a lower elevation. The watersamples were analyzed by the University of Riobamba and tested for salinity (measured indeciSiemens per meter), pH, chlorides, carbonates and solid residue. The results are presentedin Table 4.4. For some guidelines for irrigation water quality by FAO see Appendix 5.
Table 4.4 River water quality and measured discharge
Columbe River Llinllin River Pulucate CreekDate April 21st
2003May 5th
2003 May 5th 2003 May 11th 2003
Planned elevation forabstraction [m a.s.l.] 3 146 3 400 3 320
Elevation for discharge test andsampling [m a.s.l.] 3 145 3 286 Approx 3 200
Discharge [m3/s] 3.9 4.6 3.1 0.0038Conductivity [dS/m] 0.28 0.18 0.12 6.40Chlorides [mg/l] 17.0 21.3 9.9 18.5Solid residue [ml/l] < 0.50 < 0.1 < 0.1 < 0.1Carbonates [mg/l] 648 160 200 560pH 7.4 6.6 6.4 6.8

15
4.1.4 Conclusion on surface waterAn important conclusion made was that there is no water in the Pulucate Creek at the point ofplanned abstraction most of the year. The water in the creek also had a very high conductivity.This was probably due to human activities. At this point the Pulucate Creek alternative wasrejected and no more investigations were done.
The 14 years discharge data from the Guamote River should be sufficient to make dischargecalculations of the rivers of interest. The problem of too few years used when calculating themonthly precipitation means of the stations representing the Thiessen polygons should notaffect the final calculations of the river discharge. For those calculations only the relationshipbetween the areas is important and not the absolute number.
4.2 Ground waterThe second alternative of water supply presented in section 2.4 involves pumping shallowground water from the pasturage between Balda and San Martin Bajo to the fields atGampala. In this part of the report the hydrogeology of the pasturage will be studied. Thegeology was studied and a slug test was carried out to give information about the hydrauliccharacteristics. Quality data of the ground water was obtained by water samples and datafrom INAMHI. Interviewing the locals and measurements of the water level in existing wellsgave information on the current ground water use and water level variations.
4.2.1 Hydraulic characteristics of the aquiferThe geology of the pasturage is a deposit terrace formation overlaying the two locally knownrocks “cangagua” or “sicalpa”. The cangagua is a vulcanic deposit rock and the sicalpaconsists of tuffs or agglomerates of volcanic origin. Both the cangagua and sicalpa areimpermeable except at fracture zones. The superficial deposit terrace consists ofconglomerized alluvial material such as sand, lime and clay. The deposits originate from theerosion of the mountains. This alluvial terrace could be expected to be a source of water ifzones of coarser material with high hydraulic conductivity would be found. (Map: Ministeriode Recursos Naturales y Energéticos, 1982 and Map: Ministerio de Recursos Naturales yEnergéticos, 1978)
Slugtest - Hvorslev methodThe purpose of a slug test is to estimate the hydraulic conductivity of a confined aquifer insitu. The slug test consists of creating a very brief pressure pulse at one point in the aquiferand observing the transient response at the same point. The pressure pulse can be generatedby instantaneously injecting or withdrawing a slug of known volumes into/from a well andthen measuring the rate at which the water level returns to its initial level. Possible slugs aresolid slugs, a bailer or a slug of water. The disadvantage of a slug test is that it only givesmeasurements for the zone close to the well. It is difficult to generalize the characteristics of alarger area only from measurements in one well. (Sanders, 1998)
Cherry and Freeze (1979) describe the Hvorslev method that is used to find the hydraulicconductivity in a confined aquifer. In the method a point piezometer was used (Figure 4.7).

16
Figure 4.7 Slug test. Source Freeze and Cherry 1979
The recovering flow, q, at the piezometer tip at any time is proportional to the hydraulicconductivity, K, the soil and to the unrecovered head difference, H – h:
€
q(t) = πr2 dhdt
= FK(H − h) (Eq 4.2)
where F is a factor that depend on the shape and dimension of the intake and r is the radius ofthe well. The basic time lag, T0, is defined as:
€
T0 =πr2
FK(Eq 4.3)
T0 can be defined as the time that would be required for the complete equalization of the headdifference if the original rate of inflow were maintained. Using the initial conditions of h = H0at t = 0 the solution of the differential equation formed by substituting Eq 4.3 in Eq. 4.2 is:
€
H − hH − H0
= e−t T0 (Eq 4.4)
If the recovery is normalized to H – H0 and plotted on a logarithmic scale, a straight-line plotresults. When t = T0 (H-h)/(H-H0) is 0.37 and ln((H-h)/(H-H0)) is -1. This is used to find T0graphically in a plot of head difference and time. The hydraulic conductivity can then bedetermined from Eq 4.2. The shape factor has been evaluated by Hvorslev for a piezometerintake of length L and radius R and L/R > 8. The final equation for the conductivity is:
€
K =r2 ln(L R)2LT0
(Eq 4.5)
Results of the slug testThe slug test was carried out at the pasturage in an already existing well (location in Figure4.9b). The well was mainly used for watering the animals and as water supply for laundry.The chosen slug for this study was a slug of water that was poured into the well. Theadvantage with this method is that it is costless but may be a source of error because the slugwas not added instantaneously. In the field test in Balda the slug consisted of a large bucket of

17
water that was poured into a hand dug well with a rectangular, constant cross-section. TheHvorslev method assumes a well with a cylindrical shape. To deal with the difference incross-section shape a hypothetic cylindrical shaped well was defined with that has the samecontact area between water and wall as the parallelpiedic shaped well that was used in thefield measurements. The contact area at the bottom of the well has been assumed to be smallrelatively the rest of the contact area and therefore not considered.
Figure 9.8 A parallelpiedical shaped well and cylindrical shaped well.
€
Acylinder = 2 r πD (Eq 9.6)
€
Aparallelpied = 4bD (Eq 9.7)
where r is the radius of the circular cross-sectional, b the length of the side of the squarecross-section and D the water depth (Figure 4.8). The found relation between the radius andthe side length were r = 2b/π. Further the Hvorslev method is based on test with a pointpiezometer with an intake length of L and radius R. In the Balda case the well had nopiezometer and the radius was constant. The radius was therefore assumed to be equal to r inEq 4.5. This meant that water could seep into the well all along surface where the water wasin contact with wall of the well. The intake length, L, also varied during the test because thewater level changed. This was taken into consideration by calculating the conductivity, K, forboth maximum and minimum L. By adding water to the well the water would also be seepinginto the wall of the well above the ground water table level. But the proportion of water abovethe water table level compared to the total depth was relatively small. Under the assumptionsand simplifications done the following results were calculated (results of measurements andplot can be found in Appendix 3):
T0 = 7 860 sK(L = 4 m) = 7,28 · 10-6 m/sK(L = 4.2 m) = 7.09 · 10-6 m/s
From the slug test calculations the hydraulic conductivity was 7·10-6 m/s. This can becompared with the range of conductivities for sediments/rocks in Table 4.5.

18
Tabell 4.5 Hydraulic conductivity Source: Sanders 1998.
4.2.2 Current use and variation of ground waterAt the time of the fieldwork there were some electric pumps that withdrew ground water fromthe pasturage. Most of the water is used for domestic purposes in the villages around thepasturage. Not all the public wells were investigated due to communication problems betweenthe villages. Most likely is that the other villages around the pasturage also pump groundwater for domestic use. If the ground water alternative becomes realistic this has to be betterinvestigated. Approximately yearly withdrawal for the public wells investigated wereestimated by the power used for pumping to 260 000 m3 in Balda (well PW 1) and 70 000 m3
in La Providencia (well PW 2). The locations of the wells are presented in Figure 4.9b.
To receive information about the variation of the ground water at the pasturage interviews andmeasurement of the water level in some existing wells were done. The locations of theinvestigated wells are shown in Figure 4.9b as Well 4-7 and the results of the measurementsin Appendix 4. The wells are all hand dug, unlined and at the date of observation used forwatering animals. According to the owners cangagua was found while digging some of thewells. Few of the wells has yellowish water. The color is probably due to iron contents in thesoil. The observations of the five wells were carried out in April to May. This period receivesthe greatest precipitations during the year with an average about 50 mm/month. During thetime of observation the water level in the wells varied a up to 60 cm. According to the localsthe ground water level can vary up to about one meter during a year.
4.2.3 Ground water qualityINAMHI provided data on water quality tests done in 1977 in wells close to Balda. All wellsare public and used for domestic purposes and are presented in Figure 4.9a as Well 1-3. Twoof the tested wells are located three kilometer west of Guamote and one three kilometers northof the village Columbe. The results are presented in Table 4.6.
Sediment/Rock Hydraulic Conductivity [m/s]Clay 10-11 to 10-8
Silt 10-9 to 10-5
Sand 10-7 to 10-3
Sandstone Tightly cemented Loosely cemented
10-10 to 10-7
10-8 to 10-5
Basalt Unfractured Fractured
10-11 to 10-8
10-6 to 101
Fractured igneous and metamorphic rocks 10-10 to 10-6

19
Figure 4.9a Water quality wells, Figure 4.9b Public wells PW 1-2Well 1-3 and La Victoria. and investigated wells 4-8.
Two samples of the ground water from the pasturage in Balda were taken to find the quality.The samples were taken in the water hole called La Victoria at two occasions. The location isshown in Figure 4.9a and results in Table 4.6.
Table 4.6 Ground water quality
4.2.4 Conclusions on ground waterThere are physically good conditions for finding ground water at the pasturage if a sedimentlayer of sand or gravel is found. To obtain more information about the physical conditionsfurther drilling and sampling has to be done. Because the slug test was simplified and the
Well No 1 Well No 2 Well No 3 La VictoriaDate 1977 1977 1977 April 21st
2003May 7th
2003Conductivity [dS/m] 1.2 1.2 0.9 0.19 1.10Chlorides (Cl) [mg/l] - - - 46.9 41.2Solid residue [ml/l] - - - 1.0 < 0.1Carbonates (CO3
2-) [mg/l] - - - 306.2 608.0pH 5.0 5.0 5.0 5.9 6.7

20
aquifer probably not is confined the result should be considered as indicative and not as adefinite number of the hydraulic conductivity. More detailed well tests with more than onewell involved can tell more about the characteristics than the single slug test. The results ofground water quality show that the pH is less than the normal for irrigation according to FAOexcept for one occasion at La Victoria. The large variation in the results is somewhat strangewhen there is not much time difference between the two samples. This could maybe be theresult of human activity around and in the water hole. If the ground water alternative becomesreality, further samples have to be taken.

21
5 THE WATER SUPPLY ALTERNATIVES
In this chapter the alternatives of water supply and distribution will be investigated moreclosely based on the conclusions made in chapter 4. The possible amount of water abstractionand engineering design will be presented for the alternatives that have not been rejected. Thepossible water abstraction will be compared with the water demand to estimate how manyhectares of irrigation the alternative can support. The alternative of the Pulucate Creek wasrejected due to lack of water and poor water quality as discussed in section 4.1.4. Threealternatives are left; the Columbe River, the Llinllin River and ground water at the pasturage.All alternatives transport the water to the fields at Gampala.
5.1 Water rightsThe National Council of Hydrologic Resources (CNRH) is the agency responsible forpermitting development of water supply system in Ecuador. The CNRH regulates andcoordinates requests for the development of project of domestic, agricultural and industrialwater supply. The agency is relatively new and took over after the National Institute ofHydraulic Resources (INERHI) that was previously responsible for the development of waterprojects. According to the Water Law, article 84, an application to require water-use rightshas to consist of the following (INERHI, 1985):
• Name of the river or other source where the water will be taken, parish, canton andprovince.
• The necessary discharge of abstraction and where the abstraction would be located• The names and addresses of known users• Objective for which water is going to be used• Structures and installations required for the water usage• Time frame to implement the works• Studies and technical plans to justify and explain the request of the water
In Riobamba the Regional Corporation of Development (CODERECH) deals with waterrights. CODERECH handles the hydrological resources, irrigation systems and drainage andflood control. The corporation applies the politics and norms that CNRH formulates.According to CODERECH the process of receiving water-use rights takes about three monthsand cost about 80 USD except lawyer costs (N. Rodriguez, com.pers.). The process consistsof an application, a publication and a technical study. According to a lawyer firm inRiobamba (E. Rojas, com.pers.) the lawyer cost is about 300 USD.
5.2 River waterTo find the most suitable water supply and maximum area to irrigate a simple water balancemodel was constructed. The possible discharge to abstract was calculated from discharge dataof the Guamote River. The water supply was balanced with the monthly water demandpresented in section 3.2.
5.2.1 Water Balance ModelThe water balance model was constructed in Microsoft’s Excel. Monthly discharge anddemand data from the years 1965-67 and 1971-78 were used to study the monthly waterbalance. During these years there are both data of river discharge and meteorology. Monthlyaverages were used to eliminate daily fluctuations in storage. The water supply was balancedagainst the demand (see Appendix 1) including the losses in the irrigation system (schematic

22
construction in Figure 5.1). The losses from the irrigation system depend on the systemsefficiency, in this case for furrows. A certain percent of the river water was left to protect theenvirnoment and leave water to other water abstraction systems downstream.
Figure 5.1 The water balance model.
The equation for the balance that includes the constants and variables presented in Table 5.1was:
€
Waterbalance = QRiver (1−θ)−QDemandAIrrigatedηIrrigation
(Eq 5.1)
Table 5.1 Variables and constants in the water balance model.
By changing the irrigated area the model presents the water deficit in percentage deficit out ofthe months when irrigation was needed. The water deficit was defined as when the waterdemand, including the losses, exceeds the water supply minus the discharge left in the river(the water balance less than zero).
The available discharge in the rivers, QRiver, was calculated with the Guamote River as areference river, Eq 5.2. As both the Columbe River and the Llinllin River are parts of theGuamote River system the discharges of the rivers were calculated by a transposition of theGuamote River’s discharge data. The monthly average discharge data of the Guamote River,(QGuamote River) was multiplied by the portion that each river’s catchment area (ARiver) makes ofthe Guamote River’s catchment area (AGuamote River) and the portion that the averageprecipitation (PRiver) of the catchment area of the Columbe River makes of precipitation(PGuamote River) of Guamote River.
€
QRiver = QGuamoteRiverARiver
AGuamoteRiverPRiver
PGuamoteRiver(Eq 5.2)
The calculations assume that the runoff coefficient, Q/(A·P), is constant over the cachment ofthe Guamote River. This is probably not the reality but due to lack of further information theassumption was made. The precipitation in the catchments was calculated according tosection 4.1.2.
5.2.2 The Columbe RiverThe Columbe River is a part of the Guamote River’s catchment (Figure 2.3). The ColumbeRiver belongs to the same water system as the Llinllin River. The planned water abstraction is
Constants VariablesArea irrigated AIrrigated River discharge QRiverCatchment area ADischarege Water demand per hectare QDemandFraction of discharge left in the river θ Precipitation PStation
Efficiency of irrigation system ηirrigation
Discharge left in river
QDemand + losses in irrigation systemQRiver Balance

23
downstream the junction with the Gaushi River downstream the village Columbe (Figure 3.2).At the elevation of 3 146 m a.s.l. the river has a catchment area of 305 km2. The ColumbeRiver alternative would consist of a water abstraction and pumping directly up to the fields atGampala. The design would involve pumping about 3 000 m horizontal and 134 m vertical.
Figure 5.2 The location of planned abstraction, the Columbe River and a schematic design ofthe distribution. Photo: S. Halmstad, 2003.
Water balanceThe results from the water balance model are presented in Table 5.2. The catchment areas thatwere used are the ones presented in Table 4.2 and 4.3. The percent discharge left in the riverwas chosen to be 50%. At the time of the fieldwork there was a great uncertainty how muchwater was used downstream. This must be further examined to secure the water supply ofother water projects. The efficiency was set to 60% as discussed in section 3.3.
Table 5.2 Results of runs of the water balance model, the Columbe River alternative.
If the acceptable percent time of water deficit is chosen to be 6% about 1 300 ha could beirrigated according to the water balance model. A 6% water deficit can be accepted whenannual crops are used. From an economically point of view perennial crops are morevulnerable to water deficit.
Run No 1 Run No 2 Run No 3Irrigated area, AIrrigated [ha] 1 200 1 300 1 400Percent of discharge left in the river, θ [%] 50 50 50Efficiency of irrigation system ηirrigation [%] 60 60 60Water deficit potatoes [%] 3.2 4.8 4.8Water deficit alphalpha [%] 4.1 4.1 4.9Water deficit carrots [%] 4.9 4.9 6.9

24
EngineeringTo check the possibility to construct an irrigation system supplying water for 1 300 ha arough estimate was done to decide the need of power and suitable pump. At this stage onlythe hydraulic power, defined as the power needed to lift the water, was calculated. Thehydraulic power (Phyd) only includes lifting water with a certain discharge (Q) the verticalheight (H) of (Eq 5.3). This estimation ignores horizontal transportation, losses and pumpefficiencies and thus gives a lower limit for the total power needed.
€
Phyd = ρgHQ (Eq 5.3)
where g is the acceleration of gravity and ρ the density of water. If 1 300 ha was to beirrigated, if the pump would run 24 hours per day and if the elevation difference is 134 m theaverage hydraulic power needed would be:
• Potatoes: 413 kW or 554 hp• Alphalpha: 514 kW or 689 hp• Carrots: 559 kW or 750 hp
One of the most powerful pumps at the Ecuadorian market1 has 50 hp and an efficiency of48%. A pump of this kind costs about 4 000 USD. With this information in mind it becomessomewhat unrealistic to irrigate 1 300 ha that needs at least 25 pumps of the one described. Ifthe irrigated area is decreased to 50 ha, one pump would be sufficient to cover the hydraulicpower with the pump efficiency included. But as few hectare as 50 ha is most likely noteconomically defendable to irrigate with a pump that needs 50 hp and involves largeelectricity costs. The electricity costs2 for pumping for irrigation of 50 ha would exceed 35000 to 75 000 USD (depending on what crop is considered).
Conclusions on the Columbe RiverPumping irrigation water is most likely not economically feasible in the Balda case. If onlyvegetables such as carrots and potatoes and pasturage plants are to be cultivated there will beproblems covering the costs of the irrigation system. A pump system also requires electricitysupply that in Ecuador is relatively costly and not always reliable. Power shortage duringlonger periods could be devastating if it happens during the driest part of the year.
5.2.3 The Llinllin RiverThe Llinllin River is located in the western part of the Columbe parish and is a part of theGuamote River’s catchment area (Figure 2.3). The Llinllin River alternative would consist ofa water intake at 3 400 m a.s.l., a concrete lined open channel, divided by a siphon into twoparts (Figure 5.3). A water intake at 3400 m a.s.l. would give a catchment area of 58 km2.
1 According to TUBYMAC, a pipe merchandise workshop at the corner of Veloz Street andBrazil Street in Riobamba, Ecuador.2 Electricity cost, 4.62 centavos per kWh, according to the newspaper El Comercio the 21st ofMay 2003
25
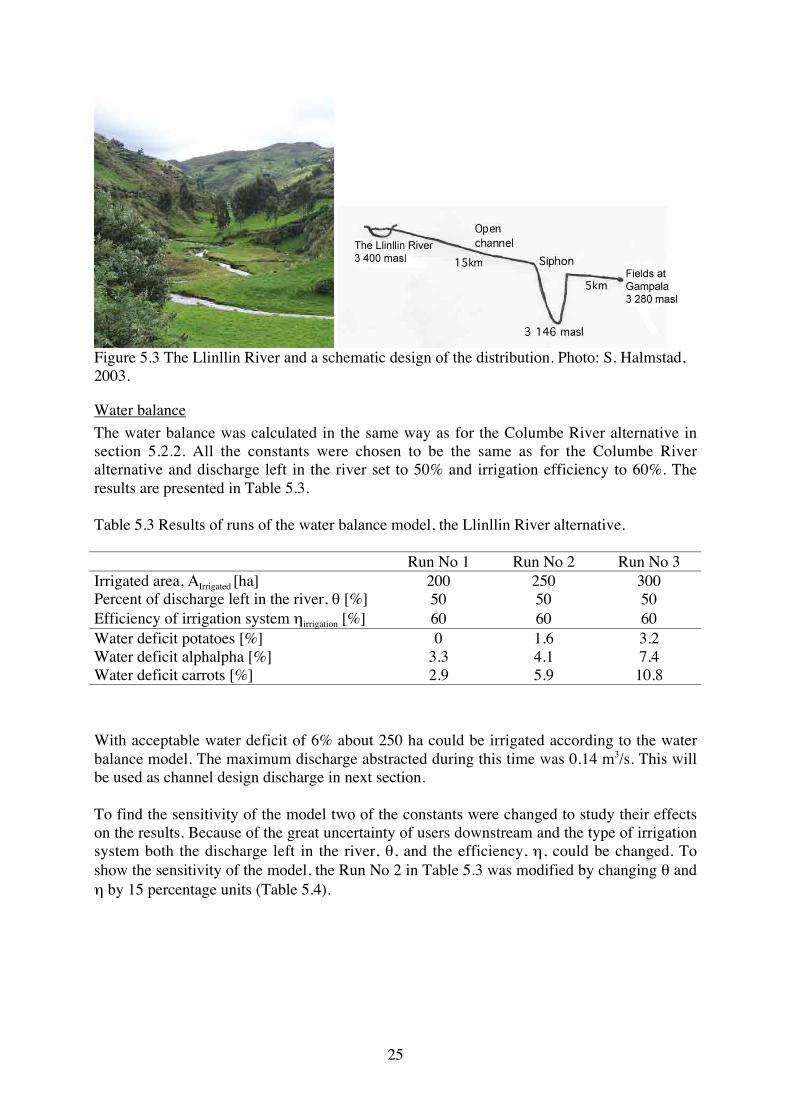
Figure 5.3 The Llinllin River and a schematic design of the distribution. Photo: S. Halmstad,2003.
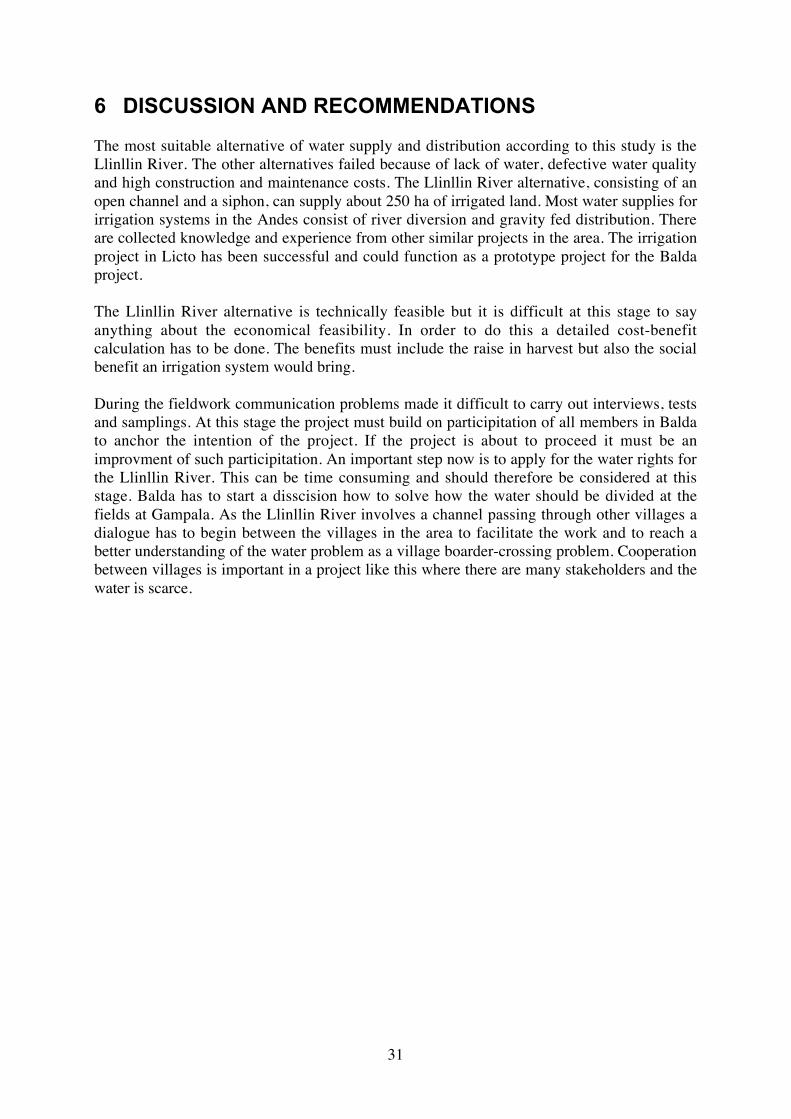
Water balanceThe water balance was calculated in the same way as for the Columbe River alternative insection 5.2.2. All the constants were chosen to be the same as for the Columbe Riveralternative and discharge left in the river set to 50% and irrigation efficiency to 60%. Theresults are presented in Table 5.3.
Table 5.3 Results of runs of the water balance model, the Llinllin River alternative.
With acceptable water deficit of 6% about 250 ha could be irrigated according to the waterbalance model. The maximum discharge abstracted during this time was 0.14 m3/s. This willbe used as channel design discharge in next section.
To find the sensitivity of the model two of the constants were changed to study their effectson the results. Because of the great uncertainty of users downstream and the type of irrigationsystem both the discharge left in the river, θ, and the efficiency, η, could be changed. Toshow the sensitivity of the model, the Run No 2 in Table 5.3 was modified by changing θ andη by 15 percentage units (Table 5.4).
Run No 1 Run No 2 Run No 3Irrigated area, AIrrigated [ha] 200 250 300Percent of discharge left in the river, θ [%] 50 50 50Efficiency of irrigation system ηirrigation [%] 60 60 60Water deficit potatoes [%] 0 1.6 3.2Water deficit alphalpha [%] 3.3 4.1 7.4Water deficit carrots [%] 2.9 5.9 10.8

26
Table 5.4 Sensitivity analysis of Run No 2 in Table 5.3.
The results of the sensitivity analysis show that the estimated times for water deficit for bothalphalpha and carrots are more affected by changes in the parameters than the potatoes. Thefurrow irrigation has one of the lowest efficiencies of the irrigation systems used today. If thesystem is changed the efficiency will most likely change to a higher value than 60%. Thesprinkler efficiency is, for example, around 75%.
EngineeringThe open channel system of the Llinllin River alternative consists of 15 km open channelfrom the water intake at 3400 m a.s.l., a siphon and 5 more km open channel to the last user(Figure 3.2 and 5.3). The chosen material for the lining of the channel was concrete and theslope 4 ‰. Lining a channel is costly compared to earthen channels but the advantage is thatthe smoother surface and consequently a higher permissible water velocity will allow asmaller cross-section for a certain discharge. The loss through seepage is also greatly reduced.The factors that have to be considered in the design of the channel are: the kind of materiallining the channel bottom, which determines the roughness, the freeboard and the mostefficient section.
Selection of channel cross-section and freeboardFor a certain given flow and slope, channels with the least contact between water and bottomsurface (wetted perimeter) will minimize the resistance and maximize the discharge. Theoptimum channel, from a hydraulic viewpoint, is the semicircular cross-section. It has theleast wetted perimeter among all sections with the same area and is the most hydraulicefficient section. But the semicircular section is difficult and expensive to construct andmaintain. A close alternative is the trapezoidal cross-section that is more widely used. (Chow,1959)
The best hydraulic dimension of the channel was determined by using Manning’s equation foruniform flow in open channels (Chow, 1959):
θ [%]
35 50 65η [%] η [%] η [%]
45 60 75 45 60 75 45 60 75
Water deficit potatoes [%] 1.6 0 0 3.2 1.6 0 11.3 3.2 3.2Water deficit alphalpha [%] 4.1 3.3 0.8 10.7 4.1 3.3 22.1 12.3 5.7Water deficit carrots [%] 6.9 2.9 2.0 15.7 5.9 3.0 24.5 16.7 8.8

27
€
Q =ARh
2 / 3S01/ 2
n (Eq 5.4)
€
Rh =AP
(Eq 5.5)
€
v=QA
(Eq 5.6)
Q - dischargev - velocityA - area of the cross-section of the waterwayRh - hydraulic radiusP - wetted perimeterS0 - longitudinal surface slopen - Manning’s coefficient of resistance.
Figure 5.4 The rectangular (left) and trapezoidal (right) cross-section of an open channel.Source: Freeze, 1979.
The two alternatives of cross-sections studied in this report will be a trapezoidal section and arectangular section (Figure 5.4). The rectangular is considered because it is simple toconstruct. To optimize the hydraulic efficiency the trapezoidal cross-section should have aside and a bottom of equal length and a side slope of 60%. The rectangular section shouldhave a width that is the double its height (Table 5.5). The water depth in the channel is shownin Figure 5.4 as y, which is sometimes also called the normal depth.
Tabel 5.5 Optimal hydraulic dimensions
For the study following values were given:Q = 0.14 m3/sn = 0.015 for concreteS0 = 0.004
The freeboard (t) is the vertical distance from top of the channel construction to the watersurface. This is to secure the channel for unexpected high peaks in discharge. The U.S.Bureau recommends heights of about 5-30% of the flow depth, y (Chow, 1959). In Ecuador apractical criterion is one third of the normal depth in the channel (Olazával et al 1999). Thechosen height of the freeboard was set to be one third of the depth:
€
t =y3
(Eq 5.7)
Cross-Section Bottom b Sidelength L
Sideslope θ
Trapezoidal
€
23y
€
23y 60 %
Rectangular
€
2y - -
y y

28
With the above constraints the following dimensions of the channel were chosen:
Table 5.6 Channel dimensions, discharge and velocity.
SiphonA siphon is needed to transport the water through a valley. At the bottom of the valley the PanAmerican Highway must also be passed. The siphon has a length of 1 300 meters andtransports water through the 175 meters deep valley, see Appendix 6 for dimensions.
Hazen Williams equation was used to estimate the friction loss in the siphon pipe. It is anempirical exponential formula based on turbulent flow and fixed exponents. The only variableis the Hazen Williams coefficient that reflects the roughness of the interior surface of a pipe.The Hazen Williams coefficient of new PVC is 140 m0.37/s, old PVC 130 m0.37/s, new cast-iron130 m0.37/s and old cast-iron 100 m0.37/s.
Hazen Williams equation (Addison, 1945):
€
Q = 0.278 C D2.36 S0.54 (Eq 5.8)
€
S =HL
(Eq 5.9)
Q – dischargeC – Hazen Williams coefficient of frictionD – diameter of pipeS – slope of the energy gradientL – length of pipeH – friction loss per unit length of pipe
Four alternatives with different combinations of D and C were studied to decide the head lossand pipe diameter. The results are presented in Table 5.7.
Table 5.7 Hazen Williams calculations of head loss in the siphon.
If a head loss less than 30 m can be accepted a pipe diameter of 0.25 m will be chosen. It isimportant that the siphon will function even when the pipes age. If the pipes would erode sothat the coefficient of friction falls below 100 the discharge would decrease. To take this into
Q [m3/s] y [m] b [m] t [m] So v [m/s]Trapezoid 0.14 0.27 0.31 0.09 0.004 1.1Rectangular 0.14 0.26 0.51 0.09 0.004 1.0
Alternative 1 Alternative 2 Alternative 3 Alternative 4D [m] 0.315 0.315 0.25 0.25Q [m3/s] 0.14 0.14 0.14 0.14C [m0.37/s] 130 100 130 100L [m] 1 330 1 330 1 330 1 330H [m] 7.1 11.5 19.4 31.6

29
consideration the discharge for lower values of C was calculated by using Eq. 5.8 and Eq 5.9with the results in Table 5.8.
Table 5.8 Discharge variation with pipe ageing (decreasing C).
The maximum pressure of the pipe is of interest when deciding pipe material. To estimate themaximum pressure at the bottom of the pipe the hydraulic pressure, phyd, due to the hydraulicheight, h, was calculated, Eq 5.10. The hydraulic height gives the maximum pressure thatcould possible occur. In case of a temporary shut down, the pipes have to manage a pressureof the total hydraulic height when the siphon is filled with water. In reality, during usage, thefriction and velocity difference lowers the pressure. Relatively the hydraulic height thenegative influence of the friction and velocity on the pressure is small.
€
phyd =ρ g h (Eq 5.10)
The maximum hydraulic pressure in the pipe will be 1.7 MPa at the bottom of the siphon.Because of the heavy pressure for the lower part of the siphon an iron pipe is most suitable forthis part. To minimize the costs, the pipe can then gradually be changed to PVC that can holdless pressure. The change in material affects the calculation of the head loss in the siphonbecause of larger friction in the iron pipe. The maximum head loss of 31.6 m, Alternative 4 inTable 5.7, is calculated for a siphon completely constructed of iron. The real head loss if PVCpipes also are used will be less than this maximum value.
Rough cost calculationsA rough cost calculation was done on the Llinllin River alternative. The cost calculations ofthe intake, channel, culverts and brim outlets were based on price information from a previousstudy in the province of Charchi, Ecuador (Bergman and Gustafson, 1996). Brim outlets andculverts were included in the cost calculation. Brim outlets are needed to prevent over flowand are constructed every 500 meters and culverts to pass roads and creak ravines. The abovecosts include labor, equipment and transports and are based on 1997 year’s price level. Thecost calculation for the siphon was done using information from a pipe merchandiseworkshop3 in Riobamba in May 2003. The cost of the siphon does not include labor ortransports.
3 TUBYMAC, corner of the Veloz Street and Brazil Street in Riobamba, Ecuador
D [m] H [m] L [m] C [m0.37/s] Q [m3/s]0.25 30 3 300 100 0.14
" " " 90 0.12" " " 80 0.11" " " 70 0.10

30
Table 5.9 Costs, the Llinllin River alternative.
The cost calculation is exclusive studies and unexpected expenses. Neither the costs of thesecondary system (furrows and the small private reservoirs) nor the costs for maintenance ofthe system are considered in this cost estimate. To improve and complement the existing roadsystem a fixed cost should be added. This is not done here because of lack of informationabout existing roads.
Conclusion on the Llinllin RiverThe Llinllin River alternative involving an open channel and a siphon is technically feasible.The alternative could supply 250 hectare of irrigation, under the constraints done, andincludes an 20 km open channel from an elevation of 3 400 m a.s.l. to the fields of Gampalaat 3 280 m a.s.l.. The choice of channel cross-section will depend on a more detailed costcalculation, either trapezoidal or rectangular. The diameter of the siphon will be 0.25 m thatinvolves a maximum head loss of 30 m. In order to say anything about the economicfeasibility of the alternative a more detailed cost calculations has to be done. The total costhas to be compared with the total benefits that an irrigation project would give.
5.3 Ground waterThe ground water alternative would involve transporting water from the pasturage atapproximately 3160 m a.s.l. to the fields at Gampala at maximum elevation at about 3 280m a.s.l. thus pumping 120 m (Figure 3.2). As discussed in the conclusions on the ColumbeRiver alternative it is hard to find an economically defendable pump system to support theirrigation at Gampala because of the large elevation difference. The pumping alternativesinvolve expensive equipment that requires electricity that adds to the running costs. It is noteconomically sustainable to pump water for irrigation if there are large height differencebetween the water source and the fields. If the soil at the pasturage had been more suitable forcultivation (section 3.1) irrigation of the pasturage could have been an alternative. Thehydraulic power needed would then be drastically decreased.
At this point the alternative of ground water at the pasturage was rejected.
Amount Unit Price per unit[USD per unit] Cost [USD]
Intake 10 000Channel 20 000 meter 40 800 000Culverts 20 pieces 500 10 000Brim outlets 40 pieces 200 8 000
Iron 2 MPa 200 meter 60PVC 1.6 MPa 515 meter 51PVC 1.25 MPa 265 meter 44PVC 0.8 MPa 80 meter 26
Siphon
PVC 0.63 MPa 240 meter 23
57 525
Total cost 885 525
31
6 DISCUSSION AND RECOMMENDATIONS
The most suitable alternative of water supply and distribution according to this study is theLlinllin River. The other alternatives failed because of lack of water, defective water qualityand high construction and maintenance costs. The Llinllin River alternative, consisting of anopen channel and a siphon, can supply about 250 ha of irrigated land. Most water supplies forirrigation systems in the Andes consist of river diversion and gravity fed distribution. Thereare collected knowledge and experience from other similar projects in the area. The irrigationproject in Licto has been successful and could function as a prototype project for the Baldaproject.
The Llinllin River alternative is technically feasible but it is difficult at this stage to sayanything about the economical feasibility. In order to do this a detailed cost-benefitcalculation has to be done. The benefits must include the raise in harvest but also the socialbenefit an irrigation system would bring.
During the fieldwork communication problems made it difficult to carry out interviews, testsand samplings. At this stage the project must build on participitation of all members in Baldato anchor the intention of the project. If the project is about to proceed it must be animprovment of such participitation. An important step now is to apply for the water rights forthe Llinllin River. This can be time consuming and should therefore be considered at thisstage. Balda has to start a disscision how to solve how the water should be divided at thefields at Gampala. As the Llinllin River involves a channel passing through other villages adialogue has to begin between the villages in the area to facilitate the work and to reach abetter understanding of the water problem as a village boarder-crossing problem. Cooperationbetween villages is important in a project like this where there are many stakeholders and thewater is scarce.

REFERENCES
Litterature
Addison H., 1945, A Treatise on Applied Hydraulics, Third edition, Chapman & Hall LTD.London.
Appolin F., Boelens R., Dávila G., Narváez E., Torres P.,1996. El Riego en la ComunidadAndina: una Construccion Social CICDA, CESA, SNV, CAMAREN, Quito Ecaudor.
Bergman M., Gustafson M., 1996 Förstudie för bevattningskanal, Charchi, Ecuador,Master’s thesis no 380, Devision of Hydraulic Engineering at the Department of Civil andEnvironmental Engineering, Royal Institute of Technology, Stockholm, Sweden
Boelens R., Dávila G. (ed.), 1998. Searching for Equity. Concepts of justice and equity inpeasant irrigation. Van Gorcum, Assen, The Netherlands
Chow, V. T., 1959, Open-Channel Hydraulics, McGraw-Hill Book Company, Inc. NewYork.
Comité Nacional sobre el Clima, 2001. Comunicación Nacional República del Ecuador.Convencion Marco de las Naciones Unidas. Cambio Climático. Ministerio del Ambiente,Quito, Ecuador. [www.unfccc.int/resource/docs/natc/ecunc1.pdf] 3d Jan 2003
Erazo A., Hoorelbeke R., 1999. Parámetros meteorológicos “Cuenca del Río Pastaza”.IFEA-I.R.D., INAMHI, Quito, Ecuador
FAO, 2000 , Guidelines for Water Management and Irrigation Development, Land and WaterDigital Media Series 12, FAO Irrigation Guidelines CD-ROM
Freeze, R. A., and Cherry, J. A. 1979, Groundwater, Prentice-Hall, Inc, Englewood Cliffs,NJ, USA
Halmstad, S., Lindell, L., 2004, Estudio de Prefactibilidad de un Proyecto de Riego en losAndes – el Caso de Balda Lupaxi Bajo, Chimborazo, Ecuador Minor Field Study Report,Commitee of Tropical Ecology, Uppsala University, Manuscript : January 2004, Uppsala,Sweden
INERHI, 1985 Ley de Creacion del INERHI, Ley de Aguas, Reglamento de Aguas Reformas ala Fecha (1985), INERHI, Quito
Linsley, R., Kohler, M., Paulhus, J., 1949. Applied Hydrology, McGraw-Hill Book Company,Inc, New York, USA
MAG, 1976, Estudio Hidro-Meteorologico e Hidrogeologico Preliminar de Las Cuencas delos Rios Pastaza Chimbo y Chanchan, Ministerio de Agricultura, Quito, Ecuador
Ministerio del Ambiente, 2000. Informe del Ecuador Sobre la Convención de Lucha Contrala Desertificación. Ministerio del Ambiente, Quito.[www.unccd.int/cop/reports/lac/national/2000/ecuador-spa.pdf] 1st of Feb 2003

Noordholland de Jong J., Boelens R., Heredia L., Gerbrandij G., Núñez P., 1999. Hacia unavision integral del riego andino, CAMAREN, Quito Ecuador
Olazával H, Nordholland de Jong J, A. J., 1999, Riego Andino, Infrastructura de Riego:Elementos Técnicos Y Sociales, CAMAREN Quito Ecuador
Sanders, L., 1998, A manual of Field Hydrogeology, Prentice-Hall, Inc, Upper Saddle River,NJ, USA
Sävborg E., Hagman U. (ed.), 2000. Länder i fickformat nr 709 Ecuador, Utrikespolitiskainstitutet, Stockholm, Sweden
US Army Corps of Engineers, 1998, Water assessment of Ecuador, US Army Corps ofEngineers Mobil District and Topographic Engineering Center.
Personal communication
Inés Chapi, Licto Ecuador, May 2003
Montolvo, Lucy. Responsable for cumminucation of the irrigation project and development inGuange Licto (Responsable de capacitacion y comunicacion proyecto de riego y desarrolloGuangue Licto), CESA Riobamba Ecuador, April 2003
Rodriguez, Nelson, 2003, CODERECH, Riobamba, Ecuador. April 2003
Rojas Inca, Edgar, 2003, Lawer, Riobamba, Ecuador. April 2003
Maps
IGM, 1971, Riobamba nr 3888 Scale 1:100 000
IGM, 1991, a, Pallatanga nr 3888-III Scale 1:50 000
IGM, 1991, b, Riobamba nr 3888-I Scale 1:50 000
IGM, 1991, c, Palmira nr 3887-I, Scale 1:50 000
IGM, 1992, Guamote nr 3888-II Scale 1:50 000
Ministerio de Recursos Naturales y Energéticos, 1982 Mapa Geológico Nacional de laRepública del Ecuador, Ministerio de Recursos Naturales y Energéticos, Ecuador. Scale1:1 000 000
Ministerio de Recursos Naturales y Energéticos, 1978 Mapa Geológico del Ecuador,Riobamba, hoja 70, Ministerio de Recursos Naturales y Energéticos, Ecuador. Scale1:100 000

Other
INAMHI, Division of Hydrology: Daily discharge data from Río Guamote AJ Cebadas,H786, Río Cebadas AJ Guamote, H790, Río Guargualla AJ Cebadas, H789 during 1965-1978. Ministry of Energy and Mines, Quito, Ecuador.
INAMHI, Division of Meteorology. Montly precipitation data from Guamote, M134, Palmira,M398, Guaslan, M133, Cebadas, M395, Juan de Velasco, M409, Licto, M407, Cajabamba,M394 during 1977-1988. Ministry of Energy and Mines, Quito, Ecuador.
MAG, unknown year. GIS information. MAG, Ecuador

APPENDIX 1
Water demand
Potatoes

Carrots

Alphalpha
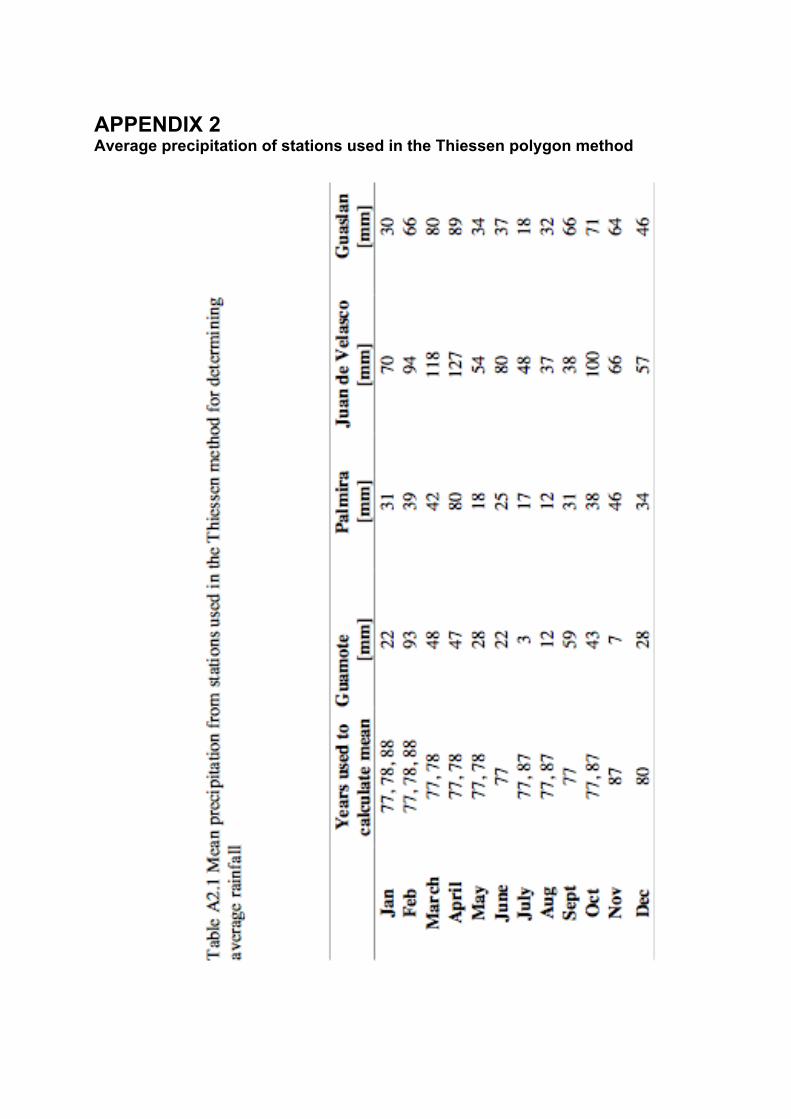
APPENDIX 2Average precipitation of stations used in the Thiessen polygon method

APPENDIX 3
Field measurements and results of slug test
Well location: Pasturage in Balda, GPS-location: 17M 0754372 9793708 3170±8 m a.s.l.Date: 030528Well data: area; 72x72 cmTotal depth of well; 450 cmDepth of water before test, H; 400 cmType of slug: Water poured into well (119.5 liters)Depth of water instantaneously after slug added, H0; 420.5 cm
Table A5.1 Water level response after slug injection.
Time [min]
€
H − h [cm]
€
H − hH − H0
Time [min]
€
H − h [cm]
€
H − hH − H0
0 -20.5 1.00 61 -12 0.590.25 -20.5 1.00 65 -11.5 0.560.75 -20 0.98 71 -11 0.54
1 -20 0.98 76 -10.75 0.521.5 -19.5 0.95 81 -10.5 0.512 -19.5 0.95 86 -10 0.49
2.5 -19.5 0.95 91 -9.75 0.483 -19 0.93 96 -9.5 0.46
3.5 -19 0.93 101 -9 0.444 -18.75 0.91 106 -8.75 0.43
4.5 -18.5 0.90 111 -8.5 0.415 -18.5 0.90 116 -8.25 0.40
5.5 -18.5 0.90 121 -7.75 0.386.5 -18.25 0.89 126 -7.5 0.377.5 -18 0.88 131 -7.25 0.358.5 -17.5 0.85 136 -7.25 0.359.5 -17.5 0.85 141 -7 0.3410.5 -17.25 0.84 146 -6.75 0.3311.5 -17.25 0.84 151 -6.5 0.3212.5 -17 0.83 156 -6.5 0.3213.5 -16.75 0.82 161 -6.25 0.3014.5 -16.75 0.82 166 -6 0.2915.5 -16.5 0.80 171 -5.75 0.2816 -16.5 0.80 176 -5.5 0.2721 -16 0.78 181 -5.5 0.2726 -15.5 0.76 186 -5.25 0.2631 -14.75 0.72 191 -5.25 0.2636 -14.25 0.70 196 -5 0.2441 -13.75 0.67 201 -4.75 0.2346 -13.25 0.65 206 -4.5 0.2251 -13 0.6356 -12.5 0.61

Figure A3.1 The recovery of the water level plotted on logarithmic scale.
y = -0,007x - 0,0803
-2
-1
00 50 100 150 200 250
Time [min]
ln [(
H-h
)/(H
-H(0
))]

APPENDIX 4
Ground water variations at the pasturageThe water level observations on the pasturage were done during April and May 2003. All theobserved wells were hand dug and mainly used for watering animals. Some had yellowishwater probably due to iron contents in the soil. The wells were located with a GPS andcoordinates, elevation and owners are shown in Table A4.1 and the results in Table A4.2:
Tabell A4.1 Well information
Well No GPS coordinate GPS elevation Owner Well depth [m]
4 17M 07543539793934
3176 ± 8m a.s.l. No info 2.05
5 17M 07543509793930
3174 ± 10m a.s.l. No info 1.75
6 No info No info Transito Atupaña 3.75
7 17M 07545059793786
3180 ± 11m a.s.l.
DomingoChimbolema 3.30
8 17M 07544879793924
3178 ± 10m a.s.l.
SalvadorTenenaula 1.80

Tabell A4.2 Ground water level below ground surface, 2003Date No 4 [m] No 5 [m] No 6 [m] No 7 [m] No 8 [m]
14/4 1.65 1.35 1.30 - -
20/4 1.30 1.25 1.20 - -
25/4 1.16 1.12 1.15 0.30 -
4/5 1.10 1.15 1.03 0.45 1.30
6/5 1.08 1.15 1.00 0.40 -
8/5 1.02 1.20 1.08 0.40 1.45
14/5 1.10 1.20 1.25 0.50 1.45
27/5 1.50 1.35 1.20 0.70 1.55
Figure A4.1 Ground water variations at the pasturage during April and May 2003
0
0,2
0,4
0,6
0,8
1
1,2
1,4
1,6
1,8
03-04-14 03-04-19 03-04-24 03-04-29 03-05-04 03-05-09 03-05-14 03-05-19 03-05-24Date [year-month-day]
Gro
und
wat
er le
vel b
elow
gro
und
surfa
ce [m
]
Well no 4Well no 5Well no 6Well no 7Well no 8

APPENDIX 5
Irrigation water quality guidelines
Food and Agriculture Organization of the United Nations, FAO, has presented guidelines forevaluation of water quality for irrigation (some presented in Table A5.1). The guidelinesemphasize on long-term influence of water quality on crop production, soil conditions andfarm management. Water used for irrigation can vary greatly in quality depending uponquantity of dissolved salts, measured in deciSiemens per meter. The salts originate fromdissolution of weathering of the rock and soil but also from human activity. The salts arecarried to the soil with the irrigation water where they remain behind as the water evaporatesor is used by the plants. The salt reduce the water availability to the crop to such extent thatyield is affected. Another problem is that certain ions such as sodium, chloride, or boron fromsoil or water can accumulate in sensible crops. The damage this causes also affects the cropyield. The deterioration of equipment due to water-induced corrosion or encrustation is also aproblem that farmers practicing irrigation faces. Sediment content and pH are parameters thatcan cause these problems. (Ayers and Westcot, 1985)
Table A5.1 FAO guidelines for irrigation water quality. Source: Ayers and Westcot, 1985Degree of Restriction on UsePotential
IrrigationProblem
UnitNone Slight to
moderate Severe
Salinity dS/m < 0.7 0.7 – 3.0 > 3.0
Chloride (Cl)(surface
irrigation)mg/l < 141 141 - 354 > 354
pH Normal Range 6.5 – 8.4
Reference:Ayers, R. S. and Westcot, D. W., 1985, Water Quality for Agriculture, FAO Irrigation andDrainage Paper 29 Rev. 1, Rome, Italy

APPENDIX 6
Schematic sketch of the siphon in the Llinllin River alternative