Water Supply Demand Strategy – Summary · Water Supply Demand Strategy – Summary 2012 iii The...
28
2012 North East Water Water Supply Demand Strategy - Summary Balancing supply and demand for the next 50 years FINAL
Transcript of Water Supply Demand Strategy – Summary · Water Supply Demand Strategy – Summary 2012 iii The...

2012
North East Water
Water Supply Demand Strategy - Summary
Balancing supply and demand for the next 50 years
FINAL

Water Supply Demand Strategy – Summary 2012
Table of Contents
Glossary ................................................................................................................................................................... i
Executive Summary ................................................................................................................................................ ii
1 Introduction ...................................................................................................................................................... 1
1.1 Scope ........................................................................................................................................................ 1
1.2 Objectives of the WSDS ............................................................................................................................ 1
1.3 Overview of North East Water ................................................................................................................. 2
2 Levels of Service ................................................................................................................................................ 3
2.1 What is meant by Levels of Service? ........................................................................................................ 3
2.2 Minimum Level of Service ........................................................................................................................ 4
2.3 Agreed Level of Service ............................................................................................................................ 4
3 Context .............................................................................................................................................................. 6
3.1 Water supply planning.............................................................................................................................. 6
3.2 Strategy documentation ........................................................................................................................... 7
3.3 Stakeholder engagement ......................................................................................................................... 8
3.4 Achievements and outcomes from recent experience ............................................................................ 9
3.5 Challenges we face ................................................................................................................................. 11
3.6 Identifying potential need for action ...................................................................................................... 12
4 How will the Levels of Service be met? ........................................................................................................... 14
4.1 Possible options ...................................................................................................................................... 14
4.2 North East Water’s One Resource framework ........................................................................................ 14
4.3 Approaches available to meet the Levels of Service .............................................................................. 16
4.4 Implementing the Strategy ..................................................................................................................... 20
5 References ...................................................................................................................................................... 21
List of Figures Figure 1: North East Water’s area of operation ..................................................................................................... 2
Figure 2: North East Water’s decision making framework for action .................................................................... 6
Figure 3: Overview of WSDS documentation ......................................................................................................... 7
Figure 4: Yield and demand over the planning horizon (example only) ............................................................... 13
Figure 5: Reliability and demand over the planning horizon (example only) ....................................................... 13
Figure 6: North East Water’s One Resource framework ....................................................................................... 15

Water Supply Demand Strategy – Summary 2012
List of Tables
Table 1: Provision of Agreed Level of Service ......................................................................................................... 5
Table 2: Sources of Supply Uncertainty and Approach to Address Uncertainty .................................................. 11
Table 3: Classification of supply enhancement and demand reduction initiatives .............................................. 14
Table 4: Application/Priority of options to meet the Levels of Service ................................................................ 18
Table 5: Region-wide volumetric summary of supply, demand and opportunities to achieve a balance ............ 20
Appendices
Appendix 1: Project Team and Water Plan 3 Reference Group

Water Supply Demand Strategy – Summary 2012
i
Glossary
Term Description
$M Million dollars – 1,000,000 dollars.
Average Annual Demand The water demand for a system varies depending on the climatic conditions for any given year. The average annual demand is the amount of water used in a year under average conditions. The required demand can vary by as much as ±20%.
Bounce back The possibility that residential usage may demonstrate a “bounce back” in demand if wetter conditions persist and some users revert to their water use behaviour from prior to 2006/07.
Bulk Entitlement (BE) The right to water held by water and other authorities defined in the Water Act 1989. The BE defines the amount of water that an authority is entitled to from a river or storage, and may include the rate at which it may be taken and other conditions.
CIV Commercial, Industrial and Vacant land customers.
DSE Department of Sustainability and Environment.
ESC Essential Services Commission.
EWR Environmental Water Reserve – water set aside to meet environmental water requirements defined in the Water Act 1989.
ML Megalitre (1 million litres).
Non Revenue Water (NRW)
Non revenue water is defined as the difference between the amount of water diverted from the source and the amount of water delivered to our customers.
Potable Suitable for drinking.
Qualification of Rights The Minister for Water may grant a temporary qualification of rights to water in extreme circumstances to ensure critical water needs are met. For example, granting North East Water access to water on the Murray System when no allocation is available.
Reclaimed water Effluent from wastewater treatment plants that is fit for the substitution of potable water, where appropriate (e.g. irrigation of public open space areas).
Regulated supply A surface water source that has an on-stream storage of sufficient size to regulate the flow of water to downstream customers and even out variation in catchment runoff from year to year. The most notable example locally is the Murray River that has Lake Hume and Dartmouth Dam.
Return flow credits Reclaimed water discharged to stream that can be used to credit extraction downstream, or potentially traded to another raw water customer.
Unregulated supply A surface water source without an on-stream storage of sufficient size to regulate the flow of water to downstream customers. Supply in these systems is dependent on seasonal catchment runoff. Water availability is typically lowest in summer when demand is highest.
Unrestricted demand Average annual demand for water without any restrictions.
Water Plan North East Water’s five year plan (approved by the Essential Services Commission) containing its approved pricing for services and capital works program.
WSDS Water Supply Demand Strategy.

Water Supply Demand Strategy – Summary 2012
ii
Executive Summary
North East Water is a regional urban water corporation that provides water and wastewater services to a
population of approximately 115,000 across north east Victoria.
North East Water’s Water Supply Demand Strategy (WSDS) seeks to identify the best mix of measures to
maintain a balance between the demand for water in urban supply systems and available supply now and into
the future. The WSDS incorporates the principles of scenario-based planning, considering the actions needed
to meet increased demand for water arising from population and industry growth, together with the possible
effects of climate change and other environmental factors. This document is our five-yearly revision of the
strategy, as required under our Statement of Obligations. This strategy will inform supply augmentation and
capital investment requirements for consideration in North East Water’s next Water Plan.
In the context of this WSDS, level of service refers to the long-term security of supply of a water supply system.
Security of supply is measured by the frequency, severity and/or duration of water restrictions, as well as the
ability to maintain a minimum supply during drought. Security of supply is often used interchangeably with
the term reliability of supply, which has an equivalent meaning in this WSDS. There are two aspects to North
East Water’s level of service; an agreed level of service and minimum level of service.
North East Water’s levels of service have been developed in consultation with the community. North East
Water’s agreed level of service reflects community expectations about the environmentally, socially and
economically responsible use of water, and its minimum level of service reflects the appropriate use of water
in times of drought or water shortage. The agreed level of service is often limited by the nature of the supply
system and increasing level of service can impact on water prices.
North East Water’s agreed level of service provides a 90% likelihood that customers will not be asked to
reduce water consumption in any given year, based on forecast community needs for water over the 50 year
planning horizon.
North East Water’s minimum level of service meets the demand for unrestrictable in-house and
commercial/industrial use. This component of demand is what would be provided to customers under Stage 4
restrictions, as outlined on our website (www.newater.com.au).
North East Water has the capacity to maintain the minimum level of service to all of its customers
(approximately 6,500 ML/yr) under anticipated drought conditions, and is planning to provide the agreed level
of service to all of its customers subject to the integration of the proposed 520 ML storage into Bright water
supply system and augmenting Goorambat’s supply (subject to inclusion in Water Plan 3).
North East Water’s customers have benefited from considerable investment in augmenting supplies and
significant reduction in customer demand across the region in recent years. On average, the demand for water
has reduced by approximately one third across the region, which has significantly improved supply reliability
(level of service) for many systems across the region, and has deferred the need for augmentation in many
towns such as Benalla.
Customer water savings have been complemented by North East Water improving the efficiency of its water
supply systems, where water losses in headworks and distribution have reduced by one third in recent years.
Further potential savings have been identified that can defer supply augmentations, such as Corryong water
supply system where projected annual savings of approximately 30 ML/yr could defer any augmentation by
approximately 20 years.

Water Supply Demand Strategy – Summary 2012
iii
The Victorian water market is a very effective method for balancing supply and demand in North East Water’s
communities that are supplied by the regulated River Murray system. The development and implementation
of water management tools such as annual carryover and wastewater return flow credits have reduced the
additional water entitlement required for River Murray supplied systems down to 113 ML over the next
50 years. North East Water will continue to use water markets to cater for future growth and to manage the
annual variation in demand during times of drought or water shortage and operate its urban water trading
scheme should the need arise again.
To ensure North East Water remains prepared, augmentation requirements have also be identified for
communities with a reliability of supply between 90% and 95%. Supply augmentation investigations will be
underpinned by North East Water’s One Resource approach, which takes a holistic approach to water resource
management and has also been used to develop the WSDS Alternative Water Atlas. The One Resource
approach reflects a strategic goal of the Corporation to deliver sustainable water services that meet the
outcomes sought by customers, that is, delivering water that is fit-for-purpose.
North East Water’s water supply systems have been tested across a spectrum of climatic conditions in recent
years. This experience has improved the robustness of North East Water’s drought response planning,
demonstrated the benefits of diversified supplies and highlighted the need for an Annual Water Security
Outlook tool. The Annual Water Security Outlook tool has been developed as part of this WSDS and will be
used to review the supply demand balance in November each year, informing an annual re-evaluation of short
and long term needs and determine whether there is a need to defer or accelerate planned activities if
conditions change from what is anticipated.
North East Water’s WSDS has been developed in consultation with the community and its Board. This included
working with North East Water’s Water Plan 3 Reference Group throughout the strategy’s development,
engaging with local councils, presentations to community groups, such as the Benalla Rotary Club, and seeking
feedback from the general public on the draft strategy. The final WSDS was issued to the Honourable Peter
Walsh, MP, Minister for Water, for noting in March 2012.

Water Supply Demand Strategy – Summary 2012
Page 1
1 Introduction
North East Water’s Water Supply Demand Strategy (WSDS) seeks to identify the best mix of measures to
maintain a balance between the demand for water in urban supply systems and available supply now and into
the future. The document is a summary of the strategy. The WSDS:
Has a 50 year timeframe.
Is reviewed on a five-yearly basis in accordance with any guidelines issued by the Department of
Sustainability and Environment.
Considers the total water cycle, consistent with the principles of integrated urban water management
and North East Water’s One Resource approach.
Balances social, environmental and economic costs and benefits.
Takes account of the risks and uncertainty associated with population growth and climate variability.
Complements North East Water’s Wastewater Strategy, which was prepared in 2010.
1.1 Scope
The WSDS provides strategic direction for the planning and management of water services at the whole of
business level and for each individual system. The scope of the WSDS is confined to communities that North
East Water currently provides water services. Although it does not provide direction for unserviced areas
(e.g. small towns without a reticulated potable water service), these opportunities are being considered by
North East Water through its Strategic Initiative to Work with unserviced communities to explore
fit-for-purpose water solutions.
1.2 Objectives of the WSDS
The objectives of the WSDS are to facilitate efficient and effective urban water planning and investment across
north east Victoria, to:
Ensure safe, secure, reliable and affordable water supplies that meet society’s needs.
Enable customers to have access to desired water products and services, and to choose to use water
for activities they value highly.
Encourage the use of all water resources, such as rainwater, stormwater and reclaimed water, in ways
that are efficient and fit-for-purpose, ensuring that public and environmental health are protected.
Encourage water projects to also enhance the liveability, productivity, prosperity and environment of
our cities and towns – wherever possible.
Ensure that water needs of environmental assets are transparently considered and delivered.
Ensure that water planning is subject to a transparent and rigorous decision-making process, with
clear roles and responsibilities and accountabilities, which can adapt to the changing environment.

Water Supply Demand Strategy – Summary 2012
Page 2
1.3 Overview of North East Water
North East Water is a regional urban water corporation that:
Provides water and wastewater services to an estimated population of 115,000 people across north
east Victoria, as shown in Figure 1.
Provides water services to 39 communities and nearly 46,000 connections.
Produces up to 18,000 ML/yr of drinking water through 21 water treatment plants.
Provides wastewater services to 24 communities and nearly 40,000 connections.
Produces approximately 9,000 ML/yr of reclaimed water through 19 wastewater treatment plants.
Figure 1: North East Water’s area of operation
North East Water sources water from various locations. Diversion of water from the River Murray supports a
high portion of North East Water’s customers. The Murray system includes the major water supply reservoirs
of Lake Hume and Lake Dartmouth, which also provide water supply to towns, rural water users and the
environment in Victoria, New South Wales and South Australia. Bulk water supply to North East Water in the
Lower Ovens and King river valleys is sourced from Lake Buffalo and Lake William Hovell, which are managed
by Goulburn-Murray Water who also supplies rural water users from the same source. Supply systems on the
Kiewa River are influenced by hydropower generation on the Upper Kiewa River, which is managed by AGL.
Other supply systems include large raw water reservoirs managed by North East Water, extraction from run of
the river systems and groundwater supply systems.

Water Supply Demand Strategy – Summary 2012
Page 3
2 Levels of Service
2.1 What is meant by Levels of Service?
In the context of this WSDS, level of service refers to the long-term security of supply of a water supply system.
Security of supply is measured by the frequency, severity and/or duration of water restrictions, as well as the
ability to maintain a minimum supply during drought. Security of supply is often used interchangeably with
the term reliability of supply, which has an equivalent meaning in this WSDS. There are two aspects to North
East Water’s level of service; an agreed level of service and minimum level of service.
An agreed level of service reflects a desired maximum frequency of restrictions for a supply system in the
long-term. If this level of service is not met, then customers would expect to experience restrictions more
frequently than desired. North East Water has planned to be able to maintain this level of service in the long-
term under anticipated future climate change conditions.
Restrictions can vary for different customer segments, refer to North East Water’s website
(www.newater.com.au) for more information on water restriction details.
The level of service in this WSDS is assessed using long-term water resource models of each supply system.
The actual level of service experienced by customers at any time over the next 50 years may differ from the
long-term modelled estimate, as occurred from 1997-2009 when a series of unforeseen consecutive dry years
resulted in a high frequency of restrictions. The level of service (reliability of supply) will be higher during
prolonged and/or severe wet climate periods and lower during prolonged dry climate periods.
The agreed level of service can be affected by a number of factors, and is often limited by the nature of the
supply system. The agreed level of service can be changed if customers are willing to pay for a different level
of service. If the best available demand reduction or supply enhancement option is relatively inexpensive,
then a higher level of service can be readily achieved with little or no impact on water prices. On the other
hand, if the best available option is expensive, then it may result in a substantial increase in water prices, and a
lower level of service may be preferable.
A minimum level of service reflects North East Water’s commitment to maintain supply for in-house
residential water consumption and commercial/industrial demand. North East Water has capacity to supply
this volume during a repeat of the worst historical drought on record, adjusted for future climate change.

Water Supply Demand Strategy – Summary 2012
Page 4
2.2 Minimum Level of Service
North East Water’s minimum level of service meets the demand for unrestrictable in-house and
commercial/industrial use. This component of demand is what would be provided to customers under Stage 4
restrictions, as outlined on our website (www.newater.com.au).
The magnitude of this demand will change over time with changes in population, in-house water use efficiency
and the nature of commercial/industrial demand. North East Water has the capacity to deliver the minimum
level of service to all of its customers, which is approximately 6,500 ML/yr based on the current (2010/11)
level of demand.
2.3 Agreed Level of Service
North East Water’s agreed level of service provides a 90% likelihood that customers will not be asked to
reduce water consumption in any given year, based on forecast community needs for water over the 50 year
planning horizon.
North East Water is planning to provide the agreed level of service to all of its customers, subject to:
Integration of 520 ML storage into Bright water supply system (expected 2014).
Augmentation of the Goorambat water supply system included in Water Plan 3 (2013 – 2018).
Table 1 highlights the anticipated range of years at which the agreed level of service is expected to no longer
be met with the current supply system. The expected year at which the agreed level of service (reliability of
supply) would no longer be met is based on the projected demands with North East Water supply system
savings and median climate change projections. The earliest year corresponds to dry climate change
conditions and slightly higher projected demands, which is based on the possibility that residential customers
revert to their higher water use behaviour. The latest year corresponds to projected demands with system
savings and wet climate change conditions.
Towns where action may be required by North East Water before the year 2025 are highlighted in red. Table 1
indicates that action is required at Goorambat, Harrietville and Corryong. Goorambat supply system extracts
water from a shallow groundwater bore which has insufficient yield to meet the agreed level of service and
supply augmentation is required immediately, as significant demand reduction has already been achieved. For
Corryong, some form of demand reduction or supply enhancement is expected to be required by the year
2032 providing forecast water savings in the system are achieved, but could be as early as 2013 if demand
increases under the dry climate change scenario. For Harrietville, the level of service objectives are expected
to be met until around the year 2049, however if dry climate change conditions were to eventuate, some form
of demand reduction or supply enhancement could be required by the year 2020.
For all other towns, no action is expected to be required until after the year 2040. Under a higher demand and
dry climate change scenario, action would still not be required until after the year 2028. This gives North East
Water at least 15 years to plan for any actions in these supply systems, and hence our long-term planning
activities will be considered for these systems when their supply and demand status is revised in five years
time. Supply system behaviour will continue to be monitored and reported on in North East Water’s Annual
Water Security Outlook.

Water Supply Demand Strategy – Summary 2012
Page 5
Table 1: Provision of Agreed Level of Service
Water Source/ Catchment
System Township Serviced Year Agreed Level of Service will not be met
Expected Earliest Latest
Broken Benalla Benalla >2060 >2060 >2060
Groundwater Goorambat Goorambat 2012 2012 2012
Kiewa
Beechworth Beechworth >2060 >2060 >2060
Mount Beauty
Mount Beauty
>2060 >2060 >2060 Tawonga
Tawonga South
Yackandandah Yackandandah >2060 >2060 >2060
King
Moyhu Moyhu >2060 >2060 >2060
Oxley Oxley >2060 >2060 >2060
Whitfield Whitfield >2060 >2060 >2060
Mitta Mitta Dartmouth Dartmouth >2060 >2060 >2060
Eskdale Eskdale 2060 2028 >2060
Murray
Bellbridge Bellbridge 2060 2028 >2060
Tallangatta Tallangatta 2060 2028 >2060
Wahgunyah/ Rutherglen
Wahgunyah 2060 2028 >2060
Rutherglen
Wodonga
Wodonga
2060 2028 >2060
Baranduda
Bonegilla/Ebden
Kiewa
Tangambalanga
Barnawartha
Chiltern
Springhurst
Yarrawonga
Yarrawonga
2060 2028 >2060
Tungamah
St James
Devenish
Bundalong
Ovens
Bright
Bright
>2060 2040 >2060 Porepunkah
Wandiligong
Harrietville Harrietville 2049 2020 >2060
Myrtleford Myrtleford >2060 2037 >2060
Wangaratta Wangaratta
2041 2029 2060 Glenrowan
Upper Murray Corryong
Corryong 2032 2013 >2060
Cudgewa
Walwa Walwa >2060 > 2060 >2060

Water Supply Demand Strategy – Summary 2012
Page 6
3 Context
3.1 Water supply planning
North East Water has three key water planning tools which form its integrated decision making framework:
1. WSDS – a proactive tool used to identify requirements over the long term.
2. Drought Response Plan – an operational tool that informs appropriate responses in the short term.
3. Annual Water Security Outlook – a tool that informs the re-evaluation of short and long term needs.
The role of these three water planning tools in North East Water’s integrated decision making framework for
action are shown in Figure 2. North East Water will implement the timetable of actions in this WSDS, but may
either defer or bring forward actions depending on the climate conditions or changes in demand in any
individual year.
Figure 2: North East Water’s decision making framework for action
The WSDS sets out when particular actions might be needed over a 50 year planning period to maintain
minimum and agreed levels of service. In contrast, the Drought Response Plan sets out the short-term actions
that could be needed during drought in order to maintain the minimum level of service, particularly if climate
conditions reduce yields and increased demands exceed supply. These short-term actions include temporarily
using alternative supply sources or temporarily introducing water restrictions, as occurred across north east
Victoria in recent drought years such as 2006/07. Drought response actions can be implemented quickly in
response to an immediate need, but may not necessarily be the most cost effective solution in the long-term.
North East Water’s WSDS presents a timetable to implement demand reduction and supply enhancement
measures over the next 50 years. When faced with a drought that threatens supply security, North East Water
has a choice about whether to bring forward a planned long-term action, or to implement a short-term action,
thereby deferring a long-term action until it is more likely to be utilised on an ongoing basis. By integrating the
planning processes for the WSDS and Drought Response Plan, North East Water is able to directly compare
short- and long-term options to make the best decision about which actions to implement at any given time.
The Annual Water Security Outlook provides an understanding of likely supply system behaviour over the
coming 12 months. It informs a re-evaluation of short and long term needs by considering current supply
system conditions and projects how the supply system would behave under wet, average, dry and very dry
climate conditions. The Annual Water Security Outlook identifies whether security of supply is likely to be
threatened, and if so, how long it is likely to be until demand reduction or supply enhancement measures are
required.
Annual Water Security Outlook-Likelihood of drought occurring-Likely lead time until security of supply is threatened-Likely severity and duration of drought
Water Supply Demand Strategy-Most cost effective long-term actions-50 year implementation timetable
Drought Response Plan-Rapid drought response actions-Seasonal triggers to implement actions
Implement WSDS timetable of actions but:-Defer action if:(i) Annual Water Security Outlook indicates no likely threat to
security of supply; and (ii) Lead time to implement WSDS action is shorter than outlook
forecast period-Bring forward action if: (i) Annual Water Security Outlook indicates likely threat to
security of supply; and (ii) Lead time to implement WSDS option is shorter than the
likely time available until the threat is realised; and(iii) The WSDS action is more cost effective than the best available
DRP action given the likely drought duration and severity
North East Water’s Planning Tools North East Water’s Actions

Water Supply Demand Strategy – Summary 2012
Page 7
3.2 Strategy documentation
Documentation prepared as part of WSDS development includes a summary document (this document), a
WSDS document and water system plans for each of the 21 specific water systems which North East Water is
responsible for. An overview of the WSDS documentation structure is shown in Figure 3. This three-tiered
approach allows the reader to access detail in an efficient and easy manner.
Figure 3: Overview of WSDS documentation
- 21 system plans
- System details
- Alternative Water Atlas
- System-specific approaches
- Annual Water Security Outlook
- Detailed WSDS
- Proposed Levels of Service
- Decription of WSDS approach
- Details of strategic approach
- Overview of WSDS
- Proposed Levels of Service
- Overview of strategic approach
Water Supply Demand Strategy - Summary
Water Supply Demand Strategy
Water System Plans
Water System Plans
Water System Plans
Water System Plans
(this document)

Water Supply Demand Strategy – Summary 2012
Page 8
3.3 Stakeholder engagement
North East Water’s WSDS has been developed in consultation with the community and its Board. The North
East Water project team has driven the development of the WSDS and sought input from the community and
Board at key stages. Community input was used to finalise the agreed and minimum levels of service, which
will be subsequently used to inform supply augmentation and capital investment requirements for
consideration in North East Water’s next Water Plan (2014-2018). Specific detail on engagements activities is
provided below.
The North East Water Water Plan 3 Reference Group was a key community group that was involved
throughout the development of the strategy. During this time, the Reference Group has:
Gained an understanding of the purpose of the WSDS and approach taken for its development.
Gained an understanding of the current level of service (reliability of supply) of North East Water’s
21 water supply systems and investment required to deliver the agreed level of service.
Provided positive feedback on the minimum and agreed levels of service.
Other mechanisms that North East Water has used to gain input from stakeholders include:
Engaging with each local council to develop the Alternative Water Atlas component of the WSDS. This
involved meeting with senior staff from Alpine Shire, Benalla Rural City, City of Wodonga, Indigo Shire,
Moira Shire, Towong Shire and Rural City of Wangaratta.
Obtaining positive feedback from local councils on forecast growth rates for each of their relevant
communities.
Presenting an overview of the WSDS development process and reliability of supply (level of service)
modelling results for Benalla to the Benalla Rotary Club. This was conducted as part of North East
Water’s community engagement during National Water Week and it provided an insight to the
community’s level of service expectations, as identified by that segment of the Benalla community.
Obtaining feedback from DSE on the draft WSDS prior to seeking public comment.
Positive feedback was obtained from the public on the draft WSDS, including the proposed levels of
service, after announcing the release of the draft WSDS in local media and making it available on the
North East Water website during February 2012.
Presenting the draft WSDS to North East Water’s Yackandandah Community Reference Group.
North East Water’s Board has provided oversight to the development of the WSDS in conjunction with the
development of North East Water’s capital program for Water Plan 3. The Board has provided input to the
development of the WSDS though a workshop and regular Board and Board sub-committee meetings.
The final WSDS was issued to the Honourable Peter Walsh, MP, Minister for Water, for noting in March 2012.
North East Water would like to acknowledge the Project Team and Water Plan 3 Reference Group for their
contribution and feedback throughout the development of the strategy.
In the future, North East Water will engage with communities affected by supply augmentations approved in
the next Water Plan. This approach is consistent with our current stakeholder engagement process.
Engagement will span from the options assessment through to the delivery of the augmentation.

Water Supply Demand Strategy – Summary 2012
Page 9
3.4 Achievements and outcomes from recent experience
North East Water’s water supply systems have been tested by the entire spectrum of climatic conditions since
implementing the first WSDS in 2007. This period has included one of the driest and wettest years on record.
This experience has allowed North East Water to test previous assumptions and as a result the Corporation has
a higher level of certainty around appropriate drought response trigger levels and actions.
The outcomes from recent experience and achievements can be grouped into the following six themes, which
are outlined below:
1. Drought response actions:
a. Water restrictions were used as a primary demand reduction tool in periods when water
availability was low. This experience informed the development of updated trigger levels in
the revised Drought Response Plan (2011).
b. Temporarily supplementing supplies from alternative sources (carting water) when regular
sources of water were physically unavailable or of reduced quality.
c. Extracting water from alternative water supply sources when the water Bulk Entitlements
allow provision.
d. Seeking Qualification of Rights from the Minister to allow extraction of water from
alternative waterways.
e. Supplementing the Ovens River supply at Bright by intermittently pumping from the
Harrietville dredge holes from January to March 2007.
2. Supply augmentation.
a. Connecting Barnawartha, Chiltern and Springhurst to the Wodonga supply system.
b. Connecting Glenrowan to the Wangaratta supply system.
c. Integrating Porepunkah into the Bright supply system.
d. Augmenting Ovens River supply at Wangaratta with groundwater bores.
e. Planned replacement of Musk Gully Creek supply source at Whitfield with supply from King
River (expected June 2012).
f. Planned installation of a dual pipe system, connecting Bundalong to Yarrawonga potable
supply system with raw water supply from local source (expected December 2012).
g. Planned integration of a 520 ML off-stream storage into the Bright system (expected 2014).
3. System water savings.
a. Reducing system water losses across the region by one third since its inception of program.
b. Auditing delivery systems to identify areas of high loss.
c. Annual meter verification program to ensure all data captured is accurate.
d. Active leak detection to identify and repair main breaks.
e. Recycling backwash water from water treatment plants.
f. Investigating zoned metering within larger towns to enable leaks to be located earlier.
g. Investigating pressure reduction options within towns that have excessive breaks to reduce
leakage.
Water Supply Demand Strategy – Summary 2012
Page 10
4. Demand reduction and management.
a. There have been significant reductions in customer demand for water across all sectors in
recent years, reflecting step changes in community attitudes around water use. Changes in
customer behaviour can be attributed to community and education programs, increased
water prices and regulation (e.g. water restrictions).
b. It is estimated that long-term average residential per connection demand has decreased by
around one third from 2004/05 to 2009/10.
c. Reduced demand has resulted in improved supply reliability (level of service) for many
systems across the region, including Benalla, and deferred the need for supply
augmentation.
d. Implementation of the Victorian Government’s waterMAP initiative has significantly reduced
demand from commercial and industrial sectors.
5. Use of water markets.
a. Purchasing additional permanent water entitlements for Benalla, Eskdale, Moyhu, Wodonga
and Yackandandah during the drought.
b. Large temporary purchases of water were made for the River Murray Bulk Entitlement to
provide customers with a higher level of service during periods of low allocation to avoid the
significant social consequences of harsh water restrictions.
c. Carryover of unused water entitlement from the previous year was used to provide Murray
System customers with an increased level of service.
d. New groundwater supplies were developed at Wangaratta and Bright.
e. North East Water’s Urban Water Trading Scheme operated from 2007/08 to 2009/10 to
provide water to customers, such as schools, councils and sporting associations, which would
otherwise be limited in their water use due to urban water restrictions.
f. Working with Goulburn-Murray Water and DSE from 2008 onwards to develop the Protocol
for Crediting Return Flows from West Wodonga Wastewater Treatment Plant, which allows
North East Water to claim monthly return flow credits from the West Wodonga Wastewater
Treatment Plant against the River Murray Bulk Entitlement.
g. Proposed change in Bulk Entitlement at Bright, due to off-stream storage, which will result in
increased reliability benefits for customers and improved passing flows for the environment
during periods of low river flows.
6. Further studies and investigations.
a. Successfully acquiring funding for supply augmentation at Springhurst and Whitfield.
b. Conducting One Resource pilot project for Yackandandah and Wodonga to develop a shared
understanding with the community of alternative water sources available to achieve
outcomes sought by the community and ultimately achieving improved supply reliability
(level of service) and resilience against future climate shocks.
c. Supply augmentation investigations for Yackandandah, including functional design for
connection to Wodonga supply system and prefeasibility assessment of groundwater
availability.
d. Business case and funding applications for Goorambat and Harrietville supply augmentation.
e. Investigation and subsequent functional design to augment Benalla’s supply from Broken
River.
f. Several studies funded by State and Commonwealth governments to investigate the
availability and interconnection of surface water and groundwater in the Ovens Valley.
g. Upper Ovens Water Management Plan led by Goulburn-Murray Water.

Water Supply Demand Strategy – Summary 2012
Page 11
3.5 Challenges we face
3.5.1 Dealing with uncertainty
The WSDS incorporates principles of scenario-based planning and adaptive management as part of a
framework for decision-making under uncertainty. North East Water has to make investment decisions in the
face of considerable uncertainty about the future demand for, and availability of, water. Future demand
depends on population growth and water consumption trends and future water availability predominantly
depends on short and long term climate variability, such as droughts, floods, shift in rainfall patterns and
subsequent stream flow impacts. Scenario-based planning coupled with adaptive management enables water
resource managers to make prudent investment decisions in the face of this uncertainty.
There are many sources of uncertainty in any water planning exercise. Some of the major sources of
uncertainty for North East Water in forecasting supply and demand and the approaches to address such
uncertainty are outlined in Table 2.
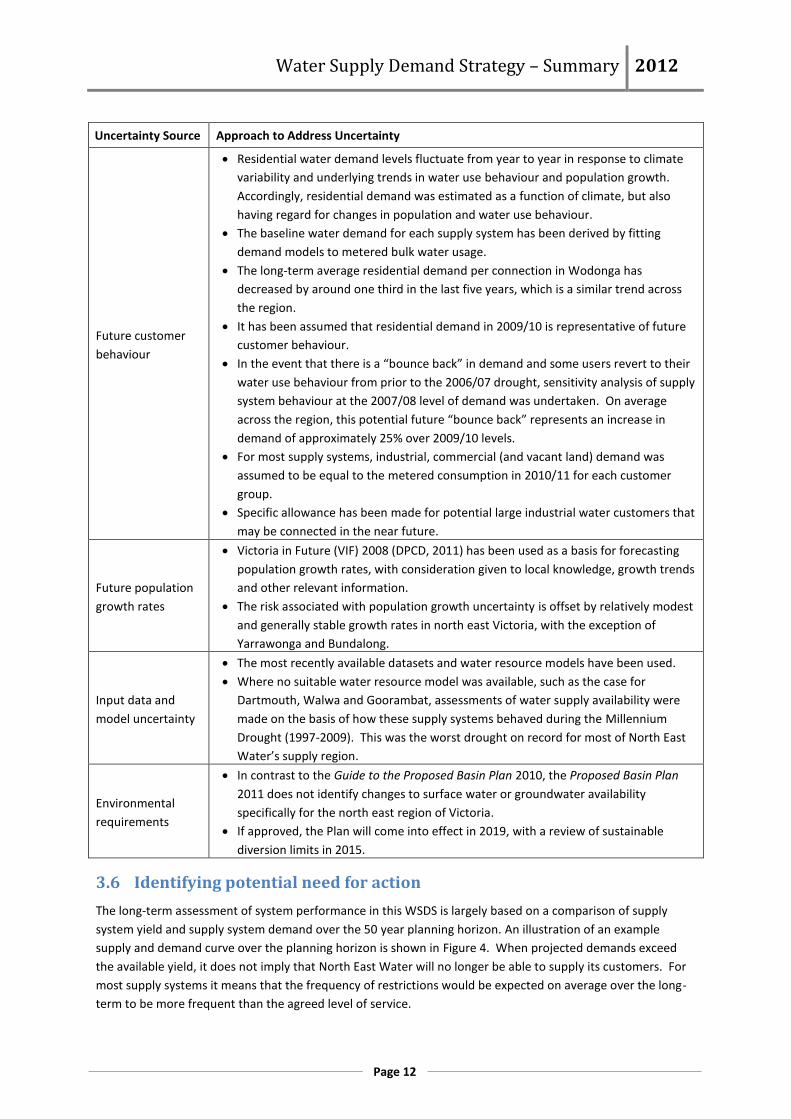
Table 2: Sources of Supply Uncertainty and Approach to Address Uncertainty
Uncertainty Source Approach to Address Uncertainty
Future climate
uncertainty and its
impact on surface
water availability
Long-term water resource models covering a range of both drought and flood events
are used to take natural climate variability into account.
Climate change projections are in accordance with latest guidance from DSE (2011),
which is sourced from the most recent research available from the South East
Australia Climate Initiative (SEACI).
Water resource modelling has been conducted on "wet", “median” and "dry"
climate future scenarios.
A further climate scenario was investigated for “return to dry” climate conditions
based on a continuation of conditions during the Millennium Drought from 1997 to
2009.
The 2060 “dry” climate change scenario is considered to be representative of the
“return to dry” scenario, which is based on a continuation of the Millennium
Drought (1997-2009).
General water quality risks that can impact on the capacity to deliver safe drinking
water have been identified in respective Water System Plans.
Future climate
uncertainty and its
impact on
groundwater
availability
Groundwater is currently used as the primary supply for Goorambat and
supplementary supply for Wangaratta.
The future availability of groundwater under climate change is uncertain.
Further investigations and monitoring will be undertaken at Goorambat to better
understand some of the uncertainties associated with groundwater supply
Groundwater would provide a reliable supplementary supply at Wangaratta
according to recent technical investigations.
The potential
impact of past and
future bushfires
Most of North East Water’s water supply catchments have been subject to bushfires
over the last decade, with major bushfires occurring across the region in 2003, 2006
and 2009.
Bushfires have a short-term operational impact at the time of the fire and are
anticipated to reduce supply over the coming decades.
Due to the many input data and modelling uncertainties in the broad scale
assessment undertaken to date, advice from DSE (2011) is to defer specific actions
until the next WSDS (2017) when more information is known about the likely long-
term catchment response to the fires.
Water Supply Demand Strategy – Summary 2012
Page 12
Uncertainty Source Approach to Address Uncertainty
Future customer
behaviour
Residential water demand levels fluctuate from year to year in response to climate
variability and underlying trends in water use behaviour and population growth.
Accordingly, residential demand was estimated as a function of climate, but also
having regard for changes in population and water use behaviour.
The baseline water demand for each supply system has been derived by fitting
demand models to metered bulk water usage.
The long-term average residential demand per connection in Wodonga has
decreased by around one third in the last five years, which is a similar trend across
the region.
It has been assumed that residential demand in 2009/10 is representative of future
customer behaviour.
In the event that there is a “bounce back” in demand and some users revert to their
water use behaviour from prior to the 2006/07 drought, sensitivity analysis of supply
system behaviour at the 2007/08 level of demand was undertaken. On average
across the region, this potential future “bounce back” represents an increase in
demand of approximately 25% over 2009/10 levels.
For most supply systems, industrial, commercial (and vacant land) demand was
assumed to be equal to the metered consumption in 2010/11 for each customer
group.
Specific allowance has been made for potential large industrial water customers that
may be connected in the near future.
Future population
growth rates
Victoria in Future (VIF) 2008 (DPCD, 2011) has been used as a basis for forecasting
population growth rates, with consideration given to local knowledge, growth trends
and other relevant information.
The risk associated with population growth uncertainty is offset by relatively modest
and generally stable growth rates in north east Victoria, with the exception of
Yarrawonga and Bundalong.
Input data and
model uncertainty
The most recently available datasets and water resource models have been used.
Where no suitable water resource model was available, such as the case for
Dartmouth, Walwa and Goorambat, assessments of water supply availability were
made on the basis of how these supply systems behaved during the Millennium
Drought (1997-2009). This was the worst drought on record for most of North East
Water’s supply region.
Environmental
requirements
In contrast to the Guide to the Proposed Basin Plan 2010, the Proposed Basin Plan
2011 does not identify changes to surface water or groundwater availability
specifically for the north east region of Victoria.
If approved, the Plan will come into effect in 2019, with a review of sustainable
diversion limits in 2015.
3.6 Identifying potential need for action
The long-term assessment of system performance in this WSDS is largely based on a comparison of supply
system yield and supply system demand over the 50 year planning horizon. An illustration of an example
supply and demand curve over the planning horizon is shown in Figure 4. When projected demands exceed
the available yield, it does not imply that North East Water will no longer be able to supply its customers. For
most supply systems it means that the frequency of restrictions would be expected on average over the long-
term to be more frequent than the agreed level of service.

Water Supply Demand Strategy – Summary 2012
Page 13
Figure 4: Yield and demand over the planning horizon (example only)
For some supply systems, such as Harrietville, the drought response triggers for implementing restrictions are
based on available streamflow at North East Water’s supply offtakes. For these supply systems, changes in
demand over the 50 year planning horizon will have no impact on the frequency of restrictions experienced by
North East Water’s customers, unless demand is near the Bulk Entitlement limit. It is more likely that changes
in river flow under future climate change will impact on the frequency of restrictions (or reliability of supply)
experienced. The method of presenting results for these supply systems is illustrated in Figure 5, which shows
demand presented separately to the changes in annual reliability of supply.
Figure 5: Reliability and demand over the planning horizon (example only)
Average annual volume
Time
2010 20602020 2030 2040 2050
Demand
Yieldfrom water resource
modelling over a long-term climate
sequence
Demand for water increases as
population growsYield from supply systems
decreases with climate change
Year in which demand exceeds yield (restrictions start to occur more frequently than agreed
level of service)
Supply to customers will be regularly restricted in these years without supply
enhancement or demand reduction measures
Supply to customers will rarely be restricted in these
years
Time
Annual reliability of supply
Time
2010 20602020 2030 2040 2050
Demand
Time
Demand for water increases as
population grows
Yield from supply systems
decreases with climate change
Year in which target reliability of supply is no longer met (restrictions start to
occur more frequently than agreed level
of service)
Supply to customers will be regularly restricted in these years without supply
enhancement or demand reduction measures
Supply to customers will rarely be restricted in these
years
Time

Water Supply Demand Strategy – Summary 2012
Page 14
4 How will the Levels of Service be met?
4.1 Possible options
A range of potential supply enhancement and demand reduction measures are available to North East Water.
These measures have been classified based on North East Water’s ability to manage the supply source, as
shown in Table 3.
Table 3: Classification of supply enhancement and demand reduction initiatives
Demand reduction measures Supply enhancement measures
Water efficient appliances.
Water use behaviour change.
Rainwater tanks.
Reduction in system losses.
Household, industry or lot scale stormwater harvesting.
Household or industry greywater use.
Water pricing.
Groundwater.
Surface water.
Bulk water storages.
Reclaimed water from wastewater treatment plants.
Centralised North East Water stormwater harvesting systems.
Using water markets.
Water carting.
Many systems use alternative water sources (e.g. reclaimed water or stormwater) to achieve outcomes
traditionally sought by potable water. This WSDS introduces the Alternative Water Atlas, which has been
prepared to inform future water supply decisions, providing information regarding relevant, achievable
alternative water resources related to specific geographic locations within the North East Water service area.
The Alternative Water Atlas includes an inventory of current and potential alternative water use across the
region, with specific detail provided in each of the respective system plans.
4.2 North East Water’s One Resource framework
The requirement for an Alternative Water Atlas is consistent with North East Water’s One Resource approach,
which reflects a strategic goal of the Corporation to deliver sustainable water services that meet the outcomes
sought by customers, which is, delivering water that is fit-for-purpose. Accordingly, North East Water has used
the One Resource framework for the development of the Alternative Water Atlas.
The One Resource approach is based on the premise that customers do not buy water because they want
water, rather they desire the outcome that it provides and is underpinned by three strategic themes:
Efficiency: Encourage and optimise water efficiency.
Choice: Maximising choice in use, maximising choice in supply.
Security: Reliability of supply.
A key element of the approach has been the development of guiding principles and a conceptual framework
that are readily understood and communicated to enable customers to participate in the identification of
options can meet the water service outcomes that they seek.

Water Supply Demand Strategy – Summary 2012
Page 15
The One Resource approach applies seven guiding principles to enhance customer choice through access to a
range of products and service opportunities that meet agreed outcomes. These are:
A holistic approach to all water resources.
Fit-for-purpose products.
An appropriate risk profile.
Endurance – Sustainability across all areas.
A benefit to broader community - Customer choice and acceptance of product.
A value proposition – Efficient use of resources.
Recognition that North East Water does not have a monopoly on the provision of water services.
The guiding principles inform a conceptual framework that enables broad consultation and delivers outcomes
that meet shared expectations, which is presented in Figure 6.
Figure 6: North East Water’s One Resource framework
The customer-focussed approach of One Resource aligns the quality of water required by the customer with
the most efficient delivery infrastructure and the capacity of the environment to meet the outcome sought. It
is important to note that efficient delivery of the water service may utilise infrastructure that is owned by the
Corporation or a third party. The consistent application of the guiding principles enables the framework to be
applied across small and large communities.
Identification of opportunities to address actual or potential water use outcomes sought by end-users enables
each opportunity to be objectively evaluated. Importantly it enables both North East Water and communities
to discuss and accept or reject potential service delivery options based on agreed criteria.
The One Resource approach has been adopted by North East Water as a key step in the delivery of sustainable
water services. It forms the basis of consultation with customers and communities to identify future water
service delivery outcomes sought and is a key element informing subsequent business case development.

Water Supply Demand Strategy – Summary 2012
Page 16
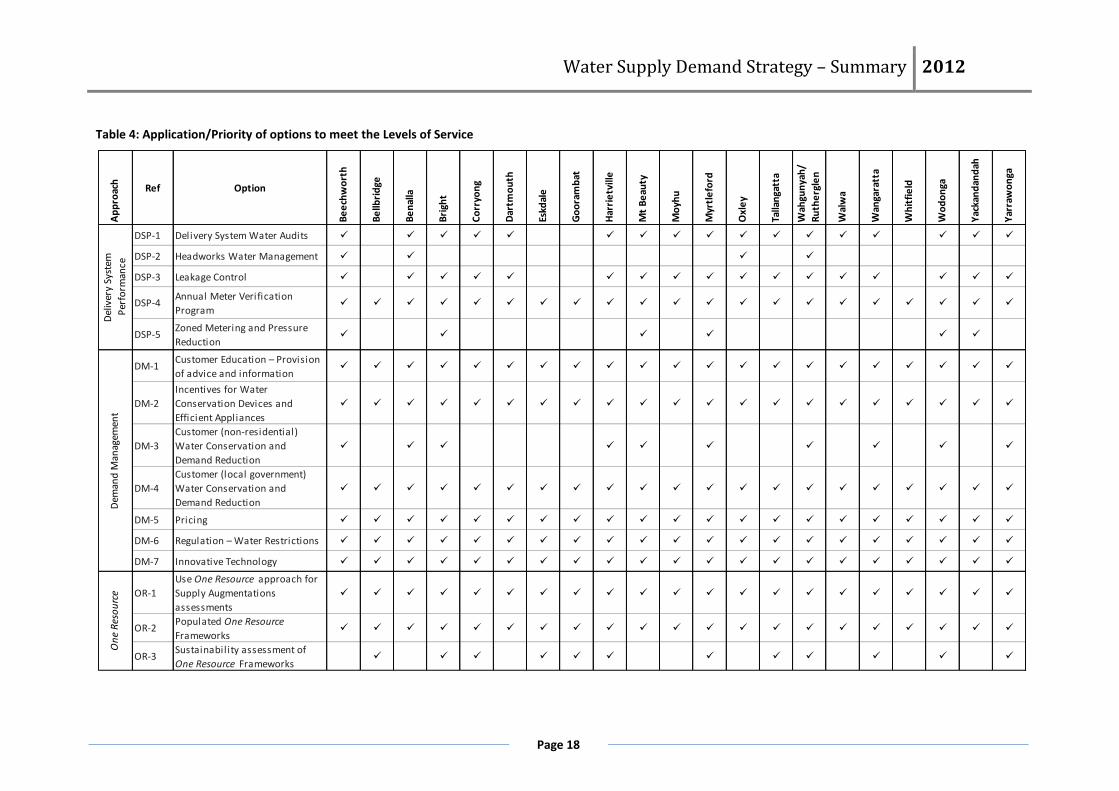
4.3 Approaches available to meet the Levels of Service
Approaches available to balance supply and demand may be categorised under demand management, supply
augmentation, or in some cases both. The five approaches identified to ensure North East Water provides the
agreed level of service are consistent with, or in many cases an extension of the approaches delivered under
the 2007 WSDS. The recommended approaches are outlined below, with specific options under each
approach and their application, or priority, across North East Water’s 21 water supply systems is shown in
Table 4. A volumetric summary of demand savings or additional supply required to achieve a balance between
supply and demand across North East Water’s region over a 50-year planning horizon is shown in Table 5.
1. Delivery System Performance (demand management).
a. Improve the understanding of water losses in each delivery system and management of
these systems, ultimately reducing water losses.
b. Five-year target to reduce water losses in headworks and distribution by 5% and 60%,
respectively, resulting in annual water savings of more than 600 ML/yr.
c. The significance of the Delivery System Performance approach is highlighted in Corryong,
where reducing water losses over the next five years could defer an expensive supply
augmentation by 20 years.
2. Demand Management (demand management).
a. Given the success of North East Water’s demand reduction initiatives to date, the objective
of this approach is to maintain current levels of demand and minimise this risk of “bounce
back” and customers reverting back to their higher water use behaviour prior to the 2006/07
drought. Accordingly water savings from this initiative have been set at zero across the
region, refer to Table 5.
3. One Resource (demand management/supply enhancement).
a. The One Resource approach is aligned closely with a key objective of the WSDS to encourage
the use of all water resources in ways that are efficient and fit-for-purpose.
b. The WSDS does not recommend preferred alternative water options in each of its systems,
instead it identifies opportunities and recommends the use of the One Resource framework
to holistically consider all initiatives that reduce demand or enhance supply.
c. The volumetric summary for the One Resource approach, detailed in Table 5, represents the
opportunities to reduce demand or enhance supply. These volumes are over and above the
nominal additional water or savings required by 2060.
4. Using Water Markets (supply enhancement).
a. The Victorian water market is a very effective method for balancing supply and demand in
North East Water’s communities supplied by the regulated River Murray system.
b. North East Water will continue to purchase additional entitlement through the water trading
market to cater for future growth and to manage the annual variation in demand.
c. The volumetric summary for the Using Water Markets approach, detailed in Table 5,
indicates that only an additional 113 ML of water entitlement is required by 2060 for
communities supplied by the River Murray. This sum does not include the benefits from
wastewater return flow credits or utilising carryover which provide additional access to
water.
d. Should the need arise, North East Water will operate its Urban Water Trading Scheme again
during severe restrictions to allow customers, which would otherwise be limited in their
water use due to urban water restrictions, to access water.

Water Supply Demand Strategy – Summary 2012
Page 17
5. Secure Water Source (supply enhancement).
a. Supply augmentation options have been developed for systems that:
i. Can not provide the agreed level of service (reliability of supply of less than 90%) -
Goorambat.
ii. Offer a reliability of supply between 90% and 95% - Wangaratta, Corryong and
Harrietville.
b. An additional 10 ML/year is required for Goorambat to improve the community’s reliability
of supply to North East Water’s agreed level of serve. This may involve replacing the existing
groundwater supply system with a 20 ML/yr pipeline supply from Devenish, which would
also ensure compliance with the Safe Drinking Water Act 2003.
c. The remaining systems have sufficient capacity to meet the agreed level of service, however
the supplies for Wangaratta, Corryong and Harrietville may need to be augmented beyond
the next 10 year planning horizon.
Water Supply Demand Strategy – Summary 2012
Page 18
Table 4: Application/Priority of options to meet the Levels of Service
Ap
pro
ach
Ref Option
Be
ech
wo
rth
Be
llbri
dge
Be
nal
la
Bri
ght
Co
rryo
ng
Dar
tmo
uth
Eskd
ale
Go
ora
mb
at
Har
rie
tvill
e
Mt
Be
auty
Mo
yhu
Myr
tle
ford
Oxl
ey
Talla
nga
tta
Wah
gun
yah
/
Ru
the
rgle
n
Wal
wa
Wan
gara
tta
Wh
itfi
eld
Wo
do
nga
Yac
kan
dan
dah
Yar
raw
on
ga
DSP-1 Delivery System Water Audits
DSP-2 Headworks Water Management
DSP-3 Leakage Control
DSP-4Annual Meter Verification
Program
DSP-5Zoned Metering and Pressure
Reduction
DM-1Customer Education – Provision
of advice and information
DM-2
Incentives for Water
Conservation Devices and
Efficient Appliances
DM-3
Customer (non-residential)
Water Conservation and
Demand Reduction
DM-4
Customer (local government)
Water Conservation and
Demand Reduction
DM-5 Pricing
DM-6 Regulation – Water Restrictions
DM-7 Innovative Technology
OR-1
Use One Resource approach for
Supply Augmentations
assessments
OR-2Populated One Resource
Frameworks
OR-3Sustainability assessment of
One Resource Frameworks
Dem
and
Man
agem
ent
On
e R
eso
urc
eD
eliv
ery
Syst
em
Per
form
ance

Water Supply Demand Strategy – Summary 2012
Page 19
Ap
pro
ach
Ref Option
Be
ech
wo
rth
Be
llbri
dge
Be
nal
la
Bri
ght
Co
rryo
ng
Dar
tmo
uth
Eskd
ale
Go
ora
mb
at
Har
rie
tvill
e
Mt
Be
auty
Mo
yhu
Myr
tle
ford
Oxl
ey
Talla
nga
tta
Wah
gun
yah
/
Ru
the
rgle
n
Wal
wa
Wan
gara
tta
Wh
itfi
eld
Wo
do
nga
Yac
kan
dan
dah
Yar
raw
on
ga
UWM-1Regulated Supply - Bulk
Entitlement
UWM-2Unregulated Supply - Bulk
Entitlement
UWM-3Unregulated Supply –
Groundwater Licence
UWM-4 Carryover
UWM-5 Wastewater Return Flow credits
UWM-6 Urban Water Trading Scheme
SWS-1aGoorambat supply augmented
with pipeline from Devenish
SWS-1bGoorambat supply augmented
with additional groundwater
SWS-1cGoorambat supply
supplemented with water carting
SWS-2aWangaratta supply augmented
with off-stream storage
SWS-2bWangaratta supply augmented
with groundwater
SWS-3aHarrietvil le supply augmented
with off-stream storage
SWS-3bHarrietvil le supply augmented
with groundwater
SWS-3cHarrietvil le supply
supplemented with water carting
SWS-4aCorryong supply augmented with
off-stream storage
SWS-4bCorryong supply augmented with
groundwater
Usi
ng
Wat
er M
arke
tsSe
cure
Wat
er S
ou
rce

Water Supply Demand Strategy – Summary 2012
Page 20
4.4 Implementing the Strategy
Table 5: Region-wide volumetric summary of supply, demand and opportunities to achieve a balance
1 NOTE: Yield from unregulated rivers at North East Water’s agreed level of service was indeterminate because reliability is fixed by available streamflow, and is independent of the level of
demand. The supply-demand balance has been assessed using estimates of reliability of supply rather than yield.
2010 2030 2060 2010 2030 2060 2010 2030 2060
Beechworth 424 469 527 1,073 1,059 1,064 0 0 0 43 0 30 0 0 73
Benal la 1,369 1,479 1,618 2,555 2,469 2,341 0 0 0 104 0 8 0 0 112
Bright 613 708 783 798 828 726 0 0 57 175 0 1 0 0 176
Corryong 275 277 279 282 248 217 0 29 62 31 0 23 0 31 85
Dartmouth 24 24 25 0 0 0 5 0 0 0 0 5
Goorambat 19 19 20 9 9 10 0 0 0 0 20 20
Harrietvi l le 61 63 65 0 0 6 6 0 0 0 6 12
Mt Beauty 315 326 337 627 627 627 0 0 0 59 0 10 0 0 69
Moyhu 28 29 30 0 0 0 1 0 0 0 0 1
Myrtleford 549 569 596 802 741 677 0 0 0 30 0 13 0 0 43
Oxley 88 100 115 0 0 0 42 0 1 0 0 43
Walwa 17 17 17 0 0 0 3 0 0 0 0 3
Wangaratta 3,203 3,409 3,657 0 0 65 183 0 237 0 65 485
Whitfield 15 15 15 0 0 0 0 0 0 0 0 0
Yackandandah 119 130 145 205 205 205 0 0 0 7 0 18 0 0 25
Bel lbridge 52 74 91 0 0 0 0
Eskdale 8 8 8 0 0 0 0
Tal langatta 586 645 719 14 0 0 0
Wahgunyah/
Rutherglen185 191 194 45 0 0 0
Wodonga 5,499 6,423 7,511 376 0 320 0
Yarrawonga 1,384 1,855 2,458 147 0 169 0
Total 14,833 16,830 19,210 17,230 17,765 16,123 9 38 908 1,271 0 830 113 122 2,336
Approaches to balance Supply and Demand (ML/yr)
Delivery
System
Performance
Demand
Management
One
Resource
Using
Water
Markets
Secure
Water
Source
Total
Indeterminate1
System
Unrestricted Average Annual Demand
(ML/yr)
Yield under median Climate Change
Scenario (ML/yr)
Nominal Additional Water or Savings
Required (ML/yr)
Insufficient data
Insufficient data
Indeterminate 1
Indeterminate 1
Insufficient data
Indeterminate 1
Indeterminate 1
10,888 11,588 10,266 0 0 708 113 1,184

Water Supply Demand Strategy – Summary 2012
Page 21
5 References
Department of Planning and Community Development (DPCD), State Government of Victoria, 2011,
Melbourne, Victoria, viewed 11 July 2011, < http://www.dpcd.vic.gov.au/home/publications-and-
research/urban-and-regional-research/Regional-Victoria/towns-in-time>.
Department of Planning and Community Development (DPCD), State Government of Victoria, 2011,
Melbourne, Victoria, viewed 11 July 2011, < http://www.dpcd.vic.gov.au/home/publications-and-
research/urban-and-regional-research/metropolitan/victoria-in-future-2008/2009-urban-and-regional-forums-
victoria-in-future-2008-population-projections>.
MDBA (2010) Guide to the Basin Plan.
MDBA (2011) Proposed Basin Plan.
North East Water (2007) Water Supply Demand Strategy.
North East Water (2011) Drought Response Plan.
North East Water (2007) Water Plan 2008 – 2013.
Victorian Water Industry Association (2005) Victorian Uniform Drought Water Restriction Guidelines. Final.
Victorian Water Industry Association (2011) Victorian Uniform Water Restriction and Permanent Water Saving Rule Guidelines - Outcome of the Review of Victoria’s Approach to Water Restrictions and Permanent Water Saving Rules. Position Paper. FINAL. 23/09/2011

Water Supply Demand Strategy – Summary 2012
Appendix 1: Project Team and Water Plan 3 Reference Group
North East Water Project Team
Business Unit Member Position
Corporate Services Ascher Derwent One Resource Project Officer
Corporate Services Dr Tim Clune Manager Sustainability and Risk
Customer and Financial Services John Morris Manager Customer and Community
Customer and Financial Services Michael Sinclair Contract Services Officer
Customer and Financial Services Naomi Laauli Acting Manager Customer Service
Customer and Financial Services Nicholas Moore Manager Finance
Operations Alister Laidlaw Water Systems Coordinator
Operations Jason Mullins Systems Improvement Manager
Planning and Infrastructure Charlie Bird Senior Engineer – Strategic Planning
Planning and Infrastructure Kevin Freeman Executive Manager Planning and Infrastructure
Planning and Infrastructure Les Ryan Manager Strategy and Development
Water Plan 3 Reference Group
Member Community
Frank Burfitt Reference Group Chair – North East Water Board of Directors
Steve Bird North East Water Board of Directors
Neil Ward Chiltern – Indigo Shire region
Rosie Scott Yarrawonga – Moira Shire region
Dr John Charles Yarrawonga – Moira Shire region
Ben Fryer Wodonga – City of Wodonga region
Michelle Cowan Wodonga – City of Wodonga region
Geoff Dinning Wangaratta – Rural City of Wangaratta region
Grant Jones Wangaratta – Rural City of Wangaratta region
Jim Bates Bright – Alpine Shire Council region
Cr Peter Davis Benalla – Rural City of Benalla region
Mark Chadwick Major Industry representation