Water Supply and Sanitation Sector Monitoring Report 1990 · 820 INT92 Water Supply and Sanitation...
46
820 INT92 Water Supply and Sanitation Sector Monitoring Report 1990 (Baseline Year) Wprld Health Organization (WHO) Water Supply and Sanitation Collaborative Council United Nations Children' 1 ^ Fund
Transcript of Water Supply and Sanitation Sector Monitoring Report 1990 · 820 INT92 Water Supply and Sanitation...

820 INT92
Water Supply andSanitation Sector Monitoring
Report 1990(Baseline Year)
WprldHealth
Organization(WHO)
Water Supplyand SanitationCollaborative
Council
United NationsChildren'1^
Fund

•;. 141/142•:;.:;gu»
Wafer Supply and Sanitation SectorMonitoring Report 1990
(Baseline Year)7Tiis publication contains maps, charts and tables developed from preliminary 7 990 baseline
data on sector coverage, management and funding, which were kindly provided by thosecountries listed in Table 1 on page 9. As 7990 was the first time that the WASAMS (Water andSanitation Monitoring System) format was used by governments to assess the status of the sector,
caution should be exercised in its interpretation due to the preliminary nature of the data. It is,however, hoped that both data quality, accuracy and reporting will improve over time as a
result of the recent and future planned monitoring capacity building workshops (for country levelpersonnel) being undertaken with WHO and UNICEF assistance.
The boundaries and colour maps used in this publication do not imply any judgment on the legalor other status of any territory, endorsement or acceptance of any boundary,
or guarantee of the accuracy on the part of WHO and UNICEF.
Published November 7 992. ® Printed on recycled paper.
Table of ContentsForeword ,. HiExecutive Summary 1I. Sector Overview ...........................................3
Main Lessons of the 1980si...."... 4General Lessons 4Specific Monitoring Lessons 4Need for Enhanced Sector Monitoring 4Response to the Needs 5
II. Strategies of the Monitoring Mechanism 6Starting with Simple Core Indicators., óThe "Open-ended" System 7Strengthening Country-level Capacities for Sector Monitoring 7Data Collection Mechanisms 7Data Processing, Analysis and Reporting 7
III. Analysis of Baseline Year Results ....8Representativeness of 1990 Data ...8Coverage ,.,.........,.,,. 10The Need for Increased Focus upon Marginal Urban Areas 10Meeting Basic Needs through More Aggressive Promotion
and use of Appropriate Low-Cost Technologies 10Management 12Community Contribution to Operation and
Maintenance Costs 12
Funding 12Investments in the Sector .: 12A Hidden Message 75Analysis by Geographic Sub-groupings 75
IV. Framework for Improved Sector Planning 20Linkage Between Sector Monitoring, Planning
and Advocacy 20Framework for Monitoring in the Context of Goal Setting.... 20Meeting the Challenge 20
V. Conclusion 24
Annex I: Participants of Workshops whoContributed to the JMP Effort ..............25
Annex II: Milestones and Achievementsof the JMP 29
Annex III: Indicative Technology Categoriesand their Respective Costs 30
Annex IV: Additional Maps and Tables 31Annex V: Generic Guidelines for Sector Monitoring
at Country Level 39
WHO/UNICEF Joint Monitoring Programme • i

Maps, Tables, Figures and Boxes
MapsM a p I .. ' . . . •••• . . •••• .••• . • . ; :••• " • . : : . • • • • • • V
WASAMS 1990: Countries Reported.. ...8M a p 2 "•'• • : " • : / :;
• ; . : . • •'. '
Safe Water Supply: Total population with accessto functioning safe water supply . . 11
Map 3Sanitation: Total population with access to adequate
excreta disposal . . . . . . ; , . . . , , , . . , ; . . , . , , . „ . . , . . . . . . .......;.......... 11Map 4 ' :' "•'•' " ' .: .; ;:. ' / ' ' '•'•[
Safe Water Supply: Totalurban population withaccess to functioning safe water supply ..,.,... 31
M a p 5 :. ' • ] ' y : ': " - :: ; '. • ;.. • • ' : : : ' •' ::'.;.": '
Safe Water Supply: Total rural population with accessto functioning safe water supply 31
M a p 6 • ; / • '..;':'. . . - . • : . • : 1 . : • ' • • • ' . • '.
Sanitation: Total urban population with access toadequate excreta disposal.. .................32
M a p 7 './;'••:...': : .'• ^ . ^ . ' • . • Ï ,.••. V
Sanitation: Total rural population with access toadequate excreta disposal ., ...;.32
TablesT a b l e 1 : ; • • • • ' • ; : : .•;, .• • • / : •'• . . " ': . ¡ W :
Countries Reporting (by UN Economic Commission Region)........ 9
T a b l e 2 ' • • " • . . . ; • • , ; . . • ' • • : . • ; : : : : ; ' ' , ' ' " ' •
Level of Reporting by Region (by UN EconomicCommission Region)..,.,.,...,...,.....,.... ...........9
Table 3Reporting by Information Category .............. 10T a b l e 4 . : :: • '•. : : : : ; : ' ' ' : • • > i : , \
Respondents'Ability to Provide Disaggregated Data onUrban Water Supply and Sanitation Coverage byMarginal and High Income Populations 10
T a b l e 5 '••.: , • [ ' • . / : : ' Y ? • ' • • • • ' • • " ' ' . ' • ' > . . • . , ) • : • .
Respondents'Ability to Provide a Breakdown of ServiceCoverage by Different Technologies ,i — 12
T a b l e é ': '. • •• . •'•/ . •.'.': ; ' '•'"':••
Global Access to Water and Sanitation 12Table 7Africa: Total Water Supply- Urban and Rural Combined 33
T a b l e 8 ' ; ' , ' ' ••''•'.' •• : :;.:V: :V ' • ; : .' .Africa: Total Sanitation - Urban and Rural Combined 34
Table 9Latin America & Caribbean: Total Water Supply—
Urban and Rural Combined .:.......... . . .35Table 10Latin America & Caribbean: Total Sanitation-
Urban and Rural Combined ,.,.36
Table 11Asia and the Pacific: Total Water Supply-
Urban and Rural Combined 37table 12Asia and the Pacific - Urban and Rural Combined 3 7T a b l e 1 3 ;• . . :i,". :./.' ;•.., V'- :\ ;.: :. ' , ;•. ' : . '. •West Asia - U r b a n and Rural Combined.. . . . . . . . . . . . . . . . . . . . . . . . . . . . . .38Table 14West Asia - Urban and Rural Combined . . .38
/ f i g u r e s / ....•:..•.. . •' • . . . / : • . ' \ ' i : '• •F i g u r e 1Water Supply: Proportion of Population Served by
Technology Types.................. ........ 13F i g u r e 2 :' • , : ' ' •' : • ' . • • '
Sanitation: Proportion of Population Served byTechnology Types 13
F i g u r e 3 ' ' v . . ' ' • . .• ' ' • • " ' • • • " . . ' • • • ' ~ ' • : ' .
Water Supply: Contribution to Operation andMaintenance Costs 14
Figure 4Water Supply: Contribution to Capital Investment 14F i g u r e 5 '••: ' • : • • ; • • ; • . •"•• • • . ' : • . ; . ;.•' • • " • • ; ; . '••
Sanitation: Contribution to Operation and Maintenance Costs .. 14Figure 6Water Supply Coverage by Region: Technology Types Used ..... 1 óF i g u r e 7 • • : : ' : : • • > • • • • • . ' • : ; •/'• ".'.'•• ":':-~\ • • ' . : : ' : . ;:':'::".•:'•':•.•:••,.•. :
Sanitation Service Coverage by Region: TechnologyTypes Used ......,.:...,..,....,;......:............. 18
' F i g u r e 8 . •• ; • : . • • • ' ;•• ••• . '••. . • • , ; . . . . • • ' " • : • • '
Conceptual Framework Linking Monitoring Planningand Advocacy .......;.......... ..,..,...,21
F i g u r e 9 ' ' ' : ' : : ' ' ; ; : • . . : . '••' • • ; . • • • • • • • . ' ' . ' . . ; . . . . ; •• "/•'.-'•"' : ' : .
A Framework for Goal Setting..................... ....,,...22
B o x e s . • • : ' . y . : " : . : • • • : • . : . •
• B o x . l - • : • : • • .,• • . . ; • 7 v '•'•' \ . " : ' : •' . • . [ ' • ' . • ' • • :• . . • • :.
Information Management Systems Fall into Three BroadCategories ,....6
Box 2Inadequate Cost Recovery for Water Supply 15Box 3Financial Resource Allocation is a function of Political Will........ 15Box 4Summary of Salient Points ,..,..;........................ 23Box 5Willingness versus Ability to Pay :,.,.,................,... 24Box 6The Economic Cost of Not Providing Water and Sanitation 24
ii • JMP Annual Report 1990
ForewordAccess to water supply and sanitation
services which is basic to health andi economic growth is far from satis-
factory today. In fact, to continue in the 1990swith the same policies, resource allocations,technologies and implementation rales of the1980s would result in a widening of the gapbetween the served and unserved in the rapidlyexpanding urban populations by the year2000. Where facilities are available forprovision of such services, they are more oftenthan not inadequately managed. The resourcesand funds are limited for increasing coverageto the unserved. Despite the development andpromotion of low-cost technologies, thebetter-off segments of the community havebenefited more than the poorer, largelybecause of insufficient focus on the unserved.To be different in the '90s and beyond,stronger monitoring is necessary to be awareof the present position, to plan better for thefuture and to ensure that the available re-sources and future effort are carefully chan-nelled to the more needy of assistance. Alongwith monitoring, greater collaboration andcooperation will be necessary among allconcerned, both at country level and amongstexternal support agencies to further thedevelopment of sustainable services in thesector.
The Water Supply and Sanitation Collabo-rative Council has been a strong advocate ofgood and selective monitoring. The value ofmonitoring and collaboration as prerequisitesfor better planning and greater progress isappreciated more today and has received much
emphasis at major international conferences.Two Council member agencies who have beenmost concerned and committed to the promo-tion of better water supply and sanitationservices have responded by joining forces tohelp developing countries to institute a goodquality, high utility value, monitoringprogramme.. lhe World Health Organization (WHO)has the interests of global health, the UnitedNations Children's Fund (UNICEF) has theinterests of the child (and the mother). Theresults of this collaborative effort are presentedin this report in a very informative and alsoprovocative way. Their messages are food forthought for planners and decision makers.WHO and UNICEF are to be thanked for avery valuable contribution together with thosedeveloping countries which actively partici-pated in making it possible. The CollaborativeCouncil is very pleased to distribute this reportto all its members, and to others who areconcerned with the sector not only for thevalue of the information it provides but also toacknowledge a good collaborative effort. Thereport will be produced annually to update theposition.
Margaret Catley-CarlsonChairpersonWater Supply and SanitationCollaborative Council
Better-off segments of
the community have
benefited more than
the poorer, largely
because of insufficient
focus on the unserved.
WHO/UNICEF Joint Monitoring Programme • iii

iv • JMP Annual Report 1990

Executive SummaryI nadequate management of the water and
sanitation sector during the 1970s and1980s resulted in calls for enhanced sector
monitoring from recent global internationalfora including the New Delhi Consultation,the World Summit for Children, and theInternational Conference on Water and theEnvironment. The United Nations GeneralAssembly also recognized in its resolution 45/181 of 1990 that efforts would have to bestepped up during the 1990s to "monitorservice coverage for both water and sanita-tion", and decided to review progress in thesector at its 50th session in 1995.
During the international Drinking WaterSupply and Sanitation Decade (IDWSSD),1981 -1990, WHO collected information onwater supply and sanitation coverage globallythrough its decade monitoring system knownas DEMOS. Using this information, WHOproduced a series of five publications showingthe status of the sector every few years, thelast and most recent being for 1990, entitled,"The International Drinking Water Supply andSanitation Decade: End of decade review (asat December 1990) WHO/CWS/92.12". Aspart of the IDWSSD review process, WHOand others identified the need to strengthenmonitoring at country level in recognition ofthe fact that past monitoring was a passiveprocess which did not aim to influence sectordevelopment. For the 1990s, monitoringshould play a pro-active role by being used asa management tool. To enable such an evolu-tion, a limited number of relevant indicatorshas to be employed, the frequency of monitor-ing has to be increased (to at least once ayear), and capacity for monitoring must beenhanced at national, sub-national and com-munity levels. It was in response to thoseneeds that WHO and UNICEF launched aJoint Monitoring Programme (JMP) in 1990.The last DEMOS report for 1990 and the 1990"Baseline Year" JMP report, complement eachother. Subsequent JMP yearly reports willprovide country by country data in an annexreport and also on computer diskette.
While past experience has shown thatregular monitoring is crucial to effectivemanagement, it has also demonstrated the
difficulty in monitoring many sector indicatorssimultaneously. As a result, several recentmeetings (attended by water and sanitationprofessionals from governments, externalsupport agencies and others) resulted in theidentification of three "core indicators" beingproposed as the basis for enhancing sectormonitoring in the 1990s. These indicators havebeen incorporated in a computer monitoringprogramme named WASAMS (water andsanitation monitoring system). They arecoverage, management and funding. How-ever, cognizant of the fact that at regional, sub-regional, and especially at country level, otherspecific indicators may be identified orrequired, the expansion of monitoring systemsbeyond the "core indicators" is thus foreseenand catered for in the programme.
The focus of WHO and UNICEF supportthrough the JMP is to strengthen sectormonitoring capacity at country level. Measuresbeing taken to this effect include the organiza-tion of regional monitoring workshops; inter-ministerial meetings to strengthen sectorcoordination; establishment of nationalmonitoring units (NMU) within the appropri-ate government structure(s); determination ofrealistic sector goals; and establishment ofeffective frameworks for sector monitoring.Governments are also being urged to buildupon and optimize existing data collectionsystems rather than create new ones.
The manual completion of sector monitor-ing forms at country level is being computeraided via WASAMS for data aggregation,processing, analyses and reporting. This isbeing done initially at national level in order toobtain data for the baseline year. However, butmore importantly, governments and otheragencies involved in the sector are stronglyencouraged by the JMP to simultaneouslysupport (with resources and training) monitor-ing initiatives from the grass roots (commu-nity) level upwards.
In this report only the "core indicators" areanalyzed; however, other achievements/constraints and activities related to global andregional promotion of the water and sanitationsector are also featured. This report is essen-tially aimed at policy and decision makers at
Inadequate
management of
the water and
sanitation sector during
the 1970s and 1980s
resulted in calls for
enhanced sector
monitoring from recent
global international
fora.
WHO/UNICEF Joint Monitoring Programme • 1

The preliminary data
available indicate that
governments are
subsidizing services to
high-income populations
by as much as 70
percent of the operation
and maintenance costs.
the national level but also their counterparts inExternal Support Agencies (ESAs) with theobjective of highlighting the importance ofpro-active monitoring as a management toolfor the 1990s. It also serves to focus on theinequities and disparities existing in the sectoras we enter the last decade of the currentcentury.
Through enhanced monitoring capacity atcountry level, it is hoped that similar reportingwill take place. This should spur advocacyinitiatives for increased resource allocationand restructuring aimed at more equitablesector development in the near future.
The 1990 "Baseline Year" report is thefirst in a scries of yearly reports to be madethroughout the 1990s. It will be used as abenchmark to monitor progress of sector goalstowards "universal access" to water supplyand sanitation. The report utilizes for the firsttime the WASAMS format which was used by70 countries out of a total of approximately130 who received the questionnaire in late1990 to assess the status of their sector. Ananalysis of these questionnaires and subse-quent recommendations are put forward.
The disaggregation of urban populationinto high-income (or more affluent urban) andurban marginal substantiated that a consider-able disparity exists between high-incomeurban and marginal urban populations regard-ing their access to services. Likewise, thedisaggregation of coverage into differentlevels of service has provided planners withmore objective information whilst, at the sametime, highlighting the existence of disparitiesin resource allocations. The latter indicatesclearly that despite the aggressive promotionin the 1980s of an array of low-cost options toprovide services to the unserved, these haveyet to be seriously considered by governmentsand external support agencies.
There is broad-based evidence of inad-equate policies on cost recovery which haveled to large capital outlays for rehabilitation ofhigh-cost systems, mostly to benefit the better-off. Governments tend to concentrate theirsector investments on new systems and in therehabilitation of existing systems in urbanareas, with a clear bias towards high-costsystems. External support agencies (ESAs)almost match investments by governments insuch areas. The ESAs do, however, alsosupport programmes in rural areas.
The preliminary data available indicate thatgovernments arc subsidizing services to high-income populations by as much as 70 percentof the operation and maintenance costs. Mean-while evidence exists indicating that marginalurban communities are very willing to contrib-ute to operation and maintenance costs.
An alternative approach for the efficientutilization of scarce resources is urgentlyrequired. Tt is paramount that governments andESAs see resource allocations to the sector inthe context of economic investments fordevelopment, rather than social expenditures(see Box 3, page 15, and Box 6, page 24).Such an approach would necessitate therestructuring and reallocation of sector re-sources, and the forging of government andcommunity partnerships for: capacity buildingat community level for management of ser-vices; the promotion and use of appropriatelow-cost technologies; and the establishmentof affordable backup support systems for spareparts and maintenance to ensure sustainabilityof services, especially in marginal urban andrural areas where most of the unserved reside.
A strong synergistic effect between sectormonitoring, planning, and advocacy has beenrecognized as the basis to accelerate water andsanitation service coverage in the 1990s.Enhanced sector monitoring can pave the wayfor improved sector planning. It can alsoprovide the basis for public information andadvocacy campaigns from community level upto national level, which, in turn, can generatethe momentum towards the attainment ofobjectives.
The gap between current service coverageand the ultimate objective of "universal ac-cess" is very large in many developing coun-tries. Planning (and monitoring as a manage-ment tool) can therefore be of assistance to thesector only if goals are realistic. A sectormonitoring framework is thus necessary to en-hance the planning process. It comprises a situ-ation analysis of sector policies, estimation ofthe resource base, selection of technology andstrategy options and setting of sector goals.
The final portion of this report offers aconceptual framework for sector professionals,policy and decision makers (at all levels) tofacilitate development of pragmatic plans ofaction from community level up to nationallevel, i.e., national plans of action. ®
2 • JMP Annual Report 1990

I. Sector OverviewOn 10 November 1980, the United
Nations Genera! Assembly pro-claimed the period 1981-1990 as the
International Drinking Water Supply andSanitation Decade (IDWSSD). The primarygoal then envisaged for the decade was theattainment of full access to water supply andto sanitation by all inhabitants in the develop-ing countries by the year 1990.
In fact, the IDWSSD provided access foran additional 1,347 million people to safewater supplies, and sanitation facilities forsome 748 million. However, despite thesemajor accomplishments, over 1,200 millionpeople, 30 percent of the developing world'spopulation, still lacked access to safe waterand 1,700 million (40 percent) were withoutadequate sanitation at the end of the decade,according to a World Health Organization(WHO) evaluation of IDWSSD, which wasprepared in 1990. The majority of thesedeprived people reside in rural regions and inlow-income, marginal urban areas of develop-ing countries.
With this in mind, the developing countriesand the External Support Agencies (ESAs)reached a broad consensus to continue theexisting thrust of the IDWSSD beyond 1990and to harness that drive to coincide with thegoal of "Health for All by the Year 2000".
The United Nations General Assemblyrecognized that efforts would have to bestepped up during the 1990s if safe watersupply and adequate sanitation facilities for allwere to be the goal by the end of the century.General Assembly resolution 45/181 urgedgovernments to stress key objectives, andagreed to review progress made in the provi-sion of water and sanitation services at its 50thsession in 1995.
One major constraint to achieving thesegoals in many developing countries is thelarge size and complexity of the water andsanitation sector. The problem is furthercompounded by the wide range of institutionsand organizations that frequently vie with oneanother at the expense of collaborativeendeavours, thus highlighting the urgent needfor better coordination within the overallsector. Joint sector monitoring for enhancedplanning and advocacy offers one approach
that might lead to improved coordination andcooperation throughout the sector.
Significant progress was achieved duringthe 1980s with the rediscovery and improve-ment of various simple and low-cost water andsanitation technologies. This progress couldnot have been achieved without communityparticipation, especially the involvement ofwomen in the decision-making, planning andmanagement phases, initiatives ranged fromthe UNDP/World Bank project on handpumpsand publication of the UNCHS-HABITATmanual on "The Design of Shallow SewerSystems" to the promotion of ventilatedimproved pit (VIP) latrines by the BlairInstitute of Zimbabwe. Two nations whichepitomized such an approach by dint of theirlarge scale application of low-cost handpumptechnologies in the 1980s were India andBangladesh. Their example notwithstanding,most developing countries have yet to convertand switch to the large scale use of low-costtechnologies and community participatoryefforts to accelerate service coverage amongtheir unserved populations.
While the IDWSSD accomplished much inthe period 1981-1990, continuation of a"business as usual" approach, drawing on thesame policies, resources and technologies andinvolving the same rate of coverage as appliedin the 1980s, could only prolong, beyond theyear 2000, the goal of "universal access". Bythe year 2000, the gap between those withwater and sanitation services and those lackingthem will have increased significantly. Thisholds especially true for urban areas wherepopulation growth rates are highest and thedisparity between rich and poor is growing.
Numerous appeals in the 1980s highlightedthe urgent need to respond to the chronic lackof basic water and sanitation services for therapidly expanding, low-income, marginalizedurban populations. Little progress was made.These indigents frequently live under the worstenvironmental conditions imaginable, withinsufficient or no access at all to safe watersupplies and/or sanitary facilities. In addition,they often have to pay exorbitant prices forvery limited quantities of water of question-able quality, at costs which can represent asmuch as 20 percent of a family budget1. In
The primary goal then
envisaged for the
decade was the
attainment of full access
to water supply and to
sanitation by all
inhabitants in the
developing countries by
the year 1990.
WHO/UNICEF Joint Monitoring Programme • 3

The urgent need to
improve and strengthen
sector monitoring and
information
management has been
put forward and
documented on several
different occasions.
stark contrast, services to their wealthier urbanneighbours are heavily subsidized and ofrelatively high quality.
The health and productive capacity ofmillions of individuals and households,hundreds of thousands of communities, andsome 70 developing nations is already seri-ously constrained in the absence of these vitalwaler and sanitation services. To furtherpostpone addressing these two basic needsmight create a greater imbalance. The absenceof a suitable, workable monitoring system tofocus attention on those in need only serves tomask the disparities between the two groups.The introduction of such a monitoring systemwould also focus greater attention on theurgent need to optimize water and sanitationsector investments to redress the imbalance.
Main Lessons of the 1980sDespite progress made in developing mod-
els for the sustainable development of waterand sanitation programmes in rural and peri-urban areas, greater efforts are required tomake them workable in practical terms, espe-cially if the rapid acceleration of sustainablecoverage is to be assured. Greater progressmight also have resulted if systematic manage-ment principles had been applied to the waterand sanitation sector during the 1980s.
General Lessons:• Low-cost technology projects in develop-
ing countries receive as little as 4 percentof the estimated total annual external fund-ing of $3,000 million devoted to the waterand the sanitation sector according toWHO statistics of the 1980s. Meanwhilethe firm commitment of developing coun-tries to such projects is indicated by a six-fold increase in their funding since 1980.
• Nearly all developing countries lack sys-tematic action plans offering guidelines formethodical approaches to sectoral activities.
• Women's involvement in decision making,planning and management, crucial for effec-tive community participation, has been nei-ther systematically encouraged nor applied,but is, at best, pursued on an ad hoc basis.
• The promotion and acceptance of cost-sharing mechanisms, including cost recov-ery schemes for operation and mainte-nance, etc., face formidable resistance at
government and consumer levels in somecountries, given the widely accepted normto consider water as "a free commodity",and are difficult to put in practice at thecommunity level,
• Maintenance still poses significant prob-lems, regardless of the appropriateness ofthe technologies concerned. The problemsrelate mainly to sustainable funding for theprovision of spare parts, lack of sufficientbackup services, and poor support for ca-pacity training at community level.
• The lack of trained professional and sub-professional personnel within the sectorhampers efforts in the developing countriesto upgrade the sector and related services.
Specific Monitoring Lessons:• Most developing countries are ill-equipped
to monitor many sector indicators simulta-neously, especially if the indicators are them-selves not easily measurable to begin with.
• In many countries, crude "guesstimating"of sector status, usually by one centralizeddepartment/ministry, acting independentlyof other partners in the water and sanitationsector, has inhibited or discouraged the useof sector monitoring as a management tool.
• The sector has not effectively used simplemeasurable indicators suitable for the kindof "pulse taking" essential to providingplanners and decision makers with relevantinformation.
• The devolution of responsibilities, monitor-ing included, to the community level is notbeing actively pursued in spite of the strongcorrelation between such action and sectorsustainability. Through enhanced monitor-ing it is possible to make optimal use ofsuch data for more equitable resource allo-cation, planning and management.
Need for Enhanced Sector MonitoringThe urgent need to improve and strengthen
sector monitoring and information manage-ment has been put forward and documented onseveral different occasions. The New DelhiConsultation sponsored by the United NationsDevelopment Programme (UNDP), the WorldSummit for Children organized by UNICEF,the Declaration of Puerto Rico spearheadedby the Pan American Health Organization
4 • JMP Annual Report 1990

(PAHO), all of which took place in September1990, and the United Nations Secretary-General's report to the 45th General Assem-bly in 1990 on the "Achievements of theTDWSSD 1981-1990", all indicated the needto "monitor service coverage for both watersupply and sanitation". As recently as January1992, the need to enhance sector monitoringwas again raised, this time at the InternationalConference on Water and the Environment(ICWE) convened by the World Meteorologi-cal Organization (WMO), on behalf of theUnited Nations Administrative Committee onCoordination and the Intcrsecretariat Groupfor Water Resources (ACC/ISGWR), in Dublin.
Efforts to monitor the sector in the 1980slacked the means to regularly and systemati-cally track progress in the use of low-costtechnologies, allocation of sector funding, orsustainability through community involve-ment. Therefore, it is essential to devisebroadly representative and acceptable indica-tors to serve as yardsticks by which progresscan be measured, if the water and sanitationsector is to meet the goals set for the 1990s.
If monitoring is to function as a manage-ment tool, it should reflect the following threesteps in a cyclical manner:
Assessment of the current sector situation;Analysis of the constraints affecting sector
acceleration and the identification of potentialways to overcome these limitations;
Action in response to the foregoingassessment and analysis.
The current monitoring initiative permitsassessment of the current sector situation,analysis of the constraints and opportunitiesfor overcoming these, and action based on theassessment and analysis. While allowing forthe disaggrcgation of statistics on servicecoverage for "high income" (urban) and "lowincome" (marginal urban) and rural popula-tions, the system also provides an indicator forassessing technology application and commu-nity involvement.
Response to the NeedsGiven the clear-cut demand for improved
sector monitoring, the World Health Organiza-tion (WHO) and the United Nations Children'sFund (UNICEF), responding to the GeneralAssembly's decision to review progress in thesector at its 50th session in 1995, decided toincorporate the strengthening of sector man-agement through monitoring into their joint
water and sanitation activities which were al-ready in progress. The two agencies launcheda Joint Monitoring Programme (JMP) forthe sector in 1990.
The JMP was established primarily toprovide support to developing countries basedon the demand for enhancing monitoringcapacity at country level. This initiative is afirst step in what is envisaged as a muchbroader participatory venture involving othermultilateral and bilateral agencies, govern-ments, non-governmental organizations(NGOs) and, most importantly, the communi-ties themselves.
.Sector monitoring is linked to sector-ac-tion-planning comprising the establishment ofrealistic goals and the mechanism and strate-gies to achieve these. Monitoring involves thestrengthening of national data collection pro-cesses and networks, and also systematic as-sessment, analysis and responsive action, in-cluding corrective and timely measures totackle problems. Thus monitoring is placedwithin the broader context of country-levelsector management and capacity building.
Meeting the challenge of "universalaccess" to water and sanitation by the year2000 necessitates frequent and systematicmonitoring of a limited number of measurablecore indicators to track progress.
By gradually working from the nationallevel downwards and simultaneously fromcommunity level upwards, the calibre of ac-quired data can be expected to improve in ac-curacy over time.
Aggregation of all information can beundertaken by computer at central level. Tntime, such aggregation and local data process-ing, analysis, and reporting might also bedecentralized. This would enable provincial, aswell as national authorities to regularlyappraise sector performance and subsequentlytake remedial actions as necessary and appro-priate. Sector monitoring would thus becomeclosely linked to both sector planning andinformation management.
Enhanced sector management would meanthat existing resources would be more effi-ciently used. This outcome can be used foradvocacy at national and international levels,to attract more resources for acceleration ofsector coverage. ®1 Urban Example - Prospective for the Future(Water .Supply and Sanitation to Urban MarginalAreas of Tegucigalpa, Honduras), UNICEF.
Efforts to monitor the
sector in the 1980s
lacked the means to
regularly and
systematically track
progress in the use of
low-cost technologies,
allocation of sector
funding, or
sustainability through
community
involvement.
WHO/UNICEF Joint Monitoring Programme »5

H. Strategies of theMonitoringMechanism
Starting With Simple Core Indicators
A previously noted, a simple monitoringapproach would facilitate regular andL systematic sector management at
several levels. Responding to this need, theJMP facilitated a series of meetings attendedby water and sanitation professionals fromGovernments, External Support Agencies(ESAs) and others. Their discussions yieldedthe following three "core indicators":
Coverage: Quantifies the population servedwith different systems ranging from householdwater and sewerage connections, to hand-pumps and improved pit latrines.
Management: Seeks to quantify thecontribution made by users, beneficiaries orcommunities to operation and maintenance(O&M) costs. This management indicatorattempts to put a monetary value to commu-nity inputs for operation, maintenance and
management. Although it is recognised thatsuch a proxy indicator cannot satisfactorilyreflect the total spectrum of community inputs,it is however, hoped to improve the monitoringof community management over time.
Funding: Used to estimate the total fundsinvested in the sector and to determine theproportion of investments made in low-costtechnologies. Information obtained from dataon funding will assist decision makers tomonitor whether investments for the unservedpopulations are adequate and what policychanges are needed.
Information management systems fall intothree broad categories (see Box 1 ). The initialpurpose of this report aims to provide policymakers and planners with a macro picture ofthe sector using the three core indicators. It ishoped that through this process the needs ofthe sector will be firmly established on the
B O X 1Information Management Systems
Fall into Three Broad Categories
i Electronic data processing (EDP) is, simply put, theelectronic processing of routine operations such as billing,water loss computation, inventory, personnel, etc. The objectiveis to achieve an increased efficiency of existing operations.
i Management information systems (MIS) entails theaggregation of information from the EDP level for operationaldecision making — that is, project level management andenhanced metering, technology choice, reallocation ofresources at project level, etc. MIS requires specific and detailedinformation.
i Decisions support systems (DSS) are designed tofacilitate the process of decision making at the strategic andpolicy making level. DSS are not necessarily directly related toexisting and ongoing operations or institutions; they also seek toprovide information on areas not covered by ongoingoperations. This implies that a significant portion of theinformation generated at the MIS/EDP levels is of little use atthe DSS level. Additionally, information from non-registered ornon-formal agencies, such as those operated by church groups,local NGOs, etc., may also feed into DSS. One could add tothis extra-operational category of data (EOD) socio-economic,demographic and epidemiological information.
The following diagram may help to illustrate theinter-relationship between these categories ofinformation management systems.
Conceptual Diagramof Information Management Systems
Strategic/PolicyInformationManagement
OperationalInformation
Tj. Management
EDP: Electronic Data Processing*MIS: Management Information Systems*DSS: Decisions Support SystemsEOD: Extra Operational Data (JMP Terminology)* Operational Information Management
The Water and Sanitation Monitoring System (WASAMS)developed by the JMP is intended as a DSS.
6 • JMP Annual Report 1990

political agenda for responsive positive action.This acknowledges the fact that informationalone does not necessarily lead to change.Therefore, follow-up action by sector profes-sionals, other partners and communities fromgrass root level upwards is necessary tofacilitate change.
The "Open-ended" SystemThe Water and Sanitation Monitoring Sys-
tem (WASAMS) currently operates manuallyvia (hard copy) questionnaires. However, itscomputerization is now refined to provide an"open-ended" facility, or simple user-friendlyutility for developing country-specific indica-tors and their parameters. This in-built open-ended monitoring system allows the "core" in-dicators to remain unchanged whilst simulta-neously facilitating the inclusion, on a demandbasis, of specific indicators identified at re-gional, sub-regional, country, sub-national andcommunity levels. It is thus foreseen that theexpansion of monitoring systems beyond the"core" indicators can be facilitated at all levels.
Strengthening Country-levelCapacities for Sector Monitoring
Currently, several countries are beingsupported in their efforts to strengthen andenhance country-level monitoring. Measuresinclude organizing regional monitoringworkshops; facilitating interministerialmeetings to strengthen sector coordination;setting up national monitoring units (NMUs);assessing and analysing the sector status;setting sector goals, and establishing a frame-work for sector monitoring.
Several countries, including Burundi,Jamaica, Togo and Nigeria have alreadyestablished NMUs and are proceeding withsub-national data collection to facilitate futureplanning. Moreover, the participants of the lastthree Regional Monitoring Workshops (heldin Jamaica, Swaziland and Benin) recom-mended and put forward a set of genericguidelines for sector monitoring at country level(see Annex V).
Data Collection MechanismsAn array of data retrieval systems already
exists that can be utilized at country level.These systems include census, householdsurveys, sentinel sites that comprise fixed sitesfor routine household level data gathering, and
routine reporting through government adminis-tration networks. Ideally governments shouldoptimize such systems for sector data collec-tion rather than create new ones. Consequentlysuch systems should be adjusted for relevanceto the data collection needs of the water andsanitation sector and should be designed torespond to the same relevant questions re-quired by the sector, given that such surveysare conducted at different times, with differentgeographical spreads and possibly withvarying degrees of accuracy.
Harmonizing the different existing datacollection systems would help overcome anenormous hurdle. Moreover, the cost effective-ness of data retrieval would have been greatlyenhanced. Complementary or alternativemonitoring mechanisms should also be consid-ered wherever needed.
Data Processing, Analysisand Reporting
While computerized data aggregation canbe undertaken initially at the central level, re-sponsibility for such data collection should beencouraged and supported at sub-national andcommunity levels to facilitate an upward flowof relevant data to national level. This ap-proach would also apply to data analysis andreporting. Annual reporting would keep policyand decision makers abreast of progress maderegarding targets set for any particular year.The system would also facilitate decision mak-ing on sector funding, generating relevant in-formation, as needed, including more accurateand reliable data as to which areas might be ingreatest need. However, monitoring via (hard-copy) questionnaires will take place until com-puterized systems are established at countrylevel, and will continue to be used at the sub-national level for some time. Nonetheless, ifaffordable, the use of simple computers shouldbe strongly encouraged at sub-national levelsin order to enhance monitoring capacity at thelowest possible tier. Therefore computer pro-grammes should only be considered as tools tosupport monitoring in this context.
External reporting beyond the country,while limited to the "core indicators", wouldfeature in the proposed annual reportingsystem, which would also register otherachievements and activities related to globaland regional promotion of the water andsanitation sector. ®
Annual reporting would
keep policy and decision
makers abreast of
progress made
regarding targets set
for any particular year.
WHO/UNICEF Joint Monitoring Programme • 7

IE. Analysis ofBaseline Year Results
M A P 1
WASAMS-1990
CountriesReported
For a complete list ofcountries, see Table 1,
Representativeness of 1990 Data
Data used in this 1990 global report werederived from material provided by
Governments who participated in theglobal reporting effort, and are indicated inTables 1 and 2.
The baseline year of 1990 was the firsttime in which the Water and SanitationMonitoring System (WASAMS) format wasused by countries in assessing the status oftheir sector. Oí the approximately 130 coun-tries to receive the questionnaire in early 1991,70 countries responded; a return rate of 54%.Many of the others were unable to completethe questionnaires because they had insuffi-cient sector data, a clear indication of the needfor country level support to improve sectormonitoring and information systems. The1990 data are based on the sector status as at31 December 1990. The annual report onsubsequent years will also be based on thesituation as at 31 December of each year.
The ability of countries to complete thedifferent parts of the questionnaire, i.e.,Coverage, Management, and Funding, variedconsiderably. Most countries were able tocomplete the questions on coverage, while
around 75 percent of those reporting wereunable to provide much information on thefunding and management aspects of the sectorat this point in time (Table 3).
For comparability at global level, theanalysis in this report is made according to theUnited Nations (UN) Economic CommissionRegional sub-divisions (Table 2).
Although the majority of reporting coun-tries had least difficulty in completing the firstpart of the questionnaire dealing with cover-age, many were unable to provide disaggre-gated information for urban high-income andmarginal urban populations (Table 4). Thiswas not surprising, given that past monitoringpractices had omitted any breakdown of urbanpopulation into such categories. Initial difficul-ties in defining and quantifying these catego-ries were not unanticipated. The indicativedefinitions proposed by the .IMP for thisbreakdown are:
Urban (High-income) Populations: arepopulations perceived locally to have access toa good standard of dwelling expressed inphysical terms, safe water supply and sanita-tion; and other services such as health andpublic transport.
8 • JMP Annual Report 1990
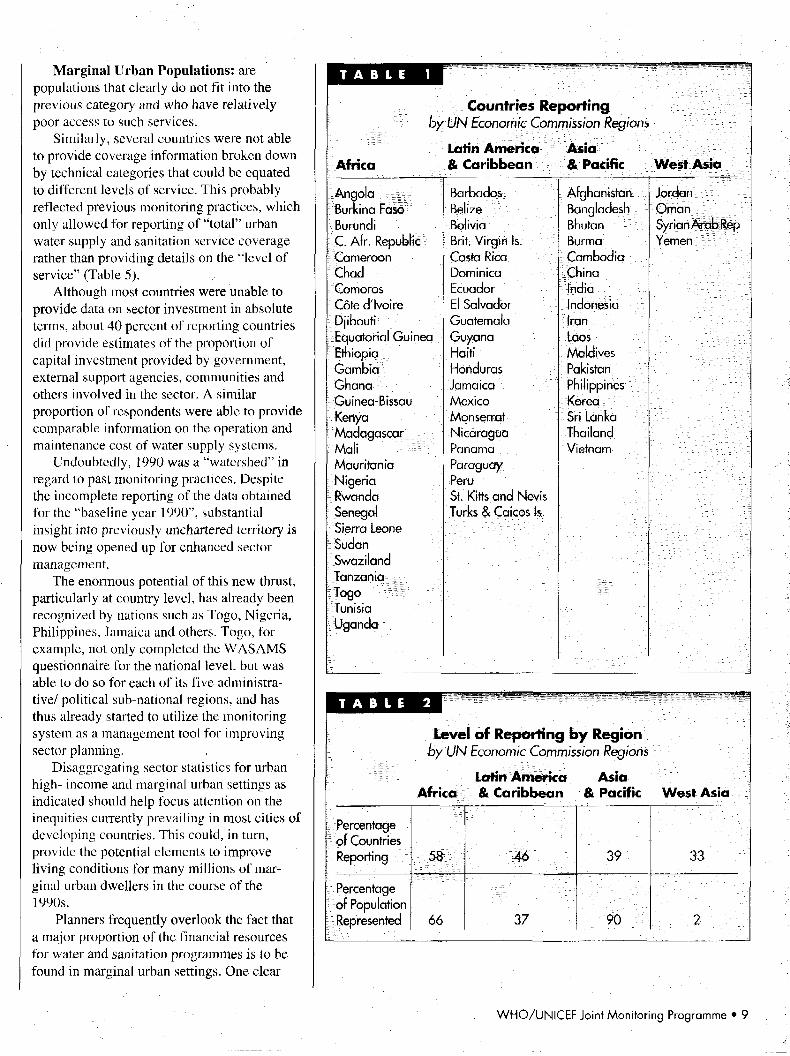
Marginal Urban Populations: arepopulations that clearly do not fit into theprevious category and who have relativelypoor access to such services.
Similarly, several countries were not ableto provide coverage information broken downby technical categories that could be equatedto different levels of service. This probablyreflected previous monitoring practices, whichonly allowed for reporting of "total" urbanwater supply and sanitation service coveragerather than providing details on the "level ofservice" (Table 5).
Although most countries were unable toprovide data on sector investment in absoluteterms, about 40 percent of reporting countriesdid provide estimates of the proportion ofcapital investment provided by government,external support agencies, communities andothers involved in the sector. A similarproportion of respondents were able to providecomparable information on the operation andmaintenance cost of water supply systems.
Undoubtedly, 1990 was a "watershed" inregard to past monitoring practices. Despitethe incomplete reporting of the data obtainedfor the "baseline year 1990", substantialinsight into previously unchartered territory isnow being opened up for enhanced sectormanagement.
The enormous potential of this new thrust,particularly at country level, has already beenrecognized by nations such as Togo, Nigeria,Philippines, Jamaica and others. Togo, forexample, not only completed the WASAMSquestionnaire for the national level, but wasable to do so for each of its five administra-tive/ political sub-national regions, and hasthus already started to utilize the monitoringsystem as a management tool for improvingsector planning.
Disaggregating sector statistics for urbanhigh- income and marginal urban settings asindicated should help focus attention on theinequities currently prevailing in most cities ofdeveloping countries. This could, in turn,provide the potential elements to improveliving conditions for many millions of mar-ginal urban dwellers in the course of the1990s.
Planners frequently overlook the fact thata major proportion of the financial resourcesfor water and sanitation programmes is to befound in marginal urban settings. One clear
T A B L E 1
Countries Reportingby UN Economic Commission Regions
AfricaLatin America& Caribbean
Asia& Pacific West Asia
AngolaBurkina FasoBurundiC. Afr. RepublicCameroonChadComorosCôte d'IvoireDjiboutiEquatorial GuineaEthiopiaGambiaGhanaGuinea-BissauKenyaMadagascarMaliMauritaniaNigeriaRwandaSenegalSierra LeoneSudanSwazilandTanzaniaTogoTunisiaUganda
BarbadosBelizeBoliviaBrit. Virgin Is.Costa RicaDominicaEcuadorEl SalvadorGuatemalaGuyanaHaitiHondurasJamaicaMexicoMon serrâtNicaraguaPanamaParaguayPeruSt. Kitts and NevisTurks & Caicos Is.
AfghanistanBangladeshBhutanBurmaCambodiaChinaIndiaIndonesiaIranLaosMaldivesPakistanPhilippinesKoreaSri LankaThailandVietnam
JordanOmanSyrian Arab Rep.Yemen
T A B L E
Level of Reporting by Regionby UN Economic Commission Regions
Latin America AsiaAfrica & Caribbean & Pacific West Asia
Percentageof CountriesReporting
Percentageof PopulationRepresented
58
ÓÓ
46
37
39
'••• • • • 9 0 • • - v :
• . • • • • • • . • • . • .
33
.:
: ' . : . ' 2 ' • ; ; . ; • • • '
WHO/UNICEF Joint Monitoring Programme • 9

indicator in support of this is the exorbitantproportion of such household incomes cur-rently expended by families for low qualitybasic services in the sector. It is hoped thatplanners and decision makers will make use ofthe JMP funding indicator to identify suchcommunity-level potential for the accelerationof sector coverage.
T A B L E
Reporting by Information Category
Proportion ofQuestionnaires
Completed
Number of Countries Reporting
Coverage Management Funding
0%1 -10%
11 - 20%21 -30%31 -40%41 - 50%51 - 60%01 - 70%71 - 80%81 -90%91 -99%
100%
50341241ó0000
3214ó324001008
T A B L E
Respondents' Ability to Provide Disaggregated Dataon Urban Water Supply and Sanitation Coverage
by Marginal and High-Income Populations
Region Number of Reporting CountriesProviding Urban High-Income/ Providing Urban High-Income/
Marginal Urban Marginal UrbanBreakdown For Water Supply Breakdown For Sanitation
Africa
L. America& Caribbean
Asia & Pacific
West Asia
Total
15
9
8
3
35
15
9
8
3
35
Analysis of 1990 Baseline Data
CoverageThe Need for Increased FocusUpon Marginal Urban Areas
A cursory look at global figures revealsthat, globally, 83 percent of the urban popula-tion of developing countries have access tosafe water supply. However, the JMF' disaggre-gation shows a hidden inequity: the fact thatthere is a 95 percent service coverage rate forthe urban high-income group compared to only64 percent coverage for the marginal urbanpopulation. The same principle can be appliedto sanitation, given that high-income urbanresidents appear to have the same levels ofservice coverage for both water supply andsanitation.
Data disaggregation along these lines couldhelp planners and policy makers better focusresources on the needs of pockets of urbanpopulations whose situation was previouslymasked by the overall coverage statistics. Thistakes on an added urgency given the soaringurban population growth rates predicted for the1990s.
Meeting Basic Needs Through MoreAggressive Promotion and Use ofAppropriate Low-Cost Technologies
The existence of service disparities andinequities are even further substantiated whenthe initial results of the global disaggregationof access to water supply by technology areexamined (Figure 1). Urban high-incomepopulations have close to 80 percent access todomestic connections in comparison to a rateof less than 30 percent access for the combinedmarginal urban and rural populations. Thedisaggregation of coverage into different levelsof service has provided planners with moreobjective information while substantiatingfurther the existence of disparities in resourceallocations.
Generally speaking, the low-cost optionswhich were aggressively promoted during the1980s have yet to be seriously considered as ameans to accelerate sustainable service cover-age. Although boreholes with handpumps, atechnology aggressively pursued during the1DWSSD, constitute the largest single meansof water supply to rural people, some countrieshave access to even less costly options such asprotected springs, rainwater harvesting andgravity flow systems.
10 • JMP Annual Report 1990

In the case of sanitation, a large range oftechnologies is being used to provide servicesto urban high-income populations (Figure 2).The claim that small-bore sewer technologyhas been applied in the urban high-incomeareas to a significant extent needs scrutiny,given some possible difficulty in this particu-lar case with terminology. The definitionadopted by the JMP, for example, definessmall-bore sewers as follows:
"Normally of 4 to 6 inches in diameter andburied at shallow depths (less than I metre)below the surface. Such systems are usuallydesigned for low-income populations inunplanned settlements where the population
density usually exceeds 200 persons perhectare."
JMP statistics indicate that householdconnections to septic systems are used almostas frequently by urban marginal populations asare simple pit latrines. This is surprisingconsidering the much higher cost of septicsystems in comparison to small-bore sewers.However, the driving force behind such adecision for the individual householders maybe their ability to manage the system, ratherthan the cost.
In rural areas, simple pit latrines are almost13 times more common than VIP latrines de-spite aggressive advocacy and promotion of
Safe WaferSupply
Total population withaccess to functioningsafe water supply.
Source: WASAMS - 1990
Legend
Not Reported
0% to 25%
26% to 50%
5 1 % to 75%
76% to 100%
Sanitation
Total population withaccess to adequateexcreta disposal.
Source: WASAMS - 1990
Legend
Not Reported
0% to 25%
26% to 50%
5 1 % to 75%
76% to 100%
For Maps 1 and 2, as there is no standard regional or global definition for coverage, this varies from country to country.
WHO/UNICEF Joint Monitoring Programme • 11

Initial analysis of the
1990 baseline data
available reveals that
Governments are
subsidizing high-income
populations by as
much as 70 percent
of O&M costs.
the latter during the 1980s. Although the VTPoffers a higher level service, its higher pricemay not be affordable to the unserved major-ity. Two possible solutions can be envisagedto accelerate adequate sanitation service cov-erage in rural areas, namely, reduction of VIPlatrine costs, through a more aggressive use oflocal construction techniques and materials,and/or upgrading the simple pit latrine togreatly reduce odour and fly nuisance.
Again, analysis of JMP 1990 data showsenormous disparities in service coverage,which may indicate, among other things, inad-equate policies on cost recovery which have
Respondents' Ability to Provide a Breakdownof Service Coverage by Different Technologies
Region
Africa
L, America& Caribbean
Asia & Pacific
West Asia
Total
Number of Reporting CountriesProviding Service Coverage Providing Service
Breakdown by Different Coverage Breakdown byTechnologies for Water Different Technologies for
Supply Sanitation
22
16
14
3
55
25
16
12
2
55
T A B L E
Global Access to Water and Sanitation
Percentage of Population with Accessto Safe Water and Adequate Sanitation
Sub-Sectors
Urban
Marginal Urban
Urban Total
Rural Total
Water SupplyWHO Í990'11
82
63
JMP1990
95
64
83
67
SanitationWHO 1990
72
49
JMP1990
9545
65
22<2)
(1) Refers to fhe "Decade Monitoring Report" by WHO, where 1988 sector data wereextrapolated t& 1990: : • ". . •'• • • • • • • • • • • • . . : ?
(2) Refers to the large discrepancy in relation to the earlier WHO extrapolations for 1990is most probably due to the absence of JMP rural data from China.
led to large capital outlays for rehabilitation ofhigh-cost systems, mostly to benefit the better-off.
Service implementation rates would have tobe accelerated by between 1.5 to 4 times thelevels of the past decade if "universal access"is to be attained in the foreseeable future.Clearly an alternative approach is urgently re-quired.
Such an approach would necessitate policychanges in favour of realistic cost recovery,especially for the high-cost/high level services.Subsequently, a significant proportion of thecapital generated through such means shouldbe redirected towards the sustainable accelera-tion of service coverage to the unserved.
ManagementCommunity Contribution to Operationand Maintenance Costs
The importance of sustainability becamemore and more apparent as the 1980s moved toa close. Reflecting this new-found emphasis,the JMP adopted a proxy indicator for commu-nity involvement in management of services.This indicator specifically attempts to highlightcommunity contribution to operation andmaintenance (O&M) costs.
Initial analysis of the 1990 baseline dataavailable, on this indicator, reveals that Gov-ernments are subsidizing urban high-incomepopulations by as much as 70 percent of O&Mcosts. Meanwhile, in marginal urban and ruralcommunities, Governments are contributing al-most up to 40 percent of the total O&M costsfor a lower level of service, i.e. half as much asfor their wealthier neighbours (Figure 3).
The lessons of the 1980s indicated a strongcorrelation between sustainability of servicesand cost recovery and suggest that the latterbecomes more effective as responsibility isdevolved to the communities. The sustain-ability of conventional high-cost urban systemswhich largely benefit the more affluent popula-tions therefore comes into question, given thehigh level of government subsidies allocated tothe better-off in urban areas who should beable to afford such basic services.
FundingInvestments in the Sector
The sector information provided by govern-ments for 1990 indicates that Governmentsconcentrate their water supply investments in
12 • JMP Annual Report 1990

urban areas in new systems and in the rehabili-tation of existing systems. There also seems tobe a special bias favouring new high-costsystems. External Support Agencies (ESAs)almost match investments by Governments inurban areas. However, there is evidence thatESAs attempt to compensate to some extent,at least for this bias, by also supportingprogrammes in rural areas (Figure 4).
Although communities do not contributesignificantly to capital investments for watersupply, marginal urban and rural populationscontribute proportionally more than do theirmore affluent urban neighbours. Indicationsare that investments by "other" actors, pre-sumably the private sector, etc., tend to favoururban dwellers more than rural populations.
Percentage
1009080706050403020100
For sanitation, Government and ESA capi-tal investments, alike, also favour more afflu-ent urban populations (Figure 5). Conversely,marginal urban and rural communities appearto contribute a higher proportion of capital in-vestments than do Governments for new andrehabilitated systems. As in the case of watersupply, members of the more affluent urbangroup seem to be contributing proportionallyless than their poorer neighbours.
Given the proportionally higher contribu-tion by marginal urban and rural populations,it is not unreasonable to deduce that thedemand for sanitation among these groups,particularly the latter, may possibly be higherthan previously assumed.
::
ItIt: PL nI
| Urban
F̂ j Marginal Urban
HI Rural
mm
i
Percentage
1009080706050403020100
:::
:
:::
Jm — m ^
• Urban[""I Marginal Urban
H Rural
P
ml[••:-
1
Jm
L•& jr s
Indications are that
contributions by
"other" actors,
presumably the private
sector, etc., tend to
favour urban dwellers
more than rural
populations.
F I G U R E
Water Supply
Proportion ofpopulation served bytechnology types.
Source: JMP - 1990
F I G U R E
Sanitation
Proportion ofpopulation served bytechnology types.
Source: JMP-1990
WHO/UNICEF Joint Monitoring Programme • 13

Water Supply
Contribution toOperation &Maintenance Costs.
Source: J M P - 1 9 9 0
Water Supply
Contribution to capitalinvestments.
Source: JMP - 1990
Sanitation
Proportionalcontribution to capitalinvestments.
Source: J M P - 1 9 9 0
Percentage
100
Urban
Marginal Urban
Rural
Government ESAs Communities Others
Percentage
100
90
80
70
60
50
40
30
20
10
0
:
::
-:
-
~- unüJP
il Um
1• Urban
HI Marginal Urban
0 Rural
ral it—
s.
Gov. Gov. ESAs ESAsNew Sys. Rehab. New Sys. Rehab.
Gov. New Sys.Gov. Rehab.
ESAs New Sys.ESAs Rehab.
New systems funded by GovernmentRehabilitation of existing systemsby GovernmentNew systems funded by ESAsRehabilitation of existing systemsfunded by ESAs
Comm. Comm. Other OtherNew Sys. Rehab. New Sys. Rehab.
C o m m . N e w Sys. New systems funded by communitiesComm, Rehab.
Other New Sys.Other Rehab.
Rehabilitation of existing systemsfunded by communitiesNew systems funded by othersRehabilitation of existing systemsfunded by others
Percentage
100
90
80
70
60
50
40
30
20
10
0uIfftj— •
1i
r
1H11•
•
!• Urban
Q MarginH Rural
at Urban
LGov. Gov. ESAs ESAs Comm. Comm. Other Other
New Sys. Rehab. New Sys. Rehab. New Sys. Rehab. New Sys. Rehab.Gov. New Sys.Gov. Rehab.
ESAs New Sys.ESAs Rehab.
New systems funded by GovernmentRehabilitation of existing systemsby GovernmentNew systems funded by ESAsRehabilitation of existing systemsfunded by ESAs
C o m m . N e w Sys. New systems funded by communitiesC o m m . Rehab . Rehabilitation of existing systems
funded by communitiesOther N e w Sys. New systems funded by othersOther Rehab . Rehabilitation of existing systems
funded by others
14 • JMP Annual Report 1990

A Hidden MessageThere appears to be a hidden message in
the aforementioned sections on managementfunding. The large capital expenditures forrehabilitation of conventional high-cost urbanschemes are obviously related to the rapiddeterioration of such infrastructures. Thisapparent lack of sustainability may be linkedto inadequate cost recovery for operation andmaintenance (see Box 2).
Despile this, governments seem to persistin heavily subsidizing the better-off popula-tion who can afford operation and main-tenance cost of basic services. This inequitableallocation of limited resources constrains theexpansion of services to the unserved poor(see Box 3, this page, and Box 5, page 24).
Inadéquate Cost Recoveryfor Water Supply
A recent review of World Bank-financedprojects showed that the effective pricecharged for water is only about 35 percent ofthe average cost of supplying it. The propor-tion of total project financing generated byutilities points in the same direction: Internalcash generation accounts for only 8 percent ofproject cost in Asia, 9 percent in Sub-SaharanAfrica, 21 percent in Latin America and theCaribbean, and 35 percent in the Middle Eastand North Africa.
WoHd Development Report 1992,The World Bank, Washington, D.C.
Financial Resource Allocationis a Function of Political Will
The (UNDP) 1991 Human Development Reportsets out a framework for restructuring nationalpublic expenditures and international aid allo-cations to ensure the resources needed to un-derpin human development strategy in the1990s. This analysis shows that in many coun-tries at present, only a small proportion ofGDP (gross domestic product), on averagebarely 2 percent, is directed to priority humanexpenditure. The same ¡s true of the aid bud-gets of most donor countries, on average only8 percent of total aid. Put differently, theamount of restructuring to generate the re-sources required for meeting priority humangoals is usually not large.
Richard Jolly, UNICEF New Yorkand Rolph van der Hoeven, ILO, Geneva
Analysis by Geographic Sub-groupingsThe potential national and sub-national
application of WASAMS as a tool to deriveinformation on geographic or other sub-groupings is illustrated in the following briefanalysis which is based on the UN RegionalEconomic Commission global sub-divisions.
Figure 6, which represents data on globalwater supply coverage by region, shows anarray of technologies used. Similarities existbetween Latin America and the Caribbean andWest Asia, regarding provision of water supplythrough household connections. There is also asimilarity between Africa, Asia and the Pacificregarding the same technology.
Water supply for rural populations bymeans of standpipes follows a similar pattern,with approximately 20 percent of the popula-tion being served in Latin America and the Car-ibbean, and West Asia, while about 10 percentis similarly served in Africa, Asia and the Pacific.
Rainwater harvesting appears to beunderutilized on a global basis as a means ofgaining access to improved water supply.However, many countries (especially in Asiaand the Pacific) are actively pursuing thismethod of supplementing their domestic watersupplies. Many countries could potentially gainfrom such an approach.
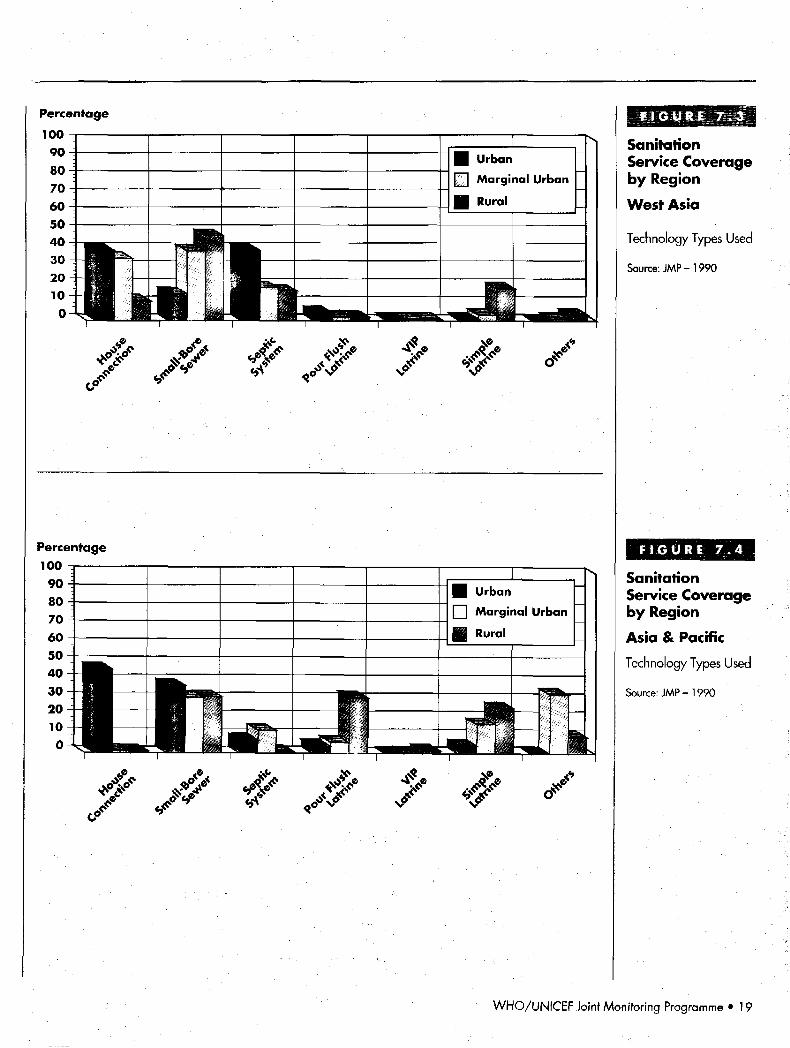
As indicated in Figure 7, there is a greatervariation in sanitation service coverage bytechnologies between regions than is the casewith water supply. For example, pour flushlatrine technology is practically limited to thesingle region of Asia and the Pacific. The useof simple pit latrines follows a similar patternin Latin America and the Caribbean, as inAfrica. However, 14 percent of Africa's urbanhigh-income population use this technology,compared to its non-use by the equivalentgroup in Latin America and the Caribbean.
Other unspecified technologies for sanita-tion appear to be commonly used in Asia andthe Pacific Region, and to a lesser extent inAfrica as well. It is hoped that through the useof the mapping feature of WASAMS (atnational and sub-national levels) the specificsector needs and the inequities may be high-lighted. This information, if effectively usedand brought to the attention of policy anddecision makers, could lead to the restructuringof resources to minimize disparities andaccelerate sector coverage. ©
Rainwater harvesting
appears to be
underutilized on a
global basis as a means
of gaining access to
improved water supply.
WHO/UNICEF Joint Monitoring Programme • 15

Figure 6: Water Supply Coverage by Region
F I G U R E 6 . 1
Water SupplyCoverage byRegion
Latin America &Caribbean
Technology Types Used
Source: JMP - 1990
F I G U R E 6 . 2
Water SupplyCoverage byRegion
Africa
Technology Types Used
Source: JMP-1990
Percentage
100
90
80
70
60
50
40
30
20
10
0 i
t—
1rA .
• Urban| | ] Marginal Urban
M Rural
ffll
Percentage
10090807060
40302010
0
- im• E M
rWB
d 1|M|
• Urban
H] Marginal Urban
^ Rural
-
•
16 • JMP Annual Report 1990

Percentage
1009080706050403020100
:
::
:1
1 U1 mi
....
• Urban
HI Marginal Urban
• Rural
f
•s.
b.
Percentage1009080706050403020100
- HnH f
• UrbanQ Marginal Urban
• Rural
l1
Ltf
F I G U R E 6 . 3
Water SupplyCoverage byRegion
West Asia
Technology Types Used
Source: JMP-1990
F I G U R E 6 . 4
Water SupplyCoverage byRegion
Asia & Pacific
Technology Types Used
Source: JMP-1990
WHO/UNICEF Joint Monitoring Programme • 17
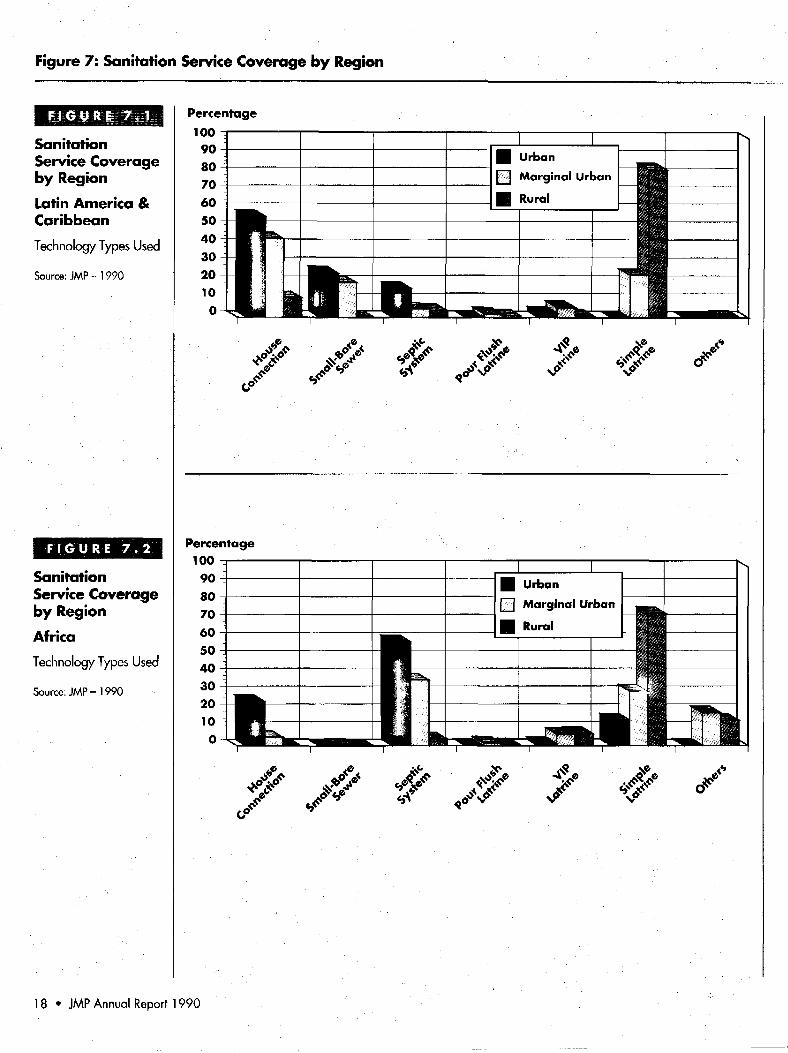
Figure 7: Sanitation Service Coverage by Region
SanitationService Coverageby Region
Latin America &Caribbean
Technology Types Used
Source: JMP - 1990
F I G U R E 7 . 2
SanitationService Coverageby Region
Africa
Technology Types Used
Source: JMP - 1990
Percentage
100
90
80
70
60
50
40
30
20
10
0
- ^
- I ! Í-
• Urban
HI Marginal Urban
B Rural 1s,
J?
Percentage
100
90
80
70
60
50
40
30
20
-
-
—
1 j
• Urban[ J Marginal Urban
• Rural
1 1 L
má41—Wsjm—
y¡M Lc/
18 • JMP Annual Report 1990
Percentage
1009080706050403020100
m ti|U
jp1 1
[
n
mr
• UrbanH] Marginal Urban
1 Rural
Percentage1009080706050403020100 r«i-
• Urban|~| Marginal Urban
^ | Rural
jt_ Is
SanitationService Coverageby Region
West Asia
Technology Types Used
Source: JMP - 1990
F I G U R E 7 . 4
SanitationService Coverageby Region
Asia & Pacific
Technology Types Used
Source: JMP - 1990
WHO/UNICEF Joint Monitoring Programme • 19

LV: Framework forImproved Sector PlanningEnhanced sector
monitoring can pave
the way for improved
sector planning.
Linkage Between Sector Monitoring,Planning and Advocacy
Tl he first section of this report provided ageneral overview of the water and sanita-tion sector from the 1970s through the
1980s (IDWSSD), while also outlining thepolitical framework for sector development inthe 1990s. Section II discussed the need for animproved, simple sector monitoring systemwith a high degree of flexibility at countrylevel for specific monitoring requirementsusing the "open-ended" system. It highlightsthe urgent need to strengthen sector capacity atcountry level. Section III provided an analysisof the sector derived from the 1990 baselinedata submitted. This analysis forms thebenchmark for monitoring sector performanceduring the 1990s.
In response to the critical need to improvesector management through enhanced monitor-ing Section IV provides a framework for sectorprofessionals, policy makers, donors and deci-sion makers at all levels to monitor progressregarding achieving their sector goal of "uni-versal access" at the earliest possible date.
Enhanced sector monitoring can pave theway for improved sector planning. It can alsoprovide the basis for authoritative publicinformation and advocacy campaigns. A keyingredient is the catalytic relationship betweensector monitoring and planning: The formernormally feeds into the latter, which can inturn be adjusted as goals and annual targetsundergo changes. However, planning can alsofeed back into monitoring. Monitoring feed-back can also be used to "prime" publicinformation channels and advocacy initiativesdirected towards policy and decision makers.Additionally, it contributes to the information,education and communication (IEC) processwhich explores all available communicationchannels and strategies to disseminate relevantinformation. This ultimately generates mo-mentum towards the attainment of objectives(Figure 8).
In order to be effective, IEC has to gener-ate political will which, in turn, must be
translated into actions, including the revisionof sector policies, the provision of additionalresources and the promotion of active commu-nity participation.
For sector planning to be effective, itshould reflect the following three proceduresin a cyclical manner:
i. Assessment of the current sector situation;
ii. Analysis of the constraints affecting sectoracceleration and the identification of poten-tial ways to overcome these limitations;
iii. Action in response to the foregoing assess-ment and analysis.
Framework for Monitoringin the Context of Goal Setting
The gap between the current access rate (orbaseline service coverage) and the ultimate ob-jective of "universal access" is very large inmany countries. Planning can only be of assis-tance to sector management if the goals are re-alistic and have some chance of being met. Aselected sector goal for the 1990s could beplaced anywhere between the "business asusual" of the 1980s and "universal access" bythe year 2000, assuming that the lowest end ofthe scale corresponds to a linear projection ofthe 1980s implementation rate, while the high-est equates to the World Summit for Childrengoals of "universal access" (Figure 9).
Within the above context, a sector planningframework comprising seven steps is pro-posed. In the absence of reliable baseline data,a conservative estimate should be made. Also,it should be kept in mind that it is very diffi-cult to verify progress if initial estimated dataon coverage is too optimistic. It is also advis-able to agree upon the population denominatorfor the various sub-national levels, otherwisethere may be errors in the estimation of theunserved/served population.
Meeting The ChallengeA much greater syncrgism in terms of
linkage between sector monitoring, planning
20 • JMP Annual Report 1990

and advocacy is paramount to meeting thechallenge of "universal access" to water andsanitation in the shortest possible time. Thereí erred-to conceptual framework aims to helpsector professionals, policy makers, decisionmakers and donors achieve this goal.
Step One: Situation Analysis.This should include the following:
• estimates of current water supply and sani-tation coverage (the baseline);
• assessment of sector investments duringthe 1980s with an estimate of the propor-tion oí funds spent on high-cost, intermedi-ate-cost, and low-cost technologies (seeAnnex III);
• review of past and current sector policies;
• assessment of current sector strategies in-cluding the potential of "community par-ticipation" in decision making, planningand management, and willingness to payfor and sustain services, etc.;
ü rough assessment of the feasibility ofreaching "universal access" in terms of thecurrent resource base (funding, human re-sources, implementation capacity etc.) andcurrent approaches by the year 2000.
Outcome: Clear assessment of the Water andSanitation Sector, with a view as to whetheror not the current resource base is sufficientto achieve "universal access "by the year 2000,following the ''business as usual" approach.
If "universal access" can be achievedthrough the "business as usual" approach,then proceed to Step Four. If not, proceed toStep Two.
Step Two: Estimate the Maximum ServiceCoverage Which can be Attained ThroughOptimal Use of the Available Resource Baseand Appropriate Strategies, and Indicate theResource Gap yet to be Bridged, to Achieve"Universal Access" by the Year 2000.
• On the basis of 1980s strategies and costsfor high, intermediate and low-cost tech-nologies (Step One), estimate the maxi-mum coverage which can be attainedthrough restructuring of resources infavour of the unscrved, through the opti-mal mix of technologies bearing in mindpolitical acceptability and sustainability.
• Determine the additional resources required(financial, human etc.) to bridge the gap be-tween the goals attainable through optimaluse of available resources, and the "univer-sal access" goal of the year 2000.
Outcome: Outline for optimal use of avail-able resource base, and estimate of additionalresources required, if any, to achieve "univer-sal access".
If "universal access" can be achieved viathis "optimal use of available resource baseand appropriate strategies", then proceed toStep Four. If not, proceed to Step Three.
Step Three: Explore the Restructuring ofMacro-economic and Sector Policies toIncrease the Resource Base.
This entails a simulation of various policiesto determine their potential to generate suffi-cient resources to bridge or minimize the gapbetween the goals attainable through optimaluse of available resources, and the goal of"universal access" (Step Two), again bearingin mind their political acceptability andsustainability. This may include:
• equitable tariffs for cost recovery/sharing;
• increased sector investment, includingcommunity contributions, external re-sources, etc.;
• optimal use of, and support to, the privatesector (manufacture, implementation, etc.);
Estimate the maximum
coverage which can be
attained through
restructuring of
resources in favour of
the unserved...
F I G U R E
Conceptual FrameworkLinking Monitoring Planning and Advocacy
Policy & Decision Makersana the General Public
Information,Education &
Communication
/ \Community gr\ PolicyParticipation M/T~\ Changes
ResourcesMobilization
Sector Plans ofAction (NPAs)
SectorMonitoring
NPAs: National Plans of Action
Source: UNICEF/Water & Environmental Sanitation Section, June 1992
WHO/UNICEF Joint Monitoring Programme • 21

F I G U R E 9
A Framework for Goal Setting
UA
TowardsUniversalAccess
BU
1980 1990 2000E3 Sanitation % Water @ Population
UNICEF/Water and Environmental Sanitation Section, New York, July 1992
HI reduction in duties and taxes on specificequipment and materials for intermediate-and low-cost options;
• devolution of authority and responsibilitiesto local communities to enhancesustai nabi I ity.
Outcome: Optimal policy package to bridgeor minimize the gap.
Step Four: Selection of Strategies to Opti-mize the Use of the Resource Base.
Once the resource base is established,different choices of resource utilization maybe made. The technology options vary on thebasis of the proportion of resources beingallocated to appropriate low-cost and interme-diate-cost technologies. They range fromcurrent resource allocations of approximately20 percent being allocated to low-cost andintermediate-cost technologies, to the maxi-mum possible proportion of resources thatmay be reallocated to these technologies,based on policy decisions.
The underlying principle is that the greaterthe shift towards low-cost and intermediate-cost technologies, the greater the potential toachieve "universal access" or to minimize thegap between needs and resources.
Once the policy decision is made on roughlywhat proportion of resources should be allo-cated to each of these technology/strategycategories, (i.e. high-, intermediate- and low-cost) resources can be prorated accordingly.
The strategies should go beyond the tech-nology options to include the social aspects,that is, the type/level of community participa-tion required to provide sustainability to theentire approach.
Outcome: Optimal mix of technologies formaximum acceleration of sustainable coverage.
Step Five: Establishing of Sector Goals.At this point realistic sector goals can be
established. Specifically this should be under-taken for: 1 ) water supply and 2) sanitationcoverage in a) urban, b) marginal urban, and c)rural areas, with a total of six sector goals in all.
At this early stage in the 1990s, il may bedifficult to realistically determine the accessgoal for the year 2000. However a mid-decadegoal can be determined more readily, with a"guesstimate" only for the end-decade goal.
Outcome: Realistic Sector Goals.
Step Six: Establishing a Planning Framework.At this juncture it is possible to make a
breakdown of the six sector goals into annualtargets. This becomes the planning frameworkagainst which progress can be monitored. Ifchanges occur in policies, the resource baseand/or the goals, this framework has the flex-ibility to adapt to such changes. It thus becomesa "live" planning tool unlike the rigid "masterplans" of the past.
Outcome: Pragmatic planning/monitoringframework.
Step Seven: Optimal use of Monitoring Data,Finally, these data should be used for sector
advocacy purposes, feedback to communitiesand sub-national levels for improved decision-making, planning, resource mobilization and itsequitable allocation, and management.
Outcome: Mobilization of resources andstrengthening of decision-making, planningand management at all levels. ©
22 • JMP Annual Report 1990

Summary of
Strategies for Sector Monitoring in the 1990s
• Meetings attended by water and sanitationsector professionals from Governments,ESAs, and others, resulted in "three coreindicators" for enhancing sector monitoringin the 1990s.
• A country-based and country-managedmonitoring system was developed, which isboth manual and computerised, andpossesses an open-ended facility to permitcountries to utilize additional indicators asrequired.
» For the first time a disaggregation of waterand sanitation coverage into urban andmarginal urban was used. Likewise, alarger range of levels of service (technologytypes) has been monitored.
• Current measures being used to strengthencountry-level capacity for sector monitoringinclude regional workshops; country-levelinter-ministerial meetings; establishingnational monitoring units; setting of realisticgoals, and developing effective frameworksfor guiding sector monitoring.
• Governments are being urged, through theJMP, to build upon and optimize existingdata collection systems.
Salient Points
Outcome of Global Monitoring 1990
m Baseline year 1990 was the first time inwhich the WASAMS format was used bycountries to assess the status of their sector.
• Disaggregated data on urban populationconfirmed that a considerable disparity existsin access to services between urban andmarginal urban populations.
it Low-cost options are yet to be seriouslyconsidered by Governments and ESAs.
• There is broad-based evidence thatinadequate policies exist on cost recovery,especially for high-cost systems.
m Governments tend to concentrate sectorinvestments in new and rehabilitated systemsfor (high-income) urban populations, with aclear bias towards high-cost systems.
• Water services to high-income populationsare generally being subsidised by as muchas 70 percent of the O&M cost.
m An alternative approach to efficiently utilizescarce resources is urgently needed. Thisnecessitates policy changes in favour ofrealistic cost recovery and cost sharingmeasures at all levels, including areas ofhigh-cost/high level services.
m A strong synergistic linkage between sectormonitoring, planning and advocacy hasbeen recognized as the basis to acceleratewater and sanitation coverage in the 1990s.
m Planning (and monitoring as a managementtool) can only be of assistance if goals arerealistic. A sector planning framework istherefore needed to enhonce the planningprocess.
WHO/UNICEF Joint Monitoring Programme • 23

V: ConclusionTo continue "business
as usual", despite the
laudable efforts of the
past decade, would
result in a widening
of the gap between
the served and
the unserved, especially
in urban areas.
Due to inadequate advocacy and promo-tion of the sector in the past, the
unserved population continues to grow.Therefore to reach "universal access", advo-cacy will have to be aggressively pursued to at-tract a larger share of national and external re-sources to the sector in future. Effective sectormonitoring can play a vital role in advocacy byproviding updated relevant information. Moni-toring is also crucial in facilitating effectiveand more equitable use of resources to achieve"universal access". Moreover, a strong syner-gistic linkage between Sector Monitoring,Planning, and Advocacy has been recognizedas the basis to accelerate water and sanitationservice coverage in the 1990s. Enhanced sectormonitoring can thus pave the way for improvedsector planning and management.
To continue "business as usual", despite thelaudable efforts of the past decade, would
Willingness versus Ability to Pay
Households' willingness to pay for improvedservice ishigh butnot high enough to pay thefull costs of an improved service. This grouptypically includes poor communities in aridareas in South Asia and Sub-Saharan Africa.Village people are willing to pay a relativelylarge share of their income for improved wa-ter service. The distinction is that the costs ofsupply are so high, as a result of a combina-tion of aridity and low population densities,that improved systems will not be built and op-erated without subsidies. Given the high prior-ity that people give to improved water supply,if transfers were available from central gov-ernment or from foreign donors, householdswould typically choose to spend the funds onan improved water supply. The primary ser-vice offered in such communities would bepublic taps, wells, or boreholes, although inpiped systems metered yard taps should be al-lowed, with tariffs set to recover full costs.
World Development Report 1992,^ : : ;: The World Bank, Washington, D.C
result in a widening of the gap between theserved and the unserved, especially in urbanareas. Moreover, the current global recessionbeing experienced, leaves little hope for amajor increase in the absolute level of fundingfor sector development in the near future. Animmediate solution to substantially accelerateservice coverage is therefore to better utilizeexisting resources. This can be achievedthrough macro-economic restructuring ofgovernment budgets to underpin humandevelopment initiatives, as well as restructur-ing of sector budgets in favour of low-cost,community managed technologies andapproaches, with a focus on the unserved ruraland marginal urban areas. It is paramount thatgovernments and ESAs see resource alloca-tions to the sector in the context of economicinvestments for development, rather thansocial expenditures (see Box 6).
Governments and external support agen-cies involved in the water and sanitationsector have a fundamental choice: to continue"business as usual", with essentially a lowpriority for the unserved poor, or to shift thefocus to facilitating the provision of servicesto that silent majority. By opting for the latter,one will substantially contribute to shaping abetter future and more just social order indeveloping countries and, at the same time,establish the foundation for a more rapidhuman development and a more equitablesociety. ©
B O X
The Economic Cost of NotProviding Water and Sanitation
In just the first ten weeks of the cholera epi-demic in Peru, losses from reduced agriculturalexports and tourism were estimated at $1 bil-lion — more than three times the amount thatthe country had invested in water supply andsanitation services during the 1980s.
Source: World Development Report 1992,The World Bank, Washington, DC.
24 • JMP Annual Report 1990

Annex IParticipants of Workshopswho Contributed to the JMP Effort
Geneva Pre-Test Workshop: 2-5 April, 1991Institution Name Region Country
Government
WHO
UNDP/W. Bank
UNICEF
1. Tesfaye Gemechu2. Samira Nicola Rezk3. Ativon Kodjo4. A. N. Asthana5. Vernon Barrett
1. Mihail Koussitassev2. K. Khosh - Chasm3. Mohal Lai Gupta4. Raymond Reid5. Kassa Kinde6. Skouloum Aye Marfa7. Homero Serrano Silva8. Dennis Warner9. Gregor Watters10. Anthony Thomas11. Ivan Mazuranic12. Ingvar Ahman
8. G. Schultzberg
1. Rupert Talbot2. Magdi Zaki3. David Delienne4. Raúl Niño5. Pradeep Kumar6. David Williams7. Joseph Christmas8. Carel de Rooy9. Brendan Doyle
EASROMENAWCAROROSATACRO
AFROEMROSEAROPAHOAFROAFROPAHOHQsHQsHQsHQsHQs
RWSG/EA
ESAROMENAWCAROTACROROSCAEAPROHQsHQsHQs
EthiopiaEgyptTogoIndiaJamaica
CongoEgyptIndiaUSAEthiopiaTogoJamaicaSwitzerlandSwitzerlandSwitzerlandSwitzerlandSwitzerland
Kenya
EthiopiaEgyptTogoGuatemalaIndiaIndonesiaUSAUSAUSA
WHO/UNICEF Joint Monitoring Programme • 25

Guatemala Sub-Regional (Latin America) Monitoring Workshop:2-5 December, T 991Institution
Government
PAHO
WHO
UNICEF
Name
1. Hugo Raúl Garnero2. Paulo F. Teixeira3. Pedro Reyes4. Jorge Bravo5. Carlos R. Calderón6. Francisco Rivera Diaz7. Leonardo González8. Manuel Antonio Merlos9. Armando Mira10. Eric Alvarado11. Edith Marul12. Luis Roberto Escoto13. Emilio Velazquez Uribe14. Flor de M. B. Cruz15. Manuel Barrón16. Ámbar de Pinzón17. Angel Chavez18. Angel Castillo
1. Julio Burbano2. Luis Carlos Rangel3. Ricardo Núñez4. Luis Alberto Leal5. Iván Estrubi6. Norman Jirón7. Luis F. Peñaranda8. Alberto Sylvester
1. Gregor Waiters2. Ivan Mazuranic3. Ingvar Ahman
1. Willy Bezold2. Fabio Sabatini3. Bernt Aasen4. José A. Zuleta5. Jorge M. Molina6. Hans Spruijt7. Matías Núñez8. Sara Menéndez9. Mario Sorto10. Herbert Schembri11. Angela Céspedes12. Hatsune Hatanaka13. PerEngebak14. Heraan Jaramillo15. Terry Delrue16. Carel de Rooy17. Brendan Doy le
Region
TACROTACROTACROTACROTACROTACROTACROTACROTACROTACROTACROTACROTACROTACROTACROTACROTACROTACRO
TACROTACROTACROTACROTACROTACROTACROTACRO
HQsHQsHQs
TACROTACROTACROTACROTACROTACROTACROTACROTACROTACROTACROTACROTACROTACROTACROHQsHQs
Country
ArgentinaBrazilChileCosta RicaColombiaCubaEcuadorEl SalvadorGuatemalaGuatemalaGuatemalaHondurasMexicoNicaraguaPeruPanamaParaguayVenezuela
PeruMexicoEl SalvadorR.DominicaiCosta RicaNicaraguaBoliviaCEPIS/Peru
SwitzerlandSwitzerlandSwitzerland
ColombiaColombiaHondurasBoliviaGuatemalaGuatemalaMexicoR.Dominica]El SalvadorPeruEcuadorCosta RicaGuatemalaGuatemalaGuatemalaUSAUSA
26 • JMP Annual Report 1990

OtherCAPREGTZANDESAPACARHCARE
1. Marco Rodriguez2. Yesenia Calderón3. Fernando Ponce de León4. Estilito Loria5. Ravey Smith
R.DominicanaCosta RicaBoliviaBelizeBelize
Jamaica Sub-Regional (Caribbean) Monitoring Workshop:2-6 March, 1992Institution Name Country
Government
WHO/PAHO
• • . ' • . .
UNICEF
1. Hastin Barnes2. Cathal Healy-Singh3. Barnabas Abraham4. David Lewis5. Rajendra Rampcrsaud6. Vernon Barrett7. Barrington Harvey8. Bernard G. Williams9. Errol Rawlins10. Adrienne dcHav. Etienne11. Ricardo Ward12. Trevor Howe13. Swammy D. Ramjiawan14. Hudadar Seelal15. Leroy Adams16. Colin Young
1. Ton Vlugman2. Emmanuel K. Mollel3. Guy Felix4. Terrence Thompson5. Raymond Reid6. Gregor Watters7. Ivan Mazuranic
1. AshokDhital2. Fabio Sabatini3. Karan Singh4. Pierre Adam5. JackGershon6. Joseph Christmas7. Carel de Rooy8. Margaret Karp9. Brendan Doyle
AntiguaBarbadosDominicaGrenadaGuyanaJamaicaJamaicaJamaica,St. KittsSt. LuciaSt. LuciaMontserratSurinameTrin. & Tob.Turks & Caic.St.Vin./Grenad.
BarbadosBarbadosGuyanaTrinidad & TobagoUSASwitzerlandSwitzerland
BarbadosColombiaGuyanaHaitiJamaicaUSAUSAUSAUSA
WHO/UNICEF Joint Monitoring Programme • 27

Swaziland Sub-Regional (East And Southern Africa)Monitoring Workshop: 18-22 May, 1992Institution Name Country
Government
WHO
UNDP/WB
UNICEF
1. Antonio Quaresma2. Tlamelo M. Kedikilwe3. Meles se Endalamaw4, Momodon S. Ceesay5. A.M. Makokha6. Katleho Lesaoana7. Rob Katundu8. Leo Stolk9. Obioha Agada10. Napoleon M. Ntezinde11. Edith Mbatha12. Moses Kagim Gava13. Fred Sichiiongo
1. FredD. Maitan2. Ivan Mazuranic3. Gregor Walters
1, Nick Greenacre
1. Bhai Raj Sakya2. Nuno Egidio3. Tekka Cebra4. Luc Henskens5. Emmanuel Bawa6. S. Makondiege7. Marínete M. Ramaili8. Thowai Sha Zai9. K. Gibbs10. Chandra Bedloe11. Lloyd Donaldson12. Amiin Felipe13. Hezekiel Shongwe14. T.V. Luong15. Dauda Wurie16. Grace Ekudu17. Richard Lupenga18. Joseph Christmas19. Carel de Rooy20. Margaret Karp21. Brendan Doyle
AngolaBotswanaEthiopiaGambiaKenyaLesothoMalawiMozambiqueNigeriaSwazilandTanzaniaUgandaZambia
SwazilandSwitzerlandSwitzerland
Lesotho
AngolaCape VerdeEthiopiaGambiaGhanaKenyaLesothoLiberiaMozambiqueNamibiaNigeriaS. Tome/PrincipeSwazilandTanzaniaTanzaniaUgandaZambiaUSAUSAUSAUSA
28 • JMP Annual Report 1990
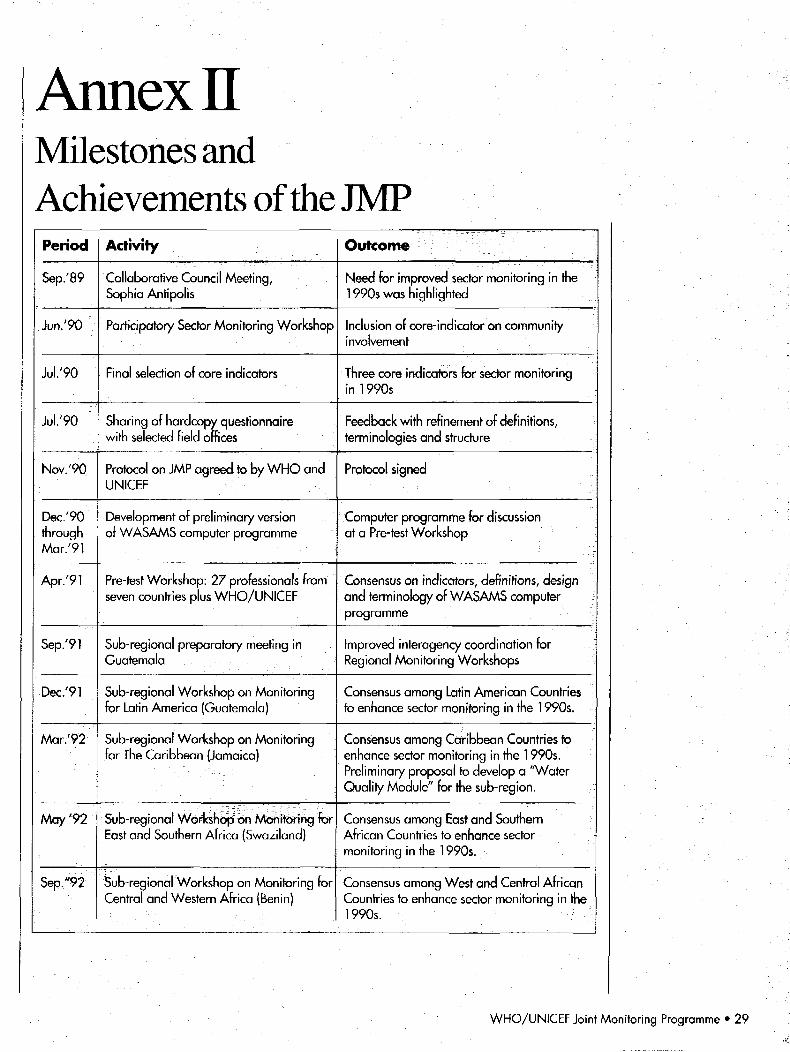
Annex!!Milestones andAchievements of the JMPPeriod
Sep.'89
hn.'9O
Jul.'9O
• Jul/90
Nov.'90
Dec/90throughMar.'91
Apr/91
Sep.'91
Dec/91
Mar/92
May'92
Sep."92
Activity
Collaborative Council Meeting,Sophia Antipolis
Participatory Sector Monitoring Workshop
Final selection of core indicators
Sharing of hardcopy questionnairewith selected field offices
Protocol on JMP agreed to by WHO andUNICEF
Development of preliminary versionof WASAMS computer programme
Pre-test Workshop: 27 professionals fromseven countries plus WHO/UNICEF
Sub-regional preparatory meeting inGuatemala
Sub-regional Workshop on Monitoringfor Latin America (Guatemala)
Sub-regional Workshop on Monitoringfor The Caribbean (Jamaica)
. . . • . • • • • • • . . .
Sub-regional Workshop on Monitoring forEast and Southern Africa (Swaziland)
Sub-regional Workshop on Monitoring forCentral and Western Africa (Benin)
Outcome
Need for improved sector monitoring in the1990s was highlighted
Inclusion of core-indicator on communityinvolvement
Three core indicators for sector monitoringin 1990s
Feedback with refinement of definitions,terminologies and structure
Protocol signed
Computer programme for discussionat a Pre-test Workshop
Consensus on indicators, definitions, designand terminology of WASAMS computerprogramme
Improved interagency coordination forRegional Monitoring Workshops
Consensus among Latin American Countriesto enhance sector monitoring in the 1990s.
Consensus among Caribbean Countries toenhance sector monitoring in the 1990s.Preliminary proposal to develop a "WaterQuality Module" for the sub-region.
Consensus among East and SouthernAfrican Countries to enhance sectormonitoring in the 1990s.
Consensus among West and Central AfricanCountries to enhance sector monitoring in the1990s.
WHO/UNICEF Joint Monitoring Programme • 29

AnnexinIndicative Technology Categoriesand Their Respective Costs
Technology Category Cost/Capita (US$)
High-Cost (Conventional) Technology
Urban Water Supply
Urban Sanitation
Intermediate-Cost Technology
Marginal Urban Water Supply
Marginal Urban Sanitation
Low-Cost Technology
'Rural Wafer Supply
Rural Sanitation
200
350
100
25
30
20
High-Cost (Conventional) Technology: applies to the conventional urban-type system withelaborate pumping stations, water and/or sewerage treatment plants, complete distribution systemsand individual household connections for both water supply and sewage.
Intermediate-Cost Technology: applicable to marginal urban areas essentially, comprisespipeborne water supply (no allowance for elaborate treatment) leading to public standposts, and "onsite" sanitation including technologies such as pour-flush and ventilated improved pit latrines.
Low-Cost Technology: targeted to rural areas essentially, includes handpump-equippedboreholes or handdug wells, rainwater harvesting systems and pipeborne gravity systems with publicstandposts, for water supply. Sanitation technologies are the same as those allocated to the"intermediate-cost technology" category with a slight cost reduction allowing for the use of locallyavailable construction materials for the building of latrine superstructures.
1990 per capita cost estimates by UNDP/World Bank (for urbgri and marginal urban areas) and UNICEF (for rural areas).':.'.•'. : • • • • • ' • • • ' • : • • • • • • • • • " • • ' • • • • ' : > : • • . • • ' • • : V ; : . ; • • • ' " • • • ' . : •. " • ' • ' • . . • • ' • • ' • • • • • • ; • • . ' • • ' • • • • . ' ; . : ' . - : : : - ' \ : : - : ' • • • '
30 • JMP Annual Report 1990

AnnexIVAdditional Maps and Tables
Note: For China, only piped water was reported (excluding Mongolia).
Note: For China, only piped water was reported (excluding Mongolia).
Safe WaterSupply
Total urban populationwith access tofunctioning safe watersupply.
Source: WASAMS - 1990
Legend
Not Reported
0% to 25%
20% to 50%
51% to 75%
76% to 100%
Safe WaterSupply
Total rural populationwith access tofunctioning safe watersupply.
Source: WASAMS - 1990
Legend
Not Reported
0% to 25%
26% to 50%
m 51% to 75%
76% to 100%
WHO/UNICEF Joint Monitoring Programme • 31

Sanitation
Total urban populationwith access to adequateexcreta disposal.
Source: WASAMS - 1990
Legend
Not Reported
0% to 25%
?>:;\ 26% to 50%
51% to 75%
76% to 100%
Ü
Sanitation
Total rural populationwith access to adequateexcreta disposal.
Source: WASAMS - 1990
Legend
Not Reported
0% to 25%
26% to 50%
51% to 75%
76% to 100%
.,,:p^'^/<!y:T'w^
•p
ifit
' ^ Í 1 ' . - 1 / ' : ' . - » 1 . 1 . - * : - ! " 1 . ! . ' ^ •'•''•••(•'.'•''''•'.;'>:••
32 • JMP Annual Report 1990

AfricaTotal Water Supply — Urban and Rural Combined
Coverage as a Percentage of Population Served
PopulationCountry1 (in thousands) 0 - 2 5 % 2 6 - 5 0 % 5 1 - 7 5 % 7 6 - 1 0 0 %
Angola
Burundi
ChadCameroon
Comoros
Côte d'Ivoire
Djibouti
Equat. Guinea
Ethiopia
Ghana
Guinea Bissau
Kenya
Madagascar
Mali
Nigeria
Rwanda
Senegal
Sierra Leone
Sudan
Togo
Tunisia
Uganda
Total
•••;®;Q02,^
5,266
5,550
11,482
468
10,736
480
356
50,974
14,200
1,000
24,398
11,200
8,100
108,016
7,800
6,928
3,664
24,600
3,496
7,900
16,794
333,410
—
'"..::.' - '. • ' . • •
—
22.9—
——
—
——
—
—
21.1
2
35.7
49.0 ' :
' : ' : : • . . • • • • • • • .
_ • • • • •
—
—
34.7
26.9—
— ••':?
48.6_
41.3
—
48.3
36.5
47.6
—
—
9
— • . : • . .
: • •
57.4
69.5
75.5—
—
60.6
52.9—
—
—
63.0
64.0_
—
—
59.6—
—
9
—
: —
—
—
83.5
—
—
—
—
— í_
—.
—
—
— •
92.2— : . " • • • • • • ' •
21 Countries which reported on 1990 baseline data for Safe Water Supply.
WHO/UNICEF Joint Monitoring Programme • 33

T A B L E
AfricaTotal Sanitation — Urban and Rural Combined
Coverage as a Percentage of Population Served
Country2Population(in thousands) 0 - 2 5 % 26-50% 51 - 75% 7 6 - 100%
Angola
Burundi
Cameroon
Comoros
Côte d'Ivoire
Djibouti
Equator. Guinea
Ghana
Guinea/Conakry
Kenya
Nigeria
Rwanda
Sudan
Togo
Tunisia
Uganda
Total
10,002
5,266
11,482
4Ó8
10,736
480
356
14,200
5,542
24,398
108,016
7,800
24,000
3,496
7,900
16,793
251,535
22.3
19.4—
——
—
—
—
20.9—
—
—
—
23.2
—
—
4
—
—
—
—
—
—
41.5
50.6—
41.5—
—
——
—
31.9
4
—
—
—
—
60.4
55.2—
—
—
—
64.856.7
74.8—
—
—
5
—
—
91.0
81.2—
—
—
——
—
—
—
——
95.3—
32 Countries which reported on 1990 baseline data for Sanitation.
34 • JMP Annual Report 1990

T A B L E
Latin America & the CaribbeanTotal Water Supply — Urban and Rural Combined
Coverage as a Percentage of Population Served
Country1Population(in thousands) 0 - 25% 26-50% 51 -75% 7 6 - 100%
Barbados
Belize
Bolivia
Brit. Virgin Is.
Costa Rica
Dominica
Ecuador
El Salvador
Guyana
Haiti
Honduras
Jamaica
Mexico
Montserrat
Nicaragua
Paraguay
St, Kitts & Nevis
Total
257
184
6,928
14
2,940
80
10,782
5,250
775
6,267
4,880
2,400
81,100
15
3,807
4,280
34
129,993
—
—
—
—
—
—
—
—
—
—
—
—
—
—
—
—
—
0
—
—
—
—
—
—
—
47.4
—-
38.4
—
—
—
44.8
—
34.9
—
4
—
—
52.1—
—
—
54.5
—
—
—
Ó3.Ó
—
—
—
53.2
—
.—
4
100
90.2
—
100
93.2
95.8
—
—
83.2
—
—
100
76.1
—
—
— . •
100
9
' Countries which reported on 1990 baseline data for Safe Water Supply.
WHO/UNICEF Joint Monitoring Programme • 35

T A B L E 1 0
Latin America & the CaribbeanTotal Sanitation — Urban and Rural Combined
Coverage as a Percentage of Population Served
Country2Population(in thousands) 0 - 25% 26 - 50% 51-75% 76- 100%
Countries which reported on 1990 baseline data for Sanitation.
Barbados
Bolivia
Brit. Virgin.ls.
Costa Rica
Dominica
Ecuador
El Salvador
Guyana
Honduras
Jamaica
Mexico
Panama
Paraguay
Peru
St. Kitts & Nevis
Total
257
6,928
14
2,940
80
10,782
5,250
755
4,880
2,400
81,100
2,300
4,280
22,332
34
144,332
—
—
—
—
—
—
—
—
——
—
—
—
—
0
—26.5—
—
—
48.4——
—
—
50.2—
—
—
—
3
——————57.5—
57.0—
—
—
62.0
57.5—4
100—100
97.4
98.8—
—
96.7—
85.4—
84.3—
—
98.5
8
30 • JMP Annual Report 1990

T A B L E 1 1Asia and the Pacific
Total Water Supply — Rural and Urban CombinedCoverage as a Percentage of Population Served
PopulationCountry1
Afghanistan
Bangladesh
Bhutan
Cambodia
China
India
Indonesia
Iran
Laos
Maldives
Myanmar
Pakistan
Philippines
Rep. Korea
Sri Lanka
Thailand
Vietnam
Total
in thousands)
17,600
113,005
1,2008,134
1,143,330
853,380
179,500
60,816
4,100
21340,100
116,000
61,480
43,500
17,617
55,88864,400
2,780,263
0 - 25%
——
—
—
—
—
—
—
—
—
—
—
—
—
—
—
—
0
26 - 50%
—
—
34.2
36.3—
—
—
—
34.649.4
32.1
—
—
—
—
—
41.9
6
51 - 7 5 %
—
——
—
—
—
56.9—
—
—
—
56.1—
—
71.2—
—
3
7 6 - 100%
99.2
79.7%—
—
79.12
85.2—
89.0—
—
—
—
80.0
100—
95.4—
8
'Countries which reported on 1990 baselinedata for Safe Water Supply. :
1 For China, only piped water was reported(excluding Mongolia).
T A B L E 1 2Asia & the Pacific
Total Sanitation — Rural and Urban CombinedCoverage as a Percentage of Population Served
Country2
Bangladesh
Bhutan
Cambodia
India
Indonesia
Laos
Maldives
Myanmar
Pakistan
Philippines
Rep. Korea
Sri Lanka
Thailand
Vietnam
Total
Population(in thousands
113,005
1,200
8,134
853,380
179,500
4,100
213
40,100116,000
61,480
43,50017,617
55,888
64,400
1,558,517
0 - 25%
20.0
13.014.4
16.2—
11.4
23.9—
24.4
—
—
—
—
—
7
26 - 50%
—
—
—
—
38——
35.0—
—
—
——
—
2
51 - 7 5 %
—
—
—
—
—
—
—
—
—
70.6—
60.2—
62.1
3
7 6 - 100%
—
—
—
—
—
—
—
—
—
—
100—
89.7—
2'• Countries which reported on 1990 baseline data for Sanitation.
WHO/UNICEF Joint Monitoring Programme • 37
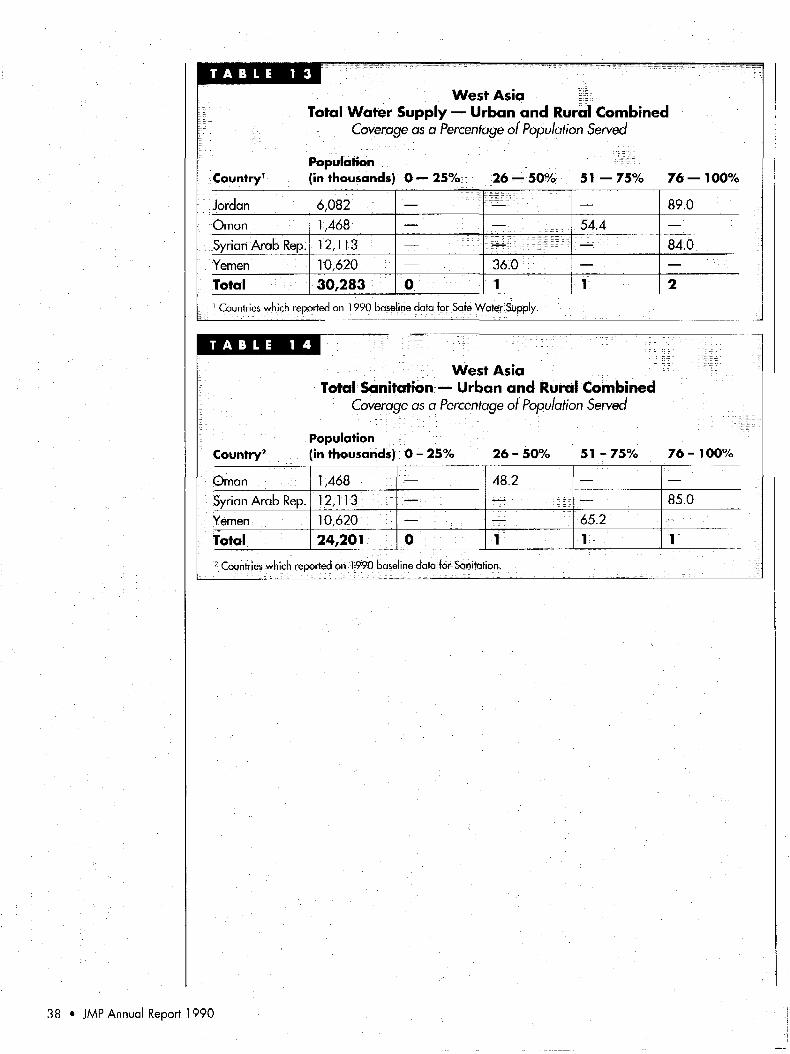
T A B L E 1
West AsiaTotal Water Supply — Urban and Rural Combined
Coverage as a Percentage of Population Served
Country'Population(in thousands) 0 — 25% 26 — 50% 51 - 75% 76 — 100%
Jordan
Oman
Syrian Arab Rep.
Yemen
Total
ó,082
1,468
12,113
10,620
30,283
— • . • • • • ' • • : • : • • ; : ;
—
—
—
0
i t i i s i "•:"••'•,:•••• •.
—
—
36.0
1
—
54.4——
1
89.0
84.0— • • ; • • • • . • :
21 Countries which reported on 1990 baseline data for Safe Water Supply.
T A B L E 1 4
West AsiaTotal Sanitation — Urban and Rural Combined
Coverage as a Percentage of Population Served
Country1
Oman
Syrian Arab Rep.
Yemen
Total
'opulationiti thousands)
1,468
12,113
10,62024,201
0 - 25%
— ' '
0
26 - 50%
48.2
r - ~ , • : • ' • •
51 - 7 5 %
65.2
7 6 - 100%
—
85.0. . _ , . • ; • .
v :. '1 Countries which reported <?n 199Ö baseline data ifer; Sanitation,
38 • JMP Annual Report 1990

Annex VGeneric Guidelines for DevelopingEnhanced Sector Monitoring at Country LevelThese generic guidelines were developed andrecommended by the participants of theRegional Monitoring Workshops held inJamaica, Swaziland and Benin.
Step One: Review of Monitoring Systems
Strategy:Conduct a survey on the existing monitoringsystems (routine and surveys) and identifystrengths and weaknesses.
Key Indicators:• List of key actors in the sector
II Status of coordination of monitoringmechanism
• Indication of existing types of information/data.
Assumptions:• All actors are willing to cooperate
• Appropriate resources/capacity available.
Step Two: Mobilize and sensitize key actorsat all levels.
Strategies:Conduct a monitoring workshop at the na-tional level to:• Present and discuss findings of Step One.
• Develop recommendations for policyguidelines for implementation
H Explain importance of sharing information
Key Indicators:• Commitment to a joint monitoring system.
• Agreement on who will participate inco-ordination.
• Recommendation on guidelines forimplementation.
Assumption:• Genuine commitment and clear understand-
ing of the need for coordinated monitoring.
Step Three: Strengthen/set up CoordinationCommittees at all levels.
Strategies:• Set up clear Terms of Reference (TORs).
• Institutionalize coordinating committees.
• Conduct monitoring workshops at differentlevels (see Step Two)
Key Indicators:• Clear TORs.
• Work schedule for the coordinatingcommittees.
• Develop TOR for focal point at differentlevels.
Assumption:• Existing institutions have the responsibility
and the capacity to implement the en-hanced monitoring system.
Step Four: Set up focal point(s) (Secretariat).
Strategy:Set up focal points in each sector (sanitation,social sectors, water, local government, etc.) atnational level responsible for monitoring andcoordination through existing structures forreporting to the National Coordination Com-mittee (see Step Three).
Key Indicator:• Sectorial information and data available
regularly at the different levels.
Assumption:• Relevant sector institution has the capacity,
understands the need and is willing to playits part.
Set up focal points
in each sector at
national level
responsible for
monitoring and
coordination through
existing structures...
WHO/UNICEF Joint Monitoring Programme • 39

Evaluate test results
and modify monitoring
system and Plan of
Action as necessary.
Step Five: Develop plan of action andidentify resources.
Strategies:• Using Step One identify type of data
required for each sector.
• Define monitoring actions/activitiesrequired.
• Quantify inputs necessary.
• Set time frames.
Key Indicators:• Draft of the country specific monitoring
system.
• Assessment of existing resources/workplans for all levels.
Assumption:• Coordinating committees (comprising
members of existing monitoring/surveil-lance structures) at different levels are inplace and functioning.
Step Six: Develop country specific monitor-ing system.
Strategy:Set up a sectoral/multi-sectoral working groupto adapt existing monitoring systems to therequirements of the country — includingWAS A M S (which will then feed back into theWASAMS "core indicators").
Key Indicators:• Data collection formats that are simple but
comprehensively developed and feed intothe "core indicators" of WASAMS.
• Data Analysis system setup.
• Feedback mechanism in place.
Assumptions:• Results of Step One obtained.
• Get the commitment of Focal Points in thesectors.
• Appropriate resources/capacity available/mobilized.
Step Seven: Testing the Monitoring System,
Strategies:• Select pilot lest sites at different levels for
implementation.
• Evaluate test results and modify monitoringsystem and Plan of Action as (may be )necessary.
Key Indicator:H Quality and reliability of data, timeliness
and flow of information attained.
Assumption:• Existence of "political will" and resources.
Step Eight: Go to Scale! and continue to usethe "Triple A" (Assessment, Analysis andAction) in a cyclical manner.
Note: Most of the assumptions refer to capac-ity building and advocacy related constraints.These will have to be tackled through trainingand dialogue at different levels with theassistance of ES As if required. ®
40 • JMP Annual Report 1990

WHO/UNICEF Joint Monitoring Programme
The Water Supply and Sanitation Sector Monitoring Report 1990 (Baseline Year)provides a "benchmark" to measure progress of the water and sanitation sector in the1990s. It also furnishes planners and policy makers (both country level and ExternalSupport Agencies) with fundamental information for enhanced planning, policyformulation, advocacy and support needs of the sector.
The publication contains preliminary data on sector coverage, management andfunding, voluntarily provided by 70 governments out of approximately 130 countriesinvited to participate. This high return rate of 54 percent clearly indicates the wish bymany governments to attract greater focus on the water and sanitation sector at country,regional and global levels.
The report draws from experience, crucial lessons learnt, achievements and constraintsof the 1980s in an attempt to better develop a foundation for sector developmentapproaches in the 1990s. In doing so, the report helps to better focus attention on theunserved and underserved, especially those impoverished populations living in marginalurban and rural areas of developing countries. To narrow the gap between the served andthe unserved, the report highlights the need to more seriously promote the use ofappropriate low-cost technologies in an attempt to accelerate the provision of a basic levelof service to all mankind.
And finally, the report puts forward a framework for improved sector planning to helpachieve accelerated sustainable service coverage in the shortest possible time-frame.
For additional information or copies of this report, please write to:
The ChiefWater and Environmental Sanitation Section
UNICEF, HI IFThree United Nations Plaza
New York, NY 10017Fax Number: (212) 326-7438
The ManagerCommunity Water Supply and Sanitation
EHE/CW5World Health organisation
1211 Geneva 27, SwitzerlandFax Number: (4122) 791 0746
The countries shown in colour on the front cover are thosewhich responded to the WASAMS 1990 baseline survey.