Water Supply and Sanitation Sector Cost-Benefit Analysis ...
38
Water Supply and Sanitation Sector Cost-Benefit Analysis Guidance 5/1/19 12:00 am
Transcript of Water Supply and Sanitation Sector Cost-Benefit Analysis ...

Water Supply and
Sanitation Sector
Cost-Benefit
Analysis Guidance
5/1/19 12:00 am

Table of Contents
1. Introduction 3
2. Simple Taxonomy of WASH Project Logics 4
3. General Approaches to the Economic Analysis of Potential WASH Projects 10
4. Estimation of MCC WASH Project Costs 20
5. Detailed Estimation of Project Benefits 21
Appendix: MCC History 26
Endnotes 37
Water Supply and Sanitation Sector Cost-Benefit Analysis Guidance | July 3, 2019
2
Stefan Osborne, Economist, Economic Analysis Division, Department of Policy and Evaluation, MCC
1. Introduction
MCC is required by its statutory regulations to conduct cost benefit analysis (CBA) and to calculate the
economic rate of return (ERR) on projects supported through country compacts. ERRs form a critical part
of the project approval process and are required to equal or exceed a threshold level of ten percent over
the medium term. To clarify methodology and to improve the consistency across country compacts, the
division responsible for estimating ERRs is developing a series of reports outlining methodology for each
major investment sector. This current report is the first and covers Water, Sanitation, and Hygiene
(WASH) projects. Other sector CBA methodology reports are forthcoming. The guidelines aim to help
MCC economists better understand the methodological tools available, and to provide greater
methodological clarity to external practitioners. This should help to provide more consistent application
of CBA methodology.
WASH infrastructure projects can be divided into three basic categories: production and treatment,
transmission, and distribution of water. Production and treatment projects build or rehabilitate central
water pumps or sewage treatment plants. Transmission projects build or rehabilitate systems that
transmit water from central pumping stations to distribution systems. Distribution projects build or
rehabilitate systems that deliver clean water to consumers in greater volumes, on a more reliable basis,
and/or connect new consumers to the system. When distribution by pipeline is infeasible, clean water can
be distributed by digging wells or boreholes. WASH sanitation projects improve public sewer systems
(including building or rehabilitating sewage treatment plants), connect households to sewer systems,
provide households with septic tanks, or provide latrines.
Donor interventions in WASH projects can be justified on economic efficiency grounds by (i) market
failures in the provision of clean water and sanitation, due to information externalities related to hygiene
and health, and environmental externalities from water use and inadequate sanitation practices; and/or
the natural monopoly characteristics of water and sanitation systems; or (ii) government or public service
failures resulting from poor sector or utility governance, including mispricing of water and sanitation
services, costly and/or unreliable service provision, and/or costly system losses.
1
Health externalities
occur because providing cleaner water to existing customers, and extending access to clean water to new
customers, can lower the overall incidence of water-borne diseases. The private benefit to an individual
investing in access to clean water is less than the total societal benefit of one more individual having
access to clean water. Due to such externalities, provision of WASH investments tends to be lower than
the socially optimal level (i.e., the level at which the marginal cost of providing the infrastructure is equal
to the marginal benefit to the society as a whole).
2
In addition, countries may often misallocate their
available water resources across uses and over time. Too much water may be used in low return activities,
and too little in high return activities; when this results in rationing or threatens water scarcity in the near
term, the failure to address market failures adequately can result in a sub-optimal growth trajectory.
Water Supply and Sanitation Sector Cost-Benefit Analysis Guidance | July 3, 2019
3

Insufficient quantity and quality of water and sanitation infrastructure, sometimes combined with a lack
of knowledge and practices of good hygiene, has been identified as a binding constraint to economic
growth in several MCC compact countries. In other cases, water scarcity has been identified as binding to
growth due to a combination of low natural endowments and either conservation failures, allocation
inefficiencies, or both. Specific indicators may include household and firm use of private labor, private
vendors, or tanker services to obtain water at volumes and costs that are high relative to comparator
countries; high time use by households to collect water that imply a large opportunity cost of access; large
estimated disability adjusted life years (DALYs) due to water borne illnesses, particularly diarrhea; and
high collection inefficiencies and system losses combined with high unmet demand at a cost-reflective
price.
These indicators are often supported by an unfavorable level and trend in: i. water and sewage service
coverage relative to benchmark countries; ii. firm perceptions that water is a constraint to investment; iii.
evidence of poor sustainability of water service delivery due to underpricing or low fee collection (with the
resulting low maintenance and reinvestment in the system); and iv. country-specific tax, investment and
regulatory problems. To relieve the constraint, compact countries typically request that MCC invest in
infrastructure for delivering clean water, and these are usually combined with sector reforms to improve
system sustainability and sector performance in a more lasting, systemic way.
To realize the benefits of WASH projects, beneficiary behavior often must change (e.g. end user hygiene
practices). As a result, WASH projects are frequently accompanied by a local outreach strategy.
3
When
feasible the outreach strategy is integrated into the project, but at times it is done as a standalone project.
When integrated into the project, a “behavior change” parameter must be included in the ERR, informed
by evidence or “expert judgment,” that can be evaluated afterwards.
4
Since one of the goals of WASH projects is to reduce potential beneficiaries’ exposure to contaminated
water, drainage projects should be considered WASH projects. To the extent that drainage projects
eliminate flooding, they may also reduce property damage and value added lost to business closures, as
well as time lost in congested traffic via time-consuming detours.
5
Ideally the cost benefit analysis should
be built around a simulation of likely flooding scenarios.
Lastly, recognizing the importance of addressing root causes, activities to improve sector policy,
institutional capacity, and governance play an increasing role in WASH projects. MCC compact countries
frequently seek assistance in enhancing the performance of their WASH utilities by improving sector
governance, the management, commercial and financial viability, service levels, and sustainability of
WASH utilities, and/or changing beneficiary behavior (typically hygiene-related) to maximize the benefits
beneficiaries get from already existing WASH infrastructure.
These guidelines will describe the typical project logic for WASH projects and the associated costs and
benefits, as well as typical institutional reform issues. This is a living document that will be updated
periodically as necessary.
2. Simple Taxonomy of WASH Project Logics
Water Supply and Sanitation Sector Cost-Benefit Analysis Guidance | July 3, 2019
4

WASH projects can be generally categorized by their program logics linking outputs that are funded by
Compacts to potential benefit streams, as shown in Table 1.
Table 1: WASH Project Taxonomy
Project Main Potential Benefit Streams
Central infrastructure (upgrading central
treatment and distribution centers)
Decreased technical losses, increased
supply, lower costs of service, improved
reliability, and/or lower all-in water prices
for consumers. If consumption increases,
increased consumer surplus.
Reform of sector governance, utility
governance and/or ownership, regulation,
financial arrangements
Decreased commercial losses, more
sustainable service or system expansion,
leading to higher future supply and/or
lower costs of service (or substitution
from higher cost sources) for consumers.
Infrastructure Extension (extending water
and sewer pipes to unserved
neighborhoods)
Improved health outcomes, decreased
time gathering water for water extension
projects
Other water infrastructure (boreholes,
wells, etc.)
Improved health outcomes, decreased
time gathering water, greater production
Other sanitation infrastructure (latrines,
septic tanks, etc.)
Improved health outcomes
Project logics are logical models that outline the cause and effect relationships between the outputs
provided by the project and the outcomes underlying the beneficiary streams captured in the economic
analysis of a project. Included in these cause and effect relationships are assumptions upon which the next
level of outcomes depend. For example, whether health outcomes are improved by providing increased
access to clean water may depend on a number of behavioral changes necessary to prevent contaminants
from being introduced into clean water in the household. This assumption about the connection between
access to clean water and health impacts is critical to the cause and effect chain (“results chain”) and to
avoiding leaps of logic in its articulation.
As with all logics, the particular operational context is paramount—there is no such thing as a definitive
or standard logic. For example, if evidence demonstrates that households generally do not practice safe
hygiene, then an accompanying activity may be required to address this, and “safe hygiene practices”
would become a medium-term outcome targeted by the activity, as opposed to an assumption.
6
A project
logic is a living guide that should be responsive to feedback from the context in which it operates.
Three examples of project logics are provided here for time savings, health benefits, and cost savings.
WASH infrastructure provides clean water that, combined with proper hygiene practices, can significantly
reduce the burden of water-borne diseases in a country’s population, increasing the overall productivity of
Water Supply and Sanitation Sector Cost-Benefit Analysis Guidance | July 3, 2019
5
the country’s endowment of labor. It can also significantly lower the amount of time households must
spend gathering water. Lastly, policy and institutional reform WASH projects can improve the
productivity of capital invested in the sector (e.g., by implementing a maintenance program to reduce
physical leaks), and thereby lower the cost of water delivery to the utility’s customers, and may increase
service quality and expanded service, depending on the context and the reform in question.
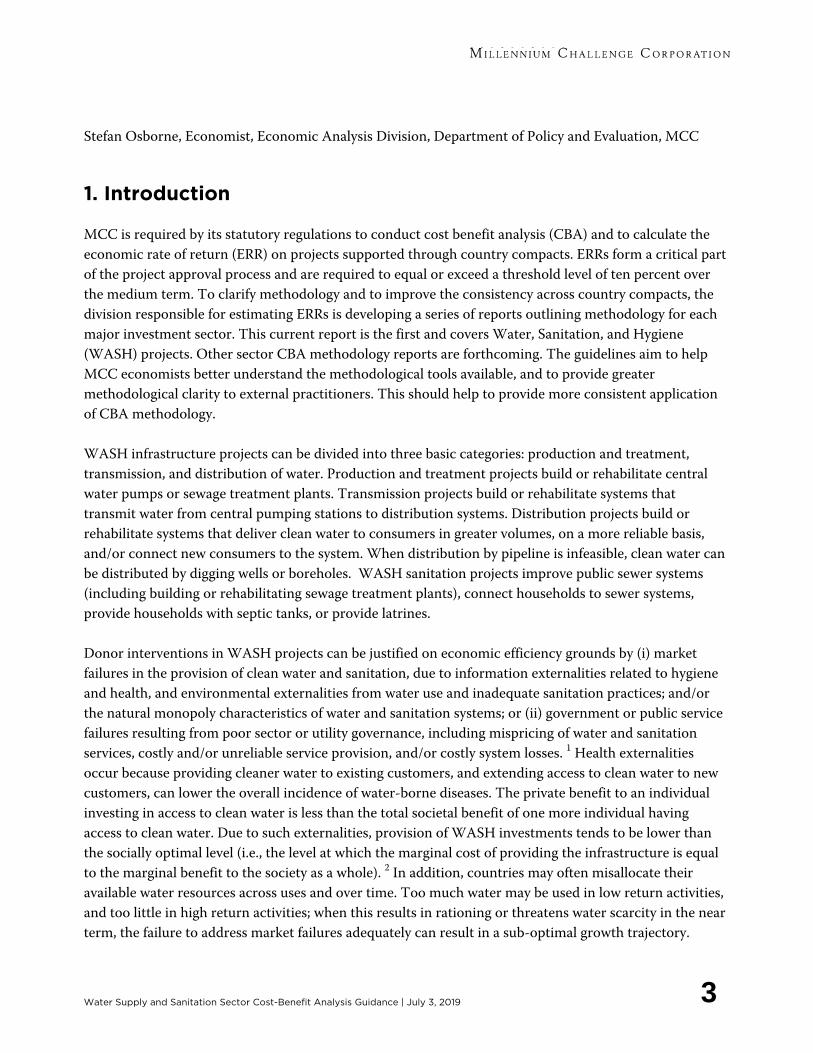
Time Savings from Collecting Water
In some countries women and children are the main household members responsible for gathering water.
One of the main benefit streams from WASH projects, particularly in rural settings, is reducing time spent
gathering water. Absent data about children’s wages and the opportunity cost of children’s time not spent
in education and other enrichment activities, we assume that time spent by children getting water is
substitutable with women’s time – if the children don’t do this chore, the women in the household have to
do it. For the time-savings benefit stream of WASH projects, the project logic may look like that in Table
2.
Table 2: Example Project Logics for Time Savings from Collecting Water
Time Savings (for a
networked WASH
system)
Assumptions Indicators
Infrastructure
Output
New pipes
connecting
households to
existing network
installed
Length of pipe laid
Project Output Households that
previously had to
leave house to
collect water are
now connected to
the new pipes
Last mile
connections are
either affordable or
paid for by the local
government, and
households choose
to connect
Number of
households
connected
Short Term
Outcome
Switching from
other sources to tap
water and time
savings accrued
Tap water
consumption
Time spent
collecting water
Long Term
Outcome
Time savings used in
productive (market
or domestic) or
leisure activities
No barriers to entry
to labor markets –
leisure, if chosen, is
chosen voluntarily
Value of time saved,
valued according to
guidelines
Goal Increase in
household
Household income
or expenditures /
Water Supply and Sanitation Sector Cost-Benefit Analysis Guidance | July 3, 2019
6
Time Savings (for a
networked WASH
system)
Assumptions Indicators
income/value added
from home
production/leisure
good consumption
consumption
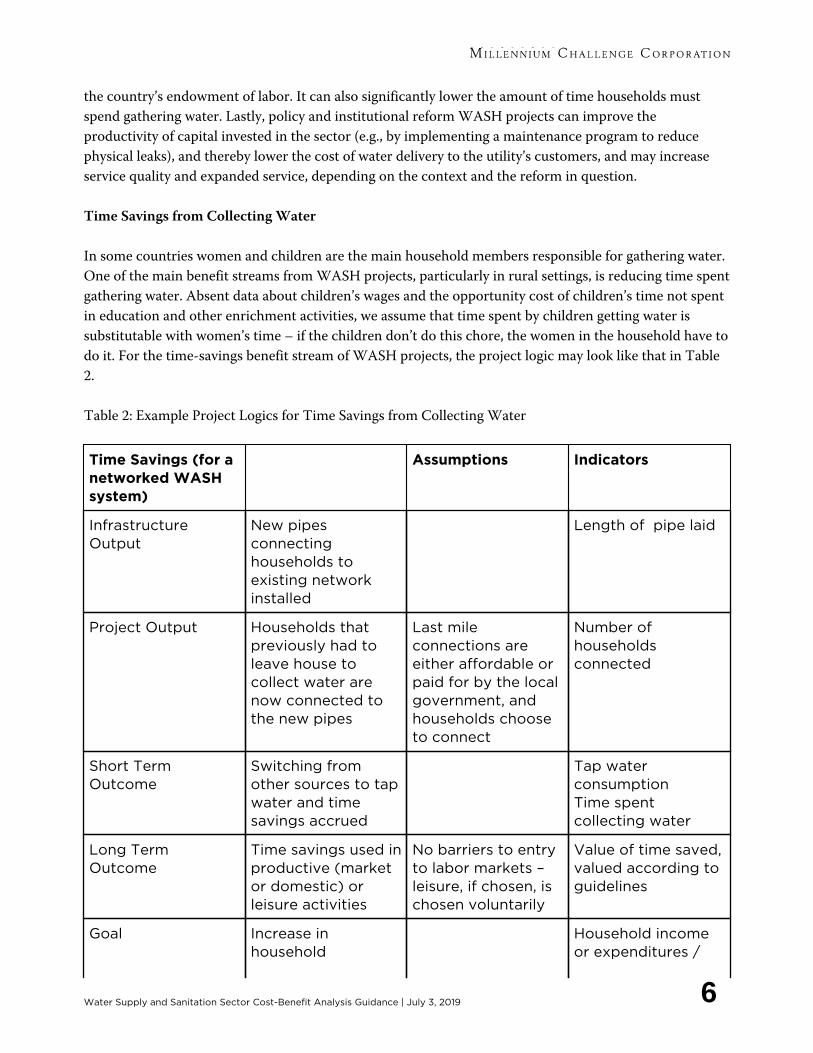
Health Benefits
When the provision of water to the populace is below the social optimum, there may be health benefits
from increasing access to clean water. These health benefits depend on new water and sanitation users
connecting to the system and/or higher levels of water use per capita. However, the expense of accessing
clean water is often prohibitive for poor households, many of whom cannot access the necessary finance
for a connection, and utilities may be financially incapable of financing connections through user fees. In
many cases, health benefits also depend on households’ adopting new hygiene practices. The project logic
must explicitly account for how new users will be connected to the new infrastructure, and what will lead
to changes in their hygienic practices, if necessary, to realize benefits.
7
It should be noted that water systems that do not maintain continuous 24-hour pressure can allow
contamination from groundwater to seep in, defeating the purpose of the project. The economist should
always ask water sector counterparts on the team if achieving 24-hour pressure is necessary and
accounted for in the project logic.
Table 3: Example Project Logic for Health Benefits
Health Benefits (for
a networked WASH
system)
Assumptions Indicators
Infrastructure
Output
New pipes
connecting
households to
existing network
installed
Length of pipe laid
Project Output Households that
previously had to
leave house to
collect water are
now connected to
the new pipes
Last mile
connections are
either affordable or
paid for by the local
government, and
households choose
to connect
Number of
households
connected
Short Term
Outcome
Households reduce
consumption of
contaminated water
Households engage
in safe water
storage and
Tap water
consumption
Tested water is not
Water Supply and Sanitation Sector Cost-Benefit Analysis Guidance | July 3, 2019
7

Health Benefits (for
a networked WASH
system)
Assumptions Indicators
in favor of clean
water
handling practices
so tap water is not
contaminated
contaminated
Long Term
Outcome
Incidence of water-
borne diseases
declines
Incidence of
infectious diarrhea,
stunting/wasting
Goal Decrease in DALYs
lost
Days spent suffering
from/caring for
diarrhea declines,
under 5 deaths
decline,
stunting/wasting
declines
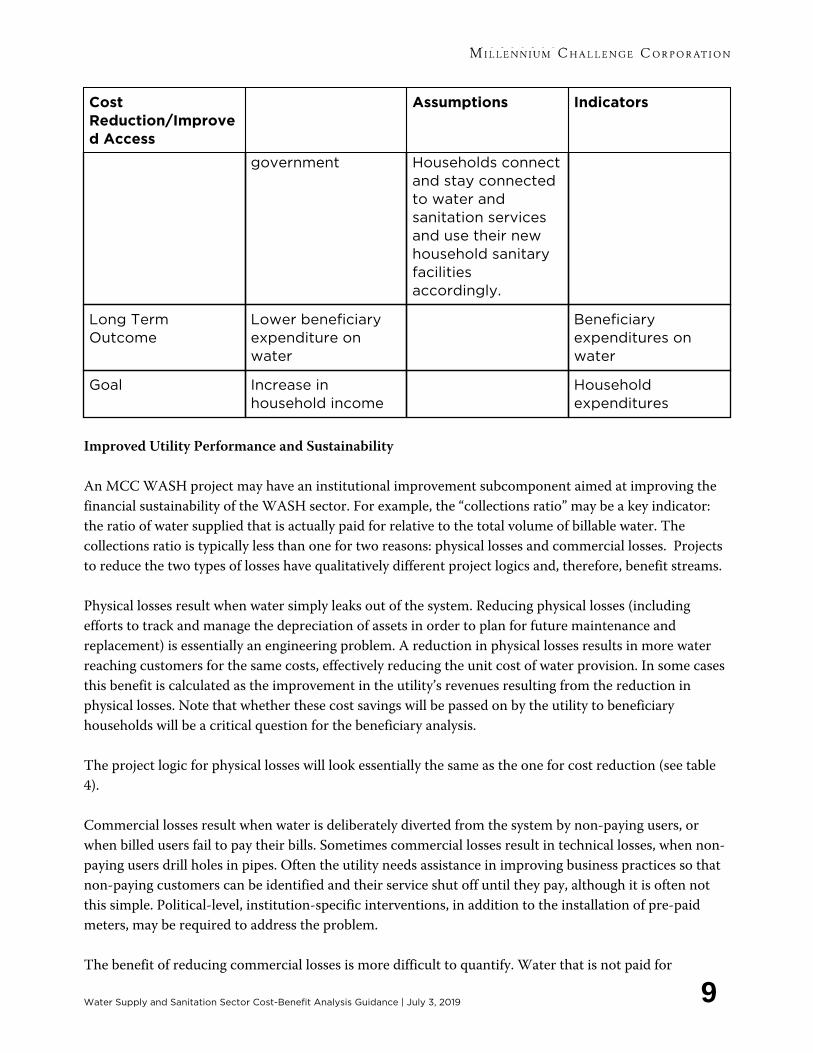
Project Logic for Cost Reduction/Improved Access
In some countries, the main problem associated with water is its overall scarcity, and the benefits
associated with health or time savings are relatively low compared to reducing the cost of water. In some
cases benefits can be measured with “revealed preferences” estimates associated with reducing the costs of
water using observations of consumer expenditures on marketed commodities (like bottled water), but in
some cases the full benefits are better captured by measuring the increase in consumer surplus resulting
from increased water consumption through a stated-preference survey.
Table 4: Example Project Logic for Cost/Reduction/Improved Access
Cost
Reduction/Improve
d Access
Assumptions Indicators
Infrastructure
Output
Repair of partially
and fully
depreciated pipes
Length of targeted
pipe repaired
Project Output Lower technical
losses
Technical losses
Short Term
Outcome
Increased revenue
per unit of water
supplied by utility
Increased water
supply to customers
is monetized
Utility revenue
Medium Term
Outcome
Cost savings are
passed on to
shareholders,
consumers, or
Utility regulatory
agency performing
price setting
function adequately
Water tariffs
Water Supply and Sanitation Sector Cost-Benefit Analysis Guidance | July 3, 2019
8
Cost
Reduction/Improve
d Access
Assumptions Indicators
government Households connect
and stay connected
to water and
sanitation services
and use their new
household sanitary
facilities
accordingly.
Long Term
Outcome
Lower beneficiary
expenditure on
water
Beneficiary
expenditures on
water
Goal Increase in
household income
Household
expenditures
Improved Utility Performance and Sustainability
An MCC WASH project may have an institutional improvement subcomponent aimed at improving the
financial sustainability of the WASH sector. For example, the “collections ratio” may be a key indicator:
the ratio of water supplied that is actually paid for relative to the total volume of billable water. The
collections ratio is typically less than one for two reasons: physical losses and commercial losses. Projects
to reduce the two types of losses have qualitatively different project logics and, therefore, benefit streams.
Physical losses result when water simply leaks out of the system. Reducing physical losses (including
efforts to track and manage the depreciation of assets in order to plan for future maintenance and
replacement) is essentially an engineering problem. A reduction in physical losses results in more water
reaching customers for the same costs, effectively reducing the unit cost of water provision. In some cases
this benefit is calculated as the improvement in the utility’s revenues resulting from the reduction in
physical losses. Note that whether these cost savings will be passed on by the utility to beneficiary
households will be a critical question for the beneficiary analysis.
The project logic for physical losses will look essentially the same as the one for cost reduction (see table
4).
Commercial losses result when water is deliberately diverted from the system by non-paying users, or
when billed users fail to pay their bills. Sometimes commercial losses result in technical losses, when non-
paying users drill holes in pipes. Often the utility needs assistance in improving business practices so that
non-paying customers can be identified and their service shut off until they pay, although it is often not
this simple. Political-level, institution-specific interventions, in addition to the installation of pre-paid
meters, may be required to address the problem.
The benefit of reducing commercial losses is more difficult to quantify. Water that is not paid for
Water Supply and Sanitation Sector Cost-Benefit Analysis Guidance | July 3, 2019
9
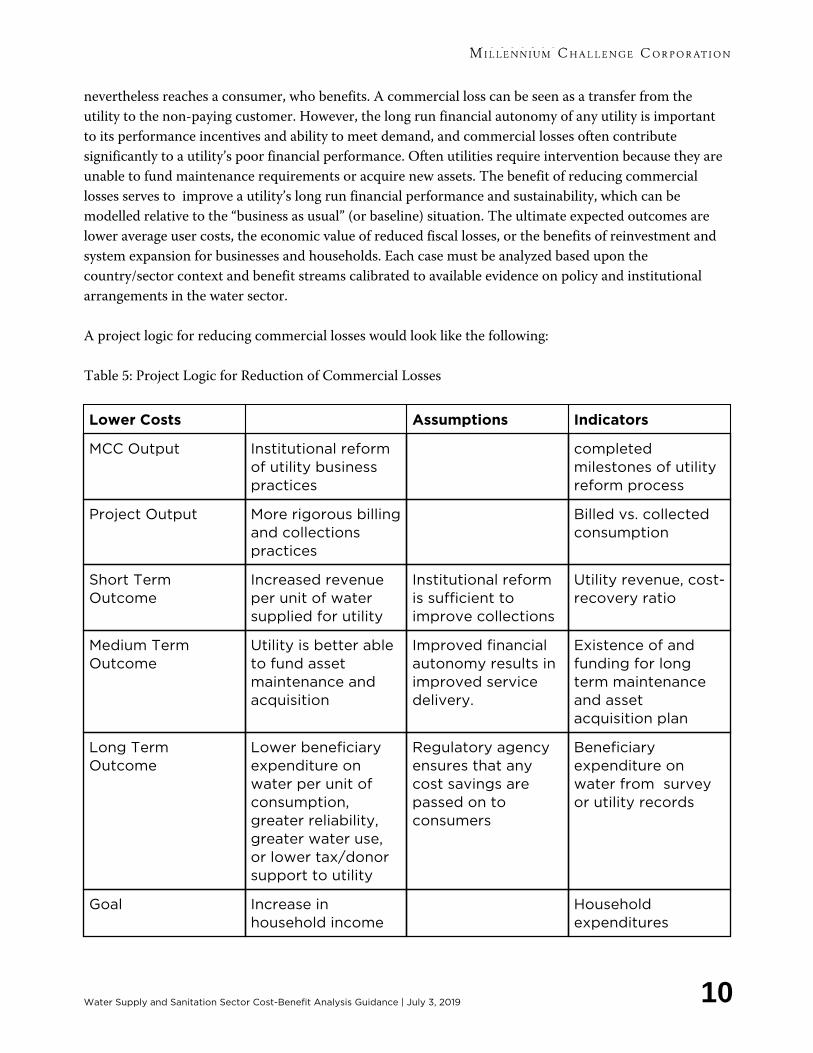
nevertheless reaches a consumer, who benefits. A commercial loss can be seen as a transfer from the
utility to the non-paying customer. However, the long run financial autonomy of any utility is important
to its performance incentives and ability to meet demand, and commercial losses often contribute
significantly to a utility’s poor financial performance. Often utilities require intervention because they are
unable to fund maintenance requirements or acquire new assets. The benefit of reducing commercial
losses serves to improve a utility’s long run financial performance and sustainability, which can be
modelled relative to the “business as usual” (or baseline) situation. The ultimate expected outcomes are
lower average user costs, the economic value of reduced fiscal losses, or the benefits of reinvestment and
system expansion for businesses and households. Each case must be analyzed based upon the
country/sector context and benefit streams calibrated to available evidence on policy and institutional
arrangements in the water sector.
A project logic for reducing commercial losses would look like the following:
Table 5: Project Logic for Reduction of Commercial Losses
Lower Costs Assumptions Indicators
MCC Output Institutional reform
of utility business
practices
completed
milestones of utility
reform process
Project Output More rigorous billing
and collections
practices
Billed vs. collected
consumption
Short Term
Outcome
Increased revenue
per unit of water
supplied for utility
Institutional reform
is sufficient to
improve collections
Utility revenue, cost-
recovery ratio
Medium Term
Outcome
Utility is better able
to fund asset
maintenance and
acquisition
Improved financial
autonomy results in
improved service
delivery.
Existence of and
funding for long
term maintenance
and asset
acquisition plan
Long Term
Outcome
Lower beneficiary
expenditure on
water per unit of
consumption,
greater reliability,
greater water use,
or lower tax/donor
support to utility
Regulatory agency
ensures that any
cost savings are
passed on to
consumers
Beneficiary
expenditure on
water from survey
or utility records
Goal Increase in
household income
Household
expenditures
Water Supply and Sanitation Sector Cost-Benefit Analysis Guidance | July 3, 2019
10

3. General Approaches to the Economic Analysis of Potential
WASH Projects
Given MCC’s mission to alleviate poverty through economic growth, cost-benefit analysis approaches that
value and measure benefits as proximate to real incomes as possible are preferred. Depending upon the
context, program objectives, and logic, there are two general approaches CBA of WASH projects may
take. The first approach entails a detailed investigation into separate benefit streams that model effects on
real lifetime incomes most directly – in particular, health benefits, time savings benefits, and other cost
savings on the part of WASH consumers. These include the effects on productive users – firms,
households, and laborers, and in some cases they may include induced benefits of increased production,
investment, and labor income beyond the immediate cost savings. Measuring benefits in this way allows
MCC to better track and understand the channels of impact on real incomes and to value health
externalities. It is the most informative approach for projects in which health and/or nutrition outcomes
represent key objectives of the proposed investment.
The second approach is to model changes in consumer surplus, a method which in principle combines all
private benefits into a single metric. Depending on the logic and objectives of the proposed investment,
this may be the most feasible approach. In both cases, changes in producer surplus for domestic providers
of WASH services would also be captured in the analysis. As described in MCC’s general guidelines for
CBA and Beneficiary Analysis, the estimation of benefits consists of a comparison of the benefit and cost
streams “with” and “without” the investment or project as proposed.
There is a rich literature that describes the health benefits of supplying communities with clean water and
sewage treatment facilities, and a literature describing how to monetize time saved from improved access
to water.
8
The magnitude of each benefit stream will depend crucially on the context and design of each
project. Although more studies are needed, some previous attempts to value both of these benefit streams
find that, on average, time savings account for about three quarters of benefits, with increased
productivity from improved health accounting for the other quarter (Hutton and Haller 2004, figures 7 &
8). The MCC experience has been varied – while time savings were in fact about three quarters of benefits
in the Zambia compact WASH project, time savings were only 15 and 11 minutes per day per beneficiary
in Tanzania and Ghana, respectively.
For all benefit streams, socio-economic data should be gathered, either from the beneficiary population
directly or from the compact country’s most recent socio-economic survey, which provide information on
household income and relevant demographic data (e.g. household size, gender, age and education level of
household members, etc.). For purposes of the beneficiary analysis, the beneficiary data should be
categorized by MCC’s standard income categories.
9
If possible (perhaps during the due diligence stage if
compact country data is not available), data should be gathered on time and monetary expenditure on the
collection of water from various sources.
This baseline reference estimate can be improved if data on the availability and quality of water for the
project beneficiaries is available.
10
Because water can be contaminated at the source of collection,
Water Supply and Sanitation Sector Cost-Benefit Analysis Guidance | July 3, 2019
11
between the source and the storage container at home, and after it is drawn from the storage container,
the quality of water should be sampled from (at least) three sources: the original source of the water, the
pipe/faucet that delivers water to the end user, storage containers in the home, and after water is drawn
from the storage container for drinking water, cooking, cleaning, and laundry.
Regarding the second approach, estimated consumer surplus, benefits may have to be estimated using a
revealed or stated preference methodology depending on data availability. For example, beneficiaries’
expenditures on bottled water can be used to derive “revealed” willingness to pay for clean water.
If market data are not available to produce “revealed preference” estimates of WTP, then either more
indirect methods for estimating health and time savings estimates must be used, or, if even such indirect
methods are infeasible, a contingent valuation (CV) survey can be used to estimate stated preferences.
MCC has not developed separate internal guidelines for conducting CV surveys, but adheres to NOAA’s
2001 guidelines (NOAA, 2001). NOAA conducts CBA of the Endangered Species Act, which requires
them to estimate the benefit of preventing the extinction of species on the endangered species list and
have accumulated considerable experience in conducting CV surveys.
3.1 Potential Health Benefits
People who are exposed to and consequently ingest contaminated water are vulnerable to a number of
diseases, for example: infectious diarrhea, schistosomiasis, intestinal nematodes, and lymphatic filariasis.
They can be exposed to contaminated water as a result of ingesting water from contaminated sources,
contaminating clean water themselves due to poor hygiene, or exposure to flood waters as a result of poor
drainage. Poor drainage can also lead to standing water that can serve as a breeding ground for malaria-
carrying mosquitoes.
11
12
These diseases lead to loss of labor productivity in two main ways, death and
disability. Malaria and schistosomiasis, for instance, have both death and disability effects.
Infectious diarrhea is the water-borne disease that leads to the most labor productivity loss and can be
addressed with water quality and sanitation projects
13
. Diarrhea’s main impact is through child mortality
– if the victim survives, and if severe stunting does not occur as a direct result, there is no long-lasting
disability impact (see table 6). Intestinal nematodes and lymphatic filariasis have almost the opposite
effect – both are rarely fatal but have significant disability effects.
Infectious diarrhea not only results in significant loss of life, but significantly contributes to malnutrition
in young children (ages 0-5), thus increasing the risk of stunting.
In 2009, the International Initiative for Impact Evaluation (3ie) published a meta-analysis of 65 impact
evaluations of WASH interventions aimed at reducing the incidence
14
of childhood diarrhea.
15
The study
categorized interventions into five types: water supply, water quality, sanitation, hygiene, and
combinations of water, sanitation, and hygiene.
Esrey et al. (1991) found that water supply and sanitation reduced the prevalence of schistosomiasis by
Water Supply and Sanitation Sector Cost-Benefit Analysis Guidance | July 3, 2019
12

77%, ascariasis by 29%, and hookworm by 4%. Schistosomiasis can be more difficult to track than diarrhea.
The best known way to track diarrhea incidence is to conduct a survey, which is relatively straightforward
(despite the usual weaknesses associated with relying on recall and etc. in household surveys), while
tracking schistosomiasis incidence is harder.
For drainage projects, the estimated malaria reduction can be derived from a study by Castro, et al (2010)
16
that found “restoring and maintaining drains in Dar es Salaam has the potential to eliminate more than
40% of all potential mosquito larval habitats.”
The “without project” estimate of disease incidence requires data on incidence or prevalence of the
disease of interest. Preferably, the data should be sampled directly from the beneficiary population, but
more aggregated World Health Organization (WHO) data can be the default option if more disaggregated
data are not available. Diarrheal disease prevalence is typically available at sub-national levels (importantly
– by urban/rural status) through DHS and MICS surveys.
Converting Incidence Reduction into Income Using the Human Capital Approach
To convert reductions in disease incidence into income, we must estimate the effects of lowering death
and disability on productivity and life expectancy. For diarrhea, we must also estimate the impact on
income of reducing the stunting effect associated with diarrhea’s contribution to malnutrition when it
occurs among young children.
Early estimates of benefits used in MCC ERRs focused on costs associated with hospital visits and ad hoc
measurements of productivity losses. The problem with this approach is it is not consistent across
countries. The Disability Adjusted Life Year is calculated by the WHO in a consistent manner across
countries and is therefore one of the few current metrics associated with health-related benefits that can
guarantee consistency across WASH projects in different countries.
17
The DALY metric breaks the effects
of disease into two components, years of life lost due to death (YLL) and equivalent years lost due to
disability (YLD). While not explicitly designed for converting health effects into income, to the extent that
the metric is a valid measure of productivity loss, we can assign the value of the marginal productivity of
labor to it. Assuming a perfectly competitive labor market, we can use the opportunity cost of time (see
discussion above) as the marginal productivity of labor. We use this metric (DALY*OCT) as the default
unless we have specific knowledge of a particular case that allows us to construct a more accurate metric
that is still meaningfully consistent across countries.
For stunting, we estimate the lifetime impact that stunting has on education and labor market
participation. Stunting is defined as having a height-for-age more than two standard deviations below the
median of the NCHS/WHO growth reference (WHO 1995). Alderman et al. (2006) find that stunted
children enter school one and a half years later (on average) and enter the workforce 1 year later. The
lifetime income impact estimates rely on returns to education and work experience. To estimate these
returns, we recommend using a Mincer regression, on which there is considerable literature described in
detail in EA’s guidelines for Mincer regressions.
18
Calculating and Valuing DALYs
Water Supply and Sanitation Sector Cost-Benefit Analysis Guidance | July 3, 2019
13
The main health benefits from WASH projects come from lower incidences of infectious diarrhea. WASH
projects also affect the incidence of other diseases (schistosomiasis, lymphatic filariasis, intestinal
nematodes). In the first example below we will describe how the benefits from infectious diarrhea would
be calculated, since it is the most common target of MCC interventions. The next example considers a
disease that has a more significant disability component.
Disability effects can also be estimated using days of work lost, instead of the YLD component of the
DALY (counting both would be double counting). The advantage of this metric is it is relatively easy to
measure (either by visiting clinics for administrative data or including relevant questions in a survey). The
tradeoff is it will tend to underestimate productivity losses that are not acute enough to result in missed
work time. In the case of diarrhea, days of work lost to illness will be very small compared to days lost due
to death, especially for children under 5. The economist should use their judgement whether to invest
resources in collecting days of work lost data.
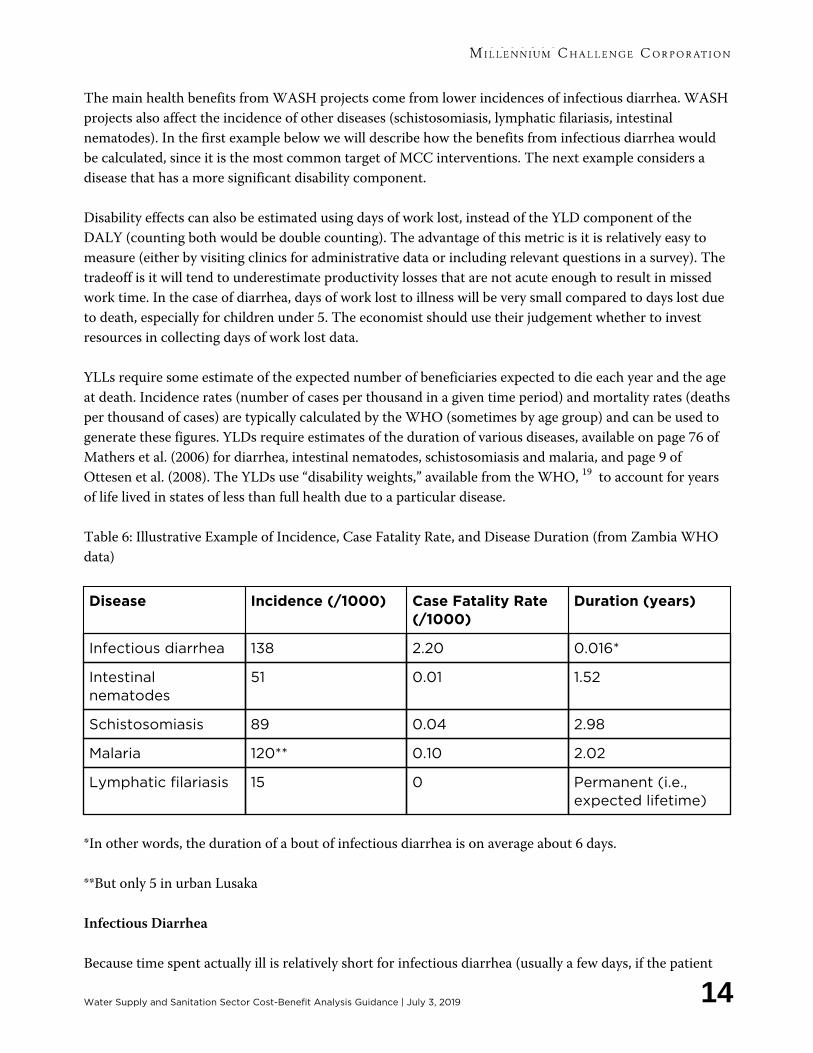
YLLs require some estimate of the expected number of beneficiaries expected to die each year and the age
at death. Incidence rates (number of cases per thousand in a given time period) and mortality rates (deaths
per thousand of cases) are typically calculated by the WHO (sometimes by age group) and can be used to
generate these figures. YLDs require estimates of the duration of various diseases, available on page 76 of
Mathers et al. (2006) for diarrhea, intestinal nematodes, schistosomiasis and malaria, and page 9 of
Ottesen et al. (2008). The YLDs use “disability weights,” available from the WHO,
19
to account for years
of life lived in states of less than full health due to a particular disease.
Table 6: Illustrative Example of Incidence, Case Fatality Rate, and Disease Duration (from Zambia WHO
data)
Disease Incidence (/1000) Case Fatality Rate
(/1000)
Duration (years)
Infectious diarrhea 138 2.20 0.016*
Intestinal
nematodes
51 0.01 1.52
Schistosomiasis 89 0.04 2.98
Malaria 120** 0.10 2.02
Lymphatic filariasis 15 0 Permanent (i.e.,
expected lifetime)
*In other words, the duration of a bout of infectious diarrhea is on average about 6 days.
**But only 5 in urban Lusaka
Infectious Diarrhea
Because time spent actually ill is relatively short for infectious diarrhea (usually a few days, if the patient
Water Supply and Sanitation Sector Cost-Benefit Analysis Guidance | July 3, 2019
14

survives), the main benefits from reducing incidence of infectious diarrhea can be measured simply
through years of life lost (YLLs), making the ERR calculation slightly simpler. YLLs due to infectious
diarrhea can be estimated using a breakdown of the host country’s population by age, and death rates per
1000 (broken down by age group where feasible).
20
Next, we need to estimate the reduction in infectious diarrhea incidence that will result from the project.
As mentioned above, the current main source for this estimate is a 2009 meta-analysis by the
International Initiative for Impact Evaluation (3IE), “Water, sanitation and hygiene interventions to
combat childhood diarrhea in developing countries.” Figure 5 on page 27 summarizes the effects of
various WASH interventions on the incidence of infectious diarrhea. Water quality interventions reduce
infectious diarrhea incidence by about 42%, while sanitation interventions reduce incidence by 37%.
Although the 3ie study did not examine drainage interventions directly, we currently apply the same
incidence reduction estimates as for sanitation interventions, 37%. We will update this recommendation
based on the impact evaluation for the Zambia WASH project.
We calculate the number of deaths in the baseline, “without project,” and the number of deaths “with
project.” Incidence rates and death rates will vary by country. The data are available from the WHO or the
country’s health ministry. The value of deaths avoided each year becomes the benefit stream for health. As
a starting point, the economist could base the YLL calculation on the average characteristics of the
beneficiary population. When possible, further disaggregation to incorporate age (younger beneficiaries
lose more years of life than older ones) and incidence/death rate by age is desirable to more accurately
estimate benefits.
An example helps to clarify concepts. Suppose a WASH project will improve availability of clean water to
10,000 beneficiaries. The “without project” incidence of infectious diarrhea is currently 140 per 1000. The
intervention is expected to reduce incidence by 40%, so the “with project” incidence rate will be 84 per
1000. Every case of infectious diarrhea has an associated 0.5% chance of death, so the number of deaths
“without project” is 0.5%*140=0.7 deaths per thousand, while deaths “with project” is 0.5%*84=0.4 deaths
per thousand. Thus, the intervention will prevent 0.3 deaths per thousand of beneficiaries. The present
discounted value (PDV) of future earnings from the average beneficiary at the time of death, multiplied by
the number of deaths prevented, is the annual benefit from the intervention. If the project has 10,000
beneficiaries, it will prevent 3 deaths each year. If the PDV of future earnings is $100,000, then the benefit
stream is $300,000 per year.
Another commonly used method to assign value to life lost to disease and disability is to use the value of a
statistical life (VSL). This method has the advantage of being derived from the value victims of disease put
on their own life themselves, rather than valuing people in terms of the income they earn (putting a lower
value on the lives of relatively poor people). Since using VSL has become standard practice in CBA in high
and middle income countries, we are investigating some suggested approaches for adopting VSL for our
purposes. The results of our investigation will be described in the next iteration of this guidance.
Other Diseases
The other diseases besides diarrhea can have labor productivity losses besides loss of life. In cases where
Water Supply and Sanitation Sector Cost-Benefit Analysis Guidance | July 3, 2019
15

the lower labor productivity is primarily a result of work days lost, the economist should assign a value to
that using the beneficiary’s opportunity cost of time. In cases where the illness does not result in lost work
days, but rather lower labor productivity overall, the economist can use the opportunity cost of time of
“years lost to disability” (YLD).
Calculating an additional YLD component follows a methodology similar to that described above for the
YLL component. The main difference is that we use the value of time spent with disability avoided,
instead of the value of deaths avoided, as the annual benefit stream.
For example, suppose the WASH project described in the previous example is expected to significantly
reduce schistosomiasis in the beneficiary population. The “without project” incidence of schistosomiasis is
currently 90 per 1000. The intervention is expected to reduce incidence by 40%, so the “with project”
incidence rate will be 54 per 1000. Every case of schistosomiasis has an associated 0.004% chance of death,
so the number of deaths “without project” is 0.004%*90=0.0036, while deaths “with project” is
0.004%*54=0.0022, so the intervention prevents 0.0014 deaths per thousand. If the project has 10,000
beneficiaries, and the PDV of future earnings is $100,000, the benefit stream from deaths avoided is
$1,400. Furthermore, each incidence of schistosomiasis lasts for 3 years, with a disability weight of 0.006,
resulting in the equivalent of 3*0.006=0.018 years of life lost. Reducing the incidence of schistosomiasis
from 90 to 54 per thousand results in a reduction in YLDs of 36*0.018=0.648 per thousand. If the value of
YLDs is approximately equal to per capita income, and per capita income is $10,000, then the reduction in
YLDs generates $64,800 in benefits each year (from the 10,000 beneficiaries). The benefits from reducing
incidence of schistosomiasis clearly come mainly from reducing the disability side of the health effect.
In these examples, the benefits from reducing incidence of schistosomiasis are significantly lower than
those from reducing incidence of infectious diarrhea. As other diseases tend to have even lower
combinations of prevalence, death rate, and disability rates compared to schistosomiasis, it may be
sufficient to limit the ERR calculation to benefits associated with the top two or three most costly water-
borne diseases in the relevant context. In some contexts, substantial malaria benefits may accrue from a
drainage project, and including these would be important in those cases.
21
Calculating and Valuing Lifetime Earnings Lost to Stunting
Cases of infectious diarrhea that occur in young children aged 0-2 can produce stunting, which typically
leads to children entering the educational system a year later (reducing their overall education) and
entering the workforce later (reducing their lifetime earnings).
22
The core of this methodology is a Mincer regression that can assign relative returns to extra years of work
experience and education. Since Mincer regressions are standard tools used in Constraints Analyses, a
Mincer regression will already be available for most compact countries. We recommend using Mincer
regressions that have applied the standard MCC methodology.
23
The returns to education are combined
with the effect that infectious diarrhea cases have (through malnutrition) on stunting. Teshome et al.
(2009) find that “children [aged 0-5 years] experiencing diarrhea were 2.3 times more likely to be stunted
compared to the reference category (i.e., children without diarrhea).”
Water Supply and Sanitation Sector Cost-Benefit Analysis Guidance | July 3, 2019
16

See Appendix 3 for an example that uses the odds ratio in Teshome et al. (2009) to determine the
expected reduction in stunting.
3.2 Time Savings Benefits
One of the main benefit streams associated with WASH projects is time saved gathering water. The
benefit of decreased time spent gathering water is measured by comparing time spent with and without
the project and multiplying that difference by the value of time of the beneficiaries.
In a standard household utility maximization model, in an interior solution with no barriers to entry to
the labor market, the household will allocate time across leisure, home production, and time spent earning
a wage such that the marginal value of all the activities is equal. In that case the opportunity cost of time of
a given family member is equal to the wage they would earn in the market.
When there are barriers to entry, it may not be optimal for the utility maximizing household to assign
family members with lower marginal labor productivity to wage earning activities, even when the market
wage is somewhat higher than the marginal value to the household of those family members engaging in
home productivity or leisure. Since households typically assign the low productivity family members (i.e.
women and children) to collecting water, using the market wage may overestimate the value of time in the
presence of significant barriers to entry. Employment indicators, like the difference between genders in
labor force participation rates, could be an indicator of whether this is a problem. In countries where the
gender gap in labor force participation (LFP) is particularly wide, the team economist should suggest the
project also address women’s access to the labor market – it won’t help the household as much if all the
freed up time is spent, involuntarily, on leisure or low productivity household production because of
exogenous barriers to working. Another way to reflect the relative size of exogenous barriers to entry for
women is to use the difference in LFP rates between genders to discount market wages, if the country
team agrees this is necessary.
24
Because the market wage for children is sometimes not collected by labor force surveys, and the resulting
wage probably does not reflect the opportunity cost of time spent in educational activities, we recommend
the economist value children’s time as equivalent to the time of adult women in the household.
Absent indicators of significant barriers to entry to the labor market, women’s time can be reliably
measured by their wage. The first best method to collect women’s wage information is to conduct a wage
survey of the beneficiary population targeted by the project, although the compact development timeline
typically does not allow enough time to do this. The second best source of wage data would be from a
recent labor force survey, if available. Absent that, the average wage (of unskilled labor, if available) for
women from a labor force publication can be used.
Use caution in using an administratively-set minimum wage, since it often significantly overestimates the
unskilled wage rate and is likely imperfectly enforced.
Absent an estimate of targeted beneficiaries’ wages, the economist should endeavor to construct a value of
Water Supply and Sanitation Sector Cost-Benefit Analysis Guidance | July 3, 2019
17

work from available sources that is a defensible proxy for the average income per hour of either the
project’s beneficiaries or of unskilled labor, in similar economic activities to those in which they are
already engaged.
3.3 Cost Savings
In addition to time savings and health benefits, consumers of water and sanitation services may
experience lower prices per unit of consumption. This could arise through substitution away from bottled
water, or the reduced use of storage tanks and/or more costly drilling for ground water. This benefit, when
applied to the original consumption level, is theoretically equivalent to an increase in real income, without
double counting the benefits of increased water consumption on health.
3.4 Consumer Surplus Approach
MCC prefers to utilize income-proximate methods described above to quantify benefit streams of WASH
projects. However, there may be times when estimating the individual benefit streams separately is
impractical, likely to miss important economic benefits, and/or is double counting. An alternative method
is to measure the total consumer surplus gained as a result of expanded access or improved service. This
approach would in principle capture the valuation of all benefit streams accruing to individual households
and businesses, including health and time savings benefits, cost savings benefits to businesses and
households, as well as the welfare benefit to consumers of having access to an expanded consumption
possibility set.
There are two main methods of capturing changes in consumer surplus, depending on whether the good
is actively traded on a market. If there is an established history of market transactions of the good in
question, the “revealed preferences” technique can be used to estimate willingness to pay for a marginal
increase in supply of the product. This is a fairly standard technique described in most microeconomics
textbooks. For example, the willingness to pay for the reduction of noxious odors associated with a water
treatment plan should be represented in the price tenants and owners are willing to pay to live in
neighborhoods where such odors are present. Using differences in rent paid for various objectively
measurable amenities – the presence or absence of toilets, electricity, water connections, proximity to
sources of noxious odors – is called a “hedonic regression,” a standard econometric technique.
Estimating the willingness to pay for a good for which there is no readily available market data can be
more complicated. For example, what is the willingness to pay for lower waterborne disease exposure due
to cleaner surface and groundwater supplies? Such benefits tend not to be tied to a specific location and
are difficult to measure using hedonic regressions. When an individual household connects to a
centralized sewage system, the household’s effluent does not enter the groundwater supply, lowering
exposure to waterborne diseases for all households accessing water from that watershed. Such
“consumption externalities” can be quantified by conducting a survey of household’s willingness to pay for
lower incidence of waterborne diseases.
The standard technique is to conduct a “stated preference” (alternately, willingness to pay or contingent
Water Supply and Sanitation Sector Cost-Benefit Analysis Guidance | July 3, 2019
18
valuation) survey. The literature on such surveys is extensive, starting with Mishan 1971, Whittington
1998, NOAA’s 2001 guidelines for conducting contingent valuation surveys, Whittington 2002 and
Whittington 2010. Also chapter 16 of Boardman et al.’s textbook “Cost Benefit Analysis” provides some
discussion of the topic.
Asking businesses their willingness to pay for water can be a good way to measure the induced benefits of
alleviating a water scarcity constraint, if business owners have full knowledge of the investment
opportunities that improved water availability would prevent. Note, however, that the businesses’
willingness to pay is equal to the risk-adjusted present value of profits from the new business
opportunities. The value added of expenditures on labor, i.e. the increase in real incomes resulting from
the project for the business’ employees, would not be captured, but could be modeled using estimates of
firms’ representative production function from detailed firm surveys.
The project logic will determine the kind of WTP survey to conduct. For example, if the primary goal of
the project logic is to induce business investment, the country team should fund a WTP survey of targeted
businesses. If the goal is primarily to increase supply of water in a country with relatively little problems
with waterborne diseases and time spent collecting water, a WTP survey of households may be more
appropriate. Country economists should be aware that a random sample of households will contain
business owners, so if WTP of both households and businesses is desired, a well-designed WTP household
survey may suffice.
Note that the lack of a market for a good has not stopped MCC from finding “revealed preferences”
approaches in the past.
25
If there is no piped water system, expenditures on bottled water, or estimates of
the value of time spent gathering water can be used instead of a contingent valuation survey. Often the
compact development timeline does not allow enough time for a proper CV study to be performed before
an investment decision must be made.
Finally, even if the willingness to pay approach is used, MCC’s economic analysis will attempt to
understand the nature of the underlying benefit streams. To what extent is the willingness to pay a
measure of what would be used by firms for productive uses, versus expanded use by consumers, or for
improving health and/or the convenience of access? These distinctions are important for MCC’s
beneficiary analysis to forecast the expected beneficiary impact and to ensure that externalities are
properly taken into account without double counting.
Benefit Stream: Lower Costs of Water
Lower costs of water are included as benefit streams in many MCC WASH projects. Lower costs occur
primarily when an existing water transmission and distribution network is rehabilitated to reduce physical
losses (e.g. leaks), as distinct from non-physical losses (e.g. theft). In such cases the recommended
methodology is to estimate the volume of water that will be saved due to the reduction in physical losses
and assign to it the per unit price of water charged to customers.
26
If there is a regulatory agency that
ensures that any cost savings are passed on to the project’s beneficiaries, then these cost savings can be
captured by consumers. In other cases, the savings will tend to accrue to the utility and may improve its
financial position, sustainability, and ability to improve service in the future.
Water Supply and Sanitation Sector Cost-Benefit Analysis Guidance | July 3, 2019
19

This points to the potential need to address institutional reform in cases where the utility is determined to
be unable to sustain service improvements or pass cost savings to customers. The country team should
recommend which reforms are needed to deliver the project’s intended results, and whether additional
external support is required to achieve the project’s objectives. Using conditionality (conditions
precedent) to establish a regulatory agency (for example to ensure cost reflective tariffs sufficient for
maintenance, overhead, and capital expansion) is unlikely on its own to successfully address governance
failures in the sector. If the benefits of the project are primarily increased profits for the utility, then the
economist should be careful to identify the project beneficiaries as the shareholders of the utility and not
the utility’s customers. The need for accompanying policy and institutional reform is discussed further
below.
In cases where customers are connected for the first time to a water utility, the reduction in cost manifests
primarily as a reduction in time spent gathering water, or expenditures on bottled or delivered water. The
recommended methodology in this instance is to deduct the estimated cost of utility bills from the time
savings or delivered water expenditures for a net reduction in cost for the beneficiary.
The benefits of improving water quality can include savings on fuel that had been used for boiling water or
investments in household treatment systems and consumables. These can include: purchase of charcoal,
gas, time spent to gather firewood; purchase and upkeep of household filters, and purchase of chlorination
chemicals
4. Estimation of MCC WASH Project Costs
As with all CBA at MCC, all costs associated with delivering the project’s benefits must be included in the
ERR, regardless of who bears them. Infrastructure extension projects incur costs of infrastructure
construction,
27
of connecting households to water and sewer lines, and constructing water closets (for
sewer infrastructure); potential increased household expenditures on water (balanced against its health
and other benefits), and costs of informational programs aimed at changing hygienic practices.
Environmental mitigation costs (or damages) are also included.
A crucial assumption on the cost side for MCC CBA is expected future maintenance practices, with and
without the project. Typically MCC is asked to build WASH infrastructure where maintenance in the past
was poor and infrastructure was allowed to depreciate prematurely.
The purpose of maintenance is to sustain an asset’s efficiency, as illustrated in the following figure:
Water Supply and Sanitation Sector Cost-Benefit Analysis Guidance | July 3, 2019
20

Energy Savings in Industrial Water Pumping Systems, page 9.
Without maintenance crucial equipment must be replaced earlier in the asset’s lifecycle than necessary,
leading to reductions in quality of benefits the asset provides, and increased expected future costs
associated with asset replacement.
Typically in the “without project” baseline, we use a realistic “business as usual” assumption regarding
how quickly assets and service levels will deteriorate in the future, basing this on past maintenance and
partial replacement practices – with the associated maintenance costs included being those necessary to
sustain the current status quo. If there is no reason to expect a change, business as usual maintenance and
asset management, and other aspects of utility performance, would also be assumed in the with-project
scenario. The “without project” scenario should not assume that similar improvements under the
proposed project will take place anyhow, in a few years, under alternative funding. This is because it is the
project itself, not the source of funding, which is being analyzed in a CBA.
When WASH infrastructure is improved, another potential source of higher costs is higher rents charged
to tenants in buildings with improved plumbing. The associated decrease in affordability can have adverse
consequences for the targeted beneficiaries – e.g., the improved infrastructure assets can lead to higher
property rents, benefitting property owners but forcing renters to move. The project design and
beneficiary analysis should take note of affordability issues and provide alternatives for addressing them,
even if there is no efficiency issue.
5. Detailed Estimation of Project Benefits
Measuring Benefits through Consumer Surplus
Water Supply and Sanitation Sector Cost-Benefit Analysis Guidance | July 3, 2019
21
“Revealed preferences” is a standard methodology described in most CBA textbooks and is not
reproduced here. Citations provided above for “stated preferences” methods may also be useful. The
“revealed preferences” method tends to be more consistent with MCC’s evidence-based approach than the
“stated preferences” methodology.
28
In this section when and whether to use CS methodologies is
discussed.
Using consumer surplus methods (both revealed and stated preferences) to estimate benefits of increased
consumption of a good in a cost-benefit analysis is standard CBA practice. As mentioned in MCC CBA
guidelines, changes in consumer surplus that represent a simple transfer from producers are not counted
as a benefit, consistent with standard CBA practice regarding transfers from one economic actor to
another.
MCC’s CBA guidelines specify that the goal of MCC projects is to promote growth in real incomes,
because growth in income is how we achieve the goals in our authorizing legislation, to promote economic
growth and reduce extreme poverty. When it can, MCC economists make a conscious effort to measure
changes in real incomes, rather than welfare (as measured by consumer surplus). Sometimes CS methods
are the best way to approximate real income changes, and in some instances CS methods are the only way
to estimate benefits at all.
In WASH projects, consumer surplus methods can capture cost savings on baseline “coping costs” other
than time spent collecting water, and “quality of life” and “aesthetic” benefits from the increased quantity
of water supplied by a project. When such benefits are expected to be significant, CS methods may be
appropriate. However, when the main component of “quality of life” benefits are for leisure purposes, like
taking showers, such benefits might be considered less relevant to MCC’s mission of reducing extreme
poverty. CS methods can also capture the benefits of small-scale productive use of water, like in
subsistence agriculture, which may be useful, depending on the project.
Indirect Benefits (through Induced Investment)
When increased supply of water can reasonably be expected to induce greater production, employment,
and/or investment (vis-à-vis the without project case), and data exists to estimate the appropriate values,
it is acceptable to include these induced benefits. Assumptions would remain conservative, and the degree
of induced economic activity would depend upon findings of a Constraints Analysis as well as the specific
context in the country – for instance, whether other constraints that appear binding are being addressed.
WASH Policy and Institutional Reform (PIR) Topics
One of MCC’s lessons learned from past projects is that most major infrastructure projects require an
associated policy/institutional reform (PIR) project to ensure that the utility is well managed and asset
maintenance improves. Evaluating the need for improvement in the asset maintenance regime is now
standard for due diligence of any proposed infrastructure project (see “Economic Analysis of Policy and
Institutional Reform Programs: Position Paper and Recommendations for MCC Management,” internal
EA guidance). When a PIR project has been deemed a necessary component of the project, then it is
considered a required condition for achieving the long-run benefits of the overall project, and therefore its
Water Supply and Sanitation Sector Cost-Benefit Analysis Guidance | July 3, 2019
22
costs are included in the overall project costs. Economists will, in cases where it is feasible to do so,
explicitly separate out the costs and benefits of PIR components to calculate a separate ERR
(complementarity of benefits being accounted for, where relevant, in the overall ERR). However,
regardless of whether this is the case, economists will need to assess, based on the available evidence and
experience, the likely trajectory of service and benefits using realistic assumptions regarding both the
with- and without- project scenarios.
There is some evidence that governance reforms are central to sustaining improved performance in the
water and sanitation sector, and that in particular private sector participation and independent regulation
result in improved sustainability, quality of service, costs of service, and investment levels (see Andrès et
al. 2013). Serious discussion about this and other evidence, the context, and the problems faced in the
sector should be part of compact development to ensure that MCC investments are cost-effective and that
impacts are sustained.
According to MCC’s sustainability guidelines, the country team should engage in a discussion of
assumptions and risks that threaten the sustainability of the project’s results. The team economist should
ensure that the team considers PIR issues in this discussion.
Several questions should be considered regarding the potential need for PIR investment. If the MCC
project is building a large infrastructure asset, this is an opportunity for MCC to ask questions about how
the asset came to be needing building/replacement in the first place. The three main variables to consider
in PIR for a WASH project is tariff levels, physical losses, and commercial losses.
For a water utility charged with maintaining a water network, is the tariff set at a level where the
utility can recover the costs of repairing existing infrastructure and to cover expected future
expansions of the network?
Is the fiscal outlook for the utility sound, with a sustainable debt level and capacity to service it?
Are liabilities of the public utility recognized in the government’s debt management strategy as
quasi-fiscal liabilities of the public sector overall?
Does the utility track the location and age of its assets and have a maintenance/replacement plan
for them?
What is the rate of physical and commercial losses? Does the utility track these figures? Is there an
acceptable level of losses written into the tariff setting analysis by the utility’s regulator? How was
that level arrived at?
Are there institutional customers who refuse to pay utility bills because of their political power?
Does the government set aside funds to pay the utility bills of these institutions? Does the utility
have political/legal standing to sue the government for non-payment?
Who owns the utility (is it government owned, a PPP, privately owned, other?)? is the owner of the
utility invested in its sustainability? Would fundamental changes to the owners’ incentives (e.g.
privatization, or establishment of a locally elected governing body) incentivize the utility’s owner to
be more invested in its sustainability?
Any combination of high physical/commercial losses and non-cost recovering tariffs can lead to eventual
financial failure of the utility, which must be bailed out by the government, either explicitly by raising
government funds, or implicitly by legally requiring the utility to continue providing services, even though
the tariff is set too low for the utility to be commercially viable. The latter is often called an implicit
Water Supply and Sanitation Sector Cost-Benefit Analysis Guidance | July 3, 2019
23

subsidy (or a “contingent liability”). Ideally such implicit subsidies should be identified in program design
and appropriate reforms introduced. In cases of significant implicit subsidization, the country team, and
the team economist in particular, should discuss during compact development whether the fundamental
incentive structure of the utility should be changed. Note that public subsidies to utilities to support social
or economic priorities of the government should at least be publicly recognized, transparent (contractual),
and explicit in the budget of the government and public utility. If possible, subsidies for social or
economic purposes should be removed from the utility’s budget entirely and administered by an agency
completely independent of the utility.
It should be noted that there is no reason the issue of addressing implicit subsidies must be accompanied
by an infrastructure project. Improving the commercial viability of a water utility can be a standalone
project. If the proposed changes are politically difficult, adding an infrastructural piece to the project may
give the compact country additional political leverage to sell the necessary changes.
Some WASH projects MCC has worked on involve significant physical losses. Reducing physical losses
has the same effect as reducing costs per unit of water supplied and can be analyzed from a cost reduction
perspective. However, physical losses that reach a certain extreme extent – say, greater than 50% – are an
indicator of significant institutional weakness. Such high levels of losses will almost certainly be
accompanied by either explicit or implicit subsidization.
Other WASH projects have involved utilities with significant commercial losses. A commercial loss is
when a utility sends water through its network to someone who consumes the water but does not pay for
it. While the (immediate) resulting net welfare is the same as the case without theft – the cost of
producing the water is the same, and the consumer’s marginal welfare from consuming the water is the
same – the transfer of revenue from the utility to the consumer harms the long run financial sustainability
of the utility, which is often the root cause of the utility’s problems. EA is currently developing a
methodology for measuring the benefit to long run sustainability that results from the reduction of
commercial losses.
In addition to assumptions captured in the project logic, teams should spend some time brainstorming
additional, implicit assumptions and risks pertinent to the sustainability of compact investments,
including risk mitigation options. We do our best to enter into implementation with comprehensive
project logics, but it is important to validate our design assumptions at the outset, and confirm that we
have not missed any major opportunities to build greater sustainability into our designs. The five pillar
model of sustainability can be a good starting place for this task. Some additional questions to consider
are:
Sequencing: for projects with activities and sub-activities that build on one another, what is the
potential impact of delays in implementation? How will a one-month (or six-month) delay affect
the overall sequencing of the compact? What will the impact be on sustainability?
Behavior change: to what degree does post-compact maintenance of compact interventions rely on
behavior change? Both in terms of infrastructure investments and non-infrastructure investments,
whose continued action will be necessary to achieve compact results? By CED, will those
individuals have (or have acquired) the necessary skills, resources, and incentives to continue
taking action after the compact has ended?
Water Supply and Sanitation Sector Cost-Benefit Analysis Guidance | July 3, 2019
24
Uptake: if beneficiaries do not choose to connect to the water network, how will this impact
compact results? If we are assuming uptake will continue to increase after compact end date, who
will be responsible for continuing to promote uptake among the target of the intervention? Will
that entity have the necessary capacity and resources to do so?
This is not an exhaustive list of considerations, and teams should feel encouraged to use the process of
completing the baseline assessment to ask obvious or difficult questions.
The question of behavior change and uptake are well understood in MCC now to be critical to achieving
project outcomes. Where key benefit streams depend, for example, on people financing household
connections to the water, sewer, or electricity grid, the affordability of connections for local beneficiaries
is paramount. In other cases behavior change around using new facilities (e.g. shifting water supply
sources), civic attitudes to trash disposal, or awareness of proper hygiene practices to prevent the spread
of water borne disease are critical to achieving project outcomes. Most projects targeting community level
services will require explicit attention to behavior change and uptake.
Uncertainty
Many of the parameters used to inform WASH CBA are subject to significant uncertainty. MCC’s CBA
guidelines require EA economists to perform Monte Carlo analysis of ERRs based on simulations around
key parameters that are subject to significant uncertainty, as identified by the economist. Uncertainty can
be increased markedly and arbitrarily simply by choosing a large number of variables, so the choice of
parameters to simulate over is best kept parsimonious and relevant.
If the distribution is roughly symmetric and unimodal, economists should report the most likely ERR (the
mode of the distribution), in addition to the probability of it falling below the hurdle rate of return. If the
distribution approximates a bimodal one, for example with or without success in achieving PIR, either an
expected value ERR could be reported, or two ERRs with an “if, then” statement where the scenarios are
well specified.
For WASH CBA, the list of variables subject to uncertainty includes:
For health benefits:
wages,
disease incidence reduction,
take up of connections to new infrastructure
behavior change (e.g. switching from outdoor defecation to latrines or indoor WCs, or
using toilets as garbage cans)
Other parameters to consider: population of the study area (if no recent census has been
performed), case fatality rates, and baseline diarrhea incidence.
For time savings
Wages
Time spent collecting water
For cost savings
technical/commercial loss reduction.
Elasticity of demand for water
Water Supply and Sanitation Sector Cost-Benefit Analysis Guidance | July 3, 2019
25

For PIR
Time path and probability of success
Sustainability of political commitment to program
Public-private Partnerships in the WASH Sector
As defined by the World Bank
29
, a public-private partnership (PPP) is a long term arrangement in which
a private party assumes some authority over a government asset, or agrees to provide a service for a
government entity, while bearing a significant share of the risk for the project’s outcome. A PPP should
therefore be viewed as distinct from privatization in which the government relinquishes control or
ownership of an asset entirely.
The WASH sector is dominated by goods that are near-public goods; water and disease resistance are
common-pool resources and the heavy infrastructure requirements cause the provision of water and
sanitation to be provided through natural monopolies. These goods can be traded in markets, but not
efficiently
30
. Often privatization is not a politically acceptable option. An additional complication in the
WASH sector arises because access to water is often viewed as a human right and the tariff is often set at
or near zero
31
.
Productive Efficiency of Public-private Partnerships and the Manila Water Concessions
Under the right circumstances, PPPs can help with these problems. The private sector has inevitable
incentives to reduce costs and collect revenue—both issues which state-owned enterprises struggle to
match—but these improved incentives must be balanced against the ability of the contracting authority to
enforce provisions of the contract, which requires contract enforcement and procurement capacity that is
often not present in developing countries.
The case of the Manila water concessions illustrates these issues well
32
. In the late 1990’s, the Manila
water utility (MWSS) agreed to separate concession arrangements with two consortia operating the
eastern (Manila Water) and western halves (Maynilad) of its network. The two concessionaires each
offered tariffs below the initial cost-recovery tariff level, while agreeing to concession fees large enough to
cover the utility’s debt service. Despite identical initial conditions, the experiences of the two
concessionaires diverged massively. Manila Water was able to keep tariffs low, while reducing non-
revenue water (NRW) more quickly than contractually required, yet continues to operate profitably.
Maynilad was somewhat slower to invest initially. After the Asian Financial crisis, Maynilad tried to raise
tariffs to cover increases in the concession fee, resulting in “rate shocks” which decreased public trust. As
a result, Maynilad never invested as heavily in its network as Manila water, and eventually, its network was
renationalized following bankruptcy.
While there may be many causes of Maynilad’s failure, one clear cause was likely the poor risk allocation
for these partnerships, which in turn is a failure of Manila’s low procurement capacity. Manila Water’s
initial investments were already sunk by the time concession fees were raised, leaving it with strong
incentives to continue network investments.
Water Supply and Sanitation Sector Cost-Benefit Analysis Guidance | July 3, 2019
26

Appendix: MCC History
As of the drafting of these guidelines, MCC is monitoring three ongoing WASH projects (in Zambia,
Jordan, and Cabo Verde) and six completed projects (in El Salvador, Georgia, Lesotho, Mozambique,
Tanzania, and Ghana).
For many of the compacts, health benefits were estimated as the reduction in number of sick days or work
days missed. The recommended methodology now is to capture this benefits in the “years lost to
disability” (YLD) part of the DALY calculation. Similarly, efforts to assign value to mortality are now
subsumed in the YLL part of the DALY calculation.
The recommendation that the opportunity cost of time should be estimated using the average wage of the
beneficiary population or, if such data are not available, the estimated wage for unskilled labor, was made
after the ERRs for these WASH projects were completed. Nevertheless, many of the wages used in the
ERRs came close to the recommended ideal.
Below are descriptions of the various WASH projects and highlighted ERR details of interest.
MCC Compacts with WASH Projects
Country Status Entry into Force Date
Georgia Closed 4/7/2006
Ghana Closed 2/16/2007
El Salvador Closed 9/20/2007
Lesotho Closed 9/17/2008
Tanzania Closed 9/17/2008
Mozambique Closed 9/22/2008
Jordan Implementation 12/13/2011
Cabo Verde II Implementation 11/30/2012
Zambia Implementation 11/15/2013
Georgia
In Georgia, the WASH infrastructure inherited from the Soviet Union had broken down significantly,
leading to clean water being provided only a few hours each day. Households were forced to fill reservoirs
with water during the times water was available. Because households had already had clean water, no
health benefits were calculated in the ERR. Rather, the main benefits of the project were time savings
(from eliminating the need to maintain the reservoirs), valued at the estimated informal wage rate for
women.
Water Supply and Sanitation Sector Cost-Benefit Analysis Guidance | July 3, 2019
27
Link to Georgia I ERRs: https://www.mcc.gov/where-we-work/err/georgia-compact
Ghana
The Water and Sanitation Facilities sub-component of the “Community Services” activity of the “Rural
Services” project in Ghana was designed to complement the Agriculture Project by providing water
infrastructure in the MCC project areas and enhance the capacity of local governments to deliver water
services. MCC funding was used to fund boreholes (both mechanized and hand-pumped), small town pipe
systems, pipe extensions, and community sanitary facilities. The main benefits of the project are improved
health, reduction in the incidence of illness and loss of productivity due to unsafe drinking water and poor
consumer sanitation and hygiene, and to reduce the time required to procure potable water.
Time savings benefits were valued at half the minimum wage and calculated as the reduction in time spent
fetching water per day as derived from local household surveys. Health savings were calculated as a
reduction in morbidity and sick days, also valued at half the minimum wage.
Link to Ghana I ERRs: https://www.mcc.gov/where-we-work/err/ghana-compact
El Salvador
In El Salvador’s “Human Development Project,” the “Community Development Activity” contains a
“Water and Sanitation” sub-activity. The sub-activity designed and constructed potable water systems
(e.g., wells and pumps) in more than 20 communities.
A large portion of the population in the Northern Zone of El Salvador lacked access to clean, piped water.
The MCC project expanded water access. As households had previously used either trucked water, wells,
or river water, the installation of piped water access provided benefits through decreased costs, reduced
time spent gathering water, and reduced disease rates. Cost savings were calculated from a Northern Zone
2008 household survey on water source and expenditures, time savings were taken from the same survey’s
data on time spent gathering water by source. Time was valued at half the minimum wage.
Link to El Salvador I ERRs: https://www.mcc.gov/where-we-work/err/el-salvador-compact
Lesotho
The Lesotho water sector project is aimed at improving water supply for industrial and domestic needs. It
consists of an urban and a rural sub-activity. The urban sub-activity was designed to extend and
rehabilitate the urban and peri-urban water network, including extending reticulation to the towns of
Semonkong and augmenting supply to the town of Mazenod. The rural sub-activity was designed to
improve water supplies and provide ventilated improved pit latrines to small rural settlements.
The benefits for the urban sub-activity consisted of four main streams: (i) time saved in water collection,
(ii) time saved in obtaining medical treatment for water-related illnesses, (iii) reduced mortality for
children under 5 due to water-related illnesses, and (iv) increases in investment due to greater water
Water Supply and Sanitation Sector Cost-Benefit Analysis Guidance | July 3, 2019
28
availability.
The analysis calculated the value of time saved on the basis of an estimate of the urban population
currently affected by underdeveloped or disrupted water service. This figure, 40 percent, corresponds to
the portion of the urban population not having piped in-house water supplies; although one could also
expect that a portion of existing in-house customers were experiencing deteriorating water service
frequency and water quality. Allowing for urban population growth, the analysis estimated an increasing
level of time spent collecting water to represent the deterioration in existing infrastructure and
anticipated difficulties in providing full service accommodation for an expanding urban population. The
value of time freed for productive activity through the convenience of improved water supply is qualified
by the likelihood of employment for urban men and women. It was assumed here that project investments
will lead to a halving of the time that would be spent in water collection over time.
Private sector investment to utilize the improved availability and reliability of water in urban areas was
also considered, relying in part on results produced in the economic growth modeling for Lesotho recently
undertaken by the World Bank. Estimation of the private sector response is based on an assumed
relationship between infrastructure and private investment and the ratio of value added to incremental
investment.
Link to Lesotho ERRs: https://www.mcc.gov/where-we-work/err/lesotho-compact
Tanzania
The MCC activities were focused in two regions of Tanzania. In Dar es Salaam, the “Lower Ruvu Plant
Expansion” expanded the capacity of the Lower Ruvu water treatment plant, and the “Non-Revenue
Water” activity was intended to significantly reduce physical and commercial water losses in the Dar es
Salaam system. In Morogoro, MCC rehabilitated and upgraded two water treatment plants there, and had
planned to improve the existing distribution network.
In Tanzania, a large portion of the population lacked access to clean, piped water. Furthermore, water
supply could not fully satisfy business demand for water in those areas with access. The MCC WASH
project sought to expand water access for residential households and increase the water supply (and
therefore the duration of water access per day) to some commercial districts. In the residential districts,
benefits included time and health savings for households, since clean piped water takes less time to gather
than well or river water and reduces the frequency of waterborne illnesses. Time savings were valued at
half the minimum wage while health savings were valued at the reduction in DALYs. For commercial
districts, benefits were measured through a consumer surplus model based on the current price of water
and an assumed linear demand curve.
Link to Tanzania ERRs: https://www.mcc.gov/where-we-work/err/tanzania-compact
Mozambique
In Mozambique MCC expanded access to water and sanitation facilities in numerous towns and provided
Water Supply and Sanitation Sector Cost-Benefit Analysis Guidance | July 3, 2019
29
boreholes to provide clean water for rural households. Benefits were time savings, valued at the average
wage as shown through a consumption survey from 2006 and calculated as the reduction in time spent
fetching water per day. Health savings were calculated as a reduction in morbidity and sick days, also
valued at the average wage through consumption surveys.
Link to Mozambique ERRs: https://www.mcc.gov/where-we-work/err/mozambique-compact
Jordan
The proposed Compact program consists of three tightly-integrated infrastructure projects that address
critical problems in water distribution, wastewater collection and wastewater treatment. The projects are
focused in Zarqa Governorate, home to the country’s second and fourth largest cities, Zarqa and Ruseifa,
and to the majority of the country’s small-scale industry.
The Zarqa Governorate Water Network Restructuring and Rehabilitation Project (Water Network
Project) is designed to reduce high water losses by repairing and upgrading transmission and distribution
pipes throughout Zarqa and Ruseifa. The project includes direct assistance to poor households to improve
plumbing, water storage, sewage connections, and general awareness of best practices for sanitation and
water efficiency.
The Wastewater Network Reinforcement and Expansion Project (Wastewater Network Project) is
designed to rehabilitate sewer main lines that are nearing capacity and extend service to approximately
18,000 households, for a total of 100,000 people that are not currently connected to the sewer network.
This will improve wastewater services, prevent potentially harmful overflows of raw sewage, and capture
additional quantities of wastewater for eventual reuse in agriculture downstream in the Jordan Valley.
The As-Samra Wastewater Treatment Plant Expansion Project (As-Samra Expansion Project) is designed
to expand the capacity of the existing As-Samra Wastewater Treatment Plant by an additional 97,800
cubic meters per day, an increase of more than one-third, which is projected to be sufficient to meet the
wastewater treatment needs of large populations in Amman and Zarqa Governorates at least through
2025.
Benefits from the Water Network Project are based on improvements in the efficiency of water supplied
to the region’s urban population. At present, most households receive water through the public water
network only once or twice per week, and many purchase bottled water or tanker truck water to
supplement their consumption. Repairs that make more water available through the public network
should allow many consumers to reduce their reliance on these costly sources of additional water, thus
reducing household expenditures on water or allowing increased water consumption without changes in
cost. Reductions in water losses also mean that the region’s limited water supply could serve its growing
population over a longer period, effectively shifting the water “supply curve” outward.
The principal benefits from the Wastewater Network Project and the As-Samra Expansion Project accrue
from increased efficiency in the use of available surface water, particularly in agriculture, which consumes
a large share of water resources. In an effort to prioritize municipal and industrial users, the GOJ has
Water Supply and Sanitation Sector Cost-Benefit Analysis Guidance | July 3, 2019
30
invested heavily in collection, treatment, and conveyance systems that “free up” fresh water used in
irrigated agriculture and replace it with high-quality treated wastewater.
Link to Jordan ERRs: https://www.mcc.gov/where-we-work/err/jordan-compact
Cabo Verde II
The Cabo Verde II WASH project has three components: 1) National Institutional and Regulatory Reform
Activity; 2) Utility Reform Activity; and 3) WASH Infrastructure Financing Activity.
The national-level reform is designed to improve planning for maintenance and infrastructure
improvements, and also to ensure that tariffs are set so as to cover maintenance and capital expansion
costs. The utility reform is designed to restructure municipal utility departments into financially and
administratively independent corporate entities. The infrastructure financing facility provides seed
funding for infrastructure capital improvements. It is also designed to reward utilities for adopting
commercial principles.
Link to Cabo Verde II ERRs: https://www.mcc.gov/where-we-work/err/cape-verde-compact-ii
Zambia
Zambia’s WASH project will rehabilitate the central water system in Lusaka, extend the water supply
infrastructure in one region, extend the combined water and sanitation infrastructure in another, and
improve the drainage system in a third region.
Rehabilitating the central water system and extending the water supply infrastructure will reduce the need
for women and children to spend time collecting water, either because of intermittent water outages or
lack of connection to the central water infrastructure. Increased access to clean water should also reduce
the incidence of water-borne disease (primarily infectious diarrhea). Improving the central water system
will also reduce leaks, and institutional reforms (particularly installing pre-paid meters) should reduce the
accumulation of arrears and improve the overall collections ratio. Improved financial performance of the
Zambia utility should lead to lower water costs for the project’s beneficiaries. The drainage project will
reduce the incidence of disease by reducing pedestrian exposure to contaminated flood waters.
Health impacts are measured in the ERR by estimating the reduction in DALYs lost to disease, valued at
the average Lusaka wage discounted by the overall urban Lusaka unemployment rate. Time savings for
women and children carrying water is valued at the average women’s wage in urban Lusaka, discounted by
the urban Lusaka unemployment rate for women. Cost reductions in water production are measured by
the billable value of the reduction in commercial and non-commercial losses.
The Zambia ERR also estimates the value of reduced property damage and value added for businesses as a
result of the drainage project, although the value of these benefit streams is very small, about 1% of overall
benefits.
Water Supply and Sanitation Sector Cost-Benefit Analysis Guidance | July 3, 2019
31

The original ERR for the drainage project estimated significant benefits from reduction of malaria
incidence. However, when more disaggregated data became available for Lusaka proper, it was discovered
that the incidence of malaria there was almost zero (about 5 per thousand instead of the originally
estimated 120), and accordingly the benefits from reduced exposure to malaria were reduced significantly.
Link to Zambia ERRs: https://www.mcc.gov/where-we-work/err/zambia-compact
References:
Alderman, Hoddinott, & Kinsey, 2006. “Long Term Consequences of Early Childhood Malnutrition,”
Oxford Economic Papers, No. 58.
Becker, 1965. “A Theory of the Allocation of Time,” The Economic Journal, Vol. 75, No. 299: 493-517.
Bi, C. and T. Osborne (2016). “Transaction Costs, Poverty, and Low Productivity Traps: Evidence from
Madagascar’s Informal Microenterprise Sector.” In Shifting Fortunes and Enduring Poverty in
Madagascar: Recent Findings. World Bank: Washington.
Boardman et al., 2010, Cost-Benefit Analysis (4th Edition), Pearson.
Bigsten, Isaksson, and Soderbom, 2000. “Rates of Return on Physical and Human Capital in Africa’s
Manufacturing Sector,” Economic Development and Cultural Change, Vol. 48, No. 4.
Castro, et al., 2010. “The Importance of Drains for the Larval Development of Lymphatic Filariasis and
Malaria Vectors in Dar es Salaam, United Republic of Tanzania,” PLoS Neglected Tropical Diseases Vol. 4,
No. 5.
Cook, J., P. Kimuyu, A. Blum, J. Gatua. (2016). “A simple stated preference tool for estimating the value of
travel time in rural Africa. Journal of Benefit-Cost Analysis. Forthcoming.
Goldschmidt-Clermont, 1989. Unpaid Work in the Household: A Review of Economic Methods.
International Labor Office.
Gronau, 1977. “Leisure, Home Production, and Work-the Theory of the Allocation of Time
Revisited,” Journal of Political Economy, Vol. 85, No. 6.
Hutton, G. and Haller, L. 2004. “Evaluation of the Costs and Benefits of Water and Sanitation
Improvements at the Global Level,” Water, Sanitation and Health Protection of the Human Environment,
World Health Organization, Geneva.
International Initiative for Impact Evaluation (3ie), 2009. “Water, sanitation and hygiene interventions to
combat childhood diarrhoea in developing countries,” Synthetic Review 001.
Water Supply and Sanitation Sector Cost-Benefit Analysis Guidance | July 3, 2019
32

Jodlowski, M. (2016). “Labor Demand Estimation in Rural Madagascar: Shadow Wages and Allocative
Inefficiency,” in Shifting Fortunes and Enduring Poverty in Madagascar: Recent Findings. World Bank:
Washington.
Mathers et al., 2006. “Updated projections of global mortality and burden of disease, 2002-2030: data
sources, methods and results.” World Health Organization.
Mishan, 1971, “Evaluation of Life and Limb,” Journal of Political Economy, vol. 79, issue 4.
National Oceanic and Atmospheric Administration (NOAA), 2001. “Report of the NOAA Panel on
Contingent Valuation.” Available at
http://www.economia.unimib.it/DATA/moduli/7_6067/materiale/noaa%20report.pdf.
Ottesen et al., 2008. “The Global Programme to Eliminate Lymphatic Filariasis: Health Impact after 8
Years,” PLoS Neglected Tropical Diseases Vol. 2, No. 10.
Rosen & Vincent, 1999. Household Water Resources and Rural Productivity in Sub-Saharan Africa: A
Review of the Evidence,” Harvard Institute for International Development, Cambridge, Massachusetts.
Teeples, Ronald, and David Glyer, 1987. “Cost of water delivery systems: specification and ownership
effects.” The Review of Economics and Statistics: 399-408.
Teshome et al., 2009. “Magnitude and determinants of stunting in children under five years of age in food
surplus region of Ethiopia: The case of West Gojam Zone,” The Ethiopian Journal of Health
Development, Vol. 23, No. 2.
Van de Walle, D. (2010). “Access to Water, Women’s Work, and Child Outcomes,” Policy Research
Working Paper 5302. World Bank.
Whittington, et al., 1990. “Calculating the Value of Time Spent Collecting Water: Some Estimates for
Ukunda, Kenya,” World Development, Vol. 18, No. 2.
Whittington, 1998, “Administering Contingent Valuation Surveys in Developing Countries,” World
Development, Vol. 26 no. 1.
Whittington, 2002, “Improving the Performance of Contingent Valuation Studies in Developing
Countries,” Environmental and Resource Economics, vol. 22, issue 1.
Whittington, 2010, “What Have We Learned from 20 Years of Stated Preference Research in Less-
Developed Countries?” Annual Review of Resource Economics, vol. 2.
WHO, 1995. Expert Committee Report: Physical status: the use and interpretation of anthropometry.
Technical Report Series 854. Geneva: World Health Organization.
Water Supply and Sanitation Sector Cost-Benefit Analysis Guidance | July 3, 2019
33

Appendix 1: Technical Example for Calculating Benefits from Reduced
Stunting
In this appendix we use Teshome et al’s odds ratio to calculate the estimated reduction in stunting
resulting from the project’s reduction in incidence of infectious diarrhea.
For the purposes of the ERR we need the difference in probability of being stunted with and without
exposure to diarrhea as an infant. I.e. we need P(stunted|diarrhea) and P(stunted|no diarrhea).
In Zambia, we know the overall prevalence rate of diarrhea: 0.483 (almost half of all children will have
diarrhea during the course of a year). We know the overall prevalence rate of stunting in Zambia is 0.372.
We also know the Odds Ratio of Teshome et al: 2.289. We therefore have enough information to calculate
the probability of stunting conditional on diarrhea exposure.
The joint probability of stunting given exposure to diarrhea is:
where p
11
is the joint probability of being exposed to diarrhea and being stunted, p
1*
is the overall
prevalence of diarrhea, p
*1
is the overall stunting prevalence, R is the odds ratio, and S is:
Once p
11
is calculated (0.227) we can get the rest of the joint probabilities trivially:
Joint probability: Stunted Not Stunted
Diarrhea 0.227 0.256
No Diarrhea 0.145 0.372
And thus the conditional probabilities:
Probability of stunting
conditional on diarrhea
exposure:
Stunted Not Stunted
Diarrhea 0.471 0.529
No Diarrhea 0.280 0.720
In Zambia, a child who endures a case of infectious diarrhea has a 47% chance of being stunted, vs a 28%
chance for a child that has not had any diarrhea. Each incidence of infectious diarrhea in a young child
Water Supply and Sanitation Sector Cost-Benefit Analysis Guidance | July 3, 2019
34
that is avoided (due to the project) reduces that child’s chance of being stunted by 47%-28%=19%.
We use this core parameter to estimate the reduction in the number of stunting cases that would result
from the anticipated reduction in incidence of infectious diarrhea resulting from the project.
If the intervention reduces cases of diarrhea by 42%, then the number of cases of diarrhea among young
children will decline from 483 to 280 per 1000. Thus, the chance of stunting for 203 out of 1000 children
goes down 19%. In other words, we expect the number of stunting cases to decline by 203*0.19=38.6 per
thousand of young beneficiaries (aged 0-5) impacted.
Now we must assign a dollar value to each stunting case prevented. The definition of stunting is growth
that is two standard deviations below the worldwide mean (according to WHO). Alderman et al. (2006)
found that a one standard deviation decline in height is associated with entering school half a year later,
thus delaying entry into the workforce. They also found that the average number of grades attained
declines by 0.74. Consequently, a child who is two standard deviations below the mean in terms of height
should enter the workforce one year later, and attain 1.5 years less schooling. With a Mincer regression in
hand that assigns values to earnings associated with these increments, we can estimate the effect on
lifetime earnings associated with one incident of stunting.
Equation one below is an example of a Mincer equation showing the returns to years of education and
experience (Exp), respectively.
Equation one: Sample Mincer Equation
Ln(Annual Salary) = 1000*[0.15*Exp – 0.002*Exp^2 + 0.1*Education]
If the average worker has 5 years of education and 15 years of experience, the salary of the average worker
will be 1000*{exp[0.15*(15) – 0.002*(15)^2+0.1*(5)]} = 10,000. The annual salary of an otherwise average
worker who suffers from stunting will be 1000*{exp[0.15*(14) – 0.002*(14)^2+0.1*(3.5)]}=7,800.
NB: Each year after the intervention a certain number of stunting cases will be eliminated. Therefore, the
benefits of the intervention in a given year is the PDV of the lifetime earnings saved by preventing each
case of stunting that year. In the above example, discounting the average savings of 2,200 over a 45 year
working life yields a PDV (at 10% discount rate) of 21,100. If 1000 of the 10,000 beneficiaries are aged 0-5,
then the total benefit from reduced incidence of stunting in a given year will be 38.6*21,100=814,460.
Acknowledgements
Deep appreciation and thanks to the external peer reviewers of this document, Dale Whittington and
Steve Anderson, and the many internal reviewers, particularly the Infrastructure review led by Omar
Hopkins, EA review led by Derick Bowen, M&E review led by Shreena Patel, GSI review led by Michelle
Adato, HCD review led by Michelle Inkley, and ESP review led by Tom Schehl, and finally under
managerial guidance of Mark Sundberg, Chief Economist, and Theresa Osborne, Managing Director, in
Water Supply and Sanitation Sector Cost-Benefit Analysis Guidance | July 3, 2019
35

the Economic Analysis Division. All comments, suggestions, and corrections have been incorporated, to
the best of the author’s ability, consistently with MCC’s overall CBA guidance. All remaining errors
and/or inconsistencies are the sole responsibility of the author.
Water Supply and Sanitation Sector Cost-Benefit Analysis Guidance | July 3, 2019
36

Endnotes
1. This can interact with any credit market failures that would preclude private customers from
financing their connections.
2. Other market failures associated with WASH projects are the fact that some kinds of WASH
infrastructure may have natural monopoly characteristics (Teeples & Glyer 1987), and that poor
WASH customers face access to finance issues when confronted with large connection fees. Other
authors have cited a principal-agent issue as well: A deciding parent is generally not a perfect agent
for child principals, who have neither information nor the ability to defend any of their interests
that may diverge from their parents’ (Munro, 2001.)
3. Usually this is either Information, Education and Communication (IEC) or Behavior Change
Communication (BCC) campaigns that can include interpersonal communication (IPC), TV, radio,
newspaper and social media (FB, internet). It should be an integral and interactive part of WASH
programs, and developed through research on beneficiary behavior, and activities for changing
behavior.
4. If the degree of behavioral change cannot be accurately predicted, the CBA model should still
include explicit assumptions that can be tested, e.g. a calculated breakeven point for a reasonable
return could be used. This could subsequently be tested for in both the monitoring and the
evaluation.
5. Note that the effects of flooding are a ‘public good’ in the strict sense used in the economics
literature (non-rival – one business’/household’s use of flood prevention does not reduce other’s
ability to benefit from it, and non-exclusive – there’s no way to prevent businesses/households
from benefiting from flood prevention).
6. Generally speaking, what distinguishes an assumption from a result is that the latter lies within a
project’s “manageable interest.”
7. For example, in the Zambia compact, the water utility is analyzing ways to help beneficiaries
finance connecting to the new infrastructure built by the compact in the “Sanitation Connection
Action Plan,” which was a condition precedent for the project.
8. It is also possible for water projects to provide benefits to industrial users of water, but no MCC
WASH project has ever explicitly, directly, and deliberately targeted an industrial user – there is no
obvious externality associated with industrial use of water, so no need for government/donor
assistance.
9. See Beneficiary Analysis guidelines.
10. Economists should collaborate with MCC infrastructure experts during the due diligence stage of
the compact development process to collect this data.
11. Although some species of mosquitoes that carry malaria will only breed in clean water.
12. Dengue, an urban disease that is on the rise due to rapid urbanization and climate change, is also
carried by mosquitoes.
13. That is, all WASH projects except for drainage projects, which also have the potential to affect
malaria incidence.
14. “Incidence” for purposes of these guidelines is defined as expected number of new cases per year
per thousand people at risk. It is not to be confused with “prevalence,” the proportion of cases in
the population at a given time, although at times it is necessary to use prevalence rates in place of
incidence rates when the latter are not available.
15. This study is a good source for economists interested in learning more about project logics for
WASH interventions.
16. Available on the internet at http://www.ncbi.nlm.nih.gov/pmc/articles/PMC2876116.
17. The DALY methodology was developed for the WHO’s 1990 “Global Burden of Disease” and has
Water Supply and Sanitation Sector Cost-Benefit Analysis Guidance | July 3, 2019
37

been updated and expanded several times since then. See
http://www.who.int/healthinfo/global_burden_disease/gbd/en/
18. See “Mincer Regression Guidelines” by Andrew Carter.
19. Available on the internet at
http://www.who.int/healthinfo/global_burden_disease/GBD2004_DisabilityWeights.pdf?ua=1
20. Adding the value of work days lost is a permissible method for capturing disability-related benefits,
although the relative size of that benefit tends to be small compared to the YLL value in the case of
diarrhea. The economist should use their best judgement when deciding to invest resources in
collecting data for a “work days lost” estimate.
21. Although not the Zambia project, since malaria incidence in Lusaka has been reduced to effectively
zero.
22. See Alderman, Hoddinott, & Kinsey (2006:21) and Bigsten et al. (2000: Table 5, p. 809).
23. Described in the (forthcoming) Education Project Guidelines.
24. The logic being that, absent barriers to entry for women, the LFP rate would be the same, and
furthermore that the higher the barriers to entry are, the greater the difference in LFP rates will be.
25. See, for example, the Malawi power sector ERR. Also there are several WASH ERRs that use
expenditures on bottled water as a “revealed preference” for WTP for piped water.
26. Often country economists have data on NRW losses but not the breakdown between physical and
non-physical losses. In the absence of data it is permissible for economists to assume 20% of NRW
losses are non-physical, consistent with assumptions in the Zambia and Tanzania I ERRs.
27. For the purposes of the ex ante ERR, the costs associated with upgrading a utility’s central
infrastructure consist entirely of engineering estimates of the cost of infrastructure construction
and ongoing maintenance.
28. Meaning peer reviewers will set a relatively high bar for accepting benefit streams from “stated
preference” surveys.
29. See “Public-Private Partnerships Reference Guide” from the World Bank et al. for a more thorough
treatment, available at documents.worldbank.org/curated/en/2014/01/20182310/public-private-
partnerships-reference-guide-version-20.
30. Either because the private sector will over-exploit the resource, or because firms will charge
monopoly prices for access.
31. See: Roth, A. “Repugnance as a Constraint on Markets” JEP 21 3, pp37-58 (2007).
32. See: Wu, X., and Malaluan, N.A. “A Tale of Two Concessionaires: A Natural Experiment of Water
Privatization in Metro Manila”, Urban Studies, 45(1), 2008
Powered by TCPDF (www.tcpdf.org)
Water Supply and Sanitation Sector Cost-Benefit Analysis Guidance | July 3, 2019
38