Water Supply and Sanitation in Cambodia - Home | WSP · Water Supply and Sanitation in Cambodia...
88
Water Supply and Sanitation in Cambodia Turning Finance into Services for the Future May 2015 Service Delivery Assessment
Transcript of Water Supply and Sanitation in Cambodia - Home | WSP · Water Supply and Sanitation in Cambodia...

Water Supply and Sanitation in CambodiaTurning Finance into Services for the Future
May 2015Service Delivery Assessment

This report is the product of extensive collaboration and information sharing between many government agencies and organisations in Cambodia. A core team drawn from the Ministry of Rural Development (Department of Rural Health Care, Department of Rural Water Supply and Department of Planning and Public Relations), and the Ministry of Industry and Handicraft, as well as the Ministry of Public Works and Transport have been key partners with the Water and Sanitation Pro-gram (WSP) of the World Bank in analyzing the sector. The authors acknowledge the valuable contributions made by these organizations, as well as other sector stakeholders, including development partners and NGOs partners in the sector that participated in the workshops and have shared their information, such as UNICEF, ADB, JICA, UN-Habitat, SNV, and others.
The Task Team Leader for the Regional Service Delivery Assessment (SDA) in East Asia and Pacific is Susanna Smets. The following World Bank staff and consultants have provided valuable contributions to the Service Delivery Assessment pro-cess and report for Cambodia: Phyrum Kov, Sopheap Ly, Virak Chan, Kuysrorn Seng, Sandra Giltner and Almud Weitz. This report was peer reviewed by World Bank staff Lixin Gu and Claire Grisaffi, as well as Belinda Abraham from UNICEF.
The report also has benefited greatly from the Cambodia Water Supply and Sanitation Sector Review completed in 2013, which was led by World Bank staff Lixin Gu.
The SDA was carried out under the guidance of the World Bank’s Wa ter and Sanitation Program and local partners. This re-gional work, implemented through a country-led process, draws on the experience of water and sanitation SDAs conduct ed in more than 40 countries in Africa, Latin America, and South Asia. An SDA analysis has three main components: a review of past water and sanitation access, a costing model to as sess the ad-equacy of future investments, and a scorecard that allows diagnosis of bottlenecks along the service de livery pathways. SDA’s contribution is to answer not only whether past trends and future finance are sufficient to meet sector targets for infrastructure and hardware but also what specific issues need to be addressed to ensure that fi nance is effectively turned into accelerated and sustainable water supply and sanitation service delivery.
The Water and Sanitation Program is a multi-donor partnership, part of the World Bank Group’s Water Global Practice, sup-porting poor people in obtaining affordable, safe, and sustainable access to water and sanitation services. WSP’s donors include Australia, Austria, Denmark, Finland, France, the Bill & Melinda Gates Foundation, Luxembourg, Netherlands, Nor-way, Sweden, Switzerland, United Kingdom, United States, and the World Bank.
WSP reports are published to communicate the results of WSP’s work to the development community. Some sources cited may be informal documents that are not readily available.
The findings, interpretations, and conclusions expressed herein are entirely those of the author and should not be attributed to the World Bank or its affiliated organizations, or to members of the Board of Executive Directors of the World Bank or the governments they represent. The World Bank does not guarantee the accuracy of the data included in this work. The bound-aries, colors, denominations, and other information shown on any map in this work do not imply any judgment on the part of the World Bank Group concerning the legal status of any territory or the endorsement or acceptance of such boundaries.The material in this publication is copyrighted. Requests for permission to reproduce portions of it should be sent to [email protected]. WSP encourages the dissemination of its work and will normally grant permission promptly. For more information, please visit www.wsp.org.
© 2015 International Bank for Reconstruction and Development/The World Bank

Water Supply and Sanitation in Cambodia
Turning Finance into Services for the Future

Water Supply and Sanitation in Cambodiaiv
Against a backdrop of strong economic growth and increas-ing household consumption over the past decade, Cambodia has made considerable progress to help people gain access to improved water and sanitation services, most notably in urban areas, where around one fifth of the population lives. As of 2012, according to Joint Monitoring Program (JMP) data, access to improved water supply in Cambodia reached 71%, up from 42% in 2000 and already having met the Mil-lennium Development Goal (MDG) target of 66%. For sanita-tion, improved access increased from 16% in 2000 to 37% in 2012, however, remains not on track to meet the MDG target of 55%.1 Based on these figures, some 4.3 million people are still without access to improved water supply and 9.4 million lack access to improved sanitation.
The Royal Government of Cambodia has adopted alternative national goals, known as the Cambodian MDGs, with 2015 targets set for each subsector. In the case of rural sanitation the target is very modest at 30%, however this target could probably be met as rural access was estimated to be 25% in 2012. The National Strategic Development Plan 2014-18 contains more ambitious targets of 60% improved access for rural and 85% of piped access for urban water supply respectively, and 60% for rural sanitation by 2018. Universal access targets have officially been adopted by 2025 for the rural sectors in the National Strategic Plan for Rural Water Supply, Sanitation and Hygiene (RWSSH) 2014-2025.2
Despite recent impressive gains in access, disparities remain especially between urban and rural populations, illustrated by only 25% of rural people having access to sanitation, as compared to 82% in urban areas. Moreover, inequalities be-
Strategic Overview
tween the poorest and better-off groups of society remain large. For example, among the poorest income quintile of the rural population only 12% has access to improved sanitation, while in the richest rural quintile this is five times as much at 59%. In urban areas, with overall good levels of improved access, 86% of the population in the richest quintile enjoys piped water supply services, as compared to 34% for the poorest quintile, while overall levels of service in rural areas are much lower with only 5% access to piped services.3
Over the past decade, government has initiated a decentralization and deconcentration (D&D) process, with the aim of increasing responsiveness of service delivery, improve efficiencies and enhance accountabilities. While reforms are progressing, the respective mandates of the three tiers of government are not yet clearly defined, accountability systems are unclear and the real empowerment of citizens has not, so far, become a reality.4 The endorsement of the policy framework for social accountability in July 20135 and its consequent implementation plan is expected to enhance citizen empowerment, accountability and local service delivery. A positive recent development within this context is the current investigation, with support of ADB and WSP, to assign rural sanitation and rural water scheme maintenance to sub-national administrations as a mandatory function, however, implementation6 of pilots has not yet started.
The National Strategic Plan for RWSSH has not yet been operationalized into a National Action Plan. This multi-year operational plan with budget for funding by government and development partners under a programmatic approach7 is ex-pected to be realized by mid 2015. Major bottlenecks in the
1 JMP (2014) Progress on Drinking Water and Sanitation – Update 2014. 2 The NSDP 2014-2018 specifies a target of 80% access to improved sanitation for the urban population, however as per JMP (2014) estimates this is already achieved (82% by 2012); the NSDP is not clear about the definition that applies to this target.3 CSES (2011) Cambodia Socio-Economic Survey 20114 World Bank (2013) Voice, Choice and Decision: A Study of Local Governance Processes in Cambodia. 5 World Bank (2014) Demand for Good Governance Policy Note, January 2014 - The Strategic Plan for Social Accountability in Sub-National Democratic Development; and 6 World bank (2014) Demand for Good Governance Policy Note, August 2014 - An Implementation Plan for Subnational Social Accountability in Cambodia7 World Bank (2012) Cambodia Water and Sanitation Sector Review
Service Delivery Assessment v
rural subsectors relate to both inadequate capital and opera-tional resources, leaving the Ministry of Rural Development mandate for rural water supply and sanitation largely unfunded. Robust and adequate systems, resources and human capaci-ties are lacking for monitoring, community mobilization, and the required comprehensive technical and managerial post-construction support to sustain rural water scheme operation.
In the urban sector, Phnom Penh Water Supply Authority, which has extended reliable and affordable services to 85% of Phnom Penh residents, has been the main driver of prog-ress in the sector. The NSDP 2014-2018 sets out an ambi-tious reform agenda to develop the necessary legal and reg-ulatory framework, and support public utilities—other than Siem Reap and Phnom Penh—to become autonomous, op-erate on commercial principles and expand services. Howev-er, to date, the implementation of previous policies has been limited. With support of development partners, the focus is shifting from project investments towards a complementary focus on building institutional and human capacities of water service providers. While the private water operators sector is growing, challenges remain concerning their technical and managerial performance, as well as accessing finance for expansion and new scheme development. Regulation and sector monitoring remains weak with limited capacities and available resources within the Department of Potable Water Supply of the Ministry of Industry and Handicraft, the de-factor regulator. While appreciating good service delivery in Phnom Penh, the scorecard focusses on the challenges in other urban areas in view of government targets, and hence reflects key bottlenecks in developing and sustaining servic-es through both public and private water providers.
The urban sanitation sector has been characterized by project-based investments in critical flood protection measures, as well as sewer systems in Phnom Penh and two other towns. As indicated in the Cambodia Water and Sanitation Sector Review,8 a strategic vision and coherent institutional framework—at national and service provider
level—is required to address the entire sanitation value chain: collection, management, treatment and disposal of fecal waste, including networked sewers, waste water and septage treatment, and fecal sludge management solutions for on-site solutions. The fact that the urban sanitation sector is still in early stages of development is reflected in a scorecard that illustrates the key bottlenecks in terms of the enabling policy environments, as well as the challenges to expand and increase service levels in a sustainable way.
As part of this Service Delivery Assessment, unofficial targets were developed for the urban subsectors namely universal access by 2025,9 as the rural subsector already have such officially endorsed targets. In order to reach the 2025 goals for rural and urban subsectors, about US$92 million would be required each year for capital spending in water supply infrastructure and about US$119 million annual on capital spending for sanitation, which includes the development of new facilities, as well as replacement of existing infrastruc-ture. For water supply, this is about 2.7% of the 2014 national budget of US$3.4 billion, and for sanitation about 3.5%.10 The total for water supply and sanitation of US$211 million per year in order to reach 100% coverage by 2025 is about 1.4% of total 2013 GDP of $15.25 billion.11 About US$24 mil-lion per year on average would be needed to finance op-eration and maintenance of current and future infrastructure. Moreover, additional software financing is needed, especially in the rural subsectors, for community mobilization, capacity building, promotion and operational expenditures.
This SDA has been conducted as a multi-stakeholder pro-cess under the joint leadership of the Ministry of Rural Devel-opment (MRD), the Ministry of Public Works and Transport (MPWT), the Ministry of Industry and Handicraft (MIH). These discussions led to a set of recommended priority actions re-quired to meet water supply and sanitation challenges, reach the goals, and ensure that finance is effectively turned into services. Indicative implementation horizons are provided to guide the sequencing of the priority actions.
8 World Bank (2012) Cambodia Water and Sanitation Sector Review9 This includes 90% access to piped water supply services and an ambitious 50% to sewer and treatment for sanitation10 2014 annual approved budget of US$3.4 billion (source: IMF)11 2013 estimated GDP US$15.25 billion (source: http://data.worldbank.org/country/cambodia)

Water Supply and Sanitation in Cambodiavi
Sector-wide
short term medium term long term
Strengthen decentralization in the water and sanitation sector by clarify-ing functions for sub-national administrations, providing operational guidance and developing the required legal framework
√ √
Develop an overall legal and institutional framework (water law) for the water and sanitation sector which redefines the institutional mandate for urban sanitation and establishes an independent regulator
√ √ √
Adopt and implement a capacity building strategy hosted with local institutions and design a pooled financing mechanism for development partners support
√ √
Establish better monitoring systems, reporting access and usage of ser-vices, service quality, sustainability, institutional WASH, and equity, and publish information through ministerial websites
√ √
Carry out high-level advocacy using platforms such as Technical Work-ing Groups and Cambodia Development Council to increase funding allocations, especially for the rural sector
√
Improve the tracking of budget allocations and expenditure on water supply and sanitation for rural and urban sub-sectors through program-based budgeting and the government’s Financial Management Informa-tion System, including better tracking at sub-national level over time
√ √
Institutionalize coordination and planning between Ministries of Health, Education and Rural Development to improve WASH facilities in institu-tions, such as health centers and schools
√ √
Priority actions for rural water supply
short term medium term long term
Clarify the roles of government agencies and sub-national administra-tions at provincial, district and commune level under the decentralization reform and test this through a pilot
√ √
Develop a National Action Plan for rural water supply with focus on sus-tainability and cost-effectiveness of different technology options (based on a review of technologies)
√
Establish district rural water supply functionality plans linked to local and national investment planning process
√
Develop professional post-construction technical and managerial sup-port systems to ensure sustainability of community-managed schemes, possibly involving the private sector
√ √
Promote expanded role of private sector in piped water service delivery in rural growth centers, through facilitating access to finance and lever-aging private sector investment grants
√ √
Safeguard water quality through treatment, water quality management and risk assessment at source, as well as household water treatment and storage programs
√ √ √
Increase enforcement for water quality regulations and carry out point-of-consumption water quality surveys
√ √
Develop national management information system for rural water supply and sanitation
√ √
Implementation horizon: short-term 2015-2016; medium-term 2016-2018; long-term 2018 and beyond.
Implementation horizon: short-term 2015-2016; medium-term 2016-2018; long-term 2018 and beyond.

Service Delivery Assessment vii
Priority actions for urban water supply
short term medium term long term
Develop full legal framework (water law) that clarifies and redefines insti-tutional roles, including that of regulator
√ √ √
Develop policy, guidelines and instruments for economic regulation, including pro-poor tariff setting and connection policies (beyond those existing at project level)
√
Following the model of Phnom Penh Water Supply Authority, transform public water works into autonomous utilities and transition all investment and service provision responsibilities
√
Develop a long-term sector development and investment plan, with em-phasis on equity considerations (e.g. social connection fund)
√
Improve service performance and efficiencies of public and private op-erators through at-scale training programs by - to-be-established - utility training center and Cambodia Water Association’s training services
√ √
Introduce competitive granting of licenses for private operators to in-crease transparency, leverage commercial finance, and ensure value for money
√
Develop capacities of Department of Potable Water Supply for expedit-ing licensing and economic regulation regime, bringing all unlicensed operators under its supervision
√ √
Develop an umbrella association for all public and private operators to promote best practices and continued support to professionalizing of the sector
√ √
Priority actions for rural sanitation and hygiene
short term medium term long term
Establish National Action Plan for rural sanitation and hygiene, that in-cludes community-wide targets, and pro-poor implementation guidelines (e.g. on use of smart subsidies/incentives)
√
Based on pilot, develop necessary legal framework, implementation guidance, and financial management mechanisms and sources for func-tional assignment of sanitation to subnational level
√ √
Carry out high-level advocacy to increase funding allocations, especially for program and operational costs (software) such as for community-led total sanitation, behavior change, and monitoring
√ √
Develop and implement a roadmap for government to facilitate and strengthen the private sector role in sanitation service delivery
√
Test and scale-up approaches for integration of sanitation and hygiene in nutrition and social protection programs
√ √
Carry out evaluations and facilitate sector learning on poor-inclusive sanitation service delivery and develop harmonized financing guideline
√
Continue innovation and R&D for low-cost product and services espe-cially for challenging environments, waste collection and emptying and other WASH products
√ √
Develop a national management information system for rural sanitation and water supply
√ √
Implementation horizon: short-term 2015-2016; medium-term 2016-2018; long-term 2018 and beyond.
Implementation horizon: short-term 2015-2016; medium-term 2016-2018; long-term 2018 and beyond.

Water Supply and Sanitation in Cambodiaviii
Priority actions for urban sanitation and hygiene
short term medium term long term
Carry out options study and high-level dialogue to build consensus on urban sanitation institutional framework (e.g. look at combined utility for urban water and wastewater)
√
Develop comprehensive urban sanitation strategy, focused on low-cost solutions for collection, management, treatment and disposal of fecal waste (wastewater treatment, as well as fecal sludge management)
√
Develop a long-term urban sanitation investment plan, identify funding sources, and support city-wide sanitation master planning (including drainage and flood protection)
√
Test and develop policy instruments for improved fecal sludge manage-ment, including promotion of private sector in septage collection, incen-tives and regulations for disposal
√ √
Build capacity of relevant actors in urban sanitation value chain, includ-ing for city-wide sanitation master planning, management of wastewater treatment plants and fecal sludge management
√ √
Tackle the elimination of open defecation among the poorest households in informal slum areas through targeted approaches
√
Improve sector coordination and programmatic support using a com-bined urban water supply and sanitation/waste water sub-Technical Working Group as platform
√
Implementation horizon: short-term 2015-2016; medium-term 2016-2018; long-term 2018 and beyond.

Service Delivery Assessment ix
Contents
Acknowledgment .................................................................................................................................................................iiStrategic Overview .............................................................................................................................................................ivContents ........................................................................................................................................................................... viiiAbbreviations and Acronyms ..............................................................................................................................................ix
1. Introduction .................................................................................................................................................................. 12. Sector Overview: Coverage and Trends....................................................................................................................... 23. Reform Context ............................................................................................................................................................ 94. Institutional Framework .............................................................................................................................................. 135. Financing and its Implementation .............................................................................................................................. 176. Sector Monitoring and Evaluation .............................................................................................................................. 217. Subsector: Rural Water Supply .................................................................................................................................. 238. Subsector: Urban Water Supply ................................................................................................................................ 279. Subsector: Rural Sanitation and Hygiene .................................................................................................................. 3210. Subsector: Urban Sanitation and Hygiene ................................................................................................................. 3611. Conclusion ................................................................................................................................................................. 40
Annex 1: Scorecard and and Explanation ........................................................................................................................ 43Annex 2: Assumptions and Inputs for Financial Model .................................................................................................... 70

Water Supply and Sanitation in Cambodiax
ADB Asian Development BankAFD Agence Francais de Developpement (French Development Agency)BORDA Bremen Overseas Research and Development AssociationCAPEX Capital ExpenditureCLTS Community-Led Total Sanitation CMDGs Cambodia Millennium Development Goals D&D Decentralization and DeconcentrationDEWATS Decentralized Wastewater Treatment SystemDP(s) Development Partner(s)FSM Fecal Sludge ManagementGDP Gross Domestic ProductGSF Global Sanitation FundJICA Japan International Cooperation AgencyJMP UNICEF-WHO Joint Monitoring ProgramMDG Millennium Development GoalsMEF Ministry of Economy and FinanceMIH Ministry of Industry and Handicraft (formerly Industry, Mines and Energy) MOE Ministry of EnvironmentMOH Ministry of HealthMOI Ministry of InteriorMOWRAM Ministry of Water Resources and MeteorologyMOEYS Ministry of Education, Youth and SportMPWT Ministry of Public Works and Transport MRD Ministry of Rural Development NCDD National Committee for Sub-National Democratic DevelopmentNGO(s) Non-government Organization(s) NSDP National Strategic Development Plan (2014-18)ODA Official Development AssistancePDIH Provincial Department of Industry and Handicraft (formerly Industry, Mines and Energy)PDRD Provincial Department of Rural DevelopmentPEFA Public Expenditure and Financial Accountability PIP Project Investment PlanPPWSA Phnom Penh Water Supply AuthorityRGC Royal Government of CambodiaSDA(s) Service Delivery AssessmentSIP Sector Investment Plan SNV Netherlands Development OrganizationSRWSA Siem Riep Water Supply AuthorityTA Technical AssistanceWASH Water, Sanitation, and Hygiene WB-WSP World Bank’s Water and Sanitation Program
Abbreviations and Acronyms

Service Delivery Assessment 1
1. Introduction
Water and sanitation Service Delivery Assessments (SDAs) are taking place in seven countries in the East Asia Pacific region under the guidance of the World Bank’s Water and Sanitation Program (WSP) and local partners. This regional work, implemented through a country-led process, draws on experience of water and sanitation SDAs conducted in more than 40 countries in Africa, Latin America, and South Asia.
The SDA analysis has three main components: a review of past water and sanitation coverage, a costing model to assess the adequacy of future investments, and a score-card that allows diagnosis of bottlenecks along the service delivery pathway. SDA’s contribution is to answer not only whether past trends and future finance are sufficient to meet sector targets for infrastructure and hardware but also what specific issues need to be addressed to ensure that finance is effectively turned into accelerated and sustainable wa-ter supply and sanitation service delivery. Bottlenecks can in fact occur throughout the service delivery pathway—all the institutions, processes, and actors that translate sec-tor funding into sustainable services. Where the pathway is well developed, sector funding should turn into services at the estimated unit costs. Where the pathway is not well developed, investment requirements may be gross under-estimates because additional investment may be needed to ‘unblock’ the bottlenecks in the pathway.
The scorecard looks at nine building blocks of the service delivery pathway, which correspond to specific functions classified in three categories: three functions that refer to enabling conditions for putting services in place (policy de-velopment, planning new undertakings, budgeting), three actions that relate to developing the service (expenditure of funds, equity in the use of these funds, service output), and three functions that relate to sustaining these services (facility maintenance, expansion of infrastructure, use of the service). Each building block is assessed against specific indicators and is scored from 0 to 3 accordingly. The score-
card uses a simple color code to indicate building blocks that are largely in place, acting as a driver for service de-livery (score >2, green); building blocks that are a drag on service delivery and that require attention (score 1–2, yel-low); and building blocks that are inadequate, constituting a barrier to service delivery and a priority for reform (score <1, red).
Since this is a national assessment, an attempt has been made to present a balanced picture taking in to account the fact service provision in Phnom Penh is much better than in the rest of the country. For the urban subsector, this means that often the scoring is reflective of the situation outside of Phnom Penh, to clearly articulate the bottlenecks.
The SDA analysis relies on an intensive, facilitated consulta-tion process, with government ownership and self-assess-ment at its core. Through the SDA process, an evidence-based analysis has been conducted to better understand what undermines progress in water supply and sanitation and what the Royal Government of Cambodia can do to accelerate progress. A series of meetings throughout 2013 and urban and rural subsector workshops with core stake-holders, together with reviews of available data, budgets and reports has provided the information on which the anal-ysis in this report is based. Sources of evidence are refer-enced at the end of this report.
The analysis aims to help the RGC to assess how it can strengthen pathways for turning finance into water supply and sanitation services in each of four subsectors. Specific priority actions were identified and have been presented for validation to government decision makers and other sector stakeholders. This report, produced by WSP in collaboration with the Government and other stakeholders, evaluates the service delivery pathway in its entirety, locating the bottlenecks and presenting priority actions to help address them during the current five year National Strategic Development Plan 2014-2018.

Water Supply and Sanitation in Cambodia2
2. Sector Overview: Coverage Trends
12 Ministry of Planning, National Institute of Statistics, Cambodia Inter Census Population Data (2013). Final Report.13 Ministry of Planning, National Institute of Statistics, Jan 2011 Analysis of Census Results, Population Projections of Cambodia p.19; other sources of population estimates, such as World Bank puts the expected 2013 population at 15.14 million. http://data.worldbank.org/country/cambodia14 World Bank (2013). Where have all the poor gone? Cambodia Poverty Assessment 2013. Phnom Penh. World Bank. 15 http://data.worldbank.org/country/cambodia, viewed Aug 2014.16 World Bank (2013). Where have all the poor gone? Cambodia Poverty Assessment 2013. Phnom Penh. World Bank. 17 Demographic Health Survey (2010) National Institute of Statistics, Directorate General for Health, and ICF Macro. 2011. Cambodia Demographic and Health Survey 2010. Phnom Penh, http://www.measuredhs.com/publications/publication-FR249-DHS-Final-Reports.cfm
SreAmbel
MoungRoessei
Samrong
Poipet
Pailin
Cheom Ksan
Lumphat
Snoul
Banam
Siempang
Bok Kou
Takeo
KampongSpeu
Kampot
PreyVeng
Svay Rieng
KampongThom
KampongChhnang
Battambang
Sisophon
Siem Reap
Sihanoukville
Phnom ThbengMeanchey
Boung Long
Stung Treng
Kampong Cham
Ta Khmau
KrongKoh Kong
Kratie SenmonoromPursat
PhnomPenh
KAMPOT
KAMPONGSPEU
KOH KONG
PURSAT
BANTEAYMEANCHEY SIEM REAP PREAH VIHEAR
KAMPONG THOM
KAMPONGCHHNANG
KAMPONG CHAM
RATANAKIRI
MONDOLKIRI
STUNGTRENG
TAKEO
KANDAL
BATTAMBANG
SVAYRIENG
PREYVENG
SIHANOUKVILLE
K R A T I E
T H A I L A N D
LAO PEOPLE'S DEMOCRATIC REPUBLIC
V I E T N A M
GULFOF
THAILAND
ChhakKampong
Saom
Tonle Sap
Sreng
Sen
Chinit
Bassa
k
Ton le Sap
Mek
ong
Kon
g San
Peam
Chas
Mekong
The boundaries and names shown and the designations used on this map do not imply official endorsement or acceptance by the United Nations.
National capitalProvincial capitalTown, villageMajor airportInternational boundaryProvincial boundaryRroadRailroad
0 10 20 30 40 mi
0 20 40 60 km
Angkor Wat
Map No. 3860 Rev. 4 UNITED NATIONSJanuary 2004
Department of Peacekeeping OperationsCartographic Section
CAMBODIA
CAMBODIA104° 105° 106° 107°
14°
13°
12°
14°
13°
12°
103° 104° 105°
Context
The recent Cambodia Inter-Census Population Survey (2013)12 estimated the total population in 2013 to be 14.7 million people, of which around 21% or 3.2 million were liv-ing in urban areas and 11.5 million in rural areas. Urbaniza-tion is taking place at considerable speed and is expected to further accelerate over time, with more than a third of Cambodians living in towns and urban centers by 2025, as indicated by population analysis study of the National Insti-tute of Cambodia in 2011.13 Between 2004 and 2011, Cam-bodia’s GDP per capita (in constant 2000 US$) grew 54.5 per cent, while the poverty rate dropped from 52.5% to 20.5 %.14 The most important drivers of poverty reduction have been better prices of rice for farmers, better wages
for agricultural workers, increases in salary jobs for urban workers and better income for non-agricultural businesses for rural households. Despite this tremendous achievement, the majority of people escaped poverty only slightly and re-mains highly vulnerable, even to small shocks, which could quickly bring them back in poverty. Poverty remains highest in rural areas, where it stood at an estimated 22% in 2012, as compared to 4% in Phnom Penh and 9% in other urban areas. Cambodia’s estimated Gross Domestic product for 2013 is US$15.3 billion, with a Gross Net income per capita of around US$950.15 Investments and public expenditure in health and education improvements have also provided a favorable environment for the poor, resulting in an impres-sive relative improvement of its Human Development Index. However in absolute terms, as of 2011 with an HDI of 0.523, it remains to rank among the worst in the region and the 139th worst in the world.16 One of the persistent challenges related to poor water, sanitation and hygiene is stunting, which continues to prevail in Cambodia, especially in rural areas and among the poor. As of 2010, 40% of under-five year old children remained stunted.17
Coverage: Assessing Past Progress
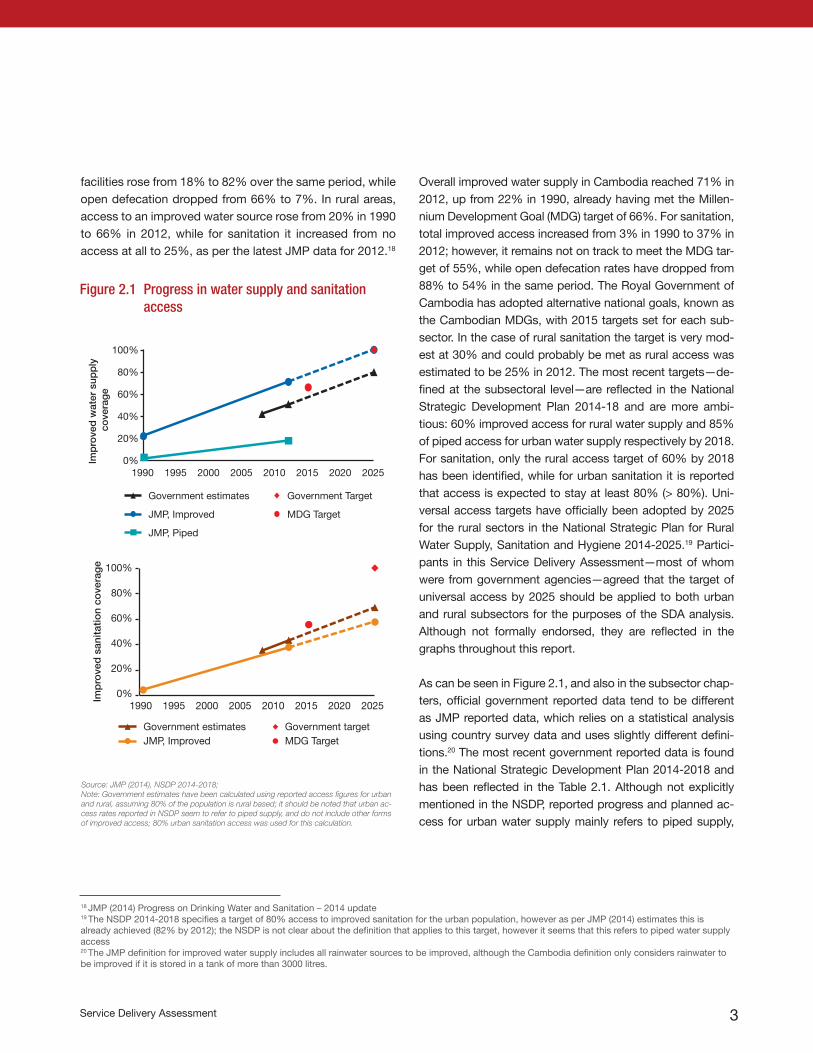
The positive developments in terms of economic growth and poverty reduction have been accompanied by an in-crease in access to water supply and sanitation in both rural and urban settings (See Figure 2.1). In the case of urban wa-ter supply, access to an improved source rose from 48% in 1990 to 94% by 2012, with two thirds having a house con-nection. Regarding sanitation, urban access to improved
Service Delivery Assessment 3
facilities rose from 18% to 82% over the same period, while open defecation dropped from 66% to 7%. In rural areas, access to an improved water source rose from 20% in 1990 to 66% in 2012, while for sanitation it increased from no access at all to 25%, as per the latest JMP data for 2012.18
Overall improved water supply in Cambodia reached 71% in 2012, up from 22% in 1990, already having met the Millen-nium Development Goal (MDG) target of 66%. For sanitation, total improved access increased from 3% in 1990 to 37% in 2012; however, it remains not on track to meet the MDG tar-get of 55%, while open defecation rates have dropped from 88% to 54% in the same period. The Royal Government of Cambodia has adopted alternative national goals, known as the Cambodian MDGs, with 2015 targets set for each sub-sector. In the case of rural sanitation the target is very mod-est at 30% and could probably be met as rural access was estimated to be 25% in 2012. The most recent targets—de-fined at the subsectoral level—are reflected in the National Strategic Development Plan 2014-18 and are more ambi-tious: 60% improved access for rural water supply and 85% of piped access for urban water supply respectively by 2018. For sanitation, only the rural access target of 60% by 2018 has been identified, while for urban sanitation it is reported that access is expected to stay at least 80% (> 80%). Uni-versal access targets have officially been adopted by 2025 for the rural sectors in the National Strategic Plan for Rural Water Supply, Sanitation and Hygiene 2014-2025.19 Partici-pants in this Service Delivery Assessment—most of whom were from government agencies—agreed that the target of universal access by 2025 should be applied to both urban and rural subsectors for the purposes of the SDA analysis. Although not formally endorsed, they are reflected in the graphs throughout this report.
As can be seen in Figure 2.1, and also in the subsector chap-ters, official government reported data tend to be different as JMP reported data, which relies on a statistical analysis using country survey data and uses slightly different defini-tions.20 The most recent government reported data is found in the National Strategic Development Plan 2014-2018 and has been reflected in the Table 2.1. Although not explicitly mentioned in the NSDP, reported progress and planned ac-cess for urban water supply mainly refers to piped supply,
18 JMP (2014) Progress on Drinking Water and Sanitation – 2014 update19 The NSDP 2014-2018 specifies a target of 80% access to improved sanitation for the urban population, however as per JMP (2014) estimates this is already achieved (82% by 2012); the NSDP is not clear about the definition that applies to this target, however it seems that this refers to piped water supply access20 The JMP definition for improved water supply includes all rainwater sources to be improved, although the Cambodia definition only considers rainwater to be improved if it is stored in a tank of more than 3000 litres.
Imp
rove
d w
ater
sup
ply
co
vera
ge
0%
20%
40%
60%
80%
100%
1990 1995 2000 2005 2010 2015 2020 2025
Government estimates Government Target
JMP, Improved MDG Target
JMP, Piped
0%
20%
40%
60%
80%
100%
1990 1995 2000 2005 2010 2015 2020 2025
Government estimates Government targetJMP, Improved MDG Target
Imp
rove
d s
anita
tion
cove
rag
e
Source: JMP (2014), NSDP 2014-2018; Note: Government estimates have been calculated using reported access figures for urban and rural, assuming 80% of the population is rural based; it should be noted that urban ac-cess rates reported in NSDP seem to refer to piped supply, and do not include other forms of improved access; 80% urban sanitation access was used for this calculation.
Figure 2.1 Progress in water supply and sanitation access

Water Supply and Sanitation in Cambodia4
however, for rural the definitions of improved water supply are not described in detail. This difference in approach ex-plains the higher access rates as reported by JMP. In addition to the pronounced disparities between urban and rural, there are also large inequalities in access by income status of the population. For example, among the poorest income quin-tile of the rural population only 12% has access to improved sanitation, while in the richest rural quintile this is five times as much at 59%. In urban areas, with overall good levels of improved access, 86% of the population in the richest quin-tile enjoys piped water supply services, as compared to 34% for the poorest quintile, while overall levels of service in rural areas are generally much lower with only 5% access to piped services.21
Investment Requirements: Testing the Sufficiency of Finance
Given the 2025 goals set by government in the National Stra-tegic Plan for Rural Water Supply, Sanitation and Hygiene 2014-25 and the request to assume universal targets for 2025
in the urban subsectors, the SDA costing tool estimates the investments required to meet the targets of universal access to improved water and sanitation services by 2025. It also facilitates a comparison of these requirements with recent and projected sector investments in order to provide a big picture situation of the funding situations. Annex 2 provides a detailed description of the methodology of the costing as well as the input data that have been used as assumptions.
The analysis derives capital expenditure (CAPEX) require-ments, representing hardware costs of new facilities as well as replacement costs of existing facilities (as an average annual amount over their economic life cycle). Estimated CAPEX requirements are further disaggregated between domestic funded, externally funded (by development part-ners) and investments that are assumed to be contributions by households. Key inputs in the estimation of investment requirements are (a) base year and target year access rates, (b) population projections, (c) unit costs of different technol-ogies/facilities and (d) assumed technology mix at the base year and target year for each of the different subsectors.
Table 2.1 Cambodia: access to water supply and sanitation, current status and targets
21 CSES (2011) Cambodia Socio-Economic Survey 2011
Status Targets
2012(NSDP)a
2012(JMP)b
2015(CMDG)c
2018(NSDP)a
2025d
(RWSSH Strategy/SDA target)
Water supply national 51%e 71% - 100%
Rural 47% 66% 50% 60% 100%
Urban 69% 94% 80% 85% 100%
Sanitation national 36%e 37% - 100%
Rural 25% 25% 30% 65% 100%
Urban >80% 82% 74% >80% 100%
a Source: National Strategic Development Plan 2014-2018 Royal Government of Cambodia b JMP Progress on Drinking Water and Sanitation – Update 2014 c RGC 2003. National Policy on Water Supply and Sanitation, Royal Government of Cambodia; MDGs are formulated for national level accessd For rural official targets as per the National Strategy; for urban subsectors these are targets agreed to be used in the SDAe These are imputed figures using subsector reported progress and a 20%-80% population division between rural and urban. Urban sanitation has not been reported on other than >80% in its current progress and projections beyond 2012

Service Delivery Assessment 5
Population estimates and the urban-rural split were derived from Cambodian government estimates for 2025 (17.5 mil-lion with 65% living in rural areas).22 Access rates for the base year (2012) were derived from JMP (2014),23 and the technology mix distribution was adopted from the Cambo-dia Socio-Economic Survey (2010). Unit costs were derived from estimates provided by government officials during the workshops, and informed by additional project documents. The analysis assumes government targets of universal ac-cess to improved water supply and sanitation by 2025. As per the discussion with government stakeholders, for ur-ban water supply, the expected level of piped water supply coverage was 90%, with the remaining 10% using other improved sources. For rural water supply, there is not yet an aspirational vision for the level of services that governments would like achieve, and for this analysis the technology dis-tribution was held constant.24 For urban sanitation, stake-holders wished to assume that by 2025 50% of the urban population would not only have access to sewers, but also that wastewater treatment is taking place.25
Investment data was collected from publicly available documents and websites,26 and subsequently validated through visits and direct communications with various stakeholders, in 2013. The collected information was di-vided between recent and anticipated investments, which represent the average annual budgets of government, de-velopment partners from 2010 to 2012 and 2013 to 2015, respectively. Expenditures were also disaggregated as fol-lows: (a) sector - water supply or sanitation, (b) location – rural or urban, (c) nature – hardware or software, (d) year, and (e) budget versus actual. To calculate gaps in invest-ment, the study estimated investments for 2013 to 2015
from various potential financing sources (government, de-velopment partners, private sector, and assumed house-hold contribution) to derive an average annual anticipated investment per subsector (based on this 3-year average). This task proved to be challenging for as currently con-solidated information on anticipated investment spending is not easily available, neither is it broken down for various subsectors.
Based on publicly available information, and correspond-ing with development partners, including the usage of the results of a comprehensive donor mapping exercise con-ducted in 2012/2013 in the rural sector produced estimates of capital spending by development partners. Forming comprehensive estimates of government capi-tal spending on water supply and sanitation was difficult. Three different ministries, several autonomous or nearly autonomous utilities have responsibility for capital spend-ing on water supply and sanitation, and local and provin-cial governments can also spend on water and sanitation. In practice, however, it appears that national governments rather than local governments have the largest amount of capital spending in the subsectors, except for utilities such as the Phnom Penh Water Supply Authority (PPWSA), that publish their annual financial statement including capital spending. Information supplied by ministries in the form of their Project Investment Plans needed careful interpretation as sources of funds were not always well defined. Develop-ment partner spending projected for 2013-2015 probably reflects an underestimate since some pipelined projects were not yet confirmed at the time of data collection and hence were not yet included.
22 RGC Ministry of Planning, National Institute of Statistics, Jan 2011 Analysis of Census Results, Rept. 12 Population Projections of Cambodia p.19. and 20. 23 Using JMP access rates might have led to conservative estimates for rural water supply as government estimates report a lower access rate; for rural sanitation, it might have led to a slight overestimation of the costs as government estimates are higher than JMP. For urban sectors consistency between JMP and government estimates seems better.24 By keeping the technology mix constant, it is expected that piped services would increase linearly from 5% in 2012 to 8% of total access by 2025. However, it is to be expected that piped services provision will become increasingly viable in areas that are “characterized” as rural and hence this assumption could be adjusted for the purpose of scenario assessment25 Based on CSES (2011), current levels of urban access to septic tanks connected to combined sewer systems is around half. However, there is hardly any treatment capacity in place at this moment. 26 The Council for the Development of Cambodia maintains an online database of Official Development Assistance (ODA) projects that has a wealth of information, listing projects as well as expected development partner expenditures;

Water Supply and Sanitation in Cambodia6
Table 2.2 presents the annual averages of the capital expen-diture (CAPEX) requirements and anticipated investments that were estimated for Cambodia. It indicates that national universal access targets will be met if about 560,000 people per year gain access to improved water supply, and around 930,000 people per year gain access to improved sanitation facilities. Despite the expected urbanization, the majority of people requiring new services reside in rural areas, especially for sanitation where 70% of those requiring access live.
The people that will need access to improved services fa-cilities translate to CAPEX requirements of US$92 million per year for water supply and US$119 million per year, for sanitation. Despite the larger service gaps in rural areas, over two third of the required CAPEX is expected to flow to urban areas. This is explained by the higher levels of servic-es and unit costs assumed for urban areas. For water sup-ply, 90% of urban households are expected to benefit from piped services in urban areas, as compared to 8% piped services in rural areas, at much lower unit costs. Similarly for urban sanitation, the 2025 target expects 50% of all ur-ban residents to be connected to sewers with full waste
water treatment capacity, while for rural sanitation the target assumes that all households will use low-cost improved on-site sanitation facilities.
Table 2.2 also shows that anticipated public (domestic and external) CAPEX are about US$30 million per year for wa-ter supply and almost US$9 million per year for sanitation, representing about 0.25% of 2013 GDP, as compared to a required level of CAPEX spending of 1.4% of GDP. Most of these anticipated funding is coming from external sources (around 80% for sanitation and 90% for water supply re-spectively), illustrating the low priority the sector receives in domestic fund allocation. This high reliance on develop-ment partner CAPEX funding in water and sanitation mirrors Cambodia’s overall financing trend. While capital spending as a percentage of total budget expenditures is more or less steady since 2009 at around 40%, the percentage of financing for capital expenditure from external sources has shifted from about 30% in 2009 to about 70% in 2013, with loans as an increasing portion of overall external financing reflecting Cambodia’s preference of using loans for infra-structure.27
27 International Monetary Fund (2013). Cambodia 2012 Article IV Consultation. IMF Country Report no 13/2. page 24
Table 2.2 Coverage and investment figuresa
Coverage(base year
2012)
Target2025
Population requiring access
Annual capital requirement
Anticipated public CAPEX2013-2015
Anticipated household
CAPEX
Annual deficit
Total Public Domestic External Total
% % ‘000/year US$ million/year
Rural water supply 66% 100% 302 31.8 24.1 0.9 5.0 5.9 1.9 24.0
Urban water supply 94% 100% 260 60.1 52.7 2.2 21.5 23.7 3.3 33.1
Water supply total 71% 100% 562 91.9 76.7 3.1 26.5 29.6 5.2 57.1
Rural sanitation 25% 100% 658 32.5 3.5 0.4 2.5 2.9 23.9 5.7
Urban sanitation 82% 100% 275 86.7 71.4 1.6 4.3 5.9 1.5 79.4
Sanitation total 37% 100% 933 119.2 74.9 2.0 6.8 8.8 25.4 85.1
Note: Public Expenditures include domestic (government) and external (development partners and NGOs) sources. Totals may not sum due to rounding. Source: SDA costing (see annex 2)

Service Delivery Assessment 7
Subtracting the sum of anticipated CAPEX contributions of the public and households from CAPEX requirements sug-gests deficits of US$57 million per year for water supply and US$85 million per year for sanitation. This implies that projected investments fall far short of the amounts required to meet targets. The expected deficits suggest the need for increasingly higher expenditures throughout the period 2015 to 2025 if the country wishes to achieve its universal targets for water supply and sanitation, especially its pro-jected high levels of services for urban sanitation.
There is some uncertainty over the estimated deficits. Ag-gregate and sector-specific deficits could be reduced by ac-counting for expenditures of utilities and the private sector, as well as not accounted for development partner funds that were unconfirmed at the time of data collection. At the same time, the implied reduction in the deficits may also be par-tially or wholly offset when one considers the fact that the anticipated household CAPEX is an assumed estimate of the amounts that households are expected to contribute. How-
Figure 2.2 Required vs anticipated (2013-2015) and recent (2010-2012) capital expenditure for water supply
ever, it is important to note that encouraging households to invest in improved facilities also entails costs in terms of ef-forts by government and development partners in community mobilization and demand creation to solicit these assumed self-investments by households. This is especially relevant for rural sanitation where over three quarters of the funds is expected to come from households, domestic resources for recurrent expenditures and demand creation activities are minimal, leaving the subsector highly reliant on support from NGOs and development partners.
Figure 2.2 and 2.3 indicate that anticipated investments for 2013-15 in water supply are higher than recent investments28 from 2010-12, although this is not the case for sanitation. While this is a good sign, anticipated investments still fall short of investment requirements. Annual CAPEX require-ments are composed of new and replacement investments. Replacement investments, which represent expenditures for replacing worn-out facilities, are substantial amounts of total annual CAPEX requirements, and would in an ideal scenario
Total investmentrequirement
Anticipatedinvestment
Recentinvestment
Ann
ual i
nves
tmen
t in
mill
ion
US
D
0102030405060
8090
100
70
Other
Replacement
New
Household
External
Domestic
Total water supply
Total investmentrequirement
Anticipatedinvestment
Recentinvestment
Ann
ual i
nves
tmen
t in
mill
ion
US
D
0
20
40
60
100
120
140
80
Other
Replacement
New
Household
External
Domestic
Total sanitation
Figure 2.3 Required vs anticipated (2013-2015) and recent (2010-2012) capital expenditure for sanitation
Water Supply and Sanitation in Cambodia8
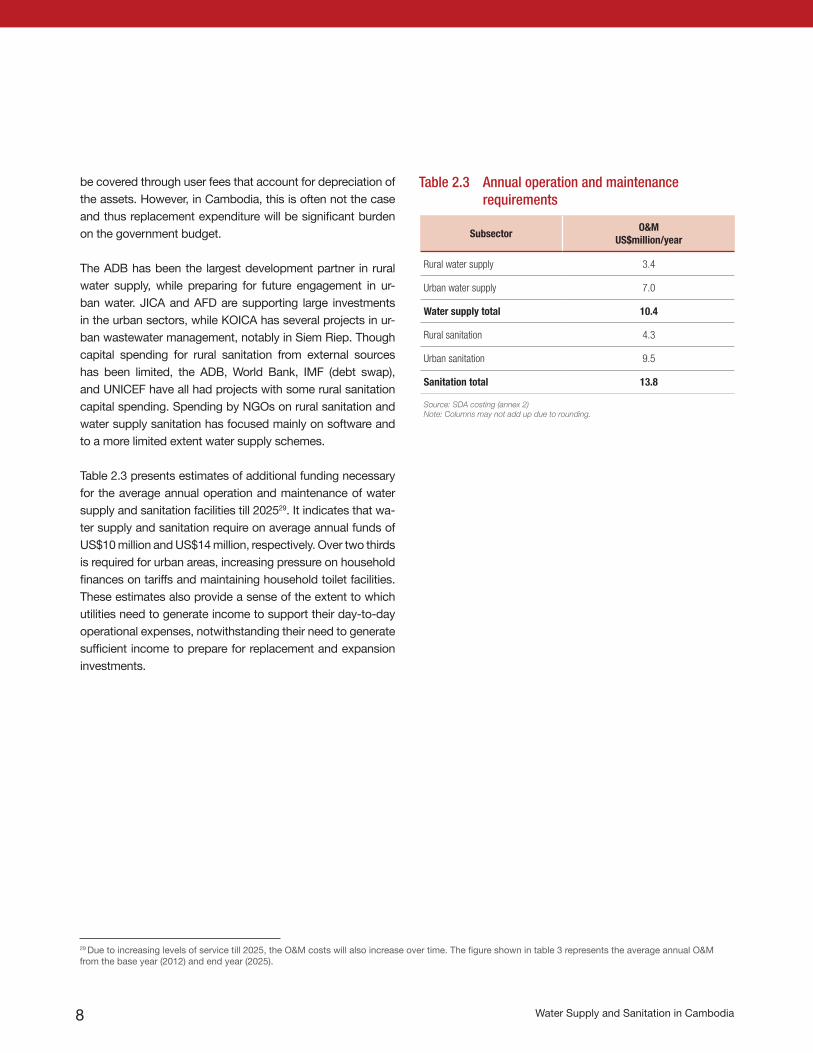
Table 2.3 Annual operation and maintenance requirements
Subsector O&MUS$million/year
Rural water supply 3.4
Urban water supply 7.0
Water supply total 10.4
Rural sanitation 4.3
Urban sanitation 9.5
Sanitation total 13.8
Source: SDA costing (annex 2)Note: Columns may not add up due to rounding.
be covered through user fees that account for depreciation of the assets. However, in Cambodia, this is often not the case and thus replacement expenditure will be significant burden on the government budget.
The ADB has been the largest development partner in rural water supply, while preparing for future engagement in ur-ban water. JICA and AFD are supporting large investments in the urban sectors, while KOICA has several projects in ur-ban wastewater management, notably in Siem Riep. Though capital spending for rural sanitation from external sources has been limited, the ADB, World Bank, IMF (debt swap), and UNICEF have all had projects with some rural sanitation capital spending. Spending by NGOs on rural sanitation and water supply sanitation has focused mainly on software and to a more limited extent water supply schemes.
Table 2.3 presents estimates of additional funding necessary for the average annual operation and maintenance of water supply and sanitation facilities till 202529. It indicates that wa-ter supply and sanitation require on average annual funds of US$10 million and US$14 million, respectively. Over two thirds is required for urban areas, increasing pressure on household finances on tariffs and maintaining household toilet facilities. These estimates also provide a sense of the extent to which utilities need to generate income to support their day-to-day operational expenses, notwithstanding their need to generate sufficient income to prepare for replacement and expansion investments.
29 Due to increasing levels of service till 2025, the O&M costs will also increase over time. The figure shown in table 3 represents the average annual O&M from the base year (2012) and end year (2025).

Service Delivery Assessment 9
3. Reform Context
30 Royal Government of Cambodia (2014) National Strategic Development Plan 2014-2018.31 The lowest tier of government is the commune (also called sangkat for urban areas), with the next administrative level being the district (not elected).32 World Bank (2014) Demand For Good Governance Policy Note, January 2014 - The Strategic Plan for Social Accountability in Sub-National Democratic Development; and 33 World bank (2014) Demand For Good Governance Policy Note, August 2014 - An Implementation Plan for Subnational Social Accountability in Cambodia
National Development Strategy and Decentralization and Deconcentration Reforms
Broad policy direction for the water and sanitation sector is provided by the Rectangular Strategy for Growth, Employ-ment, Equity, and Efficiency, which was launched in 2004 and recently updated for the period 2014-2018. The Nation-al Strategic Development Plan (NSDP) is the delivery vehicle for the Rectangular Strategy and has also been updated for the 2014-18 planning period.30 Of particular significance to the sector it builds on the earlier Cambodian Millennium De-velopment Goals and sets more ambitious targets for water supply and sanitation, as discussed in detail in Chapter 2.
In 2001, the government of Cambodia embarked on a wide range of sub-national governance reforms, recognizing the need to introduce new systems of governance at com-mune/sangkat level, and provincial, municipal, and district levels in order to strengthen local democracy, promote local development, and reduce poverty. As a second phase of decentralization & deconcentration (D&D) reform, in 2008, the Organic Law was passed which lays out the administra-tive and management structure of Cambodia’s sub-national administration. The law is expected to involve a significant devolution of power from the central to the provincial and district levels in order to improve service deliveries and strengthen the state’s regulatory functions. Furthermore, the law stipulates that the majority of ministries will have to undertake a functional review process to identify functions for potential devolution to sub-national administrations in accordance with sector priorities and the provisions set out in the Organic Law. In 2010, the Council of Ministers signed
the 10-year National Program for Sub-National Democratic Development. This was operationalized through the adop-tion of a three-year (2011-2013) Implementation Plan by the National Committee for Democratic Development (NCDD), and has since been extended till 2014. The implementa-tion plan provides a framework for further strengthening of communes,31 as well as for developing the roles of district, municipal, and provincial administrations. The recent en-dorsement of the policy framework for social accountability in July 201332 and its consequent implementation plan33 is expected to enhance citizen empowerment, accountability and local service delivery with increased focus on the poor, women, children and youth.
Commune councils, which are directly elected, have a gener-al mandate for reducing poverty through the use of the com-mune/sangkat fund. This could in theory be used to fund wa-ter supply and sanitation improvements, though in practice over 90% is used for rural road construction. At village level, Village Development Committees (VDCs) were established in 2010 as part of the decentralization process. Although Vil-lage Development Committees are governed through a joint prakas (regulation) by the Ministry of Rural Development and Ministry of Interior, they are not formed everywhere, and if ex-isting, often do not have the capacities or interest to actively engage on water supply and sanitation.
Despite the intent of the Organic Law to provide real ad-ministrative autonomy to sub-national administrations, no broad agreement has been reached as to which functions will be transferred from central to local government after three years of implementation, although in 2014 certain

Water Supply and Sanitation in Cambodia10
Table 3.1: Key milestones for the reform of the water supply and sanitation sector in Cambodia
Year Event
1999 Sub decree on water pollution control providing mandate to MoE to monitor and regulate effluent discharge into water bodies
2003 National Policy on Water Supply and Sanitation (2025 vision) ratified by Council of Ministers
2004 National Water Resource Policy approved by Council of Ministers
2004 National Drinking Water Quality Standard issued MIME
2005 Sector Investment Plan for Rural Water Supply and Sanitation 2005-15 (for ADB project)
2005 Memorandum of Understanding between MIME and MRD (outlines powers and responsibilities to avoid overlap in piped water supply)
2007 Technical Working Group for Rural Water Supply, Sanitation, and Hygiene established, that is coordinating government and development partner sector contributions
2007 Law on Water Resources Management passed
2007 Law on Concessions (implemented by the Council for Development of Cambodia to approve concession contracts for privately financed infrastructure, including water supply)
2008 Rectangular Strategy Phase II followed by NSDP 2009-2013
2008 Law on Administrative Management of Capital, Provinces, Municipalities, Districts, and Khan (the Organic Law)
2010 Joint ministerial regulation on Village Development Committees by Ministry of Rural Development (MRD) and Ministry of Interior (MoI), followed by a circular issued in 2011
2010 Action Plan for Urban Water Supply Sector 2009-13 prepared by MIME (not formally endorsed)
2010 Sub-Technical Working Group (TWG) on Urban Water Supply established, chaired by MIME, operating under Infrastructure and Regional Integration TWG chaired by MPWT
2011 MOWRAM sub-decree on water abstraction licensing drafted
2011-2013 Rural Water Supply, Sanitation, and Hygiene Strategy approved by Ministry of Rural Development and subsequently by the Council of Ministers in early 2014
2013 Rectangular strategy–phase III
2014 National Strategic Development Plan 2014-2018
2014 Ministerial Decree from MIH issued regarding the licensing process
sub-functions in health and education sector have been put forward for assignment. The Ministry of Rural Development, which is responsible for rural water supply and sanitation, was one of the first ministries selected for decentralization and has completed its functional mapping process in 2013. A functional review process followed and was formally is-sued in 2014, identifying rural sanitation and the mainte-
nance of rural water supply schemes as functions that could be transferred to district level.34 This has led to the establishment of joint teams between the Ministry of Inte-rior,35 MRD and the Ministry of Economy and Finance to design a pilot for this functional assignment with support of ADB and WSP. So, far the D&D reforms have not yet taken off for the line ministries responsible for the urban subsec-
34 MRD 2013, Functional mapping of the MRD, report, D&D working group, MRD, Cambodia MRD 2014, Functional review of the MRD, report, D&D working group, MRD, Cambodia35 The Secretariat of the National Committee for Democratic Development (NCDD) is the agency responsible under Ministry of Interior.36 Previously urban water supply resorted with the Ministry of Industry, Mines and Energy, and in late 2013 this Ministry was split in Ministry of Mines and Energy, and Ministry of Industry and Handicraft

Service Delivery Assessment 11
tors, namely the Ministry of Industry and Handicraft (MIH)36 for urban water supply and the Ministry of Public Works and Transport (MPWT) for urban sanitation.
Sector Policy
Table 3.1 lists a number of milestones that have impact on the reform of the water and sanitation sector in recent years. The National Policy for Water Supply and Sanita-tion, passed in 2003, was important as it provided direction for improved service delivery in both the urban and rural subsectors. Important policy provisions relate to the intro-duction and demand-driven approaches for service deliv-ery, introducing a regulatory body and autonomy of service providers, an enhanced role for the private sector, financial sustainability of services and ensuring poor-inclusiveness. However, the 2012 World Bank sector review, which dis-cussed the accomplishment of the policy in detail, states that many provisions have not yet been fully or effectively implemented.37 Although a law governing the provision of water and sanitation services was drafted in 2004, it has not been adopted and the sector remains without a com-prehensive legal basis.
Urban Water Supply and Sanitation
In 1996, a law was passed granting legal autonomy to the Phnom Penh Water Supply Agency (PPWSA). In the suc-ceeding years, the utility became a profitable and efficient company and today is often cited as a prime example of utility transformation. Siem Reap followed suit with the es-tablishment of an autonomous utility, and as of 2014 there are ten other public water works that function under MIH, while other towns and urban centers are served by licensed private water operators. In 2014, MIH issued a ministerial decree that provides more clarity about the licensing pro-cess and grants a 20-year license term for operators in a defined service area. At present, there is no independent regulator for urban water supply, though initial efforts to
establish one were made in 2003. Although not seen as in-ternational best practice, the department of Potable Water Supply is assumed to fulfil this role in the medium term. Currently, MIH is drafting technical standards for urban wa-ter supply and revising the existing water quality standards, previously issued in 2004. It is expected that later in 2014, MIH will issue water quality standard for urban water supply systems, while MRD will issue a guideline for rural water supply quality.38 The water quality standards as well as the necessary enforcement mechanisms are especially critical for Cambodia, which has a large population exposed to ar-senic in groundwater, as well as high risk of non-chemical contamination due to poor sanitation and shallow ground-water levels.
The urban sanitation subsector remains in the initial stages of development and there have been no significant policy initiatives in recent years. In most urban areas, privately installed on-site facilities with limited treatment are most common, in some cases connected to combined sewer and drainage systems. With drainage and flood protection un-derstandably receiving priority, so far only in Sihanoukville, Siem Reap and Battambang significant public invest-ments have been made in sanitation infrastructure. These cities have the beginnings of a sewerage network includ-ing wastewater treatment plants, although it is estimated that less than 5% of the total urban area is connected.39 In Phnom Penh wastewater is drained in lagoons with re-portedly overloaded treatment capacity before being dis-charged in rivers. In 2006, Ministry of Economy and Finance (MEF) and MPWT issued a decision on user and connection fees for sewer collection and treatment.
Rural Water Supply and Sanitation
Activity and investment in the rural subsector is guided by the National Strategic Plan for Rural Water Supply, Sanita-tion and Hygiene 2014-2025, which was approved by the Council of Ministers in 2014.
37 World Bank (2012) Cambodia Water Supply and Sanitation Sector Review38 The MIH drinking water quality and MRD drinking water guideline that are currently being drafted, are based on a combined draft proposal that was developed in 2011 with the help of WHO. However, the 2011 draft has was not cosigned by MIH and MRD, and instead two separate ministerial decrees are expected to be issued later in 2014.39 Ibid
Water Supply and Sanitation in Cambodia12
The Strategic Plan envisages 2014-2018 as a transition pe-riod to be used for institutional strengthening and capacity building, with 2018-2025 dedicated to accelerated service expansion. Development of the strategy was a collabora-tive effort by government and development partners. MRD is currently preparing for a National Action Plan 2014-2018 to operationalize the strategy through rolling 3-year opera-tional plan and budget.
The 2003 policy established that Water and Sanitation User Groups (WSUG) were to be responsible for the management of rural water supply schemes, and in 2004 guidelines were issued accordingly. However, these groups generally tend to exist only in areas with externally supported projects, as no systematic mechanisms are in place to provide continu-ous technical and financial support. In 2005, a Memoran-dum of Understanding between MRD and MIME (currently transitioned to MIH) allocated responsibility for piped water supply schemes above 500 connections to MIH. In the rural sector, the policy has been supported by the issuance of a number of guidelines by the Department of Rural Health Care, such as the 2014 guideline on Community-Led To-
tal Sanitation which outlines the process for assessing the status of open Defecation Free villages. More comprehen-sive guidelines, including one on pro-poor support through smart subsidies, are planned to be issued as part of the National Action Plan.
This recent history puts the service delivery pathway in context, which has been further explored in detail using the SDA scorecard, an assessment tool providing a snapshot of reform progress along the service delivery pathway. The scorecard assesses the building blocks of service delivery in turn: three building blocks which relate to enabling ser-vices, three which relate to developing new services, and three which relate to sustaining services. Each building block is assessed against specific indicators and scored from 1 to 3 accordingly.
Sections 4 to 6 highlight progress and challenges within the subsectors sector across three thematic areas: the institu-tional framework, finance, and monitoring and evaluation. The scorecards for each subsector are discussed in Sec-tions 7 to 10.

Service Delivery Assessment 13
Sector Leadership Roles
Responsibility for water supply and sanitation lies primar-ily with three ministries: the Ministry of Industry and Handi-crafts (MIH) for urban water supply; the Ministry of Public Works and Transport (MPWT) for urban drainage, sewerage and operation of treatment plants; and the Ministry of Rural
4. Institutional Framework
Development (MRD) for rural water supply and sanitation. Provincial departments of these ministries undertake relat-ed functions at sub-national level, while in the urban water supply sector two state-owned enterprises are functioning as autonomous utilities (PPWSA, SRWSA). MRD extends its presence to provincial level and to a much lesser extent to district offices, as the latter are not well resourced and have
Implementation horizon: short-term 2015-2016; medium-term 2016-2018; long-term 2018 and beyond.
Priority actions for institutional framework
short term medium term long term
Strengthen decentralization in the rural water and sanitation sector by clarifying institutional roles at sub-national level, developing legal framework, and providing operational guidance to sub-national administrations
√ √
Develop professional post-construction technical and managerial support systems to ensure sustainability of community-managed water supply schemes (possibly through involvement of the private sector)
√
Develop comprehensive legal framework for the urban sector aligned with D&D reform, separating responsibilities for service delivery and retaining economic and service regulation for water supply and wastewater management at central level
√ √ √
Following the model of Phnom Penh Water Supply Authority, transform public wa-ter works into autonomous utilities and transition all investment and service provi-sion responsibilities
√
Adopt and implement a capacity building strategy hosted with local institutions and design a pooled financing mechanism for development partner support √ √
Carry out options study and high-level dialogue between MIH and MPWT to build consensus on urban sanitation institutional framework, considering combined so-lutions for service provision (utility for urban water and wastewater)
√
Improve sector coordination and programmatic support using a combined urban water supply and sanitation sub-Technical Working Group as platform √
Institutionalize coordination mechanisms between Ministries of Health, Education, Rural Development to improve WASH facilities in institutions, such as health cen-ters and schools
√ √

Water Supply and Sanitation in Cambodia14
limited or no staff responsible for water supply and sanita-tion. Other central agencies with lesser roles in the sector include the following:
The Ministry of Water Resources and Meteorology issues permits which are required for water abstraction of water over a defined level.
The Ministry of the Environment is responsible for setting standards, monitoring and regulation for effluents discharg-ing into water bodies as defined by the sub-decree on water pollution control issued in 1999. However, in practice, it only monitors industrial on-site wastewater treatment facilities and does not monitor domestic or public wastewater.
The Ministry of Education, Youth and Sports has responsibil-ity – in coordination with MRD - for school sanitation via the School Health Department, though activity in this area has generally been limited to donor-funded construction of facili-ties with little attention to hygiene promotion. A positive step is the issuance of a joint decree (prakas) by Ministry of Edu-cation, Youth and Sports, Ministry of Rural Development on School to Community WASH in 2010 which is operationalized with support of UNICEF, GiZ, and NGOs active in this space. However, access to clean water in schools remained low at 58% and to sanitation at 88% (with many reportedly locked and inoperable facilities) in 2013 as per the government Edu-cation Management Information System (while access to WASH facilities in health centers is not routinely captured). It is expected that sector-wide education and health programs will pay increasing attention to improve these low access rates.
The Ministry of Health is responsible for adequate water, sanitation and hand washing facilities in health centers, in coordination with MRD. The Department of Preventive Health also has a role in hygiene promotion and has issued an Environmental Health Action Plan, although its imple-mentation on the ground is limited and coordination with MRD has room for improvement.
The Ministry of Land Management, Urban Planning and Construction is responsible for checking the adequacy of water supply provision in new development areas.
The Ministry of Interior, notably the Secretariat of the National Committee for Sub-National Democratic Development play a role in supporting the implementation of the D&D reform in close coordination with line ministries, such as MRD. While the Organic Law of 2008 formalized the start of decentralization and deconcentration, at present, control of financing40 as well as most technical capacity, remains at central government level. Local authorities, as part of their general mandate for poverty reduction, could play (and to some extent are already playing) a much more pronounced role in rural water sup-ply and sanitation with support from provincial departments. However, capacity for planning and implementation is weak at sub-national level.41
Sector Coordination
Two working groups have been set up to help coordinate the activities of government and external agencies operating in the sector. The Technical Working Group for Rural Water Sup-ply, Sanitation and Hygiene has been established formally in 2007 - including a supporting secretariat. Meetings are ex-pected to take place quarterly and are chaired by the Minister of MRD with a development partner acting as co-chair on a rotating basis (since 2011 UNICEF). The rural subsector also has a monthly coordination meeting for knowledge sharing, which has been in place for over 20 years and is chaired by the Director of the Department of Rural Water Supply. Sub-groups are formed under this umbrella to focus on particular areas of interest. Currently, the rural subsector is considering ways to improve the monthly coordination meeting so as to play a more strategic role for sector development.
The Infrastructure and Regional Integration Technical Work-ing Group is chaired by the Minister of MPWT, and in 2010
40 Other than the Commune Sangkat Fund and the District/Municipal Fund that has recently been established and are at the discretion of Communes, respectively Districts. Most of line ministries capital and program budgets are executed at central level.41 RGC 2012 Functional Mapping Report of Ministry of Rural Development; World Bank (2012). 42 See also ADB (2012) Cambodia Water Supply and Sanitation Sector Assessment, Roadmap and Strategy.
Service Delivery Assessment 15
a formal sub-group for urban water supply was established chaired by MIH, with JICA as its current co-chair. The fre-quency of meetings and the fact that the sub-TWG has not yet officially augmented its official mandate to cover urban sanitation remains a constraint for more programmatic sup-port to the urban sector.42
Urban Water Supply
In the absence of an independent regulator, and as outlined in the NSDP 2014-2018, the Ministry of Industry and Handicraft through its Department of Potable Water Supply has respon-sibility for urban water supply policy, strategic planning, regu-lation and sector oversight, including the licensing of private water operators. While tariffs of public utilities require approval form the Prime Minister, in the recent past tariffs of private op-erators have mostly been determined through local negotiation with hands-off involvement of MIH. As per the 2014 licens-ing decree, tariffs will be stipulated in the license issued by MIH, requiring consultation at local level. At present, no official guidelines, procedures and method is yet available for tariff setting and review for public and private water operators. The Department of Potable Water Supply, which has around 20 staff, is faced by high demands, leaving some departmental functions only implemented in full when there is technical and financial support from development partners. MIH responsibil-ities in provincial and small towns include monitoring drinking water quality standards in piped systems and supporting the licensing of private operators.
Following extensive reforms and investment and capac-ity building support from multiple development partners, the Phnom Penh Water Supply Authority (PPWSA) has become hugely successful over the last decades. It has a listing on the Cambodia Stock Exchange and a high level of operational au-tonomy, with its Board of Directors headed by the Governor of Phnom Penh Municipality. As a state-owned enterprise, the water supply infrastructure remains in government ownership. Similarly, Siem Reap has moved to such autonomous utility
model. Following the recent privatization of a number of pro-vincial public water works, ten other provincial water works remain under the Department of Potable Water Supply. Insti-tutional arrangements for the non-autonomous utilities are in stark contrast to the PPWSA; they are bound by government rules and compensation systems, have difficulty attracting skilled staff, have little incentives to improve performance and operational efficiency, and suffer from limited public invest-ment allocation for the expansion of services.
Small-scale private operators also play a significant role in wa-ter supply provision, particularly in rural growth centers and emerging towns. There are an estimated 300 operators at present, though only 147 (approximately) are licensed, while MIH is currently trying to bring all non-licensed operators into its sphere of monitoring with as a first step a survey to identify all unlicensed ones. In 2013 it was estimated that over 1 mil-lion people are currently being served by the domestic private sector.43 However, small private operators are not yet prop-erly regulated, have limited capabilities and struggle to access capital for service improvements and expansion. Several de-velopment partners have been supporting private operators, through experimenting with various PPP-arrangements in the past. Understanding the potential of the private water mar-ket, development partners like AFD and WSP have focused on creating a more favorable environment to access financing through local banks, and the provision of business develop-ment services to improve performance and develop bankable investment proposals. In 2012, the Cambodia Water Asso-ciation of private water operators has been established, now serving over 50 members covering more than 70 licenses.44
Urban Sanitation
The Ministry of Public Works and Transport is responsible for policy, planning, coordination and the implementation of investment projects. In 2011 a mandated department under MPWT was established to set technical standards and tariffs for urban sanitation. However, this department is in the early
43 World Bank/IFC (2013) Tapping the Market: Opportunities for Domestic Investments in Water for the Poor. World Bank Water & Sanitation Program (WSP) and International Finance Corporation (IFC).44 Notably GRET (MIREP program) and World Bank experimented with Design-Build Lease arrangements, and Build-Operate-Transfer schemes, including output-based subsidies (also by USAID). AFD and WSP have focused more on operator access-to-finance and business development.45 PPWSA collects a 10% top-up on the water tariffs and passes this on the provincial department of MPWT to support O&M of the system.

Water Supply and Sanitation in Cambodia16
stages of development and is not yet fully staffed and re-sourced. Provincial departments of MPWT are responsible for planning, project implementation and O&M of drainage, sewer and treatment facilities (treatment facilities are only present in Siem Reap, Sihanoukville and Battambang). Fee collection ar-rangements differ from city to city, with PPWSA providing this service through their water bill.45 Improving on-site sanitation and the safe collection, management, treatment and disposal of fecal sludge does not rank high on the priority list of MPWT and/or cities themselves. Private sector involvement in fecal sludge management is so far limited and largely unregulated.
Rural Water Supply and Sanitation
The Ministry of Rural Development (MRD) is the lead agency for rural sanitation and water supply, via the Departments of Rural Health Care (DRHC) and Rural Water Supply (DRWS) respectively. MRD has offices at provincial and district level. In line with the Strategic Plan for RWSSH, the intention is to strengthen their District offices, however, to date few district offices are functional in the water and sanitation domain. Both domestic and externally funded projects are channeled through the ministry, leading to rather top-down implemen-tation in limited geographic areas. While there are numerous local and international and NGOs facilitating service delivery and demand creation in rural water supply and sanitation, these efforts are, however, fragmented and not always mutu-ally supportive due to a lack of consistency in operational ap-proaches. PDRD offices often do not yet effectively coordinate NGO inputs at national or sub-national level and no program-matic guidelines have been issued for implementation of the RWSSH Strategy. The NSDP 2014-2018 provides the direc-tions to move to a programmatic national approach. The vi-sion is for MRD and PDRD to be facilitating and technical sup-porting the district offices and sub-national administrations. Districts and communes, including the Commune Council for Women and Children,46 are expected to then play a larger role in the delivery of services, in close coordination with local pri-
vate sector businesses. This will also require that sufficient hu-man and financial resources are made available at local level. As laid out in Section 3, the clarifications of institutional roles and responsibilities and the legal basis for such functional assignment will be an important part of operationalizing the Strategy. Moreover, enforcement of water quality guidelines for rural water supply is under resourced, nor is much attention given to regulating multiple bottled water plants. Regulations on drilling, that could help to prevent contamination of shallow aquifers, have not yet been developed. Since 2006, the Department of Rural Health Care has worked closely with development partners to introduce and scale up demand-driven approaches to sanitation and hygiene promo-tion including Community-Led Total Sanitation and behavior change communications. A lot of experience has been gained in sanitation marketing, leading to over 150,000 latrines being sold through the private sector over recent years.47 However, there is not yet a roadmap for how the engagement of the pri-vate sector can effectively be institutionalized and facilitated by government at different levels.
For rural water supply, current policy envisages community management of rural water supplies via Water and Sani-tation User Groups (WSUG). Progress here is hampered partly by the fact that institutional arrangements under de-concentration and decentralization are not clear, account-ability mechanisms and clear procedures are missing, and citizen engagement and voice is not yet mainstreamed in social accountability initiatives (such as trough community scorecards under the social accountability framework). This leaves a dangerous vacuum in the rural water supply sector, where sustainable post-construction support, both techni-cal and managerial, is missing.48
The role of private operators managing small piped schemes in rural growth centers was discussed under urban water supply.
46 Commune Council for Women and Children (CCWC) are already mandated with a role to promote sanitation and hygiene, however, lack the resources and capabilities to prioritize such activities, especially in commune council does not champion sanitation as an important area for improving basic social services.47 See monitoring data provided by two large scale sanitation marketing programs facilitated by WaterSHED and IDE. http://www.ideorg.org/OurStory/Publications/iDE_PR_CBD100k.pdf and http://www.watershedasia.org/watershed-supported-suppliers-sell-50000-toilets-to-rural-consumers/48 World Bank (2013) Voice Choice and Decision 2: Local Basic Service Delivery. The Asia Foundation and World Bank
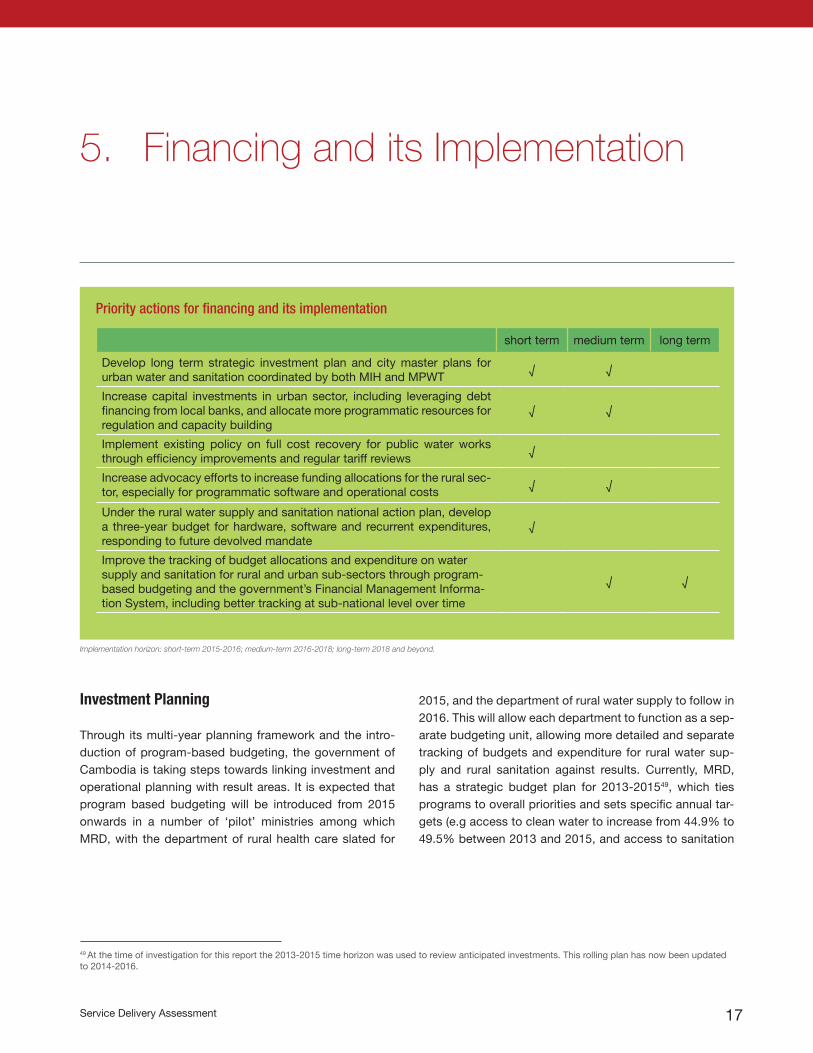
Service Delivery Assessment 17
Investment Planning
Through its multi-year planning framework and the intro-duction of program-based budgeting, the government of Cambodia is taking steps towards linking investment and operational planning with result areas. It is expected that program based budgeting will be introduced from 2015 onwards in a number of ‘pilot’ ministries among which MRD, with the department of rural health care slated for
5. Financing and its Implementation
2015, and the department of rural water supply to follow in 2016. This will allow each department to function as a sep-arate budgeting unit, allowing more detailed and separate tracking of budgets and expenditure for rural water sup-ply and rural sanitation against results. Currently, MRD, has a strategic budget plan for 2013-201549, which ties programs to overall priorities and sets specific annual tar-gets (e.g access to clean water to increase from 44.9% to 49.5% between 2013 and 2015, and access to sanitation
49 At the time of investigation for this report the 2013-2015 time horizon was used to review anticipated investments. This rolling plan has now been updated to 2014-2016.
Implementation horizon: short-term 2015-2016; medium-term 2016-2018; long-term 2018 and beyond.
Priority actions for financing and its implementation
short term medium term long term
Develop long term strategic investment plan and city master plans for urban water and sanitation coordinated by both MIH and MPWT
√ √
Increase capital investments in urban sector, including leveraging debt financing from local banks, and allocate more programmatic resources for regulation and capacity building
√ √
Implement existing policy on full cost recovery for public water works through efficiency improvements and regular tariff reviews
√
Increase advocacy efforts to increase funding allocations for the rural sec-tor, especially for programmatic software and operational costs √ √
Under the rural water supply and sanitation national action plan, develop a three-year budget for hardware, software and recurrent expenditures, responding to future devolved mandate
√
Improve the tracking of budget allocations and expenditure on water supply and sanitation for rural and urban sub-sectors through program-based budgeting and the government’s Financial Management Informa-tion System, including better tracking at sub-national level over time
√ √
Water Supply and Sanitation in Cambodia18
from 27% to 33%). Similarly to MRD, MIH and MPWT pre-pare multi-year rolling investment plans, however, these ministries are not yet part of the program-based budgeting pilot.
Currently, none of the line ministries involved in the sector has yet developed a long-term investment plan and com-prehensively covers each subsector with clear priorities and identification of sources. The absence of such planning is reflected in the ‘planning building’ block of the scorecard. It should be noted that as part of previous development part-ner support, MIH prepared such sector investment plan for 2009-2013 and MRD for 2005-2015 (although these plans were not formally endorsed at ministerial level). All ministries do have project lists and anticipated expendi-tures as per their Project Investment Plans. However, not all ministries were able to clearly identify the breakdown of do-mestic and external funding and PIPs did not specify which sources of funding were already secured.
Budget Transparency
A key recommendation of a 2011 integrated fiduciary as-sessment and public expenditure review50 was to improve the quality, coverage and classification of items in the gov-ernment budget, which is crucial for designing, executing and monitoring government policy and strengthening ac-countability. The report recommended that authorities should strive to bring all government spending on budget, including disbursements on donor-financed projects, donor-financed technical cooperation and donor top-ups of civil service wages. Agreement is needed on the expenditure reports on donor-supported projects prepared using the government’s chart of accounts – which will enable their better integration into the budget. Amongst others, the introduction of a re-vised financial management information system (FMIS), the introduction of program-based budgeting and the recent and ongoing revisions to the chart of accounts are expected to support the implementation of these recommendations. With
the expectation that financial management and other public sector reforms will deepen over the coming years, Cambodia remains a moderate performer as per the Country Policy and Institutional Assessment 2013.51
During the review of the Medium Term Expenditure Frame-works, as well as the Project Investment Plans,52 as pre-pared by MIH, MPWT and three-year rolling strategic Budget Plans of MRD, it indeed proved difficult to compre-hensive identify sources of funds for budgets and expendi-tures. Although the rolling three-year budget plan for MRD did provide some information on the joint allocation for rural water supply and sanitation, further decomposition for rural water supply and rural sanitation needs to be strengthened. The planned introduction of program-based budgeting is expected to improve the transparency of the budgeting and expenditure monitoring process, and better link such ex-penditure to outcomes. As indicated in the functional map-ping report of MRD, rural water and rural sanitation devel-opment expenditures remain a fraction of the overall capital and program budget of MRD.53
The online official development assistance (ODA) database maintained by the Cambodia Development Council is a fair-ly transparent resource for estimating development partner projects and annual expenditures subject to confirmation with the partners.
Utilization of Budgets
Because development expenditures for water supply and sanitation do not appear in detail, it is difficult to know ex-actly whether a budget allocation for water supply and sani-tation was in fact spent. Overall, Cambodia has received a satisfactory mark in an assessment of aggregate expendi-ture compared to original approved budget.54 At the level of the three main ministries, domestic budgets utilization has also been high, and as per the domestic expenditure reports of 2009-2011, has been reported to be at least 90%. This
50 World Bank. 2011. Cambodia - More Efficient Government Spending for Strong and Inclusive Growth : Integrated Fiduciary Assessment and Public Expenditure Review. World Bank51 http://data.worldbank.org/indicator/IQ.CPA.PUBS.XQ/countries Viewed Aug 2014.52 MPWT PIP did break out domestic capital budget and donor sources, while MIH PIP did not break out government contributions or expenditures.53 Ministry of Rural Development 2013, Functional mapping of the MRD, report, D&D working group, MRD, Cambodia. Around USD 0.9 million for rural water supply annual identified in the MTEF and around USD 0.3 million annually for sanitation.54 World Bank. 2011 p. 91. Cambodia - More Efficient Government Spending for Strong and Inclusive Growth : Integrated Fiduciary Assessment and Public Expenditure Review.

Service Delivery Assessment 19
confirms the views of participants in the SDA that tended to give a high rating for utilization of domestic funds. However, it should be noted that domestic funding allocation for water and sanitation are limited (especially in rural subsector) and that a large part of domestic funds are for recurrent costs, such as salaries, which are easy to spend. The high domestic budget utilization rate is reflected in the fairly positive rating of the expenditure building block. At the same time, bottle-necks were identified in the frequent delays in fund transfer, which – combined with the rainy season – narrow the actual implementation period in the field. Development partners with substantial funding in the sector confirmed that – al-though project design and start-up is lengthy – annual dis-bursement rates of 75% were normally achieved.
Budget Adequacy
Figure 5.1 shows the illustrates that in all subsectors the an-ticipated budget, even when considering expected house-hold contribution, is inadequate to reach the targets as set for 2025. Deficits are especially pronounced for urban sanitation, due
to high expectation of service levels as set in the assumed targets by 2025. However, also for water supply, urban and rural, anticipated public investments are much less than 50% of the required investments. Anticipated domestic funding sources comprise just a small share of overall spending re-quirements (< 5% in all subsectors) and the sector mostly relies on externally funded hardware support.
For rural sanitation, the deficit seems less pronounced, mainly as households are expected to be the major source of capital expenditure. However, the actual size of the defi-cits might be larger than the values presented here, as the assumed household contributions (shown in light blue) are a leveraged amount based on anticipated hardware spend-ing. The chances of these investments materializing depend highly on the effectiveness of government social mobiliza-tion and promotion programs to elicit self-investment by rural households. Given the meagre operational budget and staffing levels within MRD, PDRD and the district offices, the actual deficit is likely to be higher.55 Confirming this costing assessment, SDA participants, all scored the adequacy of the budget as problematic, as is reflected in the scorecard.
Figure 5.1 Overall annual and per capita investment requirements and contribution to anticipated financing by source
Source: SDA costing. Note: the anticipated household investment in rural services are assumed
Domestic anticipated investment
External anticipated investment
Household anticipated investment
Deficit
Urban water supplyTotal : $ 60,100,000Per capita (new): $ 116
Rural water supplyTotal : $ 31,800,000Per capita (new): $ 21
Urban sanitationTotal : $ 86,700,000Per capita (new): $ 147
Rural sanitationTotal : $ 32,500,000Per capita (new): $ 20
55Allocation (2011) to wages for MRD, PDRD and District offices as “mapped” to rural water supply, and rural healthcare was estimated to be around US$360,000, and US$240,000 respectively. MRD 2013 Functional Mapping Report.56 World Bank (2012) Voice, Choice and Decision: A Study of Local Governance Processes in Cambodia

Water Supply and Sanitation in Cambodia20
Financial Reforms in Support of Decentralization and Deconcentration
Around 2.8% of national budget is allocated to the com-mune/sangkat fund and although some funds might be used for rural water supply and sanitation, over 90% of the expenditures are estimated to be allocated to rural road construction.56 At national level it is not possible to clearly track if funds have been spend on water supply and sanita-tion, as broad categories are defined as infrastructure and social services. Hence, water and sanitation spending un-der this fund has not yet been included. Water and sanita-tion expenditure under the recently established district and municipal fund (0.8% of national budget) is unknown and could not be included. In line with the ongoing decentraliza-tion reform, it is expected that more funding will become available at the discretion of sub-national authorities, in-cluding a sub-national investment fund from 2014 onwards, some of these funds might flow into the urban and rural wa-ter and sanitation sector. It will be important in the future to track and understand how such expenditure will (or will not) be contributing to the sector. Hence, it will be critical to bet-ter monitor spending at sub-national level through the na-tional Financial Management Information System on water and sanitation in the long-term. A first start is to implement national level programme-based budgeting for water and sanitation and to routinely monitor resource flows to the sector that are not going through the government budgets.

Service Delivery Assessment 21
6. Sector Monitoring and Evaluation
There is currently no national monitoring framework in place for either the rural or urban subsectors, though the need for improved sector monitoring - and the intention to establish a sector monitoring system - has been recognized in vari-ous policy and strategy documents and sector reviews. The 2003 Water Policy, for example, included a set of monitoring and evaluation principles. At present, much of the monitor-ing in the sector is dependent on census and other survey data rather than robust real-time subsectoral monitoring sys-tem. Although with the support of WHO/UNICEF much of the surveys that are implemented have increasingly streamlined
definitions with JMP, limitations remain as sample sizes are small, limited information concerning sub-national progress can be distilled, the focus is on only monitoring access, and data is not real time to inform the annual review, planning and programming at sub-national level. Another source of in-formation is the commune database hosted by the Ministry of Planning, and in absence of more precise data, this is the only available data at commune level. However, the reliability of this data is not assured, as is based on unverified reports made by village chiefs and collected by Commune Council chiefs.
57 Unicef 2009. ‘Arsenic in Cambodia’
Implementation horizon: short-term 2015-2016; medium-term 2016-2018; long-term 2018 and beyond.
Priority actions for sector monitoring and evaluation
short term medium term long term
Establish better sectoral monitoring systems, reporting access and usage of services, service quality, sustainability and equity, and integrate indica-tors for WASH services in institutions (schools and health centers)
√ √
Publish key sector performance indicators through ministerial websites to improve transparency and usage by different levels of government and external support agencies
√ √
For urban water supply carry out industry benchmarking for both public and private operators
√ √
Allocate domestic resources, to operate and roll-out of monitoring sys-tems by national and sub-national departments/actors
√ √
Introduce annual joint government-development partner sector review process, under leadership of the Technical Working Groups (for rural and for urban)
√

Water Supply and Sanitation in Cambodia22
Rural Water Supply and Sanitation
Monitoring in the rural subsector has not been well coordi-nated up to now, there being various disconnected project databases plus a national arsenic monitoring database57. Moreover, ADB is providing support to MRD in developing a M&E system, linked to programme-based budgeting, to which a future sub-sectoral M&E system needs to be well linked. The RWSSH Strategy acknowledges the need for a unified management information system to which all partici-pating organizations contribute, making it possible to track progress towards national targets. In 2013, MRD with sup-port of WSP, UNICEF and Global Sanitation Fund, has em-barked on the development of such system, through carrying out a situation analysis, followed by the development of the M&E framework, and currently the system design is being implemented. The roll-out will initially take place in a limited number of provinces; however, as part of the development of a future national program, it is planned that other sector stakeholders will support country-wide roll-out. Stakehold-ers also recommended that a joint annual review mechanism need to be established, using management information from the future sector monitoring, systems, as well as inputs from a wide variety of sector stakeholders, including the NGOs active in the subsectors.
Urban Water Supply and Sanitation
Phnom Penh Water Supply Authority monitors and evaluates some 200 water supply parameters, publishes the data on its website, and is an example of best practice. However, for the urban water supply subsector as a whole, utility performance data is not comprehensively and systematically gathered by the Department of Potable Water Supply of MIH. The focus of the monitoring effort is mostly on the public utilities. Lim-ited data are being collected from the almost 150 licensed private operators (without verification) and are stored in a rudimentary excel spreadsheet. Accessibility of basic sector data is also an issue, as data-sharing platforms (e.g. through
websites) are not yet operational to publish information to the wider public. Development partners carry out regular as-sessments such as the JICA supported Urban Water Supply overview58, and the Cambodia Water and Sanitation Sector review, supported by the World Bank.
Realizing the importance of better monitoring, some im-provements in the urban subsector are now being made. With JICA support, public utilities are starting to improve their internal management information systems (billing, ac-counting, etc.), for both better utility performance as well as improved reporting to MIH against a range of performance indicators covering not only technical parameters but also fi-nancial performance. With support of WSP and CWA, private water operators are encouraged to use computerized man-agement systems that support improved recording practices. The Department of Potable Water Supply has recently, with support of WSP, embarked upon the establishment of an M&E system for both public and private operators. However, continued human and financial resources will be required to support its roll-out, sustain its application, and especially en-sure a minimum level of data verification, as well as water quality monitoring by Department of Industry and Handicraft at provincial level. As part of the new licensing regime, it is expected that a monitoring guideline will be issued, stipulat-ing reporting requirements. The establishment of the system is expected to facilitate the future review process of private operator water tariffs.
The urban sanitation sector mostly carries out monitoring tied in with project implementation of drainage and sewer systems. Consolidated reporting on the effectiveness of fecal waste treatment is limited, however some utility level moni-toring takes place.
In terms of a joint annual sector review process by gov-ernment and key development partners, SDA participants agreed that this process has not yet been put in place for both urban water supply and sanitation.
58 RGC 2012. Royal Government of Cambodia, Infrastructure and Regional Integration Technical Working Group. (IRITWG) Sub-Technical Working Group for Water Supply. Overview on Urban Water Supply Sector in the Kingdom of Cambodia. Phnom Penh.

Service Delivery Assessment 23
source (unless stored in a tank of over 3000 m3).59 The clas-sification of improved versus unimproved source needs to be seen in the light of the proposed future post 2015 Sustainable Development Goals for rural water supply, which will include actual water quality, and levels of service (reliability, quantity).
7. Subsector: Rural Water Supply
59According to CSES (2010) data, in the dry season, in terms of “improved water source”, it is estimated that 4% of rural households had access to piped water supply connection, 32% used a tube well or borehole, 9% used a protected dug well, and 2% used pumped water from pond or streams; unimproved sources included unprotected wells (21%), fetching water directly from pond or streams (18%), and unimproved rainwater (2%) and water vendors (13%).
Implementation horizon: short-term 2015-2016; medium-term 2016-2018; long-term 2018 and beyond.
JMP data indicate that in 2012, 66% of the rural population had access to an improved water supply (year round), of which 5% was estimated to have a piped water connection at the premises. Government estimates show a lower level of access, as they do not consider the use of rainwater as an improved
Priority actions for rural water supply
short term medium term long term
Clarify the roles of government agencies and sub-national administra-tions at provincial, district and commune level under the decentralization reform and test this through a pilot
√ √
Develop a National Action Plan for rural water supply with focus on sus-tainability and cost-effectiveness of different technology options (based on a review of technologies)
√
Establish district rural water supply functionality plans linked to local and national investment planning process
√
Develop professional post-construction technical and managerial sup-port systems to ensure sustainability of community-managed schemes, possibly involving the private sector
√ √
Promote expanded role of private sector in piped water service delivery in rural growth centers, through facilitating access to finance and lever-aging private sector investment grants
√ √
Safeguard water quality through treatment, water quality management and risk assessment at source, as well as household water treatment and storage programs
√ √ √
Increase enforcement for water quality regulations and carry out point-of-consumption water quality surveys
√ √
Develop national management information system for rural water supply and sanitation
√ √
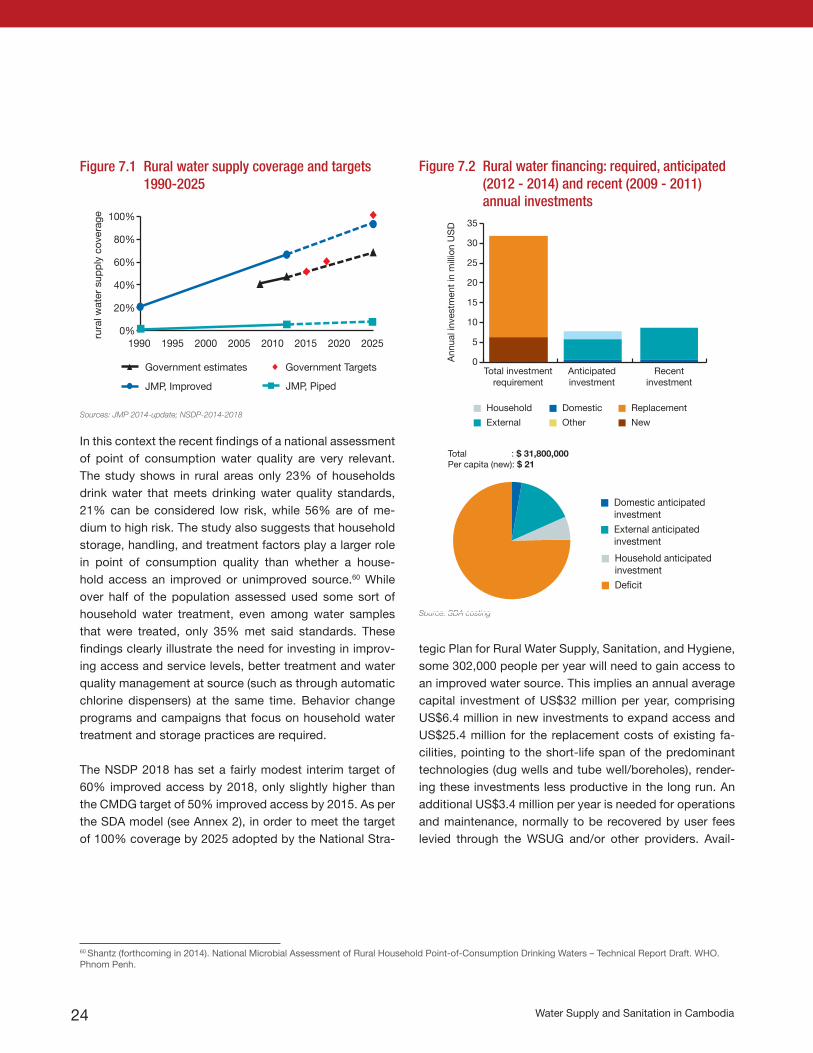
Water Supply and Sanitation in Cambodia24
In this context the recent findings of a national assessment of point of consumption water quality are very relevant. The study shows in rural areas only 23% of households drink water that meets drinking water quality standards, 21% can be considered low risk, while 56% are of me-dium to high risk. The study also suggests that household storage, handling, and treatment factors play a larger role in point of consumption quality than whether a house-hold access an improved or unimproved source.60 While over half of the population assessed used some sort of household water treatment, even among water samples that were treated, only 35% met said standards. These findings clearly illustrate the need for investing in improv-ing access and service levels, better treatment and water quality management at source (such as through automatic chlorine dispensers) at the same time. Behavior change programs and campaigns that focus on household water treatment and storage practices are required.
The NSDP 2018 has set a fairly modest interim target of 60% improved access by 2018, only slightly higher than the CMDG target of 50% improved access by 2015. As per the SDA model (see Annex 2), in order to meet the target of 100% coverage by 2025 adopted by the National Stra-
Figure 7.2 Rural water financing: required, anticipated (2012 - 2014) and recent (2009 - 2011) annual investments
Source: SDA costing
Household anticipated investmentDeficit
Domestic anticipated investmentExternal anticipated investment
Rural water supplyTotal : $ 31,800,000Per capita (new): $ 21
Total investmentrequirement
Anticipatedinvestment
Recentinvestment
Ann
ual i
nves
tmen
t in
mill
ion
US
D
0
5
10
15
25
30
35
20
Other
Replacement
New
Household
External
Domestic
Rural water supply
60 Shantz (forthcoming in 2014). National Microbial Assessment of Rural Household Point-of-Consumption Drinking Waters – Technical Report Draft. WHO. Phnom Penh.
tegic Plan for Rural Water Supply, Sanitation, and Hygiene, some 302,000 people per year will need to gain access to an improved water source. This implies an annual average capital investment of US$32 million per year, comprising US$6.4 million in new investments to expand access and US$25.4 million for the replacement costs of existing fa-cilities, pointing to the short-life span of the predominant technologies (dug wells and tube well/boreholes), render-ing these investments less productive in the long run. An additional US$3.4 million per year is needed for operations and maintenance, normally to be recovered by user fees levied through the WSUG and/or other providers. Avail-
0%
20%
40%
60%
80%
100%
1990 1995 2000 2005 2010 2015 2020 2025
Government estimates Government Targets
JMP, Improved JMP, Piped
rura
l wat
er s
upp
ly c
over
age
Sources: JMP 2014-update; NSDP-2014-2018
Figure 7.1 Rural water supply coverage and targets 1990-2025
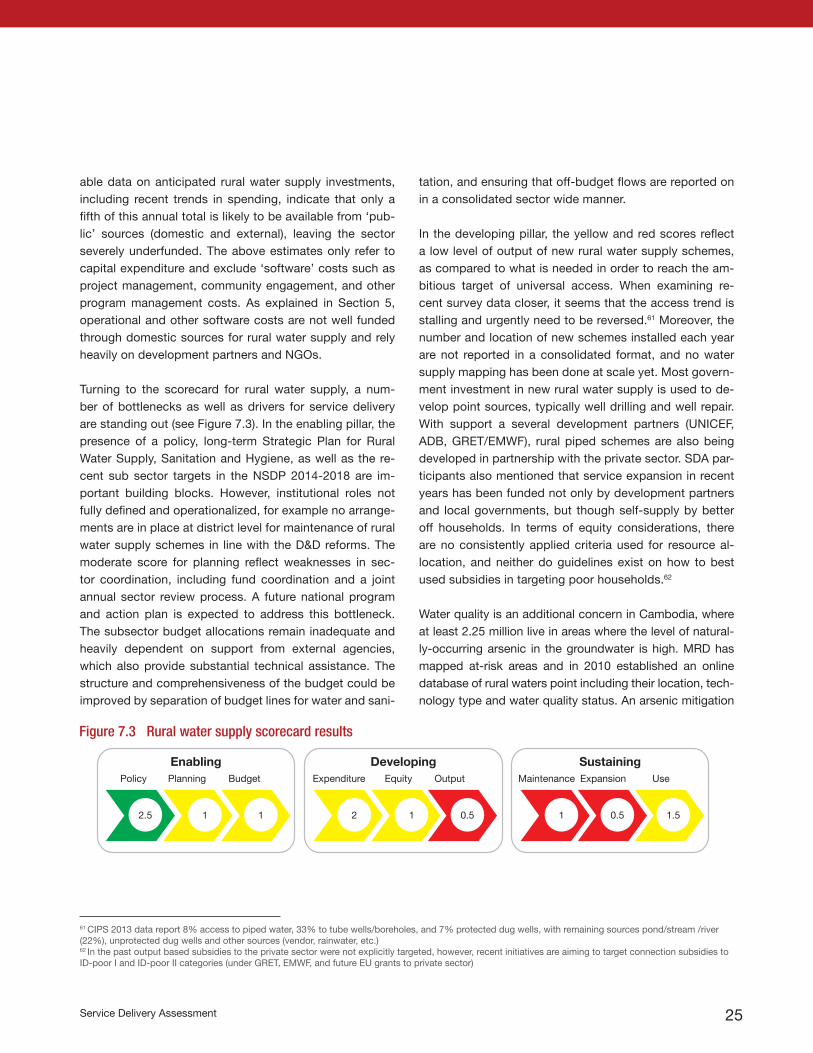
Service Delivery Assessment 25
able data on anticipated rural water supply investments, including recent trends in spending, indicate that only a fifth of this annual total is likely to be available from ‘pub-lic’ sources (domestic and external), leaving the sector severely underfunded. The above estimates only refer to capital expenditure and exclude ‘software’ costs such as project management, community engagement, and other program management costs. As explained in Section 5, operational and other software costs are not well funded through domestic sources for rural water supply and rely heavily on development partners and NGOs.
Turning to the scorecard for rural water supply, a num-ber of bottlenecks as well as drivers for service delivery are standing out (see Figure 7.3). In the enabling pillar, the presence of a policy, long-term Strategic Plan for Rural Water Supply, Sanitation and Hygiene, as well as the re-cent sub sector targets in the NSDP 2014-2018 are im-portant building blocks. However, institutional roles not fully defined and operationalized, for example no arrange-ments are in place at district level for maintenance of rural water supply schemes in line with the D&D reforms. The moderate score for planning reflect weaknesses in sec-tor coordination, including fund coordination and a joint annual sector review process. A future national program and action plan is expected to address this bottleneck. The subsector budget allocations remain inadequate and heavily dependent on support from external agencies, which also provide substantial technical assistance. The structure and comprehensiveness of the budget could be improved by separation of budget lines for water and sani-
Figure 7.3 Rural water supply scorecard results
tation, and ensuring that off-budget flows are reported on in a consolidated sector wide manner.
In the developing pillar, the yellow and red scores reflect a low level of output of new rural water supply schemes, as compared to what is needed in order to reach the am-bitious target of universal access. When examining re-cent survey data closer, it seems that the access trend is stalling and urgently need to be reversed.61 Moreover, the number and location of new schemes installed each year are not reported in a consolidated format, and no water supply mapping has been done at scale yet. Most govern-ment investment in new rural water supply is used to de-velop point sources, typically well drilling and well repair. With support a several development partners (UNICEF, ADB, GRET/EMWF), rural piped schemes are also being developed in partnership with the private sector. SDA par-ticipants also mentioned that service expansion in recent years has been funded not only by development partners and local governments, but though self-supply by better off households. In terms of equity considerations, there are no consistently applied criteria used for resource al-location, and neither do guidelines exist on how to best used subsidies in targeting poor households.62
Water quality is an additional concern in Cambodia, where at least 2.25 million live in areas where the level of natural-ly-occurring arsenic in the groundwater is high. MRD has mapped at-risk areas and in 2010 established an online database of rural waters point including their location, tech-nology type and water quality status. An arsenic mitigation
Enabling Developing SustainingPlanning
1
Policy
2.5
Budget
1
Output
0.5
Expenditure
2
Maintenance
1
Equity
1
Expansion
0.5 1.5
Use
61 CIPS 2013 data report 8% access to piped water, 33% to tube wells/boreholes, and 7% protected dug wells, with remaining sources pond/stream /river (22%), unprotected dug wells and other sources (vendor, rainwater, etc.)62 In the past output based subsidies to the private sector were not explicitly targeted, however, recent initiatives are aiming to target connection subsidies to ID-poor I and ID-poor II categories (under GRET, EMWF, and future EU grants to private sector)

Water Supply and Sanitation in Cambodia26
strategy has been developed with UNICEF/WHO support, including (amongst other things) revising the national drink-ing water standards (rural guideline now in draft), expand-ing water quality testing and promoting alternative sources where appropriate. Despite these efforts, these platforms are not yet fully institutionalized. MRD is currently work-ing with development partners to integrate water quality aspects as part of the overall rural water supply monitor-ing system. In respect of water quality monitoring, it will be critical to step up efforts on enforcement of water quality standards of piped water services, as well as regular spot checks on point-source scheme by the mandated agencies (MIH, respectively MRD). In line with the emphasis on the future post 2015 Sustainable Development Goals, inclusion of water quality testing at point-of-use in national surveys is also recommended.
Another bottleneck in the sustaining pillar reflects the lack of post-construction support services for rural communities to manage their supplies sustainable. Poor maintenance of existing schemes is a serious threat to sustainability and backup support to communities is inadequately defined and underfunded, with typical annual budget allocations of just U$500,000 per year to support maintenance of all rural water supply schemes in the country.63 A reconsideration of the role of WSUG is needed, as these groups tend to be active only when empowered through ongoing external support via INGOs or other development agencies. Differ-ent management models for community-based schemes need to be tested, and legal and institutional framework and accountabilities to be redefined, including global lessons. In this context recent experiences in for example Benin are promising where public-private partnership arrangements are used to expand services of clustered community-level
schemes.64 Moreover, a broader concept than access needs to be integrated as part of the future monitoring system of MRD. As pioneered with SNV support in Kampot province, functionality needs to be looked at from a gradual scale of level of service, and include water quality, accessibility, and quantity and reliability aspects.65 Strengthening account-ability for water supply services can further be enhanced through the community-scorecards assessing functionality of water supply, in line with the social accountability frame-work. Access to clean water supply in schools has been on the decline from 66% in 2009 to 58% in 2013, indicat-ing that schools settings need to be addressed as part of functionality plans.
Private sector investments in rural growth centers have increased over recent years and this trend is expected to continue. Over 90% of private water operators are estimat-ed to be covering their operating costs and around 80% their full costs including depreciation and debt service.66 However expansion or investments in new sites remains difficult to fund through revenues only and will requires ac-cess to commercial finance and/or investment grants to close the viability gap. The red score in the expansion block illustrates these difficulties, although several initiatives are ongoing and pipelined to enable such expansion through better access to credit, business planning support and in-vestment grants.
Equity aspects of outcomes could also be improved, al-though access to an improved water source between the lowest and highest quintile in rural areas is more or less similar, access to higher levels of services such as piped water supply, was four times higher for the richest income quintile, as compared to the poorest.67
63 SNV, 2014a. Learning Brief: Functionality of Rural Water Supply Services Programme. This brief states that district-wide water supply mapping in one of Kampot’s district revealed that out of 1,055 water supplies only 80% are fully functional.64 For more information please refer to https://beninwaterdpsp.wordpress.com65 SNV, 2014b Progress Brief: Progress Brief: Functionality of Rural Water Supply Services Programme: Assessing Rural Water Supply Levels of Service in Cambodia: Findings and Lessons Learned From a Baseline Assessment. The baseline conducted in 2013 in one district in Kampot showed that water quality and reliability were key factors contributing to only 24% of households achieving basic service levels.66 Sy, Jemima; Warner, Robert; Jamieson, Jane. 2014. Tapping the Markets: Opportunities for Domestic Investments in Water and Sanitation for the Poor. Washington, DC: World Bank.67 CSES (2011) Cambodia Socio Economic Survey

Service Delivery Assessment 27
8. Subsector: Urban Water Supply
According to the JMP update 2014, 94% of the urban pop-ulation has access to an improved water supply in 2012, of which 67% have a piped house connection. Other house-holds with access to an improved source mainly use tube well or protected dug wells, and only a fraction relies on
improved rainwater as their main water source.68 However, there is a large disparity between Phnom Penh and other cities, especially in terms of service levels. For example, the CSES 2011, which disaggregates Phnom Penh and other urban areas, reports that 90% of all residents of the capital
68As per the government definition rainwater is only considered improved if stored in a tank of more than 3000 liters. Due to the preference of rainwater taste, most urban and rural households store and use rainwater at least as a complementary source for consumption, while relying on other sources for hygienic uses.69The difference between CSES 2011, and NSDP 2012 estimates piped access outside of Phnom Penh is most likely due to other definitions of urban areas. The most recent CIPS (2013) estimates piped water supply access in urban areas slightly lower at 64%.70The NSDP 2018 target does not clearly specify whether this target refers to piped household connections only.
Implementation horizon: short-term 2015-2016; medium-term 2016-2018; long-term 2018 and beyond.
Priority actions for urban water supply
short term medium term long term
Develop full legal framework (water law) that clarifies and redefines insti-tutional roles, including that of regulator
√ √ √
Develop policy, guidelines and instruments for economic regulation, including pro-poor tariff setting and connection policies (beyond those existing at project level)
√
Following the model of Phnom Penh Water Supply Authority, transform public water works into autonomous utilities and transition all investment and service provision responsibilities
√
Develop a long-term sector development and investment plan, with em-phasis on equity considerations (e.g. social connection fund)
√
Improve service performance and efficiencies of public and private op-erators through at-scale training programs by - to-be-established - utility training center and Cambodia Water Association’s training services
√ √
Introduce competitive granting of licenses for private operators to in-crease transparency, leverage commercial finance, and ensure value for money
√
Develop capacities of Department of Potable Water Supply for expedit-ing licensing and economic regulation regime, bringing all unlicensed operators under its supervision
√ √
Develop an umbrella association for all public and private operators to promote best practices and continued support to professionalizing of the sector
√ √

Water Supply and Sanitation in Cambodia28
Figure 8.1 Urban water supply coverage and targets 1990-2025
having water piped to their dwellings, while in other urban areas a third of the population accesses piped water supply services in the dry season. Government estimates as per the NSDP 2014-2018 are expressed in piped water supply access only and are fairly consistent with JMP estimates of 2012: urban piped water supply access is estimated at 68.5% in 2012, of which access in Phnom Penh is estimat-ed to be 85% and other urban areas having around half of the population connected.69 Although not formalized in an official document, the target for urban water supply by SDA participants has been set at 100% improved access by 2025, of which it is expected that 90% will be supplied through piped household connections. The NSDP 2018 tar-get is set at 85% access to improved water supply,70 as compared to the 2015 CMDG target of 80% improved ac-cess.
In order to meet the 2025 target of 100% access to im-proved water supply in urban areas - of which 90% through piped services - around 260,000 people per year will need to gain access. This implies an annual average capital in-vestment of US$60 million per year, comprising US$30 mil-lion in new investments to expand access and US$30 mil-
0%
20%
40%
60%
80%
100%
1990 1995 2000 2005 2010 2015 2020 2025
Government estimates Government Targets
JMP, Improved JMP, Piped
Urb
an w
ater
sup
ply
cove
rage
Sources: JMP 2014-update; NSDP-2014-2018
71 World Bank (2013) Cambodia Water and Sanitation Sector Review, and Sy. et al (2013).72 WSP (forthcoming in 2014). National representative survey to determine the poor inclusiveness of licensed private water operators. Available upon request at World Bank Phnom Penh.73 Non-confirmed pipelined projects for 2015 have not yet been included in this estimate, so the actual average annual deficit could be slightly lower (e.g. ADB urban water supply loan which is under preparation, AFD credit line of US$5 million for private water operators over 2015-17, channeled through a local bank to private operators).
lion for the replacement costs of existing facilities, reflecting the already high levels of services in urban areas that need to be maintained through replacing assets. In an ideal situ-ation, replacement costs are fully accounted for through full cost recovery tariffs and would not rely as much on national transfers and investment budgets. However, except for PPWSA, most public utilities do not yet charge full cost re-covery tariffs. The level of full cost recovery by private water operators is assessed to be adequate, with an around 90% of private operators recovering operational costs and 80% full cost recovery including depreciation and debt service.71
Tariff levels in the public sector (from around US$ 0.25-0.40/m3) are considerably lower as compared to private opera-tors, who do not benefit from public investment transfers (average US$0.53-0.60/m3,72 with some operators charging as much as US$0.80). Increasing tariff levels in the public sector to full cost recovery would help to close the existing financing gap in urban water supply, as illustrated in Figure 8.2. However, of equal importance to close the investment financing gap will be to improve operational efficiencies of water utilities, such as through non-revenue water pro-grams, so that pressure on transfers for rehabilitation and replacement are diminished. An additional US$7 million per year is needed for operations and maintenance, to be re-covered through tariffs (or other user fees). In addition to capital and O&M expenditure, financing needs include sub-stantial funding for ‘software’ and programmatic costs such as project management, licensing and awareness cam-paigns, capacity building programs, and critically adequate recurrent funds to execute policy, monitoring and regulatory functions at central and provincial level.
Figure 8.2 illustrates that recent (US$26 million) and antici-pated annual public spending (US$24 million) covers around 40% of the total annual investment requirements, and after including the relatively low expected household contribu-tion, this leaves the sector with a substantial financing gap of around US$33 million annually.73 However, it should also

Service Delivery Assessment 29
Figure 8.2 Urban water supply financing: required, anticipated (2012 - 2014) and recent annual invesments (2009 - 2011)
Source: SDA Costing Model
Total investmentrequirement
Anticipatedinvestment
Recentinvestment
Ann
ual i
nves
tmen
t in
mill
ion
US
D
0
10
20
30
50
60
70
40
Other
Replacement
New
Household
External
Domestic
Urban water supply
Household anticipated investmentDeficit
Domestic anticipated investmentExternal anticipated investment
Urban water supplyTotal : $ 60,100,000Per capita (new): $ 116
be noted that new investments in piped schemes by the private sector, which could be in the order of several US$ millions annually, have not been included in the estimate, since no reliable data is yet available at the industry level. In addition to the financing gap for the sector, the reliance on development partner investments illustrates that domestic budget allocation remains inadequate.
JICA has for some years been a key donor in the subsector, its major lending projects being the Niroth Water Treatment Facility near Phnom Penh, and the expansion of the Siem Riep water supply system. A third grant project involves the rehabilitation and expansion of water distribution systems in the provincial capitals of Pursat, Battambang, and Siha-noukville. JICA is also providing capacity building support to a number of urban utilities. AFD has also supported the Niroth water treatment facility and provided a loan of just under Euro 30 million to PPWSA, in part to extend the dis-tribution network to low-income communities. UN-Habitat has also provided financial and technical assistance to the sector. ADB is currently preparing a new loan to support ur-ban utilities with service expansion outside of Phnom Penh. When turning to the scorecard, it should be noted that participants intended to emphasize the situation outside of Phnom Penh, so as to clearly identify priorities for ad-dressing bottlenecks. The NSDP 2014-2018 to a large ex-tent reflects the identified bottlenecks and lays out a clear reform agenda for the urban water supply sector over the next planning period. Key elements of this reform agenda are reflected in the agreed priority actions listed at the be-ginning of the chapter.
Within the enabling pillar, the low score for planning reflects the fact that there is currently not yet a long term strategic sector investment plan, covering all urban areas beyond Phnom Penh, with prioritization and costing and a map-ping of potential investment sites for the private sector. The three-year rolling Project Investment Plan format of MIH is now used to identify projects and source funds. The coordi-nation of fund flow (domestic and external) as well as a joint annual review mechanism of government and key develop-ment partners has not yet been fully institutionalized trans-lating in a sector wide approach of government and devel-opment partners to improve urban service delivery. PPWSA has taken on an important role in utility-to-utility peer learn-ing. Human resource capacity assessment and HR devel-opment programs have taken place for a number of utili-
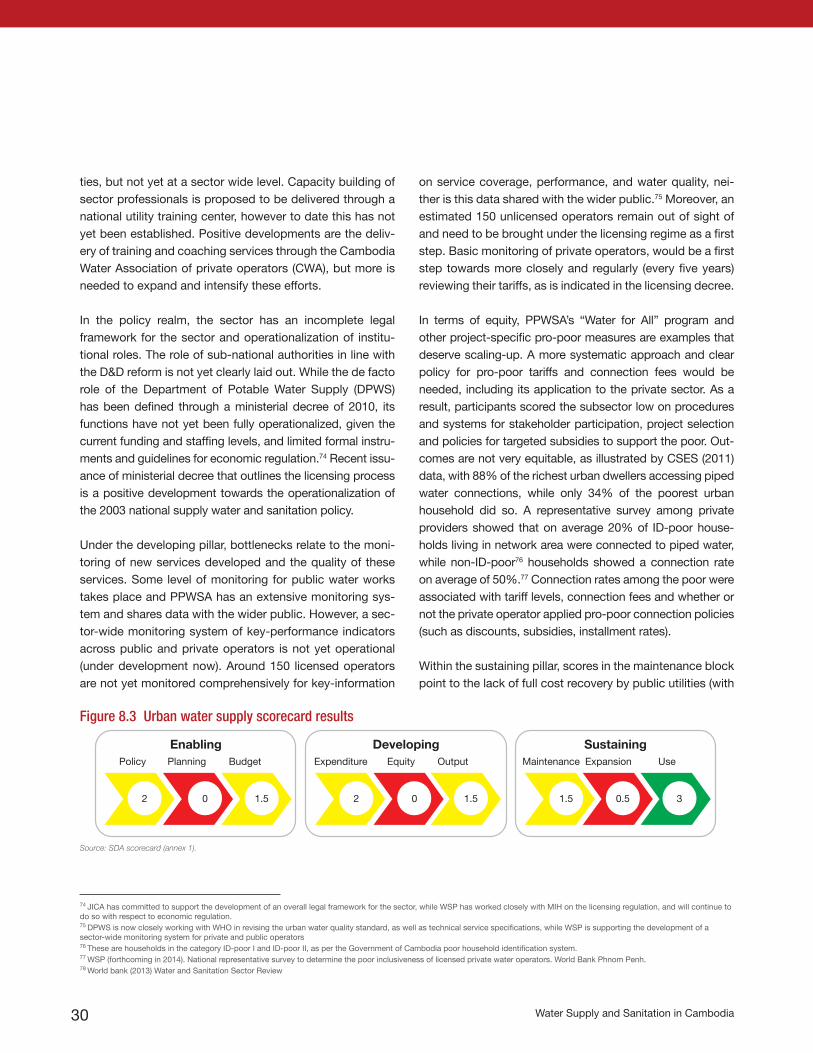
Water Supply and Sanitation in Cambodia30
ties, but not yet at a sector wide level. Capacity building of sector professionals is proposed to be delivered through a national utility training center, however to date this has not yet been established. Positive developments are the deliv-ery of training and coaching services through the Cambodia Water Association of private operators (CWA), but more is needed to expand and intensify these efforts.
In the policy realm, the sector has an incomplete legal framework for the sector and operationalization of institu-tional roles. The role of sub-national authorities in line with the D&D reform is not yet clearly laid out. While the de facto role of the Department of Potable Water Supply (DPWS) has been defined through a ministerial decree of 2010, its functions have not yet been fully operationalized, given the current funding and staffing levels, and limited formal instru-ments and guidelines for economic regulation.74 Recent issu-ance of ministerial decree that outlines the licensing process is a positive development towards the operationalization of the 2003 national supply water and sanitation policy.
Under the developing pillar, bottlenecks relate to the moni-toring of new services developed and the quality of these services. Some level of monitoring for public water works takes place and PPWSA has an extensive monitoring sys-tem and shares data with the wider public. However, a sec-tor-wide monitoring system of key-performance indicators across public and private operators is not yet operational (under development now). Around 150 licensed operators are not yet monitored comprehensively for key-information
on service coverage, performance, and water quality, nei-ther is this data shared with the wider public.75 Moreover, an estimated 150 unlicensed operators remain out of sight of and need to be brought under the licensing regime as a first step. Basic monitoring of private operators, would be a first step towards more closely and regularly (every five years) reviewing their tariffs, as is indicated in the licensing decree.
In terms of equity, PPWSA’s “Water for All” program and other project-specific pro-poor measures are examples that deserve scaling-up. A more systematic approach and clear policy for pro-poor tariffs and connection fees would be needed, including its application to the private sector. As a result, participants scored the subsector low on procedures and systems for stakeholder participation, project selection and policies for targeted subsidies to support the poor. Out-comes are not very equitable, as illustrated by CSES (2011) data, with 88% of the richest urban dwellers accessing piped water connections, while only 34% of the poorest urban household did so. A representative survey among private providers showed that on average 20% of ID-poor house-holds living in network area were connected to piped water, while non-ID-poor76 households showed a connection rate on average of 50%.77 Connection rates among the poor were associated with tariff levels, connection fees and whether or not the private operator applied pro-poor connection policies (such as discounts, subsidies, installment rates).
Within the sustaining pillar, scores in the maintenance block point to the lack of full cost recovery by public utilities (with
74 JICA has committed to support the development of an overall legal framework for the sector, while WSP has worked closely with MIH on the licensing regulation, and will continue to do so with respect to economic regulation.75 DPWS is now closely working with WHO in revising the urban water quality standard, as well as technical service specifications, while WSP is supporting the development of a sector-wide monitoring system for private and public operators76 These are households in the category ID-poor I and ID-poor II, as per the Government of Cambodia poor household identification system.77 WSP (forthcoming in 2014). National representative survey to determine the poor inclusiveness of licensed private water operators. World Bank Phnom Penh. 78 World bank (2013) Water and Sanitation Sector Review
Figure 8.3 Urban water supply scorecard results
Enabling Developing SustainingPlanning
0
Policy
2
Budget
1.5
Output
1.5
Expenditure
2
Maintenance
1.5
Equity
0
Expansion
0.5 3
Use
Source: SDA scorecard (annex 1).

Service Delivery Assessment 31
the exception of PPWSA, SRWSA and Sihanoukville which has a large industrial customer base78). Especially among the non-autonomous public water utilities, results of fi-nancial performance are mixed. Performance of the larger utilities of Siem Reap, Sihanoukville, and Kampong Thom, shows that non-revenue water is estimated at an average of 16% and the operating ratio (revenues over expenses) on average to be 1.3. Especially for the less well performing utilities, operational efficiencies, such as non-revenue wa-ter, optimizing pumping regimes (reducing electricity costs which is a key cost driver), and streamlining other business processes will be critical to achieve better financial perfor-mance.
Private operators are doing better in terms of financial per-formance with 80% covering full cost. CWA is currently de-veloping benchmarking other Key Performance Indicators (KPIs), however, this information is not yet available.
A major weakness for sustaining water supply services is that tariff reviews are not regularly conducted and an eco-nomic regulation framework and tariff methodology has not been formally adopted. Other than PPWSA who has been able to attract concessional loans from AFD, the red score under expansion points at difficulties for public and private utilities to finance expansion schemes. Public and private utilities that have access to external support services are al-ready developing business and investment plans, however for many utilities the preparation of such plans and feasibil-ity study is a bottleneck, compounded by their overall weak
financial position and technical performance. JICA (and ADB in the future) are providing assistance to strengthen the capacity of public utilities along their pathway to be-coming autonomous entities.
Once utilities are autonomous and in a better financial po-sition, they would be able to access both sub-sovereign concessional as well as commercial finance, with the ap-proval of the Board of Directors. For private operators, the recent change of license duration to 20 years is facilitating access to finance, especially now that the Cambodia Wa-ter Association, with the help of development partners, is able to offer business development services and feasibility studies to their members, as well as concessional finance through one of the local banks, lowering the collateral re-quirements.
The establishment of an umbrella association, where both public and private operators could become members, is expected to support the professionalization and capacity development of the sector.
Despite uncertainty in terms of sector financing, the sub-sector is on track to meet its 2025 target of universal ac-cess to an improved water source (see Figure 8.1). Overall levels of access to an improved source are already quite high, even among the poorest quintile (68%), although not for piped water services (34%), and public and private op-erators generally provide a high level of service hours per day with most public utilities providing 24 hours/day.79
79 RGC 2012. Royal Government of Cambodia, Infrastructure and Regional Integration Technical Working Group. (IRITWG) Sub-Technical Working Group for Water Supply. Overview on Urban Water Supply Sector in the Kingdom of Cambodia. Phnom Penh.

Water Supply and Sanitation in Cambodia32
According to the JMP update 2014, 25% of the rural popula-tion has access to improved sanitation in 2012 and 6% has access to shared improved sanitation. Almost all rural house-holds with improved access have a pour-flush toilet to either a soak-pit or a septic tank. However, there is a large disparity between income groups: among the poorest income quin-
9. Subsector: Rural Sanitation and Hygiene
80 CSES (2011) states 33% of households having a pour-flush to sewer (0.6%), pour-flush to tank/pit (30.6%) and improved pit with slab (1.3%), adding up to 33% improved access. The recent CIPS (2013) reports quite different figures for rural sanitation access with unclear category definition (38.5% having access to a toilet, of which 13% to a sewer, 22% to a septic tank and 3% to a pit latrine, and less than 1% to other facility).
Implementation horizon: short-term 2015-2016; medium-term 2016-2018; long-term 2018 and beyond.
tile of the rural population only 12% has access to improved sanitation, while in the richest rural quintile this is five times as much at 59%. Government estimates as per the NSDP 2014-2018 are above JMP estimates of 2012, using figures with 33% having access to improved sanitation.80 The Rural Water Supply, Sanitation and Hygiene Strategy 2011-2025
Priority actions for rural sanitation and hygiene
short term medium term long term
Establish National Action Plan for rural sanitation and hygiene, that in-cludes community-wide targets, and pro-poor implementation guidelines (e.g. on use of smart subsidies/incentives)
√
Based on pilot, develop necessary legal framework, implementation guidance, and financial management mechanisms and sources for func-tional assignment of sanitation to subnational level
√ √
Carry out high-level advocacy to increase funding allocations, especially for program and operational costs (software) such as for community-led total sanitation, behavior change, and monitoring
√ √
Develop and implement a roadmap for government to facilitate and strengthen the private sector role in sanitation service delivery
√
Test and scale-up approaches for integration of sanitation and hygiene in nutrition and social protection programs
√ √
Carry out evaluations and facilitate sector learning on poor-inclusive sanitation service delivery and develop harmonized financing guideline
√
Continue innovation and R&D for low-cost product and services espe-cially for challenging environments, waste collection and emptying and other WASH products
√ √
Develop a national management information system for rural sanitation and water supply
√ √

Service Delivery Assessment 33
sets an ambitious universal access target of 100% improved access, and interim NSDP 2018 target reflects the accel-eration needed at 60%, as compared to the modest 2015 CMDG target of only 30% improved access. The access to sanitation facilities is reported to have increased from 79% in 2009 to 88% in 2013 as per the government’s Education management Information System. However, observations reveals that many facilities are either locked, dirty and/or in-operable. Only 50% of schools is estimated to have hand washing facilities.
In order to meet the 2025 target, approximately 658,000 persons will need to gain access to improved sanitation each year (using JMP 2012 data). This will require US$32.5 million per year in capital expenditure, of which US$3.5 mil-lion is expected to come from public sources to support hardware subsidies/incentives for the poor, as most facili-ties are expected to be built with household own funds, as clearly stipulated in the strategy.
Recent and anticipated investments, although showing a positive trend, fall short of the amount needed. In line with the policy, the US$3.5 million annual anticipated hard-
ware investments are expected to leverage eight times the amount of household investments, as subsidies should be directed to the poor and used with caution as per the guid-ance of the strategy. However, whether this leveraging will actually materialize will depend strongly on the ability of government, development partners and other institutions to elicit household investments in improved facilities, as well as on the mechanisms through which such subsidies are delivered.
Figure 9.2 Rural sanitation financing: required, anticipated (2012 - 2014) and recent annual investment (2009 - 2011)
Source: SDA costing
Figure 9.1 Rural sanitation coverage
Source: JMP 2013; MARD (2012a); MARD (2012b); SDA costing
0%
20%
40%
60%
80%
100%
1990 1995 2000 2005 2010 2015 2020 2025
Government estimates Government targetJMP, Improved JMP, improved+shared
rura
l im
prov
ed s
anita
tion
cove
rage
Household anticipated investmentDeficit
Domestic anticipated investmentExternal anticipated investment
Rural sanitationTotal : $ 32,500,000Per capita (new): $ 20
Total investmentrequirement
Anticipatedinvestment
Recentinvestment
Ann
ual i
nves
tmen
t in
mill
ion
US
D
0
5
10
15
25
30
35
20
Other
Replacement
New
Household
External
Domestic
Rural sanitation
81 In 2011, the wages for MRD, PRDR and DoRD staff involved in rural health care and sanitation were estimated to be US$365,000 in 2011, as per MRD (2013). However, development partners and INGOs are delivering software support—estimated to be over US$8 million annually—although only some are directly supporting government-led implementation
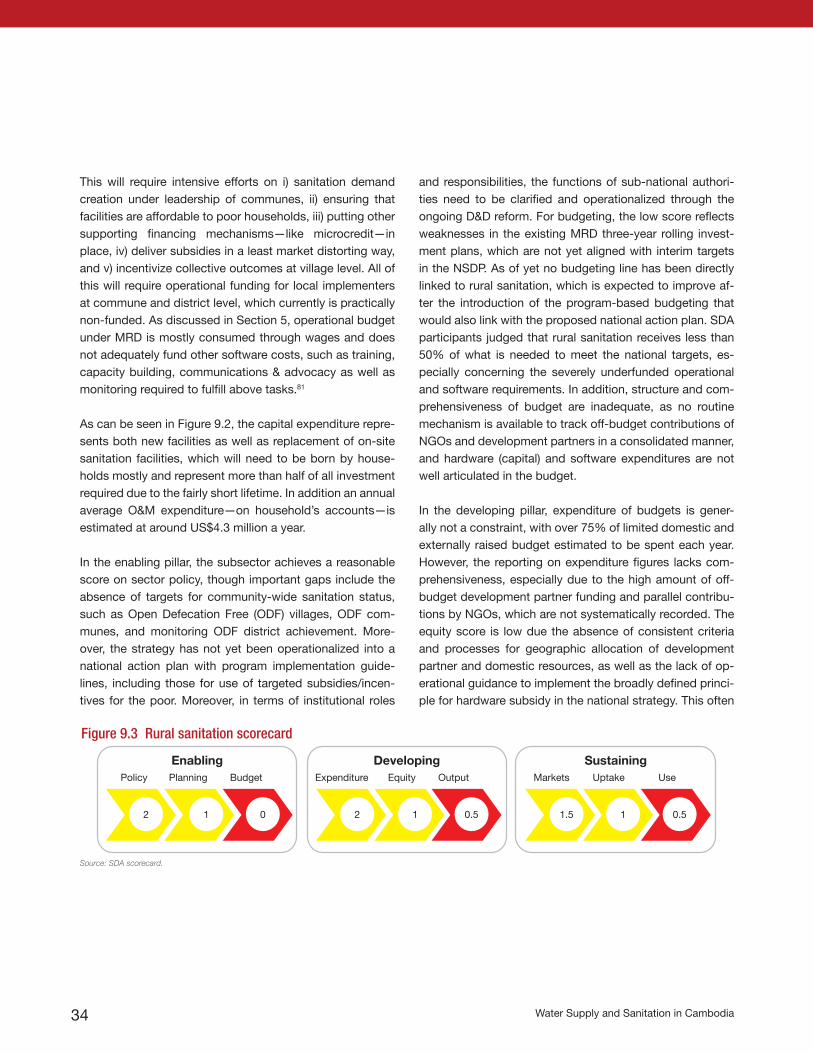
Water Supply and Sanitation in Cambodia34
This will require intensive efforts on i) sanitation demand creation under leadership of communes, ii) ensuring that facilities are affordable to poor households, iii) putting other supporting financing mechanisms—like microcredit—in place, iv) deliver subsidies in a least market distorting way, and v) incentivize collective outcomes at village level. All of this will require operational funding for local implementers at commune and district level, which currently is practically non-funded. As discussed in Section 5, operational budget under MRD is mostly consumed through wages and does not adequately fund other software costs, such as training, capacity building, communications & advocacy as well as monitoring required to fulfill above tasks.81 As can be seen in Figure 9.2, the capital expenditure repre-sents both new facilities as well as replacement of on-site sanitation facilities, which will need to be born by house-holds mostly and represent more than half of all investment required due to the fairly short lifetime. In addition an annual average O&M expenditure—on household’s accounts—is estimated at around US$4.3 million a year.
In the enabling pillar, the subsector achieves a reasonable score on sector policy, though important gaps include the absence of targets for community-wide sanitation status, such as Open Defecation Free (ODF) villages, ODF com-munes, and monitoring ODF district achievement. More-over, the strategy has not yet been operationalized into a national action plan with program implementation guide-lines, including those for use of targeted subsidies/incen-tives for the poor. Moreover, in terms of institutional roles
and responsibilities, the functions of sub-national authori-ties need to be clarified and operationalized through the ongoing D&D reform. For budgeting, the low score reflects weaknesses in the existing MRD three-year rolling invest-ment plans, which are not yet aligned with interim targets in the NSDP. As of yet no budgeting line has been directly linked to rural sanitation, which is expected to improve af-ter the introduction of the program-based budgeting that would also link with the proposed national action plan. SDA participants judged that rural sanitation receives less than 50% of what is needed to meet the national targets, es-pecially concerning the severely underfunded operational and software requirements. In addition, structure and com-prehensiveness of budget are inadequate, as no routine mechanism is available to track off-budget contributions of NGOs and development partners in a consolidated manner, and hardware (capital) and software expenditures are not well articulated in the budget.
In the developing pillar, expenditure of budgets is gener-ally not a constraint, with over 75% of limited domestic and externally raised budget estimated to be spent each year. However, the reporting on expenditure figures lacks com-prehensiveness, especially due to the high amount of off-budget development partner funding and parallel contribu-tions by NGOs, which are not systematically recorded. The equity score is low due the absence of consistent criteria and processes for geographic allocation of development partner and domestic resources, as well as the lack of op-erational guidance to implement the broadly defined princi-ple for hardware subsidy in the national strategy. This often
Figure 9.3 Rural sanitation scorecard
Enabling Developing SustainingPlanning
1
Policy
2
Budget
0
Output
0.5
Expenditure
2
Markets
1.5
Equity
1
Uptake
1 0.5
Use
Source: SDA scorecard.

Service Delivery Assessment 35
leads to fragmentation and inconsistencies in implemen-tation, undermining a coherent programmatic approach. Based on survey results since 2010, it seems that the rural sanitation access trend is accelerating. However, the num-ber of new toilet installation each year remains insufficient to reach the target. Capacity of government to stimulate demand and the absence of a real-time monitoring system with verification process contributes to a low score under the output building block.
In the sustaining pillar, the market building block shows good progress made in reducing costs of pour-flush la-trines, the rapid spread of sanitation marketing (in 150 out of 185 districts) through building private sector capacity, and the early engagement of microfinance institutions in the sector. However, a challenge is now to institutional-ize and further scale private sector involvement through appropriate platforms and a facilitating role of the public sector to sustain these developments. Another bottleneck
for uptake is the lack of a coordinated national behavior change campaign with associated tools and guidelines for effective and at-scale use by local government and NGO partners at different levels. Uptake of sanitation services is also limited in areas vulnerable to the impacts of climate change, especially areas with flooding or floating commu-nities. Although some initiatives are underway to test in-novative approaches, more is needed in terms of scaling these approaches and directing targeted subsidies to sup-port the viability of market-based delivery. Other than ODF celebrations, and output-based aid approaches in specific projects, a harmonized incentive program that stimulate uptake for poor households, encourages ODF achieve-ments for villages and communes, or benchmarks district performance is not yet developed. Finally, the red score on use clearly demonstrates the overall off-track status of the sector in terms of final outcomes, and in particular the extremely high inequalities.

Water Supply and Sanitation in Cambodia36
According to the JMP update 2014, 82% of the urban popu-lation has access to improved sanitation in 2012, and another 12% has access to shared improved sanitation in an urban context. Around half of households with improved access have a pour-flush toilet to either a soak-pit or to a lesser extent a septic tank. The other half are said to access a pour-flush la-
10. Subsector: Urban Sanitation and Hygiene
trine connected to a sewer system, mostly representing a com-bined drainage system.82 However, sector studies report much lower levels of septic tanks and direct disposal in waterways and open drains.83 There is a large disparity between income groups: open defecation among the poorest income quintile of the urban population is 36%, while in the richest urban quintile
82 In this context the master plan currently under development for Phnom Penh with support of JICA will investigate the option of having separate systems in four outer districts of Phnom Penh, while four inner districts have combined systems83 World Bank (2013); and ADB (2012) Asian Development Bank. Cambodia Water Supply and Sanitation Sector Assessment, Strategy, and Road Map. Manila.84 CSES (2011) states 43% of households having a pour-flush to sewer, 41% access pour-flush to tank/pit, and 1% uses an improved pit with slab, leaving 4% using a pour flush discharging elsewhere and 11% without sanitation. The recent CIPS (2013) reports somewhat different figures with 53% having access to a our flush connected to sewer, 32% pour flush to a septic tank, 1.2% to a pit latrine, and 12.5% without a toilet.
Implementation horizon: short-term 2015-2016; medium-term 2016-2018; long-term 2018 and beyond.
Priority actions for urban sanitation and hygiene
short term medium term long term
Carry out options study and high-level dialogue to build consensus on urban sanitation institutional framework (e.g. look at combined utility for urban water and wastewater)
√
Develop comprehensive urban sanitation strategy, focused on low-cost solutions for collection, management, treatment and disposal of fecal waste (wastewater treatment, as well as fecal sludge management)
√
Develop a long-term urban sanitation investment plan, identify funding sources, and support city-wide sanitation master planning (including drainage and flood protection)
√
Test and develop policy instruments for improved fecal sludge manage-ment, including promotion of private sector in septage collection, incen-tives and regulations for disposal
√ √
Build capacity of relevant actors in urban sanitation value chain, includ-ing for city-wide sanitation master planning, management of wastewater treatment plants and fecal sludge management
√ √
Tackle the elimination of open defecation among the poorest households in informal slum areas through targeted approaches
√
Improve sector coordination and programmatic support using a com-bined urban water supply and sanitation/wastewater sub-Technical Working Group as platform
√

Service Delivery Assessment 37
0%
20%
40%
60%
80%
100%
1990 1995 2000 2005 2010 2015 2020 2025
Government estimates Government targetJMP, Improved JMP, improved+shared
urba
n im
prov
ed s
anita
tion
cove
rage
Figure 10.1 Urban sanitation coverage and targets 1990-2025
Source: JMP 2014, and NSDP2014-2018
Figure 10.2 Urban sanitation financing: required, anticipated (2012 - 2014) and recent annual investment (2009 - 2011)
Household anticipated investmentDeficit
Domestic anticipated investmentExternal anticipated investment
Urban sanitationTotal : $ 86,300,000Per capita (new): $ 147
Total investmentrequirement
Anticipatedinvestment
Recentinvestment
Ann
ual i
nves
tmen
t in
mill
ion
US
D
010
3040
70
90100
60
Other
Replacement
New
Household
External
Domestic
Urban sanitation
20
50
80
nearly everyone has access to improved sanitation, of which almost three quarters connect to a drainage system through a pour-flush toilet. Similarly, bias to urban services is focused on the capital, with access to improved sanitation estimated to be near universal, but only three quarters in other urban centers84. Government estimates for urban sanitation for 2012 are report-ed in the NSDP 2014-2018 as more than 80% having access.
The SDA participants agreed to use 100% improved access as an on-site access target, while the NSDP 2014-2018 states that access should be at least 80% in 2018, which has already been achieved (likewise the CMDG target set at 74% improved access by 2015 has been achieved). In addition to adequately managing drainage and flood protection, the most pressing challenge, as in many East Asian cities, is to improve the level of sanitation services and ensure that fecal matter is safely col-lected, transported out of the residential environment, treated and safely disposed off. The proposed post-2015 Sustainable Development Goals are including the elimination of open def-ecation and universal basic access, as well as dimensions of safe collection, treatment and disposal.
It is estimated that less than 2% of the total urban popula-tion in Cambodia currently served by sewer systems that
Source: SDA Costing Model
are connected to a functioning wastewater treatment plant. This means that those with reported “access” to a sewer system, essentially constitute a huge lagging treatment ca-pacity that still has to be put in place, including likely im-provements to the collection system as well.
Phnom Penh uses natural lagoons as treatment facility before discharging in the river (no separate wastewater treatment plant), however, these have silted up as sludge removal has
85 World Bank (2013) reports that in the four major towns of Phnom Penh, Battambang, Siem Reap and Sihanoukville, less than 3% of the population living in these areas is served through a functioning wastewater treatment plan. Extrapolating these figures to the total urban population in Cambodia, less than 2% of all urban residents is connected to sewers with functioning treatment.86 ADB 2012 pp. 17-18.
Water Supply and Sanitation in Cambodia38
been inadequate. Less than 5% of the population of Siem Reap and Sihanoukville is served by a wastewater treatment plant, and households were not willing to connect due to low willingness-to-pay. In Battambang, the treatment plant theo-retically serves its entire catchment area but is not function-ing due to a lack of operation and maintenance funds.85
For the large number of urban residents using on-site fa-cilities (septic tanks, soakpits) some private contractors are available for the removal and disposal of septage; some municipalities also offer this service. In Phnom Penh there is a sanitary landfill managed by a private operator where tankers can safely dispose of septage (for a fee) but it is common for waste to be dumped indiscriminately.86
The arrangement for applying and collecting fees for waste-water management is not standardized across the country. In Phnom Penh, PPWSA collects sanitation fees through the water bill. Outside the capital, water supply and waste-water fees are generally collected separately on the ba-sis that water supply coverage is still low and recovering wastewater charges only from network users would place a heavy burden on a small customer base.87 Compounding problems with the low revenue base are that households and commercial establishments refuse to connect.
For the purpose of the costing model, SDA participants have suggested to use the very ambitious target of having 50% of the urban population to be connected and served by wastewater treatment facilities by 2025.
Given the fairly high existing access level and considering a rapid urbanization trend, in order to meet the 2025 target, ap-proximately 275,000 persons will need to gain access to im-proved sanitation each year (using JMP 2012 data). This will re-quire US$86.7 million per year in capital expenditure, of which US$71.4 million is expected to come from public sources to cover sewer connection and treatment capacity infrastruc-ture. Recent and anticipated investments, although showing
a slightly positive trend with around US$6 million annually, fall by far short of the amount needed. Since many households will continue to rely on on-site sanitation, US$15.3 is expected to come from household budgets no subsidies are available for on-site facilities for urban residents. Only a small portion of all required investments is expected to be leveraged through contributions of households through connecting their toilets and septic tanks to sewer systems. This leaves a funding defi-cit for capital expenditure of almost US$80 million annually, illustrating that more realistic targets are required. Moreover, as most urban residents are likely to rely on on-site solutions in the medium to long-term, other sanitation services than cen-tralized sewers with wastewater treatment plants would need to be considered as interim solutions (such as fecal sludge management), while Cambodia is developing economically.
As can be seen in Figure 10.2, the capital expenditure rep-resents new facilities, and an equal amount of replacement costs for worn out existing facilities, the latter which for on-site facilities will need to be borne by households. For cen-tralized systems, these replacement costs would rely on gov-ernment budget allocation, as currently sanitation tariffs only partially cover O&M, let alone will be able to recover full cost including depreciation of assets. In addition, between 2012 and 2025 a conservative US$9 million on average annually would need to be raised to put in place the lagging treatment capacity for those that already are connected to sewer/drain-age systems. Finally, annual average O&M expenditures are estimated at around US$9.5 million a year. Without collection of tariffs that at least cover O&M, these expenses would also have to be provided through national and local government budgets. Failure to adequately fund O&M costs will lead to much lower lifespans of the investments and thus an even higher funding gap.
Currently, development partners in the sector are KOIKA, with a US$40 million loan for construction of sewerage system in Siem Reap, a major tourist center, AFD and JICA. JICA pro-vided extensive support for drainage and flood protection infra-
87 In Siem Reap and Sihanoukville a fee is charged by the Provincial Department of Public Works and Transport; and in Battambang this is done by the municipality.88 In this context the master plan currently under development for Phnom Penh will investigate the option of having separate sewer/drainage systems in four outer districts of Phnom Penh, while four inner districts have combined systems89 JICA expenditure on flood protection has not been included in under urban sanitation investments and ADB pipelined projects were not yet confirmed as anticipated spending at the time of data collection.

Service Delivery Assessment 39
Figure 10.3 Urban sanitation and hygiene scorecard
structure in Phnom Penh and is now developing a master plan88 combining drainage, flood protection and sanitation. ADB is pipelining sanitation investments in other cities.89
Scorecard results under the enabling pillar reflect that despite the 2003 overall sector policy, urban sanitation is not very high on the priority list, there being no strategic sector investment plan or comprehensive urban sanitation strategy, although a master plan for Phnom Penh is now under preparation. Other cities have not yet developed city-wide sanitation plans and will require intensive external support to do so. There are no specific targets in the NSDP 2014-2018 for treatment and safe disposal of wastewater and/or septage. In terms of the institu-tional framework, at national ministerial level there is not yet a consensus how sanitation/waste water services are best man-aged, regulated and delivered by local service providers, such as through either municipal departments, provincial depart-ments of MPWT or through a combined utility water and waste-water approach. The department under MWPT responsible for urban sanitation remains under resourced to fulfil its mandate as per the decree of establishment in 2010. In terms of plan-ning and fund coordination, there is not yet a joint annual review mechanism of the subsector and the sub-TWG on urban wa-ter supply has not yet formally enlarged its mandate, although sanitation issues have been addressed in this forum in the past. In terms of budget, funds are inadequate and budgets do not precisely distinguish capital investment and subsidies for O&M support as gap-stoppers for inadequate revenue collection.
Further along the service delivery pathway, scores under de-veloping pillar are again modest, illustrating the gradual prog-ress in developing new services. Although domestic budget execution seems not a problem, the amounts are very low. Development partner budget expenditure is not integrated in the government reporting system, making it difficult to track progress. In terms of equity and participation, there is limited
attention to involving communities in the planning of sanita-tion investments, resulting in many households refusing to connect. Other than specific project arrangements, provi-sions that target and monitor service delivery to poor house-holds or communities within a town are not yet developed and routinely adopted. While some monitoring is happening at the level of the wastewater treatment plants, a systematic and consolidated monitoring system that reports connections and volumes of wastewater/fecal waste being collected and treated is not yet developed.
The sustaining pillar shows key bottlenecks for maintenance and expansion of urban sanitation services. While for the three plants under MPWT the operations and maintenance costs are known, fees are not covering full cost, and are reported to be on average 88%. From all wastewater collected it is estimated that around 40% is treated. While discharge standards exist, compliance is not subject to ongoing third party monitoring, though the Ministry of Environment is said to conduct annual checks. Fecal sludge management solutions are not reflected in the NSDP 2014-2018 or in priority agenda of MPWT. Com-munications programs that aim to incentivize households to regularly empty their septic tanks/pits are not yet executed neither are there incentives for the private sector to expand such services and comply with safe disposal rules. Due to the early stages of development of the urban sanitation sector, op-portunities for private sector participation in the operation and maintenance of wastewater treatment plants are premature. Despite the various constraints, the subsector scores well for user outcomes, including equity, given that urban access to improved sanitation has reached 82%, albeit mostly though private investments in on-site facilities. While overall on-site access is high, no strategies are developed to eliminate open defecation (as part of city wide sanitation planning), prevalent among poor households, which are concentrated in informal settlement areas of Phnom Penh and other bigger towns.
Enabling Developing SustainingPlanning
0.4
Policy
2
Budget
1
Output
1
Expenditure
1.5
Maintenance
1
Equity
1
Expansion
0.5 2.5
Use
Source: SDA scorecard.

Water Supply and Sanitation in Cambodia40
Reaching universal access targets set for 2025 will involve an estimated 562,000 persons per year gaining access to improved water supply services and 933,000 gaining ac-cess to improved sanitation, of which 62% live in rural ar-eas. Almost 660,000 people living in rural areas will need to gain access annually to improved sanitation, making this the most pressing development issue in terms of closing the urban-rural gap, and especially in light in the high and persistent levels of stunting (40%) of children, translat-ing in low cognitive development and less productive fu-ture lives.90 These basic service delivery gaps in water and sanitation translate to capital expenditure requirements of US$92 million per year for water supply and US$119 mil-lion for sanitation. The estimated capital requirements are biased towards urban areas, requiring 70% of the total, on account on higher unit cost and ambitious targets for high levels of services, especially for urban wastewater. Antici-pated financing falls far short of this requirement with pro-jected deficits of US$57 million per year for water supply and US$85 million for sanitation; these include replacement costs as well. On top of this, approximately US$10 million per year is required for the operation and maintenance of water supply services and US$14 million for sanitation.
With the ambitious government targets in mind, it is clear that investments in the water supply and sanitation sector fall short of requirement, and - with an eye on delivering ser-vices to the poor, the rural sectors seems to be hardest hit. However, with rapid urbanization, urban water supply ser-vices especially outside of Phnom Penh need urgent atten-tion, as well as sanitation solutions in the capital to improve
hygienic living conditions and reduce environmental deg-radation. However, the scale of the investment gap could, however, be reduced by improving the efficiency, manage-ment and sustainability of existing infrastructure and ser-vices. Especially for water supply, ensuring higher cost re-covery through user tariffs and fees will help to reduce the burden placed on government to fund replacement costs. Another critical challenge is the lack of a well-defined and operationalized institutional and regulatory framework to drive quality, equity and efficiency in service provision.
Especially relevant here is the importance to clarify func-tional assignment of rural sanitation and maintenance of rural water supplies to sub-national administrations. In line with the principles of the D&D reform, a decentralized ser-vice delivery model for rural services will need the adequate level of resourcing, strong district and commune council leadership, and oversight and guidance by technical line agencies. Similarly, the reform in the urban water supply sector would need to follow the example of Phnom Penh by creating autonomous utilities, as well as cities taking re-sponsibilities for urban sanitation issues, possibly through combined water and sanitation service providers.
Other constraints for sound sector development – following the motto “what gets measured gets managed” - is the lack of effective monitoring systems to track progress against targets and improve programming for both the urban and rural subsectors, as well as the limitations of existing finan-cial management to support budgeting and expenditure re-porting, linking these to result areas.
11. Conclusion
90 WSP (2014) Investing in the Next Generation: Growing Tall and Smart with a Toilet. World Bank Water and Sanitation Program. Phnom Penh

Service Delivery Assessment 41
Figure 11.1 Subsector scorecards
RURAL WATER SUPPLY
URBAN WATER SUPPLY
RURAL SANITATION AND HYGIENE
URBAN SANITATION
Enabling Developing SustainingPlanning
1
Policy
2.5
Budget
1
Output
0.5
Expenditure
2
Maintenance
1
Equity
1
Expansion
0.5 1.5
Use
Enabling Developing SustainingPlanning
0
Policy
2
Budget
1.5
Output
1.5
Expenditure
2
Maintenance
1.5
Equity
0
Expansion
0.5 3
Use
Enabling Developing SustainingPlanning
1
Policy
2
Budget
0
Output
0.5
Expenditure
2
Markets
1.5
Equity
1
Uptake
1 0.5
Use
Enabling Developing SustainingPlanning
0.4
Policy
2
Budget
1
Output
1
Expenditure
1.5
Maintenance
1
Equity
1
Expansion
0.5 2.5
Use

Water Supply and Sanitation in Cambodia42
SDA stakeholders identified a number of critical bottle-necks as reflected in the scorecards below, and formulated specific subsector priority areas that have been highlighted
in the strategic overview and sub-sector chapters. Key sec-tor-wide priority actions to address bottlenecks for service delivery are the following:
Sector-wide
short term medium term long term
Strengthen decentralization in the water and sanitation sector by clarify-ing functions for sub-national administrations, providing operational guidance and developing the required legal framework
√ √
Develop an overall legal and institutional framework (water law) for the water and sanitation sector which redefines the institutional mandate for urban sanitation and establishes an independent regulator
√ √ √
Adopt and implement a capacity building strategy hosted with local institutions and design a pooled financing mechanism for development partners support
√ √
Establish better monitoring systems, reporting access and usage of ser-vices, service quality, sustainability, institutional WASH, and equity, and publish information through ministerial websites
√ √
Carry out high-level advocacy using platforms such as Technical Work-ing Groups and Cambodia Development Council to increase funding allocations, especially for the rural sector
√
Improve the tracking of budget allocations and expenditure on water supply and sanitation for rural and urban sub-sectors through program-based budgeting and the government’s Financial Management Informa-tion System, including better tracking at sub-national level over time
√ √
Institutionalize coordination and planning between Ministries of Health, Education and Rural Development to improve WASH facilities in institu-tions, such as health centers and schools
√ √
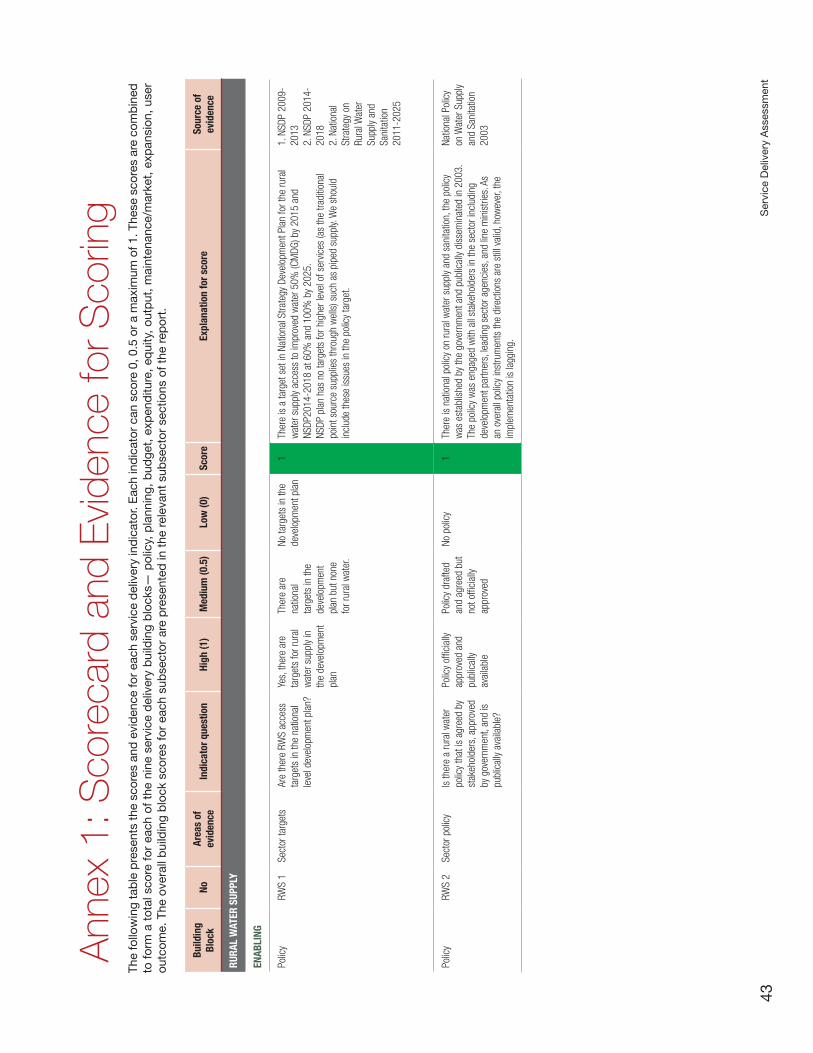
Ser
vice
Del
iver
y A
sses
smen
t43
Ann
ex 1
: Sco
reca
rd a
nd E
vide
nce
for S
corin
gTh
e fo
llow
ing
tabl
e pr
esen
ts th
e sc
ores
and
evi
denc
e fo
r eac
h se
rvic
e de
liver
y in
dica
tor.
Eac
h in
dica
tor c
an s
core
0, 0
.5 o
r a m
axim
um o
f 1. T
hese
sco
res
are
com
bine
d to
form
a t
otal
sco
re fo
r ea
ch o
f the
nin
e se
rvic
e de
liver
y bu
ildin
g bl
ocks
— p
olic
y, p
lann
ing,
bud
get,
expe
nditu
re, e
quity
, out
put,
mai
nten
ance
/mar
ket,
expa
nsio
n, u
ser
outc
ome.
The
ove
rall
build
ing
bloc
k sc
ores
for
each
sub
sect
or a
re p
rese
nted
in th
e re
leva
nt s
ubse
ctor
sec
tions
of t
he re
port
.
Build
ing
Bloc
kNo
Area
s of
ev
iden
ceIn
dica
tor q
uest
ion
High
(1)
Med
ium
(0.5
)Lo
w (0
)Sc
ore
Expl
anat
ion
for s
core
Sour
ce o
f ev
iden
ce
RURA
L W
ATER
SUP
PLY
ENAB
LING
Polic
yRW
S 1
Sect
or ta
rget
sAr
e th
ere
RWS
acce
ss
targ
ets
in th
e na
tiona
l le
vel d
evel
opm
ent p
lan?
Yes,
ther
e ar
e ta
rget
s fo
r rur
al
wat
er s
uppl
y in
th
e de
velo
pmen
t pl
an
Ther
e ar
e na
tiona
l ta
rget
s in
the
deve
lopm
ent
plan
but
non
e fo
r rur
al w
ater
.
No ta
rget
s in
the
deve
lopm
ent p
lan
1Th
ere
is a
targ
et s
et in
Nat
iona
l Stra
tegy
Dev
elop
men
t Pla
n fo
r the
rura
l w
ater
sup
ply
acce
ss to
impr
oved
wat
er 5
0% (C
MDG
) by
2015
and
NS
DP20
14-2
018
at 6
0% a
nd 1
00%
by
2025
. NS
DP p
lan
has
no ta
rget
s fo
r hig
her l
evel
of s
ervic
es (a
s th
e tra
ditio
nal
poin
t sou
rce
supp
lies
thro
ugh
wel
ls) s
uch
as p
iped
sup
ply.
We
shou
ld
incl
ude
thes
e is
sues
in th
e po
licy
targ
et.
1. N
SDP
2009
-20
132.
NSD
P 20
14-
2018
2. N
atio
nal
Stra
tegy
on
Rura
l Wat
er
Supp
ly an
d Sa
nita
tion
2011
-202
5
Polic
yRW
S 2
Sect
or p
olic
yIs
ther
e a
rura
l wat
er
polic
y th
at is
agr
eed
by
stak
ehol
ders
, app
rove
d by
gov
ernm
ent,
and
is
publ
ical
ly av
aila
ble?
Polic
y of
ficia
lly
appr
oved
and
pu
blic
ally
avai
labl
e
Polic
y dr
afte
d an
d ag
reed
but
no
t offi
cial
ly ap
prov
ed
No p
olic
y1
Ther
e is
nat
iona
l pol
icy
on ru
ral w
ater
sup
ply
and
sani
tatio
n, th
e po
licy
was
est
ablis
hed
by th
e go
vern
men
t and
pub
lical
ly di
ssem
inat
ed in
200
3.
The
polic
y w
as e
ngag
ed w
ith a
ll st
akeh
olde
rs in
the
sect
or in
clud
ing
deve
lopm
ent p
artn
ers,
lead
ing
sect
or a
genc
ies,
and
line
min
istri
es. A
s an
ove
rall
polic
y in
stru
men
ts th
e di
rect
ions
are
stil
l val
id, h
owev
er, t
he
impl
emen
tatio
n is
lagg
ing.
Natio
nal P
olic
y on
Wat
er S
uppl
y an
d Sa
nita
tion
2003

Wat
er S
upp
ly a
nd S
anita
tion
in C
amb
odia
44
Build
ing
Bloc
kNo
Area
s of
ev
iden
ceIn
dica
tor q
uest
ion
High
(1)
Med
ium
(0.5
)Lo
w (0
)Sc
ore
Expl
anat
ion
for s
core
Sour
ce o
f ev
iden
ce
Polic
yRW
S 3
Inst
itutio
nal R
oles
Ar
e th
e in
stitu
tiona
l ro
les
of ru
ral w
ater
su
bsec
tor p
laye
rs
(nat
iona
l/sta
te &
loca
l go
vern
men
t, se
rvic
e pr
ovid
er, r
egul
ator
etc
) cl
early
defi
ned
and
oper
atio
naliz
ed?
Defin
ed a
nd
oper
atio
naliz
edDe
fined
but
not
op
erat
iona
li-ze
d
Not d
efine
d0.
5Th
ere
is o
vera
ll st
atem
ent o
n th
e ro
les
and
resp
onsi
bilit
ies
wer
e de
fined
fro
m n
atio
nal t
o su
b-na
tiona
l lev
el. A
ccor
ding
to th
e D&
D le
gal f
ram
ewor
k,
loca
l aut
horit
y is
the
entit
y to
take
lead
of l
ocal
dev
elop
men
t and
dev
elop
sh
ort t
erm
, med
ium
and
long
term
pla
n. S
UG a
nd V
DC a
re e
xpec
ted
to ta
ke
up a
role
in w
ater
sup
ply
man
agem
ent,
but o
ften
not o
pera
tiona
lized
in
the
field
. The
impl
emen
tatio
n of
D&D
refo
rm is
stil
l lim
ited,
alth
ough
rura
l w
ater
sup
ply
mai
nten
ance
is n
ow fo
rmal
ly pr
opos
ed to
be
assi
gned
to s
ub-
natio
nal a
utho
rity.
Ther
e ar
e m
any
acto
rs in
the
rura
l wat
er s
uppl
y se
ctor
. M
RD h
as n
o ef
fect
ive c
oord
inat
ion
stra
tegy
to w
ork
with
rele
vant
min
istri
es,
deve
lopm
ent p
artn
ers,
NGO
yet
. Thi
s is
may
be d
ue to
lim
ited
supp
ort f
rom
po
litic
al, l
ack
of in
stitu
tiona
l cap
acity
, ins
uffic
ient
bud
get a
lloca
tions
to
spec
ific
sect
or in
stitu
tion.
Alth
ough
ther
e is
Pra
kas
on th
e es
tabl
ishm
ent o
f DR
WS,
PDR
D an
d DO
RD b
ut n
o de
taile
d Te
rm o
f Ref
eren
ce a
re d
evel
oped
. M
oU w
ith M
IME/
MIH
has
bee
n ar
rang
ed to
cla
rify
inst
itutio
nal r
ole
of M
RD
for s
mal
l com
mun
ity-b
ased
wat
er s
chem
es (<
500
con
nect
ions
).
1. G
uide
line
of C
CWC
July
2010
2. V
DC
esta
blis
hed
2010
3. P
raka
s th
e es
tabl
ishm
ent o
f DR
WS
4. P
raka
s th
e es
tabl
ishm
ent
of P
DRD
and
DORD
5. R
oles
and
Re
spon
sibi
litie
s of
DRW
S6.
Gui
delin
e fo
r W
SUG
2004
7. M
oU
with
MIH
/M
IME
on th
e re
spon
sibi
litie
s fo
r pip
ed w
ater
su
pply
Plan
ning
RWS
4Fu
nd fl
ow
coor
dina
tion
Does
gov
ernm
ent
have
a p
roce
ss fo
r co
ordi
natin
g m
ultip
le
inve
stm
ents
in th
e su
bsec
tor (
dom
estic
or
don
or, e
g. N
atio
nal
gran
ts, s
tate
bud
gets
, do
nor l
oans
and
gra
nts
etc.
)?
Coor
dina
tion
proc
ess
defin
ed a
nd
oper
atio
naliz
ed
Coor
dina
tion
proc
ess
defin
ed b
ut n
ot
oper
atio
nal-
ized
Not d
efine
d/ n
o pr
oces
s0,
5Th
e m
inis
try’s
pro
cess
is b
ased
on
the
prio
rity
activ
ity a
nd a
t pro
ject
leve
l on
ly. M
inis
try h
as te
ams
coor
dina
ting
mul
tiple
inve
stm
ent b
udge
t bas
ed
on th
e pr
iorit
y ne
eds/
proj
ects
. But
ther
e is
no
sect
or-w
ide
prog
ram
mat
ic
appr
oach
yet
bas
ed o
n a
natio
nal a
ctio
n pl
an. N
orm
ally
the
min
istry
cre
ates
pr
ojec
t man
agem
ent u
nit (
PMU)
to c
oord
inat
e an
y in
vest
men
t pro
ject
. M
RD a
lso
sign
s M
OU w
ith th
e NG
O an
d DP
to im
prov
e co
ordi
natio
n, b
ut
no s
yste
mat
ic s
yste
m is
in p
lace
that
trac
ks a
nd c
oord
inat
es fu
nd fl
ow o
f do
mes
tic s
ourc
es, d
evel
opm
ent p
artn
ers
that
are
cha
nnel
ling
thro
ugh
the
budg
et, a
nd N
GOs
that
exe
cute
d th
roug
h pa
ralle
l mec
hani
sms.
MRD
has
th
e TW
G-RW
SS w
hich
is th
e pl
atfo
rm to
coo
rdin
ate
deve
lopm
ent p
artn
ers
and
gove
rnm
ent p
rogr
am a
nd p
olic
ies,
but
so
far i
t doe
s no
t sup
port
the
coor
dina
tion
of fu
ndin
g to
the
sect
or. F
und
flow
is b
ilate
rally
coo
rdin
ated
be
twee
n M
EF, M
RD a
nd D
Ps. C
oord
inat
ion
at C
ambo
dia
Deve
lopm
ent
Coun
cil (
CDC)
leve
l is
happ
enin
g to
a li
mite
d ex
tent
. The
re is
ann
ual C
DC
Foru
m w
hich
is th
e hi
ghes
t lev
el p
latfo
rm fo
r gat
herin
g al
l DPs
to lo
ok a
t pr
iorit
y de
velo
pmen
t pro
gram
pro
pose
d by
the
gove
rnm
ent,
how
ever
has
no
t tak
en p
lace
in re
cent
yea
rs.
1. E
xper
ts
opin
ion
2. C
onsu
ltativ
e W
orks
hop
on
Rura
l Wat
er
Supp
ly &
Sani
tatio
n3.
Rur
al W
ASH
retre
at 2
014

Ser
vice
Del
iver
y A
sses
smen
t45
Build
ing
Bloc
kNo
Area
s of
ev
iden
ceIn
dica
tor q
uest
ion
High
(1)
Med
ium
(0.5
)Lo
w (0
)Sc
ore
Expl
anat
ion
for s
core
Sour
ce o
f ev
iden
ce
Plan
ning
RWS
5In
vest
men
t pla
nIs
ther
e a
med
ium
term
in
vest
men
t pla
n fo
r rur
al
wat
er b
ased
on
natio
nal
targ
ets
that
is c
oste
d,
prio
ritize
s in
vest
men
t ne
eds,
is p
ublis
hed
and
used
?
Inve
stm
ent p
lan
base
d on
prio
rity
need
s ex
ists
, is
publ
ishe
d an
d us
ed
Exis
ts b
ut n
ot
used
, or u
nder
pr
epar
atio
n
Does
not
exis
t0
Ther
e is
pub
lic in
vest
men
t pla
n (P
IP) f
or 5
yea
r – w
ith a
3 y
ear r
ollin
g pl
an, n
ot li
nked
to th
e se
ctor
targ
et. I
t has
bee
n de
velo
ped
base
d on
the
annu
al b
udge
t allo
cate
d to
the
depa
rtmen
t. Th
e PI
P w
as d
one
with
out n
eed
asse
ssm
ent a
nd th
e qu
ality
is li
mite
d.
MEF
has
enc
oura
ged
to M
RD s
houl
d de
velo
p PI
P ev
en th
ough
MEF
mig
ht
not a
ble
to p
rovid
e fu
ll fu
ndin
g bu
t it i
s us
eful
info
rmat
ion
for M
EF k
new
w
hat i
s th
e ne
eds
and
help
find
ing
the
deve
lopm
ent p
artn
ers.
NTP3
doc
umen
t, an
nual
MAR
D ci
rcul
ars
requ
estin
g tw
o ye
ar p
lans
. /
Rura
l San
itatio
n Co
mpo
nent
No
.3 /
MOH
Sa
nita
tion
Actio
n Pl
an (2
012-
2015
).
Plan
ning
RWS
6An
nual
revie
wIs
ther
e a
annu
al m
ulti-
stak
ehol
der r
evie
w
in p
lace
to m
onito
r su
bsec
tor p
erfo
rman
ce,
to re
view
pro
gres
s an
d se
t cor
rect
ive a
ctio
ns?
Revie
w o
f pe
rform
ance
an
d se
tting
of
corre
ctive
act
ions
Revie
w o
f pe
rform
ance
bu
t no
setti
ng
of c
orre
ctive
ac
tions
No re
view
or
set
ting
of
corre
ctive
act
ions
0M
RD h
as e
stab
lishe
d TW
G-RW
SSH
on ru
ral w
ater
sup
ply
and
sani
tatio
n.
The
mai
n ro
les
of T
WG
are
to fo
llow
up
the
prog
ress
of t
he s
ecto
r thr
ough
qu
arte
rly m
eetin
gs a
nd c
oord
inat
e st
rate
gic
inpu
ts fr
om d
evel
opm
ent
partn
ers.
Sec
reta
riat i
s un
ders
taffe
d, a
nd n
o an
nual
sec
tor r
evie
w ta
kes
plac
e. T
here
is n
o as
sess
men
t for
cor
rect
ive m
easu
re o
f the
sec
tor
perfo
rman
ce. J
oint
Mon
itorin
g In
dica
tors
of t
he T
WG
refle
ct s
ome
activ
ities
be
twee
n go
vern
men
t and
DP,
but s
ecto
r mon
itorin
g sy
stem
is a
bsen
t. Th
ere
is W
ASH
coor
dina
tion
mee
ting,
with
sub
-gro
ups,
that
sup
ports
info
rmat
ion
shar
ing,
but
they
hav
e lim
ited
invo
lvem
ent i
n TW
G.M
OP le
ads
a m
id-t
erm
revie
w o
f NSD
P fo
r all
sect
ors.
1. T
oR o
f TW
G-RW
SSH
2. T
oR fo
r WAS
H co
ordi
natio
n gr
oup
and
ToRs
of
sub
-gro
ups
Plan
ning
RWS
7HR
Cap
acity
Has
an a
sses
smen
t be
en u
nder
take
n of
th
e hu
man
reso
urce
ne
eds
in th
e su
b se
ctor
to m
eet t
he
subs
ecto
r tar
get a
nd is
th
e ac
tion
plan
bei
ng
impl
emen
ted?
Asse
ssm
ent
unde
rtake
n an
d ac
tions
bei
ng
impl
emen
ted
Asse
ssm
ent
unde
rtake
n bu
t no
act
ion
bein
g ta
ken
No a
sses
smen
t un
derta
ken
0.5
For t
he d
evel
opm
ent o
f the
nat
iona
l stra
tegy
for r
ural
wat
er s
uppl
y an
d sa
nita
tion,
HR
need
s w
ere
iden
tified
but
not
spe
cific
type
of s
kill.
Only
the
reso
urce
nee
ds a
t loc
al le
vel w
ere
men
tione
d. R
ecru
itmen
t pro
cess
es
with
in M
RD n
eed
MEF
app
rova
l and
do
not n
eces
saril
y re
flect
ski
ll re
quire
men
ts. F
unct
iona
l map
ping
repo
rts w
eakn
esse
s in
sta
ffing
, in
quan
tity
and
qual
ity.
1. N
atio
nal
Stra
tegy
For
Ru
ral W
ater
Su
pply
and
Sani
tatio
n 20
11-2
025
2. F
unct
iona
l Re
port
of M
RD
2010
(sup
porte
d by
UNI
CEF)
3. F
unct
iona
l M
appi
ng re
port
of M
RD (2
013)

Wat
er S
upp
ly a
nd S
anita
tion
in C
amb
odia
46
Build
ing
Bloc
kNo
Area
s of
ev
iden
ceIn
dica
tor q
uest
ion
High
(1)
Med
ium
(0.5
)Lo
w (0
)Sc
ore
Expl
anat
ion
for s
core
Sour
ce o
f ev
iden
ce
Budg
etRW
S 8
Adeq
uacy
Are
the
publ
ic fi
nanc
ial
com
mitm
ents
to th
e ru
ral w
ater
sub
sect
or
suffi
cien
t to
mee
t the
na
tiona
l tar
gets
for t
he
subs
ecto
r?
Mor
e th
an
75%
of w
hat i
s ne
eded
Betw
een
50-
75%
of n
eeds
Less
than
50%
of
need
s0
The
natio
nal s
trate
gy c
lear
ly de
fined
the
need
of fi
nanc
ing
yet b
ut
addr
esse
d th
at la
ck o
f fina
ncin
g. S
DA e
stim
ate
clea
rly s
peci
fy a
gap
of
US$2
4 m
illion
ann
ually
, and
cou
ld b
e hi
gher
if h
ouse
hold
con
tribu
tions
do
not m
ater
ializ
e (le
ss th
an 5
0% o
f nee
ds).
Mor
eove
r, fu
ndin
g of
sof
twar
e,
O&M
sup
port
and
othe
r ope
ratio
nal c
ost a
re s
ever
ely
inad
equa
te. P
artn
er
map
ping
repo
rt fo
r the
rura
l wat
er s
uppl
y an
d sa
nita
tion
sect
or s
how
ed th
at
deve
lopm
ent p
artn
er a
nd N
GO s
uppo
rt al
loca
ted
for p
erio
d of
200
9-20
15
is a
roun
d $1
5 m
illion
per
yea
r (in
clud
es s
oftw
are,
har
dwar
e an
d pr
ogra
m
cost
s), w
ith d
eclin
ing
allo
catio
n to
wat
er s
uppl
y
1. C
ostin
g an
alys
is S
DA
mod
el2.
Sec
tor
Inve
stm
ent P
lan
2005
-201
5.
Page
83.
The
pro
gres
s re
port
of W
SS
sect
or m
appi
ng
issu
ed b
y M
RD
on J
anua
ry
2013
.
Budg
etRW
S 9
Stru
ctur
eDo
es th
e bu
dget
st
ruct
ure
perm
it th
e in
vest
men
ts a
nd
subs
idie
s (o
pera
tiona
l co
sts,
adm
inis
tratio
n,
debt
ser
vice,
etc
) for
the
rura
l wat
er s
ecto
r to
be
clea
rly id
entifi
ed?
Yes
for
inve
stm
ent a
nd
for s
ubsi
dies
Yes
for
inve
stm
ent b
ut
not s
ubsi
dies
No0.
5As
per
the
Natio
nal B
udge
t Law
, mul
ti-ye
ar b
udge
t sho
uld
show
the
sour
ce o
f inc
ome
from
ow
n so
urce
(sta
te in
com
e) a
nd in
com
e fro
m
exte
rnal
(inc
ludi
ng: i
nves
tmen
t sub
sidy
, bila
tera
l sub
sidy
, and
loan
s) a
nd
the
expe
nditu
re fo
r nat
iona
l lev
el (m
inis
tries
and
pro
vinci
al d
epar
tmen
ts),
and
the
expe
nditu
re fo
r sub
-nat
iona
l lev
el (i
nclu
ding
: city
, dis
trict
, san
gkat
/co
mm
une)
. The
law
als
o sp
ecifi
es th
e ca
pita
l exp
endi
ture
from
abr
oad
and
capi
tal i
nves
tmen
t with
the
avai
labl
e an
d no
t ava
ilabl
e bu
dget
. Rel
ated
to
the
reco
rds
of a
ll th
e m
ajor
sou
rce
of e
xter
nal i
ncom
e, th
e Co
unci
l for
th
e De
velo
pmen
t of C
ambo
dia
(CDC
) est
ablis
hed
the
ODA
data
base
for
deve
lopm
ent p
artn
ers
to p
rovid
e in
form
atio
n ab
out t
heir
inve
stm
ents
. Pr
esen
t, M
RD h
as a
lloca
ted
budg
et 9
0% to
rura
l roa
d an
d le
ss th
an 1
0%
for r
ural
wat
er s
uppl
y an
d sa
nita
tion.
In p
rinci
pal,
MEF
can
onl
y in
crea
se
budg
et 5
% a
nnua
lly to
MRD
bas
ed o
n th
e GD
P gr
owth
. It d
epen
ds o
n th
e M
RD it
self
to d
ecid
e on
incr
easi
ng th
e bu
dget
for R
WSS
with
in th
e bu
dget
al
loca
ted
from
MEF
.
1. N
atio
nal
Budg
et L
aw2.
Con
sulta
tive
Wor
ksho
p on
Ru
ral W
ater
Su
pply
& Sa
nita
tion
Budg
etRW
S 10
Com
preh
ensi
veDo
es th
e go
vern
men
t bu
dget
com
preh
ensi
vely
cove
r dom
estic
an
d of
ficia
l don
or
inve
stm
ent/s
ubsi
dy to
ru
ral w
ater
?
Mor
e th
an 7
5%
of fu
nds
to
subs
ecto
r on
budg
et
Betw
een
50-
75%
of f
unds
to
sub
sect
or o
n bu
dget
Less
than
50%
of
fund
s to
su
bsec
tor o
n bu
dget
0.5
Curre
ntly
ther
e is
no
sepa
rate
bud
get-
line/
acco
unt f
or ru
ral w
ater
su
pply
sect
or. D
RWS
is re
spon
sibl
e fo
r cap
ital i
nves
tmen
t onl
y w
hile
the
oper
atio
nal e
xpen
ditu
re is
in c
harg
e by
dep
artm
ent o
f adm
in a
nd fi
nanc
e.
With
the
intro
duct
ion
of th
e pr
ogra
m-b
ased
bud
getin
g th
is is
exp
ecte
d to
ch
ange
. MRD
has
to p
ut th
e bu
dget
pla
n pr
opos
e on
thei
r PIP,
alth
ough
the
gove
rnm
ent n
ot a
ble
to p
rovid
e th
e bu
dget
as
prop
osed
but
will
show
it to
ot
her D
Ps to
get
thei
r int
eres
t to
supp
ort i
n so
me
way
s. T
he n
atio
nal b
udge
t al
loca
ted
for r
ural
wat
er s
uppl
y an
d sa
nita
tion
sect
or is
abo
ut $
11.1
2milli
on
from
200
8-20
13, a
nd it
incl
udes
maj
or d
evel
opm
ent p
artn
er fu
nds
(like
lo
ans)
, but
doe
s no
t spe
cify
ver
y w
ell h
ardw
are
vers
us s
oftw
are
cost
s.
How
ever
, due
to lo
t of N
GO in
volve
men
t in
the
sect
or, a
larg
e fu
nd a
lloca
tion
rem
ains
of b
udge
t (in
clud
ing
tech
nica
l ass
ista
nce)
.
1. O
DA h
ttp://
cdc.
khm
er.b
iz2.
Inve
stm
ent
budg
et
2009
-201
1 &
2013
&201
53.
The
pro
gres
s re
port
of W
SS
sect
or is
sued
by
MRD
on
Janu
ary
2013
.

Ser
vice
Del
iver
y A
sses
smen
t47
Build
ing
Bloc
kNo
Area
s of
ev
iden
ceIn
dica
tor q
uest
ion
High
(1)
Med
ium
(0.5
)Lo
w (0
)Sc
ore
Expl
anat
ion
for s
core
Sour
ce o
f ev
iden
ce
DEVE
LOPI
NG
Expe
nditu
reRW
S 11
Utiliz
atio
n of
do
mes
tic fu
nds
Wha
t per
cent
age
of d
omes
tic fu
nds
budg
eted
for r
ural
w
ater
are
spe
nt (3
yea
r av
erag
e)?
Over
75%
Betw
een
50%
an
d 75
%Le
ss th
an 5
0%1
Base
d on
the
natio
nal b
udge
t law
pro
vided
to M
RD fr
om 2
009-
2011
sh
owed
that
the
expe
nditu
re o
f dom
estic
fund
s w
ork
wel
l, at
nat
iona
l le
vel 8
8% a
nd p
rovin
cial
leve
l 90%
of t
otal
bud
get h
as e
xpen
sed.
Thi
s is
be
caus
e th
e bu
dget
allo
cate
d to
MRD
is n
orm
ally
late
with
one
qua
rter a
nd
prov
ides
onl
y re
curre
nt b
udge
t and
som
e sm
all s
ubsi
dy b
udge
t. So
met
imes
th
e bu
dget
app
rove
d ha
s be
en u
se fo
r oth
er p
riorit
y pu
rpos
es o
ut o
f the
pl
an a
s w
ell.
Budg
et la
w
vs. a
ctua
l ex
pend
iture
fro
m (2
009-
2011
)
Expe
nditu
reRW
S 12
Utiliz
atio
n of
ex
tern
al fu
nds
Wha
t per
cent
age
of
exte
rnal
fund
s bu
dget
ed
for r
ural
wat
er a
re s
pent
(3
yea
r ave
rage
)?
Over
75%
Betw
een
50%
an
d 75
%Le
ss th
an 5
0%1
Ther
e is
no
refe
renc
e do
cum
ent b
ut fr
om e
ach
depa
rtmen
t and
som
e de
velo
pmen
t par
tner
s lik
e Un
icef
, ADB
has
men
tione
d th
at th
e ex
tern
al fu
nd
is g
ener
ally
spen
t on
time
and
at le
ast o
ver 7
5%. H
owev
er, n
orm
ally,
the
proj
ect s
tart
up is
slo
w d
isbu
rsem
ent a
nd q
uick
afte
r the
pro
ject
sta
rted.
Mee
tings
and
Ex
perts
Opi
nion
Expe
nditu
reRW
S 13
Repo
rting
Is ru
ral w
ater
ex
pend
iture
ver
sus
budg
et a
udite
d an
d re
porte
d on
in a
co
nsol
idat
ed fo
rmat
for
all s
ourc
es o
f dom
estic
an
d of
ficia
l don
or
expe
nditu
re?
Yes
for d
omes
tic
and
dono
r ex
pend
iture
Yes
for
dom
estic
ex
pend
iture
No0
Ther
e is
no
cons
olid
ated
fina
ncia
l rep
ort f
or a
ll re
sour
ces.
In p
ract
ice
each
de
partm
ent h
as o
wn
finan
ce o
ffice
r and
repo
rt to
dep
artm
ent o
f fina
nce.
De
velo
pmen
t par
tner
exp
endi
ture
is n
ot in
clud
ed in
nat
iona
l cha
rt of
ac
coun
ts, a
nd th
us re
porti
ng is
inco
mpl
ete.
Cons
ulta
tive
Wor
ksho
p on
Ru
ral W
ater
Su
pply
& Sa
nita
tion
Equi
tyRW
S 14
Loca
l pa
rtici
patio
nAr
e th
ere
clea
rly
defin
ed p
roce
dure
s fo
r in
form
ing,
con
sulti
ng
with
and
sup
porti
ng
loca
l par
ticip
atio
n in
pl
anni
ng, b
udge
ting
and
impl
emen
ting
for r
ural
w
ater
dev
elop
men
ts?
Yes
and
syst
emat
ical
ly ap
plie
d
Yes,
but
not
sy
stem
atic
ally
appl
ied
No0.
5Th
e pr
oced
ures
wer
e cl
early
defi
ned
from
nat
iona
l to
loca
l lev
el. P
rese
ntly
the
com
mun
e, d
istri
ct a
re d
evel
opin
g in
vest
men
t pla
n sa
nd re
ceive
an
allo
catio
n of
the
annu
al n
atio
nal b
udge
t to
impl
emen
t the
act
ivity
but
st
ill ve
ry s
mal
l am
ount
. Com
mun
es a
nd d
istri
cts
rece
ive fu
ndin
g (C
SF is
2.
8% o
f nat
iona
l rev
enue
), an
d D/
M fu
nd is
0.8
% o
f nat
iona
l rev
enue
DM
fu
nd) b
ased
on
allo
catio
n m
echa
nism
. So
far,
send
ing
on ru
ral w
ater
and
sa
nita
tion
is n
ot a
prio
rity
item
. Nat
iona
l fun
ding
thro
ugh
MRD
is a
lloca
ted
to d
iffer
ent P
DRD,
nor
mal
ly ba
sed
on th
e bo
ttom
-up
wor
k pl
an p
repa
ratio
n.
How
ever
pro
cedu
res
are
not s
tand
ardi
zed
and
syst
emat
ical
ly ap
plie
d
1. C
omm
une/
Sang
kat L
aw2.
Inve
stm
ent
plan
of d
istri
ct
leve
l3.
Inve
stm
ent
plan
of
com
mun
e le
vel
Equi
tyRW
S 15
Budg
et a
lloca
tion
crite
riaHa
ve c
riter
ia (o
r a
form
ula)
bee
n de
term
ined
to a
lloca
te
rura
l wat
er fu
ndin
g eq
uita
bly
to ru
ral
com
mun
ities
and
is
it b
eing
app
lied
cons
iste
ntly?
Yes,
app
lied
cons
iste
ntly
Yes,
but
no
t app
lied
cons
iste
ntly
No0.
5Th
e na
tiona
l bud
get l
aw h
as th
e m
echa
nism
for a
lloca
tion
budg
et to
all
min
istri
es b
ased
on
the
GDP
grow
th a
nd p
riorit
ized
sect
ors.
MRD
is o
ne
of th
e pr
iorit
y m
inis
tries
. How
ever
, the
bud
get a
lloca
ted
from
MRD
to
subs
ecto
r has
no
crite
ria a
nd is
not
sys
tem
atic
ally
appl
ied.
WSS
rece
ived
less
than
10%
of t
otal
bud
get a
lloca
ted
to M
RD. T
here
is n
o do
cum
enta
tion
on th
e cr
iteria
(or f
orm
ula)
had
bee
n de
term
ine
but i
n pr
actic
e DR
WS
use
budg
et to
impl
emen
t the
act
ivity
by
rota
tion
met
hod.
The
foun
datio
n cr
iteria
ar
e po
pula
tion
dens
ity, p
over
ty ra
te, p
rese
nce
of N
GO/D
P, di
arrh
oea
rate
, re
mot
e ar
ea, a
nd lo
w W
SS c
over
age.
In s
trate
gy o
f rur
al w
ater
sup
ply
and
sani
tatio
n in
dica
tes
the
need
but
nee
d to
dev
elop
into
gui
delin
e.
Cons
ulta
tive
Wor
ksho
p on
Ru
ral W
ater
Su
pply
& Sa
nita
tion
MRD
func
tiona
l m
appi
ng re
port
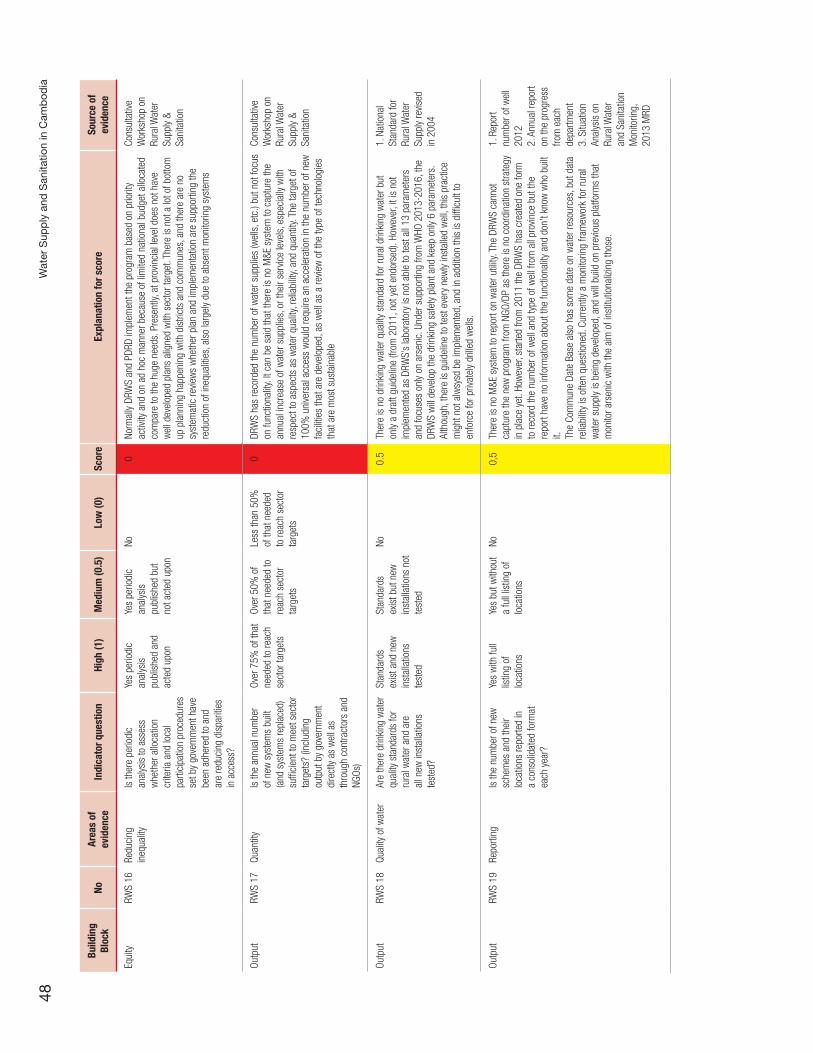
Wat
er S
upp
ly a
nd S
anita
tion
in C
amb
odia
48
Build
ing
Bloc
kNo
Area
s of
ev
iden
ceIn
dica
tor q
uest
ion
High
(1)
Med
ium
(0.5
)Lo
w (0
)Sc
ore
Expl
anat
ion
for s
core
Sour
ce o
f ev
iden
ce
Equi
tyRW
S 16
Redu
cing
in
equa
lity
Is th
ere
perio
dic
anal
ysis
to a
sses
s w
heth
er a
lloca
tion
crite
ria a
nd lo
cal
parti
cipa
tion
proc
edur
es
set b
y go
vern
men
t hav
e be
en a
dher
ed to
and
ar
e re
duci
ng d
ispa
ritie
s in
acc
ess?
Yes
perio
dic
anal
ysis
pu
blis
hed
and
acte
d up
on
Yes
perio
dic
anal
ysis
pu
blis
hed
but
not a
cted
upo
n
No0
Norm
ally
DRW
S an
d PD
RD im
plem
ent t
he p
rogr
am b
ased
on
prio
rity
activ
ity a
nd o
n ad
hoc
man
ner b
ecau
se o
f lim
ited
natio
nal b
udge
t allo
cate
d co
mpa
re to
the
huge
nee
ds. P
rese
ntly,
at p
rovin
cial
leve
l doe
s no
t hav
e w
ell d
evel
oped
pla
ns a
ligne
d w
ith s
ecto
r tar
get.
Ther
e is
not
a lo
t of b
otto
m
up p
lann
ing
happ
enin
g w
ith d
istri
cts
and
com
mun
es, a
nd th
ere
are
no
syst
emat
ic re
view
s w
heth
er p
lan
and
impl
emen
tatio
n ar
e su
ppor
ting
the
redu
ctio
n of
ineq
ualit
ies,
als
o la
rgel
y du
e to
abs
ent m
onito
ring
syst
ems
Cons
ulta
tive
Wor
ksho
p on
Ru
ral W
ater
Su
pply
& Sa
nita
tion
Outp
utRW
S 17
Quan
tity
Is th
e an
nual
num
ber
of n
ew s
yste
ms
built
(a
nd s
yste
ms
repl
aced
) su
ffici
ent t
o m
eet s
ecto
r ta
rget
s? (i
nclu
ding
ou
tput
by
gove
rnm
ent
dire
ctly
as w
ell a
s th
roug
h co
ntra
ctor
s an
d NG
Os)
Over
75%
of t
hat
need
ed to
reac
h se
ctor
targ
ets
Over
50%
of
that
nee
ded
to
reac
h se
ctor
ta
rget
s
Less
than
50%
of
that
nee
ded
to re
ach
sect
or
targ
ets
0DR
WS
has
reco
rded
the
num
ber o
f wat
er s
uppl
ies
(wel
ls, e
tc.)
but n
ot fo
cus
on fu
nctio
nalit
y. It
can
be s
aid
that
ther
e is
no
M&E
sys
tem
to c
aptu
re th
e an
nual
incr
ease
of w
ater
sup
plie
s, o
r the
ir se
rvic
e le
vels
, esp
ecia
lly w
ith
resp
ect t
o as
pect
s as
wat
er q
ualit
y, re
liabi
lity,
and
quan
tity.
The
targ
et o
f 10
0% u
nive
rsal
acc
ess
wou
ld re
quire
an
acce
lera
tion
in th
e nu
mbe
r of n
ew
faci
litie
s th
at a
re d
evel
oped
, as
wel
l as
a re
view
of t
he ty
pe o
f tec
hnol
ogie
s th
at a
re m
ost s
usta
inab
le
Cons
ulta
tive
Wor
ksho
p on
Ru
ral W
ater
Su
pply
& Sa
nita
tion
Outp
utRW
S 18
Qual
ity o
f wat
erAr
e th
ere
drin
king
wat
er
qual
ity s
tand
ards
for
rura
l wat
er a
nd a
re
all n
ew in
stal
latio
ns
test
ed?
Stan
dard
s ex
ist a
nd n
ew
inst
alla
tions
te
sted
Stan
dard
s ex
ist b
ut n
ew
inst
alla
tions
not
te
sted
No0.
5Th
ere
is n
o dr
inki
ng w
ater
qua
lity
stan
dard
for r
ural
drin
king
wat
er b
ut
only
a dr
aft g
uide
line
(from
201
1, n
ot y
et e
ndor
sed)
. How
ever
, it i
s no
t im
plem
ente
d as
DRW
S’s
labo
rato
ry is
not
abl
e to
test
all
13 p
aram
eter
s an
d fo
cuse
s on
ly on
ars
enic
. Und
er s
uppo
rting
from
WHO
201
3-20
16, t
he
DRW
S w
ill de
velo
p th
e dr
inki
ng s
afet
y pl
ant a
nd k
eep
only
6 pa
ram
eter
s.
Alth
ough
, the
re is
gui
delin
e to
test
eve
ry n
ewly
inst
alle
d w
ell,
this
pra
ctic
e m
ight
not
alw
sysd
be
impl
emen
ted,
and
in a
dditi
on th
is is
diffi
cult
to
enfo
rce
for p
rivat
ely
drille
d w
ells
.
1. N
atio
nal
Stan
dard
for
Rura
l Wat
er
Supp
ly re
vised
in
200
4
Outp
utRW
S 19
Repo
rting
Is th
e nu
mbe
r of n
ew
sche
mes
and
thei
r lo
catio
ns re
porte
d in
a
cons
olid
ated
form
at
each
yea
r?
Yes
with
full
listin
g of
lo
catio
ns
Yes
but w
ithou
t a
full
listin
g of
lo
catio
ns
No0,
5Th
ere
is n
o M
&E s
yste
m to
repo
rt on
wat
er u
tility
. The
DRW
S ca
nnot
ca
ptur
e th
e ne
w p
rogr
am fr
om N
GO/D
P as
ther
e is
no
coor
dina
tion
stra
tegy
in
pla
ce y
et. H
owev
er, s
tarte
d fro
m 2
011
the
DRW
S ha
s cr
eate
d on
e fo
rm
to re
cord
the
num
ber o
f wel
l and
type
of w
ell f
rom
all
prov
ince
but
the
repo
rt ha
ve n
o in
form
atio
n ab
out t
he fu
nctio
nalit
y an
d do
n’t k
now
who
bui
lt it. Th
e Co
mm
une
Date
Bas
e al
so h
as s
ome
date
on
wat
er re
sour
ces,
but
dat
a re
liabi
lity
is o
ften
ques
tione
d. C
urre
ntly
a m
onito
ring
fram
ewor
k fo
r rur
al
wat
er s
uppl
y is
bei
ng d
evel
oped
, and
will
build
on
prev
ious
pla
tform
s th
at
mon
itor a
rsen
ic w
ith th
e ai
m o
f ins
titut
iona
lizin
g th
ose.
1. R
epor
t nu
mbe
r of w
ell
2012
2. A
nnua
l rep
ort
on th
e pr
ogre
ss
from
eac
h de
partm
ent
3. S
ituat
ion
Anal
ysis
on
Rura
l Wat
er
and
Sani
tatio
n M
onito
ring,
20
13 M
RD

Ser
vice
Del
iver
y A
sses
smen
t49
Build
ing
Bloc
kNo
Area
s of
ev
iden
ceIn
dica
tor q
uest
ion
High
(1)
Med
ium
(0.5
)Lo
w (0
)Sc
ore
Expl
anat
ion
for s
core
Sour
ce o
f ev
iden
ce
SUST
AINI
NG
Mai
nten
ance
RWS
20Fu
nctio
n-al
ityAr
e th
ere
regu
lar a
sset
re
gist
er u
pdat
es o
f rur
al
wat
er in
frast
ruct
ure
incl
udin
g th
eir
func
tiona
l sta
tus?
Asse
t reg
iste
r an
d re
gula
r up
datin
g of
fu
nctio
nalit
y
Asse
t reg
iste
r bu
t no
upda
ting
of fu
nctio
nalit
y
Neith
er0.
5Th
ere
is n
o re
gula
r ass
et re
gist
er u
pdat
e of
rura
l wat
er in
frast
ruct
ure.
MRD
us
e w
ell l
og s
heet
for r
ecor
ding
func
tiona
lity
of n
ew w
ell i
nsta
lled
whi
ch
supp
orte
d by
pro
ject
but
not
regu
lar u
pdat
e. W
SP c
olla
bora
tion
with
MRD
ha
s es
tabl
ishe
d th
e Ca
mbo
diaw
ellm
ap in
201
0 an
d th
is p
latfo
rm w
ill be
tra
nsfo
rmed
for f
utur
e w
ater
sup
ply
mon
itorin
g sy
stem
.
1. C
ambo
dia
wel
lmap
2. N
atio
nal
Wel
log
Shee
t
Mai
nten
ance
RWS
21Co
st re
cove
ryIs
ther
e a
natio
nal p
olic
y on
O&M
cos
ts a
nd a
re
O&M
cos
ts k
now
n an
d co
vere
d fro
m s
ubsi
dies
an
d/or
use
r fee
s?
O&M
pol
icy
exis
ts, c
osts
are
as
sess
ed a
nd
>75
% c
over
ed
O&M
pol
icy
exis
ts, c
osts
ar
e es
timat
ed
and
>50
%
cove
red
No O
&M p
olic
y, co
sts
not k
now
n0
Ther
e is
no
deta
iled
polic
y on
O&M
cos
t. In
nat
iona
l stra
tegy
for r
ural
wat
er
supp
ly an
d sa
nita
tion
2011
-202
5 in
dica
ted
the
need
of e
stab
lishm
ent
the
guid
elin
e fo
r O&M
, and
the
need
to c
over
at l
east
O&M
by
user
fees
. M
RD h
as e
stab
lishe
d th
e W
SUG
in 2
004,
the
purp
ose
to g
ive o
wne
rshi
p to
wel
l use
r and
resp
onsi
ble
for O
&M b
ut th
ere
is n
o fo
llow
up
on th
e im
plem
enta
tion
and
stre
ngth
enin
g th
e W
SUG,
esp
ecia
lly w
hen
maj
or
repa
irs a
re n
eede
d. In
pra
ctic
e, th
e bu
dget
pro
posa
l to
inst
all n
ew w
ell a
lso
incl
udes
a re
habi
litat
ion
com
pone
nt, a
s w
ell a
s so
me
addi
tiona
l sup
port
to
mai
nten
ance
as
O&M
use
r fee
s ar
e of
ten
not c
olle
cted
1. C
onsu
ltativ
e W
orks
hop
on
Rura
l Wat
er
Supp
ly &
Sani
tatio
n2.
Gui
delin
e on
W
SUG
2004
Mai
nten
ance
RWS
22Sp
are
parts
cha
inIs
ther
e a
syst
em
defin
ed fo
r spa
re p
arts
su
pply
chai
n th
at is
ef
fect
ive in
all
plac
es?
Syst
ems
defin
ed
and
spar
es
avai
labl
e in
>
50%
of v
illage
s
Syst
ems
defin
ed b
ut
spar
es n
ot
avai
labl
e up
to
50%
of v
illage
s
Syst
ems
not
defin
ed
0Th
ere
is n
o co
mpr
ehen
sive
stu
dy o
n th
is is
sue
yet.
Curre
ntly,
the
supp
ly ch
ain
is ra
pidl
y gr
owin
g, M
RD h
as e
stab
lishe
d th
e ev
alua
tion
plat
form
to
eval
uate
and
reco
gnize
the
priva
te s
ecto
r (w
ell d
rille
r), s
o fa
r, th
ere
is 5
2 w
ell d
rille
rs h
as b
een
reco
gnize
d an
d ce
rtifie
d w
hich
nee
d re
eval
uatio
n ev
ery
2 ye
ar.
By e
stim
atio
n fro
m th
e gr
oup
disc
ussi
on h
as in
form
ed th
at th
e sp
are
pare
su
pply
chai
n is
ava
ilabl
e al
mos
t in
who
le d
istri
ct o
f the
pro
vince
but
mos
tly
supp
ly on
ly sm
all s
pare
par
t (pi
ped,
rubb
er v
alve
, lea
ther
val
ve) f
or p
ump
gene
rally
nee
d to
ord
er fr
om P
hnom
Pen
h m
arke
t thr
ough
the
wel
l dril
lers
. A
smal
l fun
ctio
nalit
y st
udy
in K
ampo
t dis
trict
(by
SNV)
sho
wed
that
80%
of
the
wel
ls w
ere
func
tioni
ng
Cons
ulta
tive
Wor
ksho
p on
Ru
ral W
ater
Su
pply
& Sa
nita
tion
Mai
nten
ance
RWS
23M
anag
emen
t of
Disa
ster
Ris
k an
d Cl
imat
e Ch
ange
Do ru
ral s
ervic
e pr
ovid
ers
have
pla
ns
for c
opin
g w
ith n
atur
al
disa
ster
s an
d cl
imat
e ch
ange
?
Yes,
the
maj
ority
of
rura
l ser
vice
prov
ider
s ha
ve a
pl
an fo
r dis
aste
r ris
k m
anag
emen
t an
d cl
imat
e ch
ange
No. O
nly
som
e se
rvic
e pr
ovid
ers
have
a
plan
for
disa
ster
risk
m
anag
emen
t an
d cl
imat
e ch
ange
or
mos
t ser
vice
prov
ider
s ha
ve
unde
rtake
n a
vuln
erab
ility
asse
ssm
ent.
No s
ervic
e pr
ovid
er h
as a
cl
imat
e ac
tion
plan
or h
as
unde
rtake
n a
vuln
erab
ility
asse
ssm
ent.
0Cl
imat
e ch
ange
is v
ery
new
issu
e fo
r Cam
bodi
a. N
atio
nal c
limat
e ch
ange
ad
apta
tion
plan
s ha
ve b
een
deve
lope
d, b
ut n
o sp
ecifi
c se
ctor
pla
n w
ith
resp
ect t
o w
ater
sup
ply
and
sani
tatio
n ha
s be
en d
evel
oped
yet
. How
ever
, re
cent
ly th
e se
ctor
is w
orki
ng o
n a
natio
nal r
ural
wat
er s
uppl
y em
erge
ncy
resp
onse
pla
ns fo
r floo
ds, w
hich
will
incr
ease
due
to th
e im
pact
of c
limat
e ch
ange
. At t
he ti
me
of th
e w
orks
hop
this
was
not
yet
issu
ed
Cons
ulta
tive
Wor
ksho
p on
Ru
ral W
ater
Su
pply
& Sa
nita
tion

Wat
er S
upp
ly a
nd S
anita
tion
in C
amb
odia
50
Build
ing
Bloc
kNo
Area
s of
ev
iden
ceIn
dica
tor q
uest
ion
High
(1)
Med
ium
(0.5
)Lo
w (0
)Sc
ore
Expl
anat
ion
for s
core
Sour
ce o
f ev
iden
ce
Expa
nsio
nRW
S 24
Inve
stm
ent
supp
ort
Are
pipe
d sy
stem
s in
ru
ral a
reas
reco
gnize
d as
man
agem
ent e
ntiti
es
and
give
n te
chni
cal
and
finan
cial
sup
port
to
expa
nd th
eir s
yste
ms
eith
er b
y go
vern
men
t or
larg
er u
tiliti
es?
Reco
gnize
d an
d su
ppor
ted
Reco
gnize
d bu
t no
t sup
porte
dNe
ither
0.5
MRD
reco
gnize
s th
e co
mm
unity
pip
ed w
ater
sup
ply
orga
niza
tions
and
to
oper
ate
thei
r bus
ines
s on
ly fo
r soc
ial p
urpo
ses
and
not f
or p
rofit
. The
y no
rmal
ly ar
e ci
=co
ncei
ved
as W
SUG
whi
ch m
ight
not
give
them
suf
ficie
nt
lega
l bas
is. M
RD h
as li
mite
d bu
dget
to s
uppo
rt th
e co
mm
unity
pip
ed w
ater
su
pply
for e
xten
sion
and
virtu
ally
no fu
nd fo
r tec
hnic
al s
uppo
rt. E
xpan
sion
s ar
e su
ppor
ted
by p
roje
ct fr
om d
evel
opm
ent p
artn
ers
such
as
Unic
ef, G
ret,
and
AFD…
etc.
Pip
ed w
ater
sys
tem
(<50
0HHs
) is
curre
ntly
not p
riorit
y te
chno
logy
inte
rven
tion
of M
RD a
s it
has
high
inve
stm
ent c
ost.
Cons
ulta
tive
Wor
ksho
p on
Ru
ral W
ater
Su
pply
& Sa
nita
tion
Expa
nsio
nRW
S 25
Plan
sAr
e th
ere
sche
me-
leve
l pl
ans
for t
he e
xpan
sion
of
pip
ed s
yste
ms
in
rura
l are
as?
Yes
in m
ost r
ural
ar
eas
Yes
in a
roun
d ha
lf of
rura
l ar
eas
In a
sm
all
prop
ortio
n, o
r no
rura
l are
as
0M
RD h
as n
o pl
an to
exp
ansi
on o
f pip
ed s
yste
m in
rura
l are
as y
et. C
urre
ntly,
M
RD is
impl
emen
ting
the
wat
er a
nd s
anita
tion
prog
ram
with
ADB
at
prov
ince
s su
rroun
ding
Ton
le S
ap.
No s
tudy
ahs
bee
n ca
rried
out
to in
vest
igat
e lo
nger
term
cos
t effe
ctive
ness
an
d su
stai
nabi
lity
of d
iffer
ent t
echn
olog
ies
Cons
ulta
tive
Wor
ksho
p on
Ru
ral W
ater
Su
pply
& Sa
nita
tion
Expa
nsio
nRW
S 26
Inve
stm
ent
finan
ceAr
e ex
pans
ion
cost
s fo
r rur
al w
ater
bei
ng
cove
red
by u
ser f
ees
and/
or p
ublic
gra
nts?
Yes
in m
ost r
ural
ar
eas
Yes
in a
roun
d ha
lf of
rura
l ar
eas
In a
sm
all
prop
ortio
n, o
r no
rura
l are
as
0Th
ere
is n
o co
mpr
ehen
sive
stu
dy o
n th
is is
sue
yet.
But i
t is
one
of b
ig
conc
ern
of M
RD, i
t hav
ing
seen
the
inve
stm
ent r
equi
red
a lo
t of b
udge
t and
m
ostly
the
com
mun
ity re
lies
on s
uppo
rt fro
m g
over
nmen
t or d
onor
s, u
nabl
e to
pro
vide
such
exp
ansi
ons
by th
emse
lves
Cons
ulta
tive
Wor
ksho
p on
Ru
ral W
ater
Su
pply
& Sa
nita
tion
User
Ou
tcom
esRW
S 27
Subs
ecto
r Is
the
subs
ecto
r on
track
to m
eet t
he s
tate
d ta
rget
?
On-t
rack
Off-
track
but
ke
epin
g up
w
ith p
opul
atio
n gr
owth
Off-
track
0.5
Base
d on
the
JMP
repo
rt, th
e ru
ral w
ater
sup
ply
for C
MDG
is o
n tra
ck b
ut
the
qual
ity a
nd s
usta
inab
ility
is s
till a
big
con
cern
. If f
ocus
on
the
sect
or
targ
et b
y 20
25, r
ural
wat
er s
uppl
y is
off
track
, but
incr
easi
ng.
1. J
MP
repo
rt up
date
d M
arch
20
122.
Con
sulta
tive
Wor
ksho
p on
Ru
ral W
ater
Su
pply
& Sa
nita
tion
User
Ou
tcom
esRW
S 28
prog
ress
Wha
t is
the
ratio
of
impr
oved
drin
king
w
ater
acc
ess
betw
een
the
low
est a
nd h
ighe
st
quin
tile
in ru
ral a
reas
?
Less
than
2
times
Betw
een
2 an
d 5
Mor
e th
an 5
tim
es1
The
ratio
of i
mpr
oved
acc
ess
quin
tile
is 4
3% v
ersu
s 36
% =
1.2
. How
ever
qu
intil
e fo
r pip
ed w
ater
is m
uch
mor
e un
equa
l., 7
% v
ersu
s 1%
.CS
ES 2
011
User
Ou
tcom
esRW
S 29
Equi
ty o
f use
Of th
e ho
useh
olds
usi
ng
an im
prov
ed d
rinki
ng
wat
er s
ourc
e, w
hat
prop
ortio
n ar
e us
ing
pipe
d dr
inki
ng w
ater
in
the
dwel
ling
and
yard
/pl
ot ?
Mor
e th
an 5
0%
of h
ouse
hold
sM
ore
than
25%
of
hou
seho
lds
Less
than
25%
of
hous
ehol
ds0
Base
d on
the
JMP
upda
te 2
014,
the
rura
l com
mun
ity a
cces
s to
pip
ed
wat
er s
uppl
y in
201
0 is
onl
y 5%
.JM
P 20
14
upda
te

Ser
vice
Del
iver
y A
sses
smen
t51
Build
ing
Bloc
kNo
Area
s of
ev
iden
ceIn
dica
tor q
uest
ion
High
(1)
Med
ium
(0.5
)Lo
w (0
)Sc
ore
Expl
anat
ion
for s
core
Sour
ce o
f ev
iden
ce
ENAB
LING
Polic
yUW
S1Se
ctor
targ
ets
Are
ther
e UW
S ac
cess
ta
rget
s in
the
natio
nal
leve
l dev
elop
men
t pla
n?
Yes,
ther
e ar
e ur
ban
wat
er
supp
ly ta
rget
s in
th
e de
velo
pmen
t pl
an
Ther
e ar
e na
tiona
l ta
rget
s in
the
deve
lopm
ent
plan
but
non
e fo
r urb
an w
ater
.
No ta
rget
s in
the
deve
lopm
ent p
lan
1Ur
ban
wat
er s
uppl
y se
ctor
has
a ta
rget
of 8
0% o
f urb
an w
ill re
ceive
im
prov
ed w
ater
ser
vice
in 2
015,
and
per
NSD
P 20
14-2
018
achi
eves
85%
of
pip
ed w
ater
sup
ply.
For 2
025,
MIH
info
rmal
targ
ets
are
set a
t 90%
pip
ed
acce
ss a
nd 2
00%
impr
oved
acc
ess.
1. N
SDP
2014
-20
182.
Con
sulta
tive
Wor
ksho
p on
Ur
ban
Wat
er
Supp
ly
Polic
yUW
S 2
Sect
or p
olic
yIs
ther
e an
urb
an w
ater
po
licy
that
is a
gree
d by
st
akeh
olde
rs, a
ppro
ved
by g
over
nmen
t, an
d pu
blic
ly av
aila
ble?
Polic
y of
ficia
lly
appr
oved
, and
pu
blic
ly av
aila
ble
Polic
y dr
afte
d an
d ag
reed
but
no
t offi
cial
ly ap
prov
ed
No p
olic
y0.
5Th
e go
vern
men
t has
a p
olic
y on
wat
er s
uppl
y an
d ur
ban
sani
tatio
n w
ith th
e pa
rtici
patio
n of
rele
vant
min
istri
es a
nd d
evel
opm
ent p
artn
ers
and
publ
ical
ly di
ssem
inat
ed in
200
3. B
ut th
e po
licy
is n
ot w
idel
y di
ssem
inat
ed. T
he p
olic
y is
ove
r 10
year
s ol
d an
d tim
e fo
r upd
atin
g to
mee
t the
dev
elop
men
t tre
nd
of th
e se
ctor
. A D
raft
law
for t
he w
ater
sec
tor w
as p
repa
red
in 2
005,
to
prov
ide
the
over
all l
egal
bas
is fo
r the
sec
tor,
but d
id n
ot g
et a
ppro
ved.
1. N
atio
nal
Polic
y on
Wat
er
and
Sani
tatio
n pu
blis
hed
by
gove
rnm
ent i
n 20
032.
Exp
erts
Op
inio
n
Polic
yUW
S 3
Inst
itutio
nal R
oles
Are
the
inst
itutio
nal
role
s of
urb
an w
ater
su
bsec
tor p
laye
rs
(nat
iona
l/sta
te &
loca
l go
vern
men
t, se
rvic
e pr
ovid
er, r
egul
ator
etc
) cl
early
defi
ned
and
oper
atio
naliz
ed?
Defin
ed a
nd
oper
atio
naliz
edDe
fined
but
not
op
erat
iona
lized
Not d
efine
d0.
5No
ove
rall
lega
l fra
mew
ork
is a
vaila
ble
for t
he s
ecto
r. Su
b-de
cree
No.
35
has
set r
oles
of t
he M
inis
try o
f Ind
ustry
, Min
es a
nd E
nerg
y an
d th
e ro
les
of
each
Dep
artm
ent,
the
Pota
ble
Wat
er S
uppl
y De
partm
ent i
s re
spon
sibl
e fo
r ur
ban
wat
er s
uppl
y se
ctor
. The
n, th
e M
inis
try’s
issu
ed th
e Pr
akas
No.
1029
on
the
oper
atio
n an
d fu
nctio
ning
of D
epar
tmen
t of W
ater
Sup
ply
on
Dece
mbe
r 22,
201
0. In
201
3, M
IME
has
been
spl
it up
and
Pot
able
Wat
er
Supp
ly ha
s be
en a
lloca
ted
to M
inis
try o
f Ind
ustry
and
han
dicr
aft.
The
role
s an
d re
spon
sibi
litie
s of
MIH
-DPW
S ar
e de
fined
but
due
to la
ck o
f fun
d an
d st
aff n
ot fu
lly o
pera
tiona
lized
. As
per t
he o
ngin
g D&
D pr
oces
s, th
e ro
les
of
sub-
natio
nal a
utho
rity
in w
ater
sup
ply
prov
isio
n is
als
o no
t wel
l defi
ned
Sub-
Degr
ee
No.3
5 pu
blis
hed
26 A
pril
1999
Plan
ning
UWS
4Fu
nd fl
ow
coor
dina
tion
Does
gov
ernm
ent
have
a p
roce
ss fo
r co
ordi
natin
g m
ultip
le
inve
stm
ents
in th
e su
bsec
tor (
dom
estic
or
don
or, e
g. N
atio
nal
gran
ts, s
tate
bud
gets
, do
nor l
oans
and
gra
nts
etc.
)?
Coor
dina
tion
proc
ess
defin
ed a
nd
oper
atio
naliz
ed
Coor
dina
tion
proc
ess
defin
ed b
ut n
ot
oper
atio
naliz
ed
Not d
efine
d/ n
o pr
oces
s0
Min
istry
of E
cono
my
and
Fina
nce
play
s le
ad ro
le in
fund
coo
rdin
atio
n fo
r gr
ants
and
loan
s fro
m d
onor
s, a
s w
ell a
s th
e CD
C. M
IH d
oes
not r
egul
arly
hold
sub
-TW
G m
eetin
gs to
sup
port
coor
dina
tion
of th
e se
ctor
; mos
t is
done
on
a b
ilate
ral o
r pro
ject
-by-
proj
ect b
asis
. How
ever
NSD
P 20
14-2
018
calls
fo
r wid
er s
trate
gic
refo
rm a
nd c
oord
inat
ion
on fu
nds
unde
r an
umbr
ella
in
vest
men
t pla
n.
1.TO
R of
CDC
2. T
OR o
f sub
-TW
G on
Urb
an
Wat
er S
uppl
y
Plan
ning
UWS
5In
vest
men
t pla
nIs
ther
e a
med
ium
term
in
vest
men
t pla
n fo
r ur
ban
wat
er b
ased
on
natio
nal t
arge
ts th
at
is c
oste
d, p
riorit
izes
inve
stm
ent n
eeds
, is
publ
ishe
d an
d us
ed?
Inve
stm
ent p
lan
base
d on
prio
rity
need
s ex
ists
, is
publ
ishe
d an
d us
ed
Exis
ts b
ut n
ot
used
, or u
nder
pr
epar
atio
n
Does
not
exis
t0
No m
ediu
m a
nd lo
ng te
rm in
vest
men
t for
the
sect
or is
yet
ava
ilabl
e,
with
cle
ar p
riorit
izatio
n an
d al
igne
d w
ith ta
rget
s. M
IH d
evel
ops
proj
ect
inve
stm
ent p
lan
(PIP
), w
hich
is n
ot a
sec
tor-
wid
e ap
proa
ch, b
ut a
pro
ject
ap
proa
ch, m
ostly
fund
ed th
roug
h do
nors
.
1. B
udge
t Boo
k 20
11-2
013
2. P
IP 2
012-
2014

Wat
er S
upp
ly a
nd S
anita
tion
in C
amb
odia
52
Build
ing
Bloc
kNo
Area
s of
ev
iden
ceIn
dica
tor q
uest
ion
High
(1)
Med
ium
(0.5
)Lo
w (0
)Sc
ore
Expl
anat
ion
for s
core
Sour
ce o
f ev
iden
ce
Plan
ning
UWS
6An
nual
revie
wIs
ther
e an
ann
ual m
ulti-
stak
ehol
der r
evie
w
in p
lace
to m
onito
r su
bsec
tor p
erfo
rman
ce,
to re
view
pro
gres
s an
d se
t cor
rect
ive a
ctio
ns?
Annu
al re
view
of
per
form
ance
an
d se
tting
of
corre
ctive
act
ions
Annu
al re
view
of
per
form
ance
bu
t no
setti
ng
of c
orre
ctive
ac
tions
No re
view
or
set
ting
of
corre
ctive
act
ions
0Th
e M
inis
try h
as S
ub-T
echn
ical
Wor
king
Gro
up, w
hich
can
be
a m
echa
nism
to
mon
itor o
n th
e en
tire
sect
or a
nd re
ports
to th
e TW
G on
Infra
stru
ctur
e an
d re
gion
al in
tegr
atio
n. H
owev
er, t
here
is n
ot y
et a
join
t ann
ual r
evie
w p
roce
ss
for t
he u
rban
wat
er s
ecto
r.
TOR
of s
ub-
wor
king
gro
up
on u
rban
wat
er
supp
ly
Plan
ning
UWS
7HR
Cap
acity
Has
an a
sses
smen
t be
en u
nder
take
n of
th
e hu
man
reso
urce
ne
eds
in th
e su
b se
ctor
to m
eet t
he
subs
ecto
r tar
get a
nd is
th
e ac
tion
plan
bei
ng
impl
emen
ted?
Asse
ssm
ent
unde
rtake
n an
d ac
tions
bei
ng
impl
emen
ted
Asse
ssm
ent
unde
rtake
n bu
t no
act
ion
bein
g ta
ken
No a
sses
smen
t un
derta
ken
0Re
view
and
eva
luat
ion
of th
e hu
man
reso
urce
s ne
eded
for w
orki
ng in
the
urba
n w
ater
sec
tor i
s no
t ava
ilabl
e ye
t. DP
WS
has
a pe
rson
al o
ffice
in
char
ge to
do
this
wor
k bu
t not
eno
ugh
capa
city
as
of y
et to
do
asse
ssm
ent
for s
ecto
r as
a w
hole
yet
.3
Wat
er S
uppl
y Ut
ilitie
s (K
ampo
ng T
hom
, Sie
m R
eap
and
Siha
nouk
ville
) ha
ve c
arrie
d ou
t stu
dies
on
hum
an re
sour
ces
deve
lopm
ent a
nd n
eed
asse
ssm
ent w
ith s
uppo
rt of
dev
elop
men
t par
tner
s. P
PWSA
has
dev
elop
ed
its o
wn
train
ing
cent
er in
sup
port
of o
ther
util
ity d
evel
opm
ent,
whi
ch is
ver
y po
sitiv
e st
ep fo
rwar
d
1. P
raka
s 10
29 o
n th
e es
tabl
ishm
ent o
f DP
WS
2. C
onsu
ltativ
e W
orks
hop
on
Urba
n W
ater
Su
pply
Budg
etUW
S 8
Adeq
uacy
Are
the
publ
ic fi
nanc
ial
com
mitm
ents
to th
e ur
ban
wat
er s
ubse
ctor
su
ffici
ent t
o m
eet t
he
natio
nal t
arge
ts fo
r the
su
bsec
tor?
Mor
e th
an
75%
of w
hat i
s ne
eded
Betw
een
50
and
75%
of
need
s
Less
than
50%
of
need
s0
DPW
S ha
s no
t rec
eive
d na
tiona
l bud
get f
or d
irect
cap
ital i
nves
tmen
t in
urb
an w
ater
sup
ply
sect
or, a
s th
is g
oes
dire
ctly
to th
e pr
ovin
cial
de
partm
ent t
hat a
re re
spon
sibl
e fo
r the
wat
er w
orks
. DPW
S on
ly re
ceive
s re
curre
nt b
udge
t for
ann
ual p
aym
ent.
Mos
t sec
tor i
nves
tmen
t dep
ends
on
deve
lopm
ent p
artn
er le
ndin
g an
d gr
ants
. SDA
cos
ting
illust
rate
s fin
anci
ng
gap
of U
S$33
milli
on p
er y
ear
1. B
udge
t Boo
k 20
11-2
013
2. P
IP 2
012-
2014
Budg
etUW
S 9
Stru
ctur
eDo
es th
e bu
dget
st
ruct
ure
perm
it in
vest
men
ts a
nd
subs
idie
s (o
pera
tiona
l co
sts,
adm
inis
tratio
n,
debt
ser
vice,
etc
) for
the
urba
n w
ater
sec
tor t
o be
cle
arly
iden
tified
?
Yes
for
inve
stm
ent a
nd
for s
ubsi
dies
Yes
for
inve
stm
ent b
ut
not s
ubsi
dies
No0.
5As
per
the
Natio
nal B
udge
t Law
, mul
ti-ye
ar b
udge
t sho
uld
show
the
sour
ce o
f inc
ome
from
ow
n so
urce
(sta
te in
com
e) a
nd in
com
e fro
m
exte
rnal
(inc
ludi
ng: i
nves
tmen
t sub
sidy
, bila
tera
l sub
sidy
, and
loan
s) a
nd
the
expe
nditu
re fo
r nat
iona
l lev
el (m
inis
tries
and
pro
vinci
al d
epar
tmen
ts),
and
the
expe
nditu
re fo
r sub
-nat
iona
l lev
el (i
nclu
ding
: city
, dis
trict
, san
gkat
/co
mm
une)
. The
law
als
o sp
ecifi
es th
e ca
pita
l exp
endi
ture
from
abr
oad
and
capi
tal i
nves
tmen
t with
the
avai
labl
e an
d no
t ava
ilabl
e bu
dget
. Rel
ated
to
the
reco
rds
of a
ll th
e m
ajor
sou
rce
of e
xter
nal i
ncom
e, th
e Co
unci
l for
th
e De
velo
pmen
t of C
ambo
dia
(CDC
) est
ablis
hed
the
ODA
data
base
for
deve
lopm
ent p
artn
ers
to p
rovid
e in
form
atio
n ab
out t
heir
inve
stm
ents
. Ho
wev
er, n
ot a
ll w
ater
wor
ks a
re a
ble
to fu
nd th
eir O
&M c
osts
fully
, and
the
trans
fer o
f sub
sidi
es in
to o
pera
tions
are
not
eas
ily id
entifi
able
1. O
DA
data
base
http
://cd
c.kh
mer
.biz
2. N
atio
nal
Budg
et L
aw
2009
-201
3
Budg
etUW
S 10
Com
preh
ensi
veDo
es th
e go
vern
men
t bu
dget
com
preh
ensi
vely
cove
r dom
estic
an
d of
ficia
l don
or
inve
stm
ent/s
ubsi
dy to
ur
ban
wat
er?
Mor
e th
an 7
5%
of fu
nds
to
subs
ecto
r on
budg
et
Betw
een
50-
75%
of f
unds
to
sub
sect
or o
n bu
dget
Less
than
50%
of
fund
s to
su
bsec
tor o
n bu
dget
1M
EF a
nd C
DC h
ad c
reat
ed O
DA m
anag
emen
t inf
orm
atio
n sy
stem
for
deve
lopm
ent p
artn
ers
repo
rt th
e am
ount
of f
und
and
thei
r pro
gram
s th
at a
re b
eing
impl
emen
ted.
Fun
ding
from
maj
or d
onor
s an
d m
ajor
ity
clea
rly re
cord
ed b
ut th
e bu
dget
for t
echn
ical
ass
ista
nce
not r
ecor
ded
com
preh
ensi
vely.
The
cap
ital i
nves
tmen
t dat
a fro
m m
ain
deve
lopm
ent
partn
ers
has
been
reco
rded
is o
ver 7
5% e
xcep
t the
som
e in
vest
men
t bu
dget
for t
echn
ical
ass
ista
nce
was
not
repo
rted.
Natio
nal B
udge
t: In
vest
men
t Bu
dget
201
1-20
13

Ser
vice
Del
iver
y A
sses
smen
t53
Build
ing
Bloc
kNo
Area
s of
ev
iden
ceIn
dica
tor q
uest
ion
High
(1)
Med
ium
(0.5
)Lo
w (0
)Sc
ore
Expl
anat
ion
for s
core
Sour
ce o
f ev
iden
ce
DEVE
LOPI
NG
Expe
nditu
reUW
S 11
Utiliz
atio
n of
do
mes
tic fu
nds
Wha
t per
cent
age
of d
omes
tic fu
nds
budg
eted
for u
rban
w
ater
are
spe
nt (3
yea
r av
erag
e)?
Over
75%
Betw
een
50%
an
d 75
%Le
ss th
an 5
0%1
The
natio
nal b
udge
t allo
cate
d to
MIH
is o
nly
recu
rrent
bud
get (
incl
udin
g sa
lary
, sub
sidy
& s
ocia
l fun
d), t
here
is n
o in
vest
men
t bud
get a
nd s
mal
l am
ount
allo
cate
d. B
ased
on
the
expe
nditu
re re
port
from
200
9-20
11, o
ver
90%
has
bee
n sp
ent.
Natio
nal B
udge
t: Do
mes
tic
Expe
nditu
re
Repo
rt 20
09-
2011
Expe
nditu
reUW
S 12
Utiliz
atio
n of
ex
tern
al fu
nds
Wha
t per
cent
age
of
exte
rnal
fund
s bu
dget
ed
for u
rban
wat
er a
re
spen
t (3
year
ave
rage
)?
Over
75%
Betw
een
50%
an
d 75
%Le
ss th
an 5
0%1
Each
pro
ject
has
pla
n an
d ag
reed
bet
wee
n th
e pr
ojec
t im
plem
ente
r and
do
nor.
Fund
ing
from
dev
elop
men
t par
tner
s / l
oan
is re
porte
d to
hav
e go
od
disb
urse
men
t rat
es, e
xcep
t for
som
e de
lays
in p
roje
ct s
tart
up.
Cons
ulta
tive
Wor
ksho
p on
Ur
ban
Wat
er
Supp
ly
Expe
nditu
reUW
S 13
Repo
rting
Do u
rban
util
ities
(n
atio
nal o
r 3 la
rges
t ut
ilitie
s) h
ave
audi
ted
acco
unts
and
bal
ance
sh
eet?
Audi
ted
acco
unts
an
d ba
lanc
e sh
eet
Bala
nce
shee
t bu
t not
aud
ited
No b
alan
ce s
heet
0Cu
rrent
ly th
e pr
oces
s of
repo
rting
on
expe
nditu
re d
oes
not i
nclu
de d
onor
pr
ojec
ts in
the
natio
nal c
hart
of a
ccou
nts.
Ex
pert
opin
ion
Equi
tyUW
S 14
Loca
l pa
rtici
patio
nAr
e th
ere
clea
rly
defin
ed p
roce
dure
s fo
r in
form
ing,
con
sulti
ng
with
and
sup
porti
ng
loca
l par
ticip
atio
n in
pl
anni
ng, b
udge
ting
and
impl
emen
ting
for u
rban
w
ater
dev
elop
men
ts?
Yes
and
syst
emat
ical
ly ap
plie
d
Yes,
but
not
sy
stem
atic
ally
appl
ied
No0
Ther
e is
thus
no
cons
olid
ated
aud
it re
port
for d
evel
opm
ent p
artn
er
spen
ding
but
eac
h pr
ojec
t fol
low
s th
e do
nor r
equi
red.
PPW
SA h
as
cons
olid
ated
aud
it re
port
sinc
e 10
yea
rs a
go. W
ith th
e au
tono
my
of fu
ture
pu
blic
wat
er w
orks
, all
of th
em s
houl
d be
pro
vided
aud
ited
acco
unts
as
per
the
law
on
Stat
e Ow
ned
Ente
rpris
es.
Cons
ulta
tive
Wor
ksho
p on
Ur
ban
Wat
er
Supp
ly
Equi
tyUW
S 15
Budg
et a
lloca
tion
crite
riaHa
ve c
riter
ia (o
r a
form
ula)
bee
n de
term
ined
to a
lloca
te
urba
n w
ater
fund
ing
equi
tabl
y to
urb
an
utilit
ies
or s
ervic
e pr
ovid
ers
and
amon
g m
unic
ipal
ities
and
is
it be
ing
cons
iste
ntly
appl
ied?
Yes,
app
lied
cons
iste
ntly
Yes,
but
no
t app
lied
cons
iste
ntly
No0
In p
artic
ular
, the
pub
lic w
ater
util
ities
do
thei
r ow
n pl
anni
ng a
nd re
spon
sibl
e fo
r ope
ratio
n an
d M
inis
try h
as ro
le o
f ove
rsig
ht.
Expe
rts o
pini
on
Equi
tyUW
S 16
Redu
cing
in
equa
lity
Have
urb
an u
tiliti
es
or s
ervic
e pr
ovid
ers
(nat
iona
l or i
n 3
larg
est
citie
s) d
evel
oped
and
im
plem
ente
d sp
ecifi
c pl
ans
for s
ervin
g th
e ur
ban
poor
?
Plan
s de
velo
ped
and
impl
emen
ted
Plan
s de
velo
ped
but n
ot
impl
emen
ted
No p
lans
do
cum
ente
d0
For t
he s
ecto
r as
a w
hole
ther
e ar
e no
spe
cific
pro
-poo
r pol
icie
s or
gu
idel
ines
/regu
latio
ns th
at p
ublic
or p
rivat
e ut
ilitie
s sh
ould
follo
w. P
PWSA
ha
s se
t 5%
of r
even
ue a
side
for a
soc
ial c
onne
ctio
n fu
nd. O
ther
don
ors
have
or w
ill be
pro
vidin
g ta
rget
ed s
ubsi
dies
to p
oor h
ouse
hold
s co
nnec
ting
( GRE
T, an
d AF
D) o
r set
-up
revo
lving
fund
s to
hel
p po
or p
eopl
e af
ford
able
ac
cess
to c
lean
wat
er (U
N Ha
bita
t)
Cons
ulta
tive
Wor
ksho
p on
Ur
ban
Wat
er
Supp
ly

Wat
er S
upp
ly a
nd S
anita
tion
in C
amb
odia
54
Build
ing
Bloc
kNo
Area
s of
ev
iden
ceIn
dica
tor q
uest
ion
High
(1)
Med
ium
(0.5
)Lo
w (0
)Sc
ore
Expl
anat
ion
for s
core
Sour
ce o
f ev
iden
ce
Outp
utUW
S 17
Quan
tity
Is th
e an
nual
exp
ansi
on
of H
H co
nnec
tions
and
st
and
post
s in
urb
an
area
s su
ffici
ent t
o m
eet
the
subs
ecto
r tar
gets
?
Over
75%
of t
hat
need
ed to
reac
h se
ctor
targ
ets
Over
50%
of
that
nee
ded
to
reac
h se
ctor
ta
rget
s
Less
than
50%
of
that
nee
ded
to re
ach
sect
or
targ
ets
0.5
The
Min
istry
has
set
targ
ets
to a
chie
ve u
rban
wat
er s
uppl
y 10
0% in
yea
r 20
25 w
hich
90%
is p
iped
wat
er s
uppl
y an
d 10
% o
ther
impr
oved
wat
er
sour
ces.
Bas
ed o
n th
e ab
ove
targ
ets
over
50,
000
new
con
nect
ions
hav
e to
be
put
in p
lace
ann
ually
, whi
le th
e cu
rrent
rate
is e
stim
ated
to b
e ar
ound
25
,000
ann
ually
.M
IH is
not
yet
abl
e to
fully
cap
ture
rele
vant
out
put d
ata
from
lice
nsed
wat
er
utilit
ies
due
to th
e ab
senc
e of
a m
onito
ring
syst
em. T
his
is c
urre
ntly
unde
r de
velo
pmen
t.
Cons
ulta
tive
Wor
ksho
p on
Ur
ban
Wat
er
Supp
ly
Outp
utUW
S 18
Qual
ity o
f wat
erAr
e th
ere
drin
king
wat
er
qual
ity s
tand
ards
for
urba
n w
ater
that
are
re
gula
rly m
onito
red
and
the
resu
lts p
ublis
hed?
Stan
dard
s ex
ist,
ther
e is
a
surv
eilla
nce
prog
ram
, and
re
sults
are
pu
blis
hed
Stan
dard
s ex
ist
and
ther
e is
a
surv
eilla
nce
prog
ram
but
th
ere
is n
o pu
blic
atio
n of
re
sults
No s
tand
ards
, or
sta
ndar
ds
exis
t but
are
not
m
onito
red
0.5
Ther
e is
a d
rinki
ng w
ater
qua
lity
stan
dard
(200
4), a
nd a
dra
ft fro
m 2
011
that
has
not
yet
bee
n si
gned
. Qua
rterly
wat
er q
ualit
y co
ntro
l is
supp
osed
to
be
done
by
DIH,
alth
ough
resu
lts a
re n
ot re
porte
d pu
blic
ly. T
his
will
be
incl
uded
in th
e fu
ture
mon
itorin
g sy
stem
Cons
ulta
tive
Wor
ksho
p on
Ur
ban
Wat
er
Supp
ly
Outp
utUW
S 19
Repo
rting
Is th
e nu
mbe
r of
addi
tiona
l hou
seho
ld
conn
ectio
ns m
ade
and
stan
d po
sts
cons
truct
ed
repo
rted
on in
a
cons
olid
ated
form
at fo
r th
e na
tion
each
yea
r?
Yes
with
full
listin
g of
co
nnec
tions
Yes
but w
ithou
t a
full
listin
g of
co
nnec
tions
No0.
5Al
l lic
ense
d (p
rivat
e an
d pu
blic
) util
ities
nee
d to
repo
rt an
nual
ly on
the
new
co
nnec
tion
but w
ithou
t a fu
ll lis
ting.
Not
all
licen
sed
oper
ator
s m
ay s
ubm
it da
ta. U
nlic
ense
d pr
ovid
ers
are
not b
eing
mon
itore
d ne
ither
on
conn
ectio
n no
r on
qual
ity s
tand
ard.
MM
E's
repo
rt on
con
nect
ion
2010
-201
2
SUST
AINI
NG
Mai
nten
ance
UWS
20Fu
nctio
nalit
yW
hat i
s th
e w
eigh
ted
aver
age
perc
enta
ge
of n
on re
venu
e w
ater
ac
ross
urb
an u
tiliti
es
(nat
iona
l or 3
larg
est
utilit
ies)
(las
t 3 y
ears
av
erag
e)?
Less
than
20%
20%
to 4
0%M
ore
than
40%
1Ba
sed
on th
e 3
year
repo
rt fro
m th
ree
mai
n w
ater
util
ities
(exc
ept f
rom
Ph
nom
Pen
h) (K
ampo
ng T
hom
, Sie
m R
eap,
Sih
anou
kville
) sho
w th
at th
e no
n-re
venu
e w
ater
is 1
6%
Repo
rt on
Non
-Re
venu
e w
ater
su
pply
from
3
utilit
ies
2010
-20
12
Mai
nten
ance
UWS
21Co
st re
cove
ryAr
e al
l O&M
cos
ts fo
r ut
ilitie
s (n
atio
nal o
r 3
larg
est u
tiliti
es) b
eing
co
vere
d by
reve
nues
(u
ser f
ees
and/
subs
idie
s) (l
ast 3
yea
rs
aver
age)
?
Oper
atin
g ra
tio
grea
ter t
han
1.2
Oper
atin
g ra
tio
betw
een
0.8
and
1.2
Oper
atin
g ra
tio
belo
w 0
.81
Base
d on
the
3 ye
ar fi
nanc
ial r
epor
t fro
m th
ree
mai
n w
ater
util
ities
(K
ampo
ng T
hom
, Sie
m R
eap,
Sih
anou
kville
) sho
w th
at th
e op
erat
ion
ratio
of
O&M
cos
t is
1.3
O&M
cos
t fro
m
3 ut
ilitie
s 20
10-
2012
Mai
nten
ance
UWS
22Ta
riff r
evie
ws
Are
tarif
f rev
iew
s re
gula
rly c
ondu
cted
us
ing
a pr
oces
s an
d ta
riffs
adj
uste
d ac
cord
ingl
y an
d pu
blis
hed?
Cond
ucte
d,
adju
sted
and
pu
blis
hed
Cond
ucte
d bu
t no
t adj
uste
dNo
t con
duct
ed0
Ther
e is
not
yet
a fo
rmal
regu
latio
n th
at d
efine
s th
e re
gula
tory
fram
ewor
k,
neith
er ta
riff m
etho
dolo
gy fo
r reg
ular
revie
w o
f bot
h pr
ivate
and
pub
lic
oper
ator
s. T
ariff
of P
PWSA
has
to b
e ap
prov
ed b
y th
e PM
.
Cons
ulta
tive
Wor
ksho
p on
Ur
ban
Wat
er
Supp
ly

Ser
vice
Del
iver
y A
sses
smen
t55
Build
ing
Bloc
kNo
Area
s of
ev
iden
ceIn
dica
tor q
uest
ion
High
(1)
Med
ium
(0.5
)Lo
w (0
)Sc
ore
Expl
anat
ion
for s
core
Sour
ce o
f ev
iden
ce
Mai
nten
ance
UWS
23M
anag
emen
t of
Disa
ster
Ris
k an
d Cl
imat
e Ch
ange
Do u
tiliti
es (n
atio
nal o
r 3
larg
est u
tiliti
es) h
ave
plan
s fo
r cop
ing
with
na
tura
l dis
aste
rs a
nd
clim
ate
chan
ge?
Yes,
the
maj
ority
of
urb
an s
ervic
e pr
ovid
ers
have
a
plan
for d
isas
ter
risk
man
agem
ent
and
clim
ate
chan
ge
No. O
nly
som
e se
rvic
e pr
ovid
ers
have
a
plan
for
disa
ster
risk
m
anag
emen
t an
d cl
imat
e ch
ange
or
mos
t ser
vice
prov
ider
s ha
ve
unde
rtake
n a
vuln
erab
ility
asse
ssm
ent.
No s
ervic
e pr
ovid
er h
as a
cl
imat
e ac
tion
plan
or h
as
unde
rtake
n a
vuln
erab
ility
asse
ssm
ent.
0No
Clim
ate
Chan
ge v
ulne
rabi
lity
plan
s ha
ve b
een
prep
ared
by
publ
ic u
tiliti
es
or M
IH.
Cons
ulta
tive
Wor
ksho
p on
Ur
ban
Wat
er
Supp
ly
Expa
nsio
nUW
S 24
Auto
nom
yDo
util
ities
or s
ervic
e pr
ovid
ers
(nat
iona
l or 3
la
rges
t) ha
ve o
pera
tiona
l de
cisi
on-m
akin
g au
tono
my
in in
vest
men
t pl
anni
ng, H
R, fi
nanc
e (s
epar
ate
bala
nce
shee
t) an
d pr
ocur
emen
t m
anag
emen
t?
Yes
in a
ll as
pect
sIn
all
aspe
cts
exce
pt
inve
stm
ent
plan
ning
No0
Pres
ently
ther
e ar
e on
ly tw
o au
tono
mou
s w
ater
sup
plie
s (P
hnom
Pen
h &
Siem
Rea
p). T
hese
aut
onom
ous
have
full
right
in o
pera
tion
and
inve
stm
ent
of th
e bu
sine
ss. T
hey
are
inde
pend
ently
mak
ing
plan
, inv
est a
nd a
cces
s lo
an to
exp
anse
the
busi
ness
. Oth
er p
ublic
wat
er w
orks
are
not
yet
au
tono
mou
s, a
nd a
lthou
gh w
ith o
pera
tiona
l dis
cret
ion,
the
inve
stm
ent
budg
ets
are
deliv
ered
thro
ugh
MIH
/DIH
, and
not
und
er fu
ll au
tono
my
of th
e ut
ility
Sub-
Degr
ee
on th
e es
tabl
ishm
ent
of a
uton
omou
s pu
blic
wat
er
utilit
y Ph
nom
Pe
nh a
nd S
iem
Re
ap
Expa
nsio
nUW
S 25
Plan
sDo
ser
vice
prov
ider
s (n
atio
nal/s
tate
or 3
la
rges
t util
ities
) hav
e bu
sine
ss p
lans
for
expa
ndin
g ac
cess
to
urba
n w
ater
?
Busi
ness
pla
ns
for i
ncre
asin
g ac
cess
bei
ng
impl
emen
ted
Busi
ness
pla
ns
for i
ncre
asin
g ac
cess
bei
ng
prep
ared
No b
usin
ess
plan
s0
All p
ublic
util
ities
hav
e an
nual
bus
ines
s pl
an (e
xpan
sion
pla
n) b
ut th
ere
mos
t of t
hem
hav
e no
long
term
bus
ines
s pl
an. E
xcep
t PPW
SA h
as lo
ng
term
bus
ines
s pl
an, b
eing
revie
wed
with
sup
port
from
ADB
. JIC
A is
als
o su
ppor
ting
long
er te
rm b
usin
ess
plan
ning
of a
few
pub
lic w
orks
.
Cons
ulta
tive
Wor
ksho
p on
Ur
ban
Wat
er
Supp
ly
User
Ou
tcom
esUW
S 26
Borro
win
gAr
e ut
ilitie
s al
low
ed
by la
w to
acc
ess
and
are
they
acc
essi
ng
com
mer
cial
fina
nce
for
expa
nsio
n?
Allo
wed
and
ac
cess
ing
Allo
wed
but
not
ac
cess
ing
Not a
llow
ed0
Refe
renc
e to
sub
-deg
ree
No.5
2 on
the
esta
blis
hmen
t of a
uton
omou
s w
ater
su
pply
in a
rticl
e 10
poi
nt 7
men
tione
d th
at th
e au
tono
mou
s ha
s rig
ht to
sel
l, bu
y, tra
de a
ll ki
nds
of p
rope
rty o
r sto
ck s
hare
and
allo
wed
to a
cces
s lo
an
for m
ediu
m a
nd lo
ng p
erio
d to
ope
rate
the
busi
ness
. The
aut
onom
ous
utilit
y an
acc
ess
loan
from
the
bank
onc
e th
ere
is a
ppro
val f
rom
BOD
, and
the
rest
can
not.
How
ever
, sin
ce m
any
publ
ic u
tiliti
es a
re n
ot y
et a
uton
omou
s an
d ha
s no
righ
t acc
essi
ng c
omm
erci
al fi
nanc
e th
e sc
ore
was
dec
ided
to
be 0
.
1. S
ub-D
egre
e No
.52
on th
e es
tabl
ishm
ent
of a
uton
omou
s w
ater
sup
ply.
2. E
xper
t Op
inio
n
User
Ou
tcom
esUW
S 27
Subs
ecto
r Is
the
subs
ecto
r on
track
to m
eet t
he s
tate
d ta
rget
?
On-t
rack
Off-
track
but
ke
epin
g up
w
ith p
opul
atio
n gr
owth
Off-
track
1M
IH ta
rget
s on
ly pi
ped
wat
er s
uppl
y as
the
natio
nal t
arge
t (85
% b
y 20
18)
and
seem
s on
trac
k w
ith c
urre
nt ra
te o
f pro
gres
s. T
he u
nive
rsal
acc
ess
targ
et fo
r im
prov
ed s
uppl
y is
on-
track
look
ing
at e
xistin
g tre
nd li
ne o
f JM
P da
ta.
JMP
Upda
te

Wat
er S
upp
ly a
nd S
anita
tion
in C
amb
odia
56
Build
ing
Bloc
kNo
Area
s of
ev
iden
ceIn
dica
tor q
uest
ion
High
(1)
Med
ium
(0.5
)Lo
w (0
)Sc
ore
Expl
anat
ion
for s
core
Sour
ce o
f ev
iden
ce
User
Ou
tcom
esUW
S 28
prog
ress
Wha
t is
the
ratio
of
impr
oved
drin
king
w
ater
acc
ess
betw
een
the
low
est a
nd h
ighe
st
quin
tile
in u
rban
are
as?
Less
than
2
times
Betw
een
2 an
d 5
Mor
e th
an 5
tim
es1
The
quin
tile
in u
rban
are
a is
96%
/61%
= 1
.57
for i
mpr
oved
wat
er s
uppl
y;
how
ever
pip
ed w
ater
sup
ply
is m
ore
uneq
ual w
ith 8
8% v
ersu
s 34
% (h
ence
la
rger
than
2)
CSES
201
1
User
Ou
tcom
esUW
S 29
Equi
ty o
f use
Wha
t is
the
aver
age
num
ber o
f hou
rs
of s
ervic
e pe
r day
ac
ross
urb
an u
tiliti
es?
(Wei
ghte
d by
num
ber
of H
H co
nnec
tions
per
ut
ility)
?
Mor
e th
an 1
2 ho
urs
per d
ay6
to 1
2 ho
urs
per d
ayLe
ss th
an 6
hou
rs
per d
ay1
All p
ublic
wat
er s
uppl
y pr
ovid
es a
n ov
er 1
7 ho
use
per d
ay, m
ost s
uppl
y 25
hr
s pe
r day
Over
view
on
Urba
n W
ater
Su
pply
Sect
or,
Janu
ary
2012
. TW
G -
JICA
ENAB
LING
Polic
y R
SH 1
Sect
or ta
rget
sAr
e th
ere
subs
ecto
r ta
rget
s in
the
natio
nal-
leve
l dev
elop
men
t pla
n?Fo
r hou
seho
lds
and
com
mun
ities
? Ar
e th
ere
ODF
targ
ets?
Targ
ets
for
rura
l hou
seho
ld
acce
ss a
nd
com
mun
ities
be
com
ing
ODF
in
the
deve
lopm
ent
plan
Targ
ets
for
rura
l hou
seho
ld
acce
ss in
the
deve
lopm
ent
plan
No ru
ral s
anita
tion
targ
ets
in th
e de
velo
pmen
t pla
n
0.5
Ther
e is
a ta
rget
set
in N
SDP
for t
he ru
ral a
cces
s to
san
itatio
n 30
% in
20
15, 6
0% in
201
8 an
d 10
0% in
202
5. B
ut th
ere
are
no O
DF ta
rget
s1.
NSD
P 20
14-
2018
2. N
atio
nal
Stra
tegy
on
Rura
l Wat
er
Supp
ly an
d Sa
nita
tion
2011
-202
5,
MRD
Polic
yRS
H 2
Sect
or p
olic
yIs
ther
e a
rura
l sa
nita
tion
polic
y, th
at is
agr
eed
by
stak
ehol
ders
, app
rove
d by
gov
ernm
ent,
and
publ
ical
ly av
aila
ble?
Polic
y of
ficia
lly
appr
oved
and
pu
blic
ally
avai
labl
e
Polic
y dr
afte
d an
d ag
reed
but
no
t offi
cial
ly ap
prov
ed
No p
olic
y1
Ther
e is
nat
iona
l pol
icy
on ru
ral w
ater
sup
ply
and
sani
tatio
n, th
e po
licy
was
est
ablis
hed
by th
e go
vern
men
t and
pub
lical
ly di
ssem
inat
ed in
200
3.
The
polic
y w
as e
ngag
ed w
ith a
ll st
akeh
olde
rs in
the
sect
or in
clud
ing
deve
lopm
ent p
artn
ers,
lead
ing
sect
or a
genc
ies,
and
line
min
istri
es. A
s an
ove
rall
polic
y in
stru
men
ts th
e di
rect
ions
are
stil
l val
id, h
owev
er, t
he
impl
emen
tatio
n is
lagg
ing.
Natio
nal P
olic
y on
Wat
er S
uppl
y an
d Sa
nita
tion
2003

Ser
vice
Del
iver
y A
sses
smen
t57
Build
ing
Bloc
kNo
Area
s of
ev
iden
ceIn
dica
tor q
uest
ion
High
(1)
Med
ium
(0.5
)Lo
w (0
)Sc
ore
Expl
anat
ion
for s
core
Sour
ce o
f ev
iden
ce
Polic
yRS
H 3
Inst
itutio
nal R
oles
Are
the
inst
itutio
nal
role
s of
rura
l san
itatio
n su
bsec
tor p
laye
rs
(nat
iona
l/sta
te &
loca
l go
vern
men
t, se
rvic
e pr
ovid
er, r
egul
ator
etc
) cl
early
defi
ned
and
oper
atio
naliz
ed?
Defin
ed a
nd
oper
atio
naliz
edDe
fined
but
not
op
erat
iona
lized
Not d
efine
d1
Ther
e is
ove
rall
stat
emen
t on
the
role
s an
d re
spon
sibi
litie
s w
ere
defin
ed
from
nat
iona
l to
sub-
natio
nal l
evel
. Acc
ordi
ng to
the
D&D
lega
l fra
mew
ork,
lo
cal a
utho
rity
is th
e en
tity
to ta
ke le
ad o
f loc
al d
evel
opm
ent a
nd d
evel
op
shor
t ter
m, m
ediu
m a
nd lo
ng te
rm p
lan.
. The
impl
emen
tatio
n of
D&D
re
form
is s
till l
imite
d, a
lthou
gh ru
ral s
anita
tion
is n
ow fo
rmal
ly pr
opos
ed to
be
ass
igne
d to
sub
-nat
iona
l aut
horit
y. Th
ere
are
man
y ac
tors
in th
e ru
ral
wat
er s
uppl
y se
ctor
. MRD
has
no
effe
ctive
coo
rdin
atio
n st
rate
gy to
wor
k w
ith re
leva
nt m
inis
tries
, dev
elop
men
t par
tner
s, N
GO y
et. T
his
is m
aybe
due
to
lim
ited
supp
ort f
rom
pol
itica
l, la
ck o
f ins
titut
iona
l cap
acity
, ins
uffic
ient
bu
dget
allo
catio
ns to
spe
cific
sec
tor i
nstit
utio
n. A
lthou
gh th
ere
is P
raka
s on
the
esta
blis
hmen
t of D
RHC,
PDR
D an
d DO
RD b
ut n
o de
taile
d Te
rm o
f Re
fere
nce
are
deve
lope
d.
1. G
uide
line
of C
CWC
July
2010
2. V
DC
esta
blis
hed
2010
3. P
raka
s es
tabl
ishm
ent o
f DR
HC4.
Pra
kas
esta
blis
hmen
t of
PDR
D an
d DO
RD5.
Rol
es a
nd
Resp
onsi
bilit
es
of D
RHC
6. M
RD
Func
tiona
l re
view
Rep
ort
2014
Plan
ning
RSH
4Fu
nd fl
ow
coor
dina
tion
Does
gov
ernm
ent
have
a p
roce
ss fo
r co
ordi
natin
g m
ultip
le
inve
stm
ents
in th
e su
bsec
tor (
dom
estic
or
don
or, e
g. n
atio
nal
gran
ts, s
tate
bud
gets
, do
nor l
oans
and
gr
ants
etc
)? S
tate
bu
dget
s=lo
cal
gove
rnm
ent b
udge
ts
Coor
dina
tion
proc
ess
defin
ed a
nd
oper
atio
naliz
ed
Coor
dina
tion
proc
ess
defin
ed b
ut n
ot
oper
atio
naliz
ed
Not d
efine
d/ n
o pr
oces
s0.
5Th
e m
inis
try’s
pro
cess
is b
ased
on
the
prio
rity
activ
ity a
nd a
t pro
ject
leve
l on
ly. M
inis
try h
as te
ams
coor
dina
ting
mul
tiple
inve
stm
ent b
udge
t bas
ed
on th
e pr
iorit
y ne
eds/
proj
ects
. But
ther
e is
no
sect
or-w
ide
prog
ram
mat
ic
appr
oach
yet
bas
ed o
n a
natio
nal a
ctio
n pl
an. N
orm
ally
the
min
istry
cre
ates
pr
ojec
t man
agem
ent u
nit (
PMU)
to c
oord
inat
e an
y in
vest
men
t pro
ject
. M
RD a
lso
sign
s M
OU w
ith th
e NG
O an
d DP
to im
prov
e co
ordi
natio
n, b
ut
no s
yste
mat
ic s
yste
m is
in p
lace
that
trac
ks a
nd c
oord
inat
es fu
nd fl
ow o
f do
mes
tic s
ourc
es, d
evel
opm
ent p
artn
ers
that
are
cha
nnel
ling
thro
ugh
the
budg
et, a
nd N
GOs
that
exe
cute
d th
roug
h pa
ralle
l mec
hani
sms.
MRD
has
th
e TW
G-RW
SS w
hich
is th
e pl
atfo
rm to
coo
rdin
ate
deve
lopm
ent p
artn
ers
and
gove
rnm
ent p
rogr
am a
nd p
olic
ies,
but
so
far i
t doe
s no
t sup
port
the
coor
dina
tion
of fu
ndin
g to
the
sect
or. F
und
flow
is b
ilate
rally
coo
rdin
ated
be
twee
n M
EF, M
RD a
nd D
Ps. C
oord
inat
ion
at C
ambo
dia
Deve
lopm
ent
Coun
cil (
CDC)
leve
l is
happ
enin
g to
a li
mite
d ex
tent
. The
re is
ann
ual C
DC
Foru
m w
hich
is th
e hi
ghes
t lev
el p
latfo
rm fo
r gat
herin
g al
l DPs
to lo
ok a
t pr
iorit
y de
velo
pmen
t pro
gram
pro
pose
d by
the
gove
rnm
ent,
how
ever
has
no
t tak
en p
lace
in re
cent
yea
rs.
Cons
ulta
tive
Wor
ksho
p on
Ru
ral W
ater
Su
pply
& Sa
nita
tion

Wat
er S
upp
ly a
nd S
anita
tion
in C
amb
odia
58
Build
ing
Bloc
kNo
Area
s of
ev
iden
ceIn
dica
tor q
uest
ion
High
(1)
Med
ium
(0.5
)Lo
w (0
)Sc
ore
Expl
anat
ion
for s
core
Sour
ce o
f ev
iden
ce
Plan
ning
RSH
5In
vest
men
t Pla
nIs
ther
e a
med
ium
term
in
vest
men
t pla
n fo
r ru
ral s
anita
tion
base
d on
nat
iona
l tar
gets
that
is
cos
ted,
prio
ritize
s in
vest
men
t nee
ds, i
s pu
blis
hed
and
used
?
Inve
stm
ent p
lan
base
d on
prio
rity
need
s ex
ists
, is
publ
ishe
d an
d us
ed
Exis
ts b
ut n
ot
used
, or u
nder
pr
epar
atio
n
Does
not
exis
t0.
5Th
ere
is p
ublic
inve
stm
ent p
lan
(PIP
) for
5 y
ear –
with
a 3
yea
r rol
ling
plan
, not
link
ed to
the
sect
or ta
rget
. It h
as b
een
deve
lope
d ba
sed
on th
e an
nual
bud
get a
lloca
ted
to th
e de
partm
ent.
The
PIP
was
don
e w
ithou
t nee
d as
sess
men
t and
the
qual
ity is
lim
ited.
M
EF h
as e
ncou
rage
d to
MRD
sho
uld
deve
lop
PIP
even
thou
gh M
EF m
ight
no
t abl
e to
pro
vide
full
fund
ing
but i
t is
usef
ul in
form
atio
n fo
r MEF
kne
w
wha
t is
the
need
s an
d he
lp fi
ndin
g th
e de
velo
pmen
t par
tner
s.
.
1. S
ecto
r In
vest
men
t Pla
n 20
05-2
015.
Pa
ge8
2. B
udge
t St
rate
gic
Plan
20
12-2
014
3. D
RHC’
s PI
P 20
09-2
013
Plan
ning
RSH
6An
nual
revie
wIs
ther
e a
annu
al m
ulti-
stak
ehol
der r
evie
w
in p
lace
to m
onito
r su
bsec
tor p
erfo
rman
ce,
to re
view
pro
gres
s an
d se
t cor
rect
ive a
ctio
ns?
Revie
w o
f pe
rform
ance
an
d se
tting
of
corre
ctive
act
ions
Revie
w o
f pe
rform
ance
bu
t no
setti
ng
of c
orre
ctive
ac
tions
No re
view
or
set
ting
of
corre
ctive
act
ions
0.5
MRD
has
est
ablis
hed
TWG-
RWSS
H on
rura
l wat
er s
uppl
y an
d sa
nita
tion.
Th
e m
ain
role
s of
TW
G ar
e to
follo
w u
p th
e pr
ogre
ss o
f the
sec
tor t
hrou
gh
quar
terly
mee
tings
and
coo
rdin
ate
stra
tegi
c in
puts
from
dev
elop
men
t pa
rtner
s. S
ecre
taria
t is
unde
rsta
ffed,
and
no
annu
al s
ecto
r rev
iew
take
s pl
ace.
The
re is
no
asse
ssm
ent f
or c
orre
ctive
mea
sure
of t
he s
ecto
r pe
rform
ance
. Joi
nt M
onito
ring
Indi
cato
rs o
f the
TW
G re
flect
som
e ac
tiviti
es
betw
een
gove
rnm
ent a
nd D
P, bu
t sec
tor m
onito
ring
syst
em is
abs
ent.
Ther
e is
WAS
H co
ordi
natio
n m
eetin
g, w
ith s
ub-g
roup
s, th
at s
uppo
rts in
form
atio
n sh
arin
g, b
ut th
ey h
ave
limite
d in
volve
men
t in
TWG.
MOP
lead
s a
mid
-ter
m re
view
of N
SDP
for a
ll se
ctor
s.
Cons
ulta
tive
Wor
ksho
p on
Ru
ral W
ater
Su
pply
& Sa
nita
tion
Plan
ning
RSH
7HR
Cap
acity
Has
an a
sses
smen
t be
en u
nder
take
n of
th
e hu
man
reso
urce
ne
eds
in th
e su
b se
ctor
to m
eet t
he
subs
ecto
r tar
get a
nd is
th
e ac
tion
plan
bei
ng
impl
emen
ted?
Asse
ssm
ent
unde
rtake
n an
d ac
tions
bei
ng
impl
emen
ted
Asse
ssm
ent
unde
rtake
n bu
t no
act
ion
bein
g ta
ken
No a
sses
smen
t un
derta
ken
0Fo
r the
dev
elop
men
t of t
he n
atio
nal s
trate
gy fo
r rur
al w
ater
sup
ply
and
sani
tatio
n, H
R ne
eds
wer
e id
entifi
ed b
ut n
ot s
peci
fic ty
pe o
f ski
ll. On
ly th
e re
sour
ce n
eeds
at l
ocal
leve
l wer
e m
entio
ned.
Rec
ruitm
ent p
roce
sses
w
ithin
MRD
nee
d M
EF a
ppro
val a
nd d
o no
t nec
essa
rily
refle
ct s
kill
requ
irem
ents
. Fun
ctio
nal m
appi
ng re
ports
wea
knes
ses
in s
taffi
ng, i
n qu
antit
y an
d qu
ality
.
1. N
atio
nal
Stra
tegy
For
Ru
ral W
ater
Su
pply
and
Sani
tatio
n 20
11-2
025
2. F
unct
iona
l Re
port
of th
e M
RD 2
010
Budg
etRS
H 8
Adeq
uacy
(of
finan
cing
)Ar
e th
e pu
blic
fina
ncia
l co
mm
itmen
ts to
th
e ru
ral s
anita
tion
subs
ecto
r suf
ficie
nt
to m
eet t
he n
atio
nal
targ
ets
for t
he
subs
ecto
r?
Mor
e th
an
75%
of w
hat i
s ne
eded
Betw
een
50-
75%
of n
eeds
Less
than
50%
of
need
s0
The
natio
nal s
trate
gy c
lear
ly de
fined
the
need
of fi
nanc
ing
yet b
ut
addr
esse
d th
at la
ck o
f fina
ncin
g. S
DA e
stim
ate
clea
rly s
peci
fy a
gap
of
US$6
milli
on a
nnua
lly, h
owev
er w
ith a
ver
y hi
gh re
lianc
e of
US$
24 m
illion
fro
m h
ouse
hold
s th
at w
ill re
quire
muc
h hi
gher
fund
s fo
r sof
twar
e an
d op
erat
iona
l cos
ts to
act
ually
mat
eria
lize.
Fun
ding
of s
oftw
are,
dem
and
prom
otio
n an
d ot
her o
pera
tiona
l cos
t are
sev
erel
y in
adeq
uate
. Par
tner
m
appi
ng re
port
for t
he ru
ral w
ater
sup
ply
and
sani
tatio
n se
ctor
sho
wed
that
de
velo
pmen
t par
tner
and
NGO
sup
port
allo
cate
d fo
r per
iod
of 2
009-
2015
is
aro
und
$15
milli
on p
er y
ear (
incl
udes
sof
twar
e, h
ardw
are
and
prog
ram
co
sts)
, alth
ough
with
an
incr
easi
ng a
lloca
tion
to s
anita
tion,
alth
ough
ofte
n im
plem
ente
d no
t thr
ough
gov
ernm
ent
1. S
DA fi
nanc
ial
anal
ysis
: bud
get
2. P
artn
er
map
ping
repo
rt 20
13
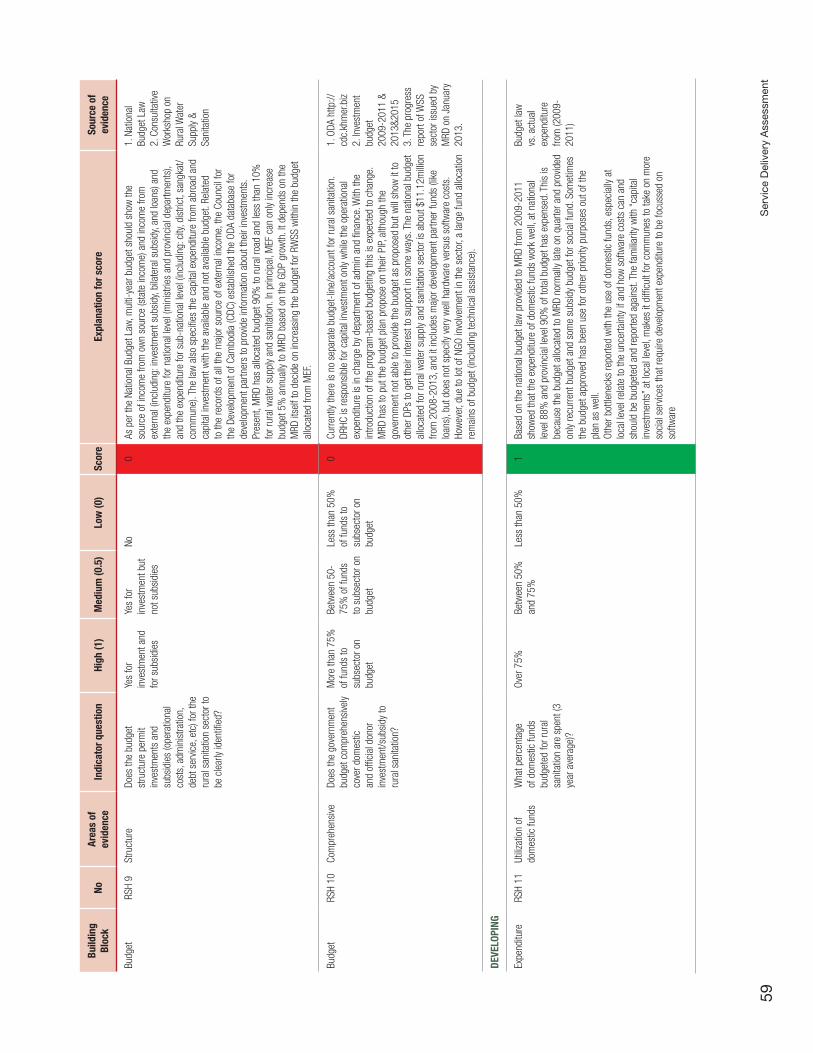
Ser
vice
Del
iver
y A
sses
smen
t59
Build
ing
Bloc
kNo
Area
s of
ev
iden
ceIn
dica
tor q
uest
ion
High
(1)
Med
ium
(0.5
)Lo
w (0
)Sc
ore
Expl
anat
ion
for s
core
Sour
ce o
f ev
iden
ce
Budg
etRS
H 9
Stru
ctur
eDo
es th
e bu
dget
st
ruct
ure
perm
it in
vest
men
ts a
nd
subs
idie
s (o
pera
tiona
l co
sts,
adm
inis
tratio
n,
debt
ser
vice,
etc
) for
the
rura
l san
itatio
n se
ctor
to
be c
lear
ly id
entifi
ed?
Yes
for
inve
stm
ent a
nd
for s
ubsi
dies
Yes
for
inve
stm
ent b
ut
not s
ubsi
dies
No0
As p
er th
e Na
tiona
l Bud
get L
aw, m
ulti-
year
bud
get s
houl
d sh
ow th
e so
urce
of i
ncom
e fro
m o
wn
sour
ce (s
tate
inco
me)
and
inco
me
from
ex
tern
al (i
nclu
ding
: inv
estm
ent s
ubsi
dy, b
ilate
ral s
ubsi
dy, a
nd lo
ans)
and
th
e ex
pend
iture
for n
atio
nal l
evel
(min
istri
es a
nd p
rovin
cial
dep
artm
ents
), an
d th
e ex
pend
iture
for s
ub-n
atio
nal l
evel
(inc
ludi
ng: c
ity, d
istri
ct, s
angk
at/
com
mun
e). T
he la
w a
lso
spec
ifies
the
capi
tal e
xpen
ditu
re fr
om a
broa
d an
d ca
pita
l inv
estm
ent w
ith th
e av
aila
ble
and
not a
vaila
ble
budg
et. R
elat
ed
to th
e re
cord
s of
all
the
maj
or s
ourc
e of
ext
erna
l inc
ome,
the
Coun
cil f
or
the
Deve
lopm
ent o
f Cam
bodi
a (C
DC) e
stab
lishe
d th
e OD
A da
taba
se fo
r de
velo
pmen
t par
tner
s to
pro
vide
info
rmat
ion
abou
t the
ir in
vest
men
ts.
Pres
ent,
MRD
has
allo
cate
d bu
dget
90%
to ru
ral r
oad
and
less
than
10%
fo
r rur
al w
ater
sup
ply
and
sani
tatio
n. In
prin
cipa
l, M
EF c
an o
nly
incr
ease
bu
dget
5%
ann
ually
to M
RD b
ased
on
the
GDP
grow
th. I
t dep
ends
on
the
MRD
itse
lf to
dec
ide
on in
crea
sing
the
budg
et fo
r RW
SS w
ithin
the
budg
et
allo
cate
d fro
m M
EF.
1. N
atio
nal
Budg
et L
aw2.
Con
sulta
tive
Wor
ksho
p on
Ru
ral W
ater
Su
pply
& Sa
nita
tion
Budg
etRS
H 10
Com
preh
ensi
ve
Does
the
gove
rnm
ent
budg
et c
ompr
ehen
sive
ly co
ver d
omes
tic
and
offic
ial d
onor
in
vest
men
t/sub
sidy
to
rura
l san
itatio
n?
Mor
e th
an 7
5%
of fu
nds
to
subs
ecto
r on
budg
et
Betw
een
50-
75%
of f
unds
to
sub
sect
or o
n bu
dget
Less
than
50%
of
fund
s to
su
bsec
tor o
n bu
dget
0Cu
rrent
ly th
ere
is n
o se
para
te b
udge
t-lin
e/ac
coun
t for
rura
l san
itatio
n.
DRHC
is re
spon
sibl
e fo
r cap
ital i
nves
tmen
t onl
y w
hile
the
oper
atio
nal
expe
nditu
re is
in c
harg
e by
dep
artm
ent o
f adm
in a
nd fi
nanc
e. W
ith th
e in
trodu
ctio
n of
the
prog
ram
-bas
ed b
udge
ting
this
is e
xpec
ted
to c
hang
e.
MRD
has
to p
ut th
e bu
dget
pla
n pr
opos
e on
thei
r PIP,
alth
ough
the
gove
rnm
ent n
ot a
ble
to p
rovid
e th
e bu
dget
as
prop
osed
but
will
show
it to
ot
her D
Ps to
get
thei
r int
eres
t to
supp
ort i
n so
me
way
s. T
he n
atio
nal b
udge
t al
loca
ted
for r
ural
wat
er s
uppl
y an
d sa
nita
tion
sect
or is
abo
ut $
11.1
2milli
on
from
200
8-20
13, a
nd it
incl
udes
maj
or d
evel
opm
ent p
artn
er fu
nds
(like
lo
ans)
, but
doe
s no
t spe
cify
ver
y w
ell h
ardw
are
vers
us s
oftw
are
cost
s.
How
ever
, due
to lo
t of N
GO in
volve
men
t in
the
sect
or, a
larg
e fu
nd a
lloca
tion
rem
ains
of b
udge
t (in
clud
ing
tech
nica
l ass
ista
nce)
.
1. O
DA h
ttp://
cdc.
khm
er.b
iz2.
Inve
stm
ent
budg
et
2009
-201
1 &
2013
&201
53.
The
pro
gres
s re
port
of W
SS
sect
or is
sued
by
MRD
on
Janu
ary
2013
.
DEVE
LOPI
NG
Expe
nditu
reRS
H 11
Utiliz
atio
n of
do
mes
tic fu
nds
Wha
t per
cent
age
of d
omes
tic fu
nds
budg
eted
for r
ural
sa
nita
tion
are
spen
t (3
year
ave
rage
)?
Over
75%
Betw
een
50%
an
d 75
%Le
ss th
an 5
0%1
Base
d on
the
natio
nal b
udge
t law
pro
vided
to M
RD fr
om 2
009-
2011
sh
owed
that
the
expe
nditu
re o
f dom
estic
fund
s w
ork
wel
l, at
nat
iona
l le
vel 8
8% a
nd p
rovin
cial
leve
l 90%
of t
otal
bud
get h
as e
xpen
sed.
Thi
s is
be
caus
e th
e bu
dget
allo
cate
d to
MRD
nor
mal
ly la
te o
n qu
arte
r and
pro
vided
on
ly re
curre
nt b
udge
t and
som
e su
bsid
y bu
dget
for s
ocia
l fun
d. S
omet
imes
th
e bu
dget
app
rove
d ha
s be
en u
se fo
r oth
er p
riorit
y pu
rpos
es o
ut o
f the
pl
an a
s w
ell.
Othe
r bot
tlene
cks
repo
rted
with
the
use
of d
omes
tic fu
nds,
esp
ecia
lly a
t lo
cal l
evel
rela
te to
the
unce
rtain
ty if
and
how
sof
twar
e co
sts
can
and
shou
ld b
e bu
dget
ed a
nd re
porte
d ag
ains
t. Th
e fa
milia
rity
with
“cap
ital
inve
stm
ents
” at l
ocal
leve
l, m
akes
it d
ifficu
lt fo
r com
mun
es to
take
on
mor
e so
cial
ser
vices
that
requ
ire d
evel
opm
ent e
xpen
ditu
re to
be
focu
ssed
on
softw
are
Budg
et la
w
vs. a
ctua
l ex
pend
iture
fro
m (2
009-
2011
)

Wat
er S
upp
ly a
nd S
anita
tion
in C
amb
odia
60
Build
ing
Bloc
kNo
Area
s of
ev
iden
ceIn
dica
tor q
uest
ion
High
(1)
Med
ium
(0.5
)Lo
w (0
)Sc
ore
Expl
anat
ion
for s
core
Sour
ce o
f ev
iden
ce
Expe
nditu
reRS
H 12
Utiliz
atio
n of
ex
tern
al fu
nds
Wha
t per
cent
age
of
exte
rnal
fund
s bu
dget
ed
for r
ural
san
itatio
n ar
e sp
ent (
3 ye
ar a
vera
ge)?
Over
75%
Betw
een
50%
an
d 75
%Le
ss th
an 5
0%1
Ther
e is
no
refe
renc
e do
cum
ent b
ut fr
om e
ach
depa
rtmen
t and
som
e de
velo
pmen
t par
tner
s lik
e Un
icef
, ADB
has
men
tione
d th
at th
e ex
tern
al fu
nd
spen
t on
time
and
at le
ast 7
5%. H
owev
er, n
orm
ally,
the
proj
ect s
tart
up is
sl
ow d
isbu
rsem
ent a
nd q
uick
afte
r the
pro
ject
sta
rted.
Mee
tings
Expe
nditu
reRS
H 13
Repo
rting
Is ru
ral s
anita
tion
expe
nditu
re v
ersu
s bu
dget
aud
ited
and
repo
rted
on in
a
cons
olid
ated
form
at fo
r al
l sou
rces
of d
omes
tic
and
offic
ial d
onor
ex
pend
iture
?
Yes
for d
omes
tic
and
dono
r ex
pend
iture
Yes
for
dom
estic
ex
pend
iture
No0
Ther
e is
no
cons
olid
ated
fina
ncia
l rep
ort f
or a
ll re
sour
ces.
In p
ract
ice
each
de
partm
ent h
as o
wn
finan
ce o
ffice
r and
repo
rt to
dep
artm
ent o
f fina
nce.
De
velo
pmen
t par
tner
exp
endi
ture
is n
ot in
clud
ed in
nat
iona
l cha
rt of
ac
coun
ts, a
nd th
us re
porti
ng is
inco
mpl
ete.
Cons
ulta
tive
Wor
ksho
p on
Ru
ral W
ater
Su
pply
& Sa
nita
tion
Equi
tyRS
H 14
Loca
l pa
rtici
patio
nAr
e th
ere
clea
rly
defin
ed p
roce
dure
s fo
r in
form
ing,
con
sulti
ng
with
and
sup
porti
ng
loca
l par
ticip
atio
n in
pl
anni
ng, b
udge
ting
and
impl
emen
ting
for r
ural
san
itatio
n de
velo
pmen
ts?
Yes
and
syst
emat
ical
ly ap
plie
d
Yes,
but
not
sy
stem
atic
ally
appl
ied
No0.
5Th
e pr
oced
ures
wer
e cl
early
defi
ned
from
nat
iona
l to
loca
l lev
el. P
rese
ntly
the
com
mun
e, d
istri
ct a
re d
evel
opin
g in
vest
men
t pla
n sa
nd re
ceive
an
allo
catio
n of
the
annu
al n
atio
nal b
udge
t to
impl
emen
t the
act
ivity
but
st
ill ve
ry s
mal
l am
ount
. Com
mun
es a
nd d
istri
cts
rece
ive fu
ndin
g (C
SF is
2.
8% o
f nat
iona
l rev
enue
), an
d D/
M fu
nd is
0.8
% o
f nat
iona
l rev
enue
DM
fu
nd) b
ased
on
allo
catio
n m
echa
nism
. So
far,
send
ing
on ru
ral w
ater
and
sa
nita
tion
is n
ot a
prio
rity
item
. Nat
iona
l fun
ding
thro
ugh
MRD
is a
lloca
ted
to d
iffer
ent P
DRD,
nor
mal
ly ba
sed
on th
e bo
ttom
-up
wor
k pl
an p
repa
ratio
n.
How
ever
pro
cedu
res
are
not s
tand
ardi
zed
and
syst
emat
ical
ly ap
plie
d
1. C
omm
une/
Sang
kat L
aw2.
Inve
stm
ent
Plan
of D
istri
ct
leve
l3.
Inve
stm
ent
Plan
of
Com
mun
e Le
vel
Equi
tyRS
H 15
Budg
et a
lloca
tion
crite
riaHa
ve c
riter
ia (o
r a
form
ula)
bee
n de
term
ined
to a
lloca
te
rura
l san
itatio
n fu
ndin
g eq
uita
bly
acro
ss ru
ral
com
mun
ities
and
is
it b
eing
app
lied
cons
iste
ntly?
Yes,
app
lied
cons
iste
ntly
Yes,
but
no
t app
lied
cons
iste
ntly
No0.
5Th
e na
tiona
l bud
get l
aw h
as th
e m
echa
nism
for a
lloca
tion
budg
et to
all
min
istri
es b
ased
on
the
GDP
grow
th a
nd p
riorit
ized
sect
ors.
MRD
is o
ne
of th
e pr
iorit
y m
inis
tries
. How
ever
, the
bud
get a
lloca
ted
from
MRD
to
subs
ecto
r has
no
crite
ria a
nd is
not
sys
tem
atic
ally
appl
ied.
WSS
rece
ived
less
than
10%
of t
otal
bud
get a
lloca
ted
to M
RD. T
here
is n
o do
cum
enta
tion
on th
e cr
iteria
(or f
orm
ula)
had
bee
n de
term
ine
but i
n pr
actic
e DR
WS
use
budg
et to
impl
emen
t the
act
ivity
by
rota
tion
met
hod.
The
foun
datio
n cr
iteria
ar
e po
pula
tion
dens
ity, p
over
ty ra
te, p
rese
nce
of N
GO/D
P, di
arrh
oea
rate
, re
mot
e ar
ea, a
nd lo
w W
SS c
over
age.
In s
trate
gy o
f rur
al w
ater
sup
ply
and
sani
tatio
n in
dica
tes
the
need
but
nee
d to
dev
elop
into
gui
delin
e.
Cons
ulta
tive
Wor
ksho
p on
Ru
ral W
ater
Su
pply
& Sa
nita
tion
Equi
tyRS
H 16
Redu
cing
in
equa
lity
Is th
ere
perio
dic
anal
ysis
to a
sses
s w
heth
er a
lloca
tion
crite
ria a
nd lo
cal
parti
cipa
tion
proc
edur
es
set b
y go
vern
men
t hav
e be
en a
dher
ed to
and
ar
e re
duci
ng d
ispa
ritie
s in
acc
ess?
Yes
perio
dic
anal
ysis
pu
blis
hed
and
acte
d up
on
Yes
perio
dic
anal
ysis
pu
blis
hed
but
not a
cted
upo
n
No0
Norm
ally
DRHC
and
PDR
D im
plem
ent t
he p
rogr
am b
ased
on
prio
rity
activ
ity a
nd o
n ad
hoc
man
ner b
ecau
se o
f lim
ited
natio
nal b
udge
t allo
cate
d co
mpa
re to
the
huge
nee
ds. P
rese
ntly,
at p
rovin
cial
leve
l doe
s no
t hav
e w
ell d
evel
oped
pla
ns a
ligne
d w
ith s
ecto
r tar
get.
Ther
e is
not
a lo
t of b
otto
m
up p
lann
ing
happ
enin
g w
ith d
istri
cts
and
com
mun
es, a
nd th
ere
are
no
syst
emat
ic re
view
s w
heth
er p
lan
and
impl
emen
tatio
n ar
e su
ppor
ting
the
redu
ctio
n of
ineq
ualit
ies,
als
o la
rgel
y du
e to
abs
ent m
onito
ring
syst
ems
Cons
ulta
tive
Wor
ksho
p on
Ru
ral W
ater
Su
pply
& Sa
nita
tion

Ser
vice
Del
iver
y A
sses
smen
t61
Build
ing
Bloc
kNo
Area
s of
ev
iden
ceIn
dica
tor q
uest
ion
High
(1)
Med
ium
(0.5
)Lo
w (0
)Sc
ore
Expl
anat
ion
for s
core
Sour
ce o
f ev
iden
ce
Outp
utRS
H 17
Quan
tity
Is th
e an
nual
exp
ansi
on
of ru
ral h
ouse
hold
s ga
inin
g ac
cess
to s
afe
sani
tatio
n su
ffici
ent
to m
eet t
he s
ubse
ctor
ta
rget
s?
Over
75%
of t
hat
need
ed to
reac
h se
ctor
targ
ets
Betw
een
75%
an
d 50
% o
f th
at n
eede
d to
ac
hiev
e ta
rget
s
Less
than
50%
of
that
nee
ded
to
reac
h ta
rget
s
0 D
RHC
has
no re
al-t
ime
relia
ble
M&E
sys
tem
to c
aptu
re th
e an
nual
in
crea
se a
nd u
sage
of i
mpr
oved
san
itatio
n, a
s w
ell a
s ve
rified
ODF
villa
ges.
Th
e ta
rget
of 1
00%
uni
vers
al a
cces
s w
ould
requ
ire a
n ac
cele
ratio
n in
the
num
ber o
f new
faci
litie
s th
at a
re d
evel
oped
, as
wel
l as
a ve
rifica
tion
and
follo
w-u
p pr
oces
s to
ens
ure
ODF
sust
aina
bilit
y. Ba
sed
on c
urre
nt tr
ends
, tre
nd n
eed
to a
ccel
erat
e 4-
5 fo
ld.
Cam
bodi
a M
&E S
ituat
ion
anal
ysis
for r
ural
W
ASH;
nat
iona
l su
rvey
dat
a CS
ES, D
HS
Outp
utRS
H 18
Capa
city
for
prom
otio
nIs
ther
e en
ough
cap
acity
-
staf
f, ex
perti
se, t
ools
, m
ater
ials
- to
del
iver
a sa
nita
tion
prog
ram
at
sca
le, u
sing
tailo
red
com
mun
ity-b
ased
and
/or
oth
er a
ppro
ache
s?
Yes,
cap
acity
ex
ists
and
ap
proa
ches
are
be
ing
used
at
scal
e
Gaps
in
capa
city
but
ap
proa
ches
ge
nera
lly b
eing
us
ed a
t sca
le
Defic
its in
ca
paci
ty a
nd n
o co
mm
unity
-bas
ed
appr
oach
es a
t sc
ale
0.5
Ther
e is
no
com
preh
ensi
ve s
tudy
the
need
of h
uman
reso
urce
s, s
kills
, an
d m
ater
ials
to im
plem
ent t
he p
rogr
am a
t sca
le y
et. C
apac
ity b
uild
ing
effo
rts a
re ta
ken
up b
y va
riety
of d
iffer
ent N
GOs
and
deve
lopm
ent p
artn
ers,
so
met
imes
usi
ng e
ach
othe
r’s m
ater
ials
. How
ever
ther
e is
no
natio
nal
capa
city
bui
ldin
g fra
mew
ork
or c
urric
ulum
that
is c
onsi
sten
tly u
sed,
nei
ther
is
ther
e an
ove
rarc
hing
Com
mun
icat
ions
stra
tegy
and
tool
s, th
at a
re w
idel
y ad
opte
d an
d en
dors
ed b
y M
RD. S
uch
natio
nal B
CC s
trate
gy is
now
in
deve
lopm
ent,
incl
udin
g th
e id
entifi
catio
n of
gap
s.
1. N
atio
nal
Stra
tegy
for
Rura
l Wat
er
Supp
ly,
Sani
tatio
n an
d Hy
gien
e 20
11-
2025
2. C
once
pt N
ote
on B
CC s
trate
gy
deve
lopm
ent
3. V
ario
us to
ols
and
mat
eria
ls
by d
iffer
ent
partn
ers
Outp
utRS
H 19
Repo
rting
Does
the
gove
rnm
ent
regu
larly
mon
itor a
nd
repo
rt on
pro
gres
s an
d qu
ality
of r
ural
sa
nita
tion
acce
ss,
incl
udin
g se
ttlem
ent-
wid
e sa
nita
tion,
and
di
ssem
inat
e th
e re
sults
?
Qual
ity,
quan
tity
and
diss
emin
ated
Qual
ity o
r qu
antit
yNe
ither
0Th
e DR
HC d
oes
not h
ave
M&E
sys
tem
in p
lace
to tr
ack
acce
ss a
nd O
DF
achi
evem
ent,
as w
ell a
s ot
her c
ritic
al m
anag
emen
t inf
orm
atio
n to
impr
ove
prog
ram
impl
emen
tatio
n. D
ata
is m
ainl
y re
ceive
d fro
m D
Ps &
NGO
s, K
AP
and
Cens
us/ S
urve
ys, w
here
defi
nitio
ns a
re n
ot a
lway
s w
ell a
ligne
d or
sa
mpl
e si
zes
are
smal
l and
pro
vide
no g
eogr
aphi
cal g
ranu
larit
y. Th
e CD
B ha
s sa
nita
tion
acce
ss b
ut is
repo
rtedl
y no
t a v
ery
accu
rate
sou
rce
and
only
upda
ted
annu
ally.
With
hel
p of
UNI
CEF,
GSF
and
WSP
, and
oth
er p
artn
ers
rura
l san
itatio
n m
onito
ring
syst
em w
ill be
dev
elop
ed
1. C
ambo
dia
M&E
Situ
atio
n an
alys
is fo
r rur
al
WAS
H;
SUST
AINI
NG
Mar
ket
RSH
20Su
pply-
chai
nDo
es th
e su
pply-
chai
n fo
r san
itatio
n pr
oduc
ts
mee
t hou
seho
ld n
eeds
(re
ady
avai
labi
lity,
quan
tity
and
cost
), sa
tisfy
gov
ernm
ent
stan
dard
s an
d re
ach
to
unse
rved
are
as?
Yes
for q
uant
ity,
cost
, sta
ndar
ds
and
reac
h
Yes,
but
not
for
all o
f qua
ntity
, co
st, s
tand
ards
an
d re
ach
No0.
5Th
e M
RD d
oes
not h
ave
stan
dard
for l
atrin
e de
sign
s, q
ualit
y le
vel o
f ser
vice.
Al
thou
gh im
porta
nt c
ost r
educ
tions
hav
e ta
ken
plac
e du
e to
inno
vatio
n of
sev
eral
NGO
s th
at a
re a
ctive
in s
anita
tion
mar
ketin
g, th
e pr
ice
and
unaf
ford
abilit
y of
a d
esira
ble
shel
ter a
re s
till b
arrie
rs. E
xper
ienc
e w
ith
mic
rofin
ance
pro
duct
s fo
r san
itatio
n is
em
ergi
ng, a
s af
ford
abilit
y is
stil
l a
big
chal
leng
e fo
r the
poo
r. As
per
the
estim
atio
n fro
m D
RHC,
san
itatio
n m
arke
ting
and
supp
ly ch
ain
supp
ort i
s no
w a
lmos
t rea
chin
g to
all
dist
rict
of15
0/18
5 to
tal d
istri
cts.
WSP
(201
4)
Less
ons
from
sa
nita
tion
loan
s th
roug
h M
icro
finan
ce
inst
itutio
nsGS
F (2
014)
Ev
alua
tion
of
mic
rofin
ance
fo
r san
itatio
n in
Ca
mbo
dia
.

Wat
er S
upp
ly a
nd S
anita
tion
in C
amb
odia
62
Build
ing
Bloc
kNo
Area
s of
ev
iden
ceIn
dica
tor q
uest
ion
High
(1)
Med
ium
(0.5
)Lo
w (0
)Sc
ore
Expl
anat
ion
for s
core
Sour
ce o
f ev
iden
ce
Mar
ket
RSH
21Pr
ivate
sec
tor
capa
city
Is th
ere
suffi
cien
t m
ason
/arti
san/
smal
l bu
sine
ss c
apac
ity to
m
eet h
ouse
hold
nee
ds
(qua
ntity
, qua
lity
and
cost
)?
Yes
for q
uant
ity
and
cost
Yes,
for
quan
tity
but n
ot
for c
ost
Neith
er0.
5Th
e sa
nita
tion
prod
uct d
esig
n w
as d
riven
by
NGO
with
col
labo
ratio
n w
ith M
RD. S
calin
g up
of s
anita
tion
mar
ketin
g in
itiat
ives
have
sho
wn
that
bu
sine
ss c
apac
ity to
del
iver c
an b
e pa
tchy
and
som
etim
es in
suffi
cien
t to
del
iver o
n in
crea
sed
dem
and.
Priv
ate
sect
or re
mai
ns re
liant
to s
ome
exte
nt o
n ex
tern
al s
uppo
rt to
man
age
certa
in a
spec
ts o
f the
sup
ply
chai
n (s
ales
, coo
rdin
atio
n, e
tc.).
Fur
ther
cos
t red
uctio
ns, e
spec
ially
for s
helte
r or
solu
tions
, and
priv
ate
sect
or c
apac
ity (i
nclu
ding
mas
on) b
uild
ing
is e
xpec
ted
to b
e ne
eded
.
WSP
Les
sons
fro
m S
anita
tion
Mar
ketin
g in
Ca
mbo
dia
(201
3)W
SP S
anita
tion
Supp
ly an
d De
man
d as
sess
men
t (2
010)
Repo
rts b
y iD
E an
d W
ater
SHED
as
per
thei
r w
ebsi
tes
Mar
ket
RSH
22Pr
ivate
sec
tor
deve
lopm
ent
Does
the
gove
rnm
ent
have
pro
gram
s to
pr
omot
e an
d gu
ide
the
dom
estic
priv
ate
sect
or
and
faci
litat
e in
nova
tion
for t
he p
rovis
ion
of
sani
tatio
n se
rvic
es in
ru
ral a
reas
?
Yes,
with
var
ious
co
mpo
nent
sYe
s, b
ut
eith
er b
eing
de
velo
ped
or
has
gaps
No p
rom
otio
n,
guid
ance
or
enco
urag
emen
t
0.5
The
natio
nal p
olic
y on
rura
l wat
er s
uppl
y an
d sa
nita
tion
2003
add
ress
ed
the
impo
rtant
role
s of
priv
ate
sect
or in
dev
elop
men
t of t
he s
ecto
r. To
no
w, M
RD h
as n
o sp
ecifi
c m
echa
nism
to a
ttrac
t priv
ate
sect
or in
vest
in
the
sect
or y
et. H
owev
er, t
he g
over
nmen
t is
wor
king
with
NGO
par
tner
s pr
ovid
ing
tech
nica
l sup
port
and
capa
city
bui
ldin
g to
loca
l priv
ate
sect
or, a
nd
curre
ntly
a re
view
is o
ngoi
ng to
look
at t
he b
est o
ptio
ns a
nd p
latfo
rms
for
gove
rnm
ent t
o pr
oact
ively
faci
litat
e a
larg
er ro
le o
f priv
ate
sect
or a
ctor
s
Natio
nal p
olic
y on
rura
l wat
er
supp
ly an
d sa
nita
tion
2003
Dalb
erg
(201
4)
ince
ptio
n re
port
of s
anita
tion
mar
ketin
g re
view
; int
erim
re
port
Mar
ket
RSH
23M
anag
emen
t of
Disa
ster
Ris
k an
d Cl
imat
e Ch
ange
Do ru
ral s
ervic
e pr
ovid
ers
[loca
l go
vern
men
t ] h
ave
plan
s fo
r cop
ing
with
na
tura
l dis
aste
rs a
nd
clim
ate
chan
ge?
Yes,
the
maj
ority
of
rura
l ser
vice
prov
ider
s ha
ve a
pl
an fo
r dis
aste
r ris
k m
anag
emen
t an
d cl
imat
e ch
ange
No. O
nly
som
e se
rvic
e pr
ovid
ers
have
a
plan
for
disa
ster
risk
m
anag
emen
t an
d cl
imat
e ch
ange
or
mos
t ser
vice
prov
ider
s ha
ve
unde
rtake
n a
vuln
erab
ility
asse
ssm
ent.
No s
ervic
e pr
ovid
er h
as a
cl
imat
e ac
tion
plan
or h
as
unde
rtake
n a
vuln
erab
ility
asse
ssm
ent.
0.5
Natio
nal c
omm
ittee
for d
isas
ter m
anag
emen
t has
not
yet
bud
get a
lloca
ted
at lo
cal l
evel
to p
repa
re fo
r dis
aste
rs, b
ut o
nly
carri
es o
ut p
ost d
isas
ter
activ
ities
, inc
ludi
ng p
rovid
ing
WAS
H se
rvic
es in
em
erge
ncy
situ
atio
ns.
Priva
te s
ecto
r pro
vider
s ar
e ty
pica
lly n
ot v
ery
pres
ent i
n ar
eas
that
are
vu
lner
able
to s
ever
floo
ding
as
suita
ble
solu
tions
are
cos
tly, d
eman
d is
lo
w, a
nd k
now
ledg
e on
wha
t des
igns
wor
k w
ell i
s no
t wid
espr
ead.
Thi
s w
ill co
ntin
ue to
be
an a
rea
for f
utur
e in
vest
igat
ion,
as
flood
s ar
e lik
ely
to
incr
ease
due
to th
e im
pact
of c
limat
e ch
ange
Cons
ulta
tive
Wor
ksho
p on
Ru
ral W
ater
Su
pply
& Sa
nita
tion
Pres
enta
tions
pr
epar
ed o
n ch
alle
ngin
g En
viron
men
ts
as p
art o
f th
e W
ATSA
N co
ordi
natio
n m
eetin
g (ID
E,
Engi
neer
s W
ithou
t Bor
ders
, Li
ve a
nd L
earn
)
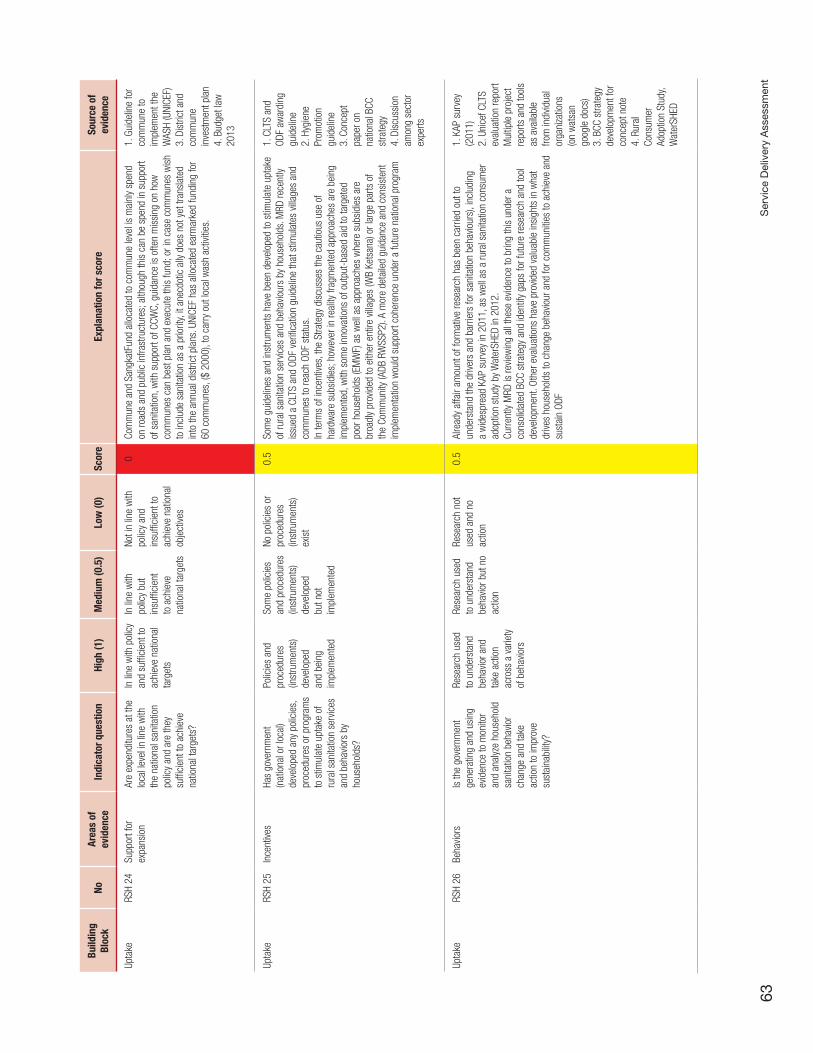
Ser
vice
Del
iver
y A
sses
smen
t63
Build
ing
Bloc
kNo
Area
s of
ev
iden
ceIn
dica
tor q
uest
ion
High
(1)
Med
ium
(0.5
)Lo
w (0
)Sc
ore
Expl
anat
ion
for s
core
Sour
ce o
f ev
iden
ce
Upta
keRS
H 24
Supp
ort f
or
expa
nsio
nAr
e ex
pend
iture
s at
the
loca
l lev
el in
line
with
th
e na
tiona
l san
itatio
n po
licy
and
are
they
su
ffici
ent t
o ac
hiev
e na
tiona
l tar
gets
?
In li
ne w
ith p
olic
y an
d su
ffici
ent t
o ac
hiev
e na
tiona
l ta
rget
s
In li
ne w
ith
polic
y bu
t in
suffi
cien
t to
ach
ieve
na
tiona
l tar
gets
Not i
n lin
e w
ith
polic
y an
d in
suffi
cien
t to
achi
eve
natio
nal
obje
ctive
s
0Co
mm
une
and
Sang
katF
und
allo
cate
d to
com
mun
e le
vel i
s m
ainl
y sp
end
on ro
ads
and
publ
ic in
frast
ruct
ures
; alth
ough
this
can
be
spen
d in
sup
port
of s
anita
tion,
with
sup
port
of C
CWC,
gui
danc
e is
ofte
n m
issi
ng o
n ho
w
com
mun
es c
an b
est p
lan
and
exec
ute
this
fund
; or i
n ca
se c
omm
unes
wis
h to
incl
ude
sani
tatio
n as
a p
riorit
y, it
anec
dotic
ally
doe
s no
t yet
tran
slat
ed
into
the
annu
al d
istri
ct p
lans
. UNI
CEF
has
allo
cate
d ea
rmar
ked
fund
ing
for
60 c
omm
unes
, ($
2000
), to
car
ry o
ut lo
cal w
ash
activ
ities
.
1. G
uide
line
for
com
mun
e to
im
plem
ent t
he
WAS
H (U
NICE
F)3.
Dis
trict
and
co
mm
une
inve
stm
ent p
lan
4. B
udge
t law
20
13
Upta
keRS
H 25
Ince
ntive
sHa
s go
vern
men
t (n
atio
nal o
r loc
al)
deve
lope
d an
y po
licie
s,
proc
edur
es o
r pro
gram
s to
stim
ulat
e up
take
of
rura
l san
itatio
n se
rvic
es
and
beha
viors
by
hous
ehol
ds?
Polic
ies
and
proc
edur
es
(inst
rum
ents
) de
velo
ped
and
bein
g im
plem
ente
d
Som
e po
licie
s an
d pr
oced
ures
(in
stru
men
ts)
deve
lope
d bu
t not
im
plem
ente
d
No p
olic
ies
or
proc
edur
es
(inst
rum
ents
) ex
ist
0.5
Som
e gu
idel
ines
and
inst
rum
ents
hav
e be
en d
evel
oped
to s
timul
ate
upta
ke
of ru
ral s
anita
tion
serv
ices
and
beh
avio
urs
by h
ouse
hold
s. M
RD re
cent
ly is
sued
a C
LTS
and
ODF
verifi
catio
n gu
idel
ine
that
stim
ulat
es v
illage
s an
d co
mm
unes
to re
ach
ODF
stat
us.
In te
rms
of in
cent
ives,
the
Stra
tegy
dis
cuss
es th
e ca
utio
us u
se o
f ha
rdw
are
subs
idie
s; h
owev
er in
real
ity fr
agm
ente
d ap
proa
ches
are
bei
ng
impl
emen
ted,
with
som
e in
nova
tions
of o
utpu
t-ba
sed
aid
to ta
rget
ed
poor
hou
seho
lds
(EM
WF)
as
wel
l as
appr
oach
es w
here
sub
sidi
es a
re
broa
dly
prov
ided
to e
ither
ent
ire v
illage
s (W
B Ke
tsan
a) o
r lar
ge p
arts
of
the
Com
mun
ity (A
DB R
WSS
P2).
A m
ore
deta
iled
guid
ance
and
con
sist
ent
impl
emen
tatio
n w
ould
sup
port
cohe
renc
e un
der a
futu
re n
atio
nal p
rogr
am
1. C
LTS
and
ODF
awar
ding
gu
idel
ine
2. H
ygie
ne
Prom
otio
n gu
idel
ine
3. C
once
pt
pape
r on
natio
nal B
CC
stra
tegy
4. D
iscu
ssio
n am
ong
sect
or
expe
rts
Upta
keRS
H 26
Beha
viors
Is th
e go
vern
men
t ge
nera
ting
and
usin
g ev
iden
ce to
mon
itor
and
anal
yze
hous
ehol
d sa
nita
tion
beha
vior
chan
ge a
nd ta
ke
actio
n to
impr
ove
sust
aina
bilit
y?
Rese
arch
use
d to
und
erst
and
beha
vior a
nd
take
act
ion
acro
ss a
var
iety
of
beh
avio
rs
Rese
arch
use
d to
und
erst
and
beha
vior b
ut n
o ac
tion
Rese
arch
not
us
ed a
nd n
o ac
tion
0.5
Alre
ady
affa
ir am
ount
of f
orm
ative
rese
arch
has
bee
n ca
rried
out
to
unde
rsta
nd th
e dr
ivers
and
bar
riers
for s
anita
tion
beha
viour
s), i
nclu
ding
a
wid
espr
ead
KAP
surv
ey in
201
1, a
s w
ell a
s a
rura
l san
itatio
n co
nsum
er
adop
tion
stud
y by
Wat
erSH
ED in
201
2.Cu
rrent
ly M
RD is
revie
win
g al
l the
se e
viden
ce to
brin
g th
is u
nder
a
cons
olid
ated
BCC
stra
tegy
and
iden
tify
gaps
for f
utur
e re
sear
ch a
nd to
ol
deve
lopm
ent.
Othe
r eva
luat
ions
hav
e pr
ovid
ed v
alua
ble
insi
ghts
in w
hat
drive
s ho
useh
olds
to c
hang
e be
havio
ur a
nd fo
r com
mun
ities
to a
chie
ve a
nd
sust
ain
ODF
1. K
AP s
urve
y (2
011)
2. U
nice
f CLT
S ev
alua
tion
repo
rtM
ultip
le p
roje
ct
repo
rts a
nd to
ols
as a
vaila
ble
from
indi
vidua
l or
gani
zatio
ns
(on
wat
san
goog
le d
ocs)
3. B
CC s
trate
gy
deve
lopm
ent f
or
conc
ept n
ote
4. R
ural
Co
nsum
er
Adop
tion
Stud
y, W
ater
SHED

Wat
er S
upp
ly a
nd S
anita
tion
in C
amb
odia
64
Build
ing
Bloc
kNo
Area
s of
ev
iden
ceIn
dica
tor q
uest
ion
High
(1)
Med
ium
(0.5
)Lo
w (0
)Sc
ore
Expl
anat
ion
for s
core
Sour
ce o
f ev
iden
ce
User
Ou
tcom
es
RSH
27Su
bsec
tor
Is th
e su
bsec
tor o
n tra
ck to
mee
t the
sta
ted
targ
et?
On-t
rack
Off-
track
but
ke
epin
g up
w
ith p
opul
atio
n gr
owth
Off-
track
0Ba
sed
on th
e pr
ogre
ss a
chie
ved
on ru
ral s
anita
tion
sect
or J
MP
2014
up
date
sta
tes
25%
acc
ess.
Alth
ough
the
trend
sin
ce 2
010
seem
s to
be
incr
easi
ng (a
nd C
IPS
repo
rts 3
7% a
cces
s in
rura
l are
as),
the
exis
ting
trend
line
is o
ff tra
ck to
ach
ieve
the
100%
acc
ess
by 2
025
1. C
IPS
2. J
MP
repo
rt up
date
d 20
14
User
Ou
tcom
esRS
H 28
prog
ress
Wha
t is
the
ratio
of
impr
oved
toile
t acc
ess
betw
een
the
low
est a
nd
high
est q
uint
ile in
rura
l ar
eas?
Less
than
2
times
Betw
een
2 an
d 5
Mor
e th
an 5
tim
es0.
5Ba
sed
on th
e so
cial
eco
nom
ic s
urve
y, th
e qu
intil
e ra
tio b
etw
een
poor
and
ric
h is
4.9
1, it
sho
wed
stil
l hav
e bi
g ga
p.Qu
intil
e ra
tio: 5
9% v
ersu
s 12
% =
4.9
1
CSES
201
1
User
Ou
tcom
esRS
H 29
Hygi
enic
use
of
qual
ity fa
cilit
ies
Wha
t per
cent
age
of
peop
le li
ving
in ru
ral
area
s us
e im
prov
ed
toile
t fac
ilitie
s (e
xclu
ding
sh
ared
faci
litie
s)?
Mor
e th
an 7
5%
of p
eopl
e us
e to
ilets
Betw
een
50%
an
d 75
% o
f pe
ople
use
to
ilets
Less
than
50%
of
peop
le u
se to
ilets
0
JMP
2014
upd
ate
illust
rate
s 25
% o
f rur
al C
ambo
dian
s ha
ve a
cces
s.1.
JM
P re
port
2014
upd
ate
ENAB
LING
Polic
yUS
H1Se
ctor
Tar
gets
Are
ther
e US
H ac
cess
ta
rget
s (h
ouse
hold
le
vel a
nd s
ewer
age/
sept
age
man
agem
ent)
in th
e na
tiona
l lev
el
deve
lopm
ent p
lan?
Yes,
targ
ets
for
urba
n ho
useh
old
acce
ss a
nd
sew
erag
e/se
ptag
e m
anag
emen
t in
clud
ed in
the
deve
lopm
ent
plan
Targ
ets
for u
rban
ho
useh
old
acce
ss
incl
uded
in th
e de
velo
pmen
t pl
an b
ut n
o se
wer
age
or s
epta
ge
man
agem
ent
targ
ets
incl
uded
No u
rban
sa
nita
tion
targ
ets
in th
e de
velo
pmen
t pla
n
0.5
NSDP
sta
tes
a ta
rget
of >
80%
hav
ing
impo
ved
acce
s si
n ur
ban
area
s by
20
18.
As p
art o
f the
SDA
dis
cuss
ions
, MPW
T ag
reed
to u
se 1
00%
impr
oved
ac
cess
as
a 20
25 ta
rget
, whi
le a
gree
ing
on a
n am
bitio
us ta
rget
whe
re 5
0%
of u
rban
hou
seho
lds
wou
ld n
eed
to h
ave
acce
ss to
sew
er a
nd tr
eatm
ent
syst
ems.
No fo
rmal
; tar
gets
are
iden
tified
for l
evel
sew
erag
e an
d se
ptag
e m
anag
emen
t
1. N
SDP2
014-
2018
Polic
yUS
H 2
Sect
or p
olic
yIs
ther
e an
urb
an
sani
tatio
n po
licy
that
is a
gree
d by
st
akeh
olde
rs, a
ppro
ved
by g
over
nmen
t, an
d pu
blic
ally
avai
labl
e?
Polic
y of
ficia
lly
appr
oved
and
pu
blic
ally
avai
labl
e
Polic
y dr
afte
d an
d ag
reed
but
no
t offi
cial
ly ap
prov
ed
No p
olic
y1
The
Natio
nal P
olic
y on
Wat
er S
uppl
y an
d Sa
nita
tion
was
dev
elop
ed a
nd
publ
ical
ly di
ssem
inat
ed b
y th
e go
vern
men
t in
2003
, the
re w
as p
artic
ipat
ion
from
dev
elop
men
t par
tner
s bu
t not
wid
ely
publ
ishe
d. It
nee
ds to
be
note
d th
at a
pol
icy
docu
men
t is
not l
aw; h
ence
the
inst
itutio
nal l
inka
ges
that
hav
e be
en li
sted
her
e ar
e no
t sta
tuto
ry
Natio
nal P
olic
y on
Wat
er S
uppl
y an
d Sa
nita
tion
2003
Polic
yUS
H 3
Inst
itutio
nal R
oles
Are
the
inst
itutio
nal
role
s of
urb
an s
anita
tion
subs
ecto
r pla
yers
(n
atio
nal/s
tate
& lo
cal
gove
rnm
ent,
serv
ice
prov
ider
, reg
ulat
or e
tc.)
clea
rly d
efine
d an
d op
erat
iona
lized
?
Defin
ed a
nd
oper
atio
naliz
edDe
fined
but
not
op
erat
iona
lized
Not d
efine
d0.
5Th
e 20
03 p
olic
y de
fined
the
role
s an
d re
spon
sibi
litie
s of
the
key
leve
ls o
f ad
min
istra
tion.
How
ever
ther
e is
no
com
preh
ensi
ve le
gal f
ram
ewor
k fo
r the
ur
ban
sani
tatio
n se
ctor
(no
law
).Th
e Pr
akas
on
the
esta
blis
hmen
t of s
ub-n
atio
nal p
ublic
infra
stru
ctur
e an
d en
gine
erin
g de
partm
ent (
SNPI
ED) w
as is
sued
by
the
MPW
T in
Jul
y 20
11.
This
dep
artm
ent i
s no
t ful
ly op
erat
iona
lized
, as
it re
mai
ns u
nder
reso
urce
d an
d st
affe
d.
.
1. N
atio
nal
Polic
y on
Wat
er
Supp
ly an
d Sa
nita
tion
2003
2. P
raka
s of
es
tabl
ishm
ent o
f SN
PIED

Ser
vice
Del
iver
y A
sses
smen
t65
Build
ing
Bloc
kNo
Area
s of
ev
iden
ceIn
dica
tor q
uest
ion
High
(1)
Med
ium
(0.5
)Lo
w (0
)Sc
ore
Expl
anat
ion
for s
core
Sour
ce o
f ev
iden
ce
Plan
ning
USH
4Fu
nd fl
ow
coor
dina
tion
Does
gov
ernm
ent
have
a p
roce
ss fo
r co
ordi
natin
g m
ultip
le
inve
stm
ents
in th
e su
bsec
tor (
dom
estic
or
don
or, e
g. N
atio
nal
gran
ts, s
tate
bud
gets
, do
nor l
oans
and
gra
nts
etc.
)?
Coor
dina
tion
proc
ess
defin
ed a
nd
oper
atio
naliz
ed
Coor
dina
tion
proc
ess
defin
ed b
ut n
ot
oper
atio
naliz
ed
Not d
efine
d/ n
o pr
oces
s0.
5No
rmal
ly th
e m
inis
try c
reat
es p
roje
ct m
anag
emen
t uni
t (PM
U) to
coo
rdin
ate
any
inve
stm
ent p
roje
ct. M
PWT’
s PI
P sh
ould
be
a ve
hicl
e fo
r bet
ter f
und
coor
dina
tion,
how
ever
ther
e is
no
sect
or w
ide
appr
oach
and
coo
rdin
atio
n m
ostly
take
s pl
ace
at th
e pr
ojec
t lev
el. T
he T
WG
on In
frast
rutu
re, c
haire
d by
M
PWT
does
not
ext
ensi
vely
disc
uss
urba
n sa
nita
tion;
the
sub-
TWG
chai
red
by M
IH o
n ur
ban
wat
er s
uppl
y ha
s no
t yet
form
ally
adop
ted
urba
n sa
nita
tion
Role
s an
d Fu
nctio
ns o
f TW
Gs O
ctob
er
2010
PI
P201
2-20
14
Plan
ning
USH
5In
vest
men
t pla
nsIs
ther
e a
med
ium
term
in
vest
men
t pla
n fo
r ur
ban
sani
tatio
n ba
sed
on n
atio
nal t
arge
ts th
at
is c
oste
d, p
riorit
izes
inve
stm
ent n
eeds
, is
publ
ishe
d an
d us
ed?
Inve
stm
ent p
lan
base
d on
prio
rity
need
s ex
ists
, is
publ
ishe
d an
d us
ed
Exis
ts b
ut n
ot
used
, or u
nder
pr
epar
atio
n
Does
not
exis
t0
Ther
e is
no
stra
tegi
c lo
ng te
rm in
vest
men
t pla
n fo
r urb
an s
anita
tion
yet.
In p
ract
ice,
the
exis
ting
Proj
ect i
mpl
emen
tatio
n Pl
an,is
pro
ject
driv
en. A
m
aste
r pla
n fo
r urb
an s
anita
tion
for P
hnom
Pen
h is
und
er p
repa
ratio
n, w
ith
JICA
sup
port
PIP2
012-
2014
Plan
ning
USH
6An
nual
revie
wIs
ther
e an
ann
ual m
ulti-
stak
ehol
der r
evie
w
in p
lace
to m
onito
r su
bsec
tor p
erfo
rman
ce,
to re
view
pro
gres
s an
d se
t cor
rect
ive a
ctio
ns?
Revie
w o
f pe
rform
ance
an
d se
tting
of
corre
ctive
act
ions
Revie
w o
f pe
rform
ance
bu
t no
setti
ng
of c
orre
ctive
ac
tions
No re
view
or
set
ting
of
corre
ctive
act
ions
0Th
ere
is n
o jo
int a
nnua
l rev
iew
pro
cess
. Rev
iew
of p
rogr
ess
sis
done
on
the
proj
ect b
asis
not
at t
he s
ecto
r lev
el.
Expe
rt Op
inio
n
Plan
ning
USH
7HR
Cap
acity
Has
an a
sses
smen
t be
en u
nder
take
n of
th
e hu
man
reso
urce
ne
eds
in th
e su
b se
ctor
to m
eet t
he
subs
ecto
r tar
get a
nd is
th
e ac
tion
plan
bei
ng
impl
emen
ted?
Asse
ssm
ent
unde
rtake
n an
d ac
tions
bei
ng
impl
emen
ted
Asse
ssm
ent
unde
rtake
n bu
t no
act
ion
bein
g ta
ken
No a
sses
smen
t un
derta
ken
0Th
ere
is n
o se
ctor
ass
essm
ent o
n hu
man
reso
urce
nee
ds fo
r urb
an
sani
tatio
n. T
he d
epar
tmen
t in
char
ge fo
r urb
an s
anita
tion
has
new
ly es
tabl
ishe
d an
d no
reso
urce
and
cap
acity
to d
o it
yet.
Expe
rt Op
inio
n
Budg
etUS
H 8
Adeq
uacy
Are
the
annu
al p
ublic
fin
anci
al c
omm
itmen
ts
to th
e ur
ban
sani
tatio
n su
bsec
tor s
uffic
ient
to
mee
t nat
iona
l tar
gets
fo
r the
sub
sect
or?
Mor
e th
an
75%
of w
hat i
s ne
eded
Betw
een
50-
75%
of n
eeds
Less
than
50%
of
need
s0
Urba
n sa
nita
tion
is a
resp
onsi
bilit
y of
the
Sub
Natio
nal P
ublic
Infra
stru
ctur
e an
d En
gine
erin
g De
partm
ent.
Budg
ets
for u
rban
san
itatio
n ar
e di
fficu
lt to
iden
tify
and
no s
ubse
ctor
ta
rget
s ex
ist f
or tr
eatm
ent o
f fec
al w
aste
. Hen
ce th
is is
sco
red
zero
. In
addi
tion,
the
SDA
cost
ing
mod
el a
ssum
es a
larg
e ga
p of
alm
ost U
S$80
m
illion
, (du
e to
am
bitio
us ta
rget
s)
1. S
DA fi
nanc
ial
anal
ysis
: bud
get
2. In
vest
men
t bu
dget
from
Na
tiona
l Bud
get

Wat
er S
upp
ly a
nd S
anita
tion
in C
amb
odia
66
Build
ing
Bloc
kNo
Area
s of
ev
iden
ceIn
dica
tor q
uest
ion
High
(1)
Med
ium
(0.5
)Lo
w (0
)Sc
ore
Expl
anat
ion
for s
core
Sour
ce o
f ev
iden
ce
Budg
etUS
H 9
Stru
ctur
eDo
es th
e bu
dget
st
ruct
ure
perm
it in
vest
men
ts a
nd
subs
idie
s (o
pera
tiona
l co
sts,
adm
inis
tratio
n,
debt
ser
vice,
etc
) for
the
urba
n sa
nita
tion
sect
or
to b
e cl
early
iden
tified
?
Yes
for
inve
stm
ent a
nd
for s
ubsi
dies
Yes
for
inve
stm
ent b
ut
not s
ubsi
dies
No0
Acco
rdin
g to
Nat
iona
l Bud
get L
aw th
e so
urce
of i
ncom
e fro
m o
wn
sour
ce (s
tate
inco
me)
and
inco
me
from
ext
erna
l (in
clud
ing:
inve
stm
ent
subs
idy,
bila
tera
l sub
sidy
, and
loan
s) a
nd th
e ex
pend
iture
for n
atio
nal
leve
l (m
inis
tries
and
pro
vinci
al d
epar
tmen
ts),
and
the
expe
nditu
re fo
r sub
-na
tiona
l lev
el (i
nclu
ding
: city
, dis
trict
, san
gkat
/com
mun
e) n
eeds
to b
e cl
early
Natio
nal B
udge
t
Budg
etUS
H 10
Com
preh
ensi
veDo
es th
e go
vern
men
t bu
dget
com
preh
ensi
vely
cove
r dom
estic
an
d of
ficia
l don
or
inve
stm
ent/s
ubsi
dy to
ur
ban
sani
tatio
n?
Mor
e th
an 7
5%
of fu
nds
to
subs
ecto
r on
budg
et
Betw
een
50-
75%
of f
unds
to
sub
sect
or o
n bu
dget
Less
than
50%
of
fund
s to
su
bsec
tor o
n bu
dget
1Th
e re
cord
s of
all
maj
or s
ourc
es o
f ext
erna
l inc
ome,
the
Coun
cil f
or
the
Deve
lopm
ent o
f Cam
bodi
a (C
DC) e
stab
lishe
d th
e OD
A da
taba
se fo
r de
velo
pmen
t par
tner
s to
pro
vide
info
rmat
ion
abou
t the
ir in
vest
men
ts.
In n
atio
nal b
udge
t boo
k, th
e da
ta o
f cap
ital i
nves
tmen
t fro
m m
ain
deve
lopm
ent p
artn
ers
has
been
reco
rded
ove
r 75%
exc
ept t
he s
ome
inve
stm
ent b
udge
t for
tech
nica
l ass
ista
nce
was
not
repo
rted.
1. O
DA
data
base
2. N
atio
nal
Budg
et
DEVE
LOPI
NG
Expe
nditu
reUS
H 11
Utiliz
atio
n of
do
mes
tic fu
nds
Wha
t per
cent
age
of d
omes
tic fu
nds
budg
eted
for u
rban
sa
nita
tion
are
spen
t (3
year
ave
rage
)?
Over
75%
Betw
een
50%
an
d 75
%Le
ss th
an 5
0%1
The
dom
estic
fund
is re
curre
nt b
udge
t tha
t gov
ernm
ent a
lloca
ted
to
min
istry
ann
ually
. Ove
r 95%
of t
he d
omes
tic fu
nd h
as b
een
spen
t and
no
rmal
ly th
e bu
dget
allo
cate
d to
min
istry
is la
te 1
qua
rter.
On th
e ot
her
hand
, the
dom
estic
fund
is v
ery
little
am
ount
.
Natio
nal B
udge
t
Expe
nditu
reUS
H 12
Utiliz
atio
n of
ex
tern
al fu
nds
Wha
t per
cent
age
of
exte
rnal
fund
s bu
dget
ed
for u
rban
san
itatio
n ar
e sp
ent (
3 ye
ar a
vera
ge)?
Over
75%
Betw
een
50%
an
d 75
%Le
ss th
an 5
0%0
No d
ata
avai
labl
e on
ext
erna
l pro
ject
util
izatio
n in
last
3 y
ears
N
o da
ta
Expe
nditu
reUS
H 13
Repo
rting
Is u
rban
san
itatio
n ex
pend
iture
ver
sus
budg
et a
udite
d an
d re
porte
d on
in a
co
nsol
idat
ed fo
rmat
for
all s
ourc
es o
f dom
estic
an
d of
ficia
l don
or
expe
nditu
re?
Yes
for d
omes
tic
and
dono
r ex
pend
iture
Yes
for
dom
estic
ex
pend
iture
No0.
5Th
e re
port
of b
udge
t exp
endi
ture
was
not
con
solid
ated
in o
ne re
port,
and
do
es n
ot in
clud
e de
velo
pmen
t par
tner
fund
. PM
U re
cord
s bu
dget
by
proj
ect
only,
but
the
SNPI
ED w
ill be
abl
e to
sep
arat
e ex
pend
iture
bet
wee
n ro
ad a
nd
sew
age
syst
em in
futu
re b
udge
t bre
akdo
wns
.
Cons
ulta
tive
Wor
ksho
p on
Ur
ban
Sani
tatio
n
Equi
tyUS
H 14
Loca
l pa
rtici
patio
nAr
e th
ere
clea
rly
defin
ed p
roce
dure
s fo
r in
form
ing,
con
sulti
ng
with
and
sup
porti
ng
loca
l par
ticip
atio
n in
pl
anni
ng, b
udge
ting
and
impl
emen
ting
for u
rban
san
itatio
n de
velo
pmen
ts?
Yes
and
syst
emat
ical
ly ap
plie
d
Yes,
but
not
sy
stem
atic
ally
appl
ied
No0.
5Th
ere
is n
o pr
oced
ure
that
cle
arly
defin
es th
e pr
oced
ure
for a
lloca
ting
budg
et. T
he c
urre
nt w
aste
wat
er tr
eatm
ent u
nits
that
are
und
er th
e co
ntro
l of
MPW
T ha
ve to
pre
pare
and
pro
pose
the
annu
al b
udge
t pla
n to
MPW
T. Fo
r Phn
om P
enh,
the
was
te w
ater
man
agem
ent u
nit i
s m
ainl
y su
ppor
ted
and
unde
r the
con
trol o
f Phn
om P
enh
mun
icip
ality
. Loc
al c
omm
uniti
es a
re
not w
ell c
onsu
lted
and
ofte
n re
fuse
to c
onne
ct to
sew
er s
yste
ms
Cons
ulta
tive
Wor
ksho
p on
Ur
ban
Sani
tatio
n

Ser
vice
Del
iver
y A
sses
smen
t67
Build
ing
Bloc
kNo
Area
s of
ev
iden
ceIn
dica
tor q
uest
ion
High
(1)
Med
ium
(0.5
)Lo
w (0
)Sc
ore
Expl
anat
ion
for s
core
Sour
ce o
f ev
iden
ce
Equi
tyUS
H 15
Budg
et a
lloca
tion
crite
riaHa
ve c
riter
ia (o
r a
form
ula)
bee
n de
term
ined
to a
lloca
te
urba
n sa
nita
tion
fund
ing
equi
tabl
y to
urb
an
utilit
ies
or s
ervic
e pr
ovid
ers
and
amon
g m
unic
ipal
ities
and
is
it be
ing
cons
iste
ntly
appl
ied?
Yes,
app
lied
cons
iste
ntly
Yes,
but
no
t app
lied
cons
iste
ntly
No0
See
abov
e ; t
here
is n
o co
nsol
idat
ed n
atio
nal b
udge
t tha
t rec
ords
cap
ital
spen
ding
at t
he p
rovin
cial
and
util
ity le
vel
Expe
rt Op
inio
n
Equi
tyUS
H 16
Redu
cing
in
equa
lity
Do lo
cal g
over
nmen
t or
urba
n se
rvic
e pr
ovid
ers
(nat
iona
l or i
n 3
larg
est
citie
s) h
ave
spec
ific
plan
s or
mea
sure
s de
velo
ped
and
impl
emen
ted
for s
ervin
g th
e ur
ban
poor
?
Plan
s de
velo
ped
and
impl
emen
ted
Plan
s de
velo
ped
but n
ot
impl
emen
ted
No p
lans
do
cum
ente
d0.
5Up
to n
ow, t
here
is n
o sp
ecifi
c po
licy
to s
ubsi
dize
the
poor
to g
et a
cces
s to
the
sani
tatio
n se
rvic
e, o
nly
on a
cas
e by
cas
e ba
sis
acco
rdin
g to
the
avai
labi
lity
of th
e pr
ojec
t. In
pra
ctic
e, ta
riff f
or s
ewag
e co
nnec
tion
and
mon
thly
serv
ice
fee
base
d on
the
hous
ehol
d in
com
e an
d lo
catio
n. T
wo
was
te tr
eatm
ent u
nits
(Sih
anou
kville
& S
iem
Rea
p) h
ave
plan
s to
offe
r sp
ecia
l low
cos
t con
nect
ions
for t
he u
rban
poo
r. Ot
her t
han
sew
ers
and
WTT
P, M
PWT
is n
ot c
once
rned
with
man
agin
g on
-site
san
itatio
n th
roug
h fe
cal s
ludg
e m
anag
emen
t, or
with
elim
inat
ing
open
def
ecat
ion
Cons
ulta
tive
Wor
ksho
p on
Ur
ban
Sani
tatio
n
Outp
utUS
H 17
Quan
tity
(acc
ess)
Is th
e an
nual
exp
ansi
on
of u
rban
hou
seho
lds
gain
ing
acce
ss to
saf
e sa
nita
tion
suffi
cien
t to
mee
t the
sub
sect
or
targ
ets?
Over
75%
of t
hat
need
ed to
reac
h se
ctor
targ
ets
Betw
een
75%
an
d 50
% o
f th
at n
eede
d to
ac
hiev
e ta
rget
s
Less
than
50%
of
that
nee
ded
to
reac
h ta
rget
s
1W
hen
look
ing
at o
n-si
te im
prov
ed s
anita
tion
acce
ss, t
he c
urre
nt tr
endl
ine
will
achi
eve
the
2025
targ
et o
f ach
ievin
g un
ivers
al a
cces
s. In
term
s of
pu
tting
suf
ficie
nt s
ewer
and
trea
tmen
t cap
acity
in p
lace
, the
pro
pose
d ta
rget
of 5
0% s
eem
s un
real
istic
give
n th
e ex
istin
g lo
w le
vels
of t
reat
men
t (e
stim
ated
at 2
%)
JMP
Upda
te
2014
Cam
bodi
a W
ater
an
d Sa
nita
tion
Sect
or re
view
–
Wor
ld B
ank
2013
Outp
utUS
H 18
Quan
tity
(trea
tmen
t)Is
the
annu
al in
crea
se
in th
e pr
opor
tion
of
feca
l was
te th
at is
sa
fely
colle
cted
and
tre
ated
gro
win
g at
the
pace
requ
ired
to m
eet
the
subs
ecto
r tar
gets
(fo
r bot
h on
site
and
se
wer
age)
?
For c
olle
ctio
n an
d fo
r tre
atm
ent
For c
olle
ctio
n bu
t not
for
treat
men
t
Not f
or c
olle
ctio
n or
trea
tmen
t (or
if
no ta
rget
)
0Th
ere
are
only
two
func
tioni
ng w
aste
trea
tmen
t sys
tem
s in
the
coun
try
as p
er 2
013.
Few
larg
er u
rban
tow
ns h
ave
colle
ctio
n sy
stem
(com
bine
d dr
ains
mos
tly) b
ut n
ot tr
eatm
ent s
yste
m a
nd c
apac
ity is
ver
y lim
ited.
Bas
ed
on th
e SD
A st
udy
from
4 s
yste
ms
(Phn
om P
enh,
Sie
m re
ap, S
ihan
oukv
ille,
Batta
mba
ng) s
how
ed th
at m
axim
um o
f 40%
of e
fflue
nt d
isch
arge
d is
bei
ng
colle
cted
, how
ever
the
leve
l of t
reat
men
t is
arou
nd 5
-7%
for t
hese
tow
ns.
At n
atio
nal l
evel
, inc
ludi
ng a
ll th
e sm
alle
r urb
an d
istri
ct a
nd p
rovin
cial
ca
pita
ls, t
his
mea
ns th
at tr
eatm
ent o
f fec
al w
aste
is a
roun
d 2%
.
SDA
Calc
ulat
ions
for
Siem
Rea
p, a
nd
Siha
nouk
ville
ba
sed
on d
ata
prov
ided
by
MPW
T. Ca
mbo
dia
Wat
er
and
Sani
tatio
n Se
ctor
revie
w
– W
orld
Ban
k 20
13
Outp
utUS
H 19
Repo
rting
Ar
e th
ere
proc
edur
es
and
proc
esse
s ap
plie
d on
a re
gula
r bas
is
to m
onito
r urb
an
sani
tatio
n ac
cess
and
th
e qu
ality
of s
ervic
es
and
is th
e in
form
atio
n di
ssem
inat
ed?
Qual
ity,
quan
tity
and
diss
emin
ated
Qual
ity o
r qu
antit
yNe
ither
0Th
ere
are
no w
ell-d
efine
d se
ctor
targ
ets
and
M&E
sys
tem
to e
valu
ate
the
prog
ress
and
ach
ieve
men
t of t
he s
ecto
r yet
. It h
as b
een
done
at
proj
ect l
evel
. In
prac
tice,
the
was
te tr
eatm
ent s
yste
m in
Sie
m R
eap
and
Siha
nouk
ville
hav
e so
me
M&E
sys
tem
but
qua
lity
of d
ata
is lo
w. H
owev
er,
less
ons
lear
nt fr
om th
ese
two
units
can
be
appl
ied
in o
ther
pro
vince
s.
Expe
rt Op
inio
n

Wat
er S
upp
ly a
nd S
anita
tion
in C
amb
odia
68
Build
ing
Bloc
kNo
Area
s of
ev
iden
ceIn
dica
tor q
uest
ion
High
(1)
Med
ium
(0.5
)Lo
w (0
)Sc
ore
Expl
anat
ion
for s
core
Sour
ce o
f ev
iden
ce
SUST
AINI
NG
Mai
nten
ance
USH
20Co
llect
ion
and
treat
men
t W
hat i
s th
e pr
opor
tion
of to
tal f
aeca
l was
te
gene
rate
d th
at g
ets
safe
ly co
llect
ed a
nd
treat
ed?
Over
75%
of
that
gen
erat
ed
is c
olle
cted
and
tre
ated
Over
50%
of
that
gen
erat
ed
is c
olle
cted
fro
m th
e HH
le
vel
Less
than
50%
of
that
gen
erat
ed0
Base
d on
the
was
te m
odel
cal
cula
tion
by S
DA fr
om 4
maj
or to
wns
pr
ovin
ces
show
ed th
at th
e le
vel o
f was
te c
olle
cted
and
trea
ted
is v
ery
low
on
ly 7%
, whi
le th
e ra
te o
f col
lect
ion
of w
aste
is h
ighe
r at 4
1%
SDA
Calc
ulat
ions
-
Was
te M
odel
Ca
lcul
atio
n.W
SP
Mai
nten
ance
USH
21Co
st re
cove
ryAr
e O&
M c
osts
of
treat
men
t sys
tem
s (b
eyon
d ho
useh
old
leve
l fa
cilit
ies)
ass
esse
d/kn
own
and
fully
met
by
eith
er c
ost r
ecov
ery
thro
ugh
user
fees
and
/or
loca
l rev
enue
or
trans
fers
?
O&M
cos
ts
know
n an
d >
75%
cov
ered
th
roug
h co
st
reco
very
O&M
cos
ts
are
know
n an
d 50
% c
over
ed
thro
ugh
cost
re
cove
ry
O&M
cos
ts n
ot
know
n1
The
sew
age
treat
men
t sys
tem
s w
ere
built
by
dono
rs a
nd g
over
nmen
t fu
nds.
Cur
rent
ly th
e re
venu
e of
two
publ
ic w
aste
trea
tmen
t uni
ts is
not
abl
e to
cov
er 1
00%
of c
ost r
ecov
ery
yet a
s it
has
been
new
ly es
tabl
ishe
d an
d op
erat
ion
is n
ot fu
ll ca
paci
ty y
et. I
t was
sta
ted
that
inco
me
has
cove
red
88%
of c
ost a
nd w
ill be
abl
e to
cov
er 1
00%
in th
e ne
ar fu
ture
.
Inco
me
and
Expe
nditu
re
from
3
was
te u
nits
(S
ihan
oukv
ille,
Siem
Rea
p, a
nd
Batta
mba
ng)
Cons
ulta
nt
wor
ksho
p
Mai
nten
ance
USH
22Di
scha
rge
Are
ther
e no
rms
and
stan
dard
s fo
r w
aste
wat
er d
isch
arge
fo
r sep
tage
and
se
wer
age
treat
men
t pl
ants
that
are
sy
stem
atic
ally
mon
itore
d un
der a
re
gim
e of
san
ctio
ns
(pen
altie
s)?
Exis
t and
are
m
onito
red
unde
r a
regi
me
of
sanc
tions
Exis
t and
m
ajor
ity a
re
mon
itore
d, b
ut
ther
e ar
e no
sa
nctio
ns
Stan
dard
s ex
ist
but m
ajor
ity
of p
lant
s ar
e no
t reg
ular
ly m
onito
red
0Th
e M
PWT
has
esta
blis
hed
one
cent
ral l
ab (i
n Si
em R
eap)
and
will
be u
sed
it as
the
natio
nal l
ab to
con
trol a
ll se
rvic
e pr
ovid
ers.
At
two
was
te tr
eatm
ent s
yste
ms
in S
ihan
oukv
ille a
nd S
iem
Rea
p ha
s ow
n la
b bu
t not
regu
larly
con
trollin
g. T
he M
inis
try o
f Env
ironm
ent a
lso
cond
uct
annu
ally
mon
itorin
g bu
t the
leve
l of a
ctua
l mon
itorin
g an
d en
forc
emen
t is
wea
k
Expe
rt Op
inio
n
Mai
nten
ance
USH
23M
anag
emen
t of
Disa
ster
Ris
k an
d Cl
imat
e Ch
ange
Do u
tiliti
es (n
atio
nal o
r 3
larg
est u
tiliti
es) h
ave
plan
s fo
r cop
ing
with
na
tura
l dis
aste
rs a
nd
clim
ate
chan
ge?
Yes,
the
maj
ority
of
urb
an s
ervic
e pr
ovid
ers
have
a
plan
for d
isas
ter
risk
man
agem
ent
and
clim
ate
chan
ge
No. O
nly
som
e se
rvic
e pr
ovid
ers
have
a
plan
for
disa
ster
risk
m
anag
emen
t an
d cl
imat
e ch
ange
or
mos
t ser
vice
prov
ider
s ha
ve
unde
rtake
n a
vuln
erab
ility
asse
ssm
ent.
No s
ervic
e pr
ovid
er h
as a
cl
imat
e ac
tion
plan
or h
as
unde
rtake
n a
vuln
erab
ility
asse
ssm
ent.
0M
ost o
f exis
ting
was
te s
yste
m a
re o
ld n
etw
orks
. The
re is
no
risk
asse
ssm
ent o
n cl
imat
e ch
ange
und
erta
ken
for t
he s
ecto
r as
a w
hole
, and
ne
ither
hav
e w
aste
wat
er u
nits
put
in p
lace
pre
vent
ive a
nd e
mer
genc
y ac
tion
plan
s. H
owev
er, i
n th
e fe
asib
ility
stud
ies
and
mas
ter p
lan,
the
impa
ct
of fl
oodi
ng is
incl
uded
in th
e pr
ojec
t des
ign.
Cons
ulta
tive
Wor
ksho
p on
Ur
ban
Sani
tatio
n
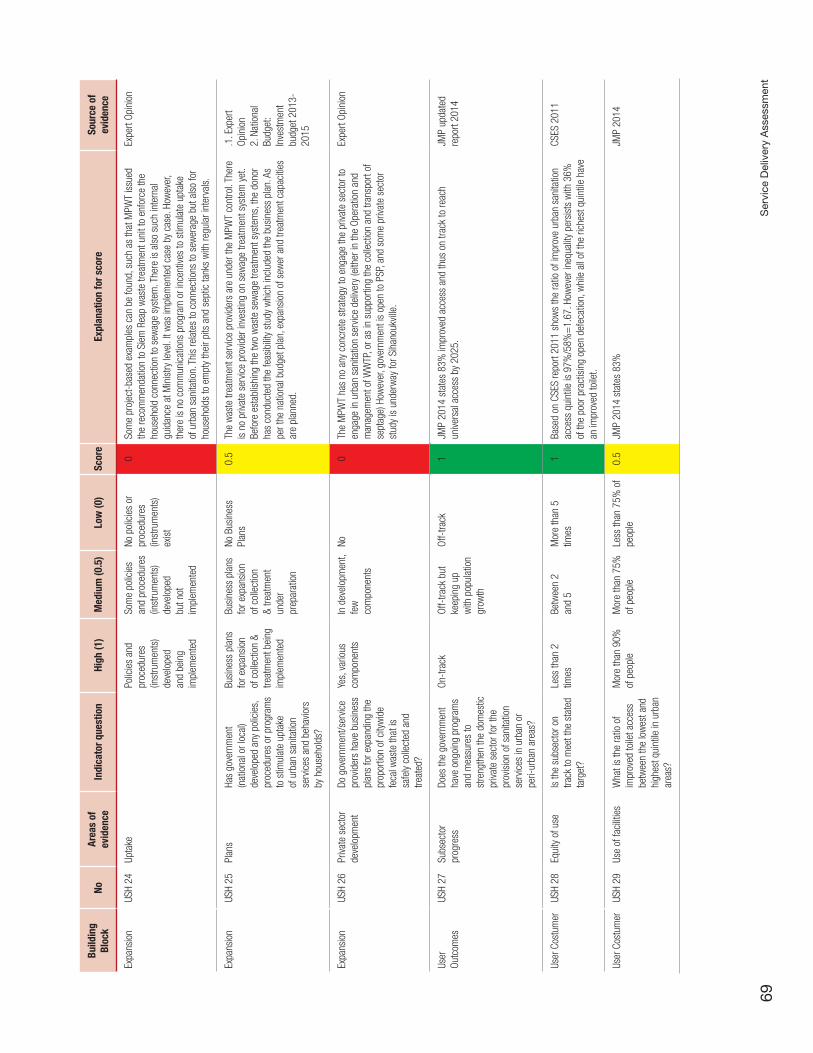
Ser
vice
Del
iver
y A
sses
smen
t69
Build
ing
Bloc
kNo
Area
s of
ev
iden
ceIn
dica
tor q
uest
ion
High
(1)
Med
ium
(0.5
)Lo
w (0
)Sc
ore
Expl
anat
ion
for s
core
Sour
ce o
f ev
iden
ce
Expa
nsio
nUS
H 24
Upta
ke
Polic
ies
and
proc
edur
es
(inst
rum
ents
) de
velo
ped
and
bein
g im
plem
ente
d
Som
e po
licie
s an
d pr
oced
ures
(in
stru
men
ts)
deve
lope
d bu
t not
im
plem
ente
d
No p
olic
ies
or
proc
edur
es
(inst
rum
ents
) ex
ist
0So
me
proj
ect-
base
d ex
ampl
es c
an b
e fo
und,
suc
h as
that
MPW
T is
sued
th
e re
com
men
datio
n to
Sie
m R
eap
was
te tr
eatm
ent u
nit t
o en
forc
e th
e ho
useh
old
conn
ectio
n to
sew
age
syst
em. T
here
is a
lso
such
inte
rnal
gu
idan
ce a
t Min
istry
leve
l. It
was
impl
emen
ted
case
by
case
. How
ever
, th
ere
is n
o co
mm
unic
atio
ns p
rogr
am o
r inc
entiv
es to
stim
ulat
e up
take
of
urb
an s
anita
tion.
Thi
s re
late
s to
con
nect
ions
to s
ewer
age
but a
lso
for
hous
ehol
ds to
em
pty
thei
r pits
and
sep
tic ta
nks
with
regu
lar i
nter
vals
.
Expe
rt Op
inio
n
Expa
nsio
nUS
H 25
Plan
sHa
s go
vern
men
t (n
atio
nal o
r loc
al)
deve
lope
d an
y po
licie
s,
proc
edur
es o
r pro
gram
s to
stim
ulat
e up
take
of
urb
an s
anita
tion
serv
ices
and
beh
avio
rs
by h
ouse
hold
s?
Busi
ness
pla
ns
for e
xpan
sion
of
col
lect
ion
& tre
atm
ent b
eing
im
plem
ente
d
Busi
ness
pla
ns
for e
xpan
sion
of
col
lect
ion
& tre
atm
ent
unde
r pr
epar
atio
n
No B
usin
ess
Plan
s0.
5Th
e w
aste
trea
tmen
t ser
vice
prov
ider
s ar
e un
der t
he M
PWT
cont
rol.
Ther
e is
no
priva
te s
ervic
e pr
ovid
er in
vest
ing
on s
ewag
e tre
atm
ent s
yste
m y
et.
Befo
re e
stab
lishi
ng th
e tw
o w
aste
sew
age
treat
men
t sys
tem
s, th
e do
nor
has
cond
ucte
d th
e fe
asib
ility
stud
y w
hich
incl
uded
the
busi
ness
pla
n. A
s pe
r the
nat
iona
l bud
get p
lan,
exp
ansi
on o
f sew
er a
nd tr
eatm
ent c
apac
ities
ar
e pl
anne
d.
.1. E
xper
t Op
inio
n2.
Nat
iona
l Bu
dget
: In
vest
men
t bu
dget
201
3-20
15
Expa
nsio
nUS
H 26
Priva
te s
ecto
r de
velo
pmen
tDo
gov
ernm
ent/s
ervic
e pr
ovid
ers
have
bus
ines
s pl
ans
for e
xpan
ding
the
prop
ortio
n of
city
wid
e fe
cal w
aste
that
is
safe
ly co
llect
ed a
nd
treat
ed?
Yes,
var
ious
co
mpo
nent
sIn
dev
elop
men
t, fe
w
com
pone
nts
No0
The
MPW
T ha
s no
any
con
cret
e st
rate
gy to
eng
age
the
priva
te s
ecto
r to
enga
ge in
urb
an s
anita
tion
serv
ice
deliv
ery
(eith
er in
the
Oper
atio
n an
d m
anag
emen
t of W
WTP
, or a
s in
sup
porti
ng th
e co
llect
ion
and
trans
port
of
sept
age)
How
ever
, gov
ernm
ent i
s op
en to
PSP
, and
som
e pr
ivate
sec
tor
stud
y is
und
erw
ay fo
r Sih
anou
kville
.
Expe
rt Op
inio
n
User
Ou
tcom
esUS
H 27
Subs
ecto
r pr
ogre
ssDo
es th
e go
vern
men
t ha
ve o
ngoi
ng p
rogr
ams
and
mea
sure
s to
st
reng
then
the
dom
estic
pr
ivate
sec
tor f
or th
e pr
ovis
ion
of s
anita
tion
serv
ices
in u
rban
or
peri-
urba
n ar
eas?
On-t
rack
Off-
track
but
ke
epin
g up
w
ith p
opul
atio
n gr
owth
Off-
track
1JM
P 20
14 s
tate
s 83
% im
prov
ed a
cces
s an
d th
us o
n tra
ck to
reac
h un
ivers
al a
cces
s by
202
5.JM
P up
date
d re
port
2014
User
Cos
tum
erUS
H 28
Equi
ty o
f use
Is th
e su
bsec
tor o
n tra
ck to
mee
t the
sta
ted
targ
et?
Less
than
2
times
Betw
een
2 an
d 5
Mor
e th
an 5
tim
es1
Base
d on
CSE
S re
port
2011
sho
ws
the
ratio
of i
mpr
ove
urba
n sa
nita
tion
acce
ss q
uint
ile is
97%
/58%
=1.
67. H
owev
er in
equa
lity
pers
ists
with
36%
of
the
poor
pra
ctis
ing
open
def
ecat
ion,
whi
le a
ll of
the
riche
st q
uint
ile h
ave
an im
prov
ed to
ilet.
CSES
201
1
User
Cos
tum
erUS
H 29
Use
of fa
cilit
ies
Wha
t is
the
ratio
of
impr
oved
toile
t acc
ess
betw
een
the
low
est a
nd
high
est q
uint
ile in
urb
an
area
s?
Mor
e th
an 9
0%
of p
eopl
eM
ore
than
75%
of
peo
ple
Less
than
75%
of
peop
le0.
5JM
P 20
14 s
tate
s 83
%JM
P 20
14

Water Supply and Sanitation in Cambodia70
Annex 2: Assumptions and Inputs for Financial Model
Table A2.1. Population (millions) and access to improved water supply and sanitation 1990, 2010, and 2025 used for SDA Financial model
Region
1990 Estimated 2012 Estimated 2025 Target
PopAccess
Pop.Access
Pop.Access
WS SAN WS SAN WS SAN
Rural 8.3 20% 0% 11.3 66% 25% 11.4 100% 100%
Urban 1.2 32% 18% 3.1 94% 82% 6.1 100% 100%
National 9.5 22% 3% 14.4 71% 37% 17.5 100% 100%Source: Access data from JMP (2014) –progress on Drinking Water Supply and Sanitation - Update 2014; Population date in 2012 and prediction for 2025 from National Institute of Statistics (2011); access targets for rural water supply and sanitation from the National Rural Water Supply Sanitation and Hygiene Strategy and for urban subsectors agreed with stakeholders during SDA process.
This annex describes the key inputs that were used to generate estimates of the required expenditures to meet government targets and anticipated capital expenditures (CAPEX) from 2012 to 2025. It discusses the sources, ad-justments and assumptions of the following information: Exchange rates, demographic variables, sector-specific technologies and spending plans.
Exchange Rates
Budgets and project costs in Cambodia are frequently pre-sented in both riel and US dollars, and even historically (from 2009 on) use an exchange rate of 4,000 riel to 1 US dollar. This rate has been used to convert riel to US dollars. Other amounts (for example amounts expressed by devel-opment partners in their own currencies) were converted using a constant exchange rate at the time the information was obtained (Oct 2012—March 2013).
Demographic and Access Estimates
The main demographic variables in the SDA financial model are rural and urban population estimates or projections for 1990, 2012, and the target year (2025). Combined with es-timates of actual and target coverage rates for water and sanitation, this information assists in the calculation of the number of people who will be needing access to improved facilities from 2013 to the target year. The second set of information refers to the average size of households. This is used to convert costs of facilities, which are generally expressed on a per household basis, into per capita terms.
Table A2.1 shows the key demographic variables used in the analysis. The average household size (4.8 persons) was drawn from official government figures.

Service Delivery Assessment 71
Table A2.2 Selected information on water supply.
OptionDistribution of facilities (2012, %)a Projected distribution of facilities
(2025, %)a Unit capital cost ($/capita) Lifespan (years)
Rural Urban Rural Urban Rural Urban
Piped into dwelling/yardfor rural schemes
8% - 8% - 35 - 15
Piped into dwelling/yardfor urban schemes
- 74% - 9% - 117 25
Tube well or borehole 72% 18% 72% 6% 21 21 10
Protected dug well 20% 7% 20% 4% 16 16 10
Improved rainwater 0% 1% 0% 0% 16 16 5
Total 100% 100% 100% 100% - - -
a Expressed as a relative share of population that have access to improved source as per JMP; and in target year
Sector-Specific Technologies: Water
Information on sector-specific technologies, unit costs, and expected life span are necessary for the calculation of investment requirements. Table A2.2 presents data on the variables mentioned above for water supply.
The options included and technology shares for 2012 were based on the technology shares reported in the Cambodia Socio Economic Survey (2011/2010), and were then applied to the JMP access rates for 201290. Given the absence of documents, the distribution of water supply technologies for 2025 was based on SDA stakeholder guidance. For ur-ban water supply, this meant that piped water supply ser-vices are expected to increase. For rural water supply it meant that the distribution of the technology mix was held constant. Unit capital costs represent expenditures for materials and labour used in the construction of the different facili-
ties while lifespan refers to the projected number of years before a facility needs to be fully replaced. For urban wa-ter supply, the information was based on estimations from the Norith treatment and expansion project91. On the other hand, unit costs for rural water supply were based on es-timates from MRD for point source services, and for piped services, a weighted average was used of MRD estimates for small community based piped systems, and small-scale private sector based schemes (using data from the Cam-bodia country study on private sector investment in water supply, see Sy. J. et al, 2013). Lifespan were taken from estimates provided by government.
It should be noted, however, that functionality of water sup-ply systems is not an absolute (either functioning or non-functioning). Especially in the case of rural water supply systems, the supply may be partially functional or a small repair such as a valve or pump would make systems func-tional. The SDA model however assumes that all capital in-vestment must be fully replaced after its functional lifespan.
90For rural water supply this might have led to underestimation of the investment costs, as for rainwater, only government definition of improved was included (> 3000 l tank available), while the overall improved access levels of JMP 2014 were used (that include all rainwater as improved). However, this underestimation is not likely to have a major impact on the overall findings and narrative with respect to sector financing.91This estimate is based on the cost for the Niroth project, which was said to be around 200 USD/capita overall, covering 600,000 people costing US% 120 million. However to get a more realistic figure for expansion of urban services outside of Phnom Penh, expensive land costs (US$20 million), industrial treatment capacity (US$30 million), reduces the amount to around US$70 million for 600,000 people, which is USD 117.
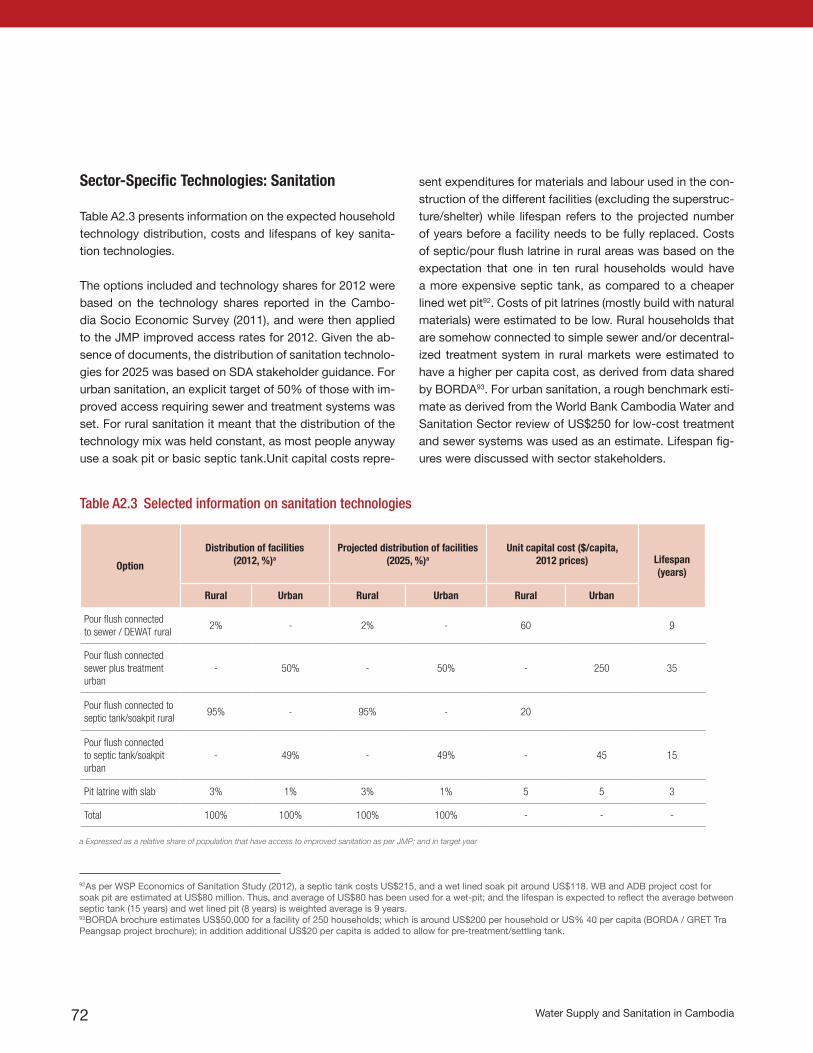
Water Supply and Sanitation in Cambodia72
Option
Distribution of facilities (2012, %)a
Projected distribution of facilities (2025, %)a
Unit capital cost ($/capita, 2012 prices) Lifespan
(years)
Rural Urban Rural Urban Rural Urban
Pour flush connectedto sewer / DEWAT rural
2% - 2% - 60 9
Pour flush connectedsewer plus treatment urban
- 50% - 50% - 250 35
Pour flush connected to septic tank/soakpit rural
95% - 95% - 20
Pour flush connected to septic tank/soakpit urban
- 49% - 49% - 45 15
Pit latrine with slab 3% 1% 3% 1% 5 5 3
Total 100% 100% 100% 100% - - -
a Expressed as a relative share of population that have access to improved sanitation as per JMP; and in target year
Table A2.3 Selected information on sanitation technologies
Sector-Specific Technologies: Sanitation
Table A2.3 presents information on the expected household technology distribution, costs and lifespans of key sanita-tion technologies.
The options included and technology shares for 2012 were based on the technology shares reported in the Cambo-dia Socio Economic Survey (2011), and were then applied to the JMP improved access rates for 2012. Given the ab-sence of documents, the distribution of sanitation technolo-gies for 2025 was based on SDA stakeholder guidance. For urban sanitation, an explicit target of 50% of those with im-proved access requiring sewer and treatment systems was set. For rural sanitation it meant that the distribution of the technology mix was held constant, as most people anyway use a soak pit or basic septic tank.Unit capital costs repre-
sent expenditures for materials and labour used in the con-struction of the different facilities (excluding the superstruc-ture/shelter) while lifespan refers to the projected number of years before a facility needs to be fully replaced. Costs of septic/pour flush latrine in rural areas was based on the expectation that one in ten rural households would have a more expensive septic tank, as compared to a cheaper lined wet pit92. Costs of pit latrines (mostly build with natural materials) were estimated to be low. Rural households that are somehow connected to simple sewer and/or decentral-ized treatment system in rural markets were estimated to have a higher per capita cost, as derived from data shared by BORDA93. For urban sanitation, a rough benchmark esti-mate as derived from the World Bank Cambodia Water and Sanitation Sector review of US$250 for low-cost treatment and sewer systems was used as an estimate. Lifespan fig-ures were discussed with sector stakeholders.
92As per WSP Economics of Sanitation Study (2012), a septic tank costs US$215, and a wet lined soak pit around US$118. WB and ADB project cost for soak pit are estimated at US$80 million. Thus, and average of US$80 has been used for a wet-pit; and the lifespan is expected to reflect the average between septic tank (15 years) and wet lined pit (8 years) is weighted average is 9 years. 93BORDA brochure estimates US$50,000 for a facility of 250 households; which is around US$200 per household or US% 40 per capita (BORDA / GRET Tra Peangsap project brochure); in addition additional US$20 per capita is added to allow for pre-treatment/settling tank.

Service Delivery Assessment 73
Table A2.5 Public investments in capital expenditure (million US$, annual average).
Sector Domestic government
Development partners Total
Anticipated (2013-2015)
Rural water supply 0.9 5.0 5.9
Urban water supply 2.2 21.5 23.7
Rural sanitation 0.4 2.5 2.9
Urban sanitation 1.6 4.3 5.9
Total 19.5 32.8 52.3
Recent (2010-2012)
Rural water supply 0.8 7.9 8.7
Urban water supply 2.4 24.4 26.8
Rural sanitation 0.2 1.6 1.8
Urban sanitation 0.3 5.3 5.6
Total 3.7 39.2 42.9
Subsector2012 O&M 2025 O&M Average O&M
US$m/year US$m/year US$m/year
Rural WS 2.7 4.1 3.4
Urban WS 4.1 9.9 7.0
WS total 6.8 14.0 10.4
Rural S&H 1.7 6.9 4.3
Urban S&H 5.6 13.5 9.5
S&H total 7.3 20.4 13.8
Table A2.4 Estimated operations and maintenance costs for water supply and sanitation
In addition to the capital expenditure for developing new urban sanitation services (that contribute to overall access), for urban sanitation additional average annual cost had to be calculated to cover for the lagging treatment capacity of those that are already having on-site access, with con-nections to sewer/combined drains. A ballpark figure was calculated as follows:. As per CSES data, half of those with access are connected to a sewer, while 83% is estimated to have improved access as per JMP. Based on the 2012 urban population, this means that 1.3 million people need to get access to treatment facilities. Assuming that treatment facilities alone will cost at least USD100/per capita, the total conservatively estimated additional investment required to address the lagging treatment capacity is US$129 million over the period to 2025, which would be on average around US$9.1 million per year. This amount is reflected under “other investment costs”.
cost of other types of water supply technologies. For sani-tation, the estimate is 3% of the capital cost for networked sewerage and for pour flush/flush into tanks or pits, and 1.5% for other technologies. Table A.2.4 below presents annual estimates of these costs in 2012 and 2025, and the average.
Operations and Maintenance
The estimates of operations and maintenance costs are de-rived from averaging a set percentage of existing technolo-gies and expected future technologies to get an average cost. These are assumed to be 3% of the capital cost for water supply piped onto premises, and 1.5% of the capital
Investments
Population projections plus technology distributions, costs, and lifespans are the key ingredients in estimating capi-tal investment needed to reach national targets. To get a sense of how short- to medium-term actual expenditures measure against investment requirements, estimated capi-tal investments of the government, donor agencies, NGOs, and private institutions from 20010 to 2012 were obtained from documents available from the Cambodian Develop-ment Council, development partners, and other agencies and complimented by direct consultations with many of them. Given limitations on time and resources, the SDA in-

Water Supply and Sanitation in Cambodia74
Table A2.6 Share of users in capital/development costs, %
Technology Rural Urban
Water Supply
Piped into dwelling 60% 10%
Tube well/Borehole 20% 80%
Protected dug well 20% 99%
Improved Rainwater 99% 99%
Sanitation
Pour flush to sewer and treatment 33% 1%
Pour flush to septic tank/ soak pit 93% 99%
Pit latrine with slab 99% 99%
vestment estimates should not be regarded as in-depth or highly detailed, but helicopter view of spending. Apart from the difficulties associated with collecting information from various sources, several other challenges were confronted in the process. The financial model uses information on only hardware costs (for example, construction costs of facili-ties) and excludes software costs (for example training and awareness programs, project implementation, and salaries). Moreover, such information must be disaggregated among the four sectors (that is, rural water supply, urban water sup-ply, rural sanitation, and urban sanitation) and, in the case of multiyear projects, for each year. This disaggregation is usually not readily available, or even known, for projects. The SDA team consulted project funders, implementers, and other experts as well as examples of similar or previous projects to make informed estimates.
Table A2.5 shows the projected average annual spending of government and development partners, including NGOs from 2013 to 2015. At the time of SDA data-gathering, fig-ures for 2012 actual expenditures were not available (they were estimated). The overall approach to calculating investment require-ments was to look at average annual calculate annual aver-age requirements, minus an ‘expectation’ of average annual investment based that on the next three year investment (2013-2015) (which is extrapolated to exist in future years). Similarly, recent expenditures were average over a three year period (2010-2012). This resulted in the following in-formation
Future Estimates of Household Expenditures
The planned spending of users is computed by specify-ing the proportion of investments that the government is households are expected to contribute. In the absence of an expressed policy or solid reporting, all users shares were discussed with stakeholders and simply provide a direction
of what the expected contributions to capital expenditure are. For rural sanitation, these are highest due to the “cau-tious hardware subsidy policy”. The figure is derived from estimating the population which is poor/eligible for public incentive to be average of 15% over period 2012-2025. The assumed hardware subsidy would be 50% of average cost of a toilet, this then computes the user share to be around 93% (85% of people pay 100% while 15% of people pay 50% of cost). It can also be seen that rural contributions to piped water supply are considerably higher due to less sub-sidies available and more private sector involvement, simi-larly they are expected to contribute a higher percentage to simple DEWAT systems in denser rural areas. Values of 99% are suggestion pure self supply and no subsidy from government (there is no option to use 100% in the model).

Service Delivery Assessment 75
References
ADB , 2012. Asian Development Bank. Cambodia Water Supply and Sanitation Sector Assessment, Strategy, and Road Map. Manila.
CSES (Cambodia Socio-Economics Survey) 2011. http://www.nis.gov.kh/index.php/social-statistics/cses/cses-ta-bles. The 2011 survey sampled about 3.600 households.
CSES (Cambodia Socio-Economics Survey) 2010. http://www.nis.gov.kh/index.php/social-statistics/cses/cses-ta-bles. The 2010 survey sampled about 3.600 households
IMF 2013. International Monetary Fund 2013 (January). Cambodia 2012 Article IV Consultation. IMF Country Re-port no 13/2.
JMP 2014. WHO and UNICEF Joint Monitoring Program. Progress on Drinking Water and Sanitation - 2014 Update.
Ministry of Planning, National Institute of Statistics, Cambo-dia Inter Census Population Data (2013). Final Report. Ministry of Planning, National Institute of Statistics, 2011 Analysis of Census Results, Population Projections of Cam-bodia p.19;
Ministry of Rural Development 2013, Functional mapping of the MRD, report, D&D working group, MRD, Cambodia.
Ministry of Rural Development 2014, Functional review of the MRD, report, D&D working group, MRD, Cambodia.
RGC 2014. Royal Government of Cambodia. National Stra-tegic Development Plan 2014-2018.
RGC 2003. Royal Government of Cambodia, Ministry of Planning. The Cambodian Millennium Development Goals. Phnom Penh.
RGC 2011. Ministry of Rural Development. National Rural Water Supply, Sanitation, and Hygiene Strategy. Phnom Penh.
RGC 2012b. Royal Government of Cambodia, Infrastruc-ture and Regional Integration Technical Working Group. (IRITWG) Sub-Technical Working Group for Water Supply. 2012b. Overview on Urban Water Supply Sector in the King-dom of Cambodia. Phnom Penh.
RGC 2014. Royal Government of Cambodia, National Stra-tegic Development Plan 2014-2018. Phnom Penh.
Shantz (forthcoming in 2014). National Microbial Assess-ment of Rural Household Point-of-Consumption Drinking Waters – Technical Report Draft. WHO. Phnom Penh.
SNV, 2014a. Learning Brief: Functionality of Rural Water Supply Services Program.
SNV, 2014b Progress Brief: Progress Brief: Functionality of Rural Water Supply Services Program: Assessing Rural Water Supply Levels of Service in Cambodia: Findings and Lessons Learned From a Baseline Assessment.

Water Supply and Sanitation in Cambodia76
Sy, Jemima; Warner, Robert; Jamieson, Jane. 2014. Tap-ping the Markets: Opportunities for Domestic Investments in Water and Sanitation for the Poor. Washington, DC: World Bank.
World Bank 2011. Cambodia - More Efficient Government Spending for Strong and Inclusive Growth : Integrated Fi-duciary Assessment and Public Expenditure Review. World Bank
World Bank (2013) Cambodia Water and Sanitation Sector Review.
World Bank (2012) Voice, Choice and Decision: A Study of Local Governance Processes in Cambodia.
World Bank (2013) Voice Choice and Decision 2: Local Ba-sic Service Delivery. The Asia Foundation and World Bank
World Bank (2013). Where have all the poor gone? Cambo-dia Poverty Assessment 2013. Phnom Penh. World Bank.
WSP (forthcoming). National representative survey to de-termine the poor inclusiveness of licensed private water op-erators. World Bank Phnom Penh.
WSP (2014) Investing in the Next Generation: Growing Tall and Smart with a Toilet. World Bank Water and Sanitation Program. Phnom Penh
Unicef 2009. ‘Arsenic in Cambodia’ http://www.unicef.org/cambodia/As_Mitigation_in_Cambodia_2009.pdfViewed Aug 2014


Water Supply and Sanitation in CambodiaTurning Finance into Services for the Future
May 2015Service Delivery Assessment