WATER RESOURCES PROBLEMS IN SOUTHERN EUROPE … · WATER RESOURCES PROBLEMS IN SOUTHERN EUROPE ......
49
European Topic Centre on Inland Waters WATER RESOURCES PROBLEMS IN SOUTHERN EUROPE AN OVERVIEW REPORT By T.Estrela, C.Marcuello and A.Iglesias August 1996 This report was prepared under the supervision of N. Thyssen, Project Manager, European Environment Agency
Transcript of WATER RESOURCES PROBLEMS IN SOUTHERN EUROPE … · WATER RESOURCES PROBLEMS IN SOUTHERN EUROPE ......
European Topic Centre on Inland Waters
WATER RESOURCES PROBLEMS IN SOUTHERN EUROPE
AN OVERVIEW REPORT
By
T.Estrela, C.Marcuello and A.Iglesias
August 1996
This report was prepared under the supervision of N. Thyssen, Project Manager, European Environment Agency
Cover Design: Folkmann Design and Promotion Printing: XXXXXXXXXXXX Note The designations employed and the presentation of material in this publication do not imply the expression of any opinion whatsoever on the part of the European Commission or the European Environment Agency concerning the legal status of any country or territory, and the boundaries shown on maps do not imply official endorsement or acceptance. Cataloguing data can be found at the end of this publication ISBN XXXXXXXXXXXX © EEA, Copenhagen, 1996 Printed on recycled and chlorine-free bleached paper
European Environment Agency Kongens Nytorv 6 DK - 1050 Copenhagen K Denmark Tel: +45 33 36 71 00 Fax: +45 33 36 71 99 E-mail: [email protected] Homepage: http://www.eea.dk
CONTENTS Page
PREFACE
EXECUTIVE SUMMARY 1
1. INTRODUCTION 3
2. SEMI-ARID AREAS IN THE EEA AREA 5
2.1 Precipitation and Evapotranspiration 5
2.2 Runoff 12
3. CURRENT WATER RESOURCES SITUATION IN SEMI-ARID ZONES OF THE EEA 14
3.1 Introduction 14
3.2 Water surface exploitation 16
3.3 Reservoir and lake eutrophication 18
3.4 Aquifer exploitation 23
3.5 Minimum and Ecological Flow 28
3.6 Wetlands 29
3.7 Seawater intrusion in coastal aquifers 30
3.8 Floods 32
3.9 Desertification and erosion in basins 34
3.10 Salinisation of soils 35
4. WATER RESOURCES AND CLIMATE IN THE FUTURE 37
5. CONCLUSIONS AND PROPOSED FUTURE TECHNICAL ACTIVITY 39
6. REFERENCES 41
APPENDIX A: DEFINITIONS OF WATER RESOURCES 44

PREFACE
This report has been prepared by the European Topic Centre on Inland Waters (ETC/IW) in fulfilment of Task 24 - Project MW4/MW5 of the 1995 Technical Work Programme. It is based on the First Draft Report submitted by CEDEX/ITGE to ETC/IW-EEA in July 1995 and on the following new documents:
INAG (1995) Comments to the First Draft Report submitted by CEDEX/ITGE to ETC/IW-EEA “Overview report on the key water issues in semi-arid /water scarcity regions of the EEA area”.
INAG (1995) Questionnaires related to the First Draft Report. These questionnaires were received by CEDEX in November, 1995.
ENVIRONMENT DEPARTMENT (1995) Questionnaires related to the First Draft Report about Sardinia (Italy). These questionnaires were received by CEDEX in November, 1995.
MINISTRY OF ENVIRONMENT, PHYSICAL PLANNING AND PUBLIC WORKS (1995). Questionnaires related to the First Draft Report about Greece. These questionnaires were received by CEDEX in January, 1996.
MINISTRY OF ENVIRONMENT, PHYSICAL PLANNING AND PUBLIC WORKS (1996) Comments to the First Draft Report submitted by CEDEX/ITGE to ETC/IW-EEA “Overview report on the key water issues in semi-arid /water scarcity regions of the EEA area”. December, 1995.
MINISTRY OF ENVIRONMENT, PHYSICAL PLANNING AND PUBLIC WORKS (1996) Comments to the Final Draft Report submitted by CEDEX/ITGE to ETC/IW-EEA “Overview report on the key water issues in semi-arid /water scarcity regions of the EEA area”. March, 1996.
This report includes information from Greece, the Island of Sardinia in Italy, Portugal and Spain. Two further semi-arid regions in Italy were expected to be included, but no information arrived by the time this report should be submitted. It was hoped that the GISCO (Eurostat) maps of Europe would have been made available for this study but this was not possible. For this reason, the Aegean Islands (Greece) and the Canary Islands (Spain) have not been included in the maps of Europe used in this document.
1
EXECUTIVE SUMMARY
The existing regional imbalance of water resources across the continent makes water shortage a great problem in many regions of Europe. This is particularly so in zones with a semi-arid climate. Although water scarcity is recognised as an increasing problem in Southern and Western Europe, the management of freshwater resources is a key question all over the continent This report gives a general overview of the present water resource situation in the semi-arid regions of the EEA area, where water scarcity problems can constitute a threat to sustainable development and have major repercussions from environmental, social, economic and political perspectives. The availability of water for human consumption, and for other uses, is often limited by poor quality. Eutrophication of rivers and lakes, over-exploitation of, and salt intrusion into, aquifers are the main features of poor water quality in semi-arid areas.
Typical water resource issues in water scarcity areas include: water surface exploitation; reservoir and lake eutrophication; aquifer exploitation; minimum and ecological flow; wetlands; seawater intrusion in coastal aquifers; floods; desertification and erosion in basins; and, soil salinisation.
The report highlights some key issues and identifies aspects that require further work before the scale of the problems can be fully quantified.
Data comparability
1. Mean annual values for precipitation, potential evapotranspiration and runoff need to be calculated and plotted on a pan-European scale using the same methodologies for all countries in order to produce truly comparable data. Similarly synthesis studies of hydrological regimes (quantity and quality) using the same methodologies on a pan-European scale will also improve understanding of the different problems associated with water resources in the different countries and regions.
Key issues
2. Erosion is an important issue in southern Europe and it is important to know the most affected areas and relate them to hydrological changes (increase of peak flows and decrease of time of concentration). The rate of soil formation decreases year by year. The environmental impacts include not only those on agriculture but also damage caused by flooding.
3. Water quality problems and the main sources of contamination in southern Europe and their relationships with potential water resources should be characterised. In particular eutrophication of reservoirs and lakes should be monitored as well as the mean concentration of chloride in groundwater (to assess saline intrusion problems).

2
4. Drought: the areas affected by drought in southern Europe should be defined and maps of drought risk, resilience and vulnerability produced. Analysis of long series of data on precipitation and river discharges would clarify these drought studies.
5. Floods in semi-arid areas constitute a natural hazard not covered by current policies. Mapping of vulnerable land use areas and applying management tools would be a good starting point in the development of policy in this field.
Further work requirements
6. The development of guidelines for environmental impact analysis, management tools, etc. for the conjunctive use of surface and groundwater resources should be made in order to improve the efficiency of water use in semi-arid areas.
7. The setting of criteria for the determination of ecological flows for semi-arid areas is considered to be of paramount importance. Common criteria in the EEA countries should be derived in order to set guidelines for the maintenance of ecological flows in rivers. River regulation systems should follow a common policy in this aspect, bearing in mind the variety and diversification of aquatic life across European river systems.
8. As a pre-requisite to points 7 and 8, studies on a pan-European scale related to the social, economical and environmental impacts of extreme events (droughts and floods) would give a good indication of the scope of these problems.
9. The possible effects of climate change on the quantity and quality of water resources should be investigated, particularly in the semi-arid regions, where the effects could be more adverse.
10. Knowledge of how the change of land use affects the availability of water resources in the EEA area should be improved, particularly in semi-arid areas. Nevertheless, the lack of reliable data will make that very difficult. Data on land use have not been available at the time this report was written. The outcomes of such an improved study would be, without doubt, an important help for water management.
11. Water re-use should be further practised in semi-arid areas. Some areas in Greece have made use of such methods for agricultural purposes, but it has not yet spread widely throughout semi-arid regions. Studies on the application of water re-use techniques would be beneficial.
Certain aspects of this study are being taken forward and developed under the 1995 subvention (95/I: Review of efficiency of water use in Europe) and under the 1996 subvention (Task 6; Groundwater quality and quantity).
3
1. INTRODUCTION
Although water scarcity is recognised as an increasing problem in Southern and Western Europe, the management of freshwater resources is a key question all over the continent and it should be governed by this principle:
"The scarcity and abusive use of fresh water is posing a serious and ever-increasing threat to sustainable development and environmental protection. The human health and well-being, guarantee of food supply, industrial development and the ecosystems upon which this is dependent are all in jeopardy and remain so, unless the management of water and land-resources is immediately undertaken in a much more efficient way than it has been up to the present (UNO, 1992)".
The existing regional imbalance of water resources across the continent makes water shortage to be a great problem in many regions of Europe. This problem is particularly remarkable in zones with a semi-arid climate. The availability of water for human consumptive uses, and for other purposes, is often limited by poor quality. Eutrophication of rivers and lakes, over-exploitation of and salt intrusion in aquifers are the main features of poor water quality in semi-arid areas.
Good management of freshwater resources in the semi-arid regions is necessary for the maintenance of the required standards of water quality and quantity, and therefore for reaching the goals of EU Policies. The targets for the Fifth Environmental Action Programme (5EAP) and for the EU Action Programme for Integrated Groundwater Protection (GAP) are aimed to be implemented by the year 2000. One of the GAP´s main purposes is to focus the groundwater protection requirements on the Common Agricultural Policy and on Regional Policy. Both aspects affect particularly the southern areas of Europe, where a high percentage of land is used for agricultural purposes and is supplied by groundwater with its associated problems of nitrates and pesticides. The 5EAP aims to maintain the water resources so that the regional balance between demand and availability is guaranteed. Risk management is another aspect which is targeted by the 5EAP objectives for EU. The main sources of risk to human health and the environment related to the semi-arid regions are floods, and forest fires. These are grouped as “natural hazards”, but, at the moment, there are no EU policy targets to reduce these events.
In addition to all those aspects, the consequences of future climatic change may affect water availability in the EEA area. Special attention to extreme events, as well as soil degradation and desertification, should be taken into account when planning a long-term strategy in water management, particularly in semi-arid countries.
On the other hand, the degradation of natural vegetation originates changes in the micro-climate in arid and semi-arid areas, resulting in irreversible desertification. Apart from the countries where semi-arid areas are recognised, a greater EEA area may be susceptible to desertification as a result of a global warming.
4
This report includes a general overview of the present water resource situation in the semi-arid regions in the EEA, where these problems could constitute a threat to sustainable development and have major repercussions from environmental, social, economic and political perspectives. It has been structured into three parts: a) delimitation of semi-arid areas in the EEA, b) current water resources problems and c) incidence of climate on water resources in the future. Annex 1 contains definitions of the water resource terms used in the report.
The main part of the report, "current water resources problems", is broken down into the following contents:
• Introduction
• Water surface exploitation
• Reservoir and lake eutrophication
• Aquifer exploitation
• Minimum and ecological flow
• Wetlands
• Seawater intrusion in coastal aquifers
• Floods
• Desertification and erosion in basins
• Soil salinisation
5
2. SEMI-ARID AREAS IN THE EEA AREA
A climatic zoning, which is based on the moisture index Ih -, (also known as the UNESCO index), has been established with a view to obtaining insight into the problems associated with water resources in the semi-arid areas of the European Environment Agency (EEA). This index, Ih, is obtained as P/PET, where P is the average annual precipitation, and PET is the potential evapotranspiration according to Penman's formula.
In 1979, UNESCO prepared the World Map of Arid Zones (UNESCO, 1979). Four classes or degrees of aridity were considered, these corresponding to the great geographical categories that are generally accepted. These were:
• Hyper-arid zones (P/PET < 0.03). Deserts in the strict sense of the term.
• Arid zones (0.03 ≤ P/PET < 0.20). Sub-deserts or semi-deserts.
• Semi-arid zones (0.20 ≤ P/PET < 0.5). Steppes, prairies, certain types of savannah and a large part of the Mediterranean vegetation. These are zones whose precipitation varies greatly from year to year.
• Sub-humid zones (0.5 ≤ P/PET < 0.75). The limits between these zones and the wet and semi-arid zones, are highly changeable and subject to fluctuations.
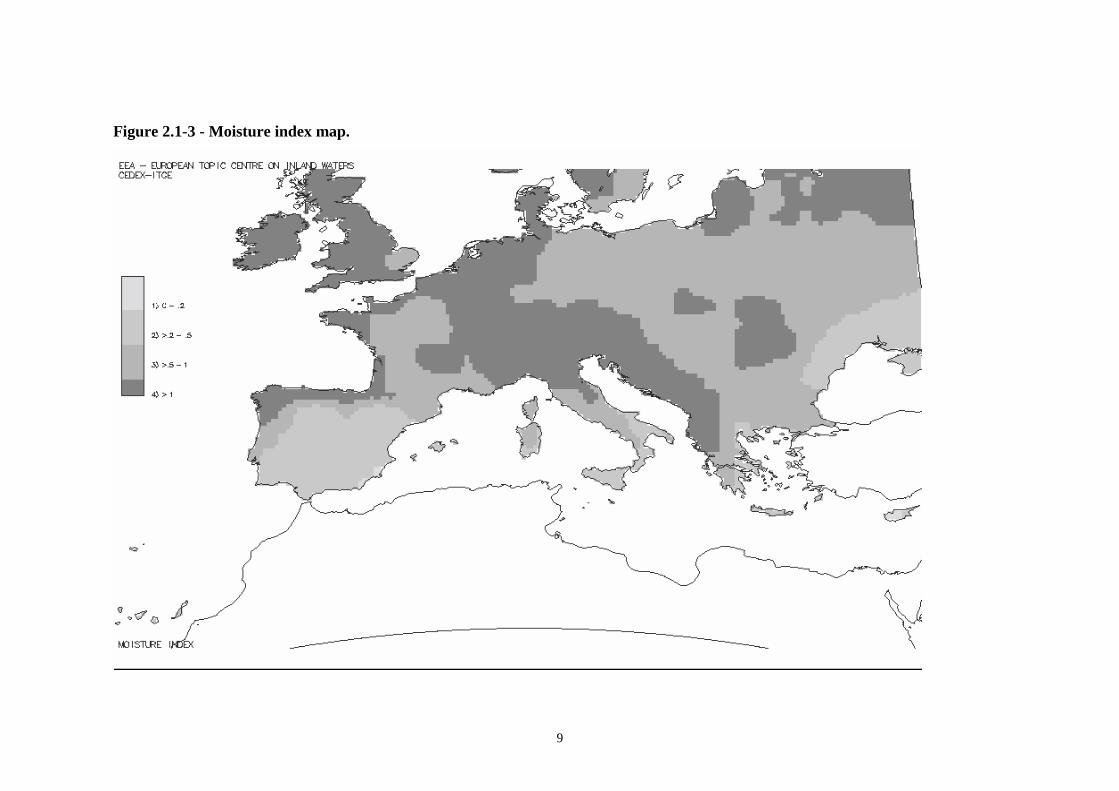
The precipitation (Figure 2.1-1) and average annual potential evapotranspiration maps (Figure 2.1-2), have been taken from the UNESCO publication entitled "Atlas of World Water Balance" (UNESCO, 1977). Figure 2.1-3 shows a map of Europe after the four classifications mentioned above have been applied, and it can be seen that the following EEA regions fall into the semi-arid category: South of Portugal, South East Spain and parts of the central area, South East Italy plus Sardinia and Sicily and South East Greece. Sections 2.1 and 2.2. are focused on the hydrological characteristics: precipitation, evapotranspiration, and runoff, in semi-arid EEA areas. The information has mainly been taken from the UNESCO publication "Comparative Hydrology" by Falkenmark and Chapman (1989), and has been supplemented with more detailed information concerning the semi-arid regions of Spain and Portugal.
2.1. Precipitation and Evapotranspiration
The average annual precipitation in semi-arid regions is well below the annual potential evapotranspiration (P < 0.5 PET). The values are generally very low, and the completely dry season usually lasts several months.
A basic feature of precipitation is the spatial distribution of storms. The surface area covered by storms in semi-arid zones, especially in the Mediterranean, is often small, and the rainfall decreases sharply within a short distance of the epicentre of the storm. The intensity of the precipitation is another relevant factor in flow generation and also in soil
6
erosion. For instance, at different locations in the Spanish Mediterranean area, over 500 mm have been recorded in one single day.
The maximum theoretical evapotranspiration is determined by the potential evapotranspiration, PET. However, in semi-arid zones, the actual evapotranspiration E is considerably lower than the PET, on account of the lack of water most of the year. As specific potential evapotranspiration conditions are absent, it is difficult to estimate E, because a series of other factors come into play, such as the pattern and magnitude of the precipitation, soil-type and vegetation cover, etc.
The actual evapotranspiration is close to zero in the driest regions of the semi-arid zones, where maximal PET values and negligible rainfall is recorded. The value can be estimated from the water balance. Several different methods can be used for calculating the potential evapotranspiration, including the Penman Monteith method, recommended by the FAO in the "Report on the Expert Consultation on Revision of FAO Methodologies of Crop Water Requirements”. (FAO, 1991).

7
Figure 2.1-1 - Precipitation map

8
Figure 2.1-2. - Potential evapotranspiration map
9
Figure 2.1-3 - Moisture index map.
10
2.1.1. Spain
The rainfall distribution is extremely uneven, and an approach to the problem by using average statistical values, could give rise to serious errors. Therefore, although the national average annual precipitation is about 670 mm (equivalent to 340,000*106 m3/year), the average is 1,315 mm, in Northern Spain, and 380 mm in the Segura Basin. The average annual precipitation does not exceed 200 mm in some areas, like Almería in the Sur Basin (MOPTMA, 1993). There is also a marked annual unevenness in each basin, which brings water shortages and drought after several consecutive dry years.
The national mean annual PET is about 800 mm and the actual evapotranspiration 445 mm/year, which amounts to approximately 226,000*106 m3/year.
The Segura Basin is the area whose mean annual precipitation is considerably lower than it is in the rest of the semi-arid areas in Spain. This area must face the problems related to water availability for irrigation year after year. Water supply problems also appear during dry seasons in most of the areas of the Guadiana, Guadalquivir and Sur Basins. Those basins register an annual mean precipitation lower than the national average.
Table 2.1- 1 shows the basins considered, in global terms, as semi-arid regions in Spain (Estrela, T. 1995). A region has been considered as a semi-arid one when a high percentage of its surface area complies with the UNESCO moisture index criterion for semi-arid areas (P/PET ≤ 0.5).
2.1.2. Portugal
The mean annual precipitation (P) in Portugal is 889 mm (OECD, 93). There is an imbalance between the northern and southern basins: whilst P=1,800 mm or even more (2,373 mm/year in Cavado basin) in the north; while in the south, the Sado and Mira Basins have P values around 700 mm or even less in the Guadiana Basin.
In Portugal, there are 5 regions with semi-arid or scarcity issues (INAG, 1995b), as Table 2.1-1 shows. Region 1 is the part of the Douro catchment with Mediterranean climate (located in the North). Regions 3 and 4 are the must problematic zones in terms of scarcity, both in surface and groundwater. In these regions there are problems of domestic water supply. The figures corresponding to P/PET are slightly greater or equal to 0.5 in the Alto Douro (01), Soul Tejo (02) and Sado e Mira (03) , yet they are less than 0.5 in the Guadiana basin and in the Algarve region. Although in the Guadiana basin the PET is equal to 1,304 mm/year, the precipitation is the lowest in the Portuguese catchment areas. In Algarve, the mean annual precipitation is equal to 653 mm, but the PET is the highest (equal to 1689 mm/year).
The PET figures quoted here seem to have been estimated in a different way from those in Spain.
11
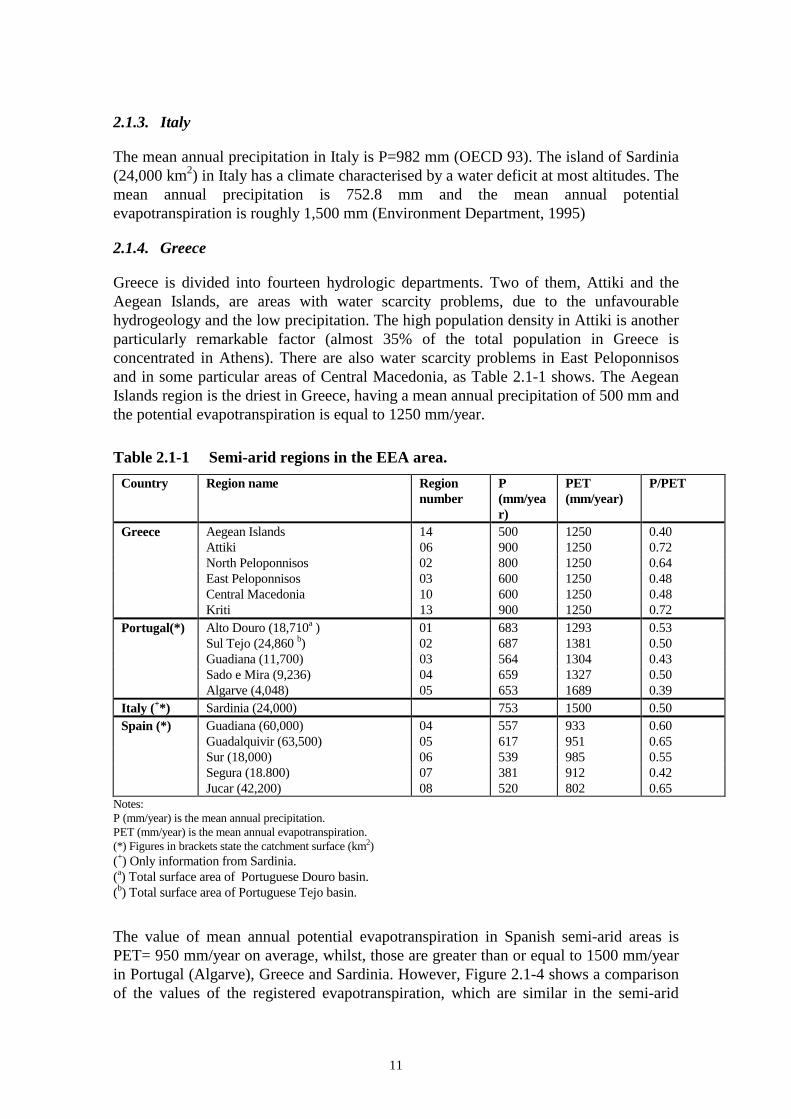
2.1.3. Italy
The mean annual precipitation in Italy is P=982 mm (OECD 93). The island of Sardinia (24,000 km2) in Italy has a climate characterised by a water deficit at most altitudes. The mean annual precipitation is 752.8 mm and the mean annual potential evapotranspiration is roughly 1,500 mm (Environment Department, 1995)
2.1.4. Greece
Greece is divided into fourteen hydrologic departments. Two of them, Attiki and the Aegean Islands, are areas with water scarcity problems, due to the unfavourable hydrogeology and the low precipitation. The high population density in Attiki is another particularly remarkable factor (almost 35% of the total population in Greece is concentrated in Athens). There are also water scarcity problems in East Peloponnisos and in some particular areas of Central Macedonia, as Table 2.1-1 shows. The Aegean Islands region is the driest in Greece, having a mean annual precipitation of 500 mm and the potential evapotranspiration is equal to 1250 mm/year.
Table 2.1-1 Semi-arid regions in the EEA area. Country Region name Region
number P (mm/year)
PET (mm/year)
P/PET
Greece Aegean Islands 14 500 1250 0.40 Attiki 06 900 1250 0.72 North Peloponnisos 02 800 1250 0.64 East Peloponnisos 03 600 1250 0.48 Central Macedonia 10 600 1250 0.48 Kriti 13 900 1250 0.72 Portugal(*) Alto Douro (18,710a ) 01 683 1293 0.53 Sul Tejo (24,860 b) 02 687 1381 0.50 Guadiana (11,700) 03 564 1304 0.43 Sado e Mira (9,236) 04 659 1327 0.50 Algarve (4,048) 05 653 1689 0.39 Italy (+*) Sardinia (24,000) 753 1500 0.50 Spain (*) Guadiana (60,000) 04 557 933 0.60 Guadalquivir (63,500) 05 617 951 0.65 Sur (18,000) 06 539 985 0.55 Segura (18.800) 07 381 912 0.42 Jucar (42,200) 08 520 802 0.65
Notes: P (mm/year) is the mean annual precipitation. PET (mm/year) is the mean annual evapotranspiration. (*) Figures in brackets state the catchment surface (km2) (+) Only information from Sardinia. (a) Total surface area of Portuguese Douro basin. (b) Total surface area of Portuguese Tejo basin.
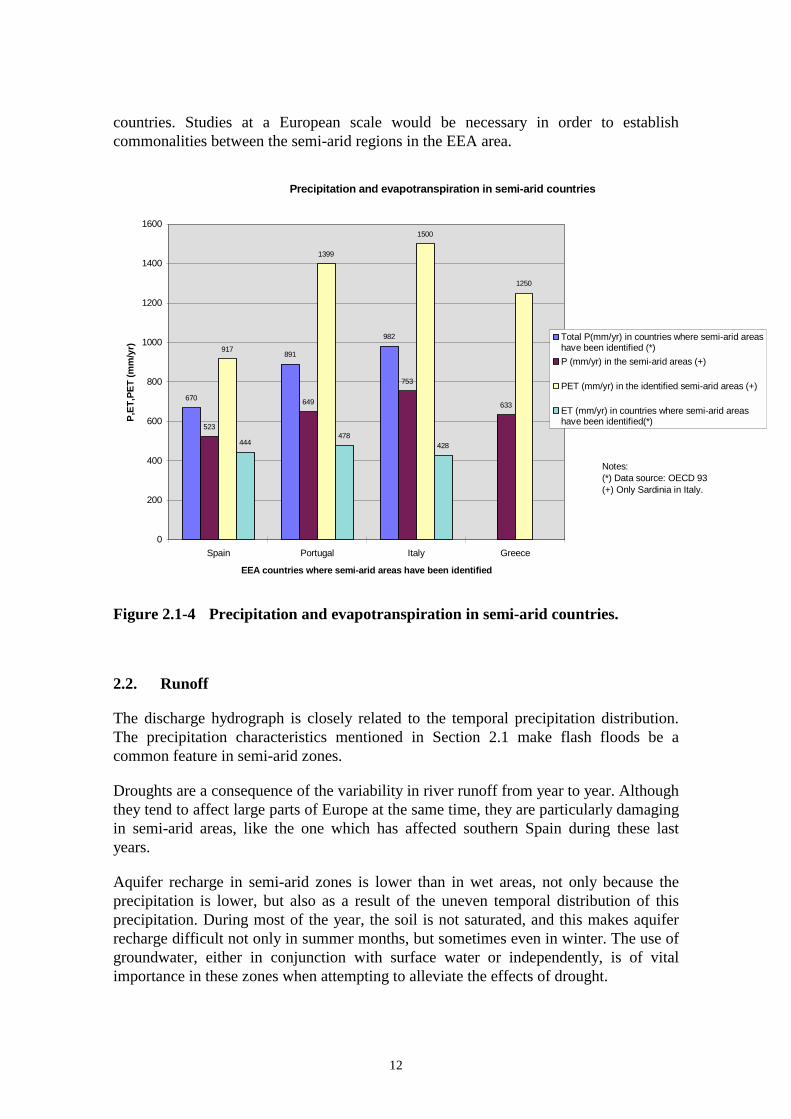
The value of mean annual potential evapotranspiration in Spanish semi-arid areas is PET= 950 mm/year on average, whilst, those are greater than or equal to 1500 mm/year in Portugal (Algarve), Greece and Sardinia. However, Figure 2.1-4 shows a comparison of the values of the registered evapotranspiration, which are similar in the semi-arid
12
countries. Studies at a European scale would be necessary in order to establish commonalities between the semi-arid regions in the EEA area.
Precipitation and evapotranspiration in semi-arid countries
670
891
982
523
649
753
633
917
1399
1500
1250
444478
428
0
200
400
600
800
1000
1200
1400
1600
Spain Portugal Italy Greece
EEA countries where semi-arid areas have been identified
P,ET
,PET
(mm
/yr)
Total P(mm/yr) in countries where semi-arid areashave been identified (*)P (mm/yr) in the semi-arid areas (+)
PET (mm/yr) in the identified semi-arid areas (+)
ET (mm/yr) in countries where semi-arid areashave been identified(*)
Notes: (*) Data source: OECD 93(+) Only Sardinia in Italy.
Figure 2.1-4 Precipitation and evapotranspiration in semi-arid countries.
2.2. Runoff
The discharge hydrograph is closely related to the temporal precipitation distribution. The precipitation characteristics mentioned in Section 2.1 make flash floods be a common feature in semi-arid zones.
Droughts are a consequence of the variability in river runoff from year to year. Although they tend to affect large parts of Europe at the same time, they are particularly damaging in semi-arid areas, like the one which has affected southern Spain during these last years.
Aquifer recharge in semi-arid zones is lower than in wet areas, not only because the precipitation is lower, but also as a result of the uneven temporal distribution of this precipitation. During most of the year, the soil is not saturated, and this makes aquifer recharge difficult not only in summer months, but sometimes even in winter. The use of groundwater, either in conjunction with surface water or independently, is of vital importance in these zones when attempting to alleviate the effects of drought.
13
Part of the water that recharges the aquifers eventually reaches the surface drainage network, and is one of the basic constituents of the total yield. It is of paramount importance to have in-depth knowledge of the processes and laws of exchange which govern the river-aquifer relationship in such zones. An awareness of this information would serve to evaluate, for example, the effects of aquifer extraction on the discharges of the rivers.
2.2.1. Spain
The total average annual yield (surface water and groundwater) is 114,000*106 m3, which amounts to specific runoff figures of 230 mm/year. The European average is approximately 300 mm/year. However, only a small amount of the natural resources are directly useable, roughly 9,200*106 m3 per year, which is a mere 8 % of the total on the Spanish peninsular. This figure contrasts sharply with the European average, where the percentage is 40% of the natural resource (MOPTMA, 1993).
From a comparative viewpoint, this situation is even less satisfactory when the uneven space/time distribution is taken into account. The basins in Galicia and in the North, which have a surface area of 53,800 km2 (10.6 % of the national territory), provide an average annual figure of 42,000*106 m3 (36.3 % of the national average). Two basins in the South, the Segura and the Júcar, with a total surface area of 79,830 km2 (15.8 %) yield an annual average of 7,600*106 m3 (6.6 % of the total). That is to say, there is an 8:1 relationship in the yields per unit of surface area.
2.2.2. Portugal
The total surface of the Portuguese catchment areas is 89,300 km2 . Five rivers are transboundary and the total surface of the shared basins between Spain and Portugal is 268,529 km2. The total specific runoff (Spain and Portugal) is 295 mm/year, and the figures for Portugal are 313 mm/year and 287 mm/year for the runoff coming from Spain. (LNEC, 1992).
There is also an imbalance between the northern and the southern basins. The Minho catchment area is 17,081 km2 (5% of the surface is Portuguese) and its average total runoff is 750 mm/year; whilst in the Guadiana basin (71,573 km2 , 16.3% of this surface is Portuguese) the total runoff is only 90 mm/year (188 mm/year yield in Portugal), (LNEC, 1992).
2.2.3. Italy and Greece
The average specific runoff in Italy is 554 mm/year, which is a much higher figure than the European average, and it represents a total quantity of internal resources of 167,000 *106 m3 (OECD 1993). Despite these figures, Sardinia and Sicily are stated as semi-arid regions, which demonstrate once more the imbalance between basins in Italy.
The internal resources of Greece are 45,000*106 m3 (OECD,1992), which are equivalent to an average runoff of 341 mm/year. The areas having scarcity problems are located mainly in the southern regions of the country.
14
3. CURRENT WATER RESOURCES SITUATION IN SEMI-ARID ZONES OF THE EEA
3.1. Introduction
Meeting demands (as regards quantity and quality) is one of the main aims of water resource planning and management. To find an equilibrium between human activities and needs, and the availability in particular areas is a key issue in semi-arid regions. As a consequence of an unsustainable development model, particularly agricultural, demands are often greater than the available resources. Many of the water resource problems existing in the EEA semi-arid zones may be solved by looking for a more “realistic” agreement between demands and exploitation.
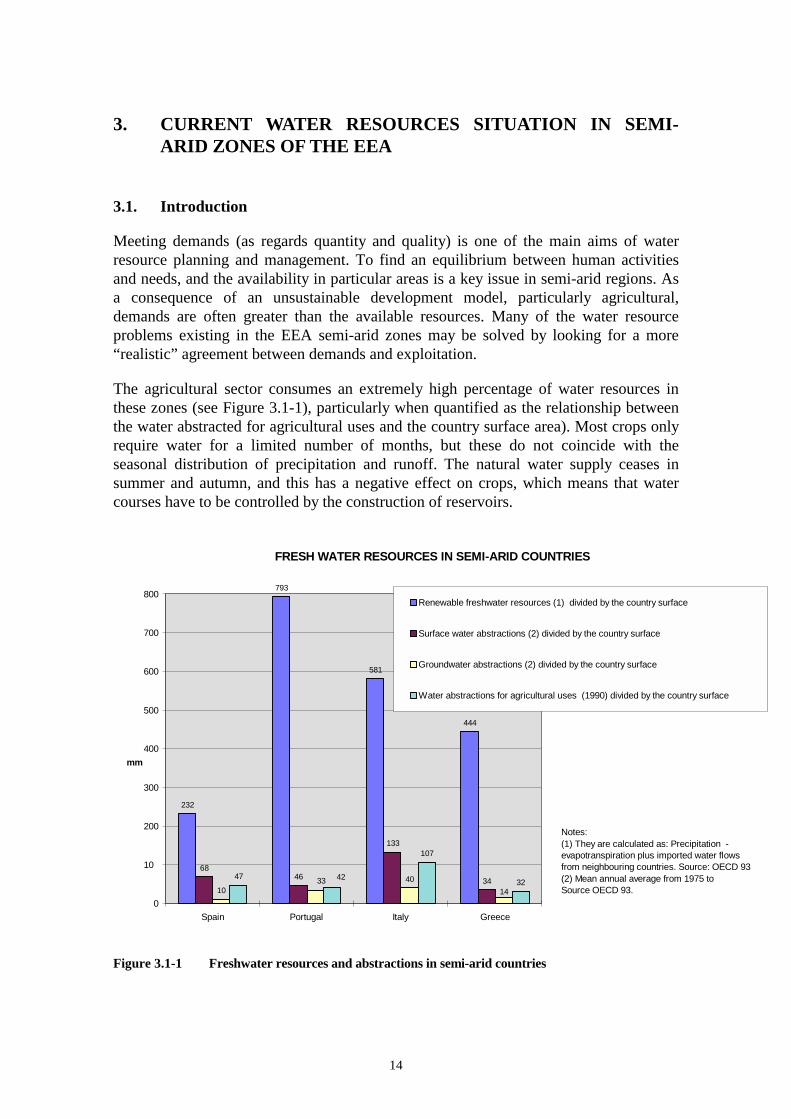
The agricultural sector consumes an extremely high percentage of water resources in these zones (see Figure 3.1-1), particularly when quantified as the relationship between the water abstracted for agricultural uses and the country surface area). Most crops only require water for a limited number of months, but these do not coincide with the seasonal distribution of precipitation and runoff. The natural water supply ceases in summer and autumn, and this has a negative effect on crops, which means that water courses have to be controlled by the construction of reservoirs.
FRESH WATER RESOURCES IN SEMI-ARID COUNTRIES
232
793
581
444
6846
133
3410
4047
107
3214
33 42
0
10
200
300
400
500
600
700
800
Spain Portugal Italy Greece
mm
Renewable freshwater resources (1) divided by the country surface
Surface water abstractions (2) divided by the country surface
Groundwater abstractions (2) divided by the country surface
Water abstractions for agricultural uses (1990) divided by the country surface
Notes:(1) They are calculated as: Precipitation -evapotranspiration plus imported water flowsfrom neighbouring countries. Source: OECD 93(2) Mean annual average from 1975 toSource OECD 93.
Figure 3.1-1 Freshwater resources and abstractions in semi-arid countries
15
The differences in yield from year to year, makes it necessary to construct large dams for the purpose of water storage in wet years, so that demands can be met in dry years. Sedimentation or eutrophication are common problems in many of those reservoirs. There are other problems associated to them, such as the reduction of the biodiversity downstream and the interruption of fish migration. The establishment of a common policy for ecological and minima flows to be guaranteed by reservoir management is a key question in order to maintain the aquatic biodiversity.
The conjunctive use of surface water and groundwater is a main factor in order to meet demands in semi-arid zones. However, excessive use of the aquifers can cause over-exploitation problems with the consequent negative environmental, social and economic impact. In coastal areas, excessive water extraction causes the water table to drop, giving rise to the sea water intrusion phenomenon. To consider any options which help save water must be one of the first steps in water management in semi-arid areas. The use of technologies that improve efficiency (e.g. drip irrigation in agriculture) is an example of saving water. Another possibility involves carrying out research into new crop varieties with lower water requirements being temporally coincident with the wet season. These new crops should be consistent with the European Joint Agricultural Policy, that hopefully will allocate each type of crop to the appropriate type of climate (INAG, 1995a). Sometimes, however neither the saving measures nor suitable management of water resources of the basins are sufficient. It would be necessary to transfer water from basins with a surplus to those with a deficit by means of works such as aqueducts.
In urban areas, the main problems concern water supply, wastewater treatment and flood prevention. The water supply can be guaranteed by storage in reservoirs, or by pumping groundwater when possible. Wastewater must be treated before being returned to a river whose discharge is very low either all year round or during the dry season. Once it has been treated it can be used to recharge aquifers, by percolation from shallow pools or injection wells, but such practice is not common in semi-arid areas. After being properly treated, wastewater can also be used for irrigation purposes, a practice which has been used recently in Greece. Floods bring about a high element of risk, especially in the case of steeply sloping basins, because of the high velocity that the water reaches. The transport of considerable amounts of sediment is an additional danger. The strategy for dealing with floods is based on the application of structural measures (reservoir construction, channelling, dikes, etc.) and non-structural measures, (flood warning systems, management of flood areas, etc.). Erosion and soil loss in the basins, is another problem closely associated with the flood phenomenon. This problem is remarkable in the Mediterranean zones, which are periodically affected by forest fires that accelerate the erosion process as a consequence of the loss of vegetable cover. The reduction of water resources coupled with the erosion problem, can lead to desertification in many areas inside the semi-arid regions, with the consequent socio-economic repercussions.
A greater in-depth review of some of the problems mentioned above is described in the following sections.

16
3.2. Water surface exploitation
The river yields in semi-arid zones show major fluctuations, both on a seasonal and annual basis. Dam building, or other hydraulic works, is the way usually to control water quantity, as far as meeting demands is concerned.
Table 3.2-1 shows the number of large dams in the countries with semi-arid regions (ETC/IW, 1995):
Table 3.2-1 Large dams in countries with semi-arid regions. Country Surface (km2) Number of large dams km2/large dam
Spain 504,750 847 596 Italy 301,262 424 711 Portugal 92,018 81 1,136 Greece 131,999 13 10,154
There are 847 large dams in Spain (ETC/IW, 1995). They have been built in order to provide an availability of 40% of its natural water resources. In contrast, most of the member countries of the European Union can make use of that same percentage of its resources, which are in themselves abundant, in a natural way. This means that they do not need to invest so heavily in the construction of such public works. More than 80% of the resources destined for drinking water and irrigation purposes come from works funded by governments. (Gil, 1995).
Storage and regulation by reservoirs do not always solve the problem of water scarcity in areas where dry periods are particularly damaging to the natural life and also to the human daily life. In those cases, water transfer from areas with a surplus to those with a deficit must be undertaken. Those sort of works involves political, social, economic and environmental considerations which need to be included as elements of resource planning to which governments have to resort occasionally. This happens when the water demands in semi-arid zones are to be met and development continued or maintained. Social groups living in wet areas find it difficult to comprehend this type of operation, and all the studies, works and investments involved.
When facing the problems that water scarcity causes to semi-arid regions in the day-to-day life, water transfer could prove to be, in some cases, an effective and permanent solution in the short and medium term. Such is the case of many of the existing hydrological plans for the developed or developing semi-arid regions of Europe. These plans include either water transfer or salt water treatment as solutions. However, it should be borne in mind that on many occasions, drought periods affect large parts of Europe at the same time, which means that in a natural scarcity situation inter-basin transfers can lose their functionality and strategic value.
Water transfers are not always related to small-scale transfers in which water is conveyed from one small sub-basin to an adjacent one. They also may involve water transfers between large basins, from wet areas to semi-arid areas or those having water
17
scarcity problems. Both small-scale and large-scale transfers mean not only a loss of water in the basins that provide the water, but also social and economical costs.
The economic and social compensation policies for the water providing basin and the intermediate ones which transport and control the transferred resources, usually prove to be a further complication to an operation that attempts to alleviate the water deficiencies in the semi-arid areas.
Monitoring of quantity and quality is generally strictly controlled, even on a political level, with a view to determining whether the transfer is carried out on a seasonal or annual basis. In addition to that, a prediction is also required for controlling the duality between future availability and demands, particularly in summer months. .An accurate short-term prediction of future resources identifies the best time at which water should be transferred and, therefore, avoids possible imbalances arising from water needs prior to the maximum demand in summer.
Although interbasin transfers constitute an element of water resources planning, there are also several disadvantages inherent to such transfers, such as major investments in construction works (aqueducts), leak losses and evaporation losses during the transfers and negative environmental impact. One undesirable situation from the ecological point of view could be the intrusion of foreign species in ecologically delicate equilibria such as those within semi-arid areas, as a result of water transfer between the north and south of Europe (INAG, 1995a).
The corrective measures contemplated in Spain to re-address the existing basin imbalances, as included in the Anteproyecto de Ley del Plan Hidrológico Nacional (National Hydrological Plan Bill (MOPTMA, 1993), involve plans to set up an Integrated System for National Hydraulic Balance (SIEHNA), which will consist of works that will make it possible to interconnect basins and to transfer resources from one to another. The envisaged redistribution of resources is as follows: at present (550*106 m3), in 2002 (2,400*106 m3) and by the year 2012 (3,800*106 m3) (Baltanás, 1985). The only current activity of this kind taking place involves the transfer of water from the Tagus Basin to the Segura Basin (Acueducto Tajo-Segura) -which was designed to transport 33 m3/sec., equivalent to a continuous flow regime of 1,000*106 m3/year. So far an average of 320*106 m3/year has been transferred. The aqueduct for taking water from the River Ebro to supply Bilbao and the Tarragona area and a further system which transports water from the River Segura to the southern reaches of the River Júcar (MOPTMA, 1993) are also operative at present.
Portugal only has small water transfers between catchments Mondego-Tejo (Alto Ceira Reservoir to Sta Luzia Reservoir) for hydropower production, Sado-Morgavel, for water supply purpose, and Guadiana-Algarve (Beliche-Odeleite system under construction).
In Sardinia there is one water transfer. It joins up the Flumendosa catchment area and the Campidano plain. A 147 km-length open channel and a 23 km-length underground tube convey the water from the Flumendosa and Mulargia reservoirs (2,5*106 m3 capacity) for domestic, agricultural, industrial and tourist uses.
18
In Greece, two dams (Mornos dam and Evinos dam) have been built to transfer water between basins. The first of them supply the Attiki region from the Mornos catchment area. The second one transfers water from the Evinos river to the Mornos catchment area, in order to satisfy the growing water demand of Athens (Attiki area). There is another transfer system (under construction) in the region of Acheloos which will transfer water for irrigation purposes.
3.3. Reservoir and lake eutrophication
The characteristics of the eutrophication processes in reservoir and lakes, are quite specific in the semi-arid areas of the EEA. Not only do the problems derived from eutrophication affect both the quality of water for irrigation and human consumption, but they also have an adverse effect on the river and reservoir fauna.
An increase in nutrients (nitrogen and phosphorus), and thus eutrophication in semi-arid areas, is enhanced by temperature and light, which are the two predominant factors in biological production. Phosphorus is usually the main nutrient responsible for freshwater eutrophication, whereas nitrogen is the primary nutrient causing eutrophication of coastal areas and seas.
In contrast to the wet areas of Europe, potential evapotranspiration exceeds precipitation in the semi-arid zones. As result, many reservoirs and lakes lose large amounts of water of good quality not replaced by precipitation. The concentration of salts reaches much higher levels than in the wet zones, particularly those salts (phosphorus) which serve as nutrients for algae.
In most cases in semi-arid zones there is a natural tendency for reservoirs to lose their oligotrophic characteristics unless they are much more closely monitored and protected by legislation than in the wet zones. The eutrophic and mesotrophic levels are often high, without this having been induced by major incidences of contamination.
Erosion of the basins is another phenomenon that produces eutrophication, because this brings about an increasing accumulation of sediment in the reservoir which, in turn, gives rise to a greater exchange between the dissolved elements present in the water and the materials lying on the bed.
The fact that the water resources are scarce in semi-arid areas, means that there is a greater degree of water re-use and, therefore, are more susceptible to eutrophication processes than the areas having more abundant supplies.
3.3.1. Spain
The General Directorate of Hydraulic Works has carried out fieldwork to measure and study the limnological state of its reservoirs. Data are available for 411 reservoirs which, although this accounts for over 40% of the total, have been chosen so that they cover 85% of the country’s water storage capacity. By extrapolating the results obtained from this limnological survey, it can be deduced that 31% of the reservoirs, containing 40%
19
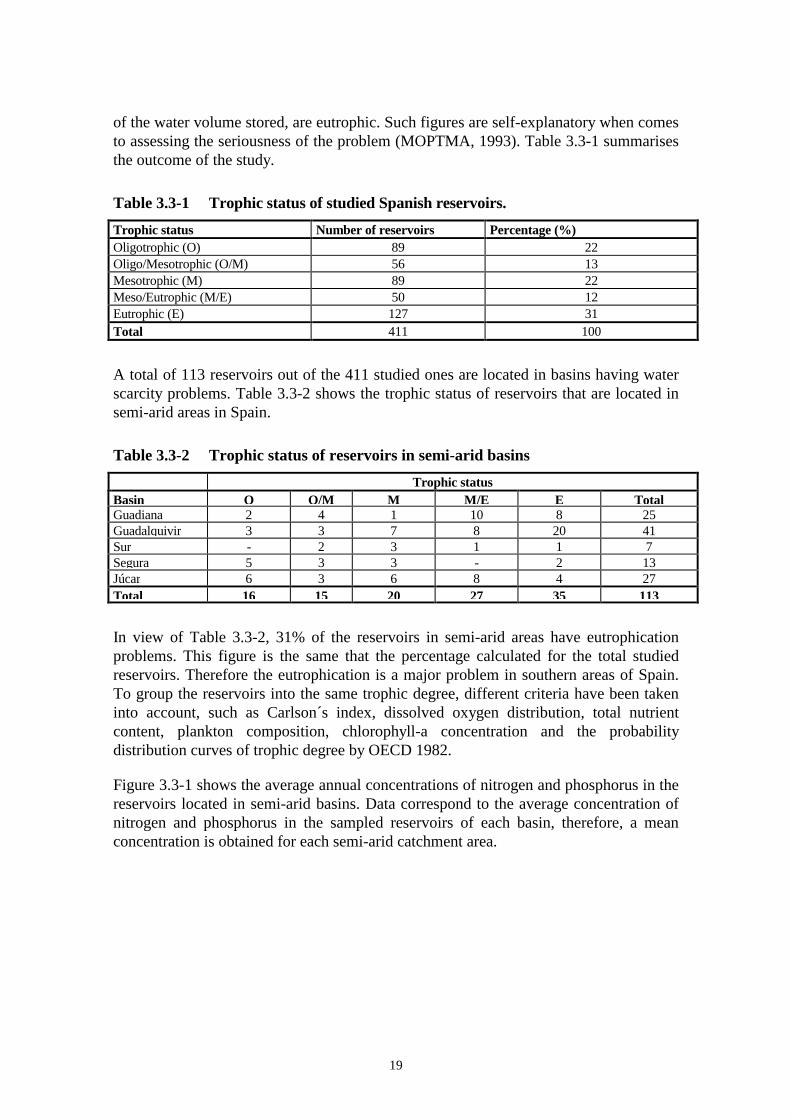
of the water volume stored, are eutrophic. Such figures are self-explanatory when comes to assessing the seriousness of the problem (MOPTMA, 1993). Table 3.3-1 summarises the outcome of the study.
Table 3.3-1 Trophic status of studied Spanish reservoirs. Trophic status Number of reservoirs Percentage (%) Oligotrophic (O) 89 22 Oligo/Mesotrophic (O/M) 56 13 Mesotrophic (M) 89 22 Meso/Eutrophic (M/E) 50 12 Eutrophic (E) 127 31 Total 411 100
A total of 113 reservoirs out of the 411 studied ones are located in basins having water scarcity problems. Table 3.3-2 shows the trophic status of reservoirs that are located in semi-arid areas in Spain.
Table 3.3-2 Trophic status of reservoirs in semi-arid basins Trophic status Basin O O/M M M/E E TotalGuadiana 2 4 1 10 8 25Guadalquivir 3 3 7 8 20 41Sur - 2 3 1 1 7 Segura 5 3 3 - 2 13Júcar 6 3 6 8 4 27Total 16 15 20 27 35 113
In view of Table 3.3-2, 31% of the reservoirs in semi-arid areas have eutrophication problems. This figure is the same that the percentage calculated for the total studied reservoirs. Therefore the eutrophication is a major problem in southern areas of Spain. To group the reservoirs into the same trophic degree, different criteria have been taken into account, such as Carlson´s index, dissolved oxygen distribution, total nutrient content, plankton composition, chlorophyll-a concentration and the probability distribution curves of trophic degree by OECD 1982.
Figure 3.3-1 shows the average annual concentrations of nitrogen and phosphorus in the reservoirs located in semi-arid basins. Data correspond to the average concentration of nitrogen and phosphorus in the sampled reservoirs of each basin, therefore, a mean concentration is obtained for each semi-arid catchment area.

20
Reservoir eutrophication in Spain
1,1431,253
0,971 1,017
0,579
0,380
0,1330,061 0,060 0,083
0
0,2
0,4
0,6
0,8
1
1,2
1,4
Guadiana Guadalquivir Sur Segura Jucar
N/P
(mg/
l)
Average Nitrogen concentration (mg/l)
Average Phosphorous concentration (mg/l)
Figure 3.3-1 Nitrogen and Phosphorus concentration in Spanish reservoirs.
Apart from assessing nitrogen and phosphorus concentration, other indicators for determining whether or not the reservoirs have eutrophication problems are the existence of stratification, the mean oxygen concentration measured close to the bottom and the mean surface chloride concentration. Table 3.3.-3 shows the figures related to these features. The Guadalquivir catchment area appears to have reservoirs with major eutrophication problems; 49% of the reservoirs are eutrophic and have the highest surface chloride average concentrations and the lowest value of oxygen measured in deep waters. The average nitrogen concentration is also high, (maximum 8.4 mg/l). On the other hand, the reservoirs located in the Jucar and Sur catchment areas are in a better situation, the latter having high values of oxygen measured at low depth, and low values of surface chloride.
3.3.2. Portugal
The Directorate of Water Resources in Portugal has carried out a classification of the trophic state of Portuguese reservoirs. As a result of these works, 62 reservoirs turn out to be classified as being oligotrophic and only 10 show eutrophication problems.
Data from Portuguese reservoirs are summarised in table 3.3-4 (INAG, 1995b):
21
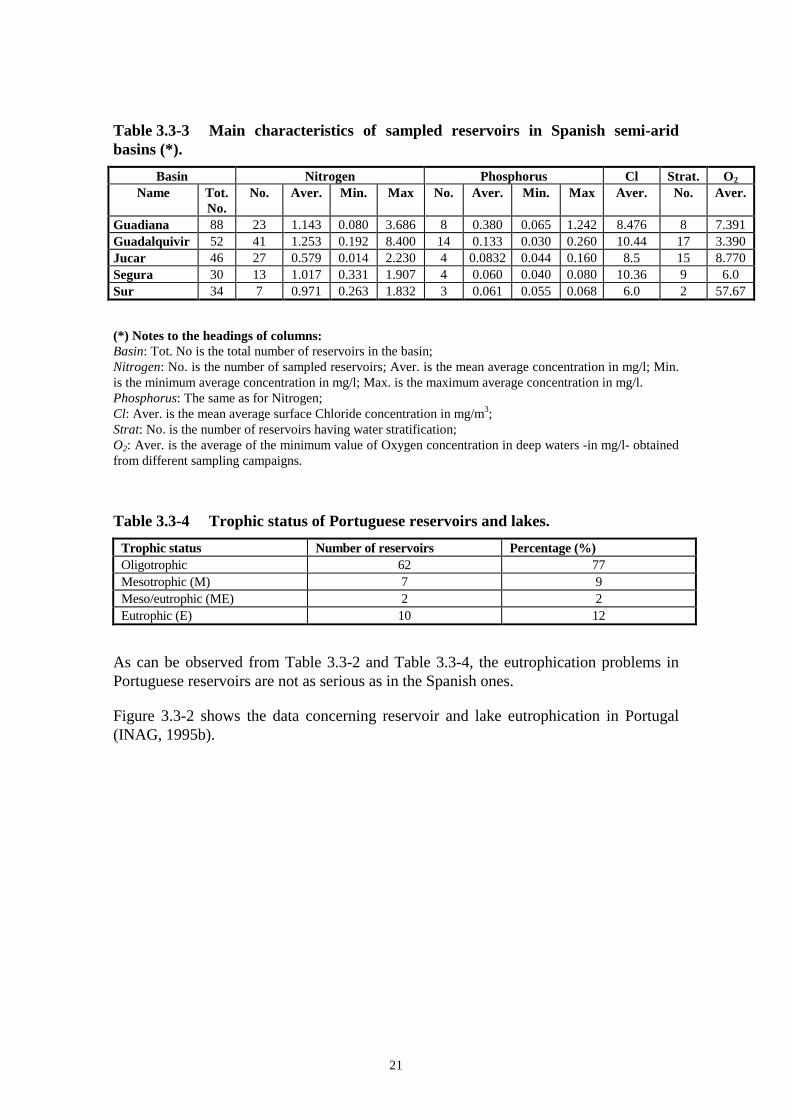
Table 3.3-3 Main characteristics of sampled reservoirs in Spanish semi-arid basins (*).
Basin Nitrogen Phosphorus Cl Strat. O2 Name Tot.
No. No. Aver. Min. Max No. Aver. Min. Max Aver. No. Aver.
Guadiana 88 23 1.143 0.080 3.686 8 0.380 0.065 1.242 8.476 8 7.391 Guadalquivir 52 41 1.253 0.192 8.400 14 0.133 0.030 0.260 10.44 17 3.390 Jucar 46 27 0.579 0.014 2.230 4 0.0832 0.044 0.160 8.5 15 8.770 Segura 30 13 1.017 0.331 1.907 4 0.060 0.040 0.080 10.36 9 6.0 Sur 34 7 0.971 0.263 1.832 3 0.061 0.055 0.068 6.0 2 57.67 (*) Notes to the headings of columns: Basin: Tot. No is the total number of reservoirs in the basin; Nitrogen: No. is the number of sampled reservoirs; Aver. is the mean average concentration in mg/l; Min. is the minimum average concentration in mg/l; Max. is the maximum average concentration in mg/l. Phosphorus: The same as for Nitrogen; Cl: Aver. is the mean average surface Chloride concentration in mg/m3; Strat: No. is the number of reservoirs having water stratification; O2: Aver. is the average of the minimum value of Oxygen concentration in deep waters -in mg/l- obtained from different sampling campaigns.
Table 3.3-4 Trophic status of Portuguese reservoirs and lakes. Trophic status Number of reservoirs Percentage (%) Oligotrophic 62 77 Mesotrophic (M) 7 9 Meso/eutrophic (ME) 2 2 Eutrophic (E) 10 12
As can be observed from Table 3.3-2 and Table 3.3-4, the eutrophication problems in Portuguese reservoirs are not as serious as in the Spanish ones.
Figure 3.3-2 shows the data concerning reservoir and lake eutrophication in Portugal (INAG, 1995b).
22
Reservoir and lake eutrophication in Portugal
0
0,2
0,4
0,6
0,8
1
1,2
1,4M
irand
a (E
1)
Pico
te (E
1)
Bem
post
a (E
1)
Poci
nho
(E1)
Vale
ira (E
1)
Reg
ua (M
1)
Povo
a (E
2)
Poio
(E2)
Mar
anha
o (M
2)
Div
or (E
2)
Mag
os (E
2)
Cai
a (M
3)
Luce
feci
t (M
E3)
Vigi
a (M
3)
Mon
te N
ovo
(ME3
)
Pego
do
Alta
r (M
4)
Vale
do
Gai
o (E
4)
Rox
o (M
4)
Alvi
to (M
4)
P, N
(mg/
l)
0
100
200
300
400
500
600
700
800
Prec
ipita
tion
(mm
)
mg/l N
mg/l P
Mean annualprecipitation
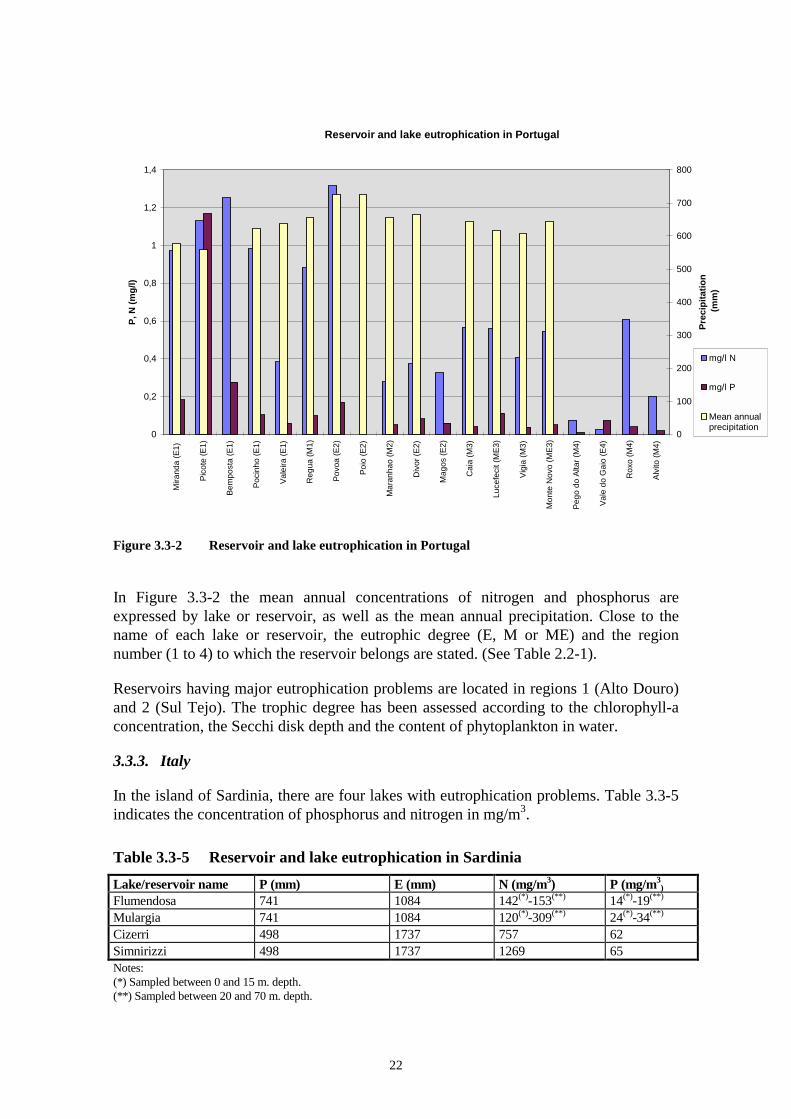
Figure 3.3-2 Reservoir and lake eutrophication in Portugal
In Figure 3.3-2 the mean annual concentrations of nitrogen and phosphorus are expressed by lake or reservoir, as well as the mean annual precipitation. Close to the name of each lake or reservoir, the eutrophic degree (E, M or ME) and the region number (1 to 4) to which the reservoir belongs are stated. (See Table 2.2-1).
Reservoirs having major eutrophication problems are located in regions 1 (Alto Douro) and 2 (Sul Tejo). The trophic degree has been assessed according to the chlorophyll-a concentration, the Secchi disk depth and the content of phytoplankton in water.
3.3.3. Italy
In the island of Sardinia, there are four lakes with eutrophication problems. Table 3.3-5 indicates the concentration of phosphorus and nitrogen in mg/m3.
Table 3.3-5 Reservoir and lake eutrophication in Sardinia Lake/reservoir name P (mm) E (mm) N (mg/m3) P (mg/m3
) Flumendosa 741 1084 142(*)-153(**) 14(*)-19(**) Mulargia 741 1084 120(*)-309(**) 24(*)-34(**) Cizerri 498 1737 757 62 Simnirizzi 498 1737 1269 65 Notes: (*) Sampled between 0 and 15 m. depth. (**) Sampled between 20 and 70 m. depth.
23
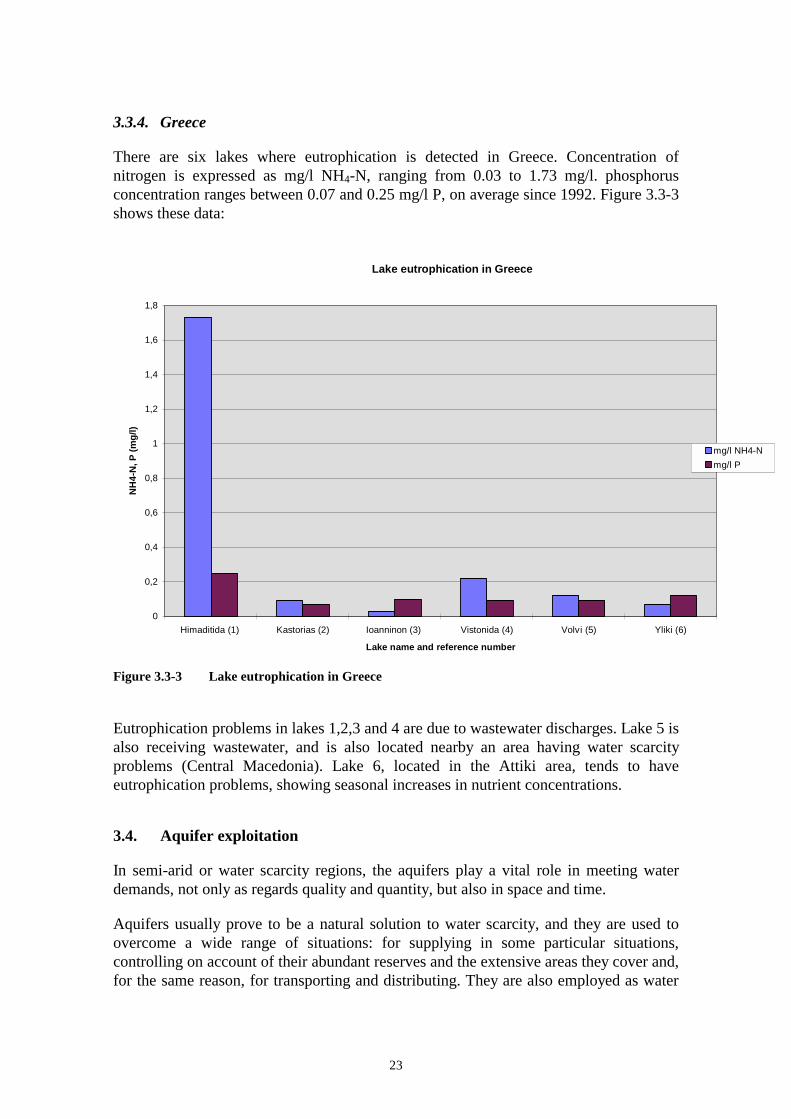
3.3.4. Greece
There are six lakes where eutrophication is detected in Greece. Concentration of nitrogen is expressed as mg/l NH4-N, ranging from 0.03 to 1.73 mg/l. phosphorus concentration ranges between 0.07 and 0.25 mg/l P, on average since 1992. Figure 3.3-3 shows these data:
Lake eutrophication in Greece
0
0,2
0,4
0,6
0,8
1
1,2
1,4
1,6
1,8
Himaditida (1) Kastorias (2) Ioanninon (3) Vistonida (4) Volvi (5) Yliki (6)
Lake name and reference number
NH
4-N
, P (m
g/l)
mg/l NH4-Nmg/l P
Figure 3.3-3 Lake eutrophication in Greece
Eutrophication problems in lakes 1,2,3 and 4 are due to wastewater discharges. Lake 5 is also receiving wastewater, and is also located nearby an area having water scarcity problems (Central Macedonia). Lake 6, located in the Attiki area, tends to have eutrophication problems, showing seasonal increases in nutrient concentrations.
3.4. Aquifer exploitation
In semi-arid or water scarcity regions, the aquifers play a vital role in meeting water demands, not only as regards quality and quantity, but also in space and time.
Aquifers usually prove to be a natural solution to water scarcity, and they are used to overcome a wide range of situations: for supplying in some particular situations, controlling on account of their abundant reserves and the extensive areas they cover and, for the same reason, for transporting and distributing. They are also employed as water
24
quality protection elements, by providing quality reserves in zones where the surface runoff in summer proves insufficient to maintain acceptable quality standards, and even when the runoff is too low to maintain minimum or ecological discharges.
However the use of the potential of aquifers in semi-arid areas brings with it the problem of average annual recharge and the difficulties involved in its management.
Some southern EEA areas have very little aquifer recharge. It becomes worse taking into account the great amount of tourism in those areas, particularly in summer months, making demands to rise to very high values compared to the rest of the year. In addition, the climate in those areas allow the cultivation of high value crops, which also require a great deal of water for irrigation in spring and summer.
The management problems, understood as a set of operational rules that determine the handling of aquifers in particular and water resource systems in general, prove particularly difficult and costly to manage and maintain.
Intensive exploitation of aquifers can give rise to over-exploitation problems. Aquifer over-exploitation depends on the balance between demand and renewable resources. In the semi-arid Mediterranean regions of Europe the absence of high rainfall and the existence of ephemeral rivers make an increasing development of groundwater resources. This leads to over-exploitation, which commonly arises from excessive abstraction for irrigation. The resulting increase in productivity and change in land use can establish a cycle of unsustainable socio-economic development within an irrigated region. Additional resources are exploited to satisfy the increased demand from the population and agriculture, exacerbating the already fragile environment by reducing groundwater levels and, in some circumstances, accelerating the desertification processes (EEC, 1994). Wetlands or wet ecosystems are also damaged when the water table drops. In contrast, over-exploitation in Northern Europe is mainly a consequence of the fact that groundwater resources have historically provided a low-cost, high-quality source for public water supply. Current issues are the cost of alternative water sources, the associated infrastructure and the environmental impact of over-exploitation.
In 1991 the EC DG XI commissioned a report into the sustainable use of groundwater in Europe (RIVM/RIZA, 1991). It was based on the earlier work of Fried (1983) in which a preliminary inventory of known European cases was prepared. Over-exploitation turned out to be the major threat to the sustainable use of groundwater in Europe. The development of guidelines for environmental impact analysis, management tools, standardised data management and abstraction licensing were cited as key requirements for improving management of groundwater resources.
Contamination problems also affect numerous aquifers, either because of point-source pollution or as a result of a widespread pollution caused by agricultural and livestock activities. Any potential decrease in water quality depends on the activities affecting the underlying or adjacent aquifers.
25
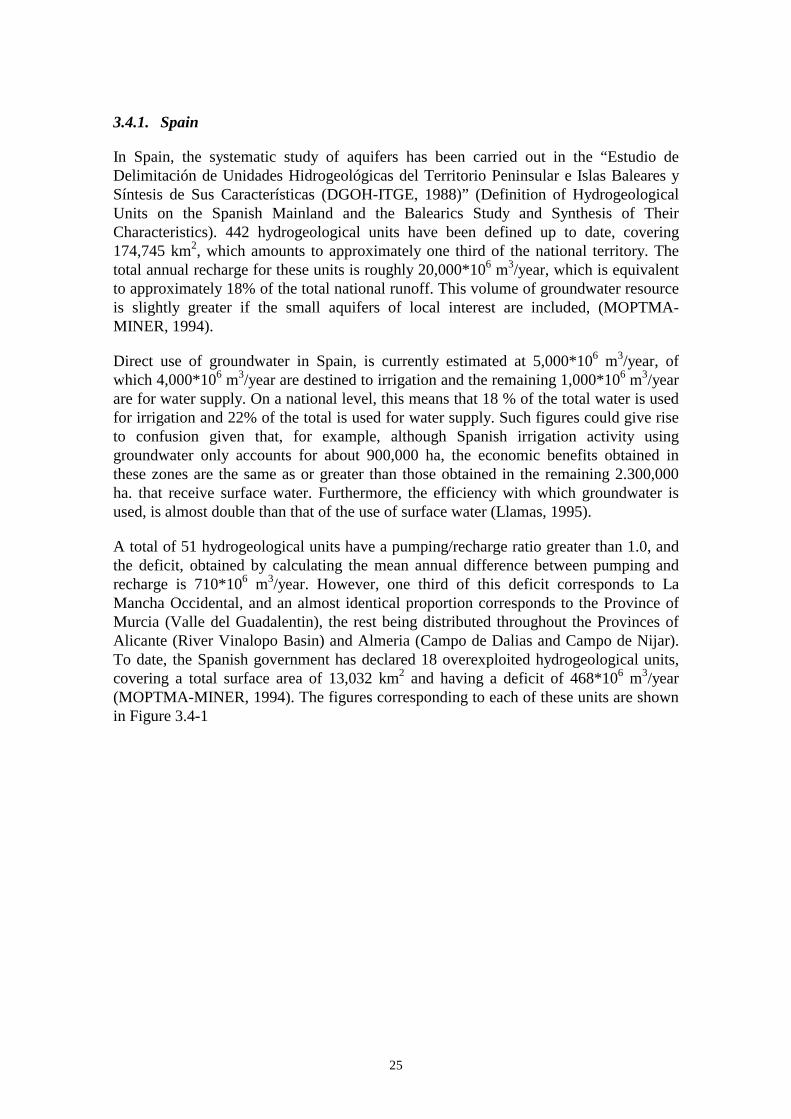
3.4.1. Spain
In Spain, the systematic study of aquifers has been carried out in the “Estudio de Delimitación de Unidades Hidrogeológicas del Territorio Peninsular e Islas Baleares y Síntesis de Sus Características (DGOH-ITGE, 1988)” (Definition of Hydrogeological Units on the Spanish Mainland and the Balearics Study and Synthesis of Their Characteristics). 442 hydrogeological units have been defined up to date, covering 174,745 km2, which amounts to approximately one third of the national territory. The total annual recharge for these units is roughly 20,000*106 m3/year, which is equivalent to approximately 18% of the total national runoff. This volume of groundwater resource is slightly greater if the small aquifers of local interest are included, (MOPTMA-MINER, 1994).
Direct use of groundwater in Spain, is currently estimated at 5,000*106 m3/year, of which 4,000*106 m3/year are destined to irrigation and the remaining 1,000*106 m3/year are for water supply. On a national level, this means that 18 % of the total water is used for irrigation and 22% of the total is used for water supply. Such figures could give rise to confusion given that, for example, although Spanish irrigation activity using groundwater only accounts for about 900,000 ha, the economic benefits obtained in these zones are the same as or greater than those obtained in the remaining 2.300,000 ha. that receive surface water. Furthermore, the efficiency with which groundwater is used, is almost double than that of the use of surface water (Llamas, 1995).
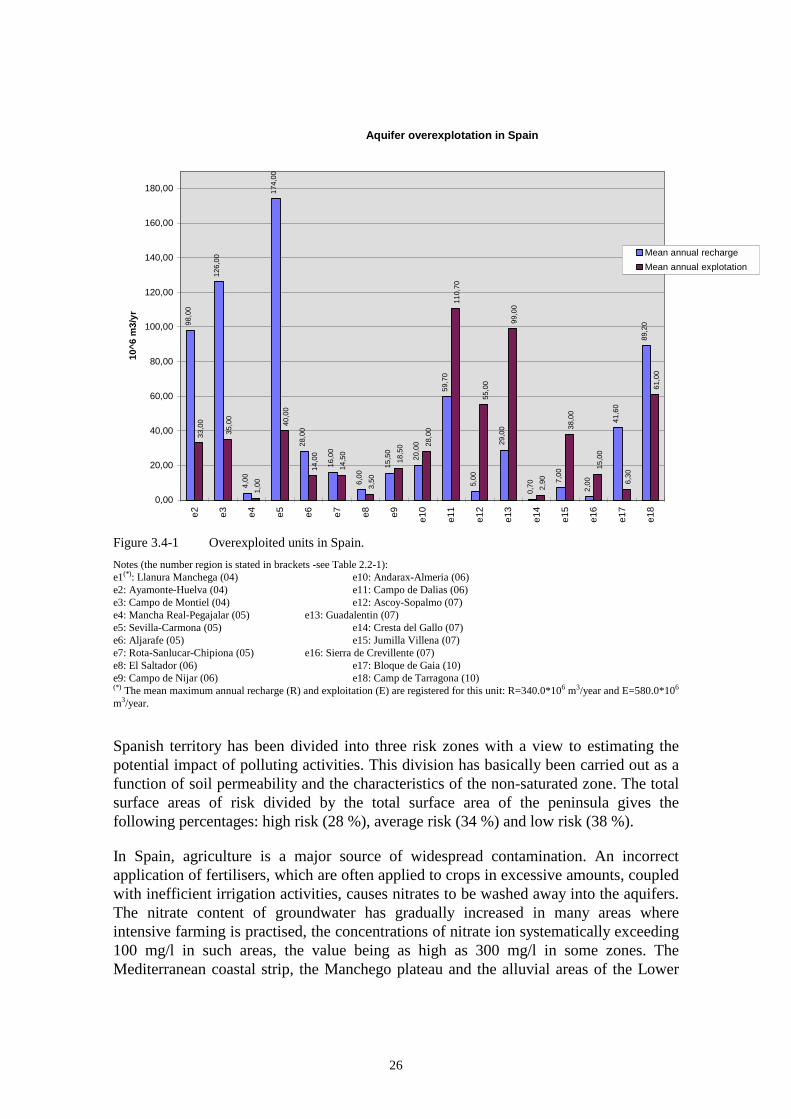
A total of 51 hydrogeological units have a pumping/recharge ratio greater than 1.0, and the deficit, obtained by calculating the mean annual difference between pumping and recharge is 710*106 m3/year. However, one third of this deficit corresponds to La Mancha Occidental, and an almost identical proportion corresponds to the Province of Murcia (Valle del Guadalentin), the rest being distributed throughout the Provinces of Alicante (River Vinalopo Basin) and Almeria (Campo de Dalias and Campo de Nijar). To date, the Spanish government has declared 18 overexploited hydrogeological units, covering a total surface area of 13,032 km2 and having a deficit of 468*106 m3/year (MOPTMA-MINER, 1994). The figures corresponding to each of these units are shown in Figure 3.4-1
26
Aquifer overexplotation in Spain
98,0
0
126,
00
4,00
174,
00
28,0
0
16,0
0
6,00
15,5
0
20,0
0
59,7
0
5,00
29,0
0
0,70 7,
00
2,00
41,6
0
89,2
0
33,0
0
35,0
0
1,00
40,0
0
14,0
0
14,5
0
3,50
18,5
0 28,0
0
110,
70
55,0
0
99,0
0
2,90
38,0
0
15,0
0
6,30
61,0
0
0,00
20,00
40,00
60,00
80,00
100,00
120,00
140,00
160,00
180,00e2 e3 e4 e5 e6 e7 e8 e9 e1
0
e11
e12
e13
e14
e15
e16
e17
e18
10^6
m3/
yr
Mean annual rechargeMean annual explotation
Figure 3.4-1 Overexploited units in Spain. Notes (the number region is stated in brackets -see Table 2.2-1): e1(*): Llanura Manchega (04) e10: Andarax-Almeria (06) e2: Ayamonte-Huelva (04) e11: Campo de Dalias (06) e3: Campo de Montiel (04) e12: Ascoy-Sopalmo (07) e4: Mancha Real-Pegajalar (05) e13: Guadalentin (07) e5: Sevilla-Carmona (05) e14: Cresta del Gallo (07) e6: Aljarafe (05) e15: Jumilla Villena (07) e7: Rota-Sanlucar-Chipiona (05) e16: Sierra de Crevillente (07) e8: El Saltador (06) e17: Bloque de Gaia (10) e9: Campo de Nijar (06) e18: Camp de Tarragona (10) (*) The mean maximum annual recharge (R) and exploitation (E) are registered for this unit: R=340.0*106 m3/year and E=580.0*106 m3/year.
Spanish territory has been divided into three risk zones with a view to estimating the potential impact of polluting activities. This division has basically been carried out as a function of soil permeability and the characteristics of the non-saturated zone. The total surface areas of risk divided by the total surface area of the peninsula gives the following percentages: high risk (28 %), average risk (34 %) and low risk (38 %).
In Spain, agriculture is a major source of widespread contamination. An incorrect application of fertilisers, which are often applied to crops in excessive amounts, coupled with inefficient irrigation activities, causes nitrates to be washed away into the aquifers. The nitrate content of groundwater has gradually increased in many areas where intensive farming is practised, the concentrations of nitrate ion systematically exceeding 100 mg/l in such areas, the value being as high as 300 mg/l in some zones. The Mediterranean coastal strip, the Manchego plateau and the alluvial areas of the Lower
27
Guadalquivir, are all areas where the contamination process is most acute (MOPTMA-MINER, 1994).
3.4.2. Portugal
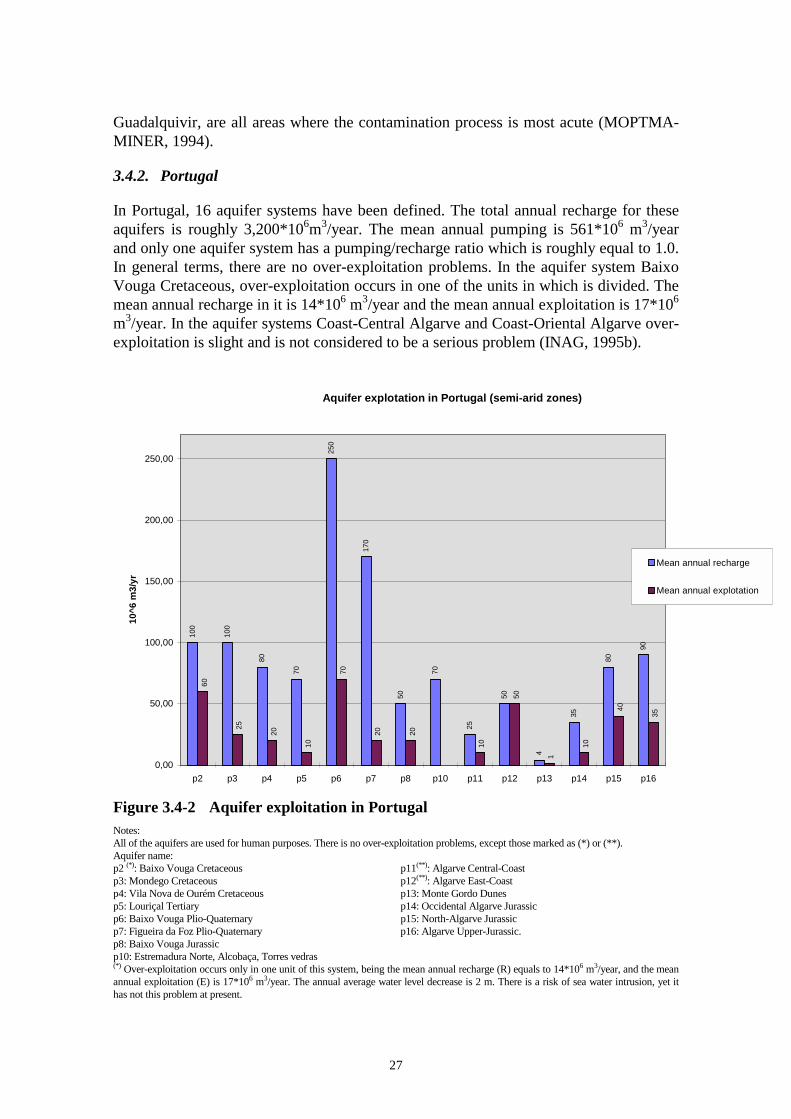
In Portugal, 16 aquifer systems have been defined. The total annual recharge for these aquifers is roughly 3,200*106m3/year. The mean annual pumping is 561*106 m3/year and only one aquifer system has a pumping/recharge ratio which is roughly equal to 1.0. In general terms, there are no over-exploitation problems. In the aquifer system Baixo Vouga Cretaceous, over-exploitation occurs in one of the units in which is divided. The mean annual recharge in it is 14*106 m3/year and the mean annual exploitation is 17*106 m3/year. In the aquifer systems Coast-Central Algarve and Coast-Oriental Algarve over-exploitation is slight and is not considered to be a serious problem (INAG, 1995b).
Aquifer explotation in Portugal (semi-arid zones)
100
100
80
70
250
170
50
70
25
50
4
35
80
90
60
25
20
10
70
20 20
10
50
1
10
40
35
0,00
50,00
100,00
150,00
200,00
250,00
p2 p3 p4 p5 p6 p7 p8 p10 p11 p12 p13 p14 p15 p16
10^6
m3/
yr
Mean annual recharge
Mean annual explotation
Figure 3.4-2 Aquifer exploitation in Portugal Notes: All of the aquifers are used for human purposes. There is no over-exploitation problems, except those marked as (*) or (**). Aquifer name: p2 (*): Baixo Vouga Cretaceous p11(**): Algarve Central-Coast p3: Mondego Cretaceous p12(**): Algarve East-Coast p4: Vila Nova de Ourém Cretaceous p13: Monte Gordo Dunes p5: Louriçal Tertiary p14: Occidental Algarve Jurassic p6: Baixo Vouga Plio-Quaternary p15: North-Algarve Jurassic p7: Figueira da Foz Plio-Quaternary p16: Algarve Upper-Jurassic. p8: Baixo Vouga Jurassic p10: Estremadura Norte, Alcobaça, Torres vedras (*) Over-exploitation occurs only in one unit of this system, being the mean annual recharge (R) equals to 14*106 m3/year, and the mean annual exploitation (E) is 17*106 m3/year. The annual average water level decrease is 2 m. There is a risk of sea water intrusion, yet it has not this problem at present.
28
(**) There are some overexploited points, having little importance. The maximum mean annual recharges are registered in aquifers p1 and p9 as follows: p1: Tejo and Sado Mio-Pliocene; R=1,600 *106 m3/year, E=150 *106 m3/year p9: Orla estremenha Jurassic; R=470 *106 m3/year, E=40 *106 m3/year
3.4.3. Italy
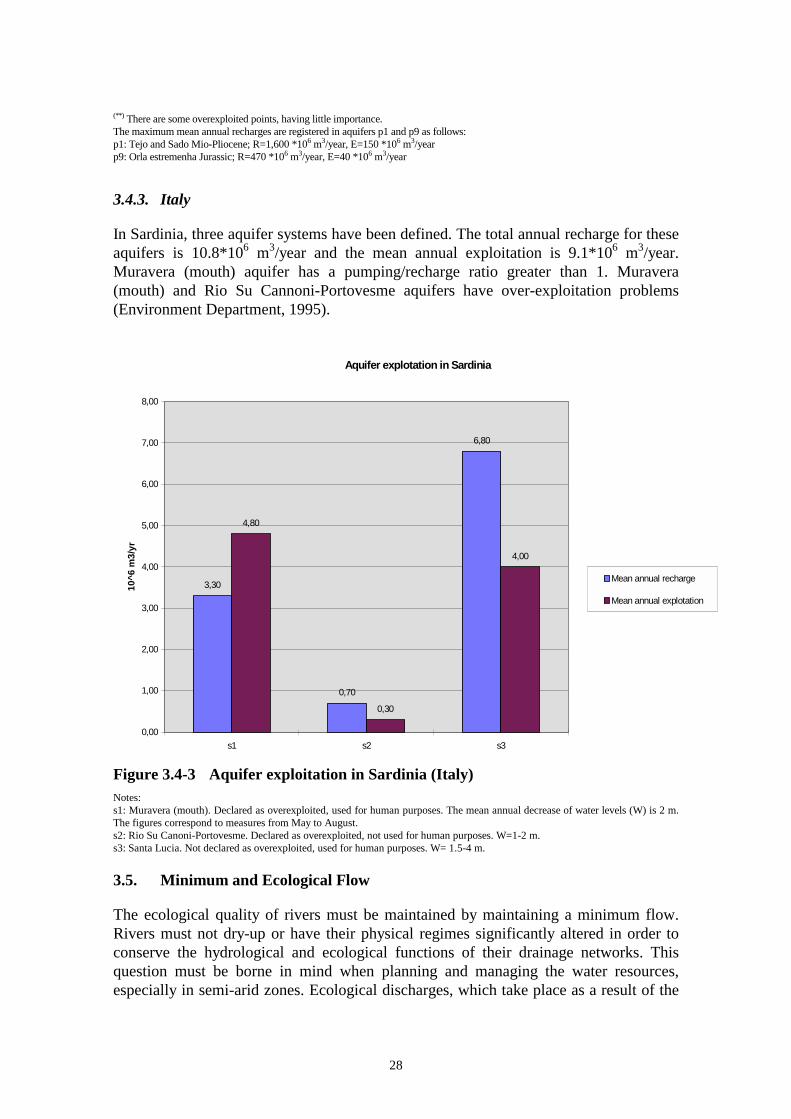
In Sardinia, three aquifer systems have been defined. The total annual recharge for these aquifers is 10.8*106 m3/year and the mean annual exploitation is 9.1*106 m3/year. Muravera (mouth) aquifer has a pumping/recharge ratio greater than 1. Muravera (mouth) and Rio Su Cannoni-Portovesme aquifers have over-exploitation problems (Environment Department, 1995).
Aquifer explotation in Sardinia
3,30
0,70
6,80
4,80
0,30
4,00
0,00
1,00
2,00
3,00
4,00
5,00
6,00
7,00
8,00
s1 s2 s3
10^6
m3/
yr
Mean annual recharge
Mean annual explotation
Figure 3.4-3 Aquifer exploitation in Sardinia (Italy) Notes: s1: Muravera (mouth). Declared as overexploited, used for human purposes. The mean annual decrease of water levels (W) is 2 m. The figures correspond to measures from May to August. s2: Rio Su Canoni-Portovesme. Declared as overexploited, not used for human purposes. W=1-2 m. s3: Santa Lucia. Not declared as overexploited, used for human purposes. W= 1.5-4 m.
3.5. Minimum and Ecological Flow
The ecological quality of rivers must be maintained by maintaining a minimum flow. Rivers must not dry-up or have their physical regimes significantly altered in order to conserve the hydrological and ecological functions of their drainage networks. This question must be borne in mind when planning and managing the water resources, especially in semi-arid zones. Ecological discharges, which take place as a result of the
29
aquifer discharges in a natural regime, can be artificially maintained by reservoir management. The determination and mapping of ecological flows for semi-arid areas of EEA is, therefore, considered to be of paramount importance (INAG, 1995a).
Some of the Spanish River Authorities have decided that ecological use is the next highest priority after water supply to cities and towns. The Spanish Water Act (BOE, 1986) refers to the need of maintaining a minimum discharge with a view to guaranteeing the conservation of natural environments. However, neither the Act nor the regulations that develop it are explicit about how to calculate such a discharge or its relationship with the ecological discharge, these questions being left to the discretion and responsibility of the various River Authorities (Ruiz, 1993). One of the few existing ways to approach the problem of determining the ecological flow, is included in the legislation for the Principality of Asturias (Consejo Gobierno del Principado de Asturias, 1987), where river reaches are divided into three types (trout fishing, of fishing interest and salmon fishing); different ecological discharges are established as a function of the discharges guaranteed for 347 days of the year.
3.6. Wetlands
Wetlands, are a result of an interaction between a variety of factors (geological, climatic, anthropogenic, etc.) which give rise to zones where there is a runoff concentration, whose supply (surface, groundwater or a combination of both) allows the water level to remain constant.
Although wetlands constitute one of the outstanding and singular elements in the landscape of a semi-arid zone, the required attention has not been given to them until recent times. An overall approach must be made to these ecological systems in order to be able to develop management strategies which permit the long-term conservation and ecological and cultural integrity of these functional units. If management strategies are to be developed, it is essential that wetlands be considered as forming an integral part of the water cycle in a state of permanent interaction with the river basins (Montes, 1994).
The Spanish Directorate General of Hydraulic Works published in 1990 a document entitled “Estudio de las Zonas Húmedas de la España Peninsular. Inventario y Tipificación”, (Wetlands on the Spanish Mainland, Inventory and Typification). This inventory contains the characteristics of 1,544 wetlands. Some of them are coastal phenomena (The Mar Menor, the Marshlands of the Guadalquivir, etc.), while others are lakes (Sanabria, Bañolas, Albufera, etc.) and the rest are all wetlands in the strictest sense of the word. Over 50% of the wetlands featured in this document are related to aquifers, 440 cover a surface area of more than ten hectares, but only 25 are in excess of 1,000 ha (MOPTMA-MINER, 1994).
In Spain, the current wetland surface area has dropped from 1,240 km2 to 800 km2 -excluding the Guadalquivir marshlands- (MOPTMA-MINER, 1994). This reduction is a consequence of different human activities, such as draining in order to reduce the risk to human health, and the lowering of the water table for water supply. The most remarkable example of the latter affect the river Guadiana (Tablas de Daimiel, Ojos del

30
Guadiana, etc.) where excessive groundwater pumping has not only brought about socio-economic problems, but has also led to the disappearance of numerous wetland areas.
Because the surface area covered by wetlands is relatively limited, to state that they play a key role in controlling the ecological processes taking place on a regional or European level would be an exaggeration. Nevertheless, the locally important hydrological, chemical, biological and ecological properties of wetlands and their socio-economic value is beyond question (Montes y Bifani, 1991).
3.7. Seawater intrusion in coastal aquifers
The exploitation of coastal aquifers always produces a lowering of the water table levels which are protected by the effects in the coastal strip of the sea level. When the extracted volumes are greater than the recharge, even on a local basis, a salinisation process begins in the aquifer as the seawater flows upon the land. In the light of this, the management of coastal aquifers is conditioned by the need to determine the maximum permissible penetration limit for each particular aquifer (MOPTMA-MINER, 1984).
The problem of aquifer contamination by seawater intrusion, together with the extent and seriousness of the problem, are mainly conditioned by three factors: the difference between the respective densities of the fresh and salt water, the hydrodynamic properties of the aquifer and the flow that the aquifer discharges into the sea.
The first two factors are intrinsic to the seawater intrusion problem regardless of the climate in the region. Furthermore, these two parameters are fixed, and cannot be modified by the usual anthropogenic activity. The flow that the aquifers discharge into the sea is conditioned by natural conditions (from rainfall) or artificial recharge (mainly from irrigation) and by pumping. Therefore, anthropogenic actions can bring about some modifications.
The main salinity problems in the semi-arid zones of Europe are caused by a scarce recharge by rainfall. This problem is further aggravated by the fact that the climates in these areas attracts an influx of European tourism, especially in the summer months. Such a situation causes imbalances, water shortage problems and costly and complicated management mechanisms.
Furthermore, the solutions that have been usually adopted in the fight against saline intrusion, are rather inappropriate to the semi-arid zones of Europe. The most common technique is to increase the groundwater flow from the aquifers to the sea. Another is to recharge water reserves in technically strategic coastal zones. However, it is difficult to obtain freshwater recharge sources in semi-arid areas. Slightly diluted wastewater constitutes a further problem when attempting to fight seawater intrusion and, finally, given that the recharge installations would have to cover an extensive surface area, the availability of land for such purposes is both scarce and costly and carries its own environmental impact.
31
3.7.1. Spain
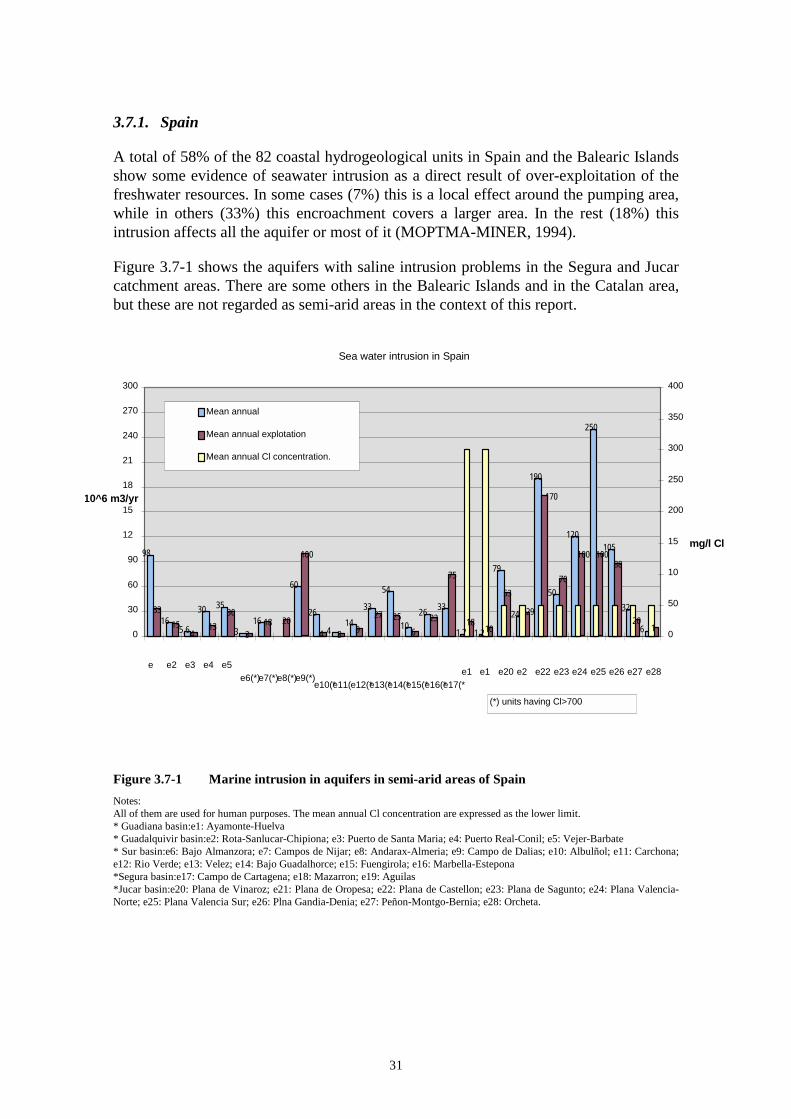
A total of 58% of the 82 coastal hydrogeological units in Spain and the Balearic Islands show some evidence of seawater intrusion as a direct result of over-exploitation of the freshwater resources. In some cases (7%) this is a local effect around the pumping area, while in others (33%) this encroachment covers a larger area. In the rest (18%) this intrusion affects all the aquifer or most of it (MOPTMA-MINER, 1994).
Figure 3.7-1 shows the aquifers with saline intrusion problems in the Segura and Jucar catchment areas. There are some others in the Balearic Islands and in the Catalan area, but these are not regarded as semi-arid areas in the context of this report.
Sea water intrusion in Spain
98
165,6
30 35
316
60
26
414
33
54
1026 33
1,7 1,2
79
24
190
50
120
250
105
32
6
3315
413
30
318 20
100
4 3 927 25
623
75
1810
5370
100 10088
201
170
29
0
30
60
90
12
15
18
21
240
270
300
e e2 e3 e4 e5e6(*)e7(*)e8(*)e9(*)
e10(*e11(e12(*e13(*e14(*e15(*e16(*e17(*e1 e1 e20 e2 e22 e23 e24 e25 e26 e27 e28
10^6 m3/yr
0
50
10
15
200
250
300
350
400
mg/l Cl
Mean annual
Mean annual explotation
Mean annual Cl concentration.
(*) units having Cl>700
Figure 3.7-1 Marine intrusion in aquifers in semi-arid areas of Spain Notes: All of them are used for human purposes. The mean annual Cl concentration are expressed as the lower limit. * Guadiana basin:e1: Ayamonte-Huelva * Guadalquivir basin:e2: Rota-Sanlucar-Chipiona; e3: Puerto de Santa Maria; e4: Puerto Real-Conil; e5: Vejer-Barbate * Sur basin:e6: Bajo Almanzora; e7: Campos de Nijar; e8: Andarax-Almeria; e9: Campo de Dalias; e10: Albulñol; e11: Carchona; e12: Rio Verde; e13: Velez; e14: Bajo Guadalhorce; e15: Fuengirola; e16: Marbella-Estepona *Segura basin:e17: Campo de Cartagena; e18: Mazarron; e19: Aguilas *Jucar basin:e20: Plana de Vinaroz; e21: Plana de Oropesa; e22: Plana de Castellon; e23: Plana de Sagunto; e24: Plana Valencia-Norte; e25: Plana Valencia Sur; e26: Plna Gandia-Denia; e27: Peñon-Montgo-Bernia; e28: Orcheta.
32
3.7.2. Portugal
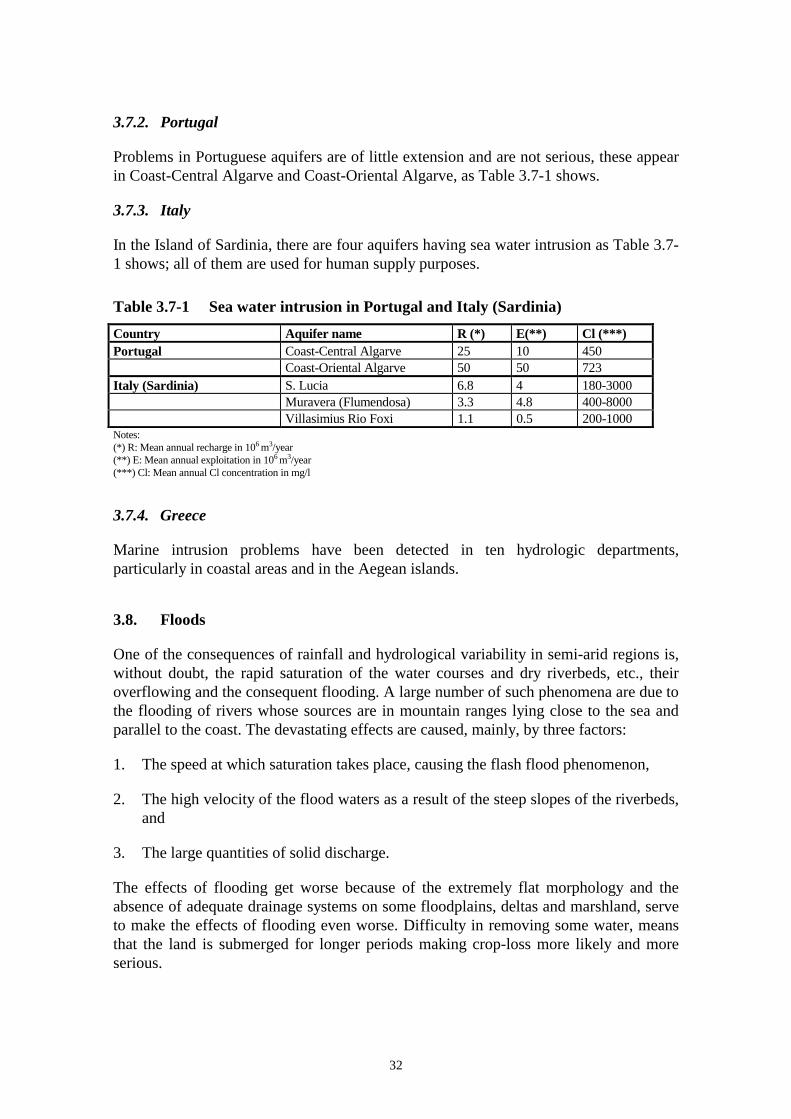
Problems in Portuguese aquifers are of little extension and are not serious, these appear in Coast-Central Algarve and Coast-Oriental Algarve, as Table 3.7-1 shows.
3.7.3. Italy
In the Island of Sardinia, there are four aquifers having sea water intrusion as Table 3.7-1 shows; all of them are used for human supply purposes.
Table 3.7-1 Sea water intrusion in Portugal and Italy (Sardinia) Country Aquifer name R (*) E(**) Cl (***) Portugal Coast-Central Algarve 25 10 450 Coast-Oriental Algarve 50 50 723 Italy (Sardinia) S. Lucia 6.8 4 180-3000 Muravera (Flumendosa) 3.3 4.8 400-8000 Villasimius Rio Foxi 1.1 0.5 200-1000 Notes: (*) R: Mean annual recharge in 106 m3/year (**) E: Mean annual exploitation in 106 m3/year (***) Cl: Mean annual Cl concentration in mg/l
3.7.4. Greece
Marine intrusion problems have been detected in ten hydrologic departments, particularly in coastal areas and in the Aegean islands.
3.8. Floods
One of the consequences of rainfall and hydrological variability in semi-arid regions is, without doubt, the rapid saturation of the water courses and dry riverbeds, etc., their overflowing and the consequent flooding. A large number of such phenomena are due to the flooding of rivers whose sources are in mountain ranges lying close to the sea and parallel to the coast. The devastating effects are caused, mainly, by three factors:
1. The speed at which saturation takes place, causing the flash flood phenomenon,
2. The high velocity of the flood waters as a result of the steep slopes of the riverbeds, and
3. The large quantities of solid discharge.
The effects of flooding get worse because of the extremely flat morphology and the absence of adequate drainage systems on some floodplains, deltas and marshland, serve to make the effects of flooding even worse. Difficulty in removing some water, means that the land is submerged for longer periods making crop-loss more likely and more serious.
33
In these regions, flooding constitutes a natural disaster with far-reaching effects, both material and human. Therefore, such zones are obliged to have flood prevention schemes which use the most effective measures for each specific case, so that the effects of floods can be reduced. Such measures can be either structural (reservoirs, river channelisation, dikes, floodways for water courses, etc.), or non-structural (flood warning and prevention systems, management of flood areas, insurance, etc.). It must also be taken into consideration that some of these measures produce negative impacts on the river; for instance, river channelisation can disrupt the existing physical equilibrium of watercourses (alteration of hydraulic variables and parameters, modification of riparian vegetation etc.).
3.8.1. Spain
The existing major seasonal unevenness of rainfall distribution in Spain produces very serious flooding when rivers overflow their banks, flooding the surrounding areas as well. This amounts to a major natural disaster (Berga, 1995) both in terms of average damage per year, whether this be material (70,000*106 Pts/year) or human (50 victims/year), and this has made it necessary to draw up flood plans which use the most effective measures in each specific case. If flooding cannot be prevented, at least the adverse effects can be reduced to a minimum, and such measures can either be structural (reservoirs, dikes, diverted water courses, etc.) or non-structural, the latter are also called management measures.
The document entitled "Las Inundaciones en España. Informe General (MOPU, 1983)" (Flooding in Spain)" contains studies carried out on a national level, for the 10 river basins on the mainland, which deal with aspects concerning the following: a) identification and analysis of past floods and b) definitions and classifications of zones where flooding is a potential risk.
The document refers to 2,438 floods which have taken place in the last five centuries, and these statistics reveal that an average of approximately five floods have occurred per year throughout the Spanish mainland. The Guadalquivir and Ebro Basins prove to be those which are most susceptible to this phenomenon, suffering the consequences of about one flood per year, and these are followed by the Júcar, Segura, Sur and Douro. Using the information contained in this document, it was possible to pinpoint a total of 1,036 zones that are at risk from flood damage. Furthermore, a classification criterion was established on the basis of the degree of risk involved, and maps were drawn up to a scale of 1:200,000, in which the boundaries of risk areas were plotted, and the priorities established in each zone were appropriately included in each map. There are nearly seventy zones where a serious risk of flooding exists, which gives a good idea of the scale of the problem.
Among the non-structural methods taken in Spain to prevent floods or alleviate their effects are systems based on prevention and warning; some of those worth mentioning are the SAIH (Sistema Automático de Información Hidrológica) [Automatic Hydrological Information System] Program, implemented by the Dirección General de Obras Hidráulicas (D.G.O.H.) [Hydraulic Works Administration]. This service is operational in approximately 50% of Spanish territory. The SAIH is a means for
34
informing the River Authorities, in real time, of the hydrological and hydro-meteorological situation in their basins. This knowledge is obtained by recording, transmitting, elaborating and presenting the hydro-meteorological and hydrological variables for strategic points in the basin. Although the SAIH was initially designed to be concerned only with flood prevention and warning, the system was soon realised to be able to be applied to an automatic and permanent hydro-meteorological service for the River Authorities for only a slight cost increase. Therefore the system would be able to: a) predict and monitor floods, b) optimise and manage water resources, c) improve dam safety and d) improve the hydro-meteorological and hydrological databases (Pedrero, 1995).
3.8.2. Portugal
A preliminary report concerned with the occurrence of river floods and the description of flood-prone areas in Portugal was made by LNEC (1992). The report presented at first a brief discussion of causes and effects of floods, then some management measures and, a preliminary map of flood risk areas at a scale of 1:50,000.
According to the report, main risk areas in Portugal have been identified as those produced either by a discharge with a return period of 100 years or by the biggest known flood. The influence of a possible dam-break has also been taken into account. The identification of three big flood plains in Portugal, Vouga, Mondego and Tejo catchments, torrential regimes in Algarve which cause flooding, and urban flood problems taking place near the largest cities have been the main outcomes of that work.
The known floods represented in the risk map are those which took place in the last 30 years in the lower reach of river Mondego, the area of Lisbon, the mouth of river Tejo and in the Algarve area.
3.8.3. Italy
In Sardinia, rainfall is also extremely irregular and occasional storm events with high runoff cause flooding with damage to crops, roads and buildings.
3.9. Desertification and erosion in basins
Desertification is a recently coined term, whose meaning has not yet fully crystallised either from the technicians’ or from society’s viewpoint. According to Puigdefabrégas (1995), desertification refers to a situation in which the land’s productive capacity deteriorates and the socio-economic systems that exploit that system start to crumble. These zones are affected by a water shortage during at least one season of the year, are fraught with problems resulting from negative human activity owing to over-use of the resources and finally, are suffering from or have suffered from acutely dry periods or dry periods whose duration is greater than normal for that region.
Desertification can cause a reduction of infiltration into the soil and thus, a greater surface flow, with a corresponding increase in the maximum flood discharges. Desertification also causes modifications to the vegetation cover, which is currently

35
undergoing rapid changes as a result of deforestation, either for providing fuel or for obtaining more arable land. The new vegetation cover, when it does exist, consists of either crops or poor vegetation. The soil is unprotected and the erosion caused by an increasing surface flow on the ground becomes even more serious, thus starting a spiralling process. Another consequence is a reduction in the storage capacity of reservoirs which receive and retain a larger amount of sediments. These reservoirs can produce environmental impacts downstream, given that siltation and flow regulation do not allow the periodic flooding of plains with nutrients, contributing to soil degradation.
Of all the countries on the Northern shores of the Mediterranean Sea, Spain is the one whose conditions make it most susceptible to suffer the effects of desertification, especially in the semi-arid areas, because of the following reasons: a mountainous morphology with steep slopes, heavy rainfall with considerable erosion ability, climatic conditions that range from sub-humid to semi-arid, temperatures and rainfall featuring highly variations from one year to the next, over-exploited systems because of the delicate balance between availability and water resource consumption, etc. (Puigdefábregas, 1995).
In Portugal, the most frequent type is water erosion because of the climatic conditions, the irregularity and concentration of the rainy period with intensive events immediately after the dry season, when the soil is dry and less protected. European studies, show that the most affected areas of Portugal are the mountainous regions in the north, although the erosion phenomenon in plains such as Alentejo or in Algarve has increased.
Considering the semi-arid areas of Portugal, 69% of them have a high risk of erosion and only 5% a low risk.
Since the Stockholm Conference of 1972, several projects have been developed concerning erosion processes but they do not form a global monitoring program. There are, however, some experimental centres in Alentejo and Algarve regions (southern Portugal) where long runs of erosion and siltation data have been measured at seven hydroelectric dams.
In Sardinia, different desertification phenomena are caused by soil erosion. Desertification occurs after fires, on slopes subjected to ploughing, and because of overgrazing and wood clearance. Good farmland is also getting decreasing because of urbanisation and contamination.
3.10. Salinisation of soils
The soil is a basic resource for agriculture, its quality being the most important feature. It is often the case in semi-arid areas that salts were deposited in earlier geological eras. When these deposits are subjected to irrigation, the soil become more saline and the quality is adversely affected. In addition to this, in climates where evapotranspiration is high, the problem gets worse because of the shortage of water. The absence of percolation brings about an increase in salt concentration close to the surface and the land eventually becomes useless. Irrigation systems which use little water enhance the
36
formation of saline areas in the surrounding areas, and the systems become fragile, there being a serious risk of salts invading the zone if the water supply is not continuous and the soil deteriorates completely. (Puigdefabrégas, 1995).
Salinisation affects 25% of the irrigated land in the European Mediterranean (Szabolcs, 1990). In the particular case of Spain, salinisation is widely spread along extensive areas of the coast, mainly in the South East and inland regions.
37
4. WATER RESOURCES AND CLIMATE IN THE FUTURE
It is expected that water resource problems associated with desertification, flooding, erosion and sediment transport, water contamination, over-exploitation of aquifers, etc., will become more acute in the future, and this will make the sustainable development of water resources even more difficult. Modifications to the climatic system will merely serve to complicate matters.
The water cycle plays an extremely important and reciprocal role in the climatic system, both conditioning the climate and being affected by it. Changes in precipitation can bring about changes not only to the runoff magnitude and temporality, but also to the frequency and intensity of storms and droughts. Temperature changes undoubtedly cause alterations to the evapotranspiration, soil moisture and seepage to the deepest layers. Such changes in the surface water-content modify the vegetation cover, which brings about a chain reaction, affecting cloud formation, the Earth's albedo and precipitation.
Studies carried out into the impact of possible climatic change on water resources in semi-arid zones should be pointed out by way of example. According to the first report on scientific evaluation of the IPCC (1992), a temperature increase of 1º C to 2º C, together with a 10% precipitation reduction, could lead to a 40% to 70% reduction in renewable resource. Furthermore, a temperature increase could cause snow to melt earlier, increasing the winter runoff and reducing the thawing processes in spring and summer. Even in the areas where precipitation increases, the greater evaporation could lead to lower runoff rates.
A variation in the risk and intensity of droughts is the most serious negative impact of climatic change on water resources. A reduction in water availability could lead to desertification in zones where the balance is particularly fragile.
Climatic change can have considerable repercussions on the flood regime. The predicted variation in storm magnitude and frequency would give rise to a spectacular increase in runoff in short periods of time, which would aggravate the already catastrophic effects of flooding, thus making it necessary to review present techniques for water resources estimation, prevention, prediction and management.
It is only to be expected that a worsening in the summer would adversely affect the water quality and it would increase salinity in the water and the soil. Water scarcity would make effluent dilution more difficult, causing, amongst other phenomena, a further increase in reservoir eutrophication. The scarcity of the resource ought to lead to the deployment of wastewater for other purposes.
The impact on aquifers of potential climatic change would take the form of a reduction in natural recharge (renewable resource), giving rise to a reduction and eventual disappearance of natural outlets (rivers, springs, wetlands etc.). Furthermore, the possibilities for management would become reduced and more complicated, being excessively concentrated on specific aquifers, with the evident risk of over-exploitation.
38
A reduction in the capacity of the resources to be renewed would cause a lowering of water quality and a drop in the groundwater table which, in coastal areas would lead to an increase in seawater intrusion; the latter problem could be further aggravated by a rise in the sea level.
The degradation and even disappearance of vegetation cover, especially that of the woodland type, together with an increase in torrential rain and a reduction in soil moisture, would increase erosion and soil loss, thereby reducing the useful life of the reservoirs by causing them to silt up, all of which would have a negative effect on harnessing water resources.
As a result of the aforementioned, an attempt must be made in the near future in order to obtain a greater insight into the possible effects of climate change upon the quantity and quality of water resources, on the water requirements of the various human activities and the availability of this particular resource, especially in the semi-arid zones which are the subject of this report.
In Portugal, according to the First European Climate Assessment and with the help of ESCAPE model, it was possible to predict the following changes between 1990 and 2050:
• Mean Precipitation (summer): -10 to -15%
• Annual Mean Temperature (south of Tejo): +1,5 to 2ºC
• Annual Mean Flow: Minho (0 to -5%), Centro (-5 to -10%), Sul Tejo (-10 to -20%) and Guadiana e Algarve (-20 to -100%)
In Sardinia, water resources have diminished due to lower precipitation. For example the water collected in the Flumendosa reservoir has dropped to 30%. Average discharge over the last twenty years is roughly 60-65% of the average for the previous 50 year period and over the last nine years, it is only 45%.
In Spain, studies have not thus far been made to assess the possible effect of changes in precipitation and evapotranspiration on water resources. However, guidelines for these studies are now being prepared by CEDEX for the General Directorate of Hydraulic Works and Water Quality.

39
5. CONCLUSIONS AND PROPOSED FUTURE TECHNICAL ACTIVITY
From the review of the general problems in semi-arid regions of the EEA area described in this report, the following conclusions and topics for possible future technical activities are made:
1. It is necessary to calculate and plot the mean annual values for precipitation, potential evapotranspiration and runoff on a pan-European scale, using the same methodologies for all countries in order to produce truly comparable data
2. Synthesis studies of hydrological regimes (quantity and quality) using the same methodologies on a pan-European scale will improve understanding of the different problems associated with water resources in the different countries and regions.
3. Erosion is an important issue in southern Europe and it would be important to know the most affected areas and relate them with hydrological changes (increase of peak flows and decrease of time of concentration). The rate of soil formation decreases year by year. The environmental impacts cover not only agriculture but also damage caused by flooding.
4. It is important to characterise water quality problems and the main sources of contamination in southern Europe and their relationships with the potential water resources. Eutrophication of reservoirs and lakes should be monitored particularly as should the mean concentration of chloride in groundwater to assess saline intrusion problems.
5. The development of guidelines for environmental impact analysis, management tools, etc. for the conjunctive use of surface and groundwater resources should be made in order to improve water efficiency in the semi-arid areas.
6. The setting up of criteria for the determination of ecological flows for semi-arid areas of the EEA is considered to be of paramount importance. Common criteria amongst the EEA countries should be derived in order to set guidelines for the maintenance of ecological flows in rivers. River regulation systems should follow a common policy in this aspect, bearing in mind the variety and diversity of aquatic life across Europe.
7. It is necessary to characterise areas affected by drought in southern Europe and to produce maps of drought risk, resilience and vulnerability. Analysis of long series of data on precipitation and river discharges would clarify these drought studies.
8. Floods in semi-arid areas constitute a natural hazard which is not covered by current policies. Mapping of vulnerable land use areas and applying management tools would be a good starting point in the to development of policy in this field.
40
9. As a pre-requisite to points 7 and 8, studies on a pan-European scale related to the social, economical and environmental impacts of extreme events (droughts and floods) would give a good indication of the scope of these problems.
10. The possible effects of climate change on the quantity and quality of water resources should be investigated, particularly in the semi-arid regions, where the effects could be more adverse.
11. Knowledge of how the change of land use affects the availability of water resources in the EEA area should be improved, particularly in semi-arid areas. Nevertheless, the lack of reliable data will make that very difficult. Data on land use have not been available at the time this report was written. The outcomes of such an improved study would be, without doubt, an important help for water management.
12. Water re-use should be further practised in semi-arid areas. Some Greek areas have made use of such methods for agricultural purposes, but it has not yet been widely spread throughout semi-arid regions. Studies on the application of water re-use techniques would be beneficial.
41
6. REFERENCES
BALTANÁS, A. (1995). El Plan Hidrológico Nacional. El Campo. Numero monográfico El Agua. Servicio de Estudios Banco Bilbao Vizcaya. España, 1995.
BERGA, L. (1995). Aplicación de los sistemas de previsión de avenidas. Experiencias y problemática. Jornadas sobre el SAIH en la gestión hídrica. Confederación Hidrográfica del Ebro. Dirección General de Obras Hidráulicas. MOPTMA. Zaragoza, 3 al 7 Abril 1995.
BOE (1986) Ley de Aguas. Boletin Oficial del Estado (B.O.E.). Madrid, España, 1986.
Consejo de Gobierno del Principado de Asturias (1987). Asturias, 24 de Diciembre de 1987.
DGOH-ITGE (1988). Estudio de delimitación de Unidades Hidrogeológicas del territorio peninsular e Islas Baleares y síntesis de sus carcaterísticas. Madrid, España. 1988.
EEC (1994). Desertification and Land Degradation in the European Mediterranean. Report EUR 14850.
ESTRELA, T. (1995). Estimation of precipitation-runoff regional laws and runoff maps in Spain using a geographical information system. International Hydrological Programme (I.H.P.). UNESCO. FRIEND AMHY. Thessaloniki, Greece. September 1995.
ESTRELA, T. and A. IGLESIAS (1995). Overview report on the key water resources issues in semi-arid/water scarcity regions of the EEA area. First draft report by CEDEX/ITGE to ETC/IW-EEA. July 1995.
ERHARD-CASSEGRAIN and MAGRET (1983). Introduction à l'Économie Générale de l'Eau".
ENVIRONMENT DEPARTMENT (1995). Questionnaires with data from Sardinia (Italy) related to First Draft Report "Overview report on the key water issues in semi-arid/water scarcity regions of the EEA area". November 1995.
ETC/IW (1995). Major European Reservoirs. Programme MW4. Draft report submitted by OIEau/IFEN to ETC/IW-EEA. September 1995.
FALKENMARK, M. and T. CHAPMAN (1989). Comparative Hydrology. UNESCO 1989.
FAO (1991) "Report on the Expert Consultation on Revision of FAO Methodologies for Crop Water Requirements". Food and Agriculture Organization of the United Nations (FAO). Roma, Italia. 28-31 Mayo 1990.
42
FRIED, J.J. et al (1982). Groundwater Resources in EC Countries. Investigation by the Commission of the European Communities.
GIL, J.M. (1995). El gran dilema hidrológico: convergencia o divergencia con Europa. Revista El Campo. Numero monográfico El Agua. Servicio de Estudios Banco Bilbao Vizcaya. España, 1995.
INAG (1995a). Comments to First draft report submitted by CEDEX/ITGE to ETC/IW EEA "Overview report on the key water resources issues in semi-arid/water scarcity of the EEA area, July 1995", October 1995.
INAG (1995b). Questionnaires with Portuguese data related to First Report "Overview report on the key water issues in semi-arid/water scarcity regions of the EEA". November 1995.
IPCC (1992). Cambio Climático: evaluación de los impactos. Primer informe de evaluación del IPCC. Vol 2. Instituto Nacional de Meteorología. España.
LNEC (1992). As cheias em Portugal. Características das zonas de risco. 1º relatorio. Análise Preliminar. 1992.
LLAMAS, M.R. (1995). Las aguas subterráneas en España. Revista El Campo. Numero monográfico El Agua. Servicio de Estudios Banco Bilbao Vizcaya. España, 1995.
Ministry of Environment, Physical Planning and Public Works of Greece (1996). Comments to the First draft report submitted by CEDEX/ITGE to ETC/IW EEA "Overview report on the key water resources issues in semi-arid/water scarcity of the EEA area, July 1995", January 1996.
Ministry of Environment, Physical Planning and Public Works of Greece (1996). Comments to the Final draft report submitted by CEDEX/ITGE to ETC/IW EEA "Overview report on the key water resources issues in semi-arid/water scarcity of the EEA area, July 1995", March 1996.
MONTES, C. (1995). La gestión de los humedales españoles protegidos: Conservación versus confusión. Revista El Campo. Numero monográfico El Agua. Servicio de Estudios Banco Bilbao Vizcaya. España, 1995.
MONTES, C. and P. BIFANI (1991). Spanish Wetlands. In: K.Turner and T. Jones (eds.) Wetlands: Market and information failures: 144-195. OCDE-Earthscan. Paris-London 202 pp.
MOPU (1983). Las inundaciones en España. Informe General. MOPU, Madrid, España. Octubre 1983
MOPTMA (1993). Memoria del Anteproyecto de Ley del Plan Hidrológico Nacional. Dirección General de Obras Hidráulicas, MOPTMA. España. Abril 1993
43
MOPTMA - MINER (1994). Libro Blanco de las Aguas Subterráneas. Ministerio de Obras Públicas, Transportes y Medio Ambiente (MOPTMA) y Ministerio de Industria y Energía. Madrid, España 1994.
PEDRERO, A. (1995). El Programa SAIH y Su Aplicación. Jornadas sobre el SAIH en la Gestión Hídrica. Confederación Hidrográfica del Ebro. Dirección General de Obras Hidráulicas. MOPTMA. Zaragoza, 3 al 7 Abril 1995.
PUIGDEFABREGAS, J. (1995). Erosión y desertificación en España. Revista El Campo. Numero monográfico El Agua. Servicio de Estudios Banco Bilbao Vizcaya. España, 1995.
RIVM/RIZA (1991). Sustainable Use of Groundwater. Problems and Threats in the European Communities: report no. 600025001. Ministerseminar Groundwater, Den Haag, 26-27 November 1991.
RUIZ, J.M. (1993). La situación de los recursos hídricos en España. Centro de Investigación para la paz. Marzo 1993, Madrid, España.
SZABOLCS, I (1990). Effects of predicted climatic change on European soils, with particular regard to salinisation (In Boer, M., De Groot, R.S. eds) Landscape Ecological Impact of Climatic Change. Amsterdam, IOS. 177-193
UNESCO (1977). Atlas of World Water Balance. The UNESCO PRESS. Paris. 1977.
UNESCO (1979). Mapa Mundial de Zonas Áridas. UNESCO, 1979.
UNO (1992). Conferencia Internacional sobre el Agua y el Medio Ambiente, el desarrollo en la perspectiva del siglo XXI., 26-31 de Enero de 1992, Dublin, Irlanda. Organizada por la ONU, Banco Mundial, OIT, etc. La Declaración de Dublín sobre el Agua y el Desarrollo Sostenible fué aprobada por el Plenario de la Conferencia.
44
APPENDIX A: DEFINITIONS OF WATER RESOURCES
This appendix defines a series of basic concepts concerning water resources that have been used in this report. They have been mainly adapted from the publication "Introduction à l'Économie Générale de l'Eau" by Erhard-Cassegrain and Magret (1983).
1) Inflows, outflows and reserves
The inflows to a territory can come from two sources:
a) effective precipitation obtained by subtracting actual evapotranspiration from the total precipitation, which gives rise to rapid runoff in the rivers and recharge into the aquifers and
b) external contributions of water that may enter the system through the rivers or connected aquifers outside of the area.
The outflow of a territory is defined as the total yield and is the sum of the discharges flowing through the surface water courses and which leave the territory concerned and the groundwater flow that leaves a territory through existing aquifers.
When considering the total yield, in certain cases it is advisable to distinguish between the part that flows into the sea from the part exported to adjacent territories.
The reserves are the natural water volumes that exist in a particular territory on a specific date, and these include both surface volumes (rivers, lakes, snow, etc.), and groundwater (aquifers). The reserves vary in time, as a function of the differences between the territory inflows and outflows. The reserves that exist in a system throughout a period that is sufficiently long to be considered representative, are taken to be the average reserves. Such a period must fulfil the requirement that the average inflows and outflows are roughly the same, thereby ensuring a balance in the system.
The association between the flows and reserves that exist in a territory, allows the renewable and non-renewable water resources to be defined for that territory.
2) Renewable and non-renewable water resources
The renewable water resources in a territory are equivalent to the total yield. An evaluation thereof must make an explicit reference to whether or not the external contributions are included and it is advisable to provide a breakdown of the exports to adjacent territories and water that flows directly into the sea, especially in the case of international frontiers. In this case, the total yield for a territory minus the external contributions, is referred to as internal renewable water resources.
In physical terms, the non-renewable water resources, refer to the amount of water obtained by a decrement of the reserves in the surface or groundwater systems. Non-renewable resources are characterised by the fact that they can only be used once during the period considered.

45
It is customary to associate the water resources concept with the aforementioned renewable water resources concept, not considering the non-renewable resources because they are reserves, and thus the existence of a time limit for their use. In this sense, the presence of considerable non-renewable resources, would allow for greater flexibility in resource management, but would not increase such resources.
3) Potential and exploitable water resources
The potential water resources are that part of the water resources which constitute the potential offer of the territory under consideration, bearing in mind the restrictions existing in areas greater than the territory itself.
These restrictions, which are usually expressed in political terms, are:
• Water Quality restrictions: keeping minimum quality standards in river reaches and aquifers.
• Ecological restrictions: keeping minimum surface or groundwater flows to the sea, in order to maintain the rich and diverse biological habitats, to prevent marine intrusion, ensuring that aquifers do not fall below a minimum level, etc.
• Geopolitical restrictions: the need to make sure that the flow does not fall below a minimum and has an acceptable quality when the water crosses a frontier.
The exploitable water resource is that part of the potential water resource that can be used under given technical and economic conditions, these being determined by the characteristics of the demand to be met. The relative nature of this definition is evident, given that the degree of technical and/or economic validity of certain systems of use, varies as a function of several factors: the technical and economic potential of the country, economic importance of the demand, etc.