WATER RESOURCES OF THE LOUISVILLE AREA KENTUCKY AND INDIANA · 2012-03-07 · WATER RESOURCES OF...
56
GEOLOGICAL SURVEY CIRCULAR 276 WATER RESOURCES OF THE LOUISVILLE AREA KENTUCKY AND INDIANA
Transcript of WATER RESOURCES OF THE LOUISVILLE AREA KENTUCKY AND INDIANA · 2012-03-07 · WATER RESOURCES OF...

GEOLOGICAL SURVEY CIRCULAR 276
WATER RESOURCES OF
THE LOUISVILLE AREA
KENTUCKY AND INDIANA


N0\1 ~5 1953
UNITED STATES DEPARTMENT OF THE INTERIOR
Douglas McKay, Secretary
GEOLOGICAL SURVEY W. E. Wrather, Director
GEOLOGICAL SURVEY CIRCULAR 276
WATER RESOURCES OF THE LOUISVILLE AREA, KENTUCKY AND INDIANA
By M. I. Rorabaugh, F. F. Schrader, and L. B. Laird
Washington, D. C., 1953
Free on application to the Geological Survey, Washington 25, D. C.

PREFACE
This report is one of a series on the water resources of selected industrial areas of national importance. These reports are prepared in the Water Resources Division of the U.S. Geological Survey, and provide valuable information for national defense and for orderly planning of municipal and industrial expansion. The Water Utilization Section of the Technical Coordination Branch provides technical guidance in the preparation of these reports. This report was prepared under the direct supervision of the following persons: W. L. Lamar, district chemist (Quality of \Vater); M. I. Rorabaugh, district engineer (Ground Water); and F. F. Schrader, district engineer (Surface Water). The authors express appreciation for the able assistance of E. A. Bell, (Ground \Vater), and L. E. Carreon, (Surface Water),
Many of the data summarized in the report were collected by the Geological Survey in cooperation with pertinent agencies of the city of Louisville, Ky.; Jefferson County, Ky.; the Commonwealth of Kentucky; and the State of Indiana, Chemical examinations were made by the Geological Survey, except as otherwise indicated.
II
Many persons and organizations contributed information used in this report. The authors wish to acknowledge the courtesy and cooperation of the following agencies: Louisville Chamber of Commerce, Louisville and Jefferson County Planning and Zoning Commission; Louisville and Jefferson County Metropolitan Sewer District; Louisville Water Company; Louisville Department of Works (city engineer); Indiana Gas and Water Company; Louisville Extension Water District; Kentucky Department of Mines and Minerals; Kentucky Geological Survey; Kentucky agricultural and Industrial Development Board; Kentucky Flood Control and Water Usage Board; Kentucky Department of Highways; Kentucky State Department of Health; U. S. Army, Corps of Engineers; and U. S. Department of Commerce, Weather Bureau.
In addition, thanks are due many individuals, well drillers, and industries for furnishing information from their files and for granting permission to the Geological Survey for the collection of field data at their installations.

Summary ••••••••..•••••••.•••••••••••.•••••••••••••..•••• Introduction ••.••••••••••.•••.•••••••.•••••.•••••••••••••. Description of area ••••••••.••••••••••••••••••••••.••• ~
Topography .••.•••••••••••••..••..••.•••••.•••••.•.••• Geology •••••.••••••..••..••••.••••••.•••••••••.••••.••• Climate ••••••••.•••••••••••••••••••••.••••••••.•••••••• Natural resources .••••••••••••••••.••••••••••••••.. History •.••••••••••••••••••••••••••••.••••.•.••••••••.•• Population ••.••.•••.•••••••••••••••.•••.•••••••••••.•• Transportation ••••••••••••••••••••.••••••••••••••••• Industrial development •.•••.•••••••••••••••••••••• Datum planes •••••••••••••••••••••••••••••••••••••.••
Occurrence of water •••••••..•••••••••••.•••••••••••• Surface water •••••••••••••••••.••••••••••••••••••••••••.
The Ohio River •••••••••••••••••••••••••••••••••••.• Navigation •••••••••••••••••••••••••••••••••••••••••. Discharge •••••••••••••••••••••••.•.•.•.••••••••••.•. Floods ••••••••••••••••••••••••••••••••.••.•.••...••• Quality •••.••••••••••.•••••••••••••••.••••••••••••..
Small streams •••••.••••••••••••••••••••.••••••••••• Harrods Creek ••••••••••••••••••••••••••••••••••• Beargrass Creek •••••••••••••.•••••••••.•••••••• Silver Creek •••••••••••••••.•••••••.•••••••••••••• Floyds Fork •••••••••••••••••••••••••••••••••••••• Por:d Creek ••••••••.•••••••••.••••••••••••••••••••.
Ground water ......................................... . Occurrence •••••••••••••••••••••••.•••••••••••••••••• Consolidated formations ••••••••••••••.•••••••. Ohio River valley alluvium ••••••••••••••••••••• Recharge and ground-water movement .•••••. Fluctuations of water levels ................. ..
Downtown area of Louisville .•.•••.•••••••••• West-central area .••••••••••••••.••.•••••••••••
CONTENTS
Page 1
2 2 2 2 5 5 5 5 6 7 7 7 8
10 13 18 18 19 19 21 21 21 21 22 22 28 28 29 29
Page Ground water-continued
Fluctuations of water levels-continued Distillery area.................................... 31 Jeffersonville..................................... 31
Quality ,.;: ground water........................... 34 \Vater from the limestones.................... 34 Water from the sand and gravel.............. 37 Effects of river-water infiltration........... 37 Variations in quality ...... •••••••••••••••••••••••• 37
Temperature of ground water . •••••••••••••••••• 38 Public water supplies................................. 38
City of Louisville............ .•• •••••••• •••.••••••• 38 New Albany, Indiana . • • • • •• • ••• • • ••• • • • •• • • • . •• . • • • 40 Jeffersonville, Indiana............................ 40 Louisville extension water district..... ..... •• 41
Present use of water.................................. 41 Public supplies... . •••••••••••••••••••••••••••••••••• 41 Private industrial use............................. 43
Surface water.......... .••••••••••••••••••••••••• 43 Ground water...................................... 43 Irrigation and rural supplies.................. 43
Fluctuation of water use.......................... 45 Summary of use..................................... 46
Potential supply......................... •• •••• ••••••••• 46 Surface water........................................ 46 Ground water......................................... 47
Water laws.............................................. 47 Federal laws ••••••••••..••••••••••• ••••••o: •••••• •• 47 Ohio River Valley Water Sanitation
Commission ............................... ~····· 47 Kentucky law....................................... 47 Indiana law ••••••.••••••••••.••. ••••••••••••••••••••• 47
References.............................................. 48 "Rubbertown" area............................. 29
ILLUSTRATIONS
Page Plate 1. Map of the Louisville area, Kentucky and Indiana, showing the availability of ground water •• In pocket
2. Map of the Louisville area, Kentucky and Indiana, showing where hydrologic and geologic data have been collected ............................................ ••••••••••••••••••••••••••••• •••••••••••••• In pocket
Figure 1. Precipitation at Louisville.......................................................................................... 3 2. Climatological data for Louisville................................................................................. 4 3. Population growth - Louisville metropolitan area .................... ,..... .... ••••. ••• • .. ................. •••• 5 4. Localized hydrologic cycle -Louisville metropolitan area •••• ••••••••••••••••••••••••••••••••••••••••••• 6 5. Minimum daily and monthly discharge, Ohio River at Louisville, 1928-52........................... 8 6. Duration curve of daily flows, Ohio River at Louisville, 1928-52 ••••••.•• ..,........................... 9 7. Drought frequencies, Ohio River at Louisville, 1928-52........ •••••••. .................................... 9 8. Maximum annual elevations of Ohio River at Louisville, 1832-1952 (only major floods prior
to 1872)................................................................................................................ 10 9. Stage hydrographs of Ohio River at Louisville, 1937 and 1945 floods.................................. 11
10. Flood-stage frequencies, Ohio River at Louisville, 1832-1952.......................................... 11 11. Water-surface profile of 1937 flood on the Ohio River at Louisville, mile 592 to mile 627 ..... 12 12. Frequency of floods by months, Ohio River at Louisville, 1875-1952................................. 13 13. Location of flood walls and areas flooded in 1937............................................................ 14 14. Cumulative frequency curve of hardness of Ohio River water at Louisville, 1950-52............. 15
III

Figure
Table 1. 2. 3.
15. Temperatures of Ohio River water and of air at Louisville, 1946-52.................................. 15 16. Durati<:>n curve of daily flows, Harrods and Beargrass Creeks, 1944-52............................. 18 17. Chemical character of waters from small streams in Louisville area ......................... ~....... 19 18. Duration curve of daily flow; Silver Creek, Floyds Fork, and Pond Creek, 1944-52............. 20 19. Longitudinal section of Ohio River valley at Louisville..................................................... 24 20. Cross-sections of the Ohio River flood plain at Louisville............... ................................. 25 21. Cross-sections of the Ohio River flood plain southwest of Louisville.................................. 26 22. Map of alluvium in Louisville area showing water-level contours in December 1952.~........... 27 23. Artificial recharge in the Louisville area, 1944-52......................................................... 29 24. Precipitation, river level, and water-table elevation in downtown Louisville, 1937-52.......... 30 25. Pumpage, precipitation, and water-table elevation, in the west-central area of Louisville,
1943-52................................................................................................................ 31 26. Pumpage, precipitation, river level, and water-table elevation in the "Rubbertown" area,
1941-52................................................... ........................................................ ... 32 27. Pumpage, precipitation, and water-table elevation in the Distillery area of Louisville,
1937-52............................................................................ ................................... 33 28. Pumpage and water-table elevation at Jeffersonville public supply, 1943-52........................ 34 29. Chemical character of selected ground waters of the Louisville area.................................. 34 30. Map of the Louisville area showing hardness of ground waters, 1952.................................. 36 31. Trends in hardness of ground water in the Louisville area ...... u ....................................... 38 32. Map of the Louisville area showing maximum and minimum temperatures of ground water,
1945-52....... .•• ........ ................................ .................. ........................................ 39 33. Temperature characteristics of infiltrated river water (data from Ranney collector at
Bells Lane)...................................................................................................... 40 34. Maximum and average of several constituents of the Louisville public water supply, 1952..... 40 35. Source and use of water from public supplies in Louisville metropolitan area, 1952 •• ,........... 41 36. Pumpage by Louisville Water Co., 1860-1952................................................................ 42 37. Ground-water pumpage for municipal use, 1938-52......................................................... 43 38. Ground-water pumpage in the Louisville metropolitan area, 1937-52.................................. 44 39. Distribution of ground-water pumpage in the Louisville area, 1952..................................... 45 40. Summary of water use in the Louisville metropolitan area, 1952 .• ····~···· .. ••·· ......... ........... 46 41. Comparison of water use in 1952 with estim.ated potential supply....................................... 47
TABLES
Chemical quality of surface waters in the Louisville area ..................................................... . Water-bearing characteristics of typical formations .......................................................... . Water-bearing properties of the principal formations in the Louisville area ........................... ..
4. Chemical quality of water from selected wells in the Louisville area ..................................... .
Page 16 22 23 35 43 5. Use of untreated river water for cooling purposes, 1944-52 .............................................. ..
6. Estimated average daily net withdrawals of ground water by industries in the Louisville metropolitan area, 1937-52 ...................................................................................... .
7. Summary of use of water in the Louis,rille metropolitan area, 1952 .•• ~ ................................... .
IV
44 46

WATER RESOURCES OF THE LOUISVILLE AREA, KENTUCKY AND INDIANA
By M. I. Rorabaugh, F. F. Schrader, and L. B. Laird
SUMMARY
The most imp9rtant sources of water in the area are the Ohio River and wells. The quantity of water flowing in the_ Ohio River ranges from a minimum of 1, 360 mgd (million gallons per day) or 2, 100 cfs (cubic feet per second) to a maximum of 717,000 mgd (1, 110,000 cfs): the average flow is 75,000 mgd (116, 000 cfs). Temperature of the river water ranges from 32°F to about 85°F. Pollution and floods are major problems. Ground-water sources have an estimated potential of about 450 mgd. This water is suitable for domestic and industrial use. Under present conditions, its temperature varies only a few degrees above and below an average qf 58°F, but under conditions of full development, the range would be much wider because most of the water would be derived by induced infiltration from the river. However, the temperature range would never be as wide as chat of the river water.
Present water use is only a small percentage of the available supply. Total surface-water use was 730 mgd in 1952, and total ground-water use in the same yeat'\vas 35 mgd. Four public systems furnish 74.2 mgd of treated water to about 500, 000 persons, and to many industries. Domestic use was 18. 6 mgd and the industrial and commercial use was 746 mgd.
INTRODUCTION
The purpose of this report is to summarize the available information on water for the Louisville area; to present the information in a form suitable for use in the initial planning of water supplies for both defense and non-vital industries; and to assist in future development and use of the water resources of the area. Demands for water are increasing. Quantity generally is the most important consideration. However, water used in the manufacture of many productsfor example: alcohol, chemicals, and synthetic rubber-must meet rigid conditions ofquality or temperature. Chemical and temperature characteristics of the waters in the area are. described in this report.
The large quantity of water available in the Ohio River provides assurance that a local water shortage is unlikely. However, other sources may be more economical for some uses. Small streams, wells, or the public supplies may be the most economical source if the quantity required is small or if the place of usage is a considerable distance from the river. Water temperature and quality are other factors to be considered when the most economical source is selected.
Major water problems include Ohio River floods, local flooding because of inadequate drainage, pollution of the Ohio River and local tributaries, and insufficient supplies of ground water in the industrial area. The highly polluted Ohio River is used as a source for municipal and industrial water and also for disposal of raw sewage and industrial waste. Natural local drainage in parts of the area is poor, and rapid expansion of industrial and residential areas have created serious problems of storm-water and sanitary drainage. Poor natural drainage has adversely affected agricultural land adjacent to the city.
Flood walls to provide protection from high waters of the Ohio River are nearing completion at the present time. Public agencies are actively engaged in seeking solutions to the other pressing problems of the area.
DESCRIPTION OF AREA
The metropolitan area considered in.this report includes Jefferson County in Kentucky, and parts of Clark and Floyd Counties in Indiana. It includes the city of Louisville, Ky., and the cities of Jeffersonville, Clarksville, and New Albany, Ind.
The Louisville metropolitan area is near the center of the Ohio River drainage basin and is between the large population centers of the Midwest and those of the South. (See lo<;:ation sketch, pl. 1.)
Topography
The topography of the area is of three distinct types. The eastern one-third of Jefferson County is relatively rough; it is made up of broad ridges, which are dissected by Floyds Fork and its tributaries. Valleys with gentle slopes have been cut to depths of about 100 feet below the ridges. General elevation of this part of the area is 700 to 750 feet above mean sea level.
The second type of topography is extremely rough (designated as 11 Knobs 11 on pl. 1). There are two such areas; one is in Indiana southwest of New Albany, and the other forms a triangular area south of Louisville. These knobs are remnants of an old plateau and rise abruptly 250 to 500 feet above the relatively level areas forming their base. In the Indiana area, Knob Creek and French Creek have down-cut to a depth of about 300 feet to form ridges, knobs, and very steep valley slopes. The area south of Louisville is trenched by Pond Creek at elevations of 420 to 450 feet above sea

2 WATER RESOURCES OF THE LOUISVILLE AREA
level. The tops of the knobs are at elevations of 700 to 900 feet above sea level.
The third topographic type has relatively flat relief and comprises the remainder of the area considered in the report. The area northeast of Jeffersonville and the area of central and northern Jefferson County (Muscatatuck re;;ional slope).slope gently from a general elevation of 700 feet at the northeast to about 450 feet at the southwest. A belt about 3 miles wide along the Ohio River northeast of Louisville is deeply incised ~JY Harrods Creek and by other smaller tributaries to the Ohio Eiver. The draiaage area of Beargrass Creek is gei1tly rolling. South of Louisville and north of the Knobs is an area of about 25 square miles, locally referred to as the ''wet woods.'' This area, a former swamp, has been drained by a network of ditches, draining to the Ohio River through Pond Creek. The "wet woods" has very little relief and ranges from 450 to 475 feet above mean sea level. The Ohio River flood plain is a 0elt along the Ohio River, ranging from a width of aoout half a mile, northeast of Louisville, to a width of about 5 miles, southwest of the city. This area, which has a general elevation of 425 to 475 feet above sea level, is gently rolling and is drained by small tributaries to the Ohio River.
Geology
The rocks underlying the Louisville area are limestones, shales, and sandstones of Ordovician, Silurian, Devonian, and Carboniferous (Mississippian) age. The formations are fairly uniform in thickness throughout the area and have a gentle dip of about 40 feet to the mile toward the west and southwest. Erosion of this sloping sequence of rocks has produced the topographic features described above. The oldest rocks are exposed in eastern Jefferson County (limestone and shale of the Arnheim formation, Waynesville limestone, Lib12rty formation, and Saluda limestone of Ordovician age; and Brassfield limestone, Osgood formation, Laurel dolomite, and Waldron shale of Silurian age). Erosion of this alternating series of shales and limestones has produced the rough topography of eastern Jefferson County. In contrast, the Muscatatuck regional slope is underlain by massive, relatively pure limestones (Louisville limestone of Silurian age, and Jeffersonville limestone and Sellersburg limes tone of Middle Devonian age). Erosion of these hard formations have produced a relatively flat surface. The Scottsburg Lowland is underlain by the easily eroded New Albany shale of Late Devonian age. The Knobs area is made up of formations of Mississippian age (New Providence shale, Kenwood sandstone, Rosewood shale, Holtsclaw sandstone, and Warsaw limestone).
In glacial times, the Ohio River cut a deep valley into the consolidated rocks (bedrock) and later filled this valley with glacial outwash sands and gravels and river deposits. The valley is about 1~ miles wide northeast of Louisville. At Louisville, it widens to nearly 6 miles, then gradually narrows to about 1 ~ miles at the southwestern corner of Jefferson County. The deepest of several old channels passes under downtown Louis~rille and the Rubbertown area, and then it coincides with the path of present river to the south. Elevation of the valley floor in this channel is about 335 feet above mean sea level under Louisville, and it slopes to about 325 feet at the southern limit of the county.
The bedrock under the central part of Louisville and Jeffersonville is limestone, and in New Albany, western Louisville, and southwest of Louisville, it is shale.
The present Ohio River flows on abed of sand and gravel along the northern and western edge of the old valley. The river is controlled by navigation dams. Normal pool elevation above the dam at Louisville is 420 feet above sea level, and below the dam it is 383 feet (Ohio River datum).
Climate
Louisville's climate is continental in type. It is the result of two major influences: warm moisture-laden air masses moving up the Mississippi and Ohio valleys from the Gulf of Mexico, and artie air masses moving into the area from the north and west. As a result, the weather is quite changeable, and extreme conditions do not prevail for long periods of time. Winters are moderately cold and summers are warm,according to 79 years of record collected by the United States Weather Bureau. Temperatures rarely exceed 100°F in summer and rarely fall below 0°F in winter; the mean annual temperature is 57. 0°F. The frost-free period is from early April until late October.
The average annual precipitation at Louisville is 42. 95 inches. Figure 1 shows annual precipitation since 1872 and monthly distribution of precipitation and snowfall. During spring and summer, thunderstorms with high intensities of rainfall are common.
Figure 2 presents data on maximum and mean wind velocity, percent of possible sunshine, temperatur~. and relative humidity. Relative humidity remains fairly high throughout the summer. Cloud cover is about equally distributed throughout the year with some increase in the winte·r. Heavy fog is unusual, averaging about 10 days per year and occurring in the period September through March.
Prevailing winds are from the south; monthly averages range from 10 miles per hour in February, March, and April to about 7 miles per hour during the summer. The strongest winds are usually associated with thunderstorm activity; the maximum wind velocity recorded (average velocity for the fastest mile) in 39 years is 68 miles per hour.
Natural Resources
Water is the most important natural resource of the area. It is used for public-water supply, cooling, manufacturing, generation of hydro-electric and steamelectric power, irrigation, recreation, waste disposal, and navigation. Other natural resources include the soils, limestones, shales, clays, and sand and gravel.
The first settlement was made on Corn Island in 1778 in connection with the expedition of General George Rogers Clark. In the same year, or early in 1779, the settlement was moved to the south bank of the Ohio River near Twelfth Street. The falls of the Ohio River at Louisville was the only major obstruction to navigation between Pittsburgh and New Orleans, and all

en 20 IIJ J: 0 z - 16 z
~ 12 t= cr .... 0.. 8 0 IIJ a: a. 4 >-_J
J: .... ~ 0 ~
~ ~ ~ ~ ~ ~ ~ ~ .....
~ J
79 -year record
~ ~ ~
~ ~ ~ ~ ~ ~ """ ~ ~ ~ 0 ~ ~ ~ ~ ~ ~ "'"' -~ ~v~~~,_'-~ t-t :::~
····':1:·::::~ ..... Minimum::·:·
.... ..... ]:'' ~ .... ····· F M A M J J.
DESCRIPTION OF AREA 3
-Maximum
~
~ ~ ~ ~ ~ ~ ~ I~ ~'-""' ..... ·;.,;.;.· .....
A s 0
~ ~ ~ ~ ~ . . ~ . :: ~ ::{:lililil N 0
(J'j ILl J:
25C:~-r-,----,--.~-----.-.--r-,----~~
~20~~~-4--+-~-+--~~-r~--~~
z
~ J: 1-z 0 ~ 0
cn50~--~~~~~--~---4~N-~--+----+---~r--r---+~-4----~--~~±---~~~ IIJ J: 0 z
.. z 0 t= ~301--~~~~~~~~~~~~~~~~~~~~~~~~~~~~~~~~~~~~ a. 0 ILl a: 0..201--~~~~~~~~~~~~~~~~~~~~~~~~~~~~~~~~~~~~
_J <( :l z z 101--~~~~~~~~~~~~~~~~~~~~~~~~~~~~~~~~~~~~ cr
OL-~~~~~~~~~~~~~~~~~~~~~~~~~~~~~~~~~~
1870 1880 1890 1900 1910 1920 1930 1940 1950
Figure 1. -Precipitation at Louisville.

4 WATER RESOURCES OF THE LOUISVILLE AREA
Wind velocity- 79 -year reco·rd
Air temperature-79-year record
wso~~--r-~--~~--~~--.--,--,-~--~
z ::t: (/)
z ~60~~--+-~--~~~-p~~~~~~---r~
LLI _J
CD
~40F=~~~-4~~~~-P~~~~~~~~~ 0 0.
lL 0 ~20~~~~~~~~~~~~~~~~~~~
z w 0 a:: LLI 0.
M A
Sunshine -51-year record
J FM AM J J AS 0 N 0
Average relative humidity -64-year record
Figure 2. -climatological data for Louisville.

DESCRIPTION OF AREA 5
river freight had to be unloaded and reloaded.· As the country west of the Allegheny Mountains was settled by English from Virginia, followed by a large German element, Louisville became an important river port. Construction of a canal and locks in 1830 greatly increased navigation on the Ohio River, and Louisville rapidly grew to take its place among the principal cities of the country.
Population
The population of the tri-county metropolitan area in 1950 was about 580, 000. The gain during the period 1940-50 was nearly 30 percent (fig. 3). The Louisville Chamber of Commerce expects that the population of Jefferson County will be nearly 590,000 by 1960, and that the tri-county population will be greater than 700,000.
Cl) 0
800
700
600
~ 500 Cl) ;::)
0 :z: 1-z 400
z 0
~ 300 ..J ;::) a. ~
200
100
~ ~ % % 2
• ~~~m ~ ~ ~
FLOYD CO.,IND.
! CLARK CO .. IND.
JEFFERSON CO .. KY. ~
~ ~ • ~
~ ~ % ~
-~ ~ ~ I /: ~ ~
~ ~ ~ ~ ~ % ~ % ~ :% %
~ ~ 2:: % } % /: :%
~ ~ ~ ~ % ~ % % ~ % % % ;; ~ % % % ~ % ~ ~ 'i.
% % % ~ % % ~ % % % % % ~ ~ ~ ~ ~ :% % ~ % % ~ %
0
!!!
Figure 3. -Population growth - Louisville metropolitan area.
Transportation
-
-
-
0
"" 1-4
= 1-Cl)
""
The area is served by 8 railroads, 10 bus lines, 12 barge firms, 5 airlines, about 100 truck lines, and a network of Federal, State, and county highways. These facilities provide direct passenger and freight service to principal cities in all directions. Barge lines in the Louisville area handle more than 7 million tons of freight each year.
Industrial Development
Industry of a diversified nature developed as Louisville grew. Good farm land was used for truck farming and stock raising,and the city provided a ready market for potatoes, fresh vegetables, meat, and dairy products. Natural resources have been deveJoped, large cement plants at Speed, Ind. (just north of the area) and at Kosmosdale, Ky.., process cement from lime-
stone; several quarries are operated to provide road material and concrete aggregate; clay and shale provide material for the manufacturing of brick, tile, and building block. Sand and gravel are produced from pits and hy dredging the river bed. The most important natural resource, water, has been developed extensively by industry. A large supply of even-temperatured ground water permitted development of distilleries and chemical plants and provided the coolant for air conditioning of many buildings in the doV{ntown area. Dairies, breweries, meat packing plants, tobacco processing plants, food processing plants, metal working plants, and refineries also use large amounts of water. More than 700 manufacturing plants employ nearly 100,000 persons in Louisville. At New Alb.any, about 40 industries produce furniture, prefabricated houses, clothing, metal products, chemical products, and other commodities. Principal large industries at Jeffersonville are a boat and machine company, a U.S. Army Quartermaster Depot, and a soap manufacturer. The Indiana Ordnance Works and the Hoosier Ordnance Works are located a short distance up river from Jeffersonville.
The Ohio River, in addition to providing cheap transportation, provides large amounts of raw water to chemical plants and steam-electric plants. Hydroelectric power is also generated at the dam on the Ohio River.
Datum Planes
The elevation of a point is its vertical distance above (or below) some arbitrarily assumed level surface. Such a surface is called a datum olane. The datum plane to which most elevations ar-;-;ererred is mean sea level. The datum is transferred from the sea coast to interior areas, such as Louisville, by a level network. Three such level networks have been run between the sea coast and Louisville. Because of small errors in the leveling, the results of the three networks do not quite agree; therefore, there are three sea level data for the Louisville area.
The Corps of Engineers established a level network in 1896-1906. This datum, referred to as Ohio River datum, is used as a reference on the Ohio River. A second network of bench marks was established by the city of Louisville in 1906, and adjusted to the U;S. Geological Survey network in 1912, it is referred to as the adjustment of 1912. A third datum, the United States Coast and Geodetic Survey adjustment of 1929, is available over the area. The three datum planes are nearly parallel in the Louisville area; their relative position is as follows:
Elevation of normal upper pool at dam 41, measured in feet above mean sea level, is Ohio River datum, 420.00 feet; Adjustment of 1912, 419.53 feet; Datum of 1929, 419.08 feet.
In this report, discussion and data for the Ohio River are based upon Ohio River datum. All of the Louisville city, street, and sewer elevations are based upon the adjustment of 1912. Because the ground-water work is closely related to many city problems, records of ground-water level have been based upon the adjustment of 1912. On illustrations relating river records to ground-water records, the river records have been converted to adjustment of 1912. The 1929 datum is used

6 '{v ATER RESOURCES OF THE LOUISVILLE AREA
for surface water information in areas other than in the city and on the Ohio River.
OCCURRENCE OF WATER
Essentially, the source of all water is precipitation. A portion of the water falling on an area soaks into the soil, and when rainfall rates exceed infiltration rates, the surplus runs overland into the streams. Part of the water entering the soil is evaporated, part is held by capillary forces until used by plants (transpired). and still another part seeps downward to be added to the ground-water body. The water in the ground-water body slowly seeps toward points of lower elevation. Eventually, the ground water discharges as a spring flow or as seepage to the ocean. This seepage and spring flow are the sources of most stream flow during dry weather periods. The hydrologic cycle is extremely complicated and is affected and controlled by the amount of precipitation, the temperature, the nature of soil, the topography, the plant cover, the geology, and other factors. Figure 4 is a generalized diagram showing the movement of water in the Louisville area. Quantitative evaluation of our water supplies requires a basic understanding of all phases of the hydrologic cycle and continuous records of measurement at various points in the cycle. Plate 2 shows places where meteorological observations are made; where stage, temperature, chemical quality, and discharge of surface streams are observed; and where water level, temperature, and chemical quality of ground water are observed.
c:: <:)
Precipitation ·.;:::
1 ~ <:)
c:t <:) ::.
l.u
Q::
1 l.u ~ .... ~
1
Of the' nearly 43 inches of precipitation at Louisville, about 15 inches becomes runoff and flows to the Ohio River in small streams. Much of the remainder is evaporated and transpired by vegetation. In the flood-plain area, where the sand and gravel is covered by river deposits of silt and clay, it has been determined that about 6 inches of water per year percolates to the water table. During the growing season evaporation and transpiration create a deficit in soil mo1sture. Normal summer rains are usually not sufficient to overcome the deficit, and very little water percolates below the soil zone during the summer. Also, in the summer few storms produce rainfall at rates in excess ofinfiltration rates; therefore, there is very little overland flow, and rises in stream level in summer are normally much less than those in winter. After frost, when transpiration and evaporation are reduced, the soil moisture deficiency is soon overcome, and winter precipitation causes ground-water recharge and subsequent high runoff to streams.
The same general seasonal cycle prevails in the areas underlain by shales, except that the amount of water reaching the ground-water body is very small because the rocks do not have sufficient void spaces to transmit and hold the water. Because vertical flow is obstructed by the shale, and because horizontal seepage is very slow through the ·clay soil, complete saturation of the overburden and top soil may occur in the winter in the shale areas. These conditions create serious problems in drainage and cause septic tanks to overflow. In these areas, the flood runoff to streams is greater than in the flood-plain area. Also, during dry seasons very little
Precipitation
l 1 l
Figure 4. -Localized hydrologic cycle - Louisville metropolitan area.

SURFACE WATER 7
ground water is available to sustain low-water flow of streams.
More space for storage is available in crevices and joints in the limestone areas than in the shale areas. In general, the seasonal cycle is similar to that for other areas. However, a wide range of conditions may occur within short distances. At one place, water may enter through sinkholes during each rain, thus intrQ4 ducing water directly to the water table and bypassing the usual seasonal effect of the soil. If crevices are open, they may drain very quickly to streams; if filled with unconsolidated material, it may take a long time for water to travel to a discharge point. Effects of these features are evident in the low-water flow of streams that drain the limestone areas.
Local precipitation is important in supplying the ground-water reservoirs and the water in the local streams-the most important of these streams are Harrods Creek, Middle Fork Beargrass Creek, South Fork Beargrass Creek,· Silver Creek, Floyds Fork, and Pond Creek. The total of the supplies dependent on local rainfall is small when compared with the flow of the Ohio River, which carries the runoff of 91, 170 square miles through the area.
SURFACE WATER
The dominant surface -water feature in the Louisville area is the Ohio River. This great stream has played an important role in the history of the area, and it continues in that role for the present-day requirements of water supply, navigation, and other functions and problems involving floods and pollution.
The other surface waters of the area consist of a network of small streams, many of which are directly tributary to the Ohio River. (See pl. 2). Economically, these small streams have little importance as sources of water. Perhaps they may be considered more of a liability in that the expanding municipalities must provide pollution control and drainage for areas behind flood-walls. These streams are considered unreliable as an important source of water (except with large carry-over storage), because during dry periods in most years the flows become very low or else the streams cease to flow altogether.
The Ohio River
The Ohio River is formed at Pittsburgh by the confluence of the Allegheny and Monongahela Rivers. ·At Louisville, 605 river miles downstream from Pittsburgh, the Ohio River has drained an area of 91, 170 squar:e miles (almost half of the total basin area of 204,000 square miles). The drainage basin above Louisville includes most of Ohio and West Virginia and parts of seven other States. The topography of the basin ranges from the rugged mountains of West Virginia to the rolling hills of Indiana and Ohio.
The Ohio River is very important to the millions of people residing in the basin. To those in the metropolitan area of Louisville, the Ohio River is an important asset, but at times it is a liability. The stream contributes valuable services to the Louisville area by supplying water for municipal and industrial use,
by assisting in the recharge of adjacent ground-water reservoirs, by supporting an extensive river commerce, by providing a medium for sewage and waste disposal, and by providing a recreational area. Destructive floods and the polluted condition of the river have caused serious problems in the past. Measures for flood control, protection, and pollution control, directed towards improvement of these conditions, have been undertaken in recent years.
Navigation. -The Corps of Engineers, Department of the Army, aids navigation on the Ohio River throughout its 981-mile length from Pittsburgh to Cairo. The channel depth is maintained at 9 feet by a series of locks and dams and by dredging. The river is navigable throughout the year, except for occasional interruptions caused by freezing or by running ice in unusually cold winters.
The navigation locks and dam create a continuous series of pools during normal river conditions. Thus, at Louisville the upper pool (formed by dam 41) extends upstream for a distance of 73 miles to dam 39, and the lower pool extends downstream for 26 miles to dam 43.
The falls of the Ohio River at Louisville is the only substantial natural falls on the entire stream. Louisville derives its nickname ''The Falls City'' from this natural river feature, which consists of a series of rapids as the bed of river drops about 26 feet in 3 miles.
Since the days of early settlem .;,nt in the area, Louisville has been an important navigation point on the Ohio River. Several dams have been constructed at the falls of Louisville during the past century. The present lock and dam 41 and the hydroelectric plant were constructed during the period 1925 to 1927. The hydroelectric plant operated by the Louisville Gas and. Electric Company has an installed capacity of 80, 000 kilowatts.
An operational feature of dam 41, as well as for other navigation dams on the Ohio River, is the manipulation of movable sections of the dam during low and medium flows, in order to maintain a constant pool stage. Thus at dam 41, a constant water-surface elevation of 420 feet above mean sea level is maintained in the upper pool by these manipulations. Below the dam, a watersurface elevation of about 383 feet above mean sea level is maintained by the operations at dam 43. These operations result in a 37-foot drop in the water surface at dam 41 during low water.
The drop in water surface at dam 41 is less than 37 feet at high or medium stages. As the flow of the river increases, the water level in the pool above the dam is maintained at nearly 420 feet by lowering movable sections of the dam. The pool level at dam 43 is maintained in a similar manner. However, the water level below dam 41 increases as the flow increases because the slope of the water surface between dam 41 and 43 also increases. When the water surface in the lower pool has reached the top of the dam, all movable sections of the dam are down and "open river" conditions prevail. When the river is falling, the procedure is reversed.
Navigation traffic on the Ohio River has increased considerably in the past few years. Principal shipments in and out of Louisville are coal and coke, stone, sand and gravel, oil and gasoline, metals, and

8 WATER RESOURCES OF THE LOUISVILLE AREA
ci1emicals and related products. In 1951, over 18,000 ooat passages were observed at dam 41--about 14,000 were barges, about 31 000 were towing vessels, and the remainder were small craft. Barge tows sometirnes consist of 15 or more barges carrying a total cargo of as much as 8, 000 to 10, 000 tons.
Discharge. --Daily records of the river stage have been collected on the Ohio River at Louisville since 18 72, and records of the daily discharge have been collected since 1928. The discharge records for the period 1928 to 1935 were collected and reported by the Corps of Engineers. Since 1935, the records of daily discharge have been published in the annual reports of the U.S. Geological Survey.
There are two gages at lock and dam 41, the upper [;age and the lower gage. The lower gage is used by the U.S. Geological Survey. The zero of the lower g-age is at elevation 374.00 feet above mean sea level, and the zero of the upper gage is at elevation 403.0 feet above mean sea level (Ohio River datum). Critical gage heights and elevations on the upper gage are as follows: pool stage at gage height 17. 0 feet (elevation 420.0 feet above mean sea level), flood stage at gage height 28 feet (elevation 431 feet above mean sea level), 1937 flood crest at gage height 57,15 feet (elevation 460, 15 feet above mean sea level).
:;:.... 25,000 < 0 p;:: ~ Ill 00 z 20,000 0 ...:! ...:! < d z g 15, 000 ...:! ...:! 1-1
:;E z 1-1
~· 10, 000 d ·p;:: < ::r:: u 00 1-1
0 5000
The average discharge of the Ohio River at Louisville for the 25-year period 1928-52 was 75,060 mgd (116, 000 cfs). The "l'laximum discharge during this period was 1, 110,000 cfs on January 27, .1937; the minimum discharge was 1, 360 mgd (2, 100 cfs) on August 12, 1930. The minimum average discharge for any 10 consecutive days during the period of record was 2, 370 mgd (3, 670 cfs) in October 1930, and the minimum average discharge for any month was 2, 840 mgd (4, 400 cfs) in October 1930, Figure 5 shows the minimum daily and monthly discharge for each year of record from 1928 to 1952.
The flow-duration curve (fig. 6) shows the precentage of time that the· daily flow of the Ohio River a.t Louisville exceeded various values. In statistics, this type of curve is commonly called a cumulative frequency curve. The shape of the curve is indicative of the flow characteristics of the drainage basin.
The duration curve of daily flows demonstrates that during the period 1928-52 the discharge of the Ohio River at Louisville equaled or exceeded 3, 500 mgd (5, 420 cfs) 99 percent of the time, and that the discharge equaled or exceeded 116,000 cfs (average flow at Louisville) 35 percent of the time.
40,000
0 z 0 u ~ 00
p;:: 30, 000~
E-t ~ Iii ~
u H p:) ::J
20, 000 u z 1-1
r4 d p;:: < ::r:: u
10, 000 ~ 0
0 1930 1935 1940
CALENDAR YEAR 1945 1950
Figure 5. -Minimum daily and monthly discharge, Ohio B.iver at Louisville, 1928-52.

0 z 0 u IZI 1'1.1
ll:: IZI !l. E-< IZI IZI r:.. u § u ~ rJ .o
~ u 1'1.1 s
0 z 0 u r.l Cll
0:: r.l !l. E-< r.l IZI r:.. u li:i ::> u ~ rJ 0 0:: < :I: u ~ 0
30
3
2
100.000
80,000
60,000
50,QOO
40,000
20,000
10,000
8000
6000
5000
4000
3000
2000
1000
800
l>< < 0 1):1 IZI !l. 1'1.1
~ ..:I
~ 0 z g ..:I
~ ~ rJ 0
-~ u ~ 0
--000 J.,OOq
800,000
600,000 500,000 400.000
300 .000
200 .000
100.000 80,00 0'-
--60,000 50,000
40,000
30.00 0
20,000
10,000
8 000
6 5 4
3
000 000 000
000
"""
--
--
~--
,__ __
OOQ O.Dl
SURFACE WATER 9
r-.
....... -........,._
!'-... r-....
........... '-...
" ' 1'\.
" ' ' ' "' Example: The daily flow at Louisville _
" equaled or exceeded 3,500 mgd during 99 percent of.-the time during the period-
...... 1928-52 ...... v
-.......... L /
......... ""' ......... r-.....
.............
DRArAGE rEA l170 sriE TES
0.05 0.1 0.2 0.5 10 20 30 40 50 60 70 80 90 95 98 99 99.5 99.8 99.9 99.99
PERCENT OF TIME DISCHARGE EXCEEDED THAT- SHOWN
Figure 6.-Duration curve of daily flows, Ohio River at Louisville, 1928-52.
100,000
l>< < 0 0:: r.l !l. Cll z g ..:I < 0 z g ..:I :l ::E
~ rJ 0 0:: < :I: u ~ 0
80,000
60,000
50,000
40.000
30,000
20,000
10,000
8000
6000
5000
4000
3000
.......... "-.
..... ...........
............. ............ Example: The average 30,day flow at Louisville
...... .............. will be less than 5, 000 mgd at average
' .......... -- intervals of 12 years and the average
" ............... r- 3o da 10-day flow will be less than 5, 000 mgd
' --..............._ ~ at average intervals of 4. 4 years
'r-.... --..!..!l.!_ay -- :> i<r--~ ..................... --t-r- r--
~ -~
---1----r-r-
1----t!<xample: The daily flow a-tl:ouisviile will be less elowest average 30-day discharge in 1930
eloiest iverafe 1IOfyl d~sc1harge in 1930 than 3, 500 mgd at average intervals 2000 of 2. 7 years
elo~est daily ~isJhJgJ ~ 1930
1000 1---DRAINAGE AREA 91,170 SQUARE MILES I
800
600
500 LOI 1.1 1.2 1.3 1.4 1.5 3 8 10 20 30 40 50 60 80 100
RECURRENCE INTERVAL, IN YEARS
Figure 7.-Drought frequencies, Ohio River at Louisville, 1928-52.
200

10 WATER RESOURCES OF THE LOUISVILLE AREA
The discharge of the Ohio River at Louisville during the period of record was studied to determine the pruoable recurrence interval, or frequency, of low flow. The recurrence intervals of minimum average flows of 1, 10, and 30 days duration are given in figure 7. The curves are based on the lowest flow for each year of record. The plotted points, except those for 1930, lie fairly close to the curves. It may therefore be concluded that the recurrence interval of the 1930 drought is much longer than the 25-year period of discharge record.
The drought-frequency curves show that during the 25-year period the flow of the Ohio River at Louisville was less than 10,000 mgd in almost every year. The daily flow receded to less than 4, 000 mgd in about half the years and to 2, 600 mgd about once in 20 years. The drought-frequency curves also indicate that on the average of once in about 10 years the lowest average flow for 10 consecutive days will be 4, 300 mgd (6, 650 cfs) and the lowest average flow for 30 consecutive days will be 5, 170 mgd (8, 000 cfs). Although the daily flow equaled or exceeded 3, 500 mgd 99 percent of the time (fig. 6) the daily flow was less than 3, 500 mgd at average inte~vals of 2. 7 years (fig. 7). The recurrence interval does not imply any regularity of occurrence, instead_.it is the probable average interval between drought flows of a given volume in a long period of time. Daily flows of as low as 3, 500 mgd could occur in consecutive years, but during the period of rec-
Note: Graph shows crest elevation attained by highest flood in each year of record
ord, the flow receded below 3, 500 mgd only about 10 times in 27 years.
In the past few years, several storage reservoirs have been constructed by the Corps of Engineers on the main tributary streams of the Ohio River in Ohio, Pennsylvania, and West Virginia. Additional reservoirs are under construction or have been proposed. Although these reservoirs have flood control as their primary function, some of them are also designated for low-water regulation. It is probable that low flows at Louisville have been increased during the past few years by the operation of these reservoirs and that future low flows will be augmented considerably by these operations. Consequently, the frequency and magnitude of low flows at Louisville, as based on records for the past 25 years, may be appreciably altered by this regulation.
Floods. -Louisville has always been more or less "flood conscious" because of the economic importance of the Ohio River to the community, and because of the effect of floods on that economy. Consequently, this intense local interest has resulted in the maintenance of flood recorc).s since the days of early settlements in the area.
A graphic record of the annual flood crests for the Ohio River at Louisville (fig. 8) indicates the highest elevation attained by the river in each year of record.
460~-------------------------------------------------------------------------ft------------j
""' co co
450~--------------------------~M~-------------------------------------------------tt-----~r-----~
ceo co M
440ffirtir--.n-------~-------------
430~~--~----~B------
400 0 co co M
0 ceo M
0 co co
0 m co M
0 0 m .....
Figure 8. --Maxim'um annual elevations of Ohio River at Louisville, 1832-1952 (only major floods prior to 1872).

i ::> !-< < Cl g:
~ g:
~ 2 ..:1 f.il > f.il ..:1 < ~ z < ~ f.il > g < !-<. f.il f.il r.. l5 z 9 !-< < > f.il ..:1 f.il
SURFACE WATER 11
!937
460
:; ::;; 450 < p
f.il.
" < " g: 440 f.il p.. p.. ;:>
~
15 25 30 I
JANU~-FEBRUARY 1937 • I I I I I I I I I I I I I I I I I I
25 5 10 15 20
FEBRUARY- MARCH 1945
Figure 9. --Stage hydrographs of Ohio River at Louisville, 1937 and 1945 floods.
In recent years, all floods in the Louisville area have been referred to the 1937 flood (which was the highest and most destructive flood in the history of the area). The most recent major flood on the Ohio River occurred in 1945. At Louisville, it was exceeded only by the 1937 flood, although it was exactly 10 feet lower at the crest .
Major floods on the Ohio River at Louisville rise and recede slowly, remaining at or near the crest for several days. This characteristic is apparent in figure 9 which shows graphically the elevation of the water surface for a period of about 3 weeks during the 1937 and 1945 floods. The two floods have a similar shape throughout the flood wave, especially during the crest and recession period.
The probable frequency of floods is an important factor in any project involving flood control and protection, as for example, the design of flood walls, intake structure, or of any structure, such as a warehouse or factory to be built on the flood plain. Flood frequency graphs have been prepared for the Ohio River at Louisville to show the probable average interval in years between floods of various magnitude (fig. 10).
The record is continuous from 18 72 (when daily observations began). From 1832 to 1872, the major floods shown are those described in historical accounts.
This graph is based on past flood records, including the continuous record since 18 72 and the historical flood records to ·1832. The curve is well defined up to the 10-year interval. From the 10-year to about the 50-year recurrence interval, it is fairly well defined, but above the 50-year interval it is not defined. This curve should not be extended.
Lack of mention in newspapers and historical accounts is sufficient evidence to assume that no major floods occurred during the years for which no data are shown.
Example: Flood attaining stage of 445. 5 ft on upper gage has an average recurrence interval of 20 years
~ Upper g~ge'\,_ \ .....-:::: ~ ~--r-·
-~ ~ ·<-
~ ,.- r-- "'-Lower gage
~ ~ --~ -- f-- ..
~ ~ -- ~-
./_ ~-----~..---r/>,... .,,."
2 3 4 5 6 7 8 9 10 15 20
~ f.::::
30 RECURRENCE INTERVAL, IN YEARS
1945
t:: -:::-
40 50 60 70 80 90 100
Figure 10. -Flood-stage frequencies, Ohio River at Louisville, 1832-1952.
1937
I
1, 110, 000 ~ 0 u r.:l
940,000 rJl p:: r.:l
820, 000 ~ r.:l r.:l
710, ~00 Jl:. u ~
s2o. ooo B ~-r.:l 0 p::
~ u {I) s r.:l
~ § p:: fl. ·~
1!50

12 WATER RESOURCES OF THE LOUISVILLE AREA
Plotting of the 1937 flood was based on the length of record from 1832 to 1952; however, the recurrence interval of the 1937 flood is indeterminate bec'l.use the record is not sufficiently long to define the relationship.
Differences in the elevations attained by the same flood above and below the dam are apparent in the two frequency curves. Thus, the plotting shows that a flood of probable 10-year recurrence interval will attain an elevation of about 442 feet aoove mean se2. ~-=·J'el
on the upper gage at dam 41, and it will attain about 440. 5 feet ?n the lower gage at dam 41.
An indication of this ·difference is also apparent in the flood profile (fig. 11). This figure graphically portrays the relationship of flood water-surface to the low-water pool stages in the reach of river from mile 592 (9 miles above the waterworks) to mile 627 at Kosmosdale.
Most floods occur during the 4-month period, January to April, and all of the high floods have occurred in those months (fig. 12). This graphical plotting shows the crest elevation of floods greater than 420 feet above mean sea level that have occurred during the period 18 75 to 1952~ each flood is shown in the month it occurred. A flood attaining a crest elevation
~ ;:J ~ 470 ~ 0 P::: ril :>
of 440 feet above mean sea level is a rather frequent occurrence during the months of January to April. Conversely, a flood during the period of May to November is an infrequent occurrence, and the occasional flood during that period rarely exceeds an elevation of 430 feet above mean sea level.
The disastrous flood of 193 7, which caused untold suffering and damage in the Louisville area, stimulated plans for flood control and protection, not only locally, but throughout the Ohio River basin. Local interest and support, combined with Federal action, has resulted in the construction of flood walls for the protection of Louisville, Jeffersonville, and New Albany. Design and construction of these flood walls is under jurisdiction of the Louisville District, Corps of Engineers, Department of the Army. Status of the flood-wall projects in 1953 is as follows: Jeffersonville, completed; Louisville, completed except for pumping stations under construction; and New Albany, under construction.
Figure 13 shows the location of these flood walls, which protect Louisville on the south side of the river and Jeffersonville and New Albany on the north side of the river. Also shown on this figure is the approximate area flooded in 193 7. Very small unflooded high spots in the overflow area are not shown.
~ 0
____ 1945 High._Water ..___.._ __ ......._ __ 53 Q ...:l ril :> ril 430 ...:l ~ ril Vl
~ ~ ril 410 :;g ril :> 0 Ill ~
~~ 390
ril ril ~ 380
1S z~ 370 0 E=: ~ 360 :> ril ...:l ril 350
590
Figure
Louisville and Portland Canal
r
Normal pool, Dam 41 DAM 41
..-L-.. __
Lower pool
(lowest point in channel cross section)
595 600 605 610 615
DISTANCE, IN MILES, BELOW PITTSBURGH
620 625
11. --Water-surface profile of 1937 flood on the Ohio River at Louisville, mile 592 to mile 627.
630

SURFACE WATER 13
19,37 460 ([
Plotted points show crest elevations of all floods above present pool stage in month of occurrence. Year of occurrence of the maximum for each month shown above symbol
1884 1945
4' 1913 4. 4'
0 4' • : • :~ 0
4 r' ~. It
4 I. 1921
:~ ~· • ~- 1933 1875 ~· ~. :t I. r• r'
II ~- • I " •
:t ~I
1928 Hll9 4-I I I
~~· 4. I. • I ' I • i • I I • j 420 f----L-~ 1-----1-----·-1----1----!---t----1----1----1-----f----1----
35
JAN
34
FEB
41
MAR
31 12
APRIL MAY
0
JUNE jULY AUG
0
SEPT
0
OCT NOV
12
DEC NUMBER OF FLOODS FOR MONTHS INDICATED
Figure 12. -Frequency of floods by months, Ohio River at Louisville, 1875-1952.
The flood walls, of course, narrow the overflow channel. Thus, for a very high flood,similar to the 1937 flood, the effect of the flood walls on both sidoes of the river is expected to raise the stage of the river a little more than half a foot. This fact should be taken into account in considering flood frequencies based on past records.
In addition to the local protection projects, other measures for flood control in the Ohio River basin have been under way since the 1937 flood. These measures consist of the construction of dams and reservoirs on the large tributary streams by the Corps of Engineers. Several of these reservoirs have been completed in the past few years and others are under construction or are proposed. The primary purpose of most of these reservoirs is for flood control. Undoubtedly, operation of the completed group of reservoirs has had some effect on flood heights at Louisville, and the final network of reservoirs should make a substantial difference.
Quality. -There is considerable variation in the chemical quality of Ohio River water. This variation is caused largely by the changes in water discharge
and by industrial and domestic pollution. Under natural conditions, <:he water of the Ohio River in this area would contain principally calcium-magnesium and bicarbonate, and appreciable amounts of sulfate. However, the acid mine drainage into the Ohio River and its tributary streams above Louisville, and the dischar~·e of large amounts of industrial and domestic wastes alter the character of the water. The acid mine wastes decrease the alkalinity, which occurs as bicarbonate, and increase the concentration of sulfate. The industrial and domestic wastes increase the sodium, sulfate, chloride, fluoride, nitrate, and hardness. In addition, oils, toxic substances, and taste and odorproducing compounds are discharged into the river from the various waste sources. The toxic substances, as discharged into the Ohio River, are diluted by the large volume of flow. Since this report does not cover a study of toxic materials in the Ohio River, the reporting of the discharge of these materials should not be taken to infer that dangerous concentrations are present. However, the city of Louisville, which draws its supply of water from the Ohio River, has a considerable problem in making the water palatable and controlling the varying amounts of bacterial and chemical pollution.

14 WATER RESOURCES OF THE LOUISVILLE AREA
-Concrete flood wall
• • Earth levee
C,;.-z:.,.""') Inundated area in 1937 flood
(very small uninundated high spots in the flooded area are not shown)
High-water line I 93 7 flood
See text for construction status of floodwolls
0 3Miles
Based on data furnished by Corps of Engineers
Figure 13.-Location of flood walls and areas flooded in 1937.

z g ...:1 t:1 ::s IX: ~ 0.. rll .... IX: < 0..
es
8 (.)
"' (.)
rll < rll rll ~ z Q It: < :t:
240
210
180
150
120
90
60
1\ \
•'\ [\.
"\
" "" " """ .......... ~ ~ ......._
SURFACE WATER 15
~ ...........
.
The water of the Ohio River is moderately hard, In 1952, it had an average hardness of 146 ppm, a maxi-mum 270 ppm, and a minimum of 58 ppm, according to samples collected and analyzed by the Louisville Water Co. The cumulative frequency curve of hardness shows that the hardness of the water exceeded 135 ppm on about 37 percent of the days recorded (fig. 14). Total solids ranged between 150 ppm and 1,170 ppm. During low stages, the dissolved solids may equal or exceed the 500 ppm limit specified in the United States Public Health Service Drinking Water Standards, and the water during those times is quite hard. The alkalinity of the water is relatively low; it averaged 58 ppm in 1952. Chemical analyses of the Ohio River are given in table l.
Bacterial pollution in the Ohio River is variable. During a 12-day survey, in September 1950, the Ohio River Valley Water Sanitation Commission reported a maximum of 2, 300, 000 coliform bacteria (MPN per 100 ml) at the Louisville water intake, with an average of 211,000 for the period. The single day's count of
1 2 10 20 30 40 50 60 70 80 90 95 98 99 2, 300, 000 coliform bacteria is higher than counts on other days. If this count were omitted, the average
PERCENT OF TIME HARDNESS EQUALLED OR EXCEEDED' THAT SHOWN for the 12-day period would be 21,000. The average concentration of coliform bacteria (B. Coli per 100 rril) in 1950,as reported by the Louisville Water Company, was 4, 982. High bacterial pollution makes the treatment of the water more difficult and may produce troublesome slimes when the untreated water is used by industry.
Figure 14. -Cumulative frequency curve of hardness of Ohio River water at Louisville, 1950-52.
100
I I 90
0~10 RIVER WEEKLY TEMPERATURE
( v
v ~ f\ A
,lrl~ ;:: jr~; t1 ~~ I I I I
L, I j : I l L !
80
I '-I\ ) ~ ; I ~~ r~ I
) I '-
I I I I I I I l_\ I I
L l I I I
,f ~ I
I v I II I r I I I l; I I-I I I
I I ~ I I I I I
I I I I I I I r ·~
p I T
I I I I ,) L
~r I I I 1 I
~
' I
} A L~ wJ1 L I
r v i~~l ' Lr I !'II I I r I I I I I,
--
40
30
I I
I I I I I I I
J ·~
I I I
u _:---AVERAGE rONTHLY AIR T
1
EMPERATURE
I I I I I J1 I I I I I I I I I I I I I I I I I I I I I I I 20 1946 1947 1948 1949 1950
[\
f: 1\ I
~~~ I I I I I I I I
.....
I I I
I I I
~~ N I
I
~~ Ll
I I I II I I I
1951
Figure 15, -Temperatures of Ohio River water and air at Louisville, 1946-52.
6 I I"~ I -I I
I I L
,... I r I I
:r r I
I I -1
J L~ I
f-' L
I I I I
1952

16 WATER RESOURCES OF THE LOUISVILLE AREA
Table 1. -chemical quality of surface
lnstantane-Source Date ous Silica Iron Cal- Mag- So- Potas- Bicar-
discharge (Si02) (Fe) cium nesium dium sium bonate (cfs)1 (Ca) (Mg) (Na) (K) (HC03)
Ohio River at Louisville, Ky .•...• 21951
3 - - - - - - - 46
Do ........................................ Oct. 15, 1952 314,500 0.7 0,02 57 15 36 3,2 80
Do •.•.••..•••......•....••.••.....••••.•.•. Nov. 14 3 20, 100 2.4 • 04 74 17 49 3.8 82 Do .... _ .................................. Dec. 15 122,000 5.6 ,05 56 12 31 5. 1 63
Floyds Fork at Fisherville, Ky .•. June 11, 1952 . 9 3.7 ,03 56 19 5.2 . 8 232
Do ........................................ July 24 . 6 6.8 .04 43 5.3 1.6 3.5 136
Do .............•.•.....•..••...•••...•.•.• Sept. 26 .No flow 2. 1· .02 54 8.5 3.2 4.2 165
Do .....•..•...••.••••..••••...•••..•.••..• Oct. 30 No flow 1.2 . 05 64 9.2 2.8 2.3 188
Middie Fork Beargrass Creek at Louisville, Ky ....................... June 10, 1952 2.6 8.4 ,03 58 16 8.7 2.0 209
Do ........................................ July 24 . 5 8. 1 ,03 56 14 18 4.0 1)!1 Do ........................................ Sept. 26 . 1 3.0 ,03 64 10 28 2.4 194
Do ........................................ Oct. 31 . 1. 3.4 ,03 83 17 28 2.7 262
South Fork Beargrass Creek at Louisville, Ky ....................... June 10, 1952 2.2 3.8 ,02 33 11 7.0 1.4 94
Do ......................................... July 24 .4 13 .07 48 12 20 6.8 172
Do ......................................... Sept, 26 No flow 9.8 ,04 64 12 13 1.8 224
Do ......................................... Oct. 31 . 1 7.9 • 10 93 16 21 2.3 312
Harrods Creek near Prospect, Ky. June 9, 1952 4.3 3.3 ,01 46 24 4. 1 1.6 238
Do ......................................... July 23 .5 4.3 ,03 37 23 3.0 2.1 205
Do .......................................... Sept. 25 . 2 3.5 .03 38 20 10 2.4 194
Do .......................................... Oct. 30 1.0 7.8 .03 51 23 10 2.7 235
Pond Creek near Louisville, Ky ... June 1"1, 1952 5.4 6.6 ,02 37 10 22 1. 4 104
Do ......................................... July 25 3,6 5.9 ,04 36 12 40" 2.5 114
Do ......................................... Sept. 26 2.0 2.7 .06 33 15 67 2.0 72
Do ......................................... qct. 31 2.4 3.6 ,06 35 15 86 1.8 76
Silver Creek at Blackiston Mill, Ind ....................................... June 9, 1952 5.5 6.2 .02 36 9.7 12 2.6 90
Do ....•••••.•••.••......••••..•••.•.•.•••.• July 23 2.0 6.6 .03 34 13 15 3,2 128
Do ......................................... Sept. 25 . 1 4. 1 .06 45 10 12 3.2 154
Do ......••.•.•••....•.•.•.••...•....•...••. Oct. 31 . 2 4.7 ,03 48 11 12 3.0 163
1 Provisional records. 2 Average of determinations by Louisville Water Co., Bicarbonate, chloride, and hardness determined daily;
others at frequent intervals. 3 Mean discharge.

SURFACE WATER 17
waters in the Louisville area
Hardness Specific Sul- Chlo- Fluo- Ni- Phenols Oils Dis- as CaC03 conductance fate ride ride trate as and solved (micromhos pH Color (S04} (Cl} (F) (N03} c 6H50H waxes solids Ca, Mg Non-car- at 25°C) bonate
- 23 - - - - - 134 78 - - -140 49 0.5 3.6 - - 355 205 138 593 7.2 4 196 68 .4 5.4 - - 457 256 187 762 7. 1 6 147 39 . 5 8. 1 - - 338 189 137 555 6.7 5
33 5. 5 • 1 1.5 - - 246 218 28 425 7. 1 6 21 2.8 .2 3,4 - - 163 130 18 274 7. 0 8 39 4.2 . 2 2.0 - - 208 171 34 357 7.4 6 49 6.0 . 2 . 2 - - 240 198 44 403 7.5 6
32 13 . 1 3,4 - - 255 208 39 I 434 7.4 4 53 21 . 3 6.0 - - 274 195 41 472 7.4 4 58 35 . 1 1. 0 - - 305 202 42 522 7.8 4 71 39 . 2 2.6 - - 385 280 62 652 7. 7 10
53 10 . 8 .8 - - 176 128 51 299 7.0 5 40 26 . 1 6.0 - - 263 170 28 447 7.4 3 36 15 . 1 2.0 - - 270 208 26 455 7,3 6 55 25 . 1 .2 - - 384 298 42 640 7,7 13
21 5,0 . 1 1.4 - - 231 211 18 410 7,8 3 21 4.5 • 1 . 9 - - 198 188 19 363 7,6 3 24 17 . 1 . 8 - - 217 179 18 388 8. 1 5 33 14 . 1 . 0 - - 262 220 29 461 7.9 8
71 20 1. 0 . 0 0.014 4.0 243 135 48 394 6,7 7 93 27 . 9 1. 4 . 020 6.0 280 142 46 475 7.0 9 139 56 1. 0 1.0 . 053 24 359 143 85 601 6,5 9 135 91 1.0 . 9 . 041 37 402 148 87 706 7. 1 12
62 11 . 1 2.7 - - 199 130 56 323 7.7 5 44 14 • 1 5.5 - - 208 137 33 347 8,2 8 44 12 .2 1. 3 - - 215 154 27 379 7.8 5 43 13 . 2 .o - - 221 164 31 377 7.6 10

18 WATER RESOURCES OF THE LOUISVILLE AREA
100 80 70 60 50 40
30
20
l':l 6 ..:I 5 ~ 4 l':l
100 80 70 60 50 40
30
20
10
8
6 5
~ 4 ~ 3
~ 2 g
_.,....., ~
r--·
r--
..... ~ ....
'~,
"' f'_,.
' ' ~' "'' ' ' "', '\!'
1"-'' ~ 3
g 2 ~ l':l
~ p.. 1.0 "\ I'./ Middle Fork Beargrass Creek drainage area 18. 5 square miles
p.. 0
~ ~~ ~ .8
~ .6 l':l .5
~ .8
~ .6 l':l .5 p.. .4 -~ 3 .3
-
"' "' ' '" '\. -,
" '\ '\_:\·
" K_, ~ .4
~ .3 r..
~ .2
~ South Fork Beargrass Creek drainage area 18. 8 square miles-~
~ .2 :;J u ~ iJ:1 .1 (!)08 ~ :o7 0.06 [!3 .05 0 .04
..:I
~ .1
~ :8~ l':l .06
5 ~ .0 II: .04
~ .03 0
r----
1--·--t·
r-- ---t--+--
r--
I\ ~ '\'
\ \' '\L-,.
" ~ ~ .....
'\ ' ,, ' .03
Harrods Creek (est~at~d) drainage area 74 square miles.-/'-..; ' ' .02
.02
.01
.008
.007
.006
.005
.004
.003
.002
1 t----
7 6-5 t---
4 t--·
3
2
1
"\, \ '
\
' '
"' I'\
' \ \
\ ' \ I' ' '\ \_
\
\ '
.do 0.01 0.05 0.1 0.2 0.5 10 20 30 40 50 60 70 80 90 95 98 99 99.5 99.8 99.9 99.99
PERCENT OF TIME DISCHARGE EXCEEDED THAT SHOWN'" HJflt
Figure 16. -Duration curve of daily flows, Harrods and Beargrass Creeks, 1944-52.
Ohio River water temperatures are closely related to air temperature (fig. 15). The water temperature at the surface of the river reached a maximum of 90° F, a minimum of 32° F and averaged 59° F during the period 1946-52.
Small Streams
The small streams of the area are shown on the reference map, plate 2. The information provided in this report is confined to the five largest streams, namely-: Harrods Creek, Silver Creek, and Beargrass Creek (all direct tributaries to the Ohio River); and Floyds Fork, and Pond Creek {tributaries to Salt
River). These five streams drain more than two-thirds of the area, which consists of parts of the three topographic types. Plate 2 shows the drainage boundaries, the stream-gaging stations, and where discharge measurements have been made. The discharge, chemical quality, and other information for each stream and basin are as follows:
Harrods Creek. --Harrods Creek drains an area of 85 square miles of generally rolling farm land. It is almost entirely within Oldham County, Kentucky. 'The stream flows into the Ohio River in the northeastern corner of Jefferson County. Five measurements of stream discharge were made between June and November 1952 at a point 2 miles east of Prospect (drainage

SURFACE WATER 19
300·~------------------~--+-------------------~--j
~ 200
:3 ~ p:: 100
"' p..
MIDDLE FORK BEARGRASS CREEK
------1-----t--- At Louisville ______ --1.-t..-t
HARRODS CREEK SOUTH FORK Near Prospect BEARGRASS CREEK
At Louisville
,.112_··- ·- ,.,I •• fl. LOYDS FORK------1----.-- SILVER CREEK ----------,
At Fisherville At Blackston Mill
100,1-----------t-----
II ~•---'1---
Figure 17. -Chemical character of waters from small streams in Louisville area.
area, 74 square miles). The minimum discharge measured during the period June to November 1952 was 0. 13 mgd (0. 2 cfs) on September 25, 1952. Lowflow characteristics of the stream are shown by the flow-duration curve in figure 16, which was computed by comparison with Beargrass Creek.
The water of Harrods Creek is predominantly the calcium-magnesium bicarbonate type, which is typical of the natural chemical character of the surface water in the area. The four samples analyzed (1952) show that the dissolved solids ranged from 198 to 262 ppm, and the hardness ranged from 179 to 220 ppm. The l"anges would be larger if the stream had been sampled more frequently over the entire year. Analyses are given in table 1 and are illustrated in figure 17.
Beargrass Creek. -Beargrass Creek drains an area of 65.4 square miles (from Louisvi-lle Sanitation Commission, 1927) entirely in Jefferson County, Kentucky. The .area comprises a hilly residential section of Louisville, and the remainder is mostly farm land on a rolling plateau. The drainage basin of Beargrass Creek is contained mainly in the area of the three forks (Middle, Muddy, and South Forks). The main stream below the confluence of the forks is short and flows into the Ohio River near the upstream end of Towhead Island.
There is evidence that the flow of the forks of Bearg'!"ass Creek, especially Middle Fork, is augmented by leakage from the city water system and from other sources, including seepage from sewers, septic tanks, and swimming pools. Thus, the flow of these streams may not represent the natural yield of the basin. Furthermore, the leakage and seepage will probably increase as the area continues to develop.
Recording stream-gaging stations have been in operation for several years on the South Fork Bcargrass Creek at Trevillian Way and on the Middle Fork Beargrass Creek at Cannons Lane. The flow-durl:ltion curves (fig. 16) show the flow characteristics of the two streams as derived from these discharge records. Other information for these gaging stations, including data for the 8-year period of record, is as follows:
South Fork Beargrass Creek at Trevillian Way (published in Water-Supply Papers as South Fork Beargrass Creek at Louisville): drainage area, 18.8 square miles; datum of gage, 450. 60 feet above mean sea level, . Louisville City Datum, adjustment of 1912; recordmg gage record since 1939 and discharge record 1939-40 and 1944 to date; average discharge, 15.9 mgd (24. 6 cfs) for 9-year period 1939-40, 1944-52; ma~imum discharge, 1, 890 cfs onMarch 6, 1945 (gage height, 11.62 feet); no flow on many days in 5 of the 11 ye_ars for which low-water discharge records are available -longest continuous period of no flow was the period September 6 to October 6, 1952.
Middle Fork Beargrass Creek at Cannons Lane: drainage area, 18.5 square miles; datum of gage 477. 70 feet above mean sea level, Louisville City Datum, adjustment of 1912; recording gage and discharge record from 1944 to date; average discharge 17. 5 mgd (27. 1 cfs) for 8-year period 1944-52; maximum discharge, 1, 400 cfs on March 6, 1945 (gage height, 4. 94 feet); no flow on August 13, 1944, September 12, 1945, and October 5, 6, 1947; the flood of February 1943 reached a stage of 8. 1 feet (485. 8 feet above mean sea level) from information by local residents.
Water samples were collected from the Middle Fork and South Fork of Beargrass Creek at approximately 5-week intervals during the period June to October 1952. The chemical character of water from both forks is similar; the water is predominantly of the calcium-magnesium bicarbonate type. The four samples collected from each fork will only partly cover the range in chemical character. The results, given in table 1, show that the dissolved solids ranged from 176 to 384 ppm and the hardness ranged from 128 to 298 ppm. The average of the four analyses is shown graphically in figure 17.
·Silver Creek. --Silver Creek drains an area of about 231 square miles in Clark and Floyd Counties, Indiana, most of which is rolling farm land. The stream flows into the Ohico River at the eastern edge of New Albany. Four measurements of stream discharge were made between June and November 1952 at Blackiston Mill about 2 miles northeast of New Albany (drainage area, about 228 square miles). The minumum discharge measured during the period in 1952 was 0. 06 mgd (0. 1 cfs) on September 25. Low-flow characteristics of the

20 WATER RESOURCES OF THE LOUISVILLE AREA
100' on
70 60 50 40
30 r--.....,
20 .......... . r-r-........ " ...
""... ::_, 10
r.:l r.:l ..:I ..:I 51 51
r.:l r.:l II: II: <
~ :::> (1 g til
II: II: r.:l r.:l p.. p.. >< 0 <
~ 0 u II: r.:l r.:l til p.. II: til [:1:1 ~ p, E-<
..:I
..:I r.:l < r.:l C!) ~ z 8 g p:j· ..:I :::>· ..:I u
~ 2:1 r.:l 2:1 0 r.:l II: 0 < II: lil ~ u !!3 u 0 !!3
8 ' 7 "" "-\.. 6
' 5,r-_ 4
~" 3 \'\..
\.'\.
2 \.r\
~:...
1. "\.. .8
'\.
.6 " .5 ' .4 l't..
- -! " .3 ' -:-- ' .2 ~
-· \\
.1n \\ / .- Pond Creek drainage area 63. 1 square miles
.08: \ ,y
:~· \ '\.
-- \ \.. .05 - \ r\ -
.n' '\.
.03 \ '\.
0 .0 \ '\.
t "· \ I
Floyds Fork drainage area 138 square mj.les_-1--_,
\ \. .01 I\
dos ---·
~~ 1--· \ I 1\.
005 r-- \ I \..
004 " '\. 00
\ I " n'N'l \ \. -~·
\ Silrr Cryk draiage lea 2i8 sq,are
1milel--\
001 O.Gl ().()5 0.1 0.2 0.5 10 20 30 40 50 60 70 80 90 95 98 99 99.5 99.8 99.9 99.99
PERCENT OF TIME DISCHARGE EXCEEDED THAT SHOWN.
Figure lB.-Duration curve of daily flow; Silver Creek, Floyds Fork, and Pond Creek, 1944-52.

GROUND WATER 21
stream are shown by the flow-duration curve (fig. 18), which wa:s computed by comparision with Muscatatuck River.
The chemical character of Silver Creek is similar to that of other small streams in the area. Four water samples were collected and analyzed during the period June to October 1952. These results show a range in dissolved solids from 199 to 221 ppm, and hardness ranges from 137 to 164 ppm. These ranges would be larger if the stream had been sampled more frequently over the entire year. The analyses are given in table 1 and illustrated in figure 17.
Floyds Fork. --Floyds Fork drains an area of 262 square miles, which includes parts of five Kentucky counties. The stream rises in Henry and Oldham Counties and flows southwestward to join the Salt River in Bullitt CountY, near Shepherdsville. The Floyds Fork basin exte.1ds over the eastern one-third of Jefferson County, a hilly area of small towns.
The natural regimen of Floyds Fork is largely undisturbed because no extensive urban orindustrial developmen.: has occurred in the drainage basin. Continuous stream-flow records have been obtained at a recording gaging station on Floyds Fork at Fisherville from August 1944 to date. The flow-duration curve (fig. 18) shows the flow characteristics of this stream, as derived from these gaging-station records.
The shaly formations in the Floyds Fork drainage carry very little ground water to support the base flow of the stream, a condition which accounts for the greater steepness of the duration curve.
Other information for this gaging station, including discharge data for the 8-year period of record, is as follows: drainage area, 138 square miles; datum of gage, 542.60 feet above mean sea level, 1929" datum; average discharge, 132 mgd (204 cfs); maximum discharge, 10, 100 cfs on April 12, 1948 (gage height, 13.34 feet); no flow on some days during most years of record - longest continuous period of no flow, Septem.ber 3 to November 18, 1952; the flood of 1937 reached a stage of about 16.8 feet (559. 4 feet above mean sea level) according to information furnished by local residents.
The water of Floyds Fork may be classed as predominantly the calcium-magnesium bicarbonate type. Four water samples were collected during the period June to October 1952. The results of analyses show a range in dissolved solids from 163 to 246 ppm and in hardness from 130 to 218 ppm (table 1 and fig. 17).
Pond Creek. -Pond Creek drains an area of 93 square miles, which is contained almost entirely in the south-central and southwestern section of Jefferson County, Ky. The area is mostly flat farm land and a few developed areas,except in the southern part of the basin where the topography is rugged with some wooded areas.
The two main forks of the stream have been straightened and improved in the central part of the basin. These improved and relocated channels are now known as· Northern Ditch and Southern Ditch. The improvements, including side drainage ditches, were made to provide drainage for the adjacent swamp lands
and to facilitate the passage of flood waters. A great part of the swampy area has been reclaimed for agricultural and residential development.
Pond Creek is improved and straightened for several miles below the confluence of the two forks. The main stream continues southw·estward to join Salt River at West Point, less than a mile from the Ohio River.
Stream-flow records have been obtained since August 1944 at a recording gaging station on Pond Creek about 1. 6 miles downstream from the confluence of Northern and Southern Ditches. These records of discharge for Pond Creek do not represent the natural yield of the basin. Water from the Louisville municipal system is diverted into the basin through disposal from several industrial plants. The recent construction of additional large industrial plants and the anticipated location of other plants in the basin will cause further increase in this diversion. An added factor has been the effect of extensive residential developments, largely without sewer connections, in the area during the past few years-the effluent from the septic tanks seeps into the drainage ditches of the area. Here again, it is anticipated that continued development will probably aggravate the condition.
The flow-duration curve (fig. 18) shows the flow characteristics of this stream as derived from the gaging-station records. Other information for this gaging station, including discharge data for the 8-year period of record, is as follows: drainage area, 63. 1 square miles; .datum of gage, 435. 53 feet above mean sea level; average discharge 60.2 mgd (93. 1 cfs); maximum discharge, 2, 060 cfs on April 13, 1948; no flow on several days in 1948. The flood of January 1937 reached an elevation of about 455 feet above mean sea level, according to information furnished by local residents.
The natural chemical character of Pond Creek water is similar to that of the other streams in the area. However, its character is altered by the industrial wastes discharged into it. Acid wastes cause a marked increase in sulfate content, lowering of the pH and a decrease in the concentration of bicarbonate. The water of Pond Creek had an average sulfate content of 110 ppm for four analyses, whereas the sulfate content for all other tributary streams averaged 42 ppm. The bicarbonate concentration was 92 ppm as compared to an average of 189 ppm for the other creeks. The chloride content was also higher, and a maximum of 1. 4 ppm of fluoride was found in Pond Creek. Oils and phenols are typical of pollution contributed to the Ohio River. The highest phenol concentration observed in four samples was 0. 053 ppm, and the highest oil concentration was 37 ppm. The four analyses from Pond Creek are given in table 1 and the average is illustrated in figure 17.
GROUND WATER
Occurrence
Most rocks containground·water; however, the quantity, quality, and possibility of recovery by wells vary greatly from place to place. Water occurs in the openings in the rocks; these openings may range in size from very small spaces between sand or clay particles to large caverns. The number of openinas may range from a very large number in a sand or gravel formation

22 WATER RESOURCES OF THE LOUISVILLE AREA
to a very small number in a massive limestone or shale. A formation has three water-bearing characteristics: (1) storage capacity, (2) pipe line capacity, and (3) intake capacity. The storage capacity of a formation depends on the number and size of the openings. Where the openings are interconnected, water can flow from one place to another as through a network of pipes. This pipeline characteristic permits water from distant parts of the formation to flow to a pumped well. Continual pumping will remove water from storage, and water levels will decline. If the formation is exposed at the surface, or if it intersects a stream, recharge may occur either by precipitation or by stream water entering the formation. Under natural conditions. average discharge equals average intake. If storage is not to be depleted indefinitely, withdrawals are limited to that part of the intake which is diverted from its natural course to discharge areas. It is rarely possible to salvage all the natural discharge. However. in the Louisville area the natural intake of the principal aquifer (the valley fill) can be augmented by induced infiltration, as described later. Table 2 gives the water-bearing characteristics of typical formations.
Table 2. --Water-bearing characteristics of typical formations
Formation Intake Pipeline Storage
Sand and gravel Excellent Good 10-30 percen by volume
Clay Poor Very poor 30-80 perc en by volume
Shale Poor Very poor Small Creviced
limestone Good Excellent Variable
In the Louisville area, several geologic formations are present. Table 3 gives a description of the formations and their water-bearing properties. The principal water-bearing formations are limestones, and sands and gravels. The clay. shale, and shaly forma,tions are not important water producers, but they are important because they influence the flow of water to or from the other formations.
Consolidated Formations
The bedrock formations of the Louisville area lie in beds of nearly uniform thickness and dip toward the sc. _ .hwest at a rate of about 40 feet to the mile. Formations below the Waldron shale (table 3) are exposed at the surface in the eastern one-third of Jefferson County. These formations contain beds of argillaceous shale and other shale, which prevent the vertical percolation of water. Storage space is very small, and transmission rates (capacity for ground water movement)" are low. On the ground-water map (pl. 1) this is classified as a poor ground-water supply area.
The Louisville, Jeffersonville, and Sellersburg limestones are a water-bearing unit exposed in the northern, central, and south-central parts of Jefferson County and in eastern Clark County. These formations also underlie the valley fill under the central part of the city of Louisville and are exposed in the river bed at the falls of the Ohio River.
In the upland areas, the joints and bedding planes have been moderately developed by solution, thus providing good transmission capacity but very low storage capacity. In these areas (see pl. 1). wells which intersect joints will produce water; those which fail to intersect a joint are dry. The producing wells usually provide sufficient water for household use, rarely more.
These same limestones, where they underlie the valley fill in Louisville, are below water level and have been extensively developed by solution; that is, many crevices and caverns have been formed. In this area, wells intersecting a crevice will produce very large amounts of water; those not intersecting a crevice are dry. (See fig. 19).
Where the limestones are covered by shale, water has had little opportunity to circulate in the joints. and enlargement by solution has not occurred. Most wells drilled in such an area will be dry. If water is found, the amount is small, and the quality is usually very poor.
The New Albany shale (black) is exposed in the Scottsburg Lowland area. The black shale usually does not produce water. In this area. the shale covers the limestones; therefore, these underlying formations are nonproductive. Poor underground drainage, fine clay soil, and flat topography combine to make surface drainage and septic tank operation difficult.
The bedrock in the Knobs area is made up of shales, limestones, and sandstones of the Mississippian age and, in the Louisville area, are usually not considered as sources of water. The very rough topography is of prime importance in relation to poor ground water conditions. The steep slopes cause the stormflow to run off rapidly, thus reducing the time and opportunity for recharge to the formations. Also, ground water seeps from the formations toward the deep valleys; therefore, very little water is stored in the rocks.
"Ohio River Valley Alluvium
The extent and location of the Ohio River valley is shown on plate 1. Cross-sections (figs. 20 and 21) show a narrow. deep, U-shaped channel upstream from Louisville. The channel widens at Louisville to nearly 6 miles, then it gradually narrows toward the southwest. The valley is partly filled with glacial-outwash sands and gravels, and with river deposits as much as 150 feet thick. A clay blanket, ranging from 5 to 40 feet in thickness, covers the sands and gravels. Because sufficient data are not available to determine the contact between the alluvium and the glacial outwash, in most places they are not shown separately on maps and in cross -sections, and the term .. glacial outwash sand and gravel" is used. The outwash material is a mixture of clay. sand, and gravel of all sizes. Lenses of clay, sand, or gravel are common. The character of the material varies considerably over short distances.
The present Ohio River flows on sand and gravel at a higher elevation than the glacial stream. Northeast and southwest of Louisville it follows the course of the ancestral stream. At Louisville, the present river flows in a channel north of the old deep channel and at the falls, it flows on bedrock. (See section CC, fig. 20~

Table 3. --Water-bearing' properties of the principal formations in the Louisville area
Approximate System Series Group Formation thiclmess Character of material
(feet)
Recent Alluviwn Soil, clay, fine sand.
Quaternary Gravel, sand, and clay deposited in the buried
Pleistocene Alluviwn 0-130 valley of the Ohio River.
Meramec Warsaw limestone 65-82 Fine-grained limestone with geodes and chert, siliceous and argillaceOIIJS. Some shale.
Holtsclaw sandstone 15-25 Fine-grained sandstone, thick-bedded, soft.
Carboniferous Mississippian Rosewood shale 190 Bluish shale with thin lenses of limestone. Osage
(Knobstone) Kenwood sandstone 40 Thin beds of fine-grained greenish sandstone in bluish shale.
New Providence shale 150-160 Soft clay shale, green or bluish.
Upper New Albany shale 90-100 Black shale, carbonaceous and fissile.
Devonian Sellersburg limestone 12-24 Light-gray limestone, thick-bedded; upper bed
coarse-grained1 lower, fine-grained. Middle
Jeffersonville limestone 20-25 ·Coarse-grained, dark-gray limestone, thick-bedded.
Louisville limestone 42-100 Fine-grained, gray limestone, thick-bedded.
Waldron shale 8-12 Bluish shale, calcareous and magnesian.
Silurian Laurel dolomite 30-40 Fine-grained dolomite, medium thick-bedded.
Osgood formation 22-30 Shale and shaly dolomite, highly magnesian. Red bed near bottom.
Brassfield limestone 3-7 Coarsely crystalline limestone.
Saluda limestone 30-40 Fine-grained limestone, thick-bedded, magnesian.
Liberty formation 36-50 Alternating clay shale, and thin limestone layers. Ordovician Richmond
Waynesville limestone 40-50 Thick-bedded limestone; shale at top and bottom.
Amheim formation 75-100 Thin limestone interbedded with blue clay shale.
Water-bearing properties
Not important as an aquifer. At places acts as confining bed for water in underlying sand and gravel.
Stores very large amounts of good quality water. Wells commonly yield 200 to 500 gpm, occasionally as much as 1, 000 gpm.
These formations occur only on the "Knobs• and along the "Knobstone" escarpment and are not important as aquifers in this area.
Not a source of grotmd water.
Generally not considered a source of grotmd water. In rare cases, supplies of household size have been obtained from joints. Acts as sealing bed impedit:o.g fiow of water into underlying <formations.
Where covered by shale, wells yield water of unusable quality, or no water at all. Where not covered by shale, wells in the uplands produce household supplies, and in the river valley they produce several hundred gallons per minute. Some holes are dry.
Does not produce water. Impedes upward or downward movement of water.
At depth usually produces salt water, or no water at all. Where not covered and in low topographic setting occasionally yields small to moderate supplies.
Not considered important as water-bearing formations. Depths below 100 to 150 feet produce water of unusable quality, or no water at all. At shallower depths, only a 'mall percentage of wells produce supplies of household size.
0 ::0 0
~ t:J
:El ::r> t-3 t_:rj
::0
~ w

"'%j
aci' s:: "i ('D
,_. co I r 0 ;:l
~-2' 0. s· e Ul ('D (')
c;· ;:l
8, 0 ::r c;· ~ ~-'"$
< e ro-« ~ r 0 s:: (jj"
~ ~
ELEVATION IN FEET, ABOVE MEAN SEA LEVEL (1912 ADJUSTED)
N N N W'W W W.,..,. ~ .,. ~ o w m ~ N ~ 0 0 0 0 0 0 0 0 0 l ' I.",.',."..' •.•. ,.1, I I I I ;:to.
(/1 Cll Cll
'0 .-o
c; Cll
1\)
Q
:::J 0. -.c· L§ c ... 0
Cll ;:' 1\)
,.. 1\)
:e Q
Cll ... Cll < Cll
0 Cll 0 Cll
3 0' Cll ... <0 Ul 1\)
Cl
~ \ Q ~ ~. 0. ~ Q
:::J 0.
~ Q
< Cll
RIVER
LOWER PADDY - RUN
-BELLS LANE
-22D STREET
10TH ST. AND - BROADWAY
-3D STREET
MAIN -STREET
BEARGRASS -CREEK AT
RIVER ROAD
LOUISVILLE _..,., 1 ~-WATER CO.
PUMPING STATION
I '>'"'"'" -OH(O RIVER
V:!I'HV :!I'l'liASIIlO'l :!IH..L .!iO S:!I;)BilOS:!I'H 'H3..L VM. vz

'%j
liQ" t: '1 Cb
t..:l
?
h '1 0 1'JI 1'JI I
1'JI Cb (') ..... c;· ::s 1'JI
9,
s-Cb
0 ::r c;· iXl :;:· Cb '1 ...., 0 0 0.
"0 Pi s· ~ t"' 0 t: fii" ~ fD
g~
E L E VAT I 0 N, IN F E E T, A B 0 V E MEAN SEA LEVEL (1912 ADJUSTED) ~ ~ ~ ~ ~ & 0 0 0 0 0 0
~--~----~--~----~~~~
en CD CD
'1:1 g
CD
"' g :::J Q.
- aJ CD c Q.
~ CD
"' "'
it < CD -0 CD ()
CD
3 CT CD ... iD Ul
"'
§ 0
l
... Q :::J Q.
g :::J Q.
.a ... Q
< !.
G)
Q ()
Q
0 c:
i g ... ?
WESTERN PARKWAY
-MARKET ST.
-HILL ST.
ROAO
ELEVATION, IN FEET, ABOVE MEAN SEA LEVEL (1912 ADJUSTED) ~ ~ ~ ~ ~ & 0 0 0 0 0 0
I~~~~~ ~R~to
... G) Q -:l g Q. ()
Q :::J Q.
a·
--OHIO RIVER
-RIVER ROAO
-ZORN AVE
I -\\Y/,/~116 syz ""-;:._ M~L LWOOO AVE.
ELEVATION, IN FEET, ABOVE MEAN SEA LEVEL (1912 ADJUSTED) ~ ~ ~ ~ ~ & 0 0 0 0 0 0
:;;--...SILVPR CREEK
-PENNSYLVANIA
-PONO RUN
-PENNSYLVANIA RR.
-OHIO RIVER
-MAIN ST.
BEARGRASS CREEK
'H::~UVM. GNfiO'HD

~ oq. r:: '1 (1)
t.,) .....
h '1 0 Ul Ul I
Ul (1)
~ c;· ::s Ul
a ::T (1)
0 :::; c;· ::0 ~-'1 ....., 0 8. '"0
iii' s· Ul 0 r:: ::T ~ (1)
~
a l' 0 r:: Ui. <
8
ELEVATION, IN FEET, ABOVE MEAN SEA LEVEL (1912 ADJUSTED)
w w w ~ ~ . ~
~ ~ ~ ~ ~ ~
I I 1~1 I lc;':)
?:!!lfo~vi~§W /
0
d\~1~ WV ~II -----
Ill 0 0 c: :::1 -Q. ~
0 0 Ill :::1 ::r Q.
oQ
0 < CD \~
~ CD
; < CD
-LOWER RIVER ROAD
-SYLVANIA ROAD
~ I L§
ELEVA T I 0 N, IN FEET, A B 0 V E MEAN SEA LEVEL (1912 ADJUSTED)
* ~ * ~ ~ ~ I I I ,...._,~-=- I "":l
Ill 0
\
G'l
g ~-Q. ~
0 :::1 Q.
-KNOB CREEK
OHIO RIVER
- CAMP GROUNO ROAO
-CANE RUN ROAD
L-----------------~~=-~~
E L E VAT I 0 N, IN F E E T, A B 0 V E MEAN SEA LEVEL (1912 ADJUSTED) ~ ~ ~ ~ ~ ~ 0 0 0 0 0 0
~--~----~----~r-~----~~
Ill 0 0 c: :::1 -Q. :E
0 0 "' ::s ::r Q. ~
oQ ... 0 < CD
----OHIO RIVER
CANE RUN
ROAO
OIXIE -HIGHWAY
ST. L---------------~------~'----~
t.,)
O"l
~ ~ tr-:1 ::0 ::0 tr-:1 (f.)
0 c::: ::0 (') tr-:1 (f.)
0 ~
~ II: tr-:1
l' 0 c::: til < ? l' tr-:1 :.;.. ::0 tr-:1 :X:.

I SCALE
I I 0 1 L... •• ~'-'--~ l ···- _ _j_ __________ _3 MILES
I ELEVATIONS IN FE~~VE MEAN SEA LEVEL ( 1912 ADJ.)
[ CONTOUR INTERVAL FIVE FEET
I ARROWS INDICATE DIRECTION OF GROUND-WATER MOVEMENT
GROUND WATER 27
----,--·z·· - j /. ~o,~':-··· :
··c;\..ll' •• • ·.-'i!· ••
Figure 22.-Map of alluvium in Louisville area showing water-level contours in December 1952.

28 WATER RESOURCES OF THE LOUISVILLE AREA
The alluvium in the Ohio River valley is a good water producing formation (pl. 1). The space between the sand and gravel particles (about 20 percent by volume) provides a very large storage. The arrangement and interconnection of spaces is such that water can move through the material. Normal movement is about 2 feet per day under a gradient of 5 feet per mile. Intake of water from precipitation at the surface 1s restricted by the clay blanket. Normal recharge from this ·source is about 6 inches of water or about 12 to 15 percent of the annual precipitation. In two places, the downtown area of Louisville and the Rubbertown area, ground-water levels are below river level. In these areas, Ohio River water infiltrates through the river bed and travels toward the areas of pumping.
For many years, water from the sands and gravels has been used by industries requiring water for cooling. In 1937, the Ohio River flood inundated a large portion of the flood plain. (See fig. 13.) The entire valley area became saturated nearly to the surface. After the flood, ground water drained slowly to the river. In 1939, it became evident that the increasing demands of industry and air-conditioning was causing a decline in water levels. Large increases in groundwater use were necessary in 1941 and 1942 because of expansion of industry in connection with war production. In 1943, a critical ground-water shortage def.'eloped, and pumpage in industrial areas now exceeded natural recharge by 20 mgd. Conservation measures, including artificial recharge of city water (river source), reuse of water. use of city water in place of grouna water, use of cooling towers, and changes in plant equipment, brought about material reductions in pumpage in 1944 and 1945. In 1946, and in all years since that time, pumpage has been in close balance with natural recharge.
Individual wells commonly yield 200 to 500 gpm in areas indicated on plate 1. Smaller yields may be expected in areas where the saturated thickness is limited by higher elevation of the bedrock.
Recharge and Ground-Water Movement
Recharge to the sand and gravel deposits comes from the following sources: (1) infiltration of water from the Ohio River through its bed and banks, (2) flow from the consolidated rocks along the walls of the valley and upward from the bedrocks, (3) rainfall penetrating the flood plains, and (4) artificial recharge. Figure 22 shows contours (lines of equal elevation) of water level in December 1952, and arrows show the direction of ground-water flow.
The arrows indicate two areas where river water is flowing to the sand and gravel - in the downtown area of Louisville, and in the Rubbertown area. Proof of infiltration of river water has been established by records of temperature and quality, as well as by hydraulic evidence obtained in pumping tests.
Infiltration from the river to the heavily pumped areas varies directly as the difference in river level and ground-water level. During floods, this difference is increased, and the amount of recharge is increased. Major floods submerge parts of the flood plain, and additional recharge by vertical percolation of flood water occurs. In unpumped areas, where the
water level normally is above river level, temporary recharge may occur during floods; that is, when the river level rises above the ground-water level. then the river water will flow into the aquifer. As soon as the river level falls below ground-water level, the flow reverses its direction, and the infiltrated water returns to the river.
Recharge from the river into the alluvium does not occur in the reach from the dam to Bells Lane. Along the northern part of this reach, the bedrock is higher than river elevation (normal river elevation is 383 feet above mean sea level); therefore,the river is not in contact with the aquifer. Along the western part of Louisville, flow of water is restricted by a clay deposit on the river bed and bank.
Northeast of Louisville and south of the'"Rubbertown" area, recharge at the present time is from rainfall and from water entering the sand and gravel from the uplands through the valley walls. Flow is toward the river, and water is lost to the river through its banks and upward through its bed.
Recharge to the sand and gravel from the consolidated rocks occurs by lateral flow from the upland areas. Because the uplands are recharged by varying amounts of rainfall, recharge from the consolidated rocks varies from year to year. Southwest of Lollisville, the recharge through the valley wall has been estimated at about 100,000 gpd per mile of valley wall, and northeast of the city, recharge has been estimated at about 200. 000 gpd per mile of valley wall. Between Beargrass Creek and Shively, the valley wall iS, limestorte, which undoubtedly carries more water than the valley wall to the north or south.
Recharge from rainfall on the flood plain in rural areas has been estimated at about 200, 000 gpd per square mile. Most of this recharge occurs during the nongrowing season. During the growing season. heavy rains do not infiltrate to the wat~~r table because requirements of soil moisture, evaporation, and transpiration leave little or no water available for additions to ground water. In the urban areas, recharge from rainfall is probably less than in the rural areas because water is drained to sewers from buildings and paved streets. On the other hand, in the older parts of LouisviLle, some recharge is probably occurring through normal leakage from the city water system and from leaks in sewers.
Artificial recharge has been practiced in the heavily pumped area of Louisville for several years. During and after the war, city water was stored in the ground during the winterto supply cold water for summer use. After a sewer-rental law (based on water use) was passed in 1947, an increased interest was shown in ground-water recharge as a means of disposal of used warm water. Figure 23 summarizes total artificial recharge in Louisville from 1944 to 1952.
Fluctuations of Water Levels
Water levels indicate the change in the amount of underground water in storage. They fall when water is withdrawn by pumping and when water discharges to the river; they rise when natural or artificial recharge occurs. A discussion of water level fluctuations in five

GROUND WATER 29
>-<X 0 a: ~ ·CL.
fl) z 9
1.8
1.6
1.4
~ 1.2r---------~----------~----------+---------~~~~~~f¥~~~~~~~~~77~~~77~~~77~~77~~ (!)
II. 0
fl) l~r----------r----------~--------~~~~~~~~~~~~~~~~~~~~~~~~~~~~~~7777~~ z 0 ::; _, i ! l&t (!) a: 4 X 0 ~ a: _, 4 0 G: j:
~ .2~~~~~~~~~~~~~~~~77777?7?~????~~~~~~~~~~7.777.7t777.777777Y~~~00~
::::::::9!!! . ............. ............. 0 ....................... ..
1944 1945 1946 1947 1948 1949 1950 1951 1952
Figure 23. -Artificial recharge in the Louisville area, 1944-52
areas, downtown Louisville, West Central area, Rubbertown area, Distillery area, and Jeffersonville area follows. (See fig. 39.)
Downtown area of Louisville. -Pumpage during the period 1938-1949 averaged about 12 mgd and ranged between about 9 mgd in the winter to about 14 mgd in the summer. During this period, pumpage from new wells approximately balanced reduced pumpage when old wells were abandoned. After the sewer tax went into effect, some of the air conditioning systems were converted to types using less ground water. The hydro graphs for wells, at Fifth and Jefferson Streets and at Fourth and Guthrie Streets, show an annual cycle related to pumping for air conditioning (fig. 24). As water levels were lowered below river level, river water infiltrated to the aquifer. As the distance below river level increased, infiltration increased, and the rate of decline became less. In 1945, and also in 1948, major floods caused additional infiltration of river water, which is reflected as rises in water level. Reduced pumpage toward the end of the period was sufficient to bring recharge and pumpage into balance, as shown by the fact that water levels have not lowered significantly since 1948. The graph for a we 11 near the river (43-15-1) reflects river floods and also the general downward trend due to pumping. In 1947, when the river level was constant, the effect of recharge by precipitation is evident.
West-central area. --Graphs of pumpage, precipitation, and water level for the area between lOth and 30th Streets and north of Algonquin Parkway are shown on figure 25. This area is unfavorably situated in relation to natural r~~barge. A bedrock barrier to the
north and a clay deposit to t.1e we_st prevent recharge from the river. Heavy pumping in the downtown area to the east, distillery area to the south, aod Rubbertown area to the southwest affect the water levels in this area. The reduction of pumpage is the principal item responsible for the recovery in water levels since 1948. Water levels in the Rubbertowri area have also affected the water levels in the west-center area. From 1945 to 1948, water levels,in northern Rubbertown area rose about 25 feet; during this time, water from the west-central area was seeping to the Rubbertown area. By 1948, water levels were higher here than in the west-central area, and the direction of flow was reversed. Since reactivation of the rubber plants in 1949, the Rubbertown area water levels have been dec lining, and the flow direction has again reversed; it is expected that a further lowering of water levels will be reflected in the future by a downward trend in the west-central area.
"Rubbertown" area. -The hydrograph for well 49-10-1, south of the heavily pumped area and away from the river, shows effects of rainfall recharging the aquifer (fig. 26). Note the large gain in storage during 1950, the wettest year of record. The hydrograph of a well near the river (53-10-1) shows infiltration of river water during floods, and it shows a return of water to the river after floods.
Hydrographs of wells on Bells Lane, northern Rubbertown area, (49-13-22 and 49-13-24) show a direct correlation with pumpage. The excessive pumpage of 1943 and 1944 caused a decline of about 35 feet, and the 1945 flood accounted for sufficient river recharge to cause a rise in water levels of about 10 feet.

~
440
w 0
t=" 435 ffi
::E li;
430 3 ~ oct >-3
"' ttl 425 ~ ::tl
:; ::tl IIJ ttl
420 i!:; ~ ...I c::: cr ::tl
415 ~ Q Ul
z 0 410 ~ l:!:j
:::IE >-3 IIJ ::r:
405 > ttl 0 t"' IP 0 cr c:::
40o::; En IIJ < LL. -t"'
395 z t"' - tr! £ ~
I I 1---- I I I \11 \J I \'11 \\ 1f \'\~\j )1\\ ~y\ ~~\~
390
~ ~ -i I -+- ., cr , "''' , ~' ' 011 "~ 7 385 ~ -+----r------1------ I • I I • I I \I I \ I I \ I I I \ J I '• J I \ I 1380
_ _ I 1.1 lJI. • I~ ______ __J -- --1---1--t - II ~ I • I ._ • 1• ol _ •I L _. • - I 1111: 1.. 1 I U I r • • • •II • :lol I 37~
Figure 24.-Precipitation, river level, and water-table elevation in downtown Louisville, 1937-52.
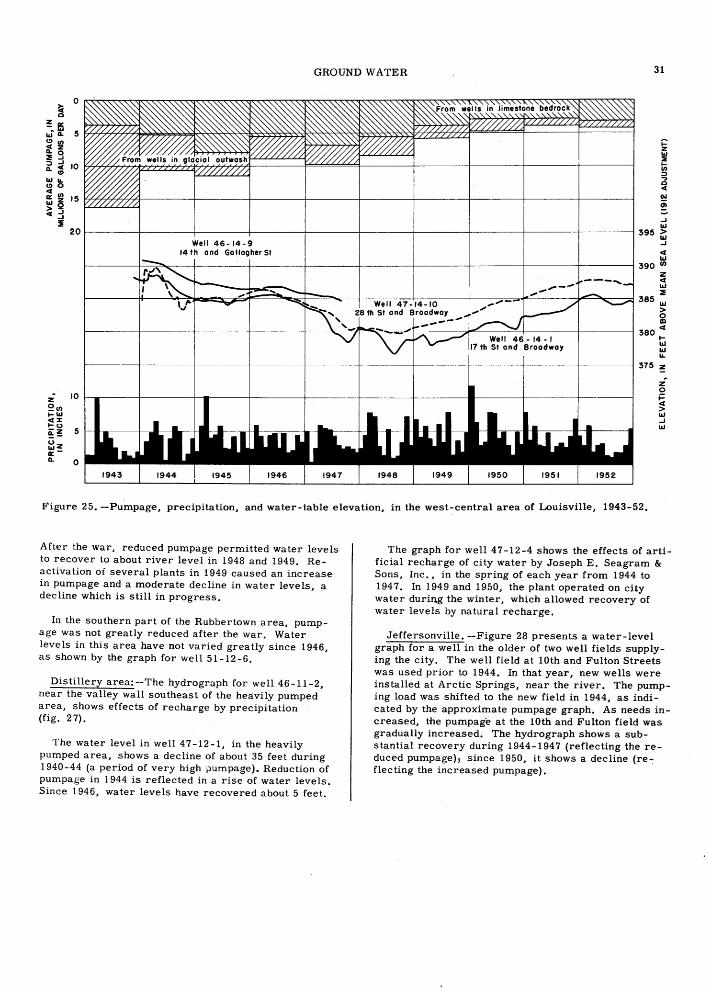
GROUND WATER 31
....1 11.1
20~-------+--------+--------4--------~--------~-------t--------t--------i--------1--------j395 ~ Well 46-14-9
14th and GollogherSt ....1 <( 11.1
~------~~~~~------~~-------4--------+--------t--------r-------i--------i--------1390 ° z <( 11.1 ~
385 11.1
> 0 ID
~------~------~--------4--------+---_)~~~~~~~~--~~~~~~j-~~---t---~---~ 380 <( 1-11.1 11.1 IL.
~------~--------+--------+--------~-------~---------r--------~-------t--------t-------~ 375 ~
z ~en 1-11.1 <(% t-o
~~ t::z o::-a.
10
5
0
z 0 i= <( > 11.1 ....1 11.1
Figure 25. -Pumpage, precipitation, and water-table elevation, in the west~central area of Louisville, 1943-52.
After the war, reduced pumpage permitted water levels to recover to about river level in 1948 and 1949. Reactivation oi several plants in 1949 caused an increase in pumpage and a moderate decline in water levels, a decline which is still in progress.
In the southern part of the Rubbertown area, pumpage was not greatly reduced after the war. Water I eve ls in this area have not varied greatly since 1946, as shown by the graph for well 51-12-6.
Distillery area: --The hydrograph for well 46-11-2, near the valley wall southeast of the heavily pumped area, shows effects of recharge by precipitation (fig. 27).
The water level in well 47-12-1, in the heavily pumped area, shows a decline of about 35 feet during 1940-44 (a period of very high pumpage). Reduction of pumpage in 1944 is reflected in a rise of water levels. Since 1946, water levels have recovered about 5 feet.
The graph for well 47-12-4 shows the effects of artificial recharge of city water by Joseph E. Seagram & Sons, Inc. , in the spring of each year from 1944 to 1947. In 1949 and 1950, the plant operated on city water during the winter, which allowed recovery of water levels by natural recharge.
Jeffersonville. --Figure 28 presents a water-level graph for a well in the older of two well fields supplying the city. The well field at lOth and Fulton Streets was used prior to 1944. In that year, new wells were installed at Arctic Springs, near the river. The pumping load was shifted to the new field in 1944, as indicated by the approximate pumpage graph. As needs increased, the pumpage at the lOth and Fulton field was gradually increased. The hydrograph shows a substantial recovery during 1944-1947 (reflecting the reduced pumpage) 1 since 1950, it shows a decline (re-: fleeting the increased pumpage).

32
(/) z 0 ::::;
~~ 0
~a:: -UJ
UJQ. (!)(/)
~~ ~::J ~~ ~LL. a::O UJ
~
z" Q(/) ~UJ t-:Z: §;~ uu.lz a::Q.
WATER RESOURCES OF THE LOUISVILLE AREA
450
445
440
435 ~ UJ
~ 430 !B ..,
0 <(
t\1 425 ~
..1
420~ ILl ..1
415~ (/)
z 410<(
ILl :!
405~ 0 a:a <(
400t-ILl ILl u.
395 2
Figure 26.-Pumpage, precipitation, river level, and water-table elevation in the "Rubbertown" area, 1941-52.

I I I ~ffi?LAVm0~hffff?V#~;ff7'7f"'&///f///J'1 I I I I I I I ~4:35
II I I I I " I if\ I I I I I I I I 1415 ~
I I I I I I \ I I I ~ I ~~ I 1410
> w ..I
4 w (J)
z 4 w 2 I I I I I Dixie H\ghwoy at Rj'ph Ave.~~ I ~~ / }-\: __ ~-"JA; YA =r A 1 Al40o ~ ID c:(
..,: w w "-; ZA
2 ~ 4 >
zol I I I I I I I I ' II Y 1:1 I I I I I ----1 380 ~ Well 47-12-4
,I I I I I I I I I 4J 1 -T -- ---- ~--- I I 375
I I I I I I
Figure 27.-Pumpage, precipitation, and water-table elevation in the Distillery area of Louisville, 1937-52.
0 ~ 0 c: z ~
~ >-1 l:lj ~
w w

34 WATER RESOURCES OF THE LOUISVILLE AREA
3.0L-______ _L ________ L_ ______ _L ________ L_ ______ -L--------~------~--------~------~------~
ILl 20 (.)
ii! 0::
~ 22 0 z <(
l A (\ I\! 1\ J )
1 n
fl A n
v \ r \A ~'\ A ..J 24 3= 9
Well I 3 lOth and Fulton Sts j V" V IV J v ~1,1 \ N ILl
II)
1- 26 ILl ILl lL
~ 28
..J ILl > ILl ..J 30 0: ILl
~ ~ 32
34
1\ 1943
(\ VJ
'\
_)
J 1944 1945
1/ N vvv \.
f\..11
\A v
1946 1947 1948 1949 1950 1951 1952
Figure 28. -Pumpage and water-table elevation at Jeffersonville public supply. 1943-52.
Quality of Ground Water
The glacial outwash deposits that underlie the river valley furnish nearly all the large ground-water supplies i.n the area; usually, only small supplies, insuf-. ficient for industrial use, are found in the outlying areas. For this reason, this report is limited to the quality of water in the glacial-outwash deposits and to water in the underlying limestones.
Chemical analyses of water from many wells in the glacial-outwash region have been made annually since 1944 by the U.S. Geological Survey. Locations of these wells are shown on plate 2. The water. is generally of the calcium bicarbonate type with varying amounts of sulfate. The hardness of the water ranges from moderate to extremely hard. ·
Water from the limestones. --The limestones that compose part of the bedrock in this region have undergone extensive solutional development where they underlie the river valley. Most W~ells drilled into the limestone have yielded water that is more highly mineralized than that from the glacial outwash, and some of these wells have been abandoned. Selected analyses of water from limestone wells in use are shown in table 4 and presented graphically in figure 29. It is probable that the water pumped from the few rock wells of better quality is coming directly from the
GLACIAL OUTWASH Stitzel- Weller Distillery
Ralph Avenue 400 f---..:__ ____ _
1200
GLACIAL OUTWASH Louisville Gas and Electric Co.
Bell's Lane
~ 1000
GLACIAL OUTWASH J. V. Pilcher Co. East Gray Street
LIMESTONE BEDROCK Brown - Forman Distillery
19th and Howard Streets
...1
...1 sa ~
"' 0.. <I)
E-o ~ ..: 0..
800
600
400
200
Figure 29. --Chemical character of selected ground waters of the Louisville area.

Well Designation Source Date
(Plate 2) (1952)
Wells in glacial outwash
A Louisville Gas & Electric Company Dec. 18 B Louisville Gas & Electric Company (No. 2) Dec,11 c Stitzel Weller Distillery, Inc. Dec. 12 D J. V. Pilcher Manufacturing Company Dec, 18 E Louisville Refining Company Dec. 12 F Kaufman Brothers Dec. 10 G Stoll Oil Refining Company Dec. 18 H Indiana Gas & Water Company (Arctic Springs) Aug. 4 I Roberts & Strack Venner Company Aug. 5 J Barth Leather Company Aug. 5 K Jeffersonville Boat & Machine Works July 23 L Indiana Gas & Water Company (lOth & Fulton) July 21 M Oscar Ewing Dairy Aug. 15 N Oertel Brewing Company, Inc. Aug. 15
Wells in limestone
p Brown-Forman Distillers Corp. Dec. 11 (Early Times Plant)
Q Brown-Forman Distillers Corp. Dec. 17 (Old Forester Plant)
R Tube Turns Aug. 14 s Fall City Brewing Company Aug. 12 T Schott Dairy Company Aug. 12
a Total in solution and in sediment.
Table 4. -chemical quality of water from selected wells in the Louisville area.
[Chemical results in parts per million]
Potas~ Manga- Cal- Mag- So- Bicar- Sul- Chlo-Silica Iron nese cium nesium dium slum bonate fate ride (SiC)z) (Fe) '(Mn) (Ca) (Mg) (Na) (K) (HCO,) (SO.&) (Cl)
16 0.44 o. 73 134 27 11 1.1 388 135 12 13 .. 16 ,00 58 14 11 1.9 164 59 19 18 1.3 1. 0 138 28 6.1 2. 2 368 159 10 18 • 23 • 00 208 41 62 10 448 275 76 15 7.2 1.4 148 36 21 2.5 484 118 27 15 .19 .00 80 23 8.2 2.0 322 33 6.0 12 .49 .48 46 8. 7 14 2.1 122 60 20 14 .43 .00 68 21 13 2.4 256 45 19 19 ,08 .00 64 22 5.4 .8 228 47 11 23 .27 .41 156 47 63 3.2 455 209 83 16 .11 .00 130 50 36 4.1 492 151 31 22 .20 1.1 122 46 27 2.4 449 147 24 -- .98 -- -- -- -- -- 586 276 70 -- .08 -- -- -- -- -- 405 76 39
23 .29 1.1 156 39 13 2.0 420 213 12
18 5.6 2.3 264 79 28 3.6 534 531 30
-- 6.0 -- -- -- -- -- 605 407 45 -- a18 -- -- -- -- -- 567 462 73 -- 6. 0 -- -- -- -- -- 354 2.9 198
'----
Fluo- Ni- Dis-ride trate solved (F) {NO,) solids
0,1 o. 0 532 .2 .o 254 .o • 0 547 .2 74 990 .o .o 614 ,2 17 326 .2 .o 220 .2 2.3 319 .2 22 296 .1 23 857 .o 24 683 .1 4.3 642 • 0 10 --.o 10 --
.4 . 0 674
.1 .o 1,264
.1 .1 --
.o .1 --
.4 .2 --
Hardness as CaCO, Specific
conduct-Non- ance
Ca, Mg carbon- (micromhos ate at 25"C.)
448 127 798 200 68 434 460 158 800 690 326 1,420 520 121 931 296 30 550 150 51 372 256 46 544 250 63 507 585 210 1,300 528 127 1,090 495 126 983 720 -- 1,490 382 -- 874
550 205 951
985 546 1,570
895 -- 1,580 860 -- 1,720 206 -- 1,130
pH
7. 6 7.6 7. 7 7,6 7.6 7. 7 7.9 7.3 7.5 7.0 7.1 6,9 ----
6.9
7. 5
------
Color
1 0 1 1 1 1 4 3 2 5 3 2 ----
1
1
------
0 !;lJ 0 c:::: ~ t:J :E :;t> ., I::J:j !;lJ
w C11

36 WATER RESOURCES OF THE LOUISVILLE AREA
SCAI.E
I 0 I I! MiLES ~~~------ -----'-----·--'
EXPLANATION
D Shale bedrock
~ Limestone bedrock
Character of bedrock not shown for area southeast of boundary of glacial outwash
\.~EXPLANATION BEDROCK DRIFT HARON ESS (Co, Mg) . WELL WELL 01 CaC05
(Porte per million)
D 0 15 ~. 200
~ ~ 201 ·350
[] () 351 ·500
~ a 501 ·6M
• • 651 +
Figure 30.-Map of the Louisville area showing hardness of ground waters, 1952.

GROUND WATER 37
giacial outwash. Averagehardness of water from 15 limestone wells, sampled annually since 1944, is 580 ppm.
Water from the sand and gravel. --The quality of the water in the sand and gravel (glacial outwash) varies over the area, and in any particular area it may change appreciably with time. The water is generally very hard, high in bicarbonate, and contains dissolved solids ranging from 250 to more than 1, 000 ppm. In 1952, the median hardness of water from wells in sand and gravel was 475 ppm. Sulfate ranged between 28 and 869 ppm. Chemical data for the waters frol;ll representative wells of the area are given in table 4. Figure 29 illustrates the chemical character of the water found in the glacial outwash.
There appears to be a correlation between the type of bedrock and the quality of the water in the sands and gravels above it. Shales overlie the limestones in part of the area, and because the shales are nearly impervious, they impede transmission of water to, or from, the underlying limestone. Thus, in areas of shale bedrock, the outwash receives very little water from below, but in areas of limestone bedrock the harder, highly mineralized water is discharged upward. For this reason, water in outwash over the limestone isharder, and it contains larger amounts of dissolved solids than water in outwash overlying shale bedrock. This fact is pointed out in figure 30. The wells in sand and gravel that were sampled in 1952 had a median hardness of 642 ppm over the limestone bedrock and 470 ppm over the shales (omitting analyses of water from wells known to be pumping appreciable quantities of infiltrated river water).
Effects of river water infiltration. --In general, wells along the Ohio River show less hardness and dissolved mineral matter than those in the remainder of the area, thus reflecting the effect of river floods forcing water into the aquifer and of induced recharge caused by the lowering of ground-water levels by heavy pumpage. In 1952, the Ohio River had an average hardness of 146 ppm and a dissolved solids content considerably less than that of the ground water. Normally, the dilution effects of river-water infiltration diminishes rapidly as the distance from the river increases. The effect is noticeable only 400 to 500 feet froin the river, except where water backs up tributary streams during floods. However, its effect is more pronounced in the areas between the river and the "Rubbertown" area and downtown area. Heavy pumping has lowered the water table, and the steep gradient in these areas induces the inflow of large quantities of river water. Wells in these sections draw a large proportion of their water from the river, and the pumped water approaches the average qualityof that from the river .. Examples can be seen in figure 30.
Variations in quality. --There are many variables in determining the quality of ground water in the area. The entire region was saturated with river water during the flood of 1937. This recent saturation, pumping variations with corresponding water-level fluctuations, induced river-water infiltration, recharge of city water, sewer-and water-line leakage, and other factors, are the cause of many of the local fluctuations. A comparatively large amount of ground-water data is
available for the Louisville area, but because of the many variables, a clear explanation of the fluctuations in quality at many pLaces cannot be made.
Over a short period of time, water from most of the wells shows considerable change in quality. The median of the hardness of 21 wells is shown on figure 31. A general increase in hardness through 1948 is evident, since that time, the trend has been toward a softer and correspondingly less mineralized water.
Wells in the extreme northeastern and southwestern parts of the glacial-outwash areas have small fluctuations in quality. However, the four principal areas of pumping (fig. 39) have much greater fluctuations in quality. The marked lowering of the water table in the downtown area (fig. 24) has induced increasing amouRts of river water into the aquifer. Wells farther from the river are being affected; an example of this is the well at the Seelbach Hotel (fig. 31). This well produced a very hard water from 1944 through 1947, averaging 707 ppm of hardness. However, after 1947, the well began pumping increasing amounts of softer river water, and the hardness fell steadily until, in 1952, the hardness was 228 ppm. Proceeding from the river toward the eastern border of the glacial-outwash deposits, the water becomes progressively harder and higher in mineral content, except in the northeast and southwest sections. Wells along the outwash boundry, ~uch as that at the J. V. Filcher Manufacturing Co., have remained relatively stable in quality (fig. 31).
Most of the water from the wells sampled in the westcentral industrial area is drawn from the limestone bedrock. The water levels in this area have also declined appreciably, and the water has become increasingly harder as more water is taken from the bedrock. The well at the Brown-Forman Distillers Corp., shown in figure 31, is representative of many of the rock wells in this area. It shows the marked upward trend in hardness, with somewhat of a leveling effect in the past few years. The water pumped from the glacial outwash in this area ranged between 615 and 1, 360 ppm of hardness. This extreme hardness probably is caused by the mineralized water entering the outwash from the limestone.
The average hardness of several wells in outwash in the distillery area is shown in figure 31. The reasons for the fluctuations are not clear, but pumpage seems to have an indirect relationship to hardness. It is possible that when heavier pumping lowers the water levels, softer water overlying the adjoining shale bedrock areas flows into the distillery area.
The Rubbertown area shows the effects of induced infiltration from the Ohio River. The wells along the river yield water similar to that found in the river, whereas quality of water from wells away from the river varies with the pumpage. As the pumpage increases, more river water is induced into the area, and the quality becomes progressively better. However, some time lag in the correlation of the infiltration and pumpage has been noted. The average of several wells (fig. 31) shows a general increase in hardness through 1950 and a trend toward softer W'lter thereafter. This corresponds with the pumpage in the Rubbertown area, which generally decreased from 1944 through 1949 and increased steadily thereafter (fig. 26).

38 WATER RESOURCES OF THE LOUISVILLE AREA
Temperature of Ground Water
The temperature of ground water has been measured monthly since 1944 in 17 wells, ,and it has been measured several times annually in about 130 wells. Measurements were taken at 5 -foot intervals of depth in each well by means of an electrical-resistance thermometer. The averages of the readings are reported.
Average ground-water temperature in the area is about 58° F. In areas away from the river, the annual temperature change is only a few degrees above or below the average (fig. 32). Along the river north of Louisville the range is 52° F to 66° F, the lowest temperature being recorded in summer and the highest in winter. River water entering the aquifer has a seasonal range of about 32° to 85° F. Because of the heat exchange with the sand and gravel under the river bed, the range is greatly reduced by the time the water reaches the we Us. An elapsed time of 6 to 8 months is required for the high and low temperatures of the river to be reflected in these particular wells,
In the Rubbertown area, the temperature range of ·well water is 47° to 64° F. The fact that the temperature range is wider than that north of the city and that the average temperature is below the average for the Louisville area, is explained by seasonal variation in river stage and regulation at the navigation dam. Above the dam, a constant pool elevation is maintained, except during floods exceeding the capacity of the movable dam. Below the dam, the stage fluctuates with moderate floods and through a greater range. The range from pool level to maximum flood is 41 feet in the upper pool and 78 feet in the lower pool. Because floods normally occur in winter and spring, a large amount of recharge from the river occurs in the Rubbertown area during periods of low temperature.
z g ~
900
d 800 ~ 0:: fil
__ , /r-- --~ ·-· .......
In the summer, when river level is low and temperature is high, the amount of recharge is smaller. Just north of the Rubbertown area, the small range of temperature indicates that the hydraulic connection between the river and the aquifer is poor. ·
An example of the temperature of infiltrated water is given in figure 33. These thermographs are from records at a Ranney collector on the river's edge at :Sells Lane in the Rubbertown area. The installation is a concrete caisson resting on bedrock and equipped with horizontal screens extending radially in all directions. Water entering the unit through various laterals has temperature characteristics reflecting the seasonal changes in river temperature but having substantial differences in temperature range and time lag.
PUBLIC WATER SUPPLIES
The area is served by four public water systems, two using Ohio River water and two using ground water. These systems are described briefly below:
City of Louisville
The Louisville Water Company is incorporated as a private company, but all stock is owned by the city of Louisville. This company serves the area within the Louisville city limits, and in addition, it sells to individuals, cities, and water districts outside the city limits. Principal outside communities being served are: Anchorage, Audubon Park, Buechel, Fern Creek, Jeffersontown, Middletown, Okolona, St. Matthews, and Shively.
Water is obtained from the Ohio Rl.ver at a pumping plant at Zorn Avenue northeast of the city. The raw
p·still~~ __ . .---·--·--a,!\ ,;_.-.-
"f o-rrD-_. ::..-·
13_!-'!r-=----/
./··
' ~ ,/ -~ ......... //' I ,/ J. V. Pilcher M
"' ~·/ .~ ......... -~ r----==: anufacturing Co
~ 700 (/).
E-< ~ <r: 600 ~
z >-i
en 0 500 u
C1! u ~ 400 rn rn. r.il ~· 300 0:: <r: ::r:
200
100
.. '\ ~
~ ---. . ... .. ..
1944
.~ --"-·'l --- " -~~~OF Al,.L WELLS SAMPLED- ...__ ---- ....
.... _ ~ ...... -MED · :J- '~ .... ~ .. -
_,-- 1_-re~--- ~~ ... ~-
k:' sti\\~-- !\ -o.-re?". • • • • • • • • • ... ·~ .... ~ D;....~ erto'f •• ••• "-- ........ ~ •• •••••• • • • '£tU~~·• • •' --- SeeJb ' .. ·······
..f!!:cl:J ~1·
.........
"' ~
1945 19·'!6 1947 1948 1949 1950 1951 1952
Figure 31. -Trends in hardness of ground-water in the Louisville area.

SCALE
-~~ Sampled well, Upper number
shows maximum temperature, lower number shows minimum tempe roture
PUBLIC WATER SUPPLIES
Figure 32. -Map of the Louisville area showing maximum and minimum temperatures of ground water, 1945-52.
39

40 WATER RESOURCES OF THE LOUISVILLE AREA
90r--------.--------r--------.--------r--------.--------.--------,--------.-~--~~--------.--------,
1945 1946 1947 1948
Figure 33. -Temperature characteristics of infiltrated river water (data from Ranney collector at Bells Lane).
water is pumped about 2 miles to the Crescent Hill filtration plant on Frankfort Avenue.
Treatment consists of sedimentation, prechlorination, coagulation with alum (sometimes with sodium aluminate), softening with lime and soda ash, clarification, recarbonation, rapid sand filtration, postchlorination, fluoridation (with sodium silicofluoride), ammoniation, and adjustment of pH (when not softening)with lime. When necessary, activated carbon and chlorine dioxide are used for taste and odor control.
The rated capacity of the plant is 80 mgd (limited by sof~ening plant); filtration capacity, when not softening, is 120 mgd. Steps to increase the plant capacity are now under way. Storage includes 131 million gallons of raw water and 57.8 million gallons of finished water.
Average consumption in 1952 was 67.9 mgd or about 150 gpd per capita for an estimated population served of 450,000. The maximum daily pumpage in 1951 was 90. 9 million gallons.
The finished water is of good chemical quality. Hardness is moderate, averaging 106 ppm in 1952, because the water is softened during periods of excessive hardness of the river water. The total solids averaged 249 ppm (237 determinations). The bicarbonate of the river water is low; it averaged 31 ppm in 1952. The principal constituent is calcium sulfate. The quality of the Louisville public supply is illustrated in figure 34.
New Albany, Indiana
The New Albany water system is owned and operated by the Indiana Gas and Water Company. It serves the city of New Albany and parts of Clarksville.
Water is pumped from the Ohio River at Ninth and Floyd Streets to the treatment plant at Silver Hills.
Treatment consists of sedimentation; slow sand filtration; and alum, soda-ash, and chlorine treatment. In summer, temporary treatment includes copper sulfate and carbon, or of carbon only.
The plant has a rated capacity of 4 mgd. Storage includes 22 million gallons of raw water and 1. 5 million gallons of finished water.
Average consumption in 1952 was 3. 5 mgd. Estimated population se.rved was 30, 000.
Jeffersonville, Indiana
The Jeffersonville system is owned and operated by the Indiana Gas and Water Company. It serves the city of Jeffersonville, part of Clarksville, and Lincoln' Heights.
z g ....l ....l SE
MAXIMUM
~
~ 300~--------------------------------p..
Cf.l E-<
~ p.. 20(1~--------------------------------
til 0 0 OJ ! u Q ~ ~ ~ s Q) Q) Q) s -~ o; -:;; "' ·~ <: <: ·;:: Q) 0 0 0
01 <: .0 .0 :a bJl k ; u CIS u ;s .~ u
rf1
0 .., u ::! a! u '0 ., Cf.l a!
3 ., "' 0 Q)
E-< <:
"' t- k
"' a!
"' :r::
Figure 34. -Maximum and average of several constituents of the Louisville public water supply, 1952.

. PRESENT USE OF WATER 41
~ a:: w a.. 1/)
z 0 .J .J Cl (!)
IL 0
1/)
z 2 .J .J
i
PUBLIC SUPPLY SOURCE TYPE OF USE
Figure 35. -Source and use of water from public supplies in Louisville area, 1952.
The supply is obtained from two well fields. The older field, at lOth and Fulton Streets, consists of 37 wells. The second field of two wells is located at Artie Springs, near the Ohio River. The only treatment is chlorination. Plant capacity is about 3 mgd; storage is 0. 5 million gallons. Average consumption in 1952 was 2. 4 mgd. Estimated population served was 20,000.
An analysi~ for water from each well field is given in table 4 (items H and L). Hardness of 256 ppm at Artie Springs probably reflects infiltration of river water. The hardness at the lOth and Fulton Streets well field was 495 ppm.
Louisville Extension Water District
The Louisville Extension Water District is a water district serving the area in Jefferson County between Dixie Highway and the Ohio River and from Louisville and Shively city limits southward to Kosmosdale. This district also furnished water to the Auburndale Water District lying south of Louisville and east of Dixie Highway.
Water is obtained from two wells in glacial-outwash material located near Bethany Lane and Lower River Road. The only treatment is chlorination. An analysis of this water in August 1952 showed a hardness of 243 ppm and dissolved solids of 262 ppm. The rated capacity is about 2 mgd. Raw storage is 0. 2 million gallons and storage of finished water is 1 million gallons. Average consumption in 1952 was 0. 4 mgd.
PRESENT USE OF WATER
Public Supplies
During 1952, public water-supply systems iri the Louisville metropolitan area used 74, 2 mgd, of which 71.4 mgd was from the Ohio River and 2. 8 mgd was from wells. Figure 35 shows the use by public supplies classified as to ownership, source of water, and type of use._
Pumpage from the Ohio Ri~er by the Louisville Water Co. for the period ~860-1952 is shown on figure 36, The following data is also given: the maximum amount daily delivered to the mains for domestic, commercial, and industrial use; leakage and losses; and use by the company in back-washing filters and operation of hydraulic pumps. Industrial and commercial use prior to 1948 was estimated; after 1948, records were computed by electric card-punch machines, and therefore they are much more accurate.
Records of yearly pumpage of ground water by the Indiana Gas and Water Co. (supplying the Jefferson-

42
><t 0
90 1--------+--
ffi 80 1-----+---Q..
CJ)
z g 70 1-----+----
....J <t C>
~ 60 ....I ....I
~ 50 .___---+-z UJ (!)
WATER RESOURCES OF THE LOUISVILLE AREA
EXPLANATION
• Leakage and unaccounted for
• Industrial
Commercial
Domestic
Maxi mum daily pumpage to mains
Average daily umpoge to moi n
~40~--4----+----~---~----4-----+--r--ar---~~~~~ ~ ::> Q..
~30~----~-----4------~-----4------+---+~------+-----~~~~~
<3: 0
~20~----~----+-----~----~--~-+-----+-----4------~~~~
0 1860 1870 1880 1890 1900 1910 1920 1930 1940 1950
Figure 36. -Pumpaga from the Ohio River by Louisville Water Co., 186Q-1952.

PRESENT USE OF WATER 43
>c 0
~2 (It z 31.5~-r--r--r--+--+--+--+==~~T.T,~~T.T,~~~~~
ci t!)
~1.0~~~~~~~47~~~~~~~~~7+~V77Y~ :::i ..J
i ~Q.II\t:h~~~~;..w:J-'h'J::vu• .. v"n:r D~;811.;r:~:~~~~~~ aJ t!) <( ~ 2 ::> ~
Figure 37. -Ground-water pumpage for municipal use, 1938-52.
ville system) and by the Louisville Extension Water District are shown on figure 37.
Private Industrial Use
Surface water. --Large quantities of raw water from the Ohio River are used for cooling by several chemi-
cal plants and by the Louisville Gas and Electric Co. Table 5 shows that the amount thus used ranged from 356.9 mgd in 1946 to 659. 1 mgd in 1952.
Ground water. --Ground water is used extensively for cooling purposes by industries in the Louisville area because of its nearly uniform temperature, which is lower than that of surface water in the summer. Table 6 lists the use by types of industry for years 1937-52. Inspection of this table shows the large increases in water use during the war in the alcohol and chemical industries and shows the reductions brought about by conservation in 1945 and 1946. Figure 38 shows the annual ground-water pumpage for industrial use during the period 1937-52. This illustration indicates the amounts pumped from the sand and gravel formation and also from the limestone bedrock. The annual pumpage since 1946 has been less than prewar pumpage, despite the fact that a large industrial expansion has taken place. This shows the effects of conservation of water beginning in 1944, and it shows the effects of additional conservation encouraged by the sewer-rental law.
Nearly all the industrial pumping is in the Ohio River valley. Distribution of pumping is shown on figure 39.
Irrigation and rural supplies. --Supplemental irrigation is practiced on some truck farms south and southwest of Louisville. Although the annual precipitation is well above needs for agriculture, distribution during the summer does not always provide adequate water for crops. Dry periods of a few weeks during July and August may seriously affect truck crops. Ground water is used for irrigation on an intermittent basis. The pumpage for this use-during a year averages about a quarter million gallons per day.
In areas not served by public supplies, rural households depend on wells, springs, and cisterns. In the flood-plain areas,· driven wells produce adequate water. In the limestone areas, drilled wells normally meet the needs, although shortages occur in dry summers. In the shaly areas, cisterns are predominate. In the rural areas, particularly in Jefferson County, farm ponds are used extensively to provide water for stock. The density of ponds in eastern Jefferson County, as determined from topographic maps, is abol)t one for each 150 acres.
Table 5, -Use of untreated river water for cooling purposes, 1944-52
(Million gallons per day)
Year 1944 1945 1946 1947 1948 1949 1950 1951 1952
Chemical plants 94.9 80. 1 30.9 21. 2 23.3 26.8 39. 1 106.8 85.5 Electric 384.8 384.8 326.0 339.6 407.7 399.9 470.5 528.3 573.5
Total 479.7 464.9 356.9 360.8 431.0 426.7 509.6 635. 1 659. 1

44 WATER RESOURCES OF THE LOUISVILLE AREA
Table 6. -Estimated average daily net withdrawals of ground water by industries in the Louisville metropolitan area, 1937-52
[Artificial recharge has been deducted from total withdrawal to obtain net withdrawal in millions of gallons per day]
Industrial plants 1937 1938 1939 1940 1941 1942 194~ 1944 1945 1946 1947 1948 1949 1950 1951 1952
Rubber and chemical manufacturing -:- - - - 19.6 47.2 58. 1 61. 9 26.4 9.7 7. 1 7. 7 8.2 9.8 11. 7 12.0
Distilling 6.3 6.2 6.6 10.6 15.0 16.8 17.3 9. 7 8.5 4.7 6.2 4,0 4.2 4.8 6.0 3. 7 Brewing 5.3 5.6 5.3 5.2 4. 1 4. 1 3.8 3. 6 3.2 3.2 3.2 3.5 3.2 3.5 3.5 3.3 Public supply . 7 . 7 . 7 . 8 1.0 1.1 1.2 1.3 1.4 1.6 1.7 1.8 2. 1 2. 1 2.4 2.8 Air conditioning 3.9 3.9 3.8 3.8 3.7 3.6 3.7 3. 7 3.7 3.5 3.3 3.2 3.0 2.8 2.9 2.7 Oil refining 4.9 4.9 4.9 4.7 4.6 4.6 3.9 4.2 3.0 3.4 3.2 2.9 2.9 3.0 3. 1 2.6 Miscellaneous 2.9 2. 9 2.8 3. 1 3.4 3.4 3.7 3.5 3.5 2.4 .2. 5 2.2 2.0 2. 1 1.8 2.0 Meat packing 2.4 2.4 2.3 2.2 2.6 2.5 2.0 2. 1 2.0 1.8 1.2 1.1 1.0 1.0 1.0 1.3 Metal working 2.2 2.2 2.3 2.4 4. 1 4.3 4.0 3.8 3.3 3.6 3.6 3.2 2.8 1.8 1.2 1.0 Ice making 4,6 4.6 4.6 4.7 4. 1 3.7 3.4 3.3 2.6 3.6 2.7 2. 1 1.2 . 9 . 9 . 9 Tobacco processing 2.5 2.6 2.5 2.2 1.9 1.7 1.2 . 9 • 9 . 5 1.2 1.4 . 7 . 6 . 6 • 6 Dairying 2.4 2.4 2.4 2.4 2.4 2.5 2.5 2.4 2.4 2.0 1.7 1.4 1.5 . 9 . 9 . 5 'Irrigation and farming . 6 . 6 . 6 . 6 . 6 . 6 . 6 . 6 • 6 . 6 . 6 . 6 . 6 . 5 . 5 • 5 Food manufacturing . 7 1.0 1.5 1.3 1.1 . 9 . 8 . 7 •. 6 . 6 • 5 • 5 • 2 . 2 . 1 • 1 Gas and electric . 8 • 9 . 8 . 8 . 8 • 8 .9 . 8 . 9 . 9 . 9 . 9 • 9 .4 . 2 • 1
Total 40.2 40.9 41. 1 44.8 69.0 97.8 107. 1 102.5 63.0 42. 1 39.6 36.5 34.5 34.4 36.8 34. 1
120r----r----r---~----r---~--~----~--~----~--~----~--~----~--~----.----.
from lis in rock
>-<( 0
umpage from wells in sand and grovel a: UJ 0.
(/)
z 0 ....I ...J <( C) 60 1L 0
(/)
z 0 3 ....I
~
20
Figure 38.-Ground-water pumpage in the Louisville metropolitan area, 1937-52.

SCALE
~~....___~wOc.._ ___ _.._ ___ _..:;2 MILES
....... ---------------........ "-.....' '\' I I ,,
i'J.,_ ~
PRESENT USE OF WATER
EXPLANATION
• 0.5 MGD I MGD 2 MGD
4MGD 5 MGD 6 MGO
Figure 39.-Distribution of ground-water pumpage in the Louisville area, 1952.
45

46 WATER RESOURCES OF THE LOUISVILLE AREA
Table 7. -Summary of use of water in the Louisville metropolitan area, 1952
[Million gallons per day)
Type of use Source and type of
supply Industrial Domestic and Total
commercial
Surface water Public supply 17,6 53.8 71.4 Industrial cooling
(chemical) - 85.6 85,6 Industrial cooling
(electric) - 573.5 573.5
Total surface water 17.6 712.9 730.5
Grou"'ld water Public supply 1.0 1. 8 2.8 Private industrial - 30.8 30.8 Irrigation and farming - . 5 • 5
Total ground water 1. 0 33. 1 34,1
Total all sources 18.6 746.0 764.6
Fluctuation of Water Use
Water use in the area fluctuates seasonally, being highest in summer and lowest in winter. In 1951, monthly pumpage by the four public systems ranged from 62. 1 mgd in the winter to 82. 9 mgd in the summer.
Except for a few types of industry, industrial use is not seasonal, but is related to the activity of the plants. Most of the plants have been operating at a fairly steady rate, and water use remains nearly constant. The distilleries, which operated intermittently during 1952, are an exception. Other exceptions are use for air conditioning, ice making, and steamelectric plants. Ground-water use for air conditioning averaged about 2. 7 mgd in 1952. Use ranged from very little in cold months to about 8 mgd during the five warm months. Many of the installations operate in the day and are off at night, therefore, the rate of pumpage during part of the day probably exceeded 15 mgd.
Ground-water use for ice-manufacturing plants averaged 1. 8 mgd in 1952. Summer use is estimated as about 2. 5 mgd.
Use of river water for cooling purposes is nearly constant atJhe largest steam-electric plant. At the smaller plants, use varies according to the needs for power and operation of the hydro plant at the dam. Seasonal use of river water for cooling purposes, which averaged 659. 1 mgd in 1952, ranged from about 866 mgd in summer to about 446 mgd in winter.
Summary of Use
A summary of use of water for the metropolitan area for 1952 is given in table 7. This table shows the amounts pumped from ground water and from the Ohio River and shows how the water was used.
Figure 40 summarizes total use classified as to source and type of supply.
POTENTIAL SUPPLY
The potential supply of water in the area is very large compared to present use. The flow of the Ohio River is so large that it over-shadows other sources.
Surface Water
An exact evaluation of the potential of the Ohio River is difficult to make. Because of low-water regulation and effects of new dams being constructed in the basin upstream, it is probabl~ that low flows in the future will be higher than those observed in the past. The minimum daily flow for a recurrence interval of 20 years (fig. 7) is about 2, 600 mgd (4, 000 cfs). This value has been used in constructing figure 41, which shows that present use is about 730 mgd (1, 130 cfs) or 28 percent of the potential. Most of the water used is returned to the river and is available for reuse downstream. therefore. the value of potential use has
><1 0
a:: ..., fl.
~ 500 0 .J .J <I C)
~ 0
(/) 400 z Q .J .J
~
~
UJ C)
~ ~ ::;) fl.
Figure 40. -Summary of water use in the Louisville metropolitan area, 1952.

WATER LAWS 47
SURFACE WATER GROUND WATER
Figure 41. -Comparison of water use in 1952 with estimated potential supply.
little practical application except to demonstrate that present use is only a small percent of that available. The limiting factor on total use will probably be controlled by temperature and pollution by chemical wastes rather than by flow rates.
The .flow of small streams is not considered important in future development of the area because of the relatively small annual yield of the streams, and because summer flows are extremely small,
Ground Water
Available ground-water supplies have been evaluated in detail on the Kentucky side of the river. Northeast of Louisville, the potential is about 280 mgd in a 6-mile strip along the river between Harrods Creek and Zorn Avenue. This water, if developed, would not be an independent supply but would come from the river by induced infiltration and would be suitable for industrial or domestic use. In the parts of Louisville where ground-water supplies are being used, the present use of about 30 mgd is about in balance with recharge from rainfall and river infiltration. This could be increased somewhat by additional development of river infiltration in a few places. Southwest of Louisville, the supply available in the sand and gravel is estimated as about 12 mgd. River infiltration of about 40 mgd could be developed. Detailed data are not available for the Indiana side of the river. Very large supplies were developed during the war at the Indiana Ordnance Works near Charlestown by induced infiltration. Northeast of Jeffersonville, additional supplies can probably be developed near the river. The area north of Utica Pike is not considered as being favorable for development of large supplies
because of the high elevation of the bedrock. The total ground-water supplies that might be developed in the metropolitan area is estimated as about 450 mgd. Use in 1952 of 34, 2 mgd is 8 percent of the available supply.
WATER·LAWS
The two main sources of water supply in the Louisville area are the Ohio River and the ground waters underlying the flood plain of the Ohio River. Other water-supplies in the area consist almost entirely of individual well supplies from consolidated ro..:k formations and cisterns.
Water laws affecting the use of Ohio River waters are the Federal regulations related to navigation and flood control and the pollution criteria as established by the Ohio River Valley Water Sanitation Commission, which are carried out by the individual states. Basic laws on water-use in both Indiana and Kentucky is the common law-riparian rights for surface water and
quasi..:riparian rights for ground water (modified in Indiana by the 1951 law; see page 48). Provisions of legislative acts empower individual agencies of both states to regulate pollution of public water supplies, treatment of water supplies, and encroachments on streams.
Federal Laws
Congress has established Federal control of the navigable waters of this co.untry; including those nonnavigable tributary streams which may have an effect on the navigable capacity of the waterways. This control, as well as flood-control activities, has been generally placed with the Corps of Engineers. Department of the Army.
For the Ohio River bordering Kentucky. from near Maysville to the mouth of the river. jurisdiction for navigation and flood control is vested in the Louisville District. Corps of Engineers. Proposed encroachments on the Ohio River in that reach of the stream are cleared through the Louisville District office.
Ohio River Valley Water Sanitation Commission
The Ohio River Valley Water Sanitation Commission was established in 1948 as a result of an eight-state compact signed by the States of Indiana, Illinois, Kentucky, New York, Ohio, Pennsylvania, Virginia,· and West Virginia. The Commission is empowered to study pollution conditions in the Ohio River Valley and to direct efforts toward abatement. State participation is effected through representation of three Commissioners from each State and a technical representative from each State on the Engineering Committee of the. Commission, and through the direct responsibility for securing action from municipalities and industries by means of State pollution control agencies.
Kentu~ky Law
The Water Pollution Control Commission for Kentucky was established in the Department of Health in 1950 by an Act of the Kentucky Legislature. In general

48 WATER RESOURCES OF THE LOUISVILLE AREA
terms, the Act directs the Commission "---to develop a comprehensive program for the prevention, control, and abatement of water pollution throughout the Commonwealth." The Commission is directed to establish standards of water quality and rules and regulations for the prevention, control, and abatement of pollution, to issue orders for remedial measures, including treatment works, and to pass on all plans for disposal or treatment works. The Commission is empowered to institute court proceedings to enforce compliance. The Act provides that the Commission shall consist of the Commissioners of Health and Conservation, the Attorney General, the Director of Division of Game and Fish, and two members at large representing industr·ial and municipal groups, respectively.
The Flood Control and Water Usage Board was established in the Department of Conservation in 1948 by an Act of the Kentucky Legislature. As defined by this Act, the Board is directed to function as the official state agency to study and review all flood control projects and projects affecting the municipal or industrial usage of water, to have jurisdiction over all stream encroachments except drainage for agricultural purposes, and to make studies and investigations for flood control and for municipal and industrial use of the water resources. The Board, appointed by the Governor, is composed of one representative from each Congressional district.
Kentucky law permits the formation of sewage, drainage, and water districts for the purpose of supervising the construction and operation of facilities within area limits specified by charter.
Indiana Law
The Indiana Department of Conservation was em:. powered in 1951 to declare restricted-use areas where it is found that use of ground water is threatening or impairing the supply. The Department may then issue or refuse permits to users who wish to use more than 100, 000 gpd in excess of their use at the time the area was designated as a restricted area.
REFERENCES
Anderson, 0. K., 1951, Local climatological summary with comparative data, Louisville, Kentucky: U.S. Dept. of Commerce, Weather Bur.
Anonymous, 1945, Conservation of ground water in the Louisville area, Kentucky; Am. Water Works Assoc. Jour., v. 37, no. 6, p. 543-560.
Butts, Charles, 1915, Geological map of Jefferson County, Kentucky: Kentucky Geol. Survey, Frankfort, Ky.
-1915, Geology and mineral resources of Jefferson County, Kentucky: Kentucky Geol. Survey, ser. 4, v. 3.
Caye, Woolsey, M., 1939, Ground water-well report. Manuscript report by the Comm. of Sewerage of Louisville, Louisville, Ky.
Comm. of Sewerage of Louisville, 1942, Final report of Commissioners of Sewerage of Louisville, 1919-42, Louisville, Ky.
Diehl, Robert B., 1943, The diminishing supply and conserv.ation of the underground water supply of Louisville, Kentucky. Mimeographed report by Diehl Pump and Supply Co., Louisville, Ky.
Grover, Nathan C., 1938, Floods of Ohio and Mississippi Rivers, January-February 1937, with a section on the flood deposits of the Ohio River, January-· February 1937 by G. R. Mansfield: U. S. Geol. Survey Water-Supply Paper 838.
Guyton, W. F., 1944, Artificial recharge of groundwater reservoir with water from city's surface supply at Louisville, Ky. Prepared by the U. S. Geol. Survey in cooperation with the Kentucky Dept. of Mines and Minerals, Geol. Div.
Guyton, W. F., 1945, Depleted wells at Louisville recharged with city water: Water Works Eng.
-, 1946, Artificial recharge of glacial sand and gravel with filtered river water at Louisville, Kentucky: Econ. Geology, v. 41, no. 6, p. 644-658.
Guyton, W. F., Stuart, W. T., and Maxey, G. B., 1944, Progress report on the ground-water resources of the Louisville are?, Kentucky. Prepared by the U. S. Geol. Survey in cooperation with the Kentucky Dept. of Mines and Minerals, Geol. Div. and the c:ity·of Louisville.
Guyton, W. F. ~ and Sublett, H. E. , 1944, Conservation of ground water in the Louisville area, Kentucky. Prepared by the U. S. Geol. Survey in cooperation with the Kentucky Dept. of Mines and Minerals, Geol. Div.
Hagan, Wallace W., 1943, Electrical earth resistivity surveys in vicinity of New Albany, Indiana. Manuscript report in files of U.S. Geol. Survey.
Hamilton, D. K., 1944, Ground water in the bedrock beneath the glacial outwash in the Louisville area, Kentucky. Prepared by the U. S. Geol. Survey in cooperation with the Kentucky Dept. of Mines and Minerals.
Kazmann, Raphael G., 1948, River infiltration as a source of ground water supply: Transactions Am. Soc. of Civil Eng., v. 113, p. 404-420.
Logan, W. N., 1932, Geological map of Indiana: Indiana Dept. of Conservation, Div. of Geol., no. 112.
Louisville Chamber of Commerce, 1951, City count is down for year, county gains, 1960 area estimate -three -quarter million: Louisville, v. 3, no-. 11, p. 29.
Louisville Water Co., Inc., annual reports, Louisville, Kentucky.
Maxey, G. B., 1944, Test to determine practicability of Ranr.·.!y water collector on bank of Ohio River at Bells Lane, Louisville, Kentucky. Prepared by the U. S. Geol. Survey in cooperation with the Kentucky Dept. of Mines and Minerals, Geol. Div. and the city of Louisville.
McFarlan, Arthur C., 1943, Geology of Kentucky: Univ. of Kentucky, Lexington, Kentucky.
McGuinnE}SS, Charles L., 1942, Report on industrial wells in New Albany, Indiana. Manuscript report in files of U. S. Geol. Survey.
Ohio River Valley Sanitation Comm., 1950, Pollution patterns in the Ohio River.
Perry, Joseph I., Mitchell, Max L., and McGrain, Preston, 1951, Indiana's water resources: Indiana Flood Control and Water Resources Comm. Bull. 1.
Rorabaugh, M. I., .1946, Ground-water resources of the southwestern part of the Louisville area, Kentucky. Prepared by the U. S. Geol. Survey in cooperation with the Rubber Reserve Co., c'ity of Louisville, and Jefferson County.
-, 1948, Ground-water resources of the northeastern part of the Louisville area, Kentucky. Prepared by the U. S. Geol. Survey in cooperation with the city of Louisville, Louisville Water Co.

REFERENCES 49
Rorabaugh, M. I., 1949, Investigation discloses large ground-water supply: The Louisville Eng. and Sci., v. 5, n0. 4.
-, 1949, Progress report on the ground-water resources of the Louisville area, Kentucky, 1945-49. Prepared by the U. S. Geol. Survey in cooperation with the city of Louisville and Jefferson County.
-, 1951, Stream-bed percolation in development of water supplies, Internat. Assoc. of Hydrology, Brussels.
Schrader, Floyd F., 1945, Water: Bull. of the Bur. of School Service, Univ. of Kentucky, v. 18, no. 2, p. 45-122.
Shoecraft, E. C., Drury, W. R., and McNamee, R. L. (con: 1lting engineers), 1944, Report on water resources for the Underground Water Users Assoc. Louisville, Kentucky. Mimeographed report.
Spicer, H. Cecil, 1946, Electrical resistivity studies of the depth to bedrock in the Louisville, Kentucky area, Manuscript report in files of U. S. Geol. Survey.
Stuart, W. T., 1944, Conservation of ground water, including artificial recharge, by two companies in the Louisville area, Kentucky. Prepared by the U. S. Geol. Survey in cooperation with the Kentucky Dept. of Mines and Minerals, Geol. Div.
Sublett, H. E., 1945, Chemical quality of ground water in the Louisville area, Kentucky. Prepared
by the U. S. Geol. Survey in cooperation with the Kentucky Dept. of Mines and Minerals, Geol. Div.
Thomas, Harold E., 1951, The conservation of ground water. McGraw-Hill Book Co., Inc.
U. S. Geol. Survey, 1944, Chemical analyses of water from wells in the Louisville area, Kentucky. Prepared by the U. S .. Geo_l_. ~urv~y in cooperation with the Kentucky Dept. of Mines and Minerals, Geol. Div.
-, 1945, Drillers' logs of wells and test borings in the Louisville area, Kentucky. Prepared by the U. S. Geol. Survey in cooperation with the Kentucky Dept. of Mines and Minerals, Geol. Div.
-, 1946, Inventory of water wells, Louisville area. Prepared by the U. S. Geol. Survey in cooperation with the city of ~uisville and Jefferson County.
-, issued annually, Surface-water supply of the United States, pt. 3, Ohio River Basin: Water-. Supply Papers.
-, issued annually, Water levels and artesian pressure in observation wells in the United States, pt. 2, Southeastern States: Water-Supply Papers.
Wenger, H. V., 1943, Report on the ground-water supply, Louisville, Kentucky, Manuscript report, War Production Board.
INT.-DUP. SEC .• WASH., D.C .. ~S!tQ6


![Kentucky Irish American. (Louisville, KY) 1903-03-14 [p ].](https://static.fdocuments.in/doc/165x107/618b434ab08f3953ca5bdca9/kentucky-irish-american-louisville-ky-1903-03-14-p-.jpg)