Water Resources Management in the Pacific Islands · Water Resources . Management in the Pacific...
59
WMO Workshop on Enhancing Climate Indices for Sector-Specific Applications in the Pacific Islands Region Nadi, Fiji Water Resources Management in the Pacific Islands Thursday 10 th December 2015 Tony Falkland
Transcript of Water Resources Management in the Pacific Islands · Water Resources . Management in the Pacific...

WMO Workshop on Enhancing Climate Indices for Sector-Specific Applications in the
Pacific Islands Region Nadi, Fiji
Water Resources Management in the Pacific Islands
Thursday 10th December 2015
Tony Falkland

Outline of Presentation • Characteristics of Pacific islands including water
resources • Influencing factors on water resources
• Major water resources issues & risks to water security
• Example of the use of rainfall and groundwater indices in a drought plan
• Importance of climate & hydrological Data in water management
Please ask questions or make comments at any
stage

Pacific Island Countries
Large diversity of characteristics •Physical nature of islands (size, height, geology, etc)
•Climate
•Hydrology & water resources availability
•Demography (total population, percentage of urban and rural)
•Culture
•Degree of economic development

Physical characteristics of Pacific Island Countries
FSM = Federated States of Micronesia, PNG = Papua New Guinea, RMI = Republic of Marshall Islands

Population summary for 14 Pacific Island Countries
FSM = Federated States of Micronesia, PNG = Papua New Guinea, RMI = Republic of Marshall Islands
Freshwater resources of Pacific Islands
• Common, naturally occurring • GROUNDWATER • SURFACE WATER • RAINWATER
• Less common or more expensive
• DESALINATION • IMPORTATION • USE of SEAWATER or BRACKISH WATER • WASTEWATER REUSE
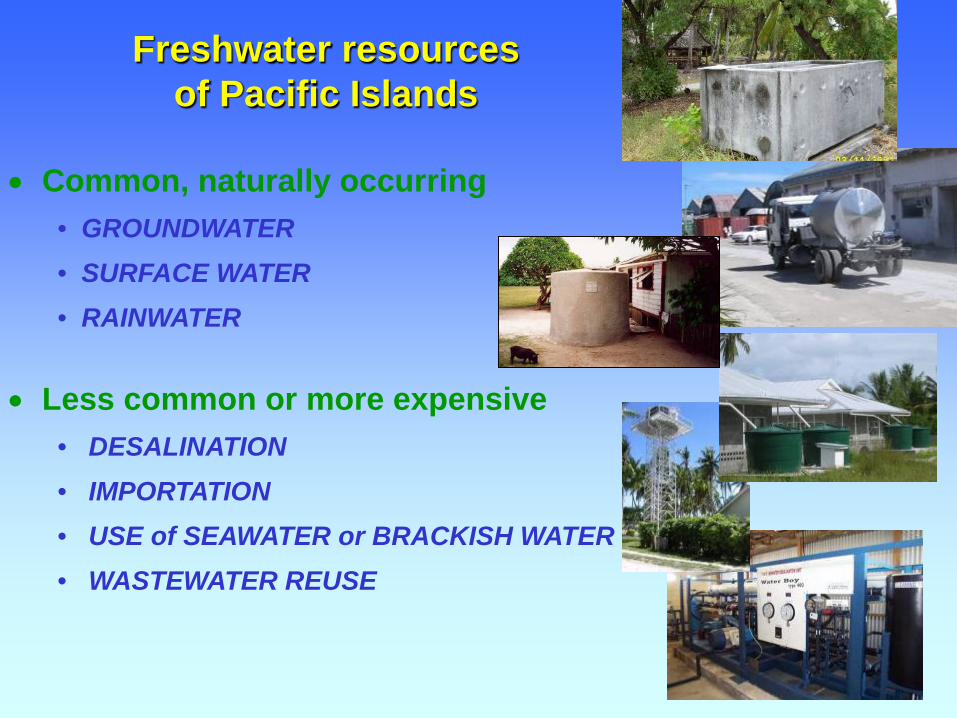
Surface Water Resources
• RIVERS & STREAMS
♦ surface ♦ subterranean (in karstic
formations)
• SPRINGS ♦ on island ♦ at coastline ♦ submarine
• LAKES & SWAMPS ♦ fresh ♦ brackish
• DAMS ♦ on some larger islands

Groundwater Resources
• PERCHED AQUIFERS (High Islands)
♦ ‘HORIZONTAL’
♦ ‘VERTICAL’(Dyke-confined)
• BASAL AQUIFERS (High & Low Islands)
♦ COASTAL AQUIFERS
♦ ‘FRESHWATER LENSES’
Example of a high island
Example of a low island
(Note: vertical scale is highly exaggerated)
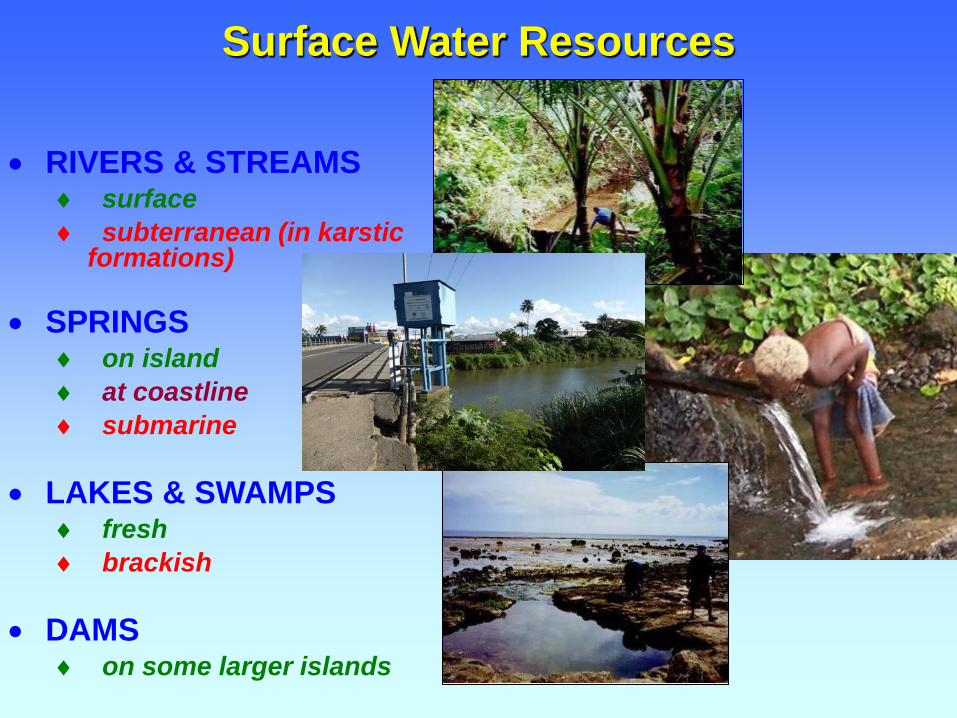
Groundwater Resources (Coastal Zone Conditions in some HIGH ISLANDS)
Basal aquifer - note THIN transition zone

Atoll Groundwater Freshwater lens drawing at more
realistic scale
Ocean Lagoon
Seawater
Brackish water zone
Freshwater zone
Ocean Lagoon

Groundwater Resources (Limestone island – raised atoll: Nauru)
Source: Jacobson et al (1992). Geology & Hydrogeology of Nauru Island. in Vacher & Quinn, Geology & Hydrogeology of Carbonate Islands.
Cross section

Water uses • Water supply (most important use) • Tourism (in some islands) • Irrigated agriculture (limited in some islands) • Hydropower (in some islands) • Mining (in some islands)

Summary of main freshwater resources in Pacific Island Countries
FSM = Federated States of Micronesia, PNG = Papua New Guinea, RMI = Republic of Marshall Islands

Special Problems of Islands (particularly small, low islands)
• Very Limited Land & Water Resources
• Highly Vulnerable to Climate Impacts & Natural Hazards (e.g. Droughts, Floods, Tropical Cyclones, Earthquakes, Tsunamis, Volcanic Eruptions, Landslides, Sea Level Rise)
• Highly Vulnerable to Pollution from Human Activities (e.g. Seawater intrusion due to pumping, Biological and Chemical pollution)
• Major Impacts from Rising Populations & Increasing Demands on Water Resources, especially in urban areas

Water security in Pacific Island Countries
Most vulnerable groups •Crowded urban and peri-urban areas (often lack adequate water supply and need to use polluted sources) •Remote islands (at risk during droughts or after cyclones if local water resources are depleted or damaged (e.g. rainwater tanks) or become saline (groundwater) and require importation of water) •Remote parts of larger islands (at risk during droughts if water resources are depleted and food crops fail) •Very low level parts of islands (at risk of overtopping & temporary salinisation of groundwater from waves caused by cyclones or tsunamis in addition to potential inundation from projected sea level rise)

% of Population with improved water sources in 2013
Source: WHO & UNICEF Joint Monitoring Programme Notes: SIDS = Small Islands Developing States AIMS = Africa, Indian Ocean, Mediterranean & South China Seas

% of Population with improved sanitation facilities in 2013
Source: WHO & UNICEF Joint Monitoring Programme Notes: SIDS = Small Islands Developing States AIMS = Africa, Indian Ocean, Mediterranean & South China Seas
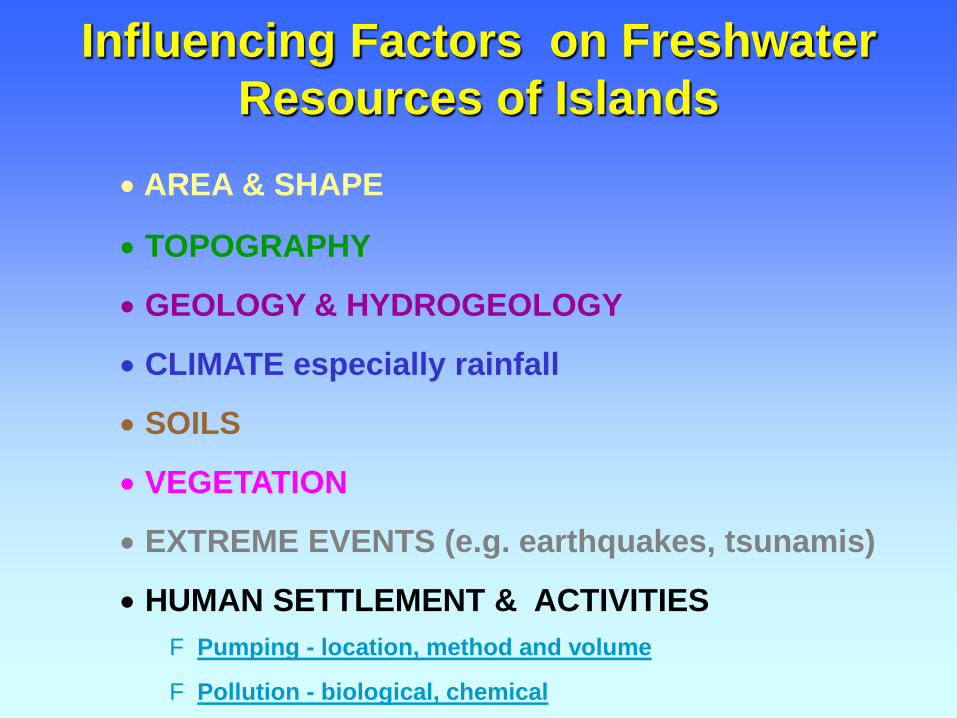
Influencing Factors on Freshwater Resources of Islands
• AREA & SHAPE
• TOPOGRAPHY
• GEOLOGY & HYDROGEOLOGY
• CLIMATE especially rainfall
• SOILS
• VEGETATION
• EXTREME EVENTS (e.g. earthquakes, tsunamis)
• HUMAN SETTLEMENT & ACTIVITIES F Pumping - location, method and volume
F Pollution - biological, chemical

Topography
High Islands: Surface & Groundwater
Resources
Low Islands: Groundwater Resources only

Geology
Examples of Volcanic, Limestone, Coral & Mixed Geology Islands

Evolution of Islands over geological time
Volcanic island
..... to mixed volcanic and coral island
….. to coral atoll

Mean annual rainfall in the Pacific Ocean
High average rainfall zones in west; Low average rainfall zone in equatorial east

Rainfall summary for Pacific Island Countries
FSM = Federated States of Micronesia, PNG = Papua New Guinea, RMI = Republic of Marshall Islands
Coefficient of variation (CV) = standard deviation / mean

Rainfall summary for Pacific Island Countries
FSM = Federated States of Micronesia, PNG = Papua New Guinea, RMI = Republic of Marshall Islands
Coefficient of variation (CV) = standard deviation / mean

Local Climate: Effects of Topography on Rainfall
Rarotonga Cook Islands Annual Rainfall
pattern (High rainfall gradient from about 2,000 mm at sea level to about
4,000 mm in elevated terrain)

Impacts of El Niño and La Niña Episodes on Rainfall
Wetter and Drier regions associated
with El Niño and
La Niña episodes
El Niño conditions
La Niña conditions
Kiritimati Island Kiribati

Annual Rainfall, Kiritimati Island, Kiribati
Low average annual rainfall of ~ 1,000mm and highly variable, Low rainfall in La Niña periods, High rainfall in El Niño periods

Droughts due to strong El Niño or La Niña episodes
Impacts on Kiritimati Island vegetation in recent droughts

Some Impacts of Droughts in Pacific Island Countries
• Depletion of water resources (problem for water security) Rainwater tanks become empty Streamflows and spring flows decrease & even cease to flow Reservoirs lose stored water & may dry up Inland groundwater levels drop Some coastal groundwater may become saline
• Depletion of soil moisture & reduction in agricultural yields and possible entire loss of crops (problem for food security)
• Increased wild fire risk due to dry catchments • Economic & social impacts including:
Reduction in revenue for households (e.g. farmers), businesses and national economies
Decrease in hydropower generation leading to increase in diesel power generation & increase in electricity tariffs (e.g. Fiji, Samoa)
Closure of schools Health impacts due to use of less safe water sources
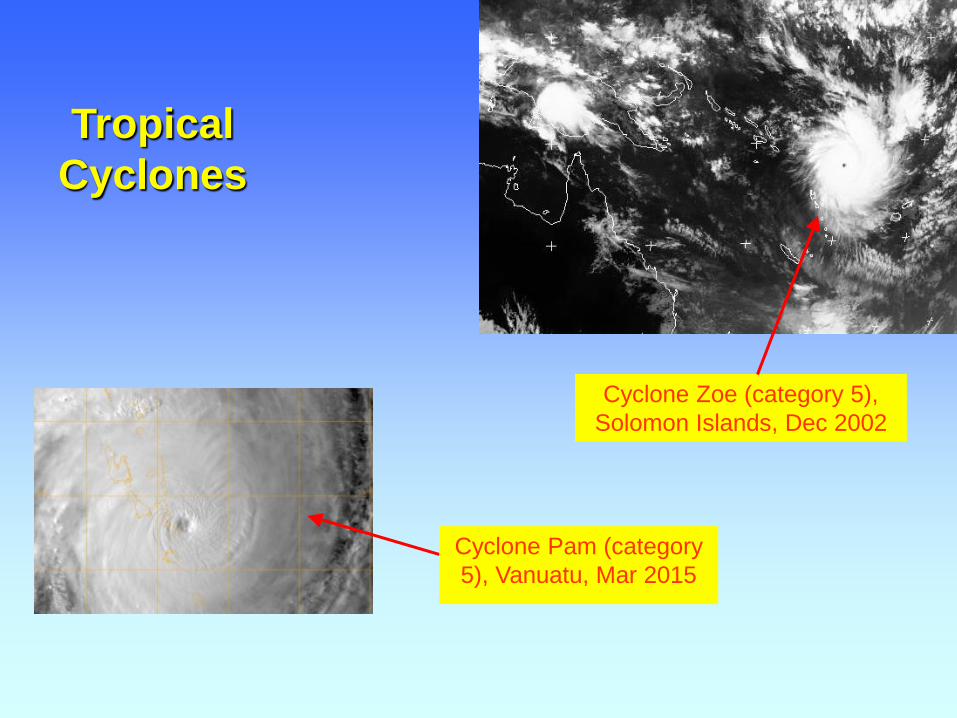
Tropical Cyclones
Cyclone Zoe (category 5), Solomon Islands, Dec 2002
Cyclone Pam (category 5), Vanuatu, Mar 2015

Floods resulting from Tropical Cyclones
Main street of Nadi flooded from Nadi River, January 2008 (due to heavy rainfall associated with Tropical Cyclone Gene)

Major water resources issues & risks to water security
The following issues affect many PICs:
• Problems with availability of freshwater
• Water quality degradation
• Insufficient knowledge of water resources
• Insufficient education and training and institutional capacity in some water agencies
• Inappropriate technology and methods
• Insufficient water governance
Some significant improvements have been made in some PICs in recent years but more effort and, where necessary, external assistance is required.

Tarawa atoll, Kiribati example of an island with a major water problem
Very limited land area (31 km2) Large population in part of the atoll (South Tarawa) Reasonable average but highly variable rainfall Limited and vulnerable groundwater resources
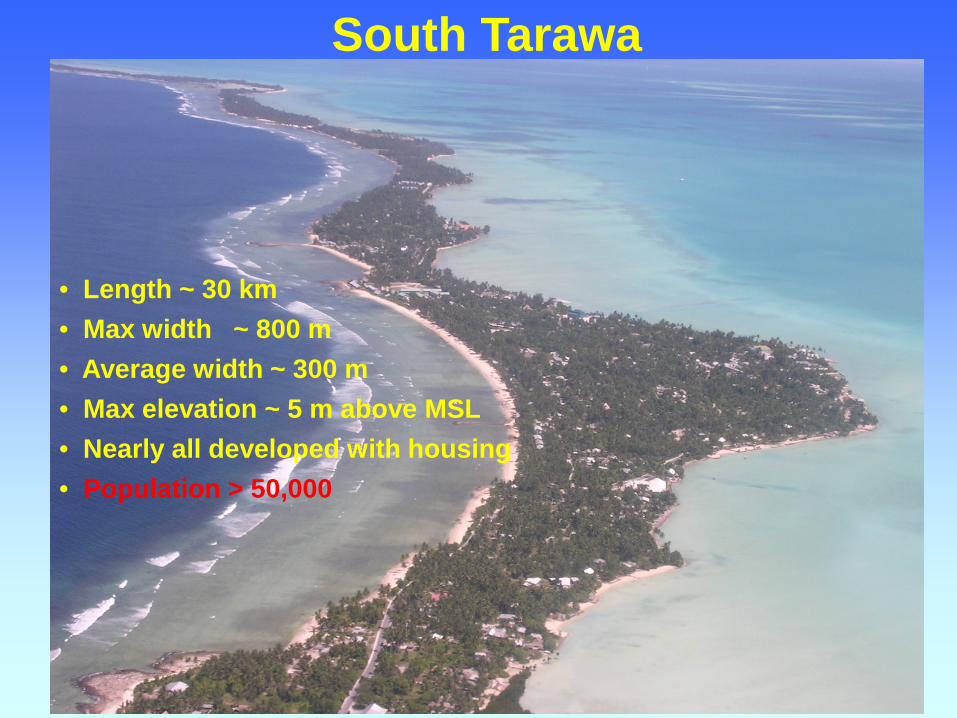
South Tarawa
• Length ~ 30 km • Max width ~ 800 m • Average width ~ 300 m • Max elevation ~ 5 m above MSL • Nearly all developed with housing • Population > 50,000

Betio, western end of South Tarawa
Population density ~15,000/km2

Tarawa atoll
Bonriki
South (urban) Tarawa (heavily populated)
Lagoon
North (rural) Tarawa (lightly populated)
Buota
Ocean
Main sources of fresh groundwater for South Tarawa
Betio (15,000 people/km2)

Current Water Supply Sources, South Tarawa
Main sources of water: Groundwater from Bonriki & Buota islands (treated & piped
along South Tarawa to village headtanks and then distributed to houses and buildings via pipe networks)
Local groundwater from wells (fresh & brackish, many polluted from sanitation systems, etc.)
Rainwater collection at houses & buildings (limited coverage) Seawater for toilet flushing for some houses in main population
centres (Betio, Bairiki & Bikenibeu)
Other sources of water: Bottled water, locally produced from desalination plant (not
working at present) Bottled water, imported (can only be afforded by some)

Bonriki, SE corner of Tarawa
Main pumping area 22 infiltration galleries & monitoring boreholes

Groundwater pumping systems (infiltration galleries) Bonriki island, SE corner of Tarawa
Image from Secretariat for the Pacific Community

Pumping from Bonriki & Buota islands
using infiltration galleries (or ‘skimming wells’)
Infiltration galleries control salinity as much as possible by spreading the pumping effect over a much wider area than a well or borehole

Gallery pump stations & pipes, Bonriki

Groundwater Resources Assessment & Monitoring
Multi-level monitoring boreholes enable measurements of groundwater salinity at different depths

Water demand has exceeded available groundwater supply for South Tarawa
Other options are being considered including some additional groundwater supply, increased rainwater harvesting and desalination

Water quality degradation • Microbiological pollution
• inappropriate or poorly maintained sanitation systems • solid waste disposal sites • farming in water supply catchments
• Chemical pollution • hydrocarbon and toxic chemical leaks and spills • solid waste disposal sites • industrial discharges • agricultural chemicals particularly insecticides, herbicides
• Saline intrusion of groundwater (due to over-pumping)
• Erosion and Sedimentation (due to uncontrolled land clearing)

High Vulnerability to Pollution (especially small coral islands)
Highly vulnerable to: – chemical & biological pollution due to thin, highly permeable soils – saline intrusion due to thin freshwater zones
Unsaturated Zone
Freshwater Zone

Impacts of pollution • Impacts of polluted drinking water on human health
• Diarrhoeal diseases are very common in many Pacific Islands • Other waterborne diseases have occurred (e.g. cholera) • One of the most serious health issues in small islands including
being a major cause of infant mortality
• Impacts of sedimentation • Dirty water supplies after rainfall • Lowers effectiveness of water supply disinfection • Can fill in-stream reservoirs and clog intakes • Downstream impacts (e.g. on mangroves, coral reefs & coastal fisheries)

Insufficient knowledge of water resources
Contributing factors:
• Inadequate baseline assessments
• Insufficient regular monitoring
• Limited analysis and interpretation
• Knowledge gaps (insufficient research)
The above factors are mainly as a result of insufficient trained staff and operational budgets to undertake the necessary tasks.
Often assessments and monitoring are left to individual projects rather than an integrated approach to the issue.
Inappropriate technology
Examples from some islands:
• Inappropriate pumping systems e.g. pumped wells and boreholes in thin freshwater lenses (rather than infiltration galleries) – saline water is the result!
• Inappropriate use of desalination e.g. where cheaper options are available, insufficient local capacity to pay or to operate & maintain – breakdowns and abandonment are the results!
• Inappropriate sanitation systems e.g. pit toilets and septic tanks in small coral islands – high pollution levels and threat to human health are the results!
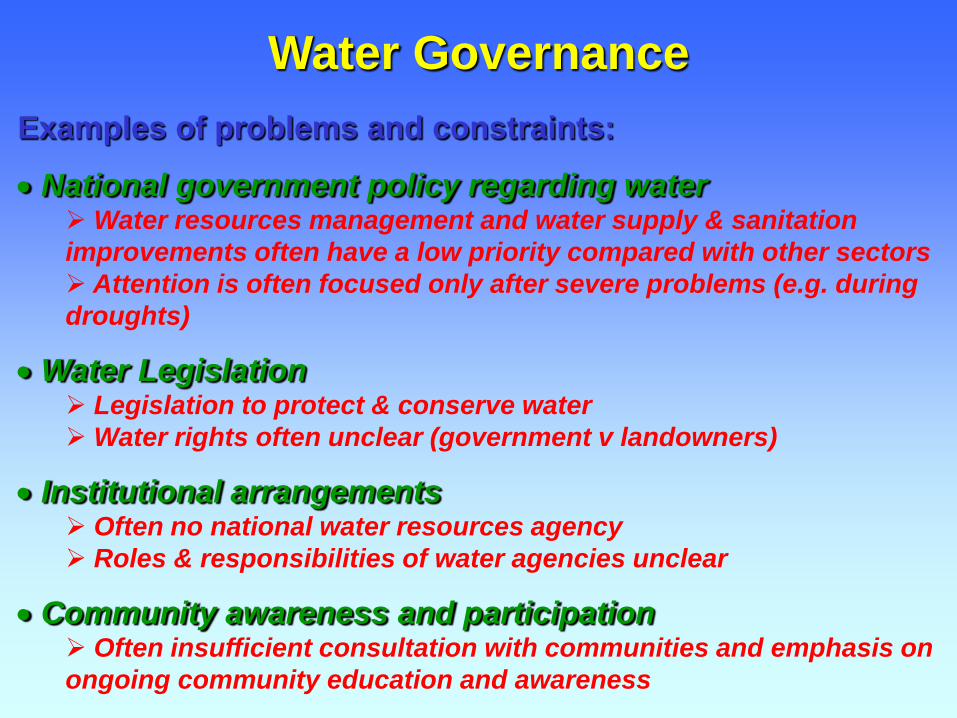
Water Governance Examples of problems and constraints:
• National government policy regarding water Water resources management and water supply & sanitation improvements often have a low priority compared with other sectors Attention is often focused only after severe problems (e.g. during droughts)
• Water Legislation Legislation to protect & conserve water Water rights often unclear (government v landowners)
• Institutional arrangements Often no national water resources agency Roles & responsibilities of water agencies unclear
• Community awareness and participation Often insufficient consultation with communities and emphasis on ongoing community education and awareness

South Tarawa Drought Plan
Example of the use of rainfall and hydrological indices

Drought Impacts
• Severity of impacts of low rainfall / droughts varies depending on type of freshwater sources & durations of cumulative low rainfall (based on hydraulic residence times).
• Three main freshwater sources in South Tarawa & low rainfall
durations: Household and community rainwater tanks. Run dry. First
freshwater sources affected. 3 months Household wells in smaller freshwater lenses along South
Tarawa. Salinity rises. Primarily used for non-potable purposes (e.g. washing). 12 months
Main freshwater lenses in Bonriki and Buota. Highest priority water resources as these supply the most number of people with freshwater. 3-5 years

Drought Monitoring Indices Indices used for drought monitoring • Rainfall:
– Historical daily rainfall data at Betio (1947 – present) – Analysed using decile (percentile) method
• Groundwater salinity (Bonriki & Buota): Measurements: – (a) in multi-level monitoring boreholes at Bonriki. Generally
every 3 months. Use freshwater lens thickness at selected boreholes as an indicator of current fresh groundwater status
– (b) in combined water pumped from the galleries. Every month. Data used directly.

Annual Rainfall Betio, Tarawa meteorological station
Reasonable average annual rainfall of ~ 2m but highly variable, Low rainfall in La Niña periods, High rainfall in El Niño periods
Worst 3 year drought
(1998-2000)

Rainfall rankings, 5 year duration (decile method)
Rainfall over 3-5 year duration impacts on main groundwater systems
Worst 3 year drought (1998-2000)

Inverse relationship between groundwater salinity & rainfall percentiles
Inverse relationship

Drought Alert Levels & Responses • Four levels of alert (No Alert, Alert Level 1, 2, 3) • Alert Level 1
– Trigger: when decile method using rainfall outlook (using SCOPIC) indicates 3 month rainfall less than 40 percentile – Action: KMS advises Drought Committee and advisory warning to the public is
issued – Advice to community about actions to conserve water (rainwater & groundwater)
• Alert Level 2 – Trigger: when decile method using rainfall outlook indicates 4-5 year rainfall less
than 40 percentile – Actions: NDMO convenes Drought Committee, increased monitoring & reporting,
increased water conservation measures including water restrictions if required – Advice to community about risk to status of Bonriki & Buota lenses
• Alert Level 3 – Trigger: when decile method using rainfall outlook indicates 4-5 year rainfall less
than 10 percentile or when groundwater salinity reaches a critical level – Actions: Declaration of Drought (by Cabinet based on advice from NDMO),
increased/severe water restrictions, possible temporary closure of some pumping stations due to salinity increase, possible use of desalination plants
– Advice to community about emergency measures taken
Importance of Assessment and Monitoring Data for Water Resources Management
• There is an old saying…“You cannot manage it if you do not measure it”
• Good quality and ongoing climate and hydrological data collection and analysis is essential for water resources assessment and management (including drought management)
Summary of Presentation
• Characteristics of Pacific islands including water resources
• Influencing factors on water resources • Major water resources issues & risks to water security • Example of the use of rainfall and groundwater indices
in a drought plan
• Importance of climate & hydrological data in water management

Thank you
Vinaka vaka levu
Any (more) questions?