Water resource benefit trade-off and hydropower development · Water resource benefit trade-off and...
74
Water resource benefit trade-off and hydropower development Case studies from Central Lao PDR Yumiko Kura 1 , Benoit Laplante 2 , Olivier Joffre 1 , Chanthaboun Sirimanotham 3 , Bounthong Sengvilaykham 4 , Tarek Ketelsen 2 and Pelle Gatke 1 1. WorldFish – Greater Mekong Region, Phnom Penh, Cambodia 2. International Centre for Environmental Management (ICEM), Hanoi, Vietnam 3. Department of Livestock and Fisheries, Ministry of Agriculture and Forestry , Vientiane, Lao PDR 4. Savannakhet University, Savannakhet, Lao PDR Report for the Challenge Program on Water & Food Mekong Project MK2: “Assessing the Value of Water” 30 JUNE, 2014
Transcript of Water resource benefit trade-off and hydropower development · Water resource benefit trade-off and...
Water resource benefit trade-off and hydropower
development Case studies from Central Lao PDR
Yumiko Kura1, Benoit Laplante2, Olivier Joffre1, Chanthaboun Sirimanotham3, Bounthong Sengvilaykham4, Tarek Ketelsen2 and Pelle Gatke1
1. WorldFish – Greater Mekong Region, Phnom Penh, Cambodia 2. International Centre for Environmental Management (ICEM), Hanoi, Vietnam 3. Department of Livestock and Fisheries, Ministry of Agriculture and Forestry , Vientiane, Lao PDR 4. Savannakhet University, Savannakhet, Lao PDR
Report for the Challenge Program on Water & Food Mekong Project
MK2: “Assessing the Value of Water”
30 JUNE, 2014
2
Acknowledgments The authors would like to acknowledge the following individuals and organizations in Lao PDR who have facilitated this research: Social and Environmental Division staff of Theun-Hinboun Power Company Ltd., members of the field survey team from the Department of Livestock and Fisheries and Savannakhet University, and the survey respondents and the local authorities in Phonkeo, Sensi, Sopchat, Thambing, and Keosenkham. This research was carried out through the CGIAR Challenge Program on Water and Food (CPWF), which is funded by the UK Department for International Development (DFID), the European Commission (EC), the International Fund for Agricultural Development (IFAD), and the Swiss Agency for Development and Cooperation (SDC). CPWF is a partner of the CGIAR Research Program on Water, Land and Ecosystems (WLE). WLE combines the resources of 11 CGIAR Centers, The United Nations Food and Agriculture Organization (FAO) and numerous international, regional and national partners to provide an integrated approach to natural resource management research. This program is led by the International Water Management Institute (IWMI), a member of the CGIAR Consortium. wle.cgiar.org All errors and omissions which may remain in this report are those of the authors and shall not be attributed to any of these individuals and organizations.
3
Table of Contents
I. INTRODUCTION ......................................................................................................................... 8
II. CASE STUDY BACKGROUND ................................................................................................. 9 II.1. Description of Study Site .................................................................................................................. 9 II.2. Description of the Theun-Hinboun Expansion Project .............................................................. 10 II.3. Characteristics of Water Resources and Seasonal River Flow Patterns ................................. 15 II.4. Hydropower Potential in Lao PDR ................................................................................................ 17
III. CASE STUDY METHODOLOGY .......................................................................................... 18
IV. RESULTS OF UPSTREAM CASE STUDY .......................................................................... 24 IV.1. Demographic Characteristics of Villages – Before Resettlement .......................................... 24 IV.2. Domestic Water Supply and Water Use ..................................................................................... 26 IV.3. Agriculture and Farmland ............................................................................................................. 33 IV.4. Livestock ........................................................................................................................................... 40 IV.5. Fisheries ............................................................................................................................................ 42 IV.6. Timber and Non-Timber Forest Products ................................................................................... 49 IV.7. Non-Farm Activities ........................................................................................................................ 51 IV.8. Income Portfolio and Economic Benefits of Water .................................................................. 52 IV.9. Conclusions: Redistribution of Water Use and Benefits After Resettlement ...................... 58
V. RESULTS OF DOWNSTREAM CASE STUDY .................................................................... 59 V.1. Description Of The Survey Area .................................................................................................... 59 V.2. Sources Of Water ............................................................................................................................. 60 V.3. Agriculture And Farmland .............................................................................................................. 62 V.4 Livestock ............................................................................................................................................ 65 V.5 Fisheries ............................................................................................................................................. 65 V.6 Income Portfolio And Economic Benefits Of Nam Hinboun River .......................................... 67 V.7. Conclusions: Sensitivity Of Water Uses And Users To Changes In River Water ................... 70
VI. RECOMMENDATIONS: HOW TO SUSTAIN WATER BENEFITS FOR LOCAL COMMUNITIES ................................................................................................................................ 71

4
Figures and Tables
Figure I.1: Organizing Framework of the MK2 Project on Water Valuation ................................................................. 8
Figure II.1: Map of the Nam Theun/Nam Kading Watershed and Rivers ...................................................................... 9
Figure II.2: Cross Section Layout of the Theun-Hinboun Expansion Project (THPC Web 2013) ..................... 11
Figure II.3: Overview of the Theun-Hinboun Power Company Projects (THPC 2012b) ...................................... 11
Figure II.4: The THXP Impact Zones Defined by the THPC (Norplan 2008b) ........................................................... 13
Figure II.5: Monthly Operating Levels at Nam Gnouang Reservoir ............................................................................... 16
Figure III.1: Original location of the villages upstream of the dam and the resettlement site .......................... 19
Figure III.2: Location of the villages downstream of the powerhouse ......................................................................... 21
Figure IV.1: Population Ethnicity .................................................................................................................................................. 25
Figure IV.2: Level of Education ...................................................................................................................................................... 26
Figure IV.3: Sources of Water Supply after Resettlement .................................................................................................. 28
Figure IV.4: Ease of access to sources of water before and after resettlement ........................................................ 30
Figure IV.5: Water consumption before and after resettlement (liters/household/day) ................................... 30
Figure IV.6: Total water collection time before and after resettlement per week (total number of hours per week) ...................................................................................................................................................................................... 32
Figure IV.7: Distribution of Economic Benefits of Reduced Water Collection Time across All Villages........ 32
Figure IV.8: Distribution of Farmland by Plot Size before Resettlement .................................................................... 33
Figure IV.9: Distribution of Farmland by Plot Size by Village .......................................................................................... 34
Figure IV.10: Share of Crops in Total Harvest and Total Home Consumption .......................................................... 35
Figure IV.11: Share of Crop for Home Consumption ............................................................................................................ 35
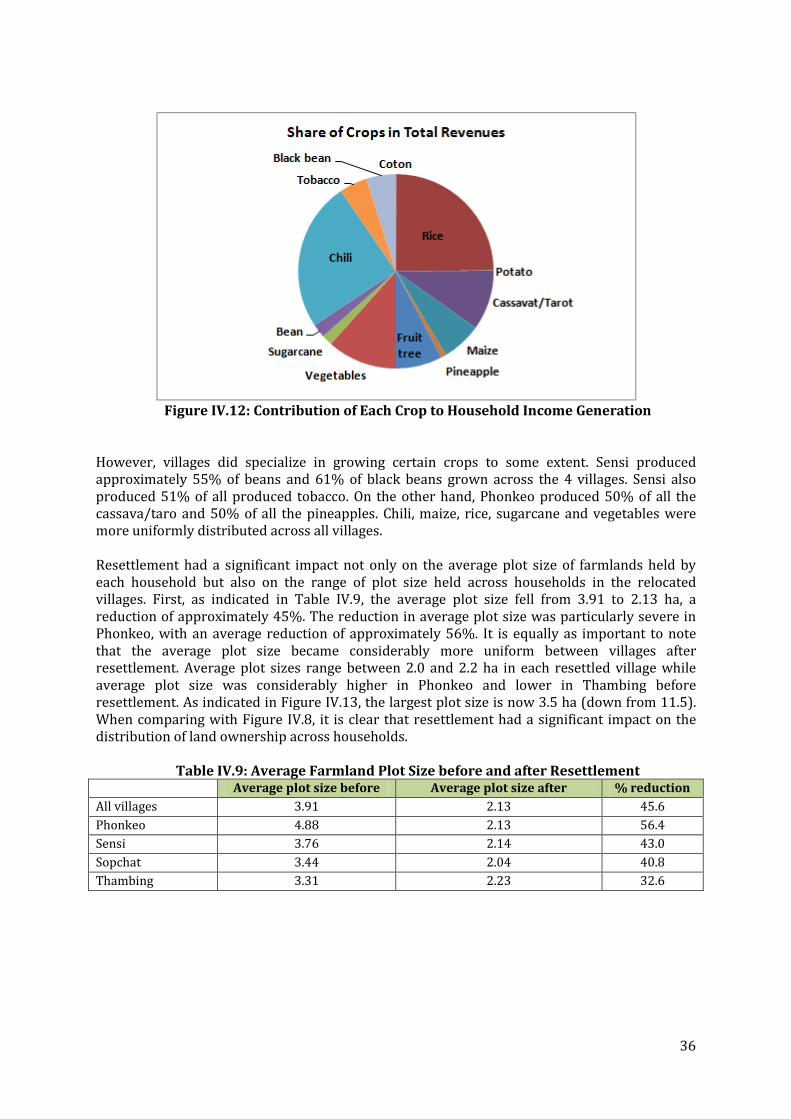
Figure IV.12: Contribution of Each Crop to Household Income Generation .............................................................. 36
Figure IV.13: Distribution of Farmland by Plot Size after Resettlement ..................................................................... 37
Figure IV.14: Share of Crops in Total Harvest Before (left) and After Resettlement (right) ............................. 38
Figure IV.15: Loss of Total Household Income versus Loss of Farmland ................................................................... 40
Figure IV.16: Total number of livestock before and after resettlement by livestock type .................................. 41
Figure IV.17: Total number of livestock before and after resettlement by village ................................................. 42
Figure IV.18: Total Fish Catch before Resettlement (kg) ................................................................................................... 43
Figure IV.19: Share of Fisheries Catch across Villages ........................................................................................................ 43
Figure IV.20: Average Monthly Fish Catch per Household Before Resettlement .................................................... 44

5
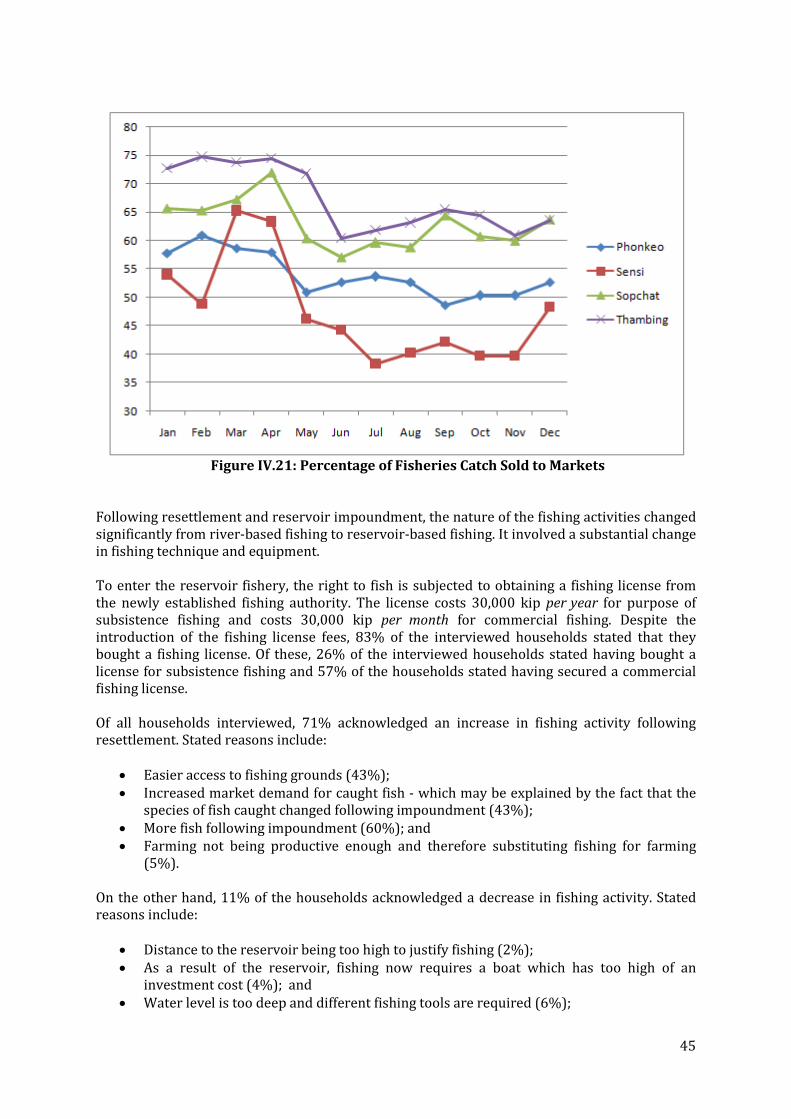
Figure IV.21: Percentage of Fisheries Catch Sold to Markets ........................................................................................... 45
Figure IV.22: Total Monthly Fish Catch before and after Resettlement (kg) ............................................................. 47
Figure IV.23: Share of Fisheries Catch before and after Resettlement ......................................................................... 47
Figure IV.24: Average monthly fish catch per household after resettlement (kg) .................................................. 48
Figure IV.25: Percentage of Fisheries Catch Sold to Markets after Resettlement ................................................... 48
Figure IV.26: Fisheries Catch Sold to Markets before and after Resettlement ......................................................... 49
Figure IV.27: Percentage of Households Engaging in the Collection of TFP and NTFP before and after Resettlement ................................................................................................................................................................................ 50
Figure IV.28: Number of Individuals Engaged in Various Non/Off Farm Activities ............................................... 51
Figure IV.29: Percentage of Inhabitants with Non/Off-Farm Activities ...................................................................... 51
Figure IV.30: Number of Individuals Engaged in Non/Off-Farm Activities before and after Resettlement 52
Figure IV.31: Income Levels by Income Group ....................................................................................................................... 53
Figure IV.32: Contribution to Income by Income Groups .................................................................................................. 54
Figure IV.33: Share of Income by Education Level ................................................................................................................ 54
Figure IV.34: Average household income after relocation ................................................................................................ 55
Figure IV.35: Share of Income Sources Before and After Resettlement ...................................................................... 55
Figure IV.36: Income before and after Relocation by Village ........................................................................................... 55
Figure IV.37: Changes in Income by Income Groups ............................................................................................................ 56
Figure IV.38: Changes in river/reservoir-related income by income groups ........................................................... 57
Figure IV.39: Share of river-based income before resettlement and reservoir-based income after resettlement ................................................................................................................................................................................. 58
Figure V.1: Share of water supply from different sources in dry and rainy seasons ............................................. 61
Figure V.2: Average fish catch/month/HH ............................................................................................................................... 66
Figure V.3: % share of average houshold income from different sources (including value of items consumed at home) .................................................................................................................................................................. 67
Figure V.4: Share of income sources (including the value of items consumed at home) ..................................... 68
Figure V.5: Share of river-based income .................................................................................................................................... 69
Table II.1: Characteristics of the Nam Gnouang Reservoir ................................................................................................ 17
Table III.1: Number of Households Resettled and Interviewed ...................................................................................... 20
Table III.2: Number of Households Interviewed .................................................................................................................... 20
6
Table III.3: Key Quantitative Livelihood Variables* ............................................................................................................. 21
Table IV.1: Surveyed Households ................................................................................................................................................ 24
Table IV.2: Sources of Water before Resettlement (number of households indicating the source of water) ........................................................................................................................................................................................................... 26
Table IV.3: Daily Average Water Consumption per Household before Resettlement (liters/household/day) ........................................................................................................................................................................................................... 27
Table IV.4: Domestic and Drinking Water Use (% of total water use) ......................................................................... 27
Table IV.5: Estimated Water Collection Time per Village – Before Resettlement ................................................... 27
Table IV.6: Sources of Water Supply after Resettlement (number of households using sources of water) 29
Table IV.7: Domestic and Drinking Water Use (% of total water use) ......................................................................... 29
Table IV.8: Estimated Water Collection Time per Village – After Resettlement ...................................................... 31
Table IV.9: Average Farmland Plot Size before and after Resettlement ...................................................................... 36
Table IV.10: Number of Households Reporting no Harvest .............................................................................................. 37
Table IV.11: Total Harvest before and after Resettlement ................................................................................................ 38
Table IV.12: Stated Reasons to Stop Cultivation .................................................................................................................... 39
Table IV.13: Number of Livestock before and after Resettlement ................................................................................. 41
Table IV.14: Trends in the Collection of TPFs and NTFPs after Resettlement .......................................................... 50
Table IV.15: Percentage Share of Household Income from Different Sources Before Resettlement .............. 53
Table V.1: % Households Ranking Nam Himboun River as “Important” or “Very Important” ......................... 62
Table V.2.: Types of Farming Plots Owned by Household.................................................................................................. 63
Table V.3: Status of land holding and irrigation ..................................................................................................................... 64
Table V.4. Average livestock ownership .................................................................................................................................... 65
Table V.5: Average household sensitivity to changes in the Nam Hinboun River by village .............................. 69

7
List of Acronyms
CPWF Challenge Program on Water and Food
EDL Electricité du Laos
EGAT Electricity Generating Authority of Thailand
FSL Full Supply Level
GWh Gigawatt hours
HH Household
ID Identification
Km Kilometer
MASL Meters Above Sea Level
MOL Minimum Operating Level
MRC Mekong River Commission
MW Megawatt
NTFP Non-Timber Forest Products
THPC Theun-Hinboun Power Company
THPP Theun-Hinboun Power Plant
THXP Theun-Hinboun Expansion Project
USD United States Dollar
VFG Village Fishery Group
WSI Water Storage Infrastructure
8
I. INTRODUCTION
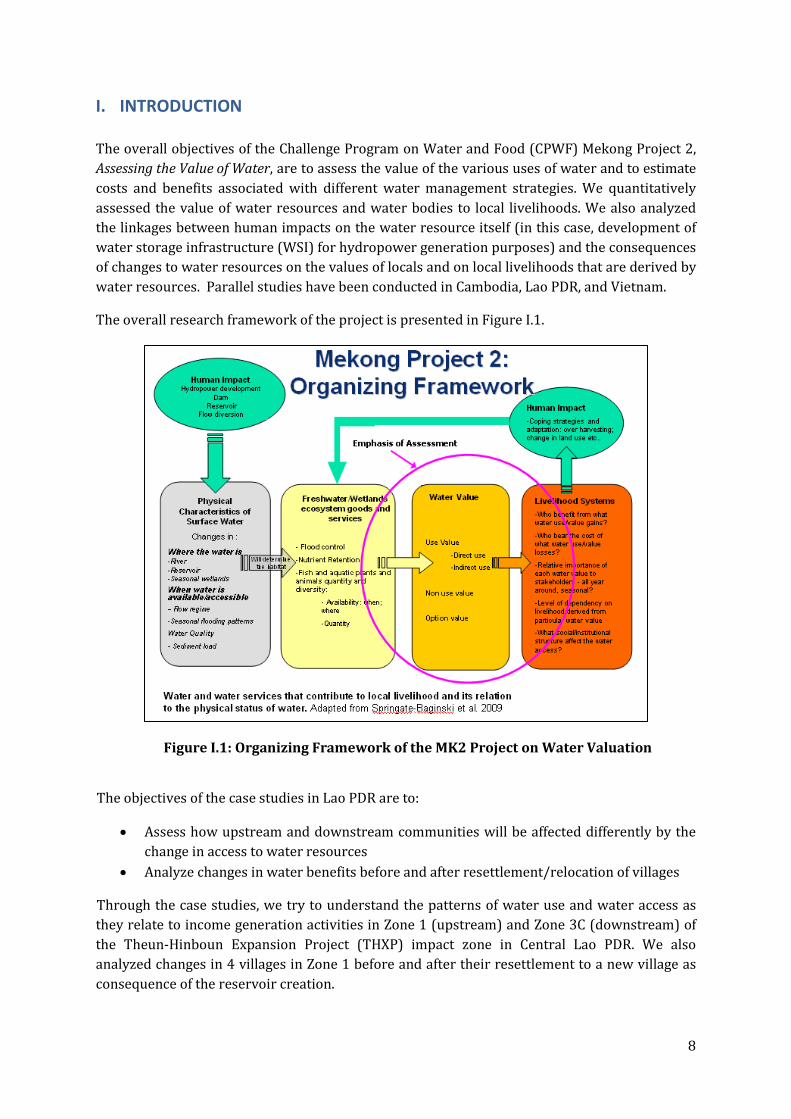
The overall objectives of the Challenge Program on Water and Food (CPWF) Mekong Project 2, Assessing the Value of Water, are to assess the value of the various uses of water and to estimate costs and benefits associated with different water management strategies. We quantitatively assessed the value of water resources and water bodies to local livelihoods. We also analyzed the linkages between human impacts on the water resource itself (in this case, development of water storage infrastructure (WSI) for hydropower generation purposes) and the consequences of changes to water resources on the values of locals and on local livelihoods that are derived by water resources. Parallel studies have been conducted in Cambodia, Lao PDR, and Vietnam.
The overall research framework of the project is presented in Figure I.1.
Figure I.1: Organizing Framework of the MK2 Project on Water Valuation
The objectives of the case studies in Lao PDR are to:
• Assess how upstream and downstream communities will be affected differently by the change in access to water resources
• Analyze changes in water benefits before and after resettlement/relocation of villages
Through the case studies, we try to understand the patterns of water use and water access as they relate to income generation activities in Zone 1 (upstream) and Zone 3C (downstream) of the Theun-Hinboun Expansion Project (THXP) impact zone in Central Lao PDR. We also analyzed changes in 4 villages in Zone 1 before and after their resettlement to a new village as consequence of the reservoir creation.

9
This case study does not intend to assess the impacts of resettlement or relocation on the overall livelihoods of the affected communities. Instead, the study compares the changes in water use patterns before and after the resettlement, including studying the dependency of local livelihoods on the river as opposed to the reservoir. The study provides insights on different adaptation strategies taken by the local communities during the transition period, which complement the livelihoods and income monitoring programs that the Theun-Hinboun Power Company (THPC) have already been conducting over several years.
The research questions outlined in the following section are based on this research framework and focus on the impacts from hydropower infrastructure.
1) What are the direct and indirect use values of water (as well as the non-use value of water) for local communities living upstream and downstream of hydropower dams?
2) Who are the different users of the water? What are the different uses? Is there a seasonal dimension?
3) How do changes in water values (+ or -) affect local population livelihoods?
For purpose of examining the above questions, a series of surveys were conducted in 4 villages upstream of the THXP, and 7 villages downstream of the project. In the next section, we present background information pertaining to the Theun-Hinboun hydropower project and its current layout, and the status of the expansion project. Details of the study methodology are presented in Section III. Survey results and key findings are presented and discussed in Section IV to V. Overall conclusions and recommendations are presented in Section VI.
II. CASE STUDY BACKGROUND
II.1. Description of Study Site
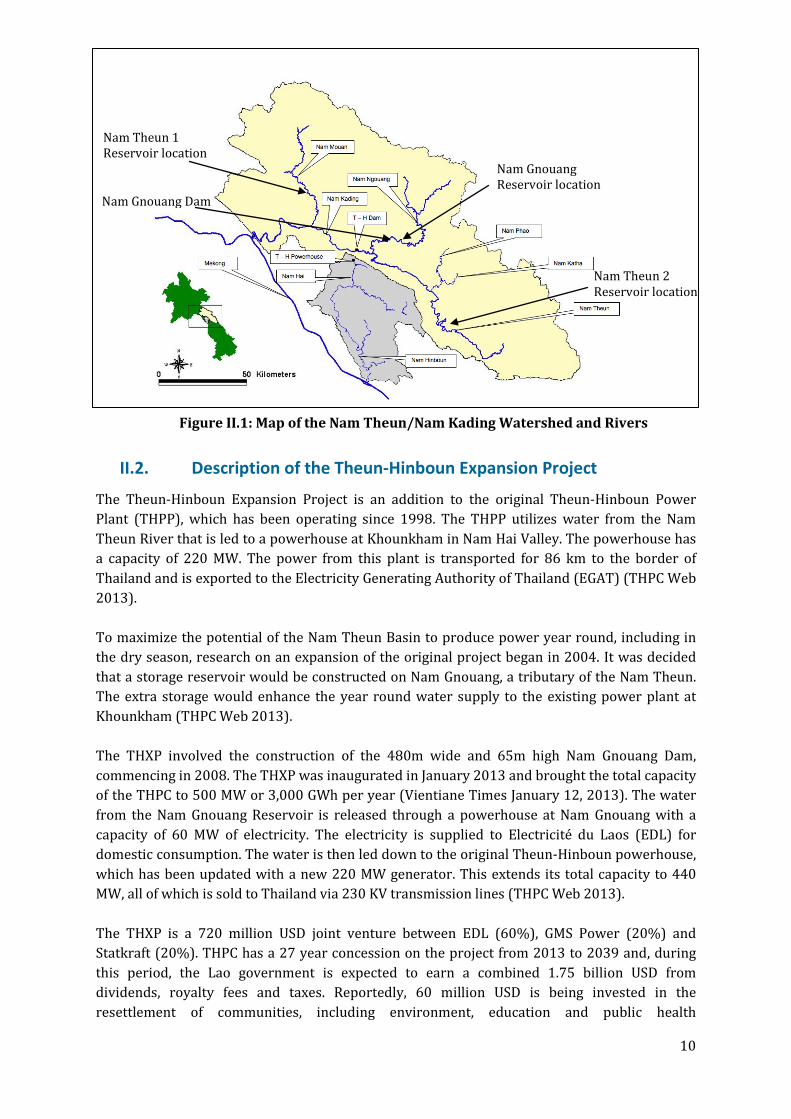
The study site of this project is located in Lao PDR within the Nam Theun/Nam Kading watershed in Khammouane and Bolikhamxay provinces east of Vientiane (see Figure II.1). Several hydropower dams and water storage infrastructures (WSI) have already been built or are under construction in the same catchment area, including the Nam Theun 1, Nam Theun 2, and Theun-Hinboun hydropower dams. The Theun-Hinboun Expansion Project (THXP) involves the construction of a dam and the creation of a reservoir on Nam Gnouang River, an upstream tributary of Nam Theun River. THXP was selected as a case study site because it will allow for an assessment of the impact of the WSI on the water usage and the values for the local communities before and after their relocations. The new Nam Gnouang Reservoir diverts stored water from the Nam Theun/Nam Kading watershed to the Theun-Hinboun powerhouse. From there, it is released in the Nam Hai/Nam Hinboun River into a different catchment basin, which receives an increased flow volume as a result of the project (Norplan 2008a).
10
II.2. Description of the Theun-Hinboun Expansion Project
The Theun-Hinboun Expansion Project is an addition to the original Theun-Hinboun Power Plant (THPP), which has been operating since 1998. The THPP utilizes water from the Nam Theun River that is led to a powerhouse at Khounkham in Nam Hai Valley. The powerhouse has a capacity of 220 MW. The power from this plant is transported for 86 km to the border of Thailand and is exported to the Electricity Generating Authority of Thailand (EGAT) (THPC Web 2013). To maximize the potential of the Nam Theun Basin to produce power year round, including in the dry season, research on an expansion of the original project began in 2004. It was decided that a storage reservoir would be constructed on Nam Gnouang, a tributary of the Nam Theun. The extra storage would enhance the year round water supply to the existing power plant at Khounkham (THPC Web 2013). The THXP involved the construction of the 480m wide and 65m high Nam Gnouang Dam, commencing in 2008. The THXP was inaugurated in January 2013 and brought the total capacity of the THPC to 500 MW or 3,000 GWh per year (Vientiane Times January 12, 2013). The water from the Nam Gnouang Reservoir is released through a powerhouse at Nam Gnouang with a capacity of 60 MW of electricity. The electricity is supplied to Electricité du Laos (EDL) for domestic consumption. The water is then led down to the original Theun-Hinboun powerhouse, which has been updated with a new 220 MW generator. This extends its total capacity to 440 MW, all of which is sold to Thailand via 230 KV transmission lines (THPC Web 2013). The THXP is a 720 million USD joint venture between EDL (60%), GMS Power (20%) and Statkraft (20%). THPC has a 27 year concession on the project from 2013 to 2039 and, during this period, the Lao government is expected to earn a combined 1.75 billion USD from dividends, royalty fees and taxes. Reportedly, 60 million USD is being invested in the resettlement of communities, including environment, education and public health
Nam Gnouang Reservoir location
Nam Theun 2 Reservoir location
Nam Theun 1 Reservoir location
Nam Gnouang Dam
Figure II.1: Map of the Nam Theun/Nam Kading Watershed and Rivers
11
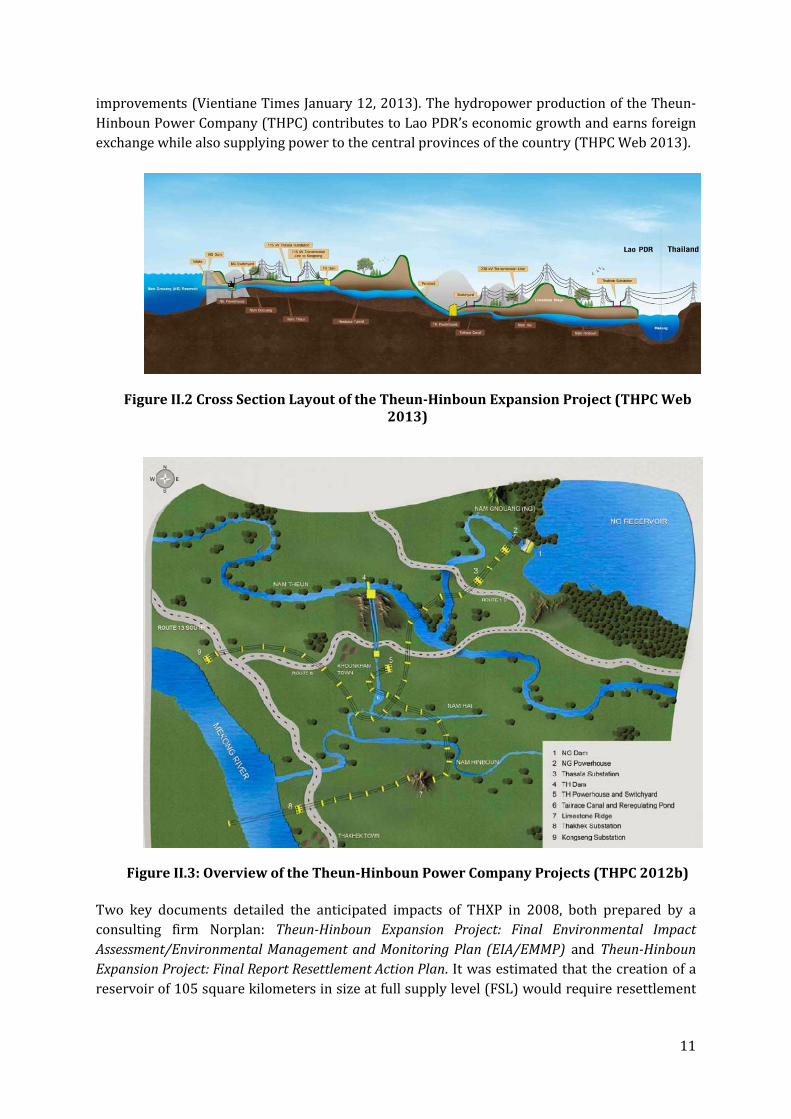
improvements (Vientiane Times January 12, 2013). The hydropower production of the Theun-Hinboun Power Company (THPC) contributes to Lao PDR’s economic growth and earns foreign exchange while also supplying power to the central provinces of the country (THPC Web 2013).
Figure II.2 Cross Section Layout of the Theun-Hinboun Expansion Project (THPC Web 2013)
Figure II.3: Overview of the Theun-Hinboun Power Company Projects (THPC 2012b) Two key documents detailed the anticipated impacts of THXP in 2008, both prepared by a consulting firm Norplan: Theun-Hinboun Expansion Project: Final Environmental Impact Assessment/Environmental Management and Monitoring Plan (EIA/EMMP) and Theun-Hinboun Expansion Project: Final Report Resettlement Action Plan. It was estimated that the creation of a reservoir of 105 square kilometers in size at full supply level (FSL) would require resettlement
12
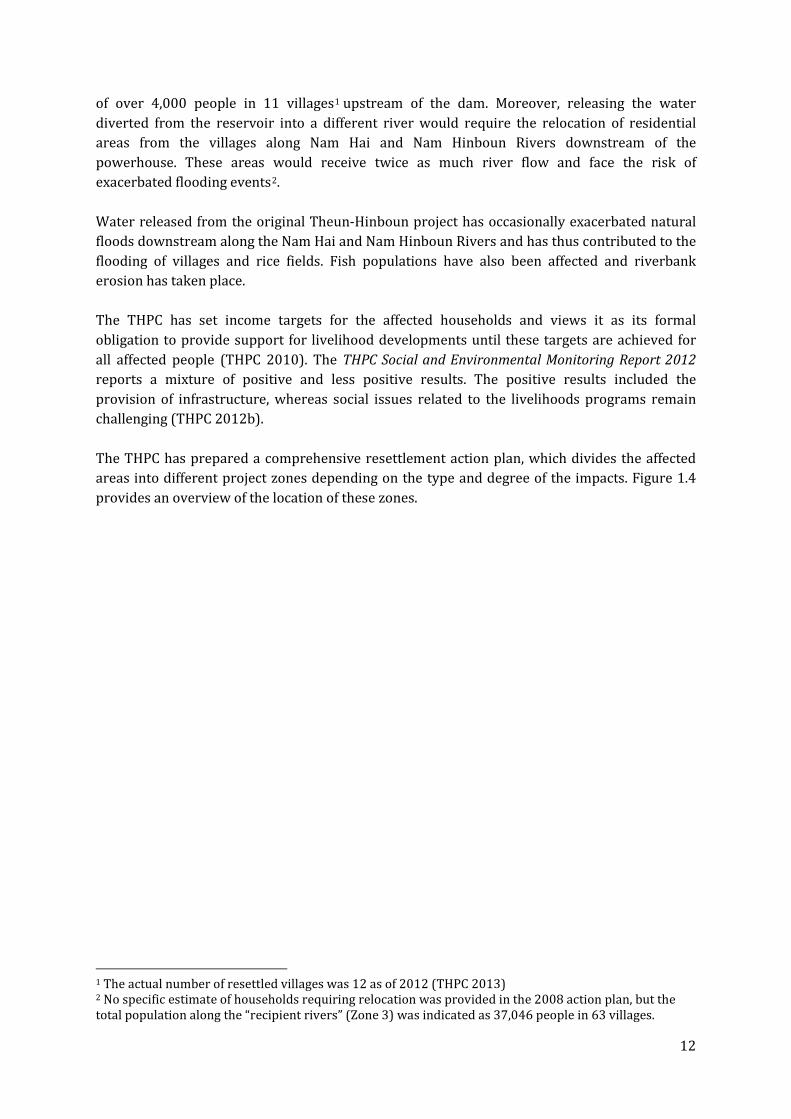
of over 4,000 people in 11 villages1 upstream of the dam. Moreover, releasing the water diverted from the reservoir into a different river would require the relocation of residential areas from the villages along Nam Hai and Nam Hinboun Rivers downstream of the powerhouse. These areas would receive twice as much river flow and face the risk of exacerbated flooding events2
.
Water released from the original Theun-Hinboun project has occasionally exacerbated natural floods downstream along the Nam Hai and Nam Hinboun Rivers and has thus contributed to the flooding of villages and rice fields. Fish populations have also been affected and riverbank erosion has taken place. The THPC has set income targets for the affected households and views it as its formal obligation to provide support for livelihood developments until these targets are achieved for all affected people (THPC 2010). The THPC Social and Environmental Monitoring Report 2012 reports a mixture of positive and less positive results. The positive results included the provision of infrastructure, whereas social issues related to the livelihoods programs remain challenging (THPC 2012b).
The THPC has prepared a comprehensive resettlement action plan, which divides the affected areas into different project zones depending on the type and degree of the impacts. Figure 1.4 provides an overview of the location of these zones.
1 The actual number of resettled villages was 12 as of 2012 (THPC 2013) 2 No specific estimate of households requiring relocation was provided in the 2008 action plan, but the total population along the “recipient rivers” (Zone 3) was indicated as 37,046 people in 63 villages.
13
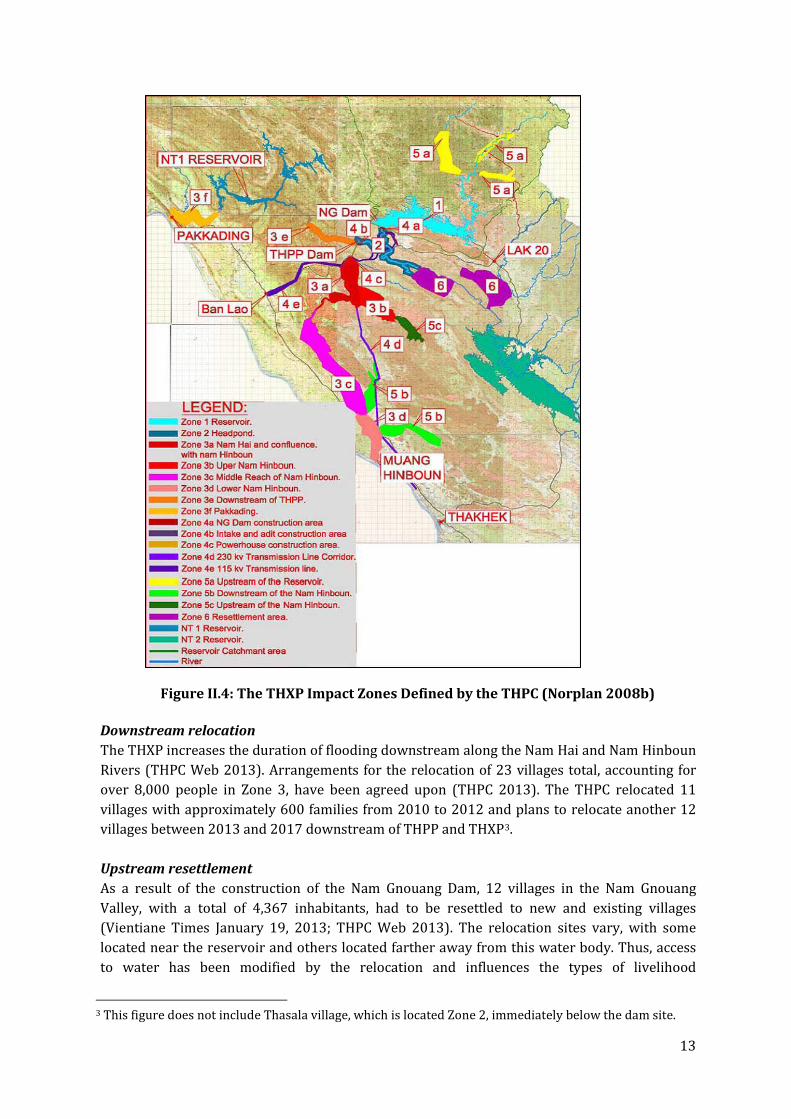
Figure II.4: The THXP Impact Zones Defined by the THPC (Norplan 2008b)
Downstream relocation The THXP increases the duration of flooding downstream along the Nam Hai and Nam Hinboun Rivers (THPC Web 2013). Arrangements for the relocation of 23 villages total, accounting for over 8,000 people in Zone 3, have been agreed upon (THPC 2013). The THPC relocated 11 villages with approximately 600 families from 2010 to 2012 and plans to relocate another 12 villages between 2013 and 2017 downstream of THPP and THXP3
.
Upstream resettlement As a result of the construction of the Nam Gnouang Dam, 12 villages in the Nam Gnouang Valley, with a total of 4,367 inhabitants, had to be resettled to new and existing villages (Vientiane Times January 19, 2013; THPC Web 2013). The relocation sites vary, with some located near the reservoir and others located farther away from this water body. Thus, access to water has been modified by the relocation and influences the types of livelihood
3 This figure does not include Thasala village, which is located Zone 2, immediately below the dam site.
14
opportunities available. While some new opportunities may arise, the household livelihood portfolios will expectedly be affected negatively by the loss of access to the natural river and its resources, such as fish and other aquatic animals.
Support programs on education, health, infrastructure and livelihoods Since 2009, people in the 12 upstream villages who have been moved to new areas have received benefits in the form of housing, facilities and services. These include land, electricity, water and sanitation, tools, as well as access to infrastructure, primary schools and clinics. A resettlement program is in place to support improvements in agriculture and other livelihood activities. Demonstration centers and nurseries have been set up in order to aid with agricultural development and irrigation systems have been renovated, built and expanded upon in the resettled and relocation villages (THPC Web 2013). The THPC cooperates with district health authorities and seeks to improve health care and awareness through free services. As part of these efforts, the company has health monitors in each village and plans to introduce a community program on hygiene and nutrition practices. To help facilitate education in the communities, new primary schools were built and equipped in the villages and the THPC works with the district education offices (THPC Web 2013). THPC recognizes that by providing the communities with better opportunities for the future, infrastructure is only the beginning of a “gradual process of development that requires long-term input to help people adapt to new livelihoods and establish sustainable systems.” (THPC Web 2013) The THPC has a Social and Environmental Department that works with resettled, relocated and host village families. These families are offered support for various income-generating activities, with a great deal of focus on farming. Rice support is provided to families that are unable to grow enough rice in order to ensure food security (THPC Web 2013). The process of resettlement interrupts existing livelihoods and may jeopardize certain income generating opportunities. In her examination of resettlements along the Nam Gnouang River, Katus (2012) found that the ability of villagers to benefit from resettlement is highly linked to their proximity to the river (Katus 2012). Fisheries and environment The fisheries in the river systems of the project area have already been impacted by the original THPP project in the form of fish population declines. This is an unfortunate impact in a region where fish provides an important part of the diet for most people. The THPC has established a Fishery Management and Mitigation Team that works to minimize the impacts through the management of the existing and new reservoir fisheries and through studies of the aquatic ecosystems in the area (THPC Web 2013). In the first period since the creation of the Nam Gnouang Reservoir, the reservoir can offer an economic opportunity for some villagers who are able to access it. The villages have been given the task of fisheries management along with the district authorities through the establishment of Village Fishery Groups (VFGs) (THPC Web 2013). Many other villagers with previous access to the river fishery are unable to utilize this reservoir resource easily because their new
15
resettlement villages are located far from the reservoir. Fishing and fish trading licenses have also been introduced and are required to participate in the reservoir fisheries. The water quality of the rivers upstream and downstream of the Nam Gnouang Reservoir is monitored at a purpose-built laboratory at Kheunkham. Among other tests, levels of dissolved oxygen, water temperature, amounts of erosion, and sediment transport are checked in order to indicate any threats to the environment. Hydrologic data is compiled into a database that covers the entire project area of the THXP, which enables the company to optimize operations of the reservoir and power stations. The quality of the water supply to resettlement and relocation villages is also checked regularly (THPC Web 2013).
Erosion monitoring Changes in water levels caused by power production, especially in the dry season, have led to riverbank erosion and changes to sediment loads. River morphology and riverbank erosion are monitored to enable mitigation of potential problems caused by altered river flows, sediment transportation and erosion downstream of the power plant along the Nam Hai and Nam Hinboun Rivers. A GIS-based system is in place to track possible changes to “top-of-bank” and cross-sections along the rivers, which will enable compensation in case of impacts to peoples’ lands (THPC Web 2013).
II.3. CHARACTERISTICS OF WATER RESOURCES AND SEASONAL RIVER FLOW PATTERNS
In MK Project 3, Optimizing Cascades of Hydropower, and MK Project 1, Optimizing Water Management for Livelihoods, information on the operational plans of hydropower projects was researched and a series of hydrological modeling exercises were conducted. These exercises covered various aspects characterizing the rainfall, river flows, catchment and reservoir hydrology for the BDC Mekong study areas in Cambodia, Lao PDR, and Vietnam (Räsänen and Kummu 2013). The MK3 report summarizes the seasonal characteristics of the Nam Hinboun/Nam Hai rivers already under the influence of the original THPP operation, based on data from the 2000s. The local rainfall pattern in the Nam Theun Basin is very complex. It is influenced by different weather systems from the southwest and the east of the region (Norplan 2008a, cited in Sioudom 2013). River flow regimes in this area are largely driven by a monsoon climate: a wet season begins in May and is followed by rises in river flow that peak from August to September. The flow levels decline back to low levels from November, the start of the dry season. During the dry season, there is scarce or almost no rainfall and the lowest water levels are experienced at the end of dry season in April. The region is also is known to be affected by late wet season tropical cyclones which resulted in extreme flood events in 2002 and 2011 (Räsänen and Kummu 2013). In addition to yearly seasonal fluctuation in rainfall and river flow, the region experiences inter-annual variability in rainfall. According to Räsänen and Kummu (2013) inter-annual alternations between very dry years and very wet years have increased and can be partially associated to the El Niño – Southern Oscillation (ENSO).

16
The main function of the Nam Gnouang Reservoir is to store water during the rainy season that can be used to generate electricity during the dry season. Figure II.5 shows the seasonal changes in the water level of the reservoir, as expressed in meters above sea level (MASL). The water level of the reservoir is affected by the operational schedule of the hydropower plant, as well as the rainfall and the inflow from the catchment upstream. Figure II.6 provides further details on the size of the reservoir and its fluctuation. For example, the water level when the reservoir is fully stored with water is 455 MASL, while the water level when the reservoir is at its lowest storage level is 420 MASL. This means that there is generally a 35 meter difference in the water level between the rainy season and dry season. The areal extent of the reservoir also fluctuates significantly, between 133.5 Km2 at Full Supply Level (FSL) and 47.5 Km2 at Minimum Operating Level (MOL). The drawdown area exposed at MOL is 86 Km2.
Figure II.5: Monthly Operating Levels at Nam Gnouang Reservoir4
4 MK1 calculations based on a set of hydropower operation assumptions.
17
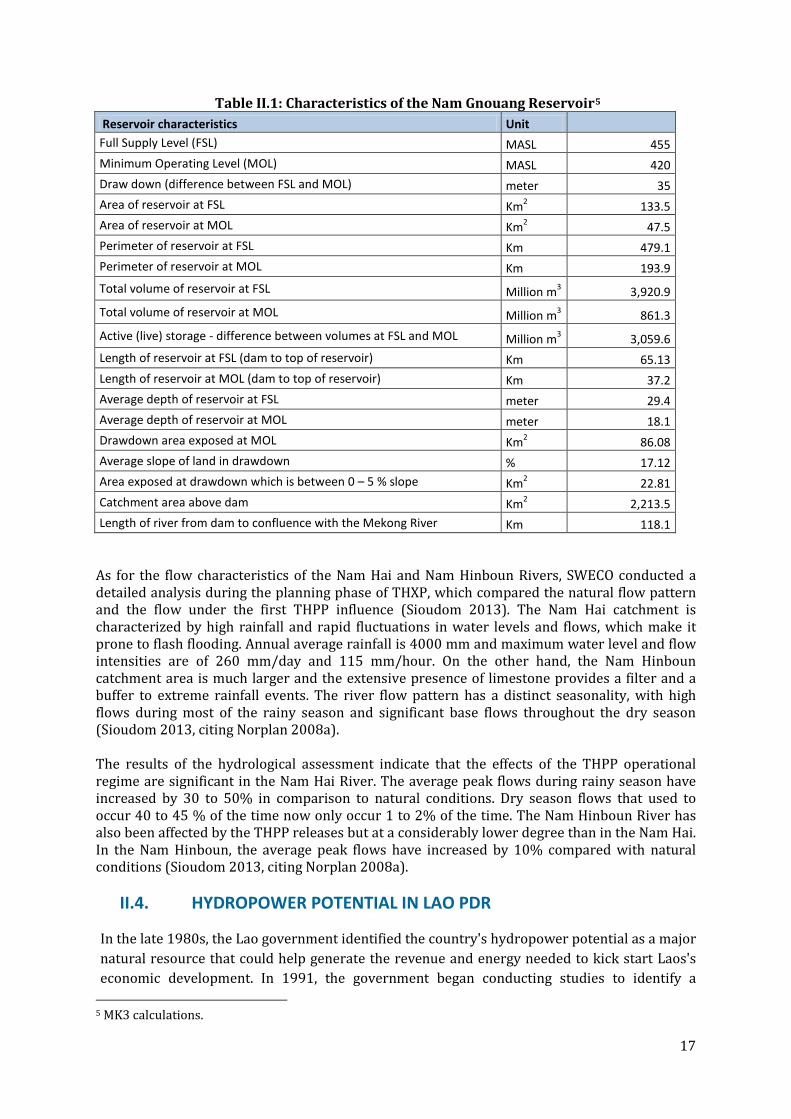
Table II.1: Characteristics of the Nam Gnouang Reservoir5
Reservoir characteristics
Unit Full Supply Level (FSL) MASL 455
Minimum Operating Level (MOL) MASL 420 Draw down (difference between FSL and MOL) meter 35 Area of reservoir at FSL Km2 133.5 Area of reservoir at MOL Km2 47.5 Perimeter of reservoir at FSL Km 479.1 Perimeter of reservoir at MOL Km 193.9 Total volume of reservoir at FSL Million m3 3,920.9 Total volume of reservoir at MOL Million m3 861.3 Active (live) storage - difference between volumes at FSL and MOL Million m3 3,059.6 Length of reservoir at FSL (dam to top of reservoir) Km 65.13 Length of reservoir at MOL (dam to top of reservoir) Km 37.2 Average depth of reservoir at FSL meter 29.4 Average depth of reservoir at MOL meter 18.1 Drawdown area exposed at MOL Km2 86.08 Average slope of land in drawdown % 17.12 Area exposed at drawdown which is between 0 – 5 % slope Km2 22.81 Catchment area above dam Km2 2,213.5 Length of river from dam to confluence with the Mekong River Km 118.1
As for the flow characteristics of the Nam Hai and Nam Hinboun Rivers, SWECO conducted a detailed analysis during the planning phase of THXP, which compared the natural flow pattern and the flow under the first THPP influence (Sioudom 2013). The Nam Hai catchment is characterized by high rainfall and rapid fluctuations in water levels and flows, which make it prone to flash flooding. Annual average rainfall is 4000 mm and maximum water level and flow intensities are of 260 mm/day and 115 mm/hour. On the other hand, the Nam Hinboun catchment area is much larger and the extensive presence of limestone provides a filter and a buffer to extreme rainfall events. The river flow pattern has a distinct seasonality, with high flows during most of the rainy season and significant base flows throughout the dry season (Sioudom 2013, citing Norplan 2008a). The results of the hydrological assessment indicate that the effects of the THPP operational regime are significant in the Nam Hai River. The average peak flows during rainy season have increased by 30 to 50% in comparison to natural conditions. Dry season flows that used to occur 40 to 45 % of the time now only occur 1 to 2% of the time. The Nam Hinboun River has also been affected by the THPP releases but at a considerably lower degree than in the Nam Hai. In the Nam Hinboun, the average peak flows have increased by 10% compared with natural conditions (Sioudom 2013, citing Norplan 2008a).
II.4. HYDROPOWER POTENTIAL IN LAO PDR
In the late 1980s, the Lao government identified the country's hydropower potential as a major natural resource that could help generate the revenue and energy needed to kick start Laos's economic development. In 1991, the government began conducting studies to identify a
5 MK3 calculations.

18
suitable project that could both provide power to export and power to supply locally for the central part of the country. The power potential of the Nam Theun River was recognized and the original Theun-Hinboun project (THPP) was launched in order to support Lao economic growth by enhancing foreign exchange earnings through the export of electricity (THPC Web 2013). The mountainous landscape and abundant rivers have provided Lao PDR with a rich potential for hydropower development, which the country highly prioritizes with many projects being planned and developed. While most projects are on tributaries, 9 dams are planned for the mainstream of the Mekong River with the Xayaburi Dam being constructed as the first of these International Rivers 2013). The mainstream dams are controversial as they are expected to have significant negative regional impacts on fisheries and agriculture. The economic gains from mainstream hydropower, however, are considerable for Lao PDR. The country will likely receive over 70% of the power benefits that can be harvested from the Mekong River out of the four MRC countries, Thailand, Lao PDR, Cambodia and Vietnam (ICEM 2010).
The installed hydropower capacity of Lao PDR has developed from approximately 200 MW in 1996 to nearly 3,000 MW by early 2013. This only utilizes about 10% of the identified potential of between 23,000 to 30,000 MW (MEM 2013; MEM 2012; Xinhua June 2012; Vientiane Times January 16, 2013). The demand for electricity is rapidly increasing due to economic growth in the region and the country aims to increase its hydropower output to 3,856 MW by 2015. This will provide its people with cheaper electricity and will earn income from electricity exports (Vientiane Times January 16, 2013; Xinhua June 2012). In the country’s latest update on the status of their electric power plants, the Lao Ministry of Energy and Mines reported 16 operational projects with a total installed capacity of 2,948.5 MW. In addition to this, projects with a combined capacity of 5,053 MW are currently under construction. The last of these 14 projects is expected to be operational in 2019. Another 24 projects with a total capacity of 5,810 MW are at the planning stage and 30 projects with a total capacity of 7,413 MW are at the feasibility stage (MEM 2012).
III. CASE STUDY METHODOLOGY
The key drivers of change in water resources in the context of this case study are:
• Creation of the Nam Gnouang Reservoir and resettlement of villages upstream of the dam
• Release of diverted water from the Nam Gnouang Reservoir into the Nam Hai/Nam Hinboun Rivers downstream of the dam
To answer the research questions presented in earlier section, we first conducted secondary data and literature reviews. We then held stakeholder consultations and focus group discussions at the village level with the purpose of identifying key water resource management issues. Afterwards, household surveys were used to collect more detailed household level information. Both quantitative and qualitative data were collected.
19
Upstream Case Study
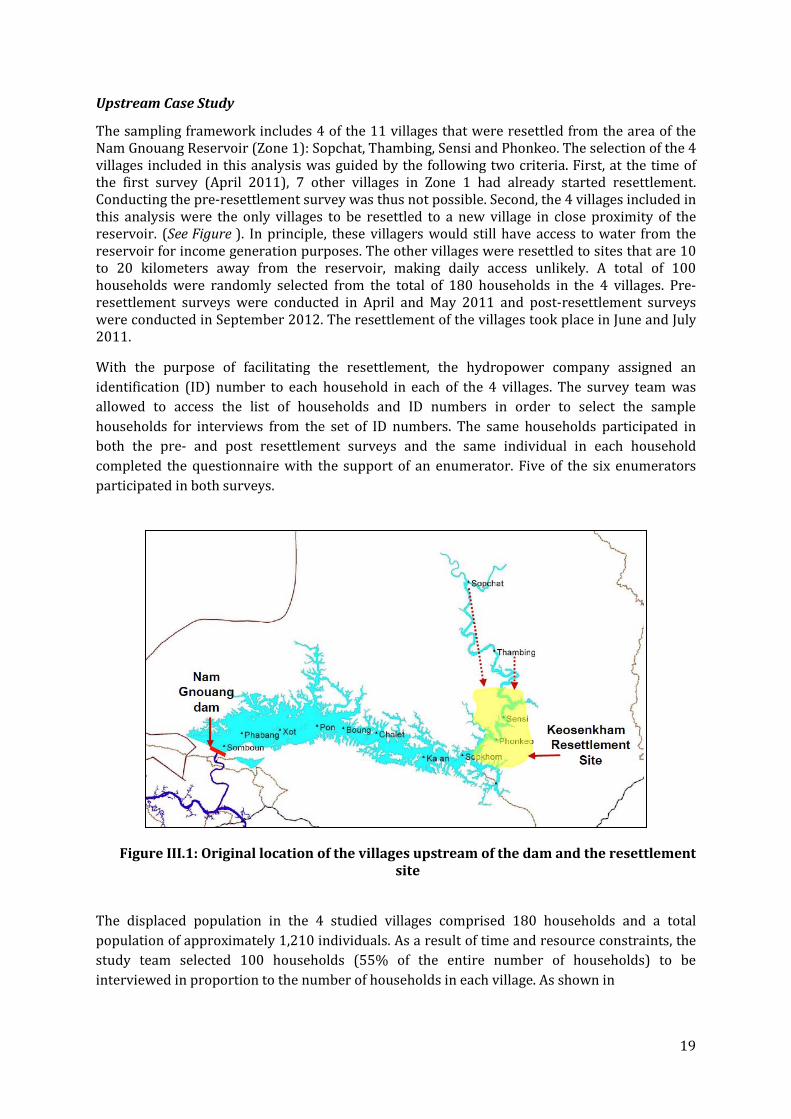
The sampling framework includes 4 of the 11 villages that were resettled from the area of the Nam Gnouang Reservoir (Zone 1): Sopchat, Thambing, Sensi and Phonkeo. The selection of the 4 villages included in this analysis was guided by the following two criteria. First, at the time of the first survey (April 2011), 7 other villages in Zone 1 had already started resettlement. Conducting the pre-resettlement survey was thus not possible. Second, the 4 villages included in this analysis were the only villages to be resettled to a new village in close proximity of the reservoir. (See Figure ). In principle, these villagers would still have access to water from the reservoir for income generation purposes. The other villages were resettled to sites that are 10 to 20 kilometers away from the reservoir, making daily access unlikely. A total of 100 households were randomly selected from the total of 180 households in the 4 villages. Pre-resettlement surveys were conducted in April and May 2011 and post-resettlement surveys were conducted in September 2012. The resettlement of the villages took place in June and July 2011.
With the purpose of facilitating the resettlement, the hydropower company assigned an identification (ID) number to each household in each of the 4 villages. The survey team was allowed to access the list of households and ID numbers in order to select the sample households for interviews from the set of ID numbers. The same households participated in both the pre- and post resettlement surveys and the same individual in each household completed the questionnaire with the support of an enumerator. Five of the six enumerators participated in both surveys.
Figure III.1: Original location of the villages upstream of the dam and the resettlement site
The displaced population in the 4 studied villages comprised 180 households and a total population of approximately 1,210 individuals. As a result of time and resource constraints, the study team selected 100 households (55% of the entire number of households) to be interviewed in proportion to the number of households in each village. As shown in

20
Table III.1, this resulted in the number of interviewed households per village ranging from 21 in Sensi to 30 in Phonkeo.
Table III.1: Number of Households Resettled and Interviewed
Village Number of households
resettled
Number of households interviewed
% total number of interviewed households
Sopchat 49 27 28% Thambing 39 22 21% Sensi 38 21 21% Phonkeo 54 30 30%
Total 180 100 100
Downstream Case Study6
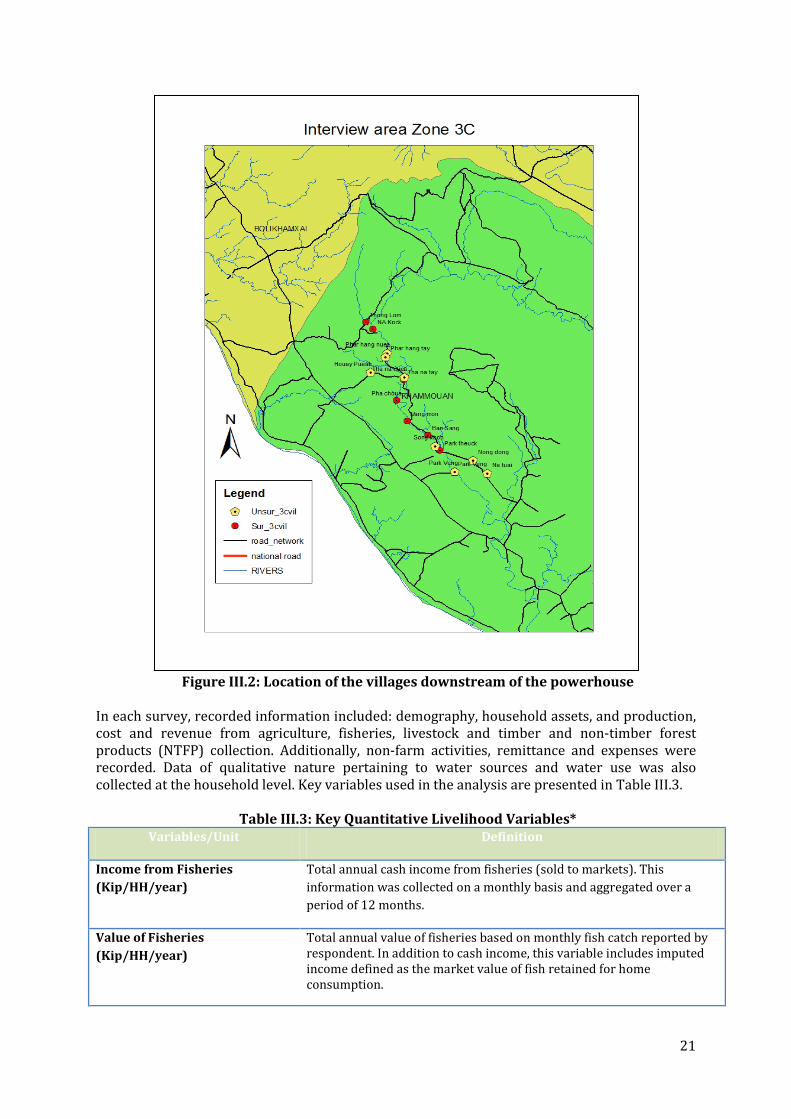
We selected 7 villages out of the total 16 villages in the middle reach of Nam Hinboun (Zone 3C), where villages will be affected by exacerbated flooding. The 7 villages were selected because they were located adjacent to the Nam Hinboun River and all were to be slated for relocation in the coming years. (See
Figure ) 156 households were randomly selected from the total of 478 households in these villages and the survey was conducted in January 2012.
Table III.2: Number of Households Interviewed Village Number of households
to be relocated Number of households
interviewed % total number of
interviewed households
Thonglom 86 27 17% Nakok 115 37 24% Thanatai 95 30 19% Phajoa 21 7 4% Vangmon 68 21 13% Pak Thuek 43 18 12% Pakveng 50 16 10% Total 478 156 100
Further details on the characteristics of the surveyed villages are presented in Section IV and V.
6 We had originally planned to survey 100 households in Zone 3C and survey another 100 households in a part of Zone 5B (Downstream of the Nam Hinboun) along a tributary to the Nam Hinboun River. The expectation was that Zone 5B would serve as a control site to Zone 3C, that was unaffected by a hydropower dam upstream. However, this idea was abandoned when it was discovered during a field visit that the area had been heavily polluted by mining operations upstream and the local communities no longer used the river.
21
Figure III.2: Location of the villages downstream of the powerhouse
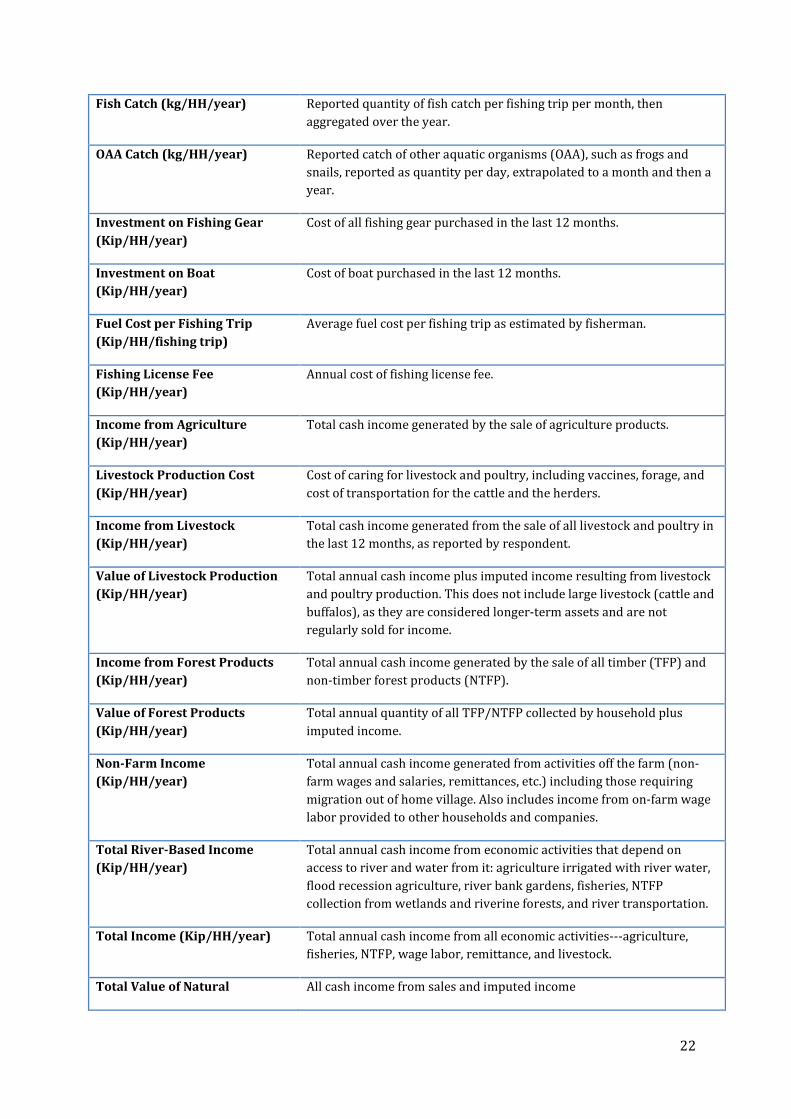
In each survey, recorded information included: demography, household assets, and production, cost and revenue from agriculture, fisheries, livestock and timber and non-timber forest products (NTFP) collection. Additionally, non-farm activities, remittance and expenses were recorded. Data of qualitative nature pertaining to water sources and water use was also collected at the household level. Key variables used in the analysis are presented in Table III.3.
Table III.3: Key Quantitative Livelihood Variables* Variables/Unit Definition
Income from Fisheries (Kip/HH/year)
Total annual cash income from fisheries (sold to markets). This information was collected on a monthly basis and aggregated over a period of 12 months.
Value of Fisheries (Kip/HH/year)
Total annual value of fisheries based on monthly fish catch reported by respondent. In addition to cash income, this variable includes imputed income defined as the market value of fish retained for home consumption.
22
Fish Catch (kg/HH/year) Reported quantity of fish catch per fishing trip per month, then aggregated over the year.
OAA Catch (kg/HH/year) Reported catch of other aquatic organisms (OAA), such as frogs and snails, reported as quantity per day, extrapolated to a month and then a year.
Investment on Fishing Gear (Kip/HH/year)
Cost of all fishing gear purchased in the last 12 months.
Investment on Boat (Kip/HH/year)
Cost of boat purchased in the last 12 months.
Fuel Cost per Fishing Trip (Kip/HH/fishing trip)
Average fuel cost per fishing trip as estimated by fisherman.
Fishing License Fee (Kip/HH/year)
Annual cost of fishing license fee.
Income from Agriculture (Kip/HH/year)
Total cash income generated by the sale of agriculture products.
Livestock Production Cost (Kip/HH/year)
Cost of caring for livestock and poultry, including vaccines, forage, and cost of transportation for the cattle and the herders.
Income from Livestock (Kip/HH/year)
Total cash income generated from the sale of all livestock and poultry in the last 12 months, as reported by respondent.
Value of Livestock Production (Kip/HH/year)
Total annual cash income plus imputed income resulting from livestock and poultry production. This does not include large livestock (cattle and buffalos), as they are considered longer-term assets and are not regularly sold for income.
Income from Forest Products (Kip/HH/year)
Total annual cash income generated by the sale of all timber (TFP) and non-timber forest products (NTFP).
Value of Forest Products (Kip/HH/year)
Total annual quantity of all TFP/NTFP collected by household plus imputed income.
Non-Farm Income (Kip/HH/year)
Total annual cash income generated from activities off the farm (non-farm wages and salaries, remittances, etc.) including those requiring migration out of home village. Also includes income from on-farm wage labor provided to other households and companies.
Total River-Based Income (Kip/HH/year)
Total annual cash income from economic activities that depend on access to river and water from it: agriculture irrigated with river water, flood recession agriculture, river bank gardens, fisheries, NTFP collection from wetlands and riverine forests, and river transportation.
Total Income (Kip/HH/year) Total annual cash income from all economic activities---agriculture, fisheries, NTFP, wage labor, remittance, and livestock.
Total Value of Natural All cash income from sales and imputed income

23
Resources (Kip/HH/year)
Total Value of All Economic Activities (Kip/HH/year)
Total value of all economic activities and outputs, including fisheries, livestock, forests, agriculture, including imputed income for those products for which the information is available.
* Kip is the currency of Lao PDR. At the time of the study, the exchange rate averaged 8,000 Kip per US dollar. HH: Household; Kg: Kilogram
24
IV. RESULTS OF UPSTREAM CASE STUDY As shown in Figure , 4 villages were relocated: Sopchat, Thambing, Sensi, and Phonkeo. The resettlement site is in close proximity to Phonkeo, although on the other side of the Nam Gnouang River. While all of the villages are now grouped together in a single contiguous area of resettlement site, Phonkeo and Sensi are located in proximity to one another along the Nam Gnouang Reservoir while Sopchat and Thambing were relocated together further away from the reservoir. Before presenting and discussing the estimated impacts of the resettlement, socio-economic characteristics of interest are briefly presented in the next section.
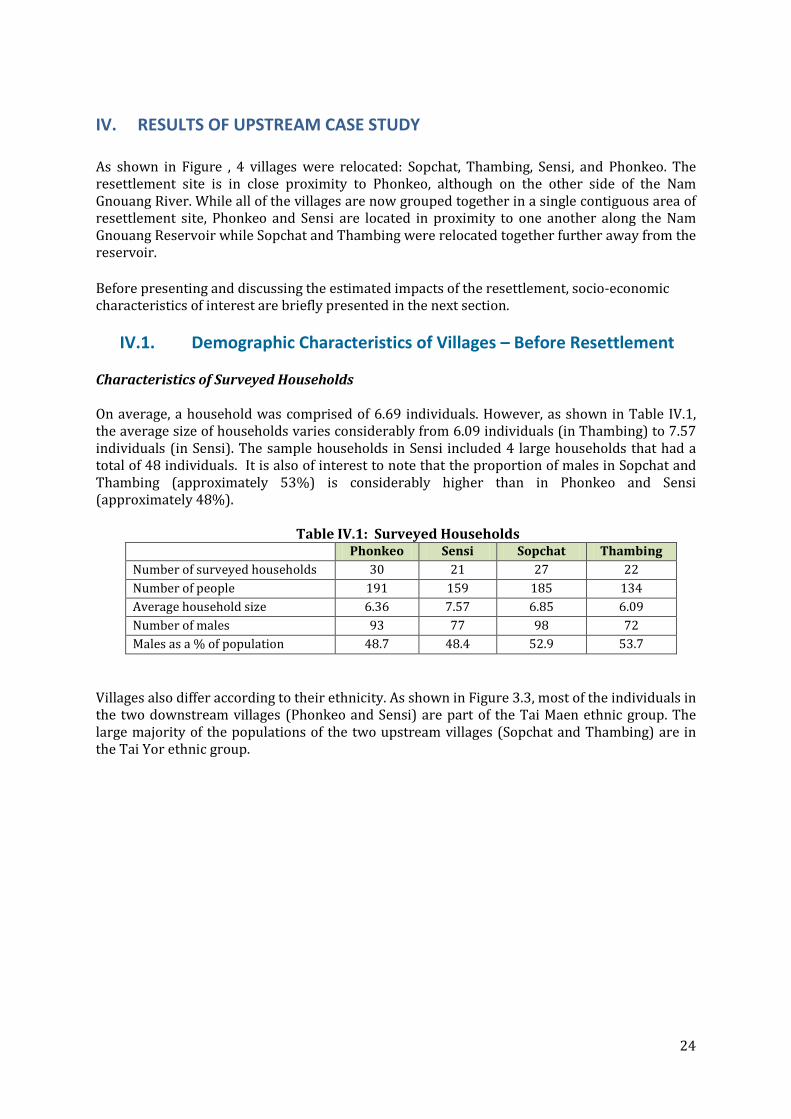
IV.1. Demographic Characteristics of Villages – Before Resettlement Characteristics of Surveyed Households On average, a household was comprised of 6.69 individuals. However, as shown in Table IV.1, the average size of households varies considerably from 6.09 individuals (in Thambing) to 7.57 individuals (in Sensi). The sample households in Sensi included 4 large households that had a total of 48 individuals. It is also of interest to note that the proportion of males in Sopchat and Thambing (approximately 53%) is considerably higher than in Phonkeo and Sensi (approximately 48%).
Table IV.1: Surveyed Households
Phonkeo Sensi Sopchat Thambing Number of surveyed households 30 21 27 22 Number of people 191 159 185 134 Average household size 6.36 7.57 6.85 6.09 Number of males 93 77 98 72 Males as a % of population 48.7 48.4 52.9 53.7
Villages also differ according to their ethnicity. As shown in Figure 3.3, most of the individuals in the two downstream villages (Phonkeo and Sensi) are part of the Tai Maen ethnic group. The large majority of the populations of the two upstream villages (Sopchat and Thambing) are in the Tai Yor ethnic group.

25
Figure IV.1: Population Ethnicity
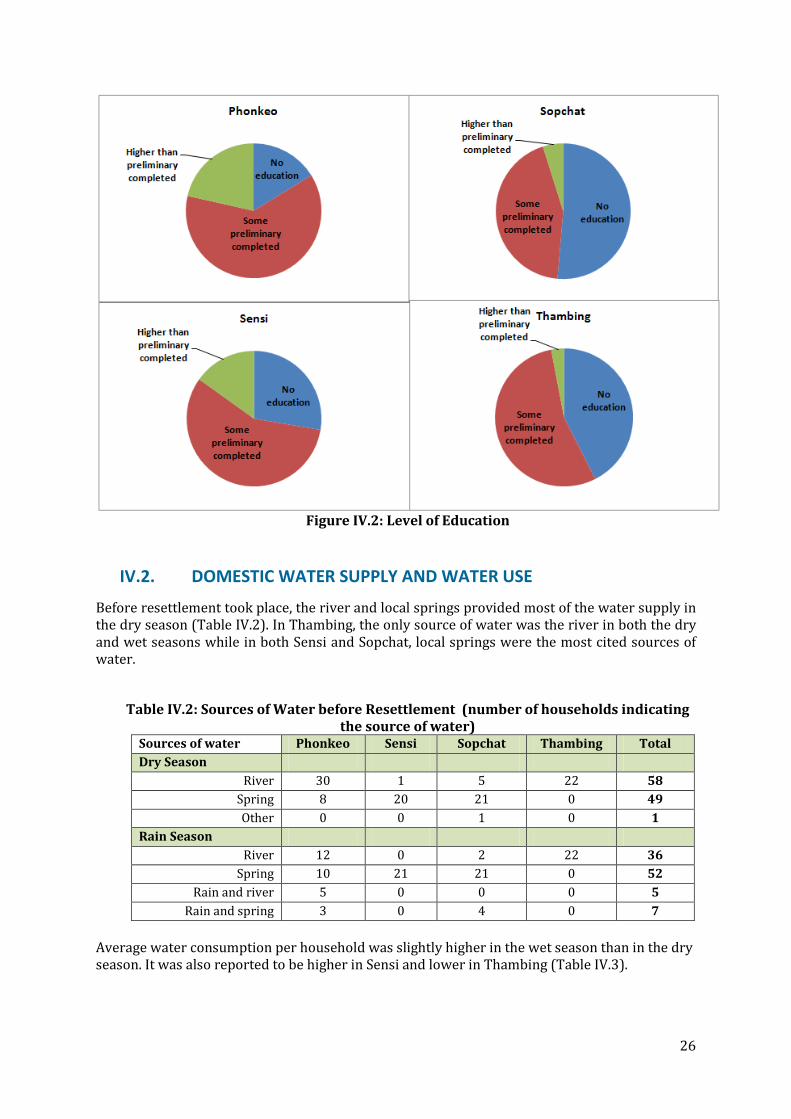
Education As indicated in Figure IV.2, a high percentage of the population (ranging between 43.8% in Sopchat and 62.3% in Phonkeo) has completed some preliminary levels of education. However, it was observed that a higher percentage of the population in Phonkeo and Sensi (21.5% and 15.1% respectively) has completed a post-preliminary level of education compared to in Sopchat and Thambing (4.8% and 3.0% respectively). On the other hand, a much higher percentage of the population in Sopchat and Thambing (51.3% and 4.5%) has no education in comparison to in Phonkeo and Sensi (16.2% and 27.7% respectively).
26
Figure IV.2: Level of Education
IV.2. DOMESTIC WATER SUPPLY AND WATER USE
Before resettlement took place, the river and local springs provided most of the water supply in the dry season (Table IV.2). In Thambing, the only source of water was the river in both the dry and wet seasons while in both Sensi and Sopchat, local springs were the most cited sources of water.
Table IV.2: Sources of Water before Resettlement (number of households indicating the source of water)
Sources of water Phonkeo Sensi Sopchat Thambing Total Dry Season
River 30 1 5 22 58 Spring 8 20 21 0 49 Other 0 0 1 0 1
Rain Season River 12 0 2 22 36
Spring 10 21 21 0 52 Rain and river 5 0 0 0 5
Rain and spring 3 0 4 0 7 Average water consumption per household was slightly higher in the wet season than in the dry season. It was also reported to be higher in Sensi and lower in Thambing (Table IV.3).

27
Table IV.3: Daily Average Water Consumption per Household before Resettlement (liters/household/day)
Phonkeo Sensi Sopchat Thambing Total Dry season 100 133 121 82 109
Rain season 127 152 131 101 128 As shown in Table IV.4, in both dry and rainy seasons, the largest share of water usage was for domestic use (approximately 45% of total water use), of which drinking water was most important (approximately 40% of total water use). Between 10% and 20% of collected water was used for livestock.
Table IV.4: Domestic and Drinking Water Use (% of total water use) Phonkeo Sensi Sopchat Thambing Total Domestic use – Dry season 47.3 46.3 48.0 47.3 47.3 Domestic use - Rain season 50.0 45.4 44.6 49.4 47.4 Drinking use – Dry season 39.0 33.2 39.2 39.0 37.8 Drinking use – Rain season 39.3 31.9 41.0 40.3 38.4
On a scale of 1 to 5 (from ‘very easy’ to ‘very difficult’,) the average degree of difficulty of collecting water was ranked as 2.3 in the dry season and 2.8 in the rainy season. Sensi appeared to benefit from the easiest access (2.1 and 2.5 respectively), which may explain Sensi’s higher average household water consumption. Thambing appeared to experience more difficult access (2.7 and 3.4, respectively), which may also explain the lower average daily water consumption in Thambing. Average collection time (minutes per round trip from dwelling to water source) was estimated to be 14.1 minutes in the dry season (the lowest being in Sensi with 10.9 minutes) and 16.1 minutes in the rainy season (the highest being 20.0 minutes in Thambing). Respondents also indicated undertaking 38 round trips per week (on average across all villages) for the purpose of water collection in the dry season. Of these, 9.1 trips were to collect water for domestic consumption. In the rainy season, the numbers were 30.6 and 6.8 round trips, respectively. Extrapolating these numbers for the entire population of all 4 villages would indicate a total water collection time of approximately 1,600 hours per week in the dry season and 1,475 hours per week in the wet season (Table IV.5).
Table IV.5: Estimated Water Collection Time per Village – Before Resettlement Phonkeo Sensi Sopchat Thambing Total Number of trips per week All water consumption
Dry season 48.1 31.8 34.6 34.4 38.0 Rain season 36.7 27.5 29.5 26.4 30.6
Of which domestic consumption Dry season 9.2 8.8 8.6 10.0 9.1
Rain season 6.6 6.0 6.3 8.2 6.8 Minutes per trip
Dry season 16.9 10.9 11.5 16.4 14.0 Rain season 18.5 13.8 12.0 20.0 16.1
Total minutes (hours) spent collecting water per week per HH*
All water consumption Dry season 812.3(13.5) 366.0(6.1) 376.3(6.3) 563.1(9.4) 533.0(8.9)
Rain season 677.7(11.3) 379.4(6.3) 355.4(5.9) 527.3(8.8) 491.5(8.2)

28
Of which domestic consumption Dry season 128.1(2.6) 101.0(1.6) 94.0(1.6) 162.9(2.7) 128.1(2.1)
Rain season 108.4(2.0) 83.5(1.3) 75.8(1.3) 163.6(2.7) 108.4(1.8) Total hours spent collecting water per week for whole village
All water consumption Dry season 731.1 231.8 307.3 366.0 1,599.0
Rain season 231.8 240.3 290.2 342.7 1,474.6 Of which domestic consumption
Dry season 140.4 63.9 76.7 105.9 384.3 Rain season 109.1 52.9 61.9 106.4 325.3
*HH: Household Sources of water supply, water consumption, and time spent collecting water all changed very significantly following the resettlement. Before resettlement, the river and springs were the main sources of water supply, in both the dry and rainy seasons. After resettlement, households were given access to private and public wells, albeit not free access. As a result, sources of water supply have completely changed. In the dry season, public and private wells provide almost all of the water supply, almost equally so across villages (Figure IV.3). For Phonkeo, Sopchat, and Thambing, private and public wells are the only sources of water (Table IV.6). In the rainy season, rain and spring water constitute the bulk of the water supply. Public and private wells, which are costly to use, become of lesser importance. The importance of rain as a source of water supply is further explained by the fact that, after resettlement, each house was equipped with a rainwater collection system connecting gutters to water storage facilities. In all cases, water from the reservoir has almost completely ceased to be a source of water supply.
Figure IV.3: Sources of Water Supply after Resettlement

29
Table IV.6: Sources of Water Supply after Resettlement (number of households using sources of water)
Phonkeo Sensi Sopchat Thambing Total Dry Season Public well 13 12 13 11 49 Private well 16 6 14 11 47 Rain water 0 1 0 0 1 Spring water 0 2 0 0 2 Rain Season Public well 8 5 6 5 24 Private well 5 1 2 0 8 Rain water 15 12 11 13 51 Spring water 2 3 8 4 17 A much greater percentage of the collected water is used for domestic purposes than before resettlement. Domestic uses include drinking, washing, bathing, providing water to small livestock and irrigating small homestead gardens.
Table IV.7: Domestic and Drinking Water Use (% of total water use)
Phonkeo Sensi Sopchat Thambing Total Domestic use – Dry season 61.5 59.3 70.2 60.8 63.2 Domestic use - Rain season 62.0 60.8 70.9 60.4 63.8 Drinking use – Dry season 33.6 33.6 27.8 34.5 32.2 Drinking use – Rain season 33.9 34.8 28.0 35.9 32.9
Given the changes in the sources of water supply, access to water became considerably easier with a water source located 10 to 50 meters from the households. Occasionally, a public well may even be connected directly to the households with pipes. On the same scale of 1 to 5, the average degree of difficulty of collecting water was ranked as 1.5 in the dry season (down from 2.3) and 1.4 in the rainy season (down from 2.8). The ease of access improved particularly in the rainy season. Perhaps more importantly, the ease of access to water was ranked differently across villages before resettlement but became ranked almost identically across all villages after the resettlement in both the dry and rainy seasons (Figure IV.4).

30
Figure IV.4: Ease of access to sources of water before and after resettlement
(1: very easy; 5: very difficult)
As a result of easier access to water combined with a fixed pricing scheme to access public wells (2,000 kip per month regardless of the water consumed), water consumption increased significantly from 109 to 383 liters/household/day in the dry season. In the rainy season, the consumption increased from 128 to 347 liters/household/day. Water consumption in the dry season is now 3.5 times higher than before resettlement, and 2.7 times higher in the rainy season. The increase in water consumption was particularly significant in Phonkeo (Figure IV.5).
Figure IV.5: Water consumption before and after resettlement (liters/household/day)
After resettlement, households spend an average of 22.5 minutes (rainy season) and 28.0 minutes (dry season) for the collection of water per week, as indicated in Table IV.8. The collection of domestic water alone represents approximately 16 minutes per week. Across all villages, this translated into a total water collection time of 83.9 hours in the dry season and 67.5 hours in the wet season. Of these hours, the collection of domestic water represents 50.8 and 45.9 hours, respectively.
0
1
2
3
4
Average all Sopchat Thambing Sensi Phonkeo
Dry Season
Before resettlement After resettlement
0
1
2
3
4
Average all Sopchat Thambing Sensi Phonkeo
Rainy Season
Before resettlement After resettlement
0
100
200
300
400
500
Average all Sopchat Thambing Sensi Phonkeo
Dry Season
Before resettlement After resettlement
0
100
200
300
400
500
Average all Sopchat Thambing Sensi Phonkeo
Rainy Season
Before resettlement After resettlement

31
Table IV.8: Estimated Water Collection Time per Village – After Resettlement Phonkeo Sensi Sopchat Thambing Total Number of trips per week All water consumption
Dry season 13.8 15.3 14.3 14.0 14.3 Rain season 11.1 9.5 11.1 10.0 10.5
Of which domestic consumption Dry season 8.7 9.3 8.0 8.6 8.6
Rain season 7.5 7.1 7.2 6.7 7.2 Minutes per trip
Dry season 2.4 1.8 1.7 1.9 1.9 Rain season 1.9 1.7 1.5 3.6 2.1
Total minutes (hours) spent collecting water per week per HH*
All water consumption Dry season 32.5(0.54) 27.7(0.46) 24.3(0.40) 26.1(0.43) 28.0(0.47)
Rain season 21.4(0.36) 16.2(0.27) 16.9(0.28) 35.9(0.60) 22.5(0.38) Of which domestic consumption
Dry season 20.7(0.34) 16.9(0.28) 13.7(0.23) 16.1(0.27) 16.9(0.28) Rain season 14.4(0.24) 12.2(0.20) 10.9(0.18) 24.2(0.40) 15.3(0.26)
Total hours spent collecting water per week for whole village
All water consumption Dry season 29.3 17.6 19.8 16.9 83.9
Rain season 19.3 10.3 13.8 23.3 67.5 Of which domestic consumption
Dry season 18.6 10.7 11.2 10.4 50.8 Rain season 13.0 7.76 8.9 15.7 45.9
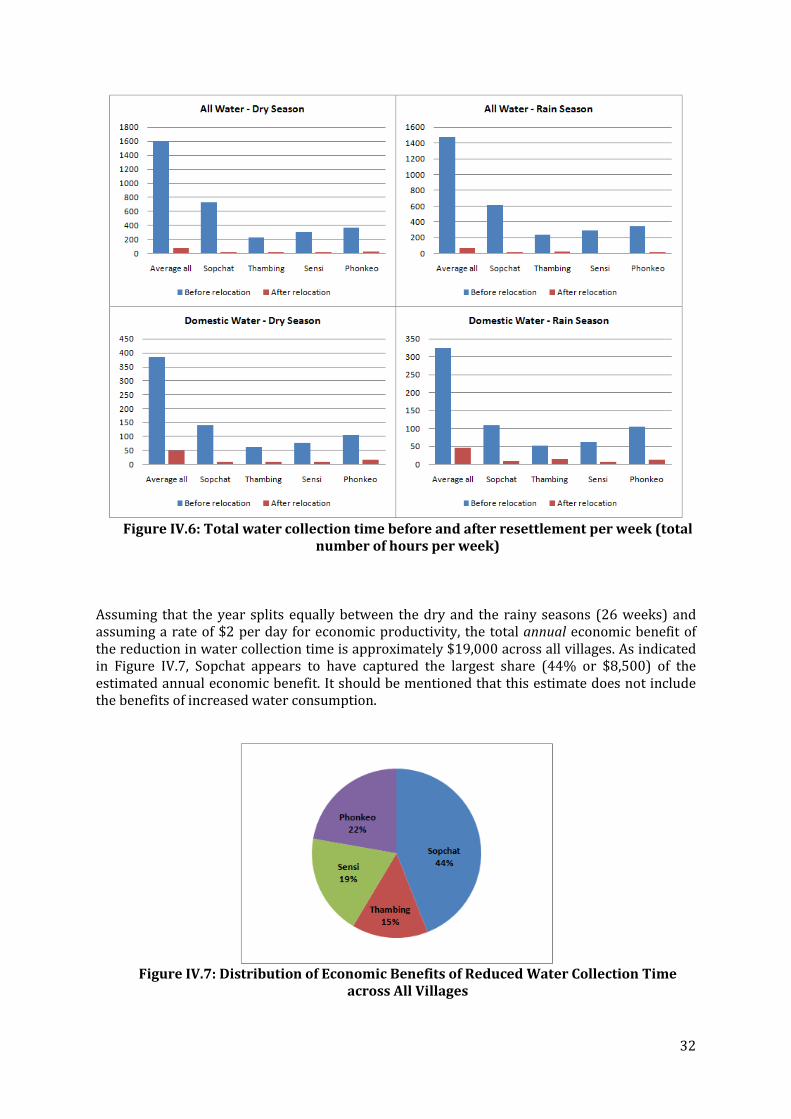
HH: Household As indicated in Figure IV.6, the total time devoted to the collection of water decreased very significantly. Across all villages, the time devoted to the collection of all water reduced by approximately 95% and by approximately 86% for the collection of domestic water.
32
Figure IV.6: Total water collection time before and after resettlement per week (total
number of hours per week)
Assuming that the year splits equally between the dry and the rainy seasons (26 weeks) and assuming a rate of $2 per day for economic productivity, the total annual economic benefit of the reduction in water collection time is approximately $19,000 across all villages. As indicated in Figure IV.7, Sopchat appears to have captured the largest share (44% or $8,500) of the estimated annual economic benefit. It should be mentioned that this estimate does not include the benefits of increased water consumption.
Figure IV.7: Distribution of Economic Benefits of Reduced Water Collection Time
across All Villages

33
The above analysis clearly indicates that the resettlement of all 4 villages has brought very significant benefits to the relocated villages. First, all households across all villages now consume considerably more water than before resettlement despite having to pay a fee to access water. While we have not attempted to monetize this positive impact, it is likely to be large. Second, households spend much less time (up to a 95% reduction) collecting water. The estimated value of this positive impact has been estimated to reach approximately $19,000 on an annual basis. The above benefit was experienced immediately as resettlement took place. However, in the short-term, economic activities contributing to livelihood appear to have been adversely impacted. These are discussed in greater details in sections below that focus more precisely on estimating changes in economic livelihoods.
IV.3. Agriculture and Farmland
Before resettlement, every household was farming a piece of land of approximately 3.91 hectares (ha) on average (Figure IV.8). The average plot size was higher in Phonkeo (4.88 ha) and lower in Thambing (3.31 ha).
Figure IV.8: Distribution of Farmland by Plot Size before Resettlement
(horizontal axis: ha; vertical axis: number of farmlands)
In Figure 3.11, it is observed that there is an absence of farmlands larger than 6 ha in both Sensi and Thambing. In Phonkeo, 3 larger farmlands (out of 30) accounted for approximately 20% of all farmlands in the village before resettlement.

34
Figure IV.9: Distribution of Farmland by Plot Size by Village
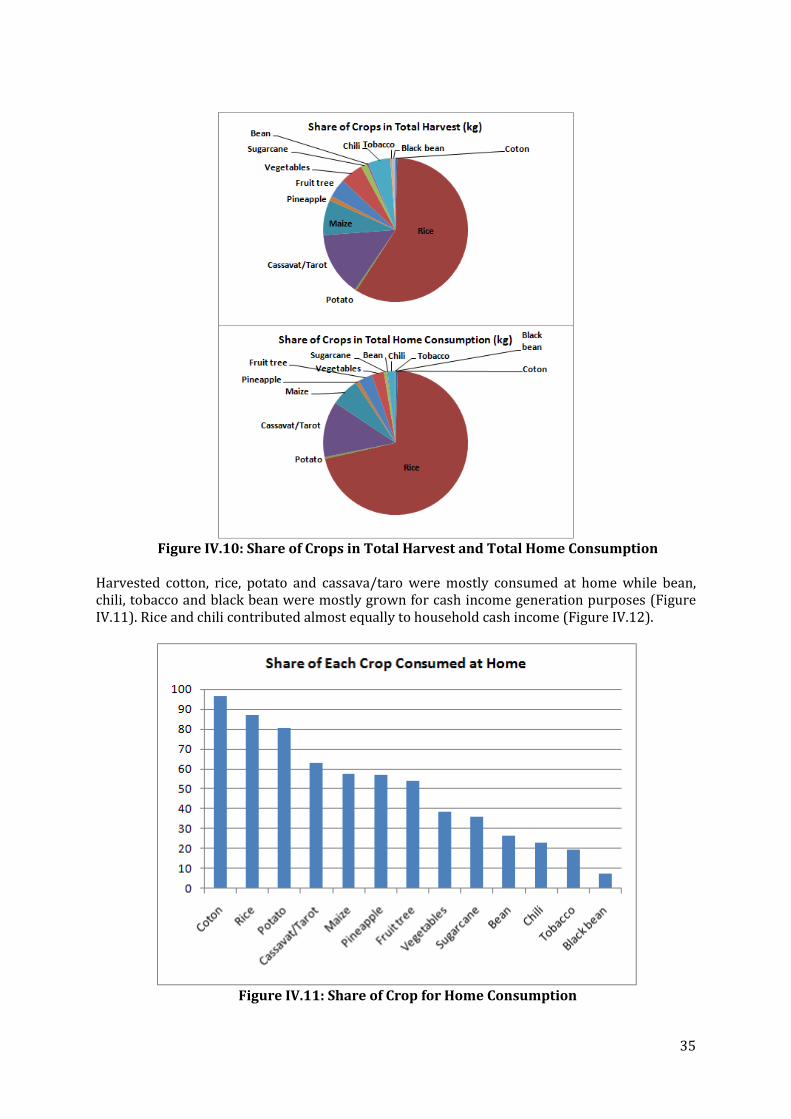
Before resettlement, 75% of the households had access to riverbank gardens and 87% of those plots were irrigated, either as drawdown irrigation or with supplementary (bucket) irrigation. In addition to riverbank garden, some other types of gardens (20% of households) and homestead gardens (37% of households) were also irrigated with river water using buckets. The total irrigated land from the river varied from 1.3 ha to 1.8 ha per household on average. Farmers were cultivating and collecting a number of different crops. In terms of quantity (measured in kilograms (kg)), rice represented the most abundant crop (Figure IV.10). Rice represents approximately 58% of the total harvest and 71% of total home food consumption.
35
Figure IV.10: Share of Crops in Total Harvest and Total Home Consumption
Harvested cotton, rice, potato and cassava/taro were mostly consumed at home while bean, chili, tobacco and black bean were mostly grown for cash income generation purposes (Figure IV.11). Rice and chili contributed almost equally to household cash income (Figure IV.12).
Figure IV.11: Share of Crop for Home Consumption
36
Figure IV.12: Contribution of Each Crop to Household Income Generation
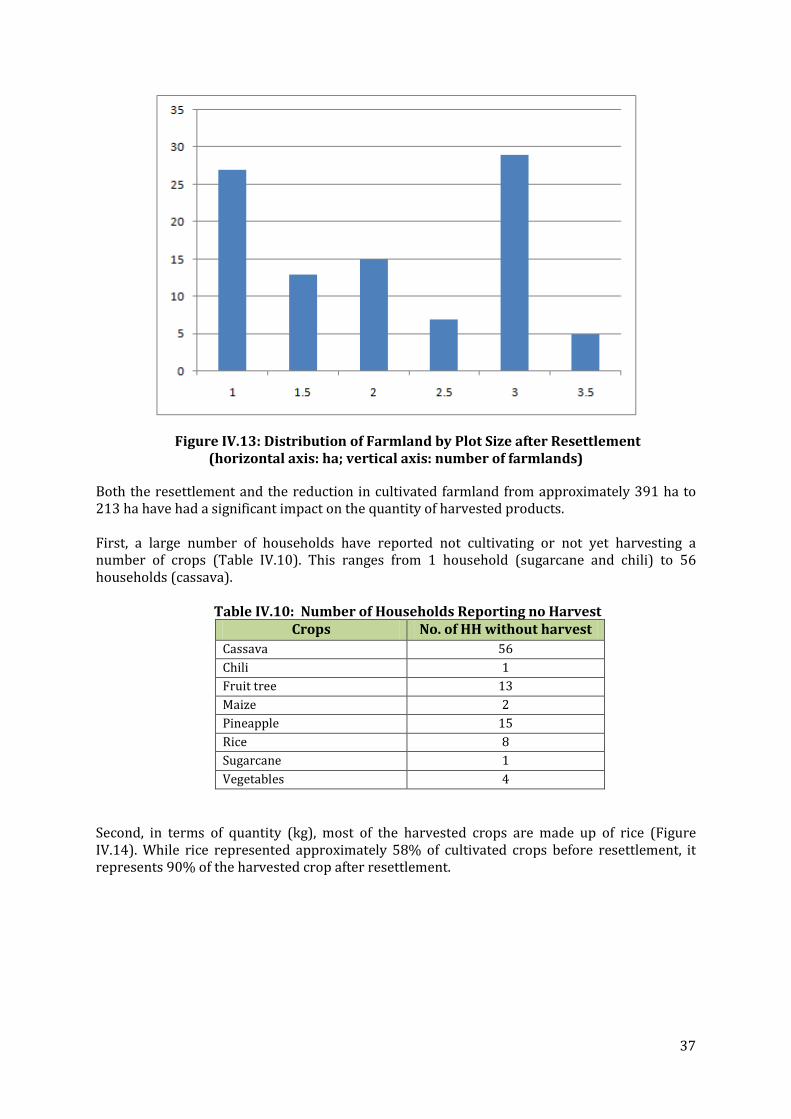
However, villages did specialize in growing certain crops to some extent. Sensi produced approximately 55% of beans and 61% of black beans grown across the 4 villages. Sensi also produced 51% of all produced tobacco. On the other hand, Phonkeo produced 50% of all the cassava/taro and 50% of all the pineapples. Chili, maize, rice, sugarcane and vegetables were more uniformly distributed across all villages. Resettlement had a significant impact not only on the average plot size of farmlands held by each household but also on the range of plot size held across households in the relocated villages. First, as indicated in Table IV.9, the average plot size fell from 3.91 to 2.13 ha, a reduction of approximately 45%. The reduction in average plot size was particularly severe in Phonkeo, with an average reduction of approximately 56%. It is equally as important to note that the average plot size became considerably more uniform between villages after resettlement. Average plot sizes range between 2.0 and 2.2 ha in each resettled village while average plot size was considerably higher in Phonkeo and lower in Thambing before resettlement. As indicated in Figure IV.13, the largest plot size is now 3.5 ha (down from 11.5). When comparing with Figure IV.8, it is clear that resettlement had a significant impact on the distribution of land ownership across households.
Table IV.9: Average Farmland Plot Size before and after Resettlement Average plot size before Average plot size after % reduction All villages 3.91 2.13 45.6 Phonkeo 4.88 2.13 56.4 Sensi 3.76 2.14 43.0 Sopchat 3.44 2.04 40.8 Thambing 3.31 2.23 32.6
37
Figure IV.13: Distribution of Farmland by Plot Size after Resettlement (horizontal axis: ha; vertical axis: number of farmlands)
Both the resettlement and the reduction in cultivated farmland from approximately 391 ha to 213 ha have had a significant impact on the quantity of harvested products. First, a large number of households have reported not cultivating or not yet harvesting a number of crops (Table IV.10). This ranges from 1 household (sugarcane and chili) to 56 households (cassava).
Table IV.10: Number of Households Reporting no Harvest Crops No. of HH without harvest
Cassava 56 Chili 1 Fruit tree 13 Maize 2 Pineapple 15 Rice 8 Sugarcane 1 Vegetables 4
Second, in terms of quantity (kg), most of the harvested crops are made up of rice (Figure IV.14). While rice represented approximately 58% of cultivated crops before resettlement, it represents 90% of the harvested crop after resettlement.

38
Figure IV.14: Share of Crops in Total Harvest Before (left) and After Resettlement
(right)
Third, following resettlement, none of the harvested crops were sold to markets for purpose of revenue generation; all were consumed within the households. Finally, and arguably most importantly, the total harvest after resettlement fell from approximately 425,400 kg of a variety of crops to 50,440 kg of crops, with lower variability.
Table IV.11: Total Harvest before and after Resettlement
Before After
Cotton 1,550 0 Rice 251,299 45,650 Potato 1,530 0 Cassava/Taro 61,248 3,960 Maize 33,655 0 Pineapple 4,226 37 Fruit tree 18,125 37 Vegetables 21,795 583 Sugarcane 5,980 70 Bean 1,743 56 Chili 21,170 50 Tobacco 1,475 0 Black bean 3,600 0
Total 42,7396 50,443
As far as farming is concerned, the most important and significant change is the disappearance of riverbank gardens. Before resettlement, 75% of the households had access to riverbank gardens and 87% of riverbank garden plots were irrigated, either as drawdown irrigation or as supplementary irrigation using buckets. The disappearance of riverbank gardens following the reservoir impoundment reduced the irrigated land per household significantly. Fewer than 40% of households started cultivating their homestead gardens using well water for irrigation after resettlement.
Bean Cassava/Taro
Chili Fruit tree
Pineapple
Rice
SugarcaneVegetablesCotton
Rice
Potato
Cassava/Taro
Maize
Pineapple
Fruit treeVegetables
Sugarcane Bean
Chili
Tobacco Black bean
39
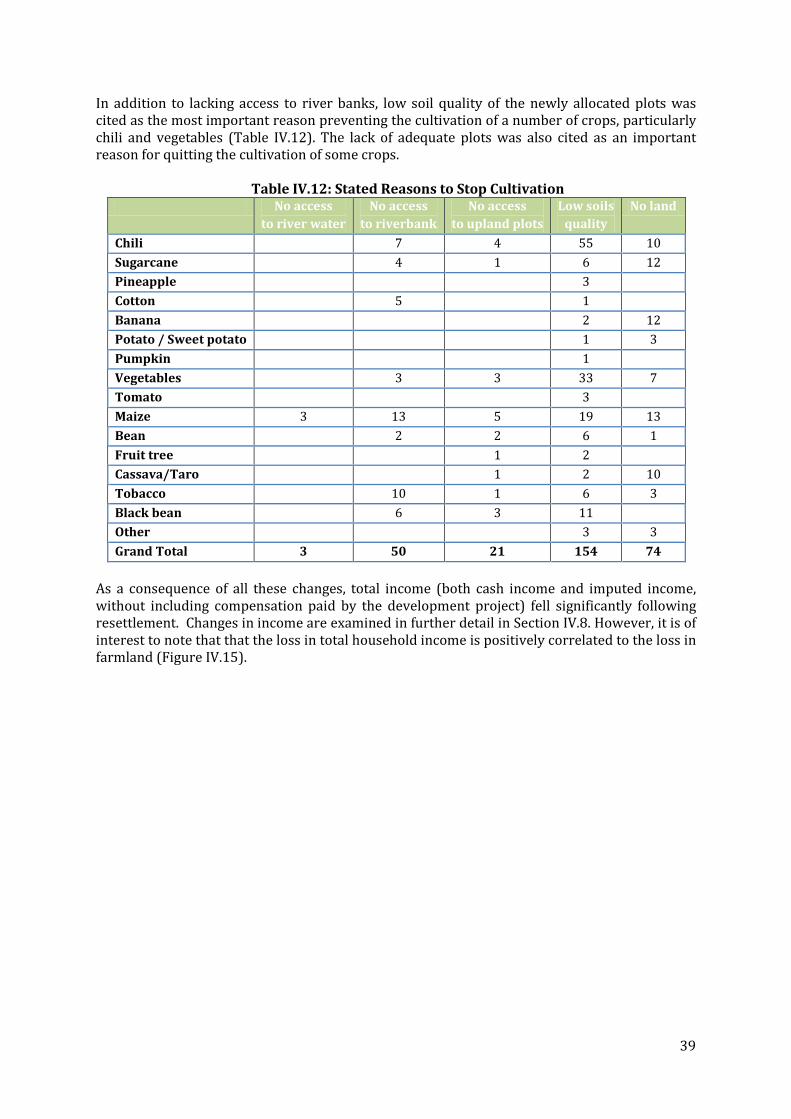
In addition to lacking access to river banks, low soil quality of the newly allocated plots was cited as the most important reason preventing the cultivation of a number of crops, particularly chili and vegetables (Table IV.12). The lack of adequate plots was also cited as an important reason for quitting the cultivation of some crops.
Table IV.12: Stated Reasons to Stop Cultivation No access
to river water No access
to riverbank No access
to upland plots Low soils
quality No land
Chili 7 4 55 10 Sugarcane 4 1 6 12 Pineapple 3 Cotton 5 1 Banana 2 12 Potato / Sweet potato 1 3 Pumpkin 1 Vegetables 3 3 33 7 Tomato 3 Maize 3 13 5 19 13 Bean 2 2 6 1 Fruit tree 1 2 Cassava/Taro 1 2 10 Tobacco 10 1 6 3 Black bean 6 3 11 Other 3 3 Grand Total 3 50 21 154 74
As a consequence of all these changes, total income (both cash income and imputed income, without including compensation paid by the development project) fell significantly following resettlement. Changes in income are examined in further detail in Section IV.8. However, it is of interest to note that that the loss in total household income is positively correlated to the loss in farmland (Figure IV.15).

40
Figure IV.15: Loss of Total Household Income versus Loss of Farmland
IV.4. Livestock
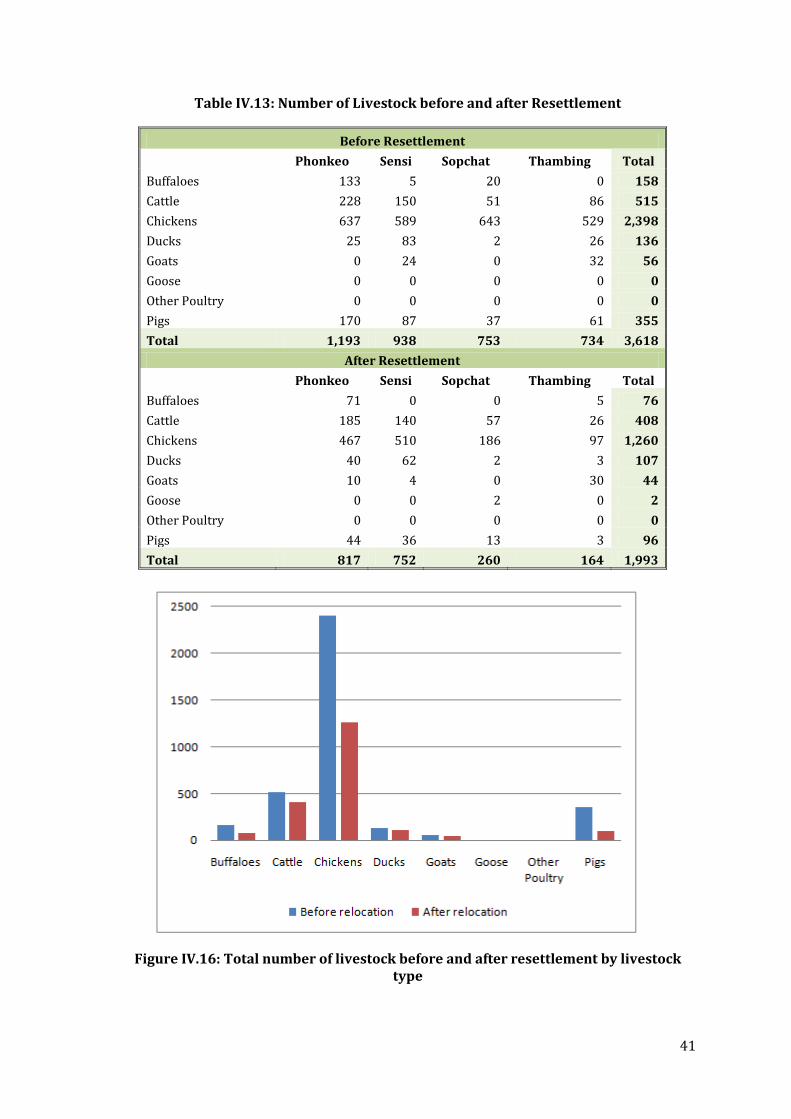
Before resettlement, the 4 villages held approximately 3,600 animals. Of these animals, 33% were in Phonkeo, 26% were in Sensi, and approximately 20% were in both Sensi and Thambing. Chickens represented 66% of all animals raised in the villages. Phonkeo appeared to represent a significant share of larger animals: 84% of all buffaloes, 47% of all pigs and 44% of all cattle. On the other hand, 61% of all ducks were raised in Sensi (Table IV.13). The resettlement had a significant impact on the number of animals being raised. There was approximately an overall 45% reduction in the total number of present animals. The number of pigs fell by 73%, buffaloes by 52% and chickens by 47% (Figure IV.16). However, it is of interest to note that Phonkeo and Sensi experienced a 20% reduction in the number of chickens raised while Sopchat and Thambing experienced a 76% reduction. Overall, Sopchat and Thambing experienced the largest reduction in the number of livestock.
Correlation coefficient: 0.355
41
Table IV.13: Number of Livestock before and after Resettlement
Figure IV.16: Total number of livestock before and after resettlement by livestock type
Before Resettlement
Phonkeo Sensi Sopchat Thambing Total
Buffaloes 133 5 20 0 158 Cattle 228 150 51 86 515 Chickens 637 589 643 529 2,398 Ducks 25 83 2 26 136 Goats 0 24 0 32 56 Goose 0 0 0 0 0 Other Poultry 0 0 0 0 0 Pigs 170 87 37 61 355 Total 1,193 938 753 734 3,618
After Resettlement
Phonkeo Sensi Sopchat Thambing Total
Buffaloes 71 0 0 5 76 Cattle 185 140 57 26 408 Chickens 467 510 186 97 1,260 Ducks 40 62 2 3 107 Goats 10 4 0 30 44 Goose 0 0 2 0 2 Other Poultry 0 0 0 0 0 Pigs 44 36 13 3 96 Total 817 752 260 164 1,993

42
Figure IV.17: Total number of livestock before and after resettlement by village
As a result of the absence of pastureland within or in proximity to the resettlement area, a number of households continue to use grazing land in the formerly settled area. Grazing land is located between 10 to 240 minutes away from the new villages and requires boat transportation. However, the increment of operational costs is not homogeneous across the sample because the distance to the pastureland depends on the location of the original village. Transportation costs were found to be significantly different across villages. Higher costs were found in Thambing and Sopchat (villages located farther away from their original locations) and lower in Sensi and Phonkeo (former villages located near the resettlement site).
IV.5. Fisheries
Before resettlement, all 100 households who participated in the survey were involved in fisheries and almost all households generated cash income from the activity. The fish catch per month was lower in the rainy season (June to November), with a total monthly catch of approximately 6,800 kg. The catch was higher in the dry season (December to April), reaching a peak monthly catch of approximately 20,000 kg (Figure IV.18). With the exception of Sensi, the fisheries catch was found to be somewhat evenly distributed across all the villages (Figure IV.19). However, during the course of the dry season, fisheries catch appeared to be significantly higher in Sopchat and Thambing in comparison to Phonkeo and Sensi. The higher average catch per household for Sopchat and Thambing seems to be due to a greater level of effort devoted to fishing as the average fisheries catch per household then appears to be significantly higher.
0
200
400
600
800
1000
1200
Phonkeo Sensi Sopchat Thambing
Before After

43
Figure IV.18: Total Fish Catch before Resettlement (kg)
Figure IV.19: Share of Fisheries Catch across Villages

44
Figure IV.20: Average Monthly Fish Catch per Household Before Resettlement
Not all households were involved in the collection of other aquatic resources (such as snails, crabs and plants) before resettlement. This activity was generally more popular in the dry season when riverbanks were more accessible. During this season, 25 to 47% of households were collecting these resources almost uniquely for home consumption. The average collected quantity ranged between 27 and 61 kg per month per household. In the rainy season, only 10 to 15% of households continued to collect these resources and did so with a reduced quantity (approximately 10 kg per month per household collected). Unlike other aquatic resources, a large percentage of the fisheries aimed to generate cash income. Approximately 75% of the catch in Thambing in the course of the dry season was used to generate income (Figure IV.21). This percentage was found to be mostly above 60% in both Thambing and Sopchat throughout the year. A smaller proportion of the catch was sold to markets in the wet season because the catch was reduced. In Sensi, the proportion of catch sold to markets was approximately 40% from June to November.
-
50
100
150
200
250
300
Jan Feb Mar Apr May Jun Jul Aug Sep Oct Nov Dec
Phonkeo
Sensi
Sopchat
Thambing
All
Kilograms
45
Figure IV.21: Percentage of Fisheries Catch Sold to Markets
Following resettlement and reservoir impoundment, the nature of the fishing activities changed significantly from river-based fishing to reservoir-based fishing. It involved a substantial change in fishing technique and equipment. To enter the reservoir fishery, the right to fish is subjected to obtaining a fishing license from the newly established fishing authority. The license costs 30,000 kip per year for purpose of subsistence fishing and costs 30,000 kip per month for commercial fishing. Despite the introduction of the fishing license fees, 83% of the interviewed households stated that they bought a fishing license. Of these, 26% of the interviewed households stated having bought a license for subsistence fishing and 57% of the households stated having secured a commercial fishing license. Of all households interviewed, 71% acknowledged an increase in fishing activity following resettlement. Stated reasons include:
• Easier access to fishing grounds (43%); • Increased market demand for caught fish - which may be explained by the fact that the
species of fish caught changed following impoundment (43%); • More fish following impoundment (60%); and • Farming not being productive enough and therefore substituting fishing for farming
(5%). On the other hand, 11% of the households acknowledged a decrease in fishing activity. Stated reasons include:
• Distance to the reservoir being too high to justify fishing (2%); • As a result of the reservoir, fishing now requires a boat which has too high of an
investment cost (4%); and • Water level is too deep and different fishing tools are required (6%);

46
Within the group of households that indicated an increase in fishing effort, the following was noted:
• Change in fishing technique, now requiring different types of gill nets (45 households); • Change in fishing location (50 households); and • Change in transportation method, now requiring a motor boat (21 households)
As a result of reservoir impoundment and the institutional and behavioral changes described above, the pattern of the fisheries catch changed significantly. First, the seasonal characteristics of the fisheries catch changed drastically. As noted previously, fisheries catch used to experience large seasonal fluctuations. Larger quantities were caught during the dry season (December to May), peaking in the months of March and April, with lower returns during the wet season (June to November). The collected catch estimates indicated a catch reduction of approximately 68%, from a peak of approximately 21,000 kg in April to a low of approximately 6,760 kg in August. Following the reservoir impoundment, the seasonality of the fisheries catch changed considerably. The catch peaked from August to October instead of from December to April (Figure IV.22). In addition, fisheries catch is more evenly distributed throughout the year, as clearly indicated in Figure IV.22. The estimates indicate a catch reduction of only 29%, from a peak of approximately 12,500 kg in September to a low of approximately 8,900 kg in February. While total fisheries catch fell from approximately 151,600 to 122,370 kg in the first year following resettlement, the relatively even distribution of fisheries catch throughout the entire year could potentially contribute to income stabilization over the course of the years. Second, the distribution of fisheries catch across villages changed significantly. As shown in Figure IV.23, Phonkeo and Sensi captured approximately 46% of the total fisheries catch before resettlement. After resettlement, this share increased to 61%. The reallocation of the fisheries catch share has come mostly at the expense of Sopchat. Sopchat was found to have the lowest fish catch after resettlement. Furthermore, the average fish catch per household decreased after resettlement, from 726 kg per household per year to 414 kg per household per year. The average fish catch per household per month is significantly lower in Sopchat than in the other 3 villages (Figure IV.24). Sopchat is also the village with the lowest average number of boats and other fishing gears per household after resettlement. All of the above may be explained by one important factor: after resettlement, the households of Sopchat need to travel for approximately 40 minutes before reaching the shore of the reservoir. Phonkeo and Sensi are 17 and 23 minutes traveling time from the reservoir, respectively. It does appear that traveling distance (and therefore the travel cost inclusive of the economic value of traveling time) is a key determinant of the overall willingness of engage in fisheries activities.
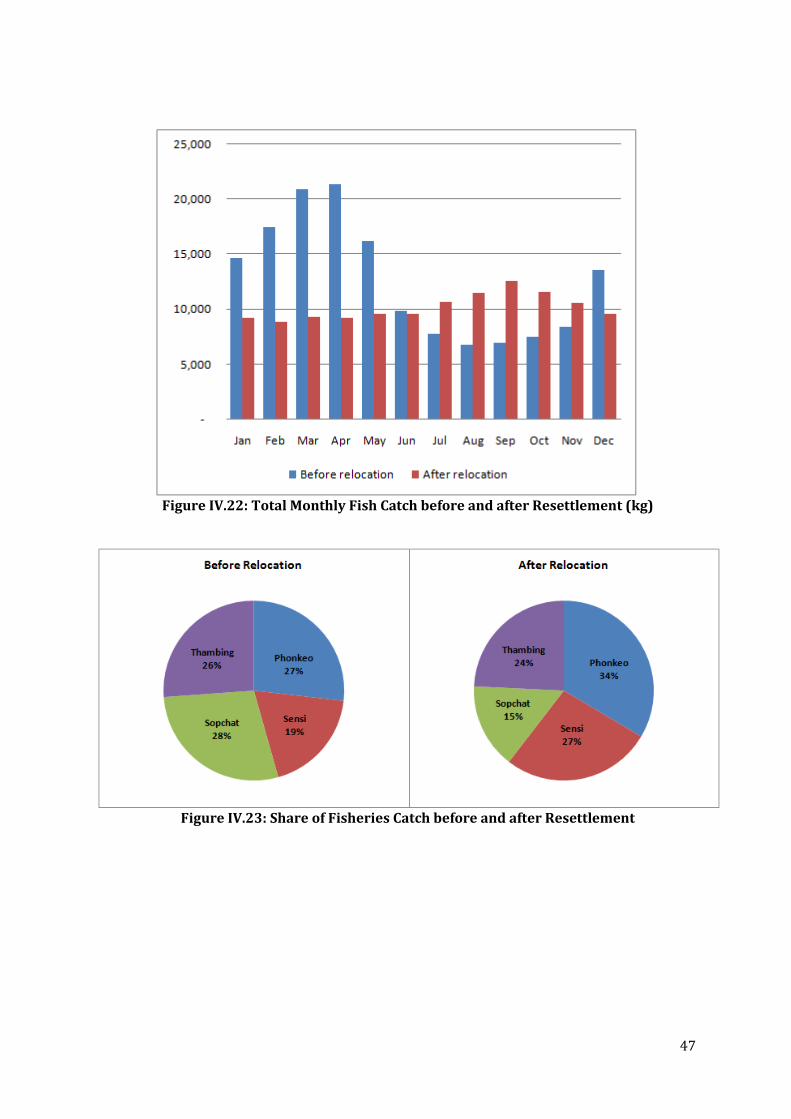
47
Figure IV.22: Total Monthly Fish Catch before and after Resettlement (kg)
Figure IV.23: Share of Fisheries Catch before and after Resettlement

48
Figure IV.24: Average monthly fish catch per household after resettlement (kg)
Perhaps as a result of the even distribution of the fisheries catch across different months, the percentage of fisheries catch sold to markets also experienced much less variation (Figure IV.25). Phonkeo’s share of the fisheries catch sold to markets is much higher than the shares of the other 3 villages. In fact, the share has increased compared to pre-resettlement levels. On the other hand, Sopchat and Thambing both sell much less of their fish catch for the purpose of cash income generation (Figure IV.26).
Figure IV.25: Percentage of Fisheries Catch Sold to Markets after Resettlement
0
50
100
150
200
250
300
Jan Feb Mar Apr May Jun Jul Aug Sep Oct Nov Dec
Phonkeo
Sensi
Sopchat
Thambing
All
Kilogram
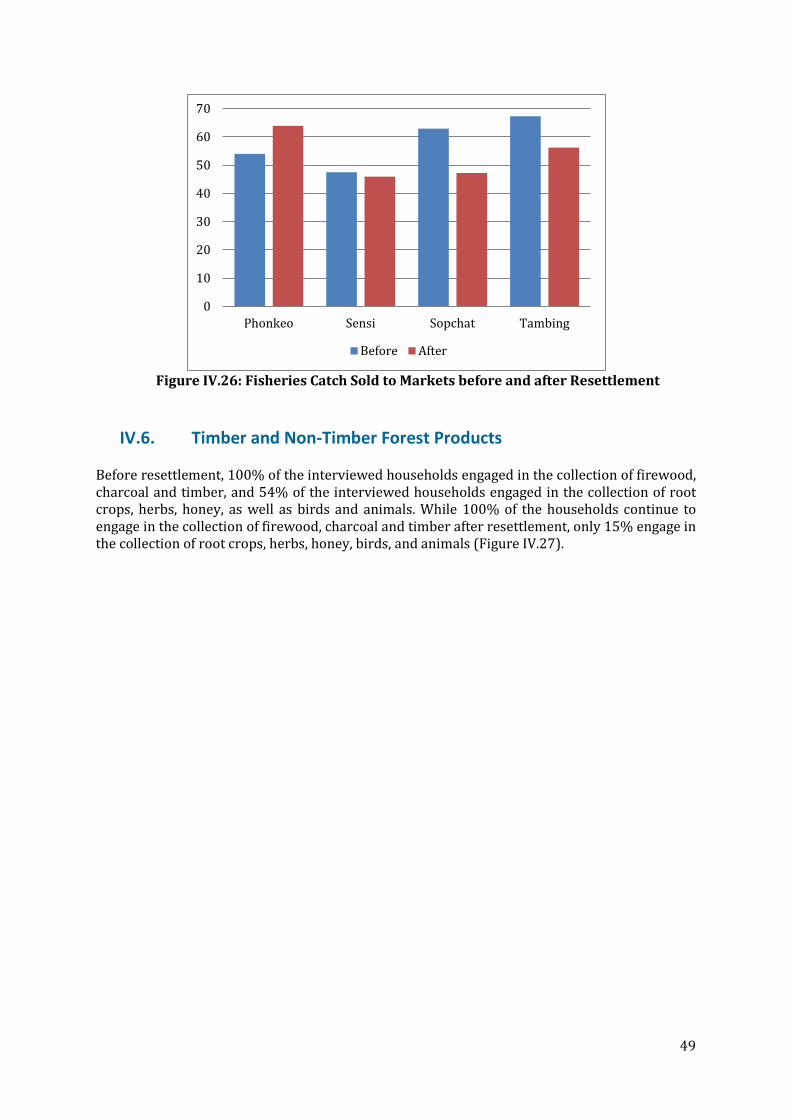
49
Figure IV.26: Fisheries Catch Sold to Markets before and after Resettlement
IV.6. Timber and Non-Timber Forest Products Before resettlement, 100% of the interviewed households engaged in the collection of firewood, charcoal and timber, and 54% of the interviewed households engaged in the collection of root crops, herbs, honey, as well as birds and animals. While 100% of the households continue to engage in the collection of firewood, charcoal and timber after resettlement, only 15% engage in the collection of root crops, herbs, honey, birds, and animals (Figure IV.27).
0
10
20
30
40
50
60
70
Phonkeo Sensi Sopchat Tambing
Before After

50
Figure IV.27: Percentage of Households Engaging in the Collection of TFP and NTFP
before and after Resettlement As a result of the various units used to measure TFPs and NTFPs, it proved difficult to estimate the change in collected products in quantitative terms. However, households were asked to indicate the nature of the change (increase, decrease, or same as before) in qualitative terms. As indicated in Table IV.14, only a few households have indicated an increase in quantities collected while most have indicated no change or a decrease. A significant number of households indicated that a lack of access to appropriate areas for collection explain the decrease in terms of both the number of households engaging in the collection of TFPs and NTFPs and of the quantities collected.
Table IV.14: Trends in the Collection of TPFs and NTFPs after Resettlement
Increase Decrease Same as before No opinion Bamboo Shoot 11% 34% 48% 7% Bamboo and other similar products 5% 37% 55% 3% Firewood 5% 54% 35% 6% Timber/Wood 7% 29% 60% 4% Mushrooms 0% 57% 40% 4% Root crops 0% 5% 89% 5% Vegetables 2% 58% 35% 4% Leaves and Flowers 15% 23% 54% 8% Wild Animals 7% 50% 43% 0% Wild Birds 0% 33% 67% 0% Rattan 0% 0% 100% 0% Fruits 0% 40% 60% 0% Palm leaves 0% 0% 100% 0% Wood for Charcoal 0% 0% 100% 0% Bark 0% 100% 0% 0%

51
IV.7. Non-Farm Activities Before resettlement, non-farm and off-farm activities were relatively limited. Of the 669 individuals represented by the 100 interviewed households, non/off-farm activities occupied only 101 people for some limited months of the year. As shown in Figure IV.28, wage labor represented the largest non/off farm activities (33 individuals). Commerce followed, with 16 individuals.
Figure IV.28: Number of Individuals Engaged in Various Non/Off Farm Activities
Despite the fact that the numbers are relatively small, it is of interest to note that approximately 60% of all those affiliated with non/off-farm activities are from Phonkeo. Approximately 31% of inhabitants of Phonkeo were engaged in non/off-farm activities for some time of the year. Meanwhile, only 5% of the inhabitants of Thambing and only 3% of the inhabitants of Sopchat were doing so (Figure IV.29).
Figure IV.29: Percentage of Inhabitants with Non/Off-Farm Activities

52
After resettlement, the number of individuals engaged in non/off-farm activities fell from 101 to 36. This reduction is entirely explained by a significant reduction in Phonkeo and Sensi (Figure IV.30). Non/off-farm activities have thus become insignificant as fisheries activities now occupy a large number of inhabitants of Phonkeo and Sensi.
Figure IV.30: Number of Individuals Engaged in Non/Off-Farm Activities before and
after Resettlement
IV.8. Income Portfolio and Economic Benefits of Water
The results of the surveys conducted before and after resettlement and reservoir impoundment illustrate the gains and losses in terms of water benefits that the local communities derived from the river and the reservoir. For all 4 villages surveyed, the communities’ access to domestic water supply has drastically improved after the resettlement. This access saves a significant amount of time spent collecting water, especially for women and children who typically carry out this household chore. On the other hand, almost all river-based livelihood options were lost, with the exception of fishing. While all 4 villages experienced similar losses in some major economic activities, these losses are not evenly distributed across the villages and households.
The average income7
7 For the purpose of this study, total income includes not only cash income generated from selling products to markets or from non/off-farm income, but also includes the market value of goods (such as fisheries and agricultural products) consumed at home – generally referred as ‘imputed income’. Our definition of total income also includes remittances that may have been received by households. However, it does not include compensation in cash or in kind that may have been provided to resettled households by the development project. The rationale for excluding such compensation is that these are meant to be of a temporary nature.
portfolio of the affected communities changed from relatively diversified livelihoods that take full advantage of the Nam Gnouang River to livelihoods that are still very much in transition, with limited use of the new reservoir. Sources of income have become limited to fewer options that can turn profit with relatively short-term inputs, such as fishing

53
and collection of forest products. It appears that households have chosen different strategies to cope with the changes according to their new circumstances.
Before resettlement, average annual household income reached 35.3 million Kip, or 4,413 USD. In all 4 villages, agriculture was the most significant component of household income, contributing approximately 38 to 43% of the total income. In Sopchat and Thambing, fisheries were the second most important contributor to household income, while non-farm income was just as important as fisheries in Phonkeo and Sensi (Table IV.15).
Table IV.15. Percentage Share of Household Income from Different Sources Before Resettlement
Agriculture Fisheries Forests Non-farm Livestock Remittances Phonkeo 38.4 17.9 20.1 19.6 4.1 0.0 Sensi 42.8 22.3 13.2 18.1 3.5 0.0 Sopchat 38.9 31.2 16.2 3.0 7.4 3.2 Thambing 39.9 29.2 13.1 12.1 5.7 0.0
For the purpose of this analysis, households were grouped into 3 income groups: the lowest 25%, the middle 50% and the upper 25%. As shown in Figure IV.31, the average income of the upper 25% group is 67.6 million Kip. For the lowest 25% income group, the average income is 14.2 million Kip.
Figure IV.31: Income Levels by Income Group
Agriculture contributes to a larger share of income for the poorer income group (Figure IV.32). On the other hand, non/off-farm income contributes to a much larger share of income for the better-off group, compared to the other two income groups.
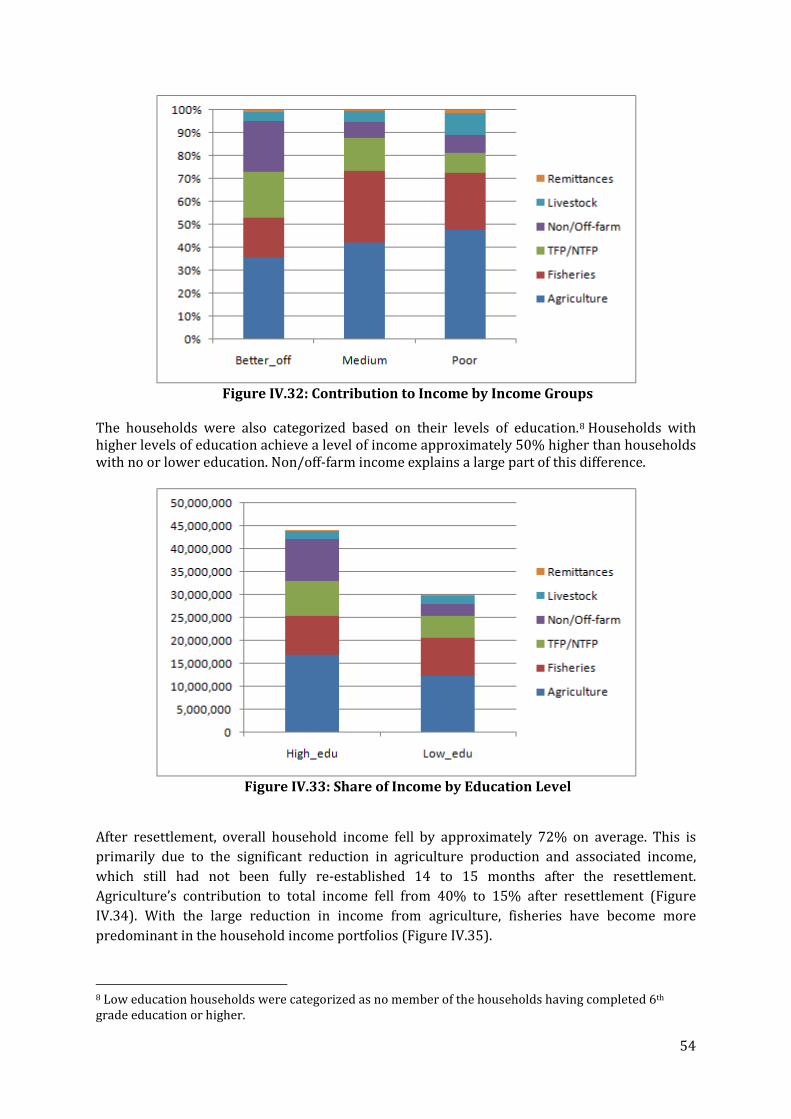
54
Figure IV.32: Contribution to Income by Income Groups
The households were also categorized based on their levels of education.8
Households with higher levels of education achieve a level of income approximately 50% higher than households with no or lower education. Non/off-farm income explains a large part of this difference.
Figure IV.33: Share of Income by Education Level
After resettlement, overall household income fell by approximately 72% on average. This is primarily due to the significant reduction in agriculture production and associated income, which still had not been fully re-established 14 to 15 months after the resettlement. Agriculture’s contribution to total income fell from 40% to 15% after resettlement (Figure IV.34). With the large reduction in income from agriculture, fisheries have become more predominant in the household income portfolios (Figure IV.35).
8 Low education households were categorized as no member of the households having completed 6th grade education or higher.

55
Figure IV. 34: Average household income after relocation
Figure IV.35: Share of Income Sources Before and After Resettlement
The reduction in income has impacted all villages, with the lowest reduction found in Sensi (70.4% reduction) and the highest in Sopchat (76.6%). Even the relatively more well off village of Phonkeo was severely impacted.
Figure IV.36: Income before and after Relocation by Village

56
Analysis of changes in fisheries income before and after resettlement revealed an association between the distance to the reservoir and the percentage loss of household income from fisheries; if the dwelling is more than 15 minutes walking distance from the reservoir, the households tend to invest less on boats and fishing gears and lose higher percentage of household income from fisheries after resettlement.
Trading activity increased with the daily presence of fish middlemen and access to the market by road after resettlement. However, revenue from non/off-farm activities decreased after resettlement due to the lack of opportunity as wage labor in farms, which involved 26% percent of the households before the resettlement and only 7% after resettlement.
The changes in income were also examined by income group (Figure IV.37). Note that the relatively poor households have been less impacted by resettlement than the better-off households. The total income of poor households, middle-income households and better-off households fell by 50%, 69% and 81%, respectively. Key to this result is the large reduction in farmland that was a key contributor (in absolute terms) to the income of better-off households. As observed in Figure IV.37, the major change across all income groups is the significant increase in the share of fisheries income to the total income and the associated reduction in the contribution of farm income.
Figure IV.37: Changes in Income by Income Groups
Before After

57
A similar shift is observed when looking solely at river/reservoir-related income, which is now almost exclusively made up of fisheries income (Figure IV.38).
Figure IV.38: Changes in river/reservoir-related income by income groups
The Nam Gnouang River contributed to approximately 38% of all income across all villages before resettlement (see Table III.3 for the definition of “river-based income”). This percentage was lower in Phonkeo (27.5%) and higher in the 3 other villages (approximately 44%). The absolute value of total reservoir-based income9
9 For estimating the water benefit of the Nam Gnouang Reservoir, we disaggregated the income generated directly from ecosystem goods and services derived from the reservoir (reservoir-based income), including fisheries, irrigated agriculture, and reservoir-related non-farm income, if any.
after resettlement is much lower compared to the total river-based income before resettlement in all villages, ranging from a 25% reduction in Sopchat to a 48.8% reduction in Phonkeo.
Before After

58
However, as a result of income reduction in land-based livelihood activities, reservoir-based sources of income occupy a greater share of the total income after resettlement. The overall dependency of household income on reservoir-based activities was higher in all the surveyed villages than the level of dependency on river-based activities before resettlement (Figure IV.39). This reflects the relative importance of income from fisheries as compared to other sources of income.
F Figure IV.39: Share of river-based income before resettlement and reservoir-based
income after resettlement
The overall results represent a transitional state of economic activities in the rural communities immediately after the shock of resettlement, rather than a fully evolved livelihood portfolio in a new environment. Extremely low income availability from all forms of agriculture production has resulted in the sudden dominance of fisheries income among all other possible income options available at the resettlement site.
IV.9. Conclusions: Redistribution of Water Use and Benefits After Resettlement
Resettlement due to hydropower development provided the affected households with homogenously designed compensation packages, including housing and farmland. In reality, various preconditions exist and influence the way in which the households have adapted to the changes in access to land and water resources, which seem to differ from village to village and from household to household. Further analysis is required to understand the association between particular adaptation strategies and the trajectories of evolving income portfolios over time, with consideration of the socioeconomic characteristics of each household, including wealth and educational background.
This analysis of the THXP development project shows that household livelihood portfolios changed considerably after the resettlement, with less income contribution from livestock, forest products, fisheries, and agriculture. Revenue generated from fisheries became more dominant. Economic value derived from the reservoir ecosystem is less diverse than the value
After

59
derived from the river ecosystem, with no agriculture on riverbank gardens, less NTFP from wetlands, and less revenue related to transportation services on the river. After resettlement, fisheries are still important and did not change significantly in terms of total quantity of fish catch. However, the access to, type and seasonality of the fisheries changed. This created an incentive for some households to invest more in fishing while discouraging others from continuing to fish.
The resettlement increased the accessibility to a reliable water source for all of the households, with the presence of public and private wells. As a result, domestic water consumption has significantly increased. Improved water access may create the opportunity for additional economic benefits, as well as saving time collecting water. The reservoir ecosystem is much less important to the local communities than the river ecosystem for several types of uses, including spiritual and domestic water use, but remained just as important, if not more, for fisheries. It is important to ensure that fisheries resources can be sustained so that their economic benefits can continue to support the recovery of the local livelihoods.
The resettlement process did not create homogenous conditions for all households within the resettlement sites. The physical access to the new reservoir and the cost of continuing the main economic activities, such as fisheries and raising livestock, are different from village to village. Households resettled farther away from the reservoir have chosen to invest less on fishing and are earning a smaller income from fisheries. These households may face difficulties in the future in being able to cope with the changes if their access to other types of livelihood strategies, including NTFP collection, is not secured in the long-term. With the absence of grazing land in the new resettlement area, large livestock have to be guarded in their old villages. This increases the operational costs, especially for the villages located farther away, and limits the ability of this economic activity to continue after resettlement.
Based on this case study, the key lessons include the necessity to understand the way rural communities access land and water resources in a variety of economic activities. There is a need for considering that the impact of lost access to the river ecosystem and its water source will vary between villages. The findings of the study provided insights for the future planning of resettlement processes and associated livelihood development programs.
The study team acknowledges that for a more comprehensive analysis of water benefits trade-offs before and after resettlement. Additional follow-up surveys will be needed in order to monitor the medium to long-term processes of local adaptation, as the communities recover from the shock of hydropower resettlement. A third survey of the same resettled communities was conducted and is currently in process of analysis. The results of the third survey shall provide additional information about the process of adjustment.
V. RESULTS OF DOWNSTREAM CASE STUDY
V.1. Description Of The Survey Area
71% of the households interviewed describe themselves as ethnically Lao, while 25% are Thaibor or Khaleang. Other ethnic groups represented are Tai Dom, Tai Daeng, Tai Meuag (each
60
representing less than 1 %), and mixed households (2%). There was no geographic specificity or village specificity for ethnic groups in the selected villages, unlike some upland villages in Lao PDR. The two main ethnic groups are represented in all villages surveyed.
100% of the surveyed households reported that they own their house. 98% of the households have at least one member who is literate and 71% of the households have a level of education up to grade 11 (equivalent to high school). There is no clear wealth divide among the surveyed households based on housing materials and assets. 45% of the households have access to electricity through solar panels and communication assets (telephone, radio, TV) are commonly owned.
This is an area that has been under the influence of a hydropower dam for quite some time. The area was first exposed to the Theun-Hinboun Hydropower Project, which was commissioned in 1998. Prominent environmental impacts that appeared immediately after the operation started include an overall increase in the volume and speed of the dry season river flow to a level similar to wet season, an increase in the silt and sediment loads, and severe bank erosion due to daily fluctuations in water levels (Warren 1999). THPC has assessed the changes in fisheries in this area and reported a decline in productivity between 1997 and 2004 (THPC 2008 RAP).
It was anticipated that the doubling of water releases following the completion of the THXP would cause additional changes in the Nam Hinboun River. The most significant of these changes would be wider fluctuations in flow volumes (0 m3/s to 220m3/s) and worsening of erosion/sedimentation problems already seen in the river. These problems would impact the shape of the waterway, the bottom substrate, aquatic biodiversity including fish, and riverbank use (Norplan 2008a).
As of 2013, all 7 villages where we conducted the survey were in the process of being relocated one at a time to new villages 1 to 5 kilometers from their original locations. The process is expected to continue until 2017. “Relocation” entails moving the residential areas farther away from the river to avoid potential flood damage, with the assistance from the hydropower company. However, the farmlands owned by the villagers will continue to be used as they will not be replaced by the company. Because of the uncertainty surrounding the terms of the relocation by village and by household, we only consider the patterns of river water uses before the villages were relocated and the sensitivity of each water use to the changes in the river flow regime in this analysis.
V.2. Sources Of Water
Despite the influence of previous hydropower development upstream and the general proximity to road networks and provincial towns, households in the survey area still heavily rely on natural sources of water, such as rivers, springs, and rain. 55% of the responses rely on the river as their primary source of water in dry season, while rain is a primary source in rainy season (51%).10
Approximately 47% of the households have access to public or private wells. Availability of spring water is village specific and only Thonglom and Vangmon have springs in both the dry and rainy seasons.
10 78 households selected more than one source of water in the dry season. In the rainy season, 119 households cited a combination of rain collected in water barrels and other sources of water (well, stream or spring) as primary sources of water supply.

61
Figure V.1: Share of water supply from different sources in dry and rainy seasons
No apparent differences in water collection effort or socioeconomic characteristics were found between the households relying on river water and the households with access to other sources.
The quantity and frequency of water collection from the river is higher in dry season than in rainy season because rainwater can be stored in barrels during the rainy season. The surveyed villagers also mention that it is more difficult to collect water from the river, compared to other sources. This is especially the case during the rainy season because of faster flow, current, and higher turbidity. 35% of the households using the river as a primary water source in dry season consider it difficult to collect water. Access to other sources of water is limited during the dry season but of those who have access to alternative sources, only 12.5% consider it difficult to collect water from these sources. The results show a similar pattern for the rainy season. This implies that, although local communities consider the river as an important source of water, the river is used because of the lack of alternatives, not because it is the most preferred source of water.
On average, the surveyed households collect 40% more water in the dry season (155 liters/day) than in rainy season (110 liters/day). Households go to collect water from the river more often for domestic uses in dry season (18 times/week) than in rainy season (11 times/week). This is likely due to the absence of water in their rainwater barrels during the dry season. The average time spent collecting water was 12 minutes in both dry and rainy seasons. This means that, on average, each household spends about 216 minutes (3.6 hours) per week on collecting water in dry season. This is less than half of the average time that the households located upstream of the Nam Gnouang Dam used to spend collecting water before their resettlements. The total quantity of water each household collects per day is very similar between these two sites.
It is unclear whether collecting water from the river will become more difficult or become easier after the new dam becomes fully operational. However, if the pattern of river flow becomes more unpredictable, it would likely disrupt water collection, which is typically carried out by women and children using their hands and plastic buckets.
The THPC assessment of the rate of “sufficient water access”11
11 Any household’s water access was considered insufficient if: 1) they rely on rivers, streams and unlined wells for drinking water in either season; 2) their water source goes dry in dry season; 3) the number of households using the same water point is 13 or greater; or 4) travel to a water source required greater than 15 minutes in either season. Only households that use an improved
in Zone 3C indicates a decline from 11% in 2008 to 3% in 2011, then a recovery to 23% in 2012. This is possibly due to the
Dry Season
River
Spring
Private Well
Public Well
Rain Water
Rain Season
River
Spring
Private Well
Public Well
Rain Water
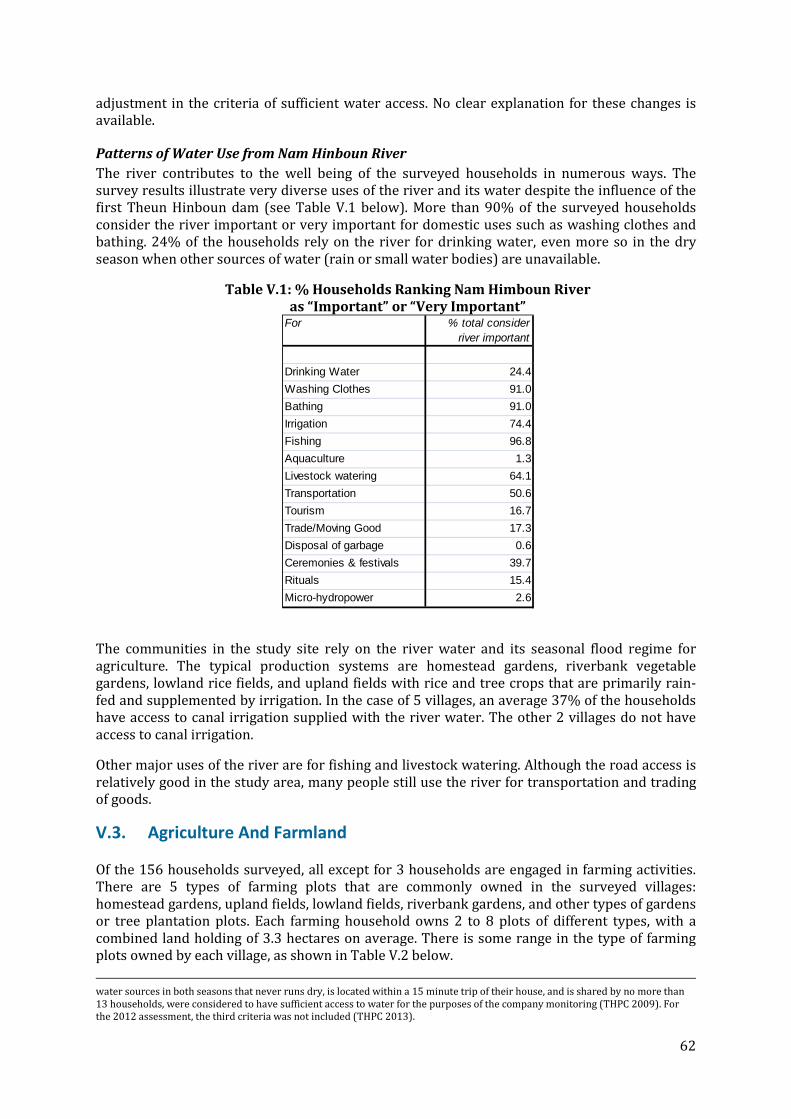
62
adjustment in the criteria of sufficient water access. No clear explanation for these changes is available.
Patterns of Water Use from Nam Hinboun River The river contributes to the well being of the surveyed households in numerous ways. The survey results illustrate very diverse uses of the river and its water despite the influence of the first Theun Hinboun dam (see Table V.1 below). More than 90% of the surveyed households consider the river important or very important for domestic uses such as washing clothes and bathing. 24% of the households rely on the river for drinking water, even more so in the dry season when other sources of water (rain or small water bodies) are unavailable.
Table V.1: % Households Ranking Nam Himboun River as “Important” or “Very Important”
The communities in the study site rely on the river water and its seasonal flood regime for agriculture. The typical production systems are homestead gardens, riverbank vegetable gardens, lowland rice fields, and upland fields with rice and tree crops that are primarily rain-fed and supplemented by irrigation. In the case of 5 villages, an average 37% of the households have access to canal irrigation supplied with the river water. The other 2 villages do not have access to canal irrigation.
Other major uses of the river are for fishing and livestock watering. Although the road access is relatively good in the study area, many people still use the river for transportation and trading of goods.
V.3. Agriculture And Farmland Of the 156 households surveyed, all except for 3 households are engaged in farming activities. There are 5 types of farming plots that are commonly owned in the surveyed villages: homestead gardens, upland fields, lowland fields, riverbank gardens, and other types of gardens or tree plantation plots. Each farming household owns 2 to 8 plots of different types, with a combined land holding of 3.3 hectares on average. There is some range in the type of farming plots owned by each village, as shown in Table V.2 below. water sources in both seasons that never runs dry, is located within a 15 minute trip of their house, and is shared by no more than 13 households, were considered to have sufficient access to water for the purposes of the company monitoring (THPC 2009). For the 2012 assessment, the third criteria was not included (THPC 2013).
For % total consider river important
Drinking Water 24.4Washing Clothes 91.0Bathing 91.0Irrigation 74.4Fishing 96.8Aquaculture 1.3Livestock watering 64.1Transportation 50.6Tourism 16.7Trade/Moving Good 17.3Disposal of garbage 0.6Ceremonies & festivals 39.7Rituals 15.4Micro-hydropower 2.6
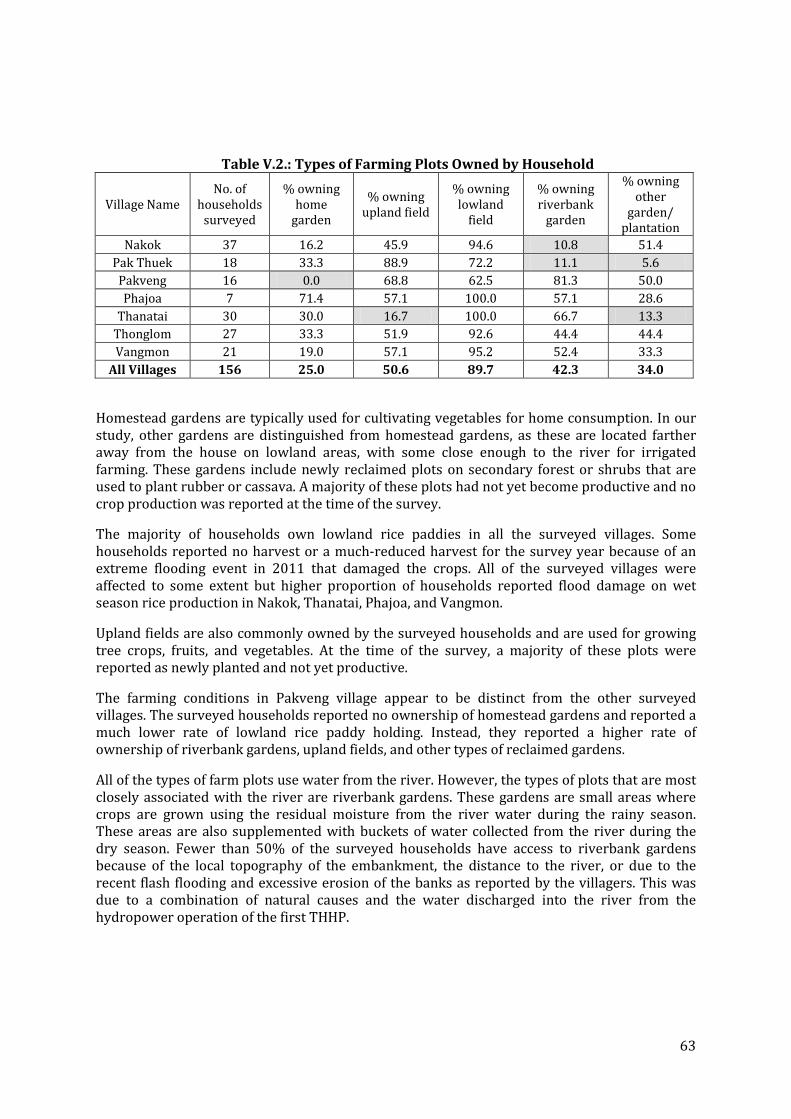
63
Table V.2.: Types of Farming Plots Owned by Household
Village Name No. of
households surveyed
% owning home
garden
% owning upland field
% owning lowland
field
% owning riverbank
garden
% owning other
garden/ plantation
Nakok 37 16.2 45.9 94.6 10.8 51.4 Pak Thuek 18 33.3 88.9 72.2 11.1 5.6
Pakveng 16 0.0 68.8 62.5 81.3 50.0 Phajoa 7 71.4 57.1 100.0 57.1 28.6
Thanatai 30 30.0 16.7 100.0 66.7 13.3 Thonglom 27 33.3 51.9 92.6 44.4 44.4 Vangmon 21 19.0 57.1 95.2 52.4 33.3
All Villages 156 25.0 50.6 89.7 42.3 34.0
Homestead gardens are typically used for cultivating vegetables for home consumption. In our study, other gardens are distinguished from homestead gardens, as these are located farther away from the house on lowland areas, with some close enough to the river for irrigated farming. These gardens include newly reclaimed plots on secondary forest or shrubs that are used to plant rubber or cassava. A majority of these plots had not yet become productive and no crop production was reported at the time of the survey.
The majority of households own lowland rice paddies in all the surveyed villages. Some households reported no harvest or a much-reduced harvest for the survey year because of an extreme flooding event in 2011 that damaged the crops. All of the surveyed villages were affected to some extent but higher proportion of households reported flood damage on wet season rice production in Nakok, Thanatai, Phajoa, and Vangmon.
Upland fields are also commonly owned by the surveyed households and are used for growing tree crops, fruits, and vegetables. At the time of the survey, a majority of these plots were reported as newly planted and not yet productive.
The farming conditions in Pakveng village appear to be distinct from the other surveyed villages. The surveyed households reported no ownership of homestead gardens and reported a much lower rate of lowland rice paddy holding. Instead, they reported a higher rate of ownership of riverbank gardens, upland fields, and other types of reclaimed gardens.
All of the types of farm plots use water from the river. However, the types of plots that are most closely associated with the river are riverbank gardens. These gardens are small areas where crops are grown using the residual moisture from the river water during the rainy season. These areas are also supplemented with buckets of water collected from the river during the dry season. Fewer than 50% of the surveyed households have access to riverbank gardens because of the local topography of the embankment, the distance to the river, or due to the recent flash flooding and excessive erosion of the banks as reported by the villagers. This was due to a combination of natural causes and the water discharged into the river from the hydropower operation of the first THHP.

64
Table V.3: Status of land holding and irrigation
Type of land Owned by % of HHs
Average plot size/HH
(hectares)
% irrigated (water source)
Irrigation methods
Home garden 25 0.2 52% (River) 10% (Pond) 8% (Well)
68% - Bucket 5% - Canal
Upland field 50.6 1.22 13% (River) 13% - Bucket (for seed germination
only)
Lowland field 89.7 1.37 32% (River) 32% - Canal +
pump
River bank garden 42.3 0.18 83% (River) 5% (Stream)
88%-Bucket
Other garden/plantation
34 1.1 28% (River) 28% - Bucket
Nearly 90% of the surveyed households own lowland rice fields but only 32% of the plots were reported to have access to canal irrigation supplied with the river water. Respondents from Nakok, Thanatai, Phajoa, Phak Thuek, and Vangmon villages reported having significant income from irrigated agriculture through canal systems. Meanwhile, Pakveng and Thonglom have no reported canal irrigation access and rely primarily on rainwater and receding floodwater for farming.
If the access to the river water and banks becomes more restrictive and/or crops get damaged due to the additional changes in the flow regime of the Nam Himboun River, all farming activities will be affected one way or another. Given its sensitivity to changes in the river flow and to the seasonal flooding cycle, crops produced using riverbank gardens in Zone 3C are most likely to be affected by the upstream hydropower operation. Some riverbank gardens may become unavailable due to the increased river flow during the dry season and due to bank erosion. The exact magnitude of the future loss is very difficult to estimate due to the lack of precise information on the operational schedule of the hydropower dam, the expected changes in river discharge patterns, and how the river morphology will respond to these changes.
Lowland rice paddy fields are the most predominant production system in these villages and also heavily rely on the natural flood pattern of the river and associated floodplains. However, improved access to irrigation can help mitigate any loss in wet season paddy rice production and can assist with dry season rice production. As in the past, THPC has been assisting some of these villages by improving canal and pump irrigation schemes. There is thus a potential for increasing the benefits of the river water despite the changes in seasonal flows. According to the company’s monitoring, the percentage of households with at least 1 hectare of rice paddy fields in the wet or dry seasons has increased in Zone 3C, from 41% in 2008 to 66% in 2011 (THPC 2012b).
Wet season paddy rice production in this area was devastated by extreme flood events in 2008 and 2011 (THPC 2013). This makes year-to-year comparisons difficult in terms of understanding the impact of hydropower operation and relocation.
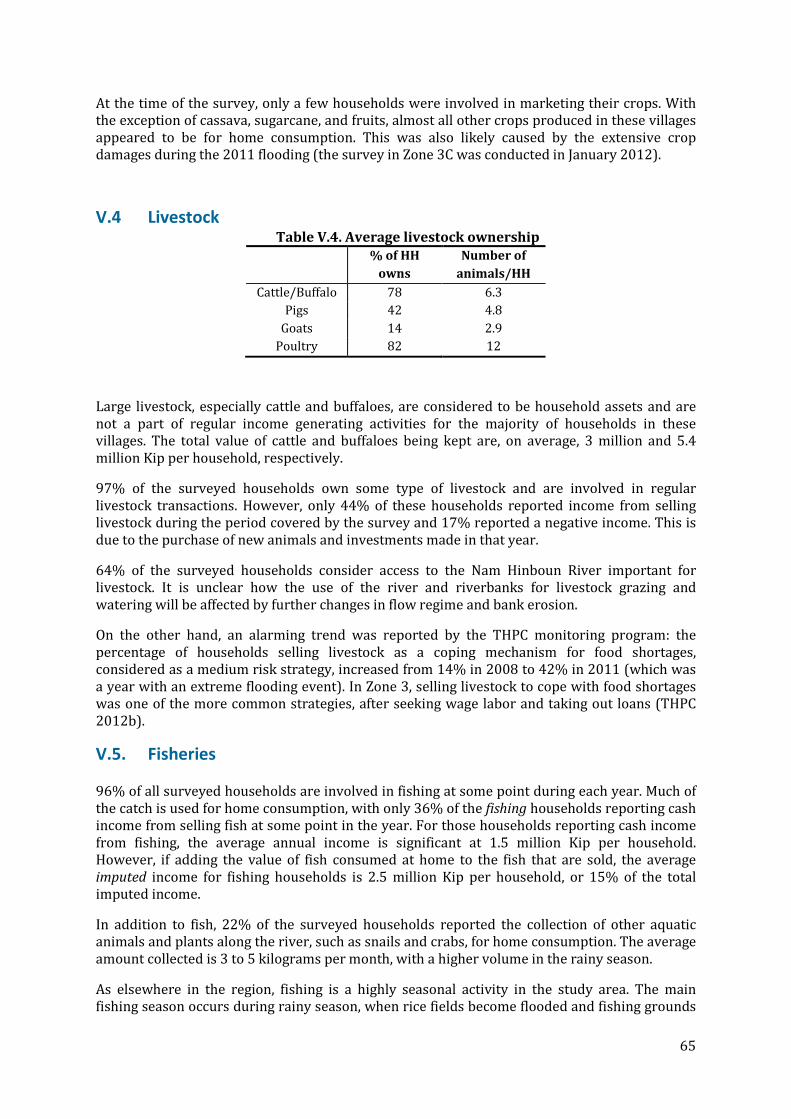
65
At the time of the survey, only a few households were involved in marketing their crops. With the exception of cassava, sugarcane, and fruits, almost all other crops produced in these villages appeared to be for home consumption. This was also likely caused by the extensive crop damages during the 2011 flooding (the survey in Zone 3C was conducted in January 2012).
V.4 Livestock
Table V.4. Average livestock ownership
Large livestock, especially cattle and buffaloes, are considered to be household assets and are not a part of regular income generating activities for the majority of households in these villages. The total value of cattle and buffaloes being kept are, on average, 3 million and 5.4 million Kip per household, respectively.
97% of the surveyed households own some type of livestock and are involved in regular livestock transactions. However, only 44% of these households reported income from selling livestock during the period covered by the survey and 17% reported a negative income. This is due to the purchase of new animals and investments made in that year.
64% of the surveyed households consider access to the Nam Hinboun River important for livestock. It is unclear how the use of the river and riverbanks for livestock grazing and watering will be affected by further changes in flow regime and bank erosion.
On the other hand, an alarming trend was reported by the THPC monitoring program: the percentage of households selling livestock as a coping mechanism for food shortages, considered as a medium risk strategy, increased from 14% in 2008 to 42% in 2011 (which was a year with an extreme flooding event). In Zone 3, selling livestock to cope with food shortages was one of the more common strategies, after seeking wage labor and taking out loans (THPC 2012b).
V.5. Fisheries 96% of all surveyed households are involved in fishing at some point during each year. Much of the catch is used for home consumption, with only 36% of the fishing households reporting cash income from selling fish at some point in the year. For those households reporting cash income from fishing, the average annual income is significant at 1.5 million Kip per household. However, if adding the value of fish consumed at home to the fish that are sold, the average imputed income for fishing households is 2.5 million Kip per household, or 15% of the total imputed income.
In addition to fish, 22% of the surveyed households reported the collection of other aquatic animals and plants along the river, such as snails and crabs, for home consumption. The average amount collected is 3 to 5 kilograms per month, with a higher volume in the rainy season.
As elsewhere in the region, fishing is a highly seasonal activity in the study area. The main fishing season occurs during rainy season, when rice fields become flooded and fishing grounds
% of HH owns
Number of animals/HH
Cattle/Buffalo 78 6.3 Pigs 42 4.8
Goats 14 2.9 Poultry 82 12
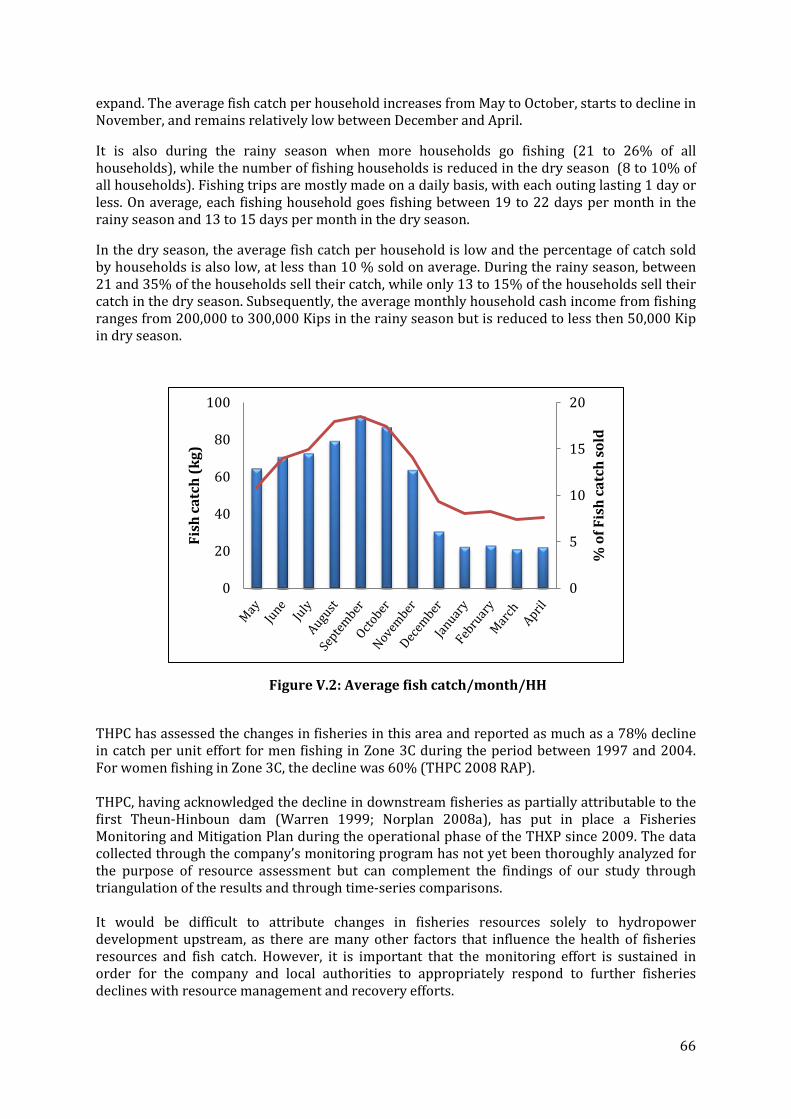
66
expand. The average fish catch per household increases from May to October, starts to decline in November, and remains relatively low between December and April.
It is also during the rainy season when more households go fishing (21 to 26% of all households), while the number of fishing households is reduced in the dry season (8 to 10% of all households). Fishing trips are mostly made on a daily basis, with each outing lasting 1 day or less. On average, each fishing household goes fishing between 19 to 22 days per month in the rainy season and 13 to 15 days per month in the dry season.
In the dry season, the average fish catch per household is low and the percentage of catch sold by households is also low, at less than 10 % sold on average. During the rainy season, between 21 and 35% of the households sell their catch, while only 13 to 15% of the households sell their catch in the dry season. Subsequently, the average monthly household cash income from fishing ranges from 200,000 to 300,000 Kips in the rainy season but is reduced to less then 50,000 Kip in dry season.
Figure V.2: Average fish catch/month/HH
THPC has assessed the changes in fisheries in this area and reported as much as a 78% decline in catch per unit effort for men fishing in Zone 3C during the period between 1997 and 2004. For women fishing in Zone 3C, the decline was 60% (THPC 2008 RAP). THPC, having acknowledged the decline in downstream fisheries as partially attributable to the first Theun-Hinboun dam (Warren 1999; Norplan 2008a), has put in place a Fisheries Monitoring and Mitigation Plan during the operational phase of the THXP since 2009. The data collected through the company’s monitoring program has not yet been thoroughly analyzed for the purpose of resource assessment but can complement the findings of our study through triangulation of the results and through time-series comparisons. It would be difficult to attribute changes in fisheries resources solely to hydropower development upstream, as there are many other factors that influence the health of fisheries resources and fish catch. However, it is important that the monitoring effort is sustained in order for the company and local authorities to appropriately respond to further fisheries declines with resource management and recovery efforts.
0
5
10
15
20
0
20
40
60
80
100
% o
f Fis
h ca
tch
sold
Fish
catc
h (k
g)

67
V.6. Income Portfolio And Economic Benefits Of Nam Hinboun River The average annual imputed income for the surveyed households in Zone 3C was 17 million Kip. This is less than half of the average imputed income of Zone 1 communities surveyed in the upstream study, before resettlement. It is important to note that the survey was conducted after a year of extreme flooding in the entire region. Although the survey team asked the respondents to report crop production figures in an average year, the results inevitably reflect the flood damage experienced by the villages. The average income for the same zone for the same year estimated by the THPC monitoring program was 16.3 million Kip (THPC 2012b), similar to the result of our survey.
According to the THPC social monitoring program, Zone 3C was the poorest zone among all impact zones of THXP, with the lowest average combined imputed income from all sources. The company also noted that the area suffers from year-to-year fluctuations in seasonal flood regimes and this results in income portfolio changes each year (THPC 2012b).
Based on our survey in 2011, the largest proportion of household income came from crop agriculture (38.8%), followed by remittances (16.4%) and fisheries (15%). One of the characteristics of this Zone is the importance of income from wage labor and remittances, as well as the relatively higher rate of indebtedness (THPC 2012b).
Figure V.3: % share of average houshold income from different sources (including value of items consumed at home)
There are significant differences in the total average income and the income portfolio from village to village. Pakveng, the poorest village among the surveyed villages in Zone 3C in terms of imputed total income, receives very little income from remittances and relies more on fishing than agriculture for cash income generation. Agriculture production is almost entirely for home consumption. The villagers do not own upland farm plots, which are typically used for cash crop cultivation in these areas, nor do they have access to dry season irrigation.
38.8
6.9 15.0
9.0
13.9
16.4
Agriculture
Livestock
Fisheries
Forestry
Non farm
Total = 17 million
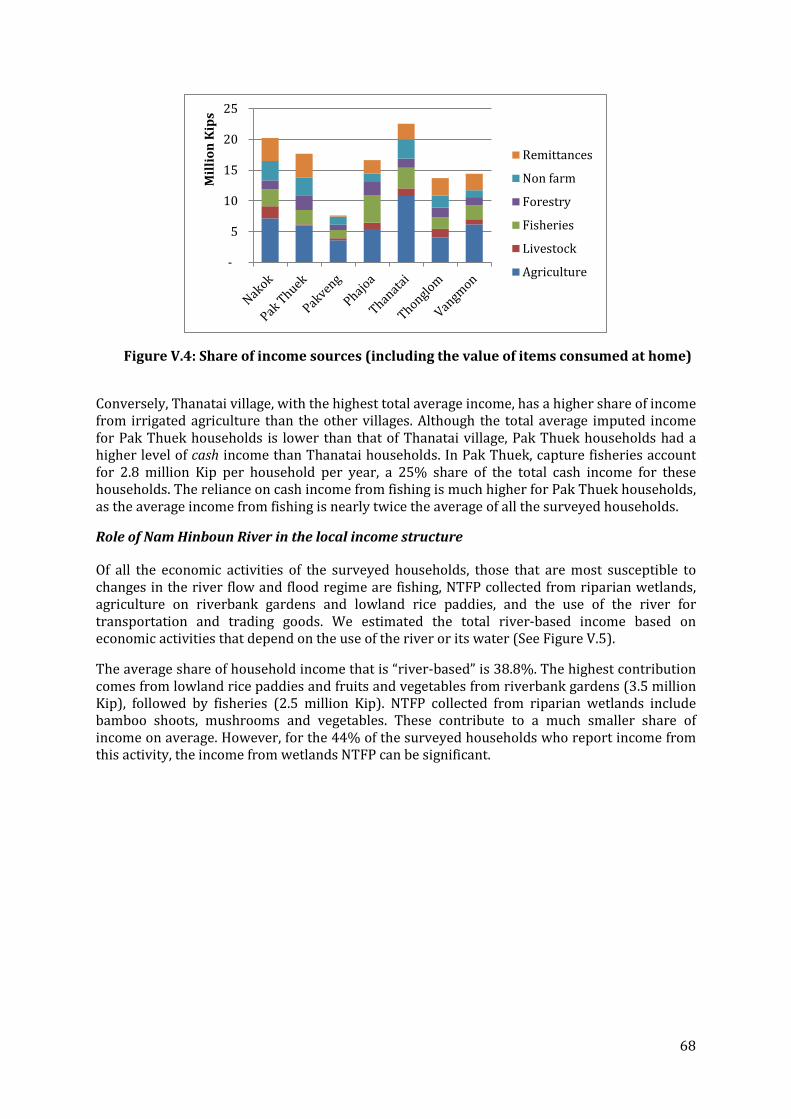
68
Figure V.4: Share of income sources (including the value of items consumed at home)
Conversely, Thanatai village, with the highest total average income, has a higher share of income from irrigated agriculture than the other villages. Although the total average imputed income for Pak Thuek households is lower than that of Thanatai village, Pak Thuek households had a higher level of cash income than Thanatai households. In Pak Thuek, capture fisheries account for 2.8 million Kip per household per year, a 25% share of the total cash income for these households. The reliance on cash income from fishing is much higher for Pak Thuek households, as the average income from fishing is nearly twice the average of all the surveyed households.
Role of Nam Hinboun River in the local income structure
Of all the economic activities of the surveyed households, those that are most susceptible to changes in the river flow and flood regime are fishing, NTFP collected from riparian wetlands, agriculture on riverbank gardens and lowland rice paddies, and the use of the river for transportation and trading goods. We estimated the total river-based income based on economic activities that depend on the use of the river or its water (See Figure V.5).
The average share of household income that is “river-based” is 38.8%. The highest contribution comes from lowland rice paddies and fruits and vegetables from riverbank gardens (3.5 million Kip), followed by fisheries (2.5 million Kip). NTFP collected from riparian wetlands include bamboo shoots, mushrooms and vegetables. These contribute to a much smaller share of income on average. However, for the 44% of the surveyed households who report income from this activity, the income from wetlands NTFP can be significant.
-
5
10
15
20
25
Mill
ion
Kip
s
Remittances
Non farm
Forestry
Fisheries
Livestock
Agriculture

69
Figure V.5: Share of river-based income
The share of river-based income is highest in Phajoa, Thanatai, and Vangmon, where it exceeds 50% of the total generated income. In Thanatai and Vangmon, irrigated agriculture accounts for an overwhelming majority of the river-based income. In Phajoa and Nakok, agriculture and fisheries contribute equally to the average river-based income. In Pakveng and Thonglom, where the total river-based income is the lowest among the surveyed villages, income from irrigated agriculture is much lower than income from fishing.
To summarize, the villages are characterized by how sensitive they are to the downstream influences of the hydropower project in Table V.5.
Table V.5: Average household sensitivity to changes in the Nam Hinboun River by village
Village Name No. of
households surveyed
No. owning lowland
rice field
No. owning
riverbank gardens
Total income (million
Kip)
% river-based
imputed income
% imputed income
from fishing
% imputed income
from river-based
agriculture
Relative sensitivity
to changes
in the river
Nakok 37 35 4 20.2 25.9 13.7 11.7 Low Pak Thuek 18 13 2 17.7 24.0 13.3 8.3 Low
Pakveng 16 10 13 7.6 30.9 17.9 12.2 High Phajoa 7 7 4 16.6 53.2 27.2 25.9 High
Thanatai 30 30 20 22.5 54.1 14.8 39.0 Medium Thonglom 27 25 12 13.7 18.1 13.6 3.5 Low Vangmon 21 20 11 14.4 55.2 16.0 38.9 Medium
All Villages 156 140 66 17.0 38.8 15.0 20.9
0
10
20
30
40
50
60
0
5
10
15
20
25
Mill
ion
Kip
s
Non river-based income
River-based income
% River-based income
70
V.7. Conclusions: Sensitivity Of Water Uses And Users To Changes In River Water The surveyed households had already been affected by environmental impacts caused by the first Theun-Hinboun Hydropower Project (THHP), which was commissioned in 1998. During the planning of THXP, the company acknowledged the past decline of downstream fisheries, as well as the vulnerability of fisheries and wet season rice production in Zone 3 to additional impacts from the expansion project. To avoid and mitigate further negative impacts, the company has proposed relocation of residential areas and livelihood assistance to the local communities (Norplan 2008b).
The dependency of the surveyed households on the access to river and river water for domestic uses and main economic activities such as farming, fishing and livestock, is still very high, despite having been under the influence of the first dam for over a decade. The imminent relocation of their residential homes to new villages away from the river, with associated new infrastructure and services to be provided by the company, will dramatically transform the communities’ overall livelihoods. This relocation will also change the way these households access water resources from various sources, including the river, and the way economic activities associated with water resources are derived.
The relocation and associated assistance are expected to bring safety to the villagers’ lives and property from extreme flooding, as well as provide positive improvements to their livelihoods. A major improvement will be the increased access to alternative sources of domestic water, which is particularly beneficial for Nakok and Pak Thuek villages as they still rely on river water for drinking during the dry season. Livelihoods will also benefit from gaining market access through road infrastructure. Improved road access is expected to create more opportunities for wage labor and cash income generation from the marketing of crops and other farm products.
There is still uncertainty surrounding the magnitude of changes in river flow and flooding patterns, as well as the specific terms of the relocation for each village and household. It is therefore difficult to estimate the expected changes to overall income, livelihood portfolios, and water resource availability and access for the affected households. However, from the analysis of the current level of household dependency on river-based economic activities, we can hypothesize that households who generate higher shares of revenue from fishing, wetland NTFP, riverbank farming, and lowland rice farming are more susceptible to the changes in the river flow and flooding regime caused by the hydropower project.
First, crop production systems using riverbank gardens and lowland floodplains rely on the natural seasonal fluctuations in water levels and are thus the most sensitive form of farming to changes in river flow and river water access. All surveyed villages rely on these land plots for farming and are likely to be affected through the loss of agriculture production from these plots.
On the other hand, the provision of dry season irrigation schemes has already started in some of these villages and has increased acquired benefits from the river through the ability to produce rice and other crops in the dry season. Among the surveyed villages, those who have access to dry season canal irrigation schemes appear to be relatively better off in terms of overall income than those who do not have access to canal irrigation, i.e. Pakveng and Thonglom villages.
Second, further declines in capture fisheries are expected and will result in an overall reduced benefit of the river for local livelihoods, both in terms of cash income and of food. The degree of decline is very difficult to predict but will have significant impact on the local communities. Phajoa has the highest share of imputed income from fishing and thus is likely to be the most affected. While the share of income from fishing is lower in Pakveng than in Phajoa, it is also likely to be severely impacted because the village has the lowest total income level among the

71
surveyed villages. Moreover, relocation of villagers’ houses to new sites 1 to 5 kilometers away from their current locations will influence the decisions of individual households about whether or not to continue fishing and about how much effort and investment will be devoted to this economic activity.
From this analysis, we conclude that all the surveyed villages will be affected. While there may be some positive impacts, changes in the river flow will mainly result in a negative effect. It is thus important to provide villages and households with a variety of options to make up for losses in livelihoods and income as the communities go through the transition period during and after the relocation process. Each households and village will be affected differently, according to individual dependency on different types of economic activities and river uses.
Further expansions of dry season irrigation schemes have a high potential for increasing the river benefits for the affected communities and compensating for the loss of other forms of livelihood and income generation. These schemes can take advantage of the increased flow during the dry season.
This analysis does not take the new conditions at the relocation sites and the associated infrastructure and services to be provided there into account. The hydropower company will conduct long-term monitoring of the relocated communities, which can allow for future assessments of changes to river-based economic activities and to patterns of water use by the same communities.
VI. RECOMMENDATIONS: HOW TO SUSTAIN WATER BENEFITS FOR LOCAL COMMUNITIES
Based on the findings of the two case studies, the following recommendations can be considered for future improvements in the design of hydropower resettlement and compensation programs in order to sustain the water benefit for affected local communities in the Lower Mekong region and possibly elsewhere:
• During the transition period after resettlement, affected households rely more on natural resources for food and income. It is important to ensure that resettled communities have access to fisheries resources and forests near their new village sites.
• Resettled households make their own decisions on coping strategies based on a number of factors regarding their conditions within a new village. Compensation programs need to take into consideration the differences within the resettlement sites in terms of access to water resources, the reservoir, and forests, as well as differences in the distance to the original villages, farmlands, and grazing lands. This is important because these areas may continue to contribute to livelihoods and income generation.
• It is difficult for the households to keep livestock within the resettlement site unless extra space is allocated for them. This is especially true for cows and buffaloes, which are important income safety nets. Specific support is needed to enable livestock-based activities to continue around the resettlement site.
• Capture fisheries have the highest potential for increasing the economic value of the hydropower reservoir for local community use. It is important that reservoirs are designed to sustain fisheries productivity and that they are managed to ensure that the fisheries resources are sustainable enough to continue benefitting the local communities.
• Cash-based activities, rather than subsistence activities, become more important to resettled communities. More skills training and other forms of support are needed to

72
help communities re-establish a range of income generating activities. These activities can be farming-based, such as selling produce, or can be off-farm wage work.
• In resettled villages, domestic water access has dramatically improved and has made more time available for women and children for income generation through other activities or for schooling. Support should be provided to take advantage of this opportunity.
• The “After Resettlement” survey was conducted too soon to document the full transformation of the livelihood portfolios of the affected communities, as well as the evolution of the new reservoir uses. Follow-up surveys are needed and will help us understand local adaptation strategies to hydropower resettlement.
• Fisheries in the Nam Gnouang Reservoir have shown signs of gradual decline, however, the resource’s status has not been assessed. More research is needed in regards to monitoring, sustaining and enhancing fisheries resources in hydropower reservoir conditions.
73
REFERENCES ICEM (International Centre for Environmental Management) 2010. Final report of the MRC Strategic Environmental Assessment of hydropower on the Mekong mainstream for the MRC. International Center for Environmental Management, Hanoi, Vietnam.
IFC (International Finance Corporation). 2013. River Health, Environmental Flows, and Cascade Management in Lao PDR. International Finance Corporation. http://www.ifc.org/wps/wcm/connect/region__ext_content/regions/east+asia+and+the+pacific/countries/eap-hydro-envflows - accessed 19/11/2013. International Rivers. Laos. http://www.internationalrivers.org/campaigns/mekong-mainstream-dams. Accessed 23/11/2013. Katus, S. 2012. Where local power meets hydropower: conceptualizing resettlement along the Nam Gnouang River in Lao PDR. Master’s Thesis for University of Amsterdam. January 2012.
MEM (Ministry of Energy and Mines). 2013. Overview of Electric Power Plants in Laos. Department of Energy Business, Ministry of Energy and Mines. Lao PDR. March 2013. http://www.poweringprogress.org/index.php?option=com_jotloader&cid=10&Itemid=91 - accessed 23/11/2013. MEM (Ministry of Energy and Mines). 2012. Overview of the Lao Power Development Program. Department of Energy Policy and Planning, Ministry of Energy and Mines. Lao PDR. Presentation by Khamso Kouphokham at the 2nd EAS Energy Efficiency Conference, Phnom Penh, Cambodia. 31st July - 1st August 2012. Norplan. 2008a. Theun Hinboun Expansion Project: Final Environmental Impact Assessment/Environmental Management and Monitoring Plan (EIA/EMMP), Norplan.
Norplan. 2008b. Theun Hinboun Expansion Project: Final Report Resettlement Action Plan (RAP). Norplan.
Räsänen, T.A. and Kummu, M. 2013. Catchment hydrology and its modeling in Nam Theun-Nam Kading (Lao PDR) and in Sesan (Cambodia and Vietnam) River Catchments. Report for the Challenge Program on Water & Food Mekong project MK3 “Optimizing the management of a cascade of reservoirs at the catchment level”. ICEM – International Centre for Environmental Management, Hanoi Vietnam, 2012.
Sioudom, K. 2013. Basin Profile for the Nam Theun/Nam Kading, Nam Hinboun and Xe Bang Fai, Lao PDR. Project report: Challenge Program on Water & Food Mekong project MK3 “Optimizing the management of a cascade of reservoirs at the catchment level”. ICEM – International Centre for Environmental Management, Hanoi Vietnam, 2013.
Springate-Baginski, O., Allen D., and Darwall W. (eds.) 2009. An Integrated Wetland Assessment Toolkit - Strengthening Pro-Poor Wetland Conservation Using Integrated Biodiversity and Livelihood Assessment, IUCN Species Programme Fresh Water Biodiversity Unit, International Union for Conservation of Nature, Cambridge, UK.

74
The World Bank. 2012. Lao PDR Power to the People: Twenty Years of National Electrification. The World Bank. Asia Sustainable and Alternative Energy Program. 2012. THPC (Theun-Hinboun Power Company). 2012a. THPC Response to International Rivers. December 11, 2012. THPC Ltd. Vientiane, Lao PDR. THPC (Theun-Hinboun Power Company). 2012b. THPC Social and Environmental Monitoring Report 2012. THPC Ltd. Vientiane, Lao PDR.
THPC (Theun-Hinboun Power Company). 2010. THPC Response to Banktrack. May 24, 2010. http://www.thpclaos.com/images/stories/pages/documents/thpc-letter-banktrack-24may10.pdf - accessed 18/11/2013
THPC (Theun-Hinboun Power Company). 2013a. THPC Social and Environmental Division Monitoring Report 2012. THPC Ltd. Vientiane, Lao PDR.
THPC (Theun-Hinboun Power Company). 2013b. THPC Response to International Rivers and FIVAS May 2, 2013. http://www.thpclaos.com/images/stories/pages/documents/THPC_RESPONSE_IR_FIVASMay2013.pdf
THPC Web. The Theun-Hinboun Power Company website. http://www.thpclaos.com/index.php?option=com_content&view=article&id=37&Itemid=208&lang=en. Accessed 19/11/2013. Vientiane Times. January 12, 2013. Theun-Hinboun hydro expansion project powers up. Vientiane Times. January 16, 2013. Laos commits to build sustainable hydropower plant. http://mekong.waterandfood.org/archives/1627
Vientiane Times. January 19, 2013. Families adjust to new life after losing homes to Theun-Hinboun dam expansion. Vientiane Times. June 7, 2013. Theun-Hinboun spends on social measures. Warren, T. J. 1999. A monitoring study to assess the localized impacts created by the Nam Theun-Hinboun hydro-scheme on fisheries and fish populations. Final report prepared for the Theun-Hinboun Power Company, Vientina,e Lao PDR.
Xinhua. June 2012. http://www.globaltimes.cn/content/716396.shtml. Accessed 20/11/2013.