
Water Report 2015 - Qualicum Beach
28
Town of Qualicum Beach Annual Water Report 2015
Transcript of Water Report 2015 - Qualicum Beach

Town of Qualicum Beach
Annual Water Report 2015

Page 2 of 28 Town of Qualicum Beach Annual Water Report 2014
Introduction
As a water purveyor, the Town of Qualicum Beach has a duty to ensure an adequate supply of high quality water for all uses. Our residents expect to get clean potable water from their taps every day. The Town of Qualicum Beach consistently aims to provide the highest possible quality of water to its consumers through the monitoring, testing, and maintenance of its water system. As a supplier under the British Columbia Drinking Water Protection Act, the Town of Qualicum Beach is required to provide an annual report on the quality of the water and its distribution.
This annual report is intended to present an overview of the water system and provide a better understanding of the process with which the water is supplied, treated and monitored.
Operators
It is the responsibility of the Town to ensure that those involved in the management of the water system are properly trained and educated to the required standards. All water distribution operators routinely attend courses and conferences to continually improve their education and knowledge base. The Qualicum Beach Water Department is staffed by 4 EOCP certified operators of varying levels including one level 3 operator and three level 2 operators.
Water System Review
The Town draws water from 2 ground water sources; the River well field and the Berwick well field. Both well fields are high quality and quantity deep well sources. The primary supply comes from the River well field, with the Berwick well field supplying auxiliary support for peak summer demands. During peak demand the wells produced a combined 188.3 l/s which would provide a theoretical max production of 16300 m3/day. In 2015 the combined total production of the well fields was 1.45 million m3. This is a volumetric decrease of 8% from last year’s total (1.57million m3).

Page 3 of 28 Town of Qualicum Beach Annual Water Report 2014 The River well field (Figure 1.), is comprised of 7 wells and is located on the northwest corner of the Town’s boundary. The well field draws water from the deltaic deposits of the Little Qualicum River. Of these 7 wells, 5 are currently used for production with one needing additional disinfection equipment and one having been decommissioned and is now used as a provincial monitoring well.
The Berwick well field (Figure 2.) is one of the Town’s original water supplies. There are 4 active production wells which provide approximately 37% of the water during peak summer demand. This well field is considered to be an auxiliary source and is only used for peak times of the year. The aquifer is “rested” for recharge during the low demand months of the winter and as a result is exhibiting rising and recovering water levels in contrast to many of the aquifers in the area.
The distribution system is a looped system made up of over 100km of pipe. The pipe used ranges in both sizes and materials. The majority of pipe is PVC, with the older pipe being either AC (asbestos/cement) or Cast Iron. The system is flushed annually by the operators. The flow rates used during the flushing process are monitored to ensure proper scouring of the pipes occurs, and that the process is having the desired effect. A total of 1350 m3 were systematically flushed throughout the distribution network.
The system is gravity fed with the water being pumped from the well fields to one of the 3 reservoir locations; Jones St, Berwick, or Village Way. There are 5 reservoirs in total, with a combined capacity of 9100 m3 or 9.1 million litres. The reservoirs feed 4 different pressure zones. These pressure zones are designed to ensure that there is enough pressure to meet fire flow requirements in all areas of the community, as well as provide adequate pressure to the consumers.
Monitoring
Through the use of SCADA (Supervisory Control and Data Acquisition) the water system is constantly being monitored. With the use of laptops and smart phones, operators are able to not only remotely monitor the system, but also make changes to the system in the case that an adjustment is needed. In addition to the use of the SCADA system, daily system inspections are done at all booster stations and wellheads by the operators.

Page 4 of 28 Town of Qualicum Beach Annual Water Report 2014
Treatment
The river well field supply water is treated with both UV disinfection and Chlorination as prescribed by the Vancouver Island Health Authority (VIHA). The primary treatment is done by UV disinfection, with Chlorination being used as a secondary treatment. The UV disinfection is dosed at 80 mJ/cm2. This ensures a 4-log inactivation of Rotavirus which is the target organism in the disinfection process. This is followed by chlorine injection to provide a distribution system residual and a measurable sentinel throughout the system. Chlorination by-products are not a concern as the chlorine dosage is low, and the water chemistry does not identify any complicating components.
Sampling and Testing
Weekly bacteriological testing is done for Total, Fecal and E. Coli. Coliform bacteria, as well as lactose fermentors, total aeromonas, sulphur reducing and iron reducing bacteria, yeast, fungi and total plate count. Water samples are taken weekly from at least 2 of the 9 sample stations throughout the Town on a rotational basis. These station locations were chosen in conjunction with the E.H.O. to reflect the water quality throughout the distribution system from its source out to the furthest boundaries.
The bacteriological testing is done in triplicate with one sample forwarded to VIHA for testing at BCCDC and the two other duplicate samples sent to Maxxam and M.B. Labs. This redundancy in testing is done to ensure the accuracy of the results for immediate and proper interpretation, to make certain correct sampling and lab work has been done, and for the identification and elimination of false positive results with confidence.
A full chemical analysis is also done on the raw water. This is completed annually as per the The Guidelines for Canadian Drinking Water Quality and gives us a better understanding of the overall quality of the water and its makeup.
In addition to the required sampling parameters set out by VIHA and The Guidelines for Canadian Drinking Water Quality, the wells are tested on a rotational basis, for site specific pollutant concerns. The Berwick wells are tested for herbicides, pesticides and fertilizer related compounds that may be associated with the activities of the adjacent golf course, while the River wells are tested for light and heavy extractable petroleum hydrocarbons (LEPH/HEPH), polycyclic aromatic hydrocarbons (PAH), gasoline constituents (BTEX) and cyanide that are potential contaminants from the adjacent

Page 5 of 28 Town of Qualicum Beach Annual Water Report 2014 highway. Additionally, three off site monitoring wells are located north and east of the River well supply to monitor the potential impacts of a gas station located across the highway and cross gradient from the wells.
Cross Connection Program
The cross connection control program is based on premise isolation. The standard water service box and meter setter specified for use in the Town contains a double check valve. Locations that are of greater risk may have alternate devices specified commensurate with the threat of contamination. There are currently 2 operators certified to perform backflow assembly testing. The 87 backflow prevention devices (80 D.C.V.A, 6 R.P.B.A, and 1 P.V.B.A) are tested annually. All private commercial and residential backflow devices are tested by independent contractors whose reports are submitted to the fire department for records management.
Well Head Protection
The Town of Qualicum Beach continues to compile data on the areal extent, behaviour and recharge of the two aquifers of the well fields to better understand the requirements to manage and evolve a well head protection program. The Town owns significant lands around each well field; 30 hectares (75 acres) newly acquired lands around Berwick and 37 hectares (90 acres) long held around the River well field. Access is restricted to these lands and a network of monitoring and sampling wells are maintained to gather data for determining aquifer conditions and to establish models of the aquifer behaviour. Aquifer levels, pumping response, temperature, water chemistry and lack or presence of potential contaminants are regularly monitored. Some sample figures from our well head monitoring and modelling program are included with this report.

Page 6 of 28 Town of Qualicum Beach Annual Water Report 2014
Figures

Page 7 of 28 Town of Qualicum Beach Annual Water Report 2014
Figure 1. River Well Field

Page 8 of 28 Town of Qualicum Beach Annual Water Report 2014
Figure 2. River Well Field Water Source

Page 9 of 28 Town of Qualicum Beach Annual Water Report 2014
Figure 3. Flow Paths for River Well Field

Page 10 of 28 Town of Qualicum Beach Annual Water Report 2014
Figure 4. Berwick Well Field

Page 11 of 28 Town of Qualicum Beach Annual Water Report 2014
Figure 5. Weekly Sampling Locations

Page 12 of 28 Town of Qualicum Beach Annual Water Report 2014
Figure 6. Water System Process Schematic

Page 13 of 28 Town of Qualicum Beach Annual Water Report 2014
Figure 7. Monthly Production Volumes (m3)
0
40,000
80,000
120,000
160,000
200,000
240,000
280,000
Jan Feb Mar Apr May Jun Jul Aug Sep Oct Nov Dec
20142015
Monthly Total Water Consumption

Page 14 of 28 Town of Qualicum Beach Annual Water Report 2014
Sample Results

Page 15 of 28 Town of Qualicum Beach Annual Water Report 2014
Bacteriological Testing
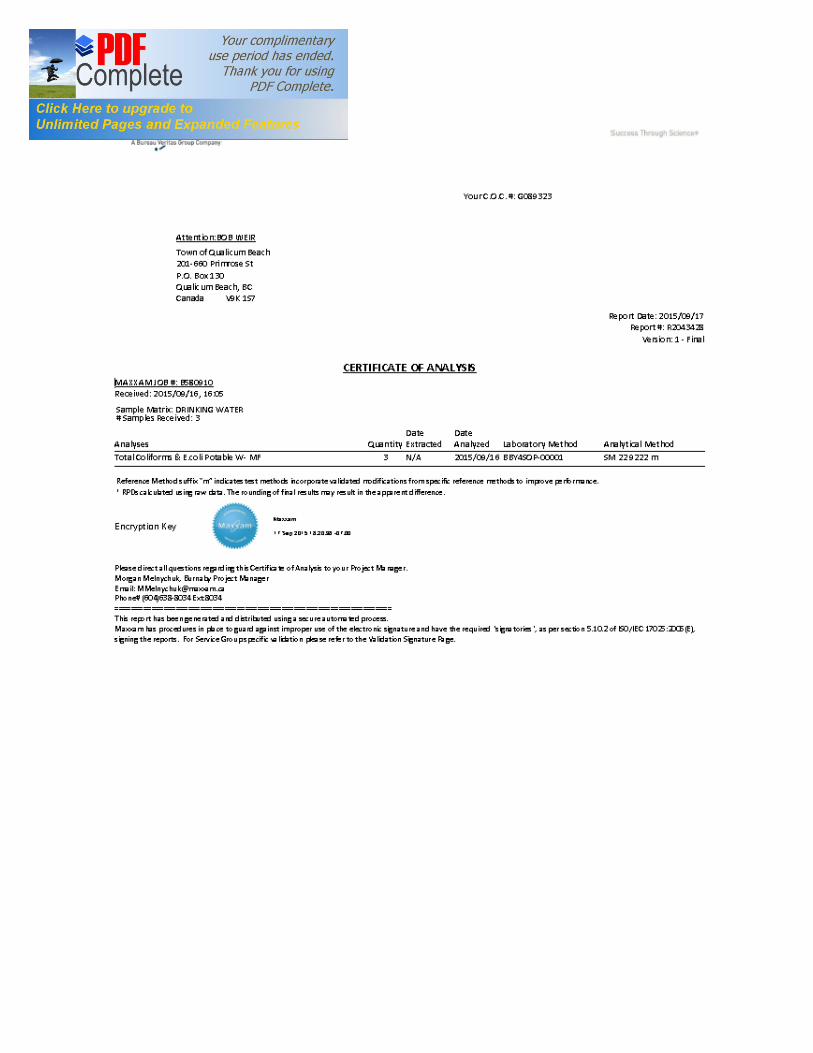
Page 16 of 28 Town of Qualicum Beach Annual Water Report 2014

Page 17 of 28 Town of Qualicum Beach Annual Water Report 2014

Page 18 of 28 Town of Qualicum Beach Annual Water Report 2014

Page 19 of 28 Town of Qualicum Beach Annual Water Report 2014
Full Spectrum Analysis

Page 20 of 28 Town of Qualicum Beach Annual Water Report 2014

Page 21 of 28 Town of Qualicum Beach Annual Water Report 2014

Page 22 of 28 Town of Qualicum Beach Annual Water Report 2014

Page 23 of 28 Town of Qualicum Beach Annual Water Report 2014

Page 24 of 28 Town of Qualicum Beach Annual Water Report 2014

Page 25 of 28 Town of Qualicum Beach Annual Water Report 2014

Page 26 of 28 Town of Qualicum Beach Annual Water Report 2014

Page 27 of 28 Town of Qualicum Beach Annual Water Report 2014

Page 28 of 28 Town of Qualicum Beach Annual Water Report 2014