Water Quality Monitoring Strategy - Lummilnnr.lummi-nsn.gov/LummiWebsite/userfiles/1_FINALWQ...
38
LUMMI NATION WATER QUALITY MONITORING STRATEGY December 2007
Transcript of Water Quality Monitoring Strategy - Lummilnnr.lummi-nsn.gov/LummiWebsite/userfiles/1_FINALWQ...

LUMMI NATION
WATER QUALITY MONITORING STRATEGY
December 2007

LUMMI NATION
WATER QUALITY MONITORING STRATEGY
Prepared for:
Lummi Indian Business Council (LIBC)
Funded by:
U.S. Environmental Protection Agency (Assistance No. BG-97042602-2)
Prepared By:
Water Resources Division Lummi Natural Resources Department
Contributors:
C. Dean Martin LIBC Water Resources Specialist Jeremy Freimund, P.H. LIBC Water Resources Manager Jamie Williams LIBC Water Resources Technician Andy Ross, LHG Salix Environmental Services Stacy Fawell, CFM Water Resources Analyst
December 21, 2007

TABLE OF CONTENTS EXECUTIVE SUMMARY ..................................................................................................1
1. INTRODUCTION..........................................................................................................2 1.1 PURPOSE STATEMENT...............................................................................................2 1.2 PROGRAM GOALS .....................................................................................................2 1.3. REPORT ORGANIZATION ...........................................................................................2
2. LUMMI NATION DESCRIPTION .................................................................................3 2.1 LUMMI RESERVATION ................................................................................................3 2.2 LUMMI NATION ENVIRONMENTAL ISSUES....................................................................3 2.3 LUMMI NATION WATERS ............................................................................................5
2.3.1 Surface Waters .................................................................................................5 2.3.2 Ground Water ...................................................................................................9
3. LONG-TERM WATER QUALITY MONITORING OBJECTIVES ..............................10 3.1 LUMMI WATER RESOURCES DIVISION GOAL .............................................................10 3.2 OVERVIEW OF LONG-TERM WATER QUALITY MONITORING OBJECTIVES....................10 3.3 WATER QUALITY THREATS AND WATER QUALITY MONITORING.................................10
3.3.1 Surface Water .................................................................................................10 3.3.2 Ground Water .................................................................................................11
4. MONITORING DESIGN.............................................................................................12 4.1 OVERVIEW OF CURRENT MONITORING DESIGN.........................................................12 4.2 SURFACE WATER – CURRENT MONITORING DESIGN ................................................12 4.3 GROUNDWATER - CURRENT MONITORING DESIGN ...................................................18
5. CORE AND SUPPLEMENTAL WATER QUALITY INDICATORS ...........................22 5.1 CURRENT WATER QUALITY INDICATORS...................................................................22 5.2 GROUND WATER QUALITY INDICATORS ....................................................................22 5.3 FUTURE WATER QUALITY INDICATORS.......................................................................23
6. QUALITY ASSURANCE/QUALITY CONTROL ........................................................24
7. DATA MANAGEMENT..............................................................................................25 7.1 WATER RESOURCES DIVISION DATABASES ..............................................................25 7.2 GEOGRAPHIC INFORMATION SYSTEM (GIS)..............................................................25 7.3 OTHER WATER RESOURCES RELATED DATABASES ..................................................26
8. DATA ANALYSIS AND ASSESSMENT ...................................................................27 8.1 ANALYSIS AND ASSESSMENT SOFTWARE .................................................................27 8.2 WATER QUALITY STANDARDS ASSESSMENT.............................................................27 8.3 GAPS IN ANALYTICAL AND ASSESSMENT CAPABILITIES .............................................27 8.4 ADDRESSING GAPS IN ANALYTICAL AND ASSESSMENT CAPABILITIES.........................28
9. REPORTING..............................................................................................................29
10. PROGRAMATIC EVALUATION..............................................................................30
11. GENERAL SUPPORT AND INFRASTRUCTURE ..................................................31
Lummi Nation Water Quality Monitoring Strategy December 2007 ii

11.1. LUMMI COMPREHENSIVE WATER RESOURCES MANAGEMENT PROGRAM................32 12. SUMMARY...............................................................................................................33
13. LIST OF REFERENCES..........................................................................................34 List of Figures FIGURE 1. REGIONAL LOCATION OF THE LUMMI INDIAN RESERVATION ..................................4 FIGURE 2. LUMMI NATION WETLANDS..................................................................................6 FIGURE 3. LUMMI NATION WATERSHEDS .............................................................................7 FIGURE 4. SURFACE WATER QUALITY MONITORING SITES .................................................14 FIGURE 5. GROUND WATER MONITORING SITES ON THE LUMMI RESERVATION. ..................19 List of Tables TABLE 1. WATERSHED CHARACTERISTICS (LWRD 1998, LWRD 2000) .............................8 TABLE 2. SURFACE WATER QUALITY MONITORING SITE GROUPS, CONVENTIONAL
PARAMETERS, LABORATORY SAMPLE COLLECTION, AND FREQUENCY (LWRD 2006). ...15 TABLE 3. PETROLEUM HYDROCARBONS, METALS, AND NUTRIENTS MEASURED QUARTERLY AT
SELECTED SITES (LWRD 2006) .................................................................................18 TABLE 4. GROUND WATER QUALITY MONITORING WELL TYPES, PARAMETERS, AND
FREQUENCY (LWRD 2006)........................................................................................20 TABLE 5. WATER QUALITY INDICATORS SAMPLED BY WATER RESOURCES PROGRAM AREA
.................................................................................................................................22 TABLE 6. QUALITY ASSURANCE DOCUMENTS....................................................................24 TABLE 7. DATA MANAGEMENT..........................................................................................26 TABLE 8. TRIBAL REPORTS ..............................................................................................29 TABLE 9. WATER QUALITY MONITORING ISSUES AND TIMELINES .......................................30 TABLE 10. GENERAL SUPPORT AND INFRASTRUCTURE......................................................31
Lummi Nation Water Quality Monitoring Strategy December 2007 iii
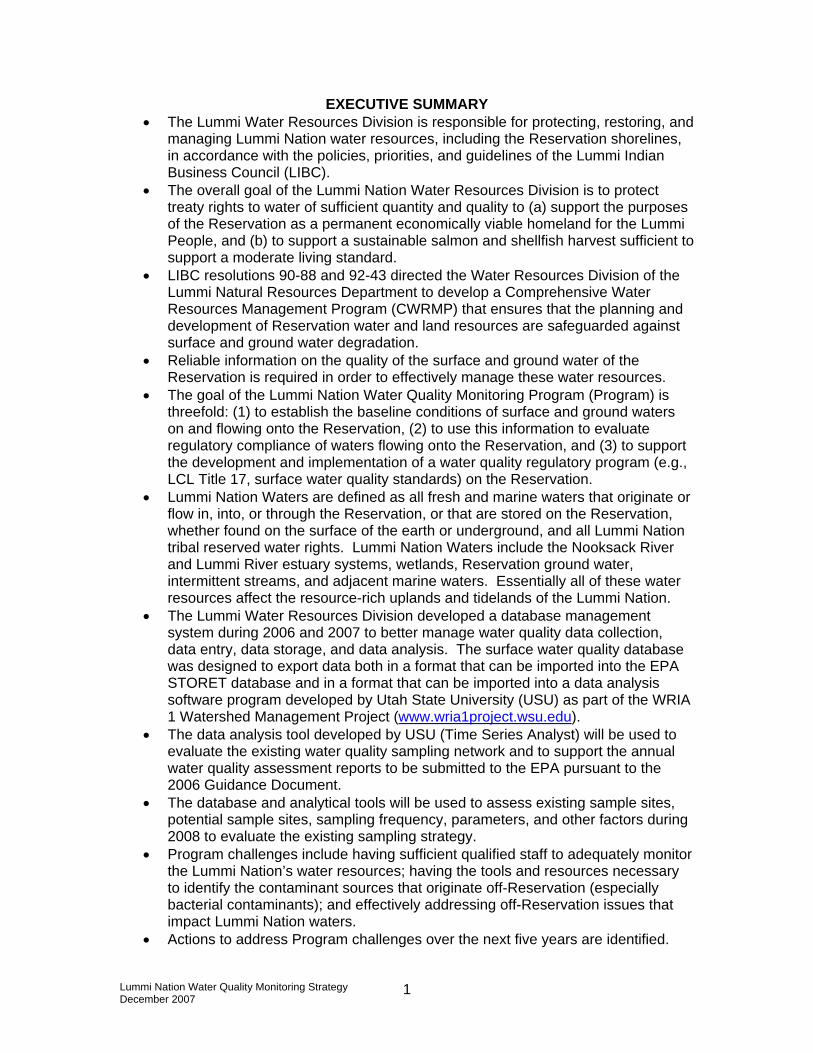
EXECUTIVE SUMMARY • The Lummi Water Resources Division is responsible for protecting, restoring, and
managing Lummi Nation water resources, including the Reservation shorelines, in accordance with the policies, priorities, and guidelines of the Lummi Indian Business Council (LIBC).
• The overall goal of the Lummi Nation Water Resources Division is to protect treaty rights to water of sufficient quantity and quality to (a) support the purposes of the Reservation as a permanent economically viable homeland for the Lummi People, and (b) to support a sustainable salmon and shellfish harvest sufficient to support a moderate living standard.
• LIBC resolutions 90-88 and 92-43 directed the Water Resources Division of the Lummi Natural Resources Department to develop a Comprehensive Water Resources Management Program (CWRMP) that ensures that the planning and development of Reservation water and land resources are safeguarded against surface and ground water degradation.
• Reliable information on the quality of the surface and ground water of the Reservation is required in order to effectively manage these water resources.
• The goal of the Lummi Nation Water Quality Monitoring Program (Program) is threefold: (1) to establish the baseline conditions of surface and ground waters on and flowing onto the Reservation, (2) to use this information to evaluate regulatory compliance of waters flowing onto the Reservation, and (3) to support the development and implementation of a water quality regulatory program (e.g., LCL Title 17, surface water quality standards) on the Reservation.
• Lummi Nation Waters are defined as all fresh and marine waters that originate or flow in, into, or through the Reservation, or that are stored on the Reservation, whether found on the surface of the earth or underground, and all Lummi Nation tribal reserved water rights. Lummi Nation Waters include the Nooksack River and Lummi River estuary systems, wetlands, Reservation ground water, intermittent streams, and adjacent marine waters. Essentially all of these water resources affect the resource-rich uplands and tidelands of the Lummi Nation.
• The Lummi Water Resources Division developed a database management system during 2006 and 2007 to better manage water quality data collection, data entry, data storage, and data analysis. The surface water quality database was designed to export data both in a format that can be imported into the EPA STORET database and in a format that can be imported into a data analysis software program developed by Utah State University (USU) as part of the WRIA 1 Watershed Management Project (www.wria1project.wsu.edu).
• The data analysis tool developed by USU (Time Series Analyst) will be used to evaluate the existing water quality sampling network and to support the annual water quality assessment reports to be submitted to the EPA pursuant to the 2006 Guidance Document.
• The database and analytical tools will be used to assess existing sample sites, potential sample sites, sampling frequency, parameters, and other factors during 2008 to evaluate the existing sampling strategy.
• Program challenges include having sufficient qualified staff to adequately monitor the Lummi Nation’s water resources; having the tools and resources necessary to identify the contaminant sources that originate off-Reservation (especially bacterial contaminants); and effectively addressing off-Reservation issues that impact Lummi Nation waters.
• Actions to address Program challenges over the next five years are identified.
Lummi Nation Water Quality Monitoring Strategy December 2007 1

1. INTRODUCTION 1.1 PURPOSE STATEMENT The purpose of this Lummi Nation water quality monitoring strategy is to summarize existing conditions, describe long-term water quality monitoring objectives and the existing monitoring program, and to identify future plans to better support management decisions intended to achieve the water resources objectives of the Lummi Nation. This report is also intended to provide the U.S. Environmental Protection Agency (EPA) documentation requested pursuant to the Final Guidance of Awards of Grants to Indian Tribes Under Section 106 of the Clean Water Act (EPA 2006). 1.2 PROGRAM GOALS The goal of the Lummi Nation Water Quality Monitoring Program (Program) is threefold: (1) to establish the baseline conditions of surface and ground waters on and flowing onto the Reservation, (2) to use this information to evaluate regulatory compliance of waters flowing onto the Reservation, and (3) to support the development and implementation of a water quality regulatory program (e.g., Water Quality Standards) on the Reservation. 1.3. REPORT ORGANIZATION This report describing the Lummi Nation water quality monitoring strategy is divided into the following sections:
• Section 1 is this introductory section. • Section 2 is a summary of background information on the Lummi Nation and its
water and land resources. • Section 3 is an overview of the long-term objectives of the Lummi Nation’s water
quality monitoring program. • Section 4 is a description of the existing water quality monitoring design. • Section 5 is an overview of the core and supplemental water quality indicators
used by the Lummi Water Resources Division. • Section 6 is a discussion about the quality assurance aspects of the water quality
monitoring program. • Section 7 is a description of the water quality data management approach. • Section 8 is data analysis and assessment information. • Section 9 addresses reporting of water quality monitoring information. • Section 10 provides information regarding programmatic evaluations. • Section 11 is a discussion of general support and infrastructure for the water
quality monitoring program. • Section 12 is a report summary. • Section 13 lists the references cited and used as background for this report.
Lummi Nation Water Quality Monitoring Strategy December 2007 2

2. LUMMI NATION DESCRIPTION
2.1 LUMMI RESERVATION The Lummi Reservation is located in the Northwest corner of Washington State (Figure 1). The Lummi Nation is a federally recognized Tribe with the Lummi Indian Business Council (LIBC) as its governing body. There are more than 4,200 enrolled members of the Lummi Nation. The Lummi Indian Reservation is located along the western boundary of Whatcom County, Washington and includes portions of the watersheds for Georgia Strait, Lummi Bay, Hale Passage, Bellingham Bay, and the Nooksack and Lummi rivers. The Nooksack River drains a watershed of 786 square miles, flows through the Reservation near the mouth of the river, and discharges to Bellingham Bay (and partially to Lummi Bay during high flows). The Reservation is located approximately 8 miles west of Bellingham, 90 miles north of Seattle, and 60 miles south of Vancouver, British Columbia, Canada. The 2000 Census reported that the total Reservation population was 4,193 people; 2,114 (50.4 percent) of these people identified themselves as American Indian or Alaska Native (Indian) alone. 2.2 LUMMI NATION ENVIRONMENTAL ISSUES The Lummi Reservation is comprised of about 12,000 acres of upland and 7,000 acres of tidelands. Approximately 38 miles of highly productive marine shoreline surround the Reservation on all but the north and northeast borders. Much of the high-density development to date has occurred along the marine shoreline. In addition, the Reservation includes the Nooksack and Lummi river deltas, tidelands, and forested uplands. Both the Nooksack and Lummi river watersheds are under environmental pressures from rapid regional growth. The Lummi Nation has also entered a period of economic development under self-governance. Growth on and near the Reservation requires that the Nation’s core environmental program prioritize the development of a regulatory infrastructure that allows for responsible growth while protecting tribal resources and the Reservation environment. This infrastructure will support both the tribal goals and EPA’s policy of tribal self-governance and recognition of sovereignty. LIBC resolutions 90-88 and 92-43 directed the Water Resources Division of the Lummi Natural Resources Department to develop a comprehensive water resources management program that ensures that the planning and development of Reservation water and land resources are safeguarded against surface and ground water degradation. Reliable information on the quality of the surface and ground water of the Reservation is required in order to effectively manage these resources. Previous EPA and other funding sources have supported the Nation’s assessment of priority water resource needs and the identification of unmet needs. Environmental planning intended to protect the Nation’s water resources has included development of a Storm Water Management Program (LWRD 1998), a Wellhead Protection Program (LWRD 1997), a Wetland Management Program (LWRD 2000), a Non-Point Source Management Program (LWRD 2001, LWRD 2002), and Water Quality Standards for Reservation surface waters (LWRD 2007). These programs are components of the Lummi Nation Comprehensive Water Resources Management Program (CWRMP). Important milestones in the program development effort include the January 2004 adoption of the Lummi Nation Water Resources Protection Code (Title 17 of the Lummi Code of Laws) and the August 2007 adoption of surface water quality standards.
Lummi Nation Water Quality Monitoring Strategy December 2007 3

Figure 1. Regional Location of the Lummi Indian Reservation
Lummi Nation Water Quality Monitoring Strategy December 2007 4

2.3 LUMMI NATION WATERS Pursuant to Chapter 17.09 of the Lummi Code of Laws, Lummi Nation Waters are all fresh and marine waters that originate or flow in, into, or through the Reservation, or that are stored on the Reservation, whether found on the surface of the earth or underground, and all Lummi Nation tribal reserved water rights. 2.3.1 Surface Waters The Lummi people are fishers and have relied on their water resources since time immemorial for ceremonial, subsistence, and commercial purposes. There are 38 miles of marine shoreline surrounding most of the reservation (except portions of the east boundary and the northern boundary). The surrounding tidelands are in Lummi Bay, Bellingham Bay, Portage Bay, the Strait of Georgia, and Hale Passage. Finfish and shellfish spawn, incubate, and/or grow within and adjacent to Lummi Nation Waters. The Lummi Nation also operates shellfish and finfish hatcheries in these waters. Prior to approximately 1860, the Nooksack River discharged to Lummi Bay rather than Bellingham Bay (Deardorff 1992, WSDC 1960). The river flow was redirected to Bellingham Bay and currently the Lummi River only receives water from the Nooksack River when the Nooksack River flows exceed approximately 9,600 cubic feet per second (cfs). The Lummi River currently drains much of the area west of the Nooksack River in the vicinity of Ferndale, Washington. The Nooksack River drains most of western Whatcom County, including the forested uplands and the developed lowlands. The Nooksack River is fed from precipitation throughout the year and glacial and snowmelt from Mount Baker and adjacent peaks during the summer months before discharging to Lummi Nation Waters (Bellingham Bay and Lummi Bay). The Nooksack River supports several important species of salmon and other aquatic life. The river delta is part of the Reservation and is part of an important marine wetland-estuary complex. There are water quality and water quantity challenges in the Nooksack watershed due to land development and agriculture. Whatcom County, which includes all of the lowlands in the Nooksack River watershed, had 167 operating dairy operations in 2005. Approximately 220 acres of tribal shellfish beds in Portage Bay were closed from November 1996 to May 2006 due to bacterial contamination attributed to poor dairy nutrient management practices in the Nooksack River (DOH 1997, Ecology 2000). Due to the estuarine environment, nearly all of the waterbodies in the Lummi River and Nooksack River floodplains are exposed to marine influences, which include the presence of saline water, salinity-based-stratification (stratification), and upstream flow during high tide. Most of the water quality sample sites are tidally influenced (water level and/or salinity) and have variable water column profiles (e.g., stratified or well-mixed) and salinities. For most sample sites, the salinity and presence or absence of stratification cannot be predicted. In the Lummi Bay Watershed, salinity levels at surface water sample sites generally decrease as the wet season progresses and generally increase as the wet season ends and the dry season progresses. The 1999 comprehensive inventory of wetlands on the Lummi Reservation (LWRD 2000) indicated that approximately 43 percent of the Reservation upland areas are either wetlands or wetland complexes (see Figure 2). Of these reservation wetlands, about 60 percent are located in the flood plains of the Lummi and Nooksack rivers. Wetland complexes are areas where wetlands formed a highly interspersed mosaic with upland
Lummi Nation Water Quality Monitoring Strategy December 2007 5

hummocks. During the wetland inventory, boundaries were drawn around the outer edges of the mosaic and the entire area labeled a “wetland complex”. As a result, the estimated wetland area identified in the inventory generally represents more wetland area than actually exists. All wetland boundaries mapped during the comprehensive wetland inventory are general boundaries based on interpretation of color and infrared aerial photographs with some field verification. Specific wetland boundaries are being delineated on the ground as needed for specific activities. Reservation watersheds were designated by Lummi Natural Resources as “A” through “S” (Figure 3) and vary from 87 acres up to 4,700 acres (Table 1). The Nooksack River discharges to Reservation tidelands, but most of the 786 square mile Nooksack River watershed is upstream of the Reservation.
Figure 2. Lummi Nation Wetlands
Lummi Nation Water Quality Monitoring Strategy December 2007 6

Figure 3. Lummi Nation Watersheds
Lummi Nation Water Quality Monitoring Strategy December 2007 7

Table 1. Watershed Characteristics (LWRD 1998, LWRD 2000) Watershed Characteristics Percent Land Use / Land Cover (rounded to integer)
Basin ID
Drainage Area
(Acres)
Receiving Water Bodies
Number of Ground
Water Wells Water
Coni- ferous and
Mixed Forest
Deci- duous Forest
Scrub/ Shrub
Grasses and/or Agri-
culture
Fallow Fields/
Exposed Soils
Urban,Resi- dential, Com-
mercial,etc. Wet- lands Rock
A 306 Bellingham Bay, Hale Passage 0 10 20 38 3 19 2 0 8 1 B 634 Portage Bay, Hale Passage 1 3 51 20 2 2 2 0 17 1 C 583 Hale Passage, Lummi Bay 33 0 18 38 4 28 4 4 13 0 D 797 Hale Passage, Lummi Bay 28 2 10 54 2 25 1 0 22 0 E 183 Bellingham Bay 2 2 8 71 2 16 0 1 45 0 F 326 Bellingham Bay 11 1 1 57 3 31 1 1 28 0 G 836 Bellingham Bay 14 2 2 61 6 21 2 1 26 0 H 537 Lummi Bay 20 0 18 62 2 13 2 0 23 0 I 1,142 Lummi Bay 16 0 6 77 2 9 1 0 41 0 J 87 Nooksack River Floodplain 0 0 14 56 8 22 0 0 18 0 K 4,696 Bellingham and Lummi Bays 42 1 1 19 4 58 3 0 39 0 L 2,384 Lummi River, Lummi Bay 29 0 0 4 3 78 2 9 1 0 M 198 Lummi Bay 0 10 0 2 2 28 4 0 25 0 N 333 Lummi Bay 0 4 0 1 4 80 1 0 91 0 O 1,964 Lummi Bay 8 0 0 9 2 81 1 0 18 0 P 4,228 Lummi Bay 63 0 1 11 2 69 2 3 5 0 Q 1,292 Onion and Lummi Bays 21 0 9 42 4 32 4 4 20 0 R 1,024 Lummi Bay and Georgia Strait 37 8 1 22 1 32 2 14 13 0 S 503,040 Bellingham and Lummi Bays ND2 ND ND ND ND ND ND ND ND ND
1 Land Use / Land Cover types were mostly estimated from LANDSAT imagery acquired 9/15/1991 and classified by the Whatcom County Planning Dept. The wetland areas and locations are based on the 1999 Reservation-wide Wetland Inventory (LWRD 2000, Harper 1999). Wetland areas include areas classified as other cover types (e.g., forest, agriculture, fallow fields) resulting in the total percentage of land cover exceeding 100 percent in many instances. 2 ND - Not Determined
Lummi Nation Water Quality Monitoring Strategy December 2007
8

2.3.2 Ground Water Two (apparently separate) potable ground-water systems occur on the Reservation (LWRD 1997). One system is located in the northern upland area. This northern system appears to flow onto the Reservation from the north and drains to the west, south, and east. The second potable ground-water system is located in the southern upland area of the Reservation (Lummi Peninsula) and is completely contained within the Reservation boundaries (LWRD 1997). The floodplain of the Lummi and Nooksack rivers, which contains a surface aquifer that is saline (Cline 1974), separates the two potable water systems. A third potable water system may exist on Portage Island, but information on the water quality and the potential yield of this system is limited and inconclusive. Over 95 percent of the potable water used by Reservation residents is pumped from the Reservation aquifers. Because of the proximity to marine waters and the local geology, the aquifers on the Reservation are subject to both horizontal and vertical salt-water intrusion if wells are over-pumped (LWRD 1997).
Summary Overview of Lummi Nation Waters: • Approximately 12,500 acres of uplands • Approximately 7,000 acres of tidelands • Approximately 38 miles of marine shoreline • Approximately 10 miles of freshwater/estuarine shoreline along the Lummi and
Nooksack rivers and deltas • Wetlands (excluding tidelands) comprise approximately 43 percent of
Reservation • 786-square mile Nooksack River watershed discharges to Bellingham Bay on the
Reservation • 19 watersheds (including the Nooksack River Watershed) have been designated
by the Lummi Department of Natural Resources - either partially or totally on the Reservation ranging from 87 to 4,700 acres (excluding the Nooksack River Watershed)
• Although there are no lakes, there are a few ponds on the Reservation • There are two potable aquifer systems on the Reservation that provide over 95
percent of the potable water use on the Reservation. Ground water is in limited supply, and is subject to salt-water intrusion
Lummi Nation Water Quality Monitoring Strategy December 2007
9

3. LONG-TERM WATER QUALITY MONITORING OBJECTIVES
3.1 LUMMI WATER RESOURCES DIVISION GOAL The Water Resources Division is responsible for protecting, restoring, and managing Lummi Nation water resources, including the Reservation shorelines, in accordance with the policies, priorities, and guidelines of the Lummi Indian Business Council (LIBC). The overall goal of the Lummi Nation Water Resources Division is to protect treaty rights to water of sufficient quantity and quality to (a) support the purposes of the Reservation as a permanent economically viable homeland for the Lummi People, and (b) to support a sustainable salmon and shellfish harvest sufficient to support a moderate living standard. 3.2 OVERVIEW OF LONG-TERM WATER QUALITY MONITORING OBJECTIVES The Lummi Nation surface and ground water quality monitoring program has been ongoing since 1993. The goal of the Lummi Nation Water Quality Monitoring Program is threefold: (1) to establish the baseline conditions of surface and ground waters on and flowing onto the Reservation, (2) to use this information to evaluate regulatory compliance of waters flowing onto the Reservation, and (3) to support the development and implementation of a water quality regulatory program (e.g., LCL Title 17, Water Quality Standards) on the Reservation. The water quality monitoring objectives to help achieve the overall Lummi Nation Water Resources Division goal and the Water Quality Monitoring Program goal include:
1. Monitor surface and ground water quality at representative locations and at frequencies sufficient to establish baseline conditions of Lummi Nation Waters.
2. Monitor surface waters for compliance with the Lummi Nation surface water quality standards to support all beneficial uses, including public health and public enjoyment; the propagation, protection, and restoration of fish, shellfish, wildlife, and their habitats; and the protection of the surface waters of the Lummi Indian Reservation as cultural, economic, and spiritual resources of the Lummi People.
3. Identify and evaluate on- and off-Reservation sources of fecal coliform contributions to shellfish harvest areas.
4. Detect and document threats to water quality and associated beneficial uses to support compliance actions.
5. Protect ground water supplies from saltwater intrusion and ground water mining. 3.3 WATER QUALITY THREATS AND WATER QUALITY MONITORING The Lummi Nation Nonpoint Source Assessment Report (LWRD 2001), the Lummi Nation Nonpoint Source Management Plan (LWRD 2002) and other documents developed as part of the Lummi Nation Comprehensive Water Resources Management Program (LWRD 1997, LWRD 1998, LWRD 2000) identify and locate the numerous threats to the quality of Lummi Nation Waters. These threats include both point sources and nonpoint sources of pollution and other threats associated with various land uses (e.g., over pumping of ground water wells). 3.3.1 Surface Water The purpose of the surface water quality monitoring component is to establish the baseline conditions of waters on and flowing onto the Reservation, to detect water quality problems, and to help identify the pollutant sources.
Lummi Nation Water Quality Monitoring Strategy December 2007
10

Threats to Lummi Nation Waters include contamination of surface waters from on- and off-Reservation sources that could damage resource rich Reservation tidelands, or adversely impact fisheries (e.g., closure of shellfish beds harvested for ceremonial, subsistence, and/or commercial purposes). Although all on-Reservation tribal shellfish beds have been opened to commercial harvest since May 2006, on-Reservation commercial shellfish beds were downgraded from “approved” to “restricted” for extended periods of time since 1996. The cause of the downgrades was attributed to contaminated Nooksack River water entering Portage Bay (DOH 1997, Ecology 2000). Information from the surface water quality monitoring program is used to:
• Evaluate compliance of waters flowing onto and within the Reservation with water quality criteria,
• Evaluate fecal coliform contributions from on- and off-Reservation to shellfish harvest areas, and
• Support the development and implementation of a water quality regulatory program on the Reservation, including the creation, adoption, implementation, and revision of Lummi Nation Water Quality Standards.
3.3.2 Ground Water The purpose of the ground water quality monitoring component of the Program is to protect ground water supplies from saltwater intrusion and ground water mining. Ground water resources on the Reservation are vulnerable to salt water intrusion due to the proximity of marine waters and local geology (LWRD 1997). The majority of residential development to date has occurred along the marine shorelines of the Reservation placing the most vulnerable portion of aquifers at risk through direct pumping of ground water near marine waters. Protection of ground water is essential because:
• Over 95 percent of all water consumed on the Reservation comes from ground water, and
• An ample supply of good quality ground water is needed to serve the purposes of the Reservation as a permanent and economically viable homeland for the Lummi People.
Lummi Nation Water Quality Monitoring Strategy December 2007
11

4. MONITORING DESIGN
4.1 OVERVIEW OF CURRENT MONITORING DESIGN The Lummi Water Resources Division employs both fixed station network and targeted water sampling designs. The fixed station network is used for baseline water quality monitoring and includes 43 routine surface water sites and 28 ground water sites (LWRD 2006). In addition to these 43 surface water quality sample sites, the Lummi Water Resources Division also collects samples at six Washington Department of Health (DOH) sample sites within Lummi Bay (DOH collects water quality samples from Portage Bay). A targeted sampling design approach is used to improve understanding of specific issues or problems that warrant further investigation (e.g., a reported or observed manure spill, a fish or waterfowl kill near a pesticide application site, questions regarding water quality impacts of an automobile recycling facility). In using the targeted design approach, sites from the fixed station monitoring network and other sites located both up and down stream from the identified potential pollutant source are sampled. 4.2 SURFACE WATER – CURRENT MONITORING DESIGN As shown in Figure 4 and detailed in the Lummi Nation Quality Assurance/Quality Control Plan (LWRD 2006), the Lummi Water Resources Division currently samples water quality at 43 sites in order to characterize surface water quality on the Reservation. Six additional Washington State Department of Health (DOH) sample sites are sampled to provide logistical assistance to the DOH and also assist with achievement of program goals. Thirty-two (32) of the 43 Lummi sampling sites are accessible from land. As described in Table 2 and Table 3, the Lummi Water Resources Division staff measure a variety of water quality variables each month. During the late summer to early-winter period, “First Flush” sampling is conducted at many of these sample sites at variable intervals (daily to weekly) based upon precipitation and runoff levels during the onset of the wet season. The remaining 11 surface water quality sample sites are accessible by boat and are located on Portage Island, in southern Portage Bay, in the Sandy Point Marina, and in Lummi Bay. These sample sites are targeted for monthly sampling, but unsafe weather conditions usually reduce the sample frequency. The DOH sites in northern Lummi Bay are generally sampled semi-monthly in coordination with the DOH. Table 2 summarizes the surface water quality monitoring sampling schedule including the measured conventional parameters. Table 3 shows the specific nutrients, metals, and hydrocarbons analyzed at an independent state- or federally-certified laboratory. Due to the costs of analyzing water quality samples for metals and petroleum hydrocarbons, these parameters are measured quarterly at two of the water quality monitoring sites (one fresh water site downstream from a petroleum oil refinery and one marine water site within a recreational boat marina). Similarly, due to cost considerations, nutrients are measured quarterly at only five of the surface water quality monitoring sites. Information from all sample runs is used to establish baseline conditions and to evaluate compliance with water quality criteria. Some sample runs serve other purposes as well. For example, to determine if sources of fecal coliform bacteria in Portage Bay are local or due to the Nooksack River, data collected by the Washington Department of Health (DOH) in and around Portage Bay are analyzed in conjunction with the data collected as part of the “Lummi Shore Road” (LSR) sample run and the “Portage Bay DOH Support”
Lummi Nation Water Quality Monitoring Strategy December 2007
12
sample run. Similar to the LSR sample run, the data collected as part of the “Bellingham Bay Watershed First Flush” aid in determining fecal coliform sources over the Portage Bay shellfish beds. The data collected under the “Floodplain East” (FPE) and “Floodplain West” (FPW) sample runs are used to establish baseline conditions for waters flowing onto the Reservation and through to Lummi Bay. Similar to the LSR sample run, the data collected as part of the FPE, FPW, and Lummi Bay First Flush sample runs help identify fecal coliform sources that potentially impact tribal shellfish beds in Lummi Bay. Water quality data collection along the Reservation boundary allows for a determination of whether or not waters flowing onto the Reservation comply with Lummi Nation and/or Washington State surface water quality standards. This water quality information is used to help identify pollution sources and to determine appropriate responses to reduce or eliminate the pollutant source.
Lummi Nation Water Quality Monitoring Strategy December 2007
13

Figure 4. Surface Water Quality Monitoring Sites
Lummi Nation Water Quality Monitoring Strategy December 2007
14

Table 2. Surface water quality monitoring site groups, conventional parameters, laboratory sample collection, and frequency (LWRD 2006).
Run Name
Sample Sites(s) Included
Conventional Parameters
Measured At Each Sample Site
Laboratory Samples
Collected At Each Sample
Site Measurement
Frequency Notes Floodplain East (FPE)
SW015, SW016, SW017, SW051, SW052, SW055, SW056, SW059, SW072
Air temperature, salinity-based stratification, water temperature, salinity, specific conductivity, current/flow direction, dissolved oxygen (DO), flow, pH, water level/depth, turbidity, and general observations.
Fecal Coliform, E. coli, and enterococcus
Monthly
Site SW051 is measured in both the FPE and FPW runs.
Floodplain West (FPW)
SW003, SW008, SW009, SW010, SW011, SW012, SW013, SW014, SW051, SW053, SW058
Air temperature, salinity-based stratification, water temperature, salinity, specific conductivity, current/flow direction, dissolved oxygen (DO), flow, pH, water level/depth, turbidity, and general observations.
Fecal Coliform, E. coli, and enterococcus
Monthly, First Flush
Site SW051 is measured in both the FPE and FPW runs.
Lummi Bay Watershed First Flush
SW003, SW008, SW009, SW 011, SW010, SW012, SW013, SW058, SW051, SW053, SW118* Time permitting: SW014, SW015, SW016, SW017, SW059
Salinity-based stratification, water temperature, salinity, specific conductivity, current/flow direction, dissolved oxygen (DO), flow, pH, water level/depth, turbidity, and general observations.
Fecal Coliform, E. coli, and enterococcus
As needed based upon predicted and observed runoff during the onset of the rainy season.
Site SW118* is part of Bellingham Bay. It is measured with the “Lummi Bay Watershed First Flush” because it provides useful information on Bellingham Bay if collected on the first day of the first flush sampling. pH and turbidity are often not measured due to time constraints.
Lummi Nation Water Quality Monitoring Strategy December 2007
15

Table 2. Surface water quality monitoring site groups, conventional parameters, laboratory sample collection, and frequency (LWRD 2006).
Run Name
Sample Sites(s) Included
Conventional Parameters
Measured At Each Sample Site
Laboratory Samples
Collected At Each Sample
Site Measurement
Frequency Notes Bellingham Bay Watershed First Flush
SW007, SW018, SW029, SW030, SW031, SW032, SW033, SW034, SW035, SW036, SW037, SW038, SW039
Salinity-based stratification, water temperature, salinity, specific conductivity, current/flow direction, dissolved oxygen (DO), flow, pH, water level/depth, turbidity, and general observations.
Fecal Coliform, E. coli, and enterococcus
The day following the Lummi Bay First Flush sample run.
Flow is only measured at upland sites along the Portage and Bellingham Bay shorelines. pH and turbidity are often not measured due to time constraints Site 29 samples representing a watershed site that is minimally affected by development.
Marine Boat-Accessible (Marine)
SW 001, SW002, SW006, SW019, SW022, SW023, SW024, SW025, SW026, SW027, SW028
Salinity-based stratification, water temperature, salinity, specific conductivity, current/flow direction, dissolved oxygen (DO), flow, pH, Secchi depth, water level/depth, turbidity, and general observations.
Fecal Coliform, E. coli, and enterococcus
Monthly, as possible
Measure flow at the Portage Island sites (Sites numbered 24 through 28).
Lummi Shore Road (LSR)
SW030, SW031, SW032, SW033, SW034, SW035, SW036, SW037, SW038, SW039, SW118 Time permitting: SW007, SW029
Salinity-based stratification, water temperature, salinity, specific conductivity, current/flow direction, flow, and general observations. Time permitting: Air temperature, dissolved oxygen (DO), pH, water level/depth, turbidity
Fecal Coliform, E. coli, and enterococcus
Monthly in coordination with the DOH sampling of Portage Bay.
Sometimes Site SW118 is sampled at both the beginning and end of run if Portage Bay sampling occurs late in morning or afternoon. Flow is only measured at upland sites along the Portage and Bellingham Bay shorelines. The LSR sample run is often constrained for time.
Lummi Nation Water Quality Monitoring Strategy December 2007
16

Table 2. Surface water quality monitoring site groups, conventional parameters, laboratory sample collection, and frequency (LWRD 2006).
Run Name
Sample Sites(s) Included
Conventional Parameters
Measured At Each Sample Site
Laboratory Samples
Collected At Each Sample
Site Measurement
Frequency Notes Portage Bay DOH Support
SW118 Air temperature, salinity-based stratification, water temperature, salinity, specific conductivity, current/flow direction, dissolved oxygen (DO), pH, water level/depth, turbidity, and general observations.
Fecal Coliform, E. coli, and enterococcus
Three times in one day the day before LSR sample run and DOH sampling of Portage Bay.
Samples are collected three times during the same day (early in the day, mid-day, and afternoon). Due to time constraints the following may only be measured one of the three sample collection times: Air temperature, dissolved oxygen (DO), pH, water level/depth, turbidity
Lummi Bay Department of Health Boat-Accessible (Lummi Bay DOH Support)
DH285, DH286, DH287, DH288, DH044, DH045
Salinity-based stratification, water temperature, salinity, specific conductivity, current/flow direction, dissolved oxygen (DO), flow, pH, Secchi depth, water level/depth, turbidity, and general observations.
Fecal Coliform As needed Washington Department of Health (DOH) provides sample bottles and bacteria enumeration. LNR staff collect bacteria samples and measure other water quality at these sites.
Lummi Nation Water Quality Monitoring Strategy December 2007
17

Table 3. Petroleum hydrocarbons, metals, and nutrients measured quarterly at selected sites (LWRD 2006)
Sample Site
Number(s) Group Name Parameters
Frequency of
Collection Notes Hydrocarbons Diesel and Lube Oil range hydrocarbons. Quarterly Sample
collected in 1 1-L amber bottle
SW001
Metals Arsenic, Copper, Mercury, Tin, Zinc, Hardness, and pH with the temperature of the water sample at the time of measurement.
Quarterly Sample collected in 1 1-L amber bottle & 1 1-L plastic bottle
SW002, SW003, SW006, SW009, SW015
Nutrients Alkalinity, Ammonia, Biochemical Oxygen Demand, Nitrate, Nitrite, Total Kjeldahl Nitrogen, Ortho Phosphate, Total Phosphorus, pH [with temperature at time of reading], Total Organic Carbon, Total Suspended Solids, Total Volatile Suspended Solids, and may include Iron, Sulfate, Chlorophyll a, Sulfide, Silicon
Quarterly Samples collect in 3 1-L plastic bottles and 2 15-mL amber vials with a preservative. Nitrite and Nitrate are normally combined.
Hydrocarbons Diesel and Lube Oil range hydrocarbons. Quarterly, First Flush
Sample collect in 1 1-L amber bottle
SW014
Metals Chromium, Copper, Lead, Zinc, Hardness and pH with the temperature of the water sample at the time of measurement.
Quarterly, First Flush
Sample collected in 1 1-L amber bottle & 1 1-L plastic bottle
* Site SW118 has replaced Site SW018 (or Site 18). Site SW118 is about 50 meters downstream from Site SW018 on the Nooksack River. Site SW118 is about 60 meters south of the Marine Drive bridge on the right bank of the Nooksack River (looking downstream). Data collected under the Boat-Accessible (Marine) sample run are used to establish baseline conditions about water quality in the Sandy Point Marina, Lummi Bay, Portage Bay, and the five (5) Portage Island fresh water discharges to Portage Bay. These data can also help identify sources of pollution. The Lummi Bay DOH Support sample run is conducted to provide information about water quality in the northern portion of Lummi Bay and assists in determining fecal coliform sources. 4.3 GROUNDWATER - CURRENT MONITORING DESIGN As shown in Figure 5 and detailed in the Lummi Nation Quality Assurance/Quality Control Plan (LWRD 2006), the Lummi Water Resources Division currently samples water quality at 28 sites in order to characterize the two major potable aquifer systems on the Reservation. Sample sites were selected to represent aquifer-wide conditions as practicable, but the spatial representativeness of these sampling points is limited by the locations of existing ground water wells in some parts of the Reservation – particularly along the interior of the Lummi Peninsula and the eastern part of the northern upland.
Lummi Nation Water Quality Monitoring Strategy December 2007
18

Table 4 shows the ground water quality sampling schedule, including parameters measured. Wells are generally sampled monthly or more frequently if necessary. Factors affecting the frequency of sampling include changes in pump rates, changes in water level, increased chloride levels, and the pumping schedule of nearby wells.
Figure 5. Ground Water Monitoring Sites on the Lummi Reservation.
Lummi Nation Water Quality Monitoring Strategy December 2007
19

Table 4. Ground water quality monitoring well types, parameters, and frequency (LWRD 2006)
Well Group Wells Included
Well Number Parameters Measured At Each Sample Site
Measurement Frequency
R. Jefferson GW112 Water level, chloride, temperature, specific conductivity.
Monthly
C. Charles GW074 Water level, chloride, temperature, specific conductivity.
Monthly
Berg GW143 Water level, chloride, temperature, specific conductivity.
Monthly
Lewis/ Boynton
GW190 Chloride, temperature, specific conductivity. Monthly
J. Adams GW092 Chloride, temperature, specific conductivity. Monthly Bewley GW164 Water level. Monthly M. Egawa GW189 Water level, chloride, temperature, specific
conductivity. Monthly
J. Finkbonner GW109 Chloride, temperature, specific conductivity (water level infrequently)
Monthly
T. Teeter GW413 Water level, chloride, temperature, specific conductivity.
Monthly
Domestic
Skolrood (if becomes active)
GW101 Water level, chloride, temperature, specific conductivity.
Monthly
Balch GW115 Water level, water use, chloride, temperature, specific conductivity.
Weekly or as needed.
Horizon GW058 Water level, water use, chloride, temperature, specific conductivity.
Weekly or as needed.
Kinley Way (Kinley 1)
GW059 Water level, water use, chloride, temperature, specific conductivity.
Weekly or as needed.
Kinley 2 GW409 Water level until operational. After operational, water level, water use, chloride, temperature, specific conductivity.
Monthly
Kinley 3 GW421 Water level until operational. After operational, water level, water use, chloride, temperature, specific conductivity.
Monthly
Mackenzie 2 GW129 Water level, water use, chloride, temperature, specific conductivity.
Weekly or as needed.
Northwest Well 2 (NW2)
GW418 Water level until operational. After operational, water level, water use, chloride, temperature, specific conductivity.
Monthly
Potable Public Water Supply Wells
West Shore GW146 Water level, water use, chloride, temperature, specific conductivity.
Weekly or as needed.
Hopkins GW111 Water level Monthly Cultee GW056 Water level Monthly Revey GW127 Water level Monthly Mackenzie 1 GW128 Water level Monthly Mackenzie 3 GW405 Water level Monthly Mackenzie 4 GW422 Water level Monthly Pierre GW066 Water level Monthly M.H. Cagey GW068 Water level Monthly
Monitoring Wells
Northwest Well 1 GW417 Water level Monthly Other Wells
Johnson GW145 Water level, water use, chloride, temperature, specific conductivity, tank level, and discharge from manifold in tank. Flow rate and totalizer at all meters except M. Finkbonner (Nau) and Greg Finkbonner meters every time visit Johnson well. The latter two meters are measured monthly.
Weekly or more frequently for water quality, water level, and water use.
Lummi Nation Water Quality Monitoring Strategy December 2007
20

Water level, temperature, specific conductivity, and chloride concentration are measured at least monthly at each site, and well production is recorded from existing meters at the Lummi Water District water supply wells. Of primary importance are the chlorides, pumping rates, and water levels of the wells as these data indicate whether seawater intrusion is occurring - or if the potential for seawater intrusion is increasing. Based upon these data, measures can be implemented (e.g., reduced pumping) to address the potential for salt-water intrusion.
Lummi Nation Water Quality Monitoring Strategy December 2007
21

5. CORE AND SUPPLEMENTAL WATER QUALITY INDICATORS
5.1 CURRENT WATER QUALITY INDICATORS A description of the core water quality indicators used by the Lummi Department of Natural Resources was presented in the self-assessment report and a waiver request submitted to the U.S. EPA Region 10 in September and October of 2007, respectively. Lummi uses eight of the nine core water quality indicators. Macroinvertebrates are not sampled as a water quality indicator due to fact that there are no streams on the Reservation that are both perennial and wade-able; characteristics that are required for the macroinvertebrate protocol. Water quality indicators sampled for various program areas are summarized in Table 5.
Table 5. Water Quality Indicators Sampled by Water Resources Program Area Water Resource Type and/or CWA Program Area and/or Monitoring Objectives D
isso
lved
Oxy
gen
Tem
pera
ture
pH
Turb
idity
Nut
rient
s (T
P/ T
N)
Hab
itat
Mac
ro
inve
rteb
rate
s
Path
ogen
s
Oth
er
Overall Water Quality X X X X X X N/A X X
Water Quality Status and Trends
X X X X X X N/A X X
NPS Effectiveness Monitoring
X X X X X X N/A X X
In addition to the core water quality parameters, the Lummi Water Resources Division staff also conducts other analyses for selected sites or as conditions require. As an example, E. coIi and Enterococcus bacteria samples are routinely collected and analyzed by a contracted certified laboratory for most fixed network surface water sites. Table 2 through Table 4 outline various nutrients, metals, and other parameters that are periodically monitored for specified sites and in other locations as conditions require. Habitat information for the sampling sites has been collected, but not as an integral part of the Water Quality Monitoring Program. During 2008 and in subsequent years the existing habitat information will be better integrated into the surface water quality monitoring database and additional habitat data collected as needed. 5.2 GROUND WATER QUALITY INDICATORS Ground water is monitored to determine variations in ground water level and variations in chloride levels to detect possible salt-water intrusion problems and ground water mining. Occasionally other parameters (e.g., arsenic) are checked on ground water samples, if needed.
Lummi Nation Water Quality Monitoring Strategy December 2007
22

5.3 FUTURE WATER QUALITY INDICATORS All of the surface water quality data collected between 1993 (the start of the monitoring program) and the end of 2007 will be entered into Lummi Natural Resource’s new database by January 31, 2008. These data will be reviewed and analyzed during 2008 to assist the Lummi Department of Natural Resources with updating and improving its surface water quality monitoring program. The current sites will be evaluated against the Lummi Nation’s water quality monitoring program objectives. Based on this evaluation, if it is determined that there is consistently good water quality at a site relative to the adopted water quality standards or if variations in water quality are small, sampling at the site may be reduced or suspended. Similarly, if the evaluation indicates that there is consistently poor water quality at a site relative to the adopted water quality standards and/or if there is high variation in the measured water quality, sampling at the site may be increased. It is also possible that additional new sites will be added to the program although staff and financial resources limit the overall size of the sampling program. A similar assessment of the ground water quality monitoring program will be conducted during 2009 after the new ground water database is populated with the historic data.
Lummi Nation Water Quality Monitoring Strategy December 2007
23

6. QUALITY ASSURANCE/QUALITY CONTROL
As detailed in the Lummi Nation Water Quality Monitoring Program Quality Assurance/Quality Control Plan – Version 3.0 (LWRD 2006), the Lummi Water Resources Division has taken a number of actions to ensure data quality. Table 6 identifies key documents related to quality assurance activities.
Table 6. Quality Assurance Documents
Type Title Completion Date EPA Approval/Date
QAPP Lummi Nation Water Quality Monitoring Program Quality
Assurance/Quality Control Plan, Version 3.0 01/06/2006 01/13/2006
Lummi Nation Water Quality Data Verification and Data
Validation Estimate
06/30/2008 N/A
SOP Various Standard Operating Procedures (for field work)Under
Development N/A
Training Water Quality Monitoring – Training Manual Revise current
draft by 11/30/08 N/A
QA Data Verification and Data Validation of Lummi Natural
Resources Water Monitoring Data Complete draft by
6/30/08 N/A
Lummi Nation Water Quality Monitoring Strategy December 2007
24

7. DATA MANAGEMENT 7.1 WATER RESOURCES DIVISION DATABASES When the Lummi Water Resources Division water quality monitoring program started in 1993, the collected data were input into spreadsheets and analyzed using the spreadsheet graphic and analytical functions. Separate spreadsheets were developed and maintained for surface and ground water. As the years passed and the quantity of the data accumulated, it became increasingly clear that the spreadsheet approach to data management was no longer a viable alternative. In 2005 the Lummi Water Resources Division Manager convened a database management system committee comprised of staff members from throughout the Lummi Natural Resources Department and two consultants. As a result of this process, both a new surface water quality database and a new ground water quality database were developed during 2006 and 2007. An overview of the data management elements of the program is summarized in Table 7. Surface Water Quality Database: A consultant was hired to input all of the surface water quality monitoring data over the 1993 through 2006 period into the new database. This effort was completed in September 2007 and the Water Resources Technician has largely entered all of the surface water quality data collected during 2007. The surface water quality database was designed to export data both in a format that can be imported into the EPA STORET database and in a format that can be imported into a data analysis software program developed by Utah State University (USU) as part of the WRIA 1 Watershed Management Project (www.wria1project.wsu.edu). The data analysis tool developed by USU (named Time Series Analyst) will be used to evaluate the existing water quality sampling network and to support the annual water quality assessment reports to be submitted to the EPA pursuant to the 2006 Guidance Document. The data will be exported into EPA’s STORET database by June 30, 2008 after quality assurance checks have been completed. Ground Water Quality Database: The ground water quality database is not as advanced as the surface water quality database. Although the database has been developed, and plans are in place to use the same consultant that populated the surface water quality database to populate the ground water quality database during 2008, this work has not occurred yet. The overall approach is to use the database to manage the data collected on ground water quality and quantity and to export these data into a separate software program called Hydrogeoanalyst (Waterloo LLC) to characterize the aquifers (e.g., the stratigraphy) and analyze the data. The Time Series Analyst software developed by USU will also be used to analyze the ground water data collected by the monitoring program. The information from all of the well logs on and near the Reservation have been entered into the Hydrogeoanalyst software database and the program has been used to develop geologic cross sections. Once the historic water quality and water use data have been entered, the database will be even more useful. 7.2 GEOGRAPHIC INFORMATION SYSTEM (GIS) The Lummi Nation Geographic Information System (GIS) Division maintains a large volume of spatial data regarding the Lummi Reservation, the Nooksack River watershed, and the Lummi Nation Usual and Accustomed grounds and stations. These data include land use, land cover, zoning, soils, geology, forest type, natural hazards, hydrography, wetlands, watershed boundaries, cultural resources, roads, elevations (including LIDAR), parcel ownership and size information, habitat, endangered species, and many
Lummi Nation Water Quality Monitoring Strategy December 2007
25

other types of spatial information. The GIS Division also helped acquire high-resolution (6-inch) aerial photography that is available for the entire Lummi Reservation. The GIS data are available in a variety of scales depending on the scale and resolution of source materials (e.g., current and historic aerial photography, satellite imagery, digital elevation models, and others). All of the water quality sample site locations are in the GIS database and the GIS is used to characterize the contributing areas to each sample site. Examples of the various GIS data layers available to the Lummi Water Resources Division can be viewed by accessing the Lummi Nation Atlas at the tribal Internet site (www.lummi-nsn.gov). 7.3 OTHER WATER RESOURCES RELATED DATABASES The Lummi Water Resources Division also utilizes water resources related databases developed and maintained by other agencies. For example, the database developed and maintained by the U.S. Geological Survey is used to evaluate streamflow, NOAA databases are used for climate and tidal information, Washington Department of Health (DOH) databases are used to access the results from their on-Reservation water quality sampling over tribal shellfish bed (In consultation with the Lummi Nation and under the Shellfish Consent Decree [Order Regarding Shellfish Sanitation, United States v. Washington [Shellfish], Civil Number 9213, Subproceeding 89-3, Western District of Washington, 1994], the DOH is responsible to the federal Food and Drug Administration (FDA) to ensure that the National Shellfish Sanitation Program (NSSP) standards for certification of shellfish growing waters are met on the Reservation). Washington Department of Ecology databases are used to access well logs. Typically these databases are accessible through the Internet.
Table 7. Data Management Water Resource
Type and/or CWA Program
Area and/or Monitoring Objectives Data Management STORET Land Use Data
Geo-referencing
Overall Water Quality and Compliance with Lummi Nation Water Quality Standards (Fixed Station Network)
In-house database (developed in 2006 – 2007) with export to Time Series Analyst.
Data for 1993 – 2007 will be downloaded by June 30, 2008. Annually thereafter.
Land use data are available from the GIS databases at a variety of scales. Maintained by GIS Division.
Yes
Water Quality Status and Trends (Fixed Station Network)
Evaluation using Hydrogeoanalyst and Time Series Analyst
Data for 1993 – 2007 will be downloaded by June 30, 2008. Annually thereafter.
Land use data are available from GIS databases at a variety of scales. Maintained by GIS Division.
Yes
Problem Investigation (Targeted Sample Sites)
The In-house database has protocols for identifying targeted sample sites
Data for 1993 – 2007 will be downloaded by June 30, 2008. Annually thereafter.
Land use data are available from GIS databases at a variety of scales. Maintained by GIS Division.
Yes
NPS Effectiveness Monitoring
Evaluation using Hydrogeoanalyst and Time Series Analyst
Data for 1993 – 2007 will be downloaded by June 30, 2008. Annually thereafter.
Land use data are available from GIS databases at a variety of scales. Maintained by GIS Division.
Yes
Lummi Nation Water Quality Monitoring Strategy December 2007
26

8. DATA ANALYSIS AND ASSESSMENT
8.1 ANALYSIS AND ASSESSMENT SOFTWARE The Lummi Water Resources Division started using the “Time Series Analyst” and “Hydrogeoanalyst” software for data analysis and to prepare reports using the collected data starting during the last quarter of 2007. Data from the State Department of Health, the Washington Department of Ecology, NOAA (for both tidal and weather information), and the U.S. Geological Survey are also used by the Lummi Water Resources Division to better assess various aspects of water quality and water quantity on the Reservation and contributing watersheds. 8.2 WATER QUALITY STANDARDS ASSESSMENT The EPA delegated authority to the Lummi Nation to administer Section 401 and 303(c) of the Clean Water Act in March 2007. The Lummi Nation completed the adoption of surface water quality standards pursuant to the Lummi Nation Water Resources Protection Code (Title 17 of the Lummi Code of Laws) in August 2007. Prior to the adoption of the water quality standards, the Lummi Water Resources Division prepared annual water quality assessment reports that compared observed water quality with the draft Lummi Nation surface water quality standards. The new database and analysis tool (Time Series Analyst) will improve overall analysis capabilities including the assessment of water quality with respect to the adopted water quality standards. The EPA is currently evaluating the adopted water quality standards; approval by the EPA is anticipated during 2008. 8.3 GAPS IN ANALYTICAL AND ASSESSMENT CAPABILITIES With the new database management and analysis tools developed over the last couple of years, previous gaps in analytical and assessment capabilities have been largely addressed. The primary previous limitation was the ability to evaluate sample results with respect to historic results and trends in a timely manner. The current gaps in analytical capabilities for the Lummi Water Resources Division include:
• Data gaps due to suspended sampling that has occurred due to staff turnover and/or equipment malfunctions.
• Current staffing levels and availability limit the ability to collect all of the samples identified in the quality assurance/quality control plan.
• Upgraded equipment is needed to enable more effective, efficient, and reliable sampling.
• The estuarine waters are difficult to sample and may be under-represented in relation to their importance.
• Largely due to access and/or weather conditions, the existing marine sites are not sampled at the targeted frequency.
• Although the on-Reservation sampling program can identify local pollutant sources to tribal shellfish beds, the specific off-reservation sources of pollutants that contaminate the shellfish beds are not discernable from the on-Reservation sampling program.
• The historic ground water quality and use data need to be entered into the newly created ground water database.
Lummi Nation Water Quality Monitoring Strategy December 2007
27

8.4 ADDRESSING GAPS IN ANALYTICAL AND ASSESSMENT CAPABILITIES A number of actions have been taken or are planned to address the identified challenges in obtaining the necessary data and analytical and assessment capabilities including:
• Encourage retention of qualified staff by providing competitive wages, training and professional development opportunities, and challenging work;
• Update and improve training documents including the Training Manual; various Standard Operating Procedures; Health and Safety Plan; and other similar documents;
• Make budget provisions to upgrade data collection equipment to more effectively and efficiently collect data;
• Add an additional 0.5 FTE Water Resources Technician; • Create additional opportunities to evaluate new equipment and methods; • Boat accessibility and availability has increased substantially over the past year
with the refurbishment of the 25-foot aluminum boat and repair of the 16-foot boat. The ease of getting the boats ready and into the water could be improved;
• Additional training in the various aspects of water quality monitoring, data management, data analysis, data quality, and program planning.
• Planned contracting of ground water data entry during 2008.
Lummi Nation Water Quality Monitoring Strategy December 2007
28

9. REPORTING In addition to weekly manager meetings with the Executive Director of the Lummi Natural Resources Department, quarterly reports to the Lummi Indian Business Council on Water Resources Division activities, and semi-annual progress reports submitted to the EPA, annual reports are developed and submitted to the EPA that summarize the results of the water quality sampling program. Reports related to the Lummi Nation Water Quality Monitoring Program prepared by the Lummi Nation for the EPA are summarized in Table 8. The format and content of the annual summary report will be modified during 2008 to meet the needs identified in the Final Guidance of Awards of Grants to Indian Tribes Under Section 106 of the Clean Water Act (EPA 2006).
Table 8. Tribal Reports
Report Timeframe
Entities Receiving
Report Comments
Semi-Annual Progress Reports
Semi-Annual
Lummi Natural Resources Department Environmental Program Director
EPA
This report provides an overview of activities over the previous six-month period, identifies any problems encountered and budget status.
Water Quality Assessment Report
Annual Lummi Natural Resources Department Environmental Program Director
EPA
This report is a brief overview of water quality over the past year at the fixed station network sample sites. The data collected for each site are graphed to include pertinent water quality standards and the data also presented in tabular form. The period of record for the sites (some going back to 1993) is also graphed and compared to recent sample results.
Lummi Nation Water Quality Monitoring Strategy December 2007
29

10. PROGRAMATIC EVALUATION
Because the Lummi Nation water quality monitoring program is largely grant funded, the Lummi Water Resources Division evaluates and reviews its existing monitoring programs on an annual basis aligned with the grant cycle. This process addresses programmatic needs and resources and evaluates the effectiveness monitoring and assessment programs. The Water Resources Division evaluates its data needs and identifies gaps and priorities that may be changing due to resource limitations, new and emerging issues, and changing program objectives. Anticipated water quality monitoring issues and timelines are summarized in Table 9. Table 9. Water Quality Monitoring Issues and Timelines
Issue 2007 2008 2009 2010 A. Use existing
data to refine data collection process based on water quality monitoring objectives.
Complete database development and populate with data from period of record.
Use Time Series Analyst tool to evaluate data and refine data collection strategy.
On-going On-going
B. Improve source identification of bacterial contamination of Lummi Nation Waters.
Continue cooperative efforts with neighboring jurisdictions, Additional staff training.
Research source identification technology and possible cooperators.
Pilot projects for targeted data collection and evaluation
Implement routine bacterial source evaluations if decided by management.
C. Better integrate habitat and biological data with water quality data.
Complete database development to manage this data.
Improve process and protocols; begin additional characterization and database integration.
Continue and improve data collection and integration.
On-going
D. Continue and improve coordination of sampling activities with other agencies.
Continue sampling activities coordination with other agencies.
Discuss possible agreements, and coordinated work projects with other entities.
On-going On-going
E. Improve monitoring of wetlands, tidelands, estuaries, and other Lummi waters.
Complete database development and data entry.
Evaluate data to refine data collection strategy. Revise monitoring strategy based on data and needs.
Revise monitoring strategy based on data and needs.
On-going
F. Evaluate personnel, equipment and resource requirements based on water quality monitoring needs.
Evaluate staff classifications based on work needs and qualifications.
Evaluate water quality objectives, monitoring data, and staffing needs. Refine required resource needs (personnel, equipment, etc.).
On-going On-going
Lummi Nation Water Quality Monitoring Strategy December 2007
30

11. GENERAL SUPPORT AND INFRASTRUCTURE As detailed below, the Lummi Water Resources Division has extensive responsibilities and limited staff resources. The division is currently comprised of five staff members (Water Resources Manager, Water Resources Analyst, Water Resources Specialist, Water Resources Planner I, and a Water Resources Technician). Temporary loss of staff availability due to staff turnover or other reasons (e.g., maternity leave) can result in a loss of overall program productivity. Improving the available documentation (Training Manual, Standard Operating Procedures, Quality Assurance and Quality Control Plans, Safety Manual, and others) can assist new staff members in learning what is required, but it is still a difficult and time-consuming process to become proficient in the sampling and data entry protocols overall and with the site specific sample locations. Building additional capability by adding staff and cross training staff members are recognized approaches to ensure the water quality sampling program effectiveness. Retention of qualified staff is an important element to safeguard the program’s capacity. Table 10. General Support and Infrastructure
Objectives Staffing Training Equipment Lab Resources Current Water Quality Monitoring and Water Quality Protection
0.05 FTE Water Resources Manager 0.5 FTE Water Resources Specialist 1.0 FTE Water Resources Technician Additional support from GIS Manager, Water Resources Analyst, and Database Specialist
On the Job Training by contractors and self-training; boating safety and operation and maintenance courses; first-aid, bacterial source tracking; permits; spill response; incident command system (ICS); water quality standards, wetland delineation, macroinvertebrate sampling; etc.
In-house equipment includes meters for pH, conductivity, temperature, salinity, dissolved oxygen, chloride, and well depth. Also, two boats, one canoe, two vehicles.
Contracted private certified lab for bacterial, nutrients, oil, suspended solids, metals and other parameters (see Table 2 and Table 3).
Future Water Quality Monitoring and Water Quality Protection
0.05 FTE Water Resources Manager 0.5 FTE Water Resources Specialist 1.5 FTE Water Resources Technician Additional support from GIS Manager, Water Resources Analyst, and Database Specialist
Continuing education as described above, monitoring methods and protocols, bacterial source tracking, field work photography, ICS, oil spill response, data verification and data validation, habitat monitoring, GIS, storm water, permits, etc.
Updated multi-probe meters with recording capability, sturdy field computers, boat equipment, safety equipment
Sufficient funding to support contracted private lab analysis, bacterial source tracking and other needs.
Lummi Nation Water Quality Monitoring Strategy December 2007
31

11.1. LUMMI COMPREHENSIVE WATER RESOURCES MANAGEMENT PROGRAM The Lummi Nation water quality monitoring program is one element of the Lummi Nation Comprehensive Water Resources Management Program that was initiated in the early 1990s pursuant to LIBC resolutions 90-88 and 92-43. These resolutions directed the Water Resources Division of the Lummi Natural Resources Department to develop a comprehensive water resources management program. Reliable information on the quality of the surface and ground water of the Reservation is required in order to effectively manage these resources. The purpose of the Comprehensive Water Resources Management Program (CWRMP) is to ensure that the planning and development of Reservation water and land resources are safeguarded against surface and ground water degradation. The CWRMP consists of the development and implementation of the following programs:
• Wellhead Protection Program: The overall purpose of this program is to protect Reservation ground water from contaminants (LWRD 1997).
• Storm Water Management Program: The purpose of this program is to protect all waters and tidelands from contaminated storm water, and to protect downstream property owners from adverse impacts of new development (LWRD 1998).
• Wetland Management Program: The purpose of this program is to protect the on- Reservation ground water supply, surface water resources including tidelands and estuaries, and to protect wetland functions and property owners (LWRD 2000).
• Water Quality Standards Program: The purpose of this program is to attain fishable and swimmable waters within the Reservation, and to adopt and implement rules to protect and enhance public health. The Lummi Nation water quality standards apply to all surface waters of the Reservation (LWRD 2007).
• Nonpoint-Source Management Program: The purpose of this program is to effectively and efficiently control nonpoint sources of pollution on the Reservation. The 80-mile long Nooksack River originates in three forks flowing off Mount Baker and the Twin Sisters. It drains an 786-square mile watershed and discharges through the Lummi Reservation (LWRD 2001, LWRD 2002).
Related On-Going Projects Include:
• Reservation Surface Water Quality Monitoring: Forty-three (43) water quality stations are monitored and the collected data analyzed.
• Nooksack Estuary Recovery Project: An effort is underway to evaluate and restore the Nooksack/Lummi River estuary.
• Flood Damage Reduction Plan: The purpose of this program is to reduce flood related hazards and damages on the Reservation.
• Multi-Hazard Mitigation Plan: The purpose of this program is to evaluate risks from natural hazards on the Reservation and to identify and implement actions to reduce or eliminate the hazards.
• Ground water monitoring: Regular monitoring of water levels and water quality in 28 locations is undertaken to protect Reservation ground water.
• Environmental Permitting Support: Work closely with the Lummi Planning Department and other LIBC departments to ensure that water resources are protected whenever development projects are undertaken on or near the Lummi Reservation.
Lummi Nation Water Quality Monitoring Strategy December 2007
32

• Tidelands and Coastal Zone Management: Provide technical support to implement the Lummi Nation Tidelands Ordinance (Title 13) and the Lummi Nation Coastal Zone Management Plan.
• Portage Bay Shellfish Bed Closure Response: The Lummi Nation is contributing to an intergovernmental effort to identify and correct pollution sources that have contaminated tribal shellfish beds.
• Stream Gaging: The Lummi Nation is working cooperatively with the U.S. Geological Survey and others to ensure operation of a stream gaging network in the Nooksack River Watershed.
• WRIA 1 Watershed Management Project: An effort is underway to develop and implement a plan to allocate water for instream flow and out-of-stream uses, to protect water quality, and to restore and protect fish habitat in the Nooksack River basin and certain adjacent watersheds.
• On-Reservation Water Rights Negotiation and Litigation: Provide technical support to efforts to quantify and protect on-Reservation water rights through negotiation, if possible, and litigation if necessary.
12. SUMMARY
Water resources of sufficient quantity and quality are critical to the Lummi Nation and the Lummi People. To protect these resources a Comprehensive Water Resources Management Program is being implemented. As part of this comprehensive program the Lummi Water Resources Division monitors surface and ground water resources to protect water rights and to safeguard all beneficial uses. Beneficial uses of Lummi Nation Waters include: public health and public enjoyment; the propagation, protection, and restoration of fish, shellfish, wildlife, and their habitats; and the protection of the surface waters of the Lummi Indian Reservation as cultural, economic, and spiritual resources of the Lummi People. The collection, management, evaluation, analysis, and reporting of water quality monitoring data are included in the Water Resources Division’s responsibilities. An improved data management system that became operational during 2007 will improve the efficiency and effectiveness of program planning and implementation. Other improvements in program staffing, training, and development are being implemented or planned.
Lummi Nation Water Quality Monitoring Strategy December 2007
33

13. LIST OF REFERENCES
Arnett, J. 1994. Lummi Reservation Wetlands Study Field Inventory - Final Report. Cline, D.R. 1974. A ground water investigation of the Lummi Indian Reservation area,
Washington. Tacoma, U.S. Geological Survey, Open-File Report. 66 p. Deardorff, L. 1992. A Brief History of the Nooksack River’s Delta Distributaries. Lummi
Nation Fisheries Department. 33 p. Harper, K. 1999. Lummi Nation Wetland Inventory Technical Report. Sheldon and
Associates, Inc. Seattle, Washington. December. 35 p. Lummi Water Resources Division (LWRD). 1997. Lummi Nation Wellhead Protection
Program --Phase I. Prepared for Lummi Indian Business Council. Lummi Reservation, Washington. November.
Lummi Water Resources Division (LWRD). 1998. Lummi Reservation Storm Water
Management Program Technical Background Document. Prepared for Lummi Indian Business Council. Lummi Reservation, Washington. December.
Lummi Water Resources Division (LWRD). 2000. Lummi Indian Reservation Wetland
Management Program Technical Background Document. Prepared for Lummi Indian Business Council. Lummi Reservation, Washington. March.
Lummi Water Resources Division (LWRD). 2001. Nonpoint Source Assessment
Report. Prepared for Lummi Indian Business Council. Lummi Reservation, Washington. December.
Lummi Water Resources Division (LWRD). 2002. Nonpoint Source Management Plan.
Prepared for Lummi Indian Business Council. Lummi Reservation, Washington. January.
Lummi Water Resources Division (LWRD). 2006. Lummi Nation Water Quality
Monitoring Program, Quality Assurance/Quality Control Plan. Version 3.0. Prepared for Lummi Indian Business Council. Lummi Reservation, Washington. January.
U. S. Fish and Wildlife Service (USFWS). 1987. National Wetlands Inventory. Washington State Department of Conservation (WSDC). 1960. Water Resources of the
Nooksack River Basin and Certain Adjacent Streams: Water Supply Bulletin No. 12. 187 p.
Washington State Department of Ecology (Ecology). 2000. Nooksack River Watershed
Bacteria Total Maximum Daily Load. Pub No. 00-10-036 June.
Washington State Department of Health (DOH). 1997. Sanitary Survey of Portage Bay. August
Lummi Nation Water Quality Monitoring Strategy December 2007
34