Water Quality Monitoring During Turbine Venting … Report Water Quality Monitoring During Turbine...
51
Final Report Water Quality Monitoring During Turbine Venting Tests at the Iron Gate Powerhouse, Klamath Hydroelectric Project Prepared by Ken Carlson (CH2M HILL) Kaylea Foster (MB&G) Prepared for PacifiCorp Energy Portland, Oregon December 2008
Transcript of Water Quality Monitoring During Turbine Venting … Report Water Quality Monitoring During Turbine...

F i n a l R e p o r t
Water Quality Monitoring During Turbine Venting Tests at the Iron
Gate Powerhouse, Klamath Hydroelectric Project
Prepared by Ken Carlson (CH2M HILL)
Kaylea Foster (MB&G)
Prepared for
PacifiCorp Energy
Portland, Oregon
December 2008

This report should be cited as:
Carlson, K. and K. Foster. 2008. Water Quality Monitoring During Turbine Venting Tests at the Iron Gate Powerhouse, Klamath Hydroelectric Project. Draft Report. Prepared by CH2M HILL and Mason, Bruce, & Girard. Prepared for PacifiCorp Energy. December 2008.

Table of Contents
Introduction...................................................................................................................................1 Purpose and Objective .....................................................................................................1 Background .......................................................................................................................1
Methods..........................................................................................................................................3 Results ............................................................................................................................................4
Test Conditions .................................................................................................................4 August 2008..........................................................................................................4 October 2008.........................................................................................................4
Water Quality Measurements During the August 2008 Test .....................................5 Dissolved Oxygen ...............................................................................................5 Total Dissolved Gas ..........................................................................................10
Water Quality Measurements During the October 2008 Test ..................................13 Dissolved Oxygen .............................................................................................13 Total Dissolved Gas ..........................................................................................16
Conclusions .................................................................................................................................18 References ....................................................................................................................................19
List of Figures
Figure 1. Continuous measurements of DO in mg/l (top plot) and percent saturation (bottom plot) from the Klamath River near the USGS Gage Station below Iron Gate powerhouse during August 18-19, 2008. Test conditions are indicated by the hatched line with a value determined as explained in the Results section of the report............. 6
Figure 2. Continuous measurements of DO in mg/l (top plot) and percent saturation (bottom plot) from the Klamath River near the USGS Gage Station below Iron Gate powerhouse during August 20-21, 2008. Test conditions are indicated by the hatched line with a value determined as explained in the Results section of the report............. 7
Figure 3. Maximum, mean, and minimum DO values in mg/L (top plot) and percent saturation (bottom plot) from spot (instantaneous) measurements taken at various locations below Iron Gate powerhouse during the August 2008 testing event............. 9
Figure 4. Continuous measurements of TDG (in percent saturation) from the Klamath River near the USGS Gage Station below Iron Gate powerhouse during August 18-19 (top plot) and August 20-21 (bottom plot). Test conditions are indicated by the hatched line with a value determined as explained in the Results section of the report........... 11
Figure 5. Maximum, mean, and minimum TDG values (in percent saturation) from spot (instantaneous) measurements taken at various locations below Iron Gate powerhouse during the August 2008 testing event......................................................... 12
Figure 6. Continuous measurements of DO in mg/L (top plot) and percent saturation (bottom plot) from the Klamath River near the Iron Gate Hatchery bridge below Iron Gate powerhouse and near Blue Heron Park during October 9-11, 2008. Test

INTRODUCTION
PAGE 4
conditions are indicated by the hatched line with a value determined as explained in the Results section of the report. ......................................................................................... 14
Figure 7. Maximum, mean, and minimum DO values in mg/L (top plot) and percent saturation (bottom plot) from spot (instantaneous) measurements taken at various locations below Iron Gate powerhouse during the October 2008 testing event.......... 15
Figure 8. Continuous measurements of TDG (in percent saturation) from the Klamath River near the Iron Gate Hatchery bridge below Iron Gate powerhouse and near Blue Heron Park during October 9-11, 2008. Test conditions are indicated by the hatched line with a value determined as explained in the Results section of the report. ......... 16
Figure 9. Maximum, mean, and minimum TDG values (in percent saturation) from spot (instantaneous) measurements taken at various locations below Iron Gate powerhouse during the October 2008 testing event........................................................ 17
Appendices
Appendix A: Continuous Water Quality Data from August 18-21, 2008
Appendix B: Spot Measurements during August 18-21, 2008
Appendix C: Continuous Water Quality Data from October 9-12, 2008
Appendix D: Spot Measurements Taken during October 9-12, 2008

INTRODUCTION
PAGE 1
Introduction
Purpose and Objective This report describes the results of water quality monitoring in the Klamath River downstream of the Iron Gate powerhouse during turbine venting tests at the powerhouse during 2008. The turbine venting tests were conducted to support the ongoing assessment of measures to improve water quality in the vicinity of the Klamath Hydroelectric Project (Project). The primary objective of the turbine venting tests and associated water quality monitoring was to evaluate the ability and effectiveness of turbine venting to enhance dissolved oxygen (DO) in the tailwaters downstream of Iron Gate dam and powerhouse.
The Iron Gate powerhouse contains a single Francis-type turbine with a generating capacity of 18 megawatts (MW) and hydraulic capacity of 1,550 cubic feet per second (cfs). Like many turbines of similar design, the Iron Gate unit is equipped with an air admission system, which normally admits air into the turbine draft tube1 at low wicket gate2 openings to reduce or eliminate cavitation3 and residual draft tube swirl4. As the induced air travels through the draft tube and into the powerhouse tailwaters, a fraction of the oxygen (and nitrogen) goes into solution, increasing DO (and dissolved nitrogen). A potentially efficient method of improving DO is available by configuring the air admission valve to remain open at all gate openings (i.e., turbine venting).
This report is a companion document to a report by Principia Research that describes the effects of the turbine venting tests on the operation and performance of the powerhouse generating unit. Principia (2008) describes the effect of air admissions on generation efficiency, and quantifies the amount of air drawn into the unit through the air admission system over a range of turbine flows.
Background PacifiCorp is implementing a Reservoir Management Plan (RMP) for improving water quality in Copco and Iron Gate reservoirs (PacifiCorp 2008). The RMP is evaluating the effectiveness and feasibility of several technologies and measures to more effectively control water quality conditions in Copco and Iron Gate reservoirs that result from significant loads of organic and nutrient matter originating from upstream of the Project. The Project
1 The draft tube is the specially shaped outlet of the turbine unit. 2 The wicket gate is a set of guide vanes that direct inflowing water tangentially to the turbine runner. This radial flow acts on the runner vanes, causing the runner to spin. The wicket gate is adjustable to allow efficient turbine operation for a range of water flow conditions. 3 Cavitation is the phenomenon of formation of bubbles in water flowing through the turbine where the pressure of the water falls below its vapor pressure. Cavitation is an undesirable occurrence because it can cause damage to components, vibrations, and a loss of efficiency. 4 Francis turbines operated at partial discharge can have a high level of residual flow swirl at the draft tube inlet in the event of a mismatch between the swirl generated by the wicket gate and the angular momentum of flow on the turbine runner. This residual flow swirl can result in undesirable effects on turbine operation efficiency.

INTRODUCTION
PAGE 2
reservoirs on the Klamath River (i.e., Iron Gate, Copco, and J.C. Boyle reservoirs) are nutrient-enriched (eutrophic) due to large inflow loads of nutrient and organic matter from upstream sources, notably Upper Klamath Lake (UKL). In general, eutrophic lakes strongly stratify and typically experience low DO levels in the deeper water during summer (Thornton et al. 1990, Holdren et al. 2001, Cooke et al. 2005).
Daily mean dissolved oxygen conditions are at or near saturation throughout the Klamath River downstream of Iron Gate dam due to the many rapids and riffles in the river that provide mechanical reaeration (PacifiCorp 2008). An exception is the reach immediately below Iron Gate dam during late summer and fall periods, where relatively deep releases from Iron Gate reservoir entrain water, resulting in discharges from the dam of water with low dissolved oxygen concentration.
An important goal of the RMP is to assess potential techniques for increasing DO in Project-affected reaches, including downstream of Iron Gate dam and powerhouse. The RMP specifically identifies turbine venting as one of the potential techniques. In concept, turbine venting uses an air admission valve to allow the induction of air into the water passageways within a turbine to aerate the releases from a dam. Such turbine aeration utilizes the low pressures of the water passing through the turbine to entrain air for tailrace DO enhancement (Cooke and Kennedy 1989, Thornton et al. 1990, MEI 2005).
In 2005, MEI (2005) conducted a preliminary assessment of the potential use of turbine venting at the Iron Gate powerhouse. MEI (2005) used modeling to estimate air admission rates, DO uptake, and potential total dissolved gas (TDG) for the observed powerhouse operating conditions. MEI (2005) estimated that turbine air admission could result in DO uptake of 1.5 to 2.7 mg/L depending on turbine operation conditions.
In part based on the MEI (2005) assessment, the Final Environmental Impact Statement (FEIS) for the Project issued by the Federal Energy Regulatory Commission (FERC) concluded that turbine venting would be effective in achieving increases in dissolved oxygen in the Klamath River downstream of Iron Gate dam. On this basis, FERC (2007) recommended a measure to include turbine venting and follow-up DO monitoring at Iron Gate. In response to FERC’s recommendation, PacifiCorp incorporated the turbine venting study in the RMP, and conducted the study in 2008.

METHODS
PAGE 3
Methods
Testing took place on two occasions: (1) August 18-22, 2008; and (2) October 9-12, 2008. During the two events, turbine venting testing was performed over a range of turbine airflow conditions between the air admission valve fully open to fully closed. Because the flow releases at Iron Gate are subject to regulated instream flow requirements, the range of turbine flow conditions was limited to 990 to 1500 cfs.
The water quality monitoring during turbine venting tests consisted principally of continuous and spot (instantaneous) measurements of DO and TDG in the tailwaters and the river downstream of Iron Gate dam and powerhouse. Data were collected with two types of recording instruments: (1) YSI Datasonde; and (2) Hydrolab Minisonde. The YSI Datasonde was used to measure and record DO in milligrams per liter (mg/L) and percent saturation (% saturation). The Hydrolab Minisonde was used to measure and record TDG in millimeters of mercury (mmHg) and percent saturation (% saturation).
During the August 2008 event, a continuously-recording YSI Datasonde and Hydrolab Minisonde was deployed downstream of Iron Gate dam near the Iron Gate Hatchery bridge (at RM 189.8). A second Hydrolab Minisonde was deployed in the Klamath River further downstream near Blue Heron Park (RM 188.6) to measure TDG, while a second YSI Datasonde was used for taking spot measurements of DO at various locations downstream of Iron Gate dam. Apparent malfunction resulted in non-collection of data by the YSI Datasonde deployed near the Iron Gate Hatchery bridge. Fortunately, a similar datasonde had been deployed throughout the summer by the Karuk Tribe nearby at the USGS Gaging Station 11516530 (RM 189.5). The Karuk Tribe graciously provided the provisional data collected by their datasonde covering the August 2008 event (S. Corum, pers. comm., October 2008). This Karuk Tribe data is included along with the other data discussed in the Results section that follows.
During the October 2008 event, continuously-recording YSI Datasonde and Hydrolab Minisonde units were deployed at both monitoring stations: (1) downstream of Iron Gate dam near the Iron Gate Hatchery bridge (RM 189.9); and (2) the Klamath River further downstream near Blue Heron Park (RM 188.6). Continuous monitoring was supplemented by spot measurements using other instruments at the Iron Gate powerhouse tailrace (RM 190.0), the Klamath River at the USGS Gaging Station 11516530 (RM 189.5), and the Klamath River at Klamathon Bridge (RM 184.2).
Prior to deployment, the instruments were calibrated and programmed to collect water quality readings at 30-minute intervals. The instruments were set to begin collecting baseline data prior to testing (i.e., during existing regular operations). Continuous monitoring and spot measurements occurred during testing, and data continued to be collected for an additional 24 hours after testing ceased and regular operations resumed.

RESULTS
PAGE 4
Results
Test Conditions August 2008 During the August event, turbine venting testing was performed over a range of turbine airflow conditions between the air admission valve fully open to fully closed. From a zero to 38 percent wicket gate opening, the valve is fully open. At 38 percent, the valve begins closing and is fully closed at gate openings greater than 65 percent (Principia 2008).
Monitoring began on August 18 prior to testing during existing regular powerhouse operations. The existing regular operations included a wicket gate opening of about 60 percent with the air admission valve slightly open. The turbine penstock discharge was 990 cfs, and the river discharge measured at the USGS Gaging Station 11516530 (below Bogus Creek) was 1030 cfs.
At about noon on August 19, the wicket gate opening was adjusted to about 23 percent with the air admission valve fully open. This condition remained until about 3 PM on August 20, when flow was increased to a turbine penstock discharge of about 1500 cfs with a river discharge measured at the USGS Station (11516530) of 1560 cfs. A series of gate opening adjustments were made until about 6 PM to support a series of turbine efficiency measurements by Principia (2008). The turbine efficiency measurements made during this three-hour period on August 20 were conducted at gate openings from 30 percent to about 85 percent at 5 percent increments. The fully-closed valve setting at the 85 percent gate openings was held until about mid-day on August 21, when the regular wicket gate opening of about 60 percent was reinstated with the air admission valve slightly open.
October 2008 The October monitoring event was conducted to obtain additional water quality measurements during turbine venting with the air admission valve fully open. This event was conducted only to obtain the additional water quality measurements. No additional turbine efficiency data was collected. The river discharge measured at the USGS Gaging Station 11516530 (below Bogus Creek) remained at 1320 to 1340 cfs during this event.
Monitoring began on October 9 prior to turbine venting during existing regular powerhouse operations (i.e., a wicket gate opening of about 60 percent with the air admission valve slightly open). At 8:30 AM on October 10, the air admission valve was fully opened at a gate opening of about 30 percent and venting occurred for the following 24 hours. Both instantaneous and continuous data were collected for an additional 24 hours after regular operations resumed.

RESULTS
PAGE 5
Water Quality Measurements During the August 2008 Test Dissolved Oxygen Continuous measurements of DO from the Klamath River below Iron Gate powerhouse during the August 2008 test are shown in Figures 1 and 2. The continuous measurement data is provided in Appendix A.
Test conditions during the August test period are indicated on Figures 1 and 2 by a hatched line with a value determined as follows: (1) positive or negative values indicate a condition when the turbine air admission valve was on or off, respectively; and (2) the magnitude of the values correspond to the percent opening of turbine wicket gates. The pre-test existing operation condition is represented on the plots by a value of +60, which corresponds to the current operation with the admission valve on at a 60 percent gate opening. The test condition when the air is fully on is represented on the plots by a value of +23 with the admission valve on at a 23 percent gate opening.
The continuous measurements of DO shown in Figures 1 and 2 indicate that turbine venting air admissions produced an increase in DO in turbine discharges to the river during the August 2008 test. The first evidence of this effect can be seen when the air admission valve was briefly shut off around noon on August 19, which appeared to cause a drop in DO of about 1 mg/L and 10 percent saturation (Figure 1).
This brief valve shut-off period was followed by a 27-hour period when the air admission system was fully on at a gate opening of 23 percent (shown on the later part of the Figure 1 plot and earlier part of the Figure 2 plot). During this “fully air on” period, DO ranged from a minimum of about 7.2 mg/L and 80 percent saturation to a maximum of about 8.6 mg/L and 96 percent saturation. By comparison, the previous day’s pre-test DO values ranged from a minimum of about 6.2 mg/L and 68 percent saturation to a maximum of about 8.3 mg/L and 93 percent saturation.
The “fully air on” condition remained until about 3 PM on August 20, when flow was increased to a turbine penstock discharge of about 1500 cfs with a river discharge measured at the USGS Station (11516530) of 1560 cfs. A spike in DO is evident at this time in Figure 2, when DO increased by about 1 mg/L and 10 percent saturation. Over the next few hours, a series of gate opening adjustments were made to support a series of turbine efficiency measurements by Principia (2008). Concurrent smaller responses in DO occurred during this short period (Figure 2).
At the conclusion of the series of gate opening adjustments, a “fully air off” condition (i.e., a fully-closed valve setting at the 85 percent gate openings) was held until about mid-day on August 21, when the regular wicket gate opening of about 60 percent was reinstated with the air admission valve slightly open. During this “fully air off” condition, DO values declined to a minimum of about 5.6 mg/L and 64 percent saturation to a maximum of about 8.3 mg/L and 94 percent saturation.

RESULTS
PAGE 6
Dissolved Oxygen: August 18‐19, 2008
5
6
7
8
9
10
8/189:01
8/1811:01
8/1813:01
8/1815:01
8/1817:01
8/1819:01
8/1821:01
8/1823:01
8/191:01
8/193:01
8/195:01
8/197:01
8/199:01
8/1911:01
8/1913:01
8/1915:01
8/1917:01
8/1919:01
8/1921:01
8/1923:01
Date
Dissolved
Oxygen (m
g/L)
‐100
‐60
‐20
20
60
100
Test Con
dition
Dissolved Oxygen At USGS Station
Test Condition
60
70
80
90
100
110
8/189:01
8/1811:01
8/1813:01
8/1815:01
8/1817:01
8/1819:01
8/1821:01
8/1823:01
8/191:01
8/193:01
8/195:01
8/197:01
8/199:01
8/1911:01
8/1913:01
8/1915:01
8/1917:01
8/1919:01
8/1921:01
8/1923:01
Date
Dissolved
Oxygen (%
saturation)
‐100
‐60
‐20
20
60
100
Test Con
dition
Dissolved Oxygen At USGS Station
Test Condition
Figure 1. Continuous measurements of DO in mg/l (top plot) and percent saturation (bottom plot) from the Klamath River near the USGS Gage Station below Iron Gate powerhouse during August 18-19, 2008. Test conditions are indicated by the hatched line with a value determined as explained in the Results section of the report.

RESULTS
PAGE 7
Dissolved Oxygen: August 20‐21, 2008
5
6
7
8
9
10
8/200:01
8/202:31
8/205:01
8/207:31
8/2010:01
8/2012:31
8/2015:01
8/2017:31
8/2020:01
8/2022:31
8/211:01
8/213:31
8/216:01
8/218:31
8/2111:01
8/2113:31
8/2116:01
8/2118:31
8/2121:01
8/2123:31
Date
Dissolved
Oxygen (m
g/L)
‐100
‐60
‐20
20
60
100
Test Con
dition
Dissolved Oxygen At USGS Station
Test Condition
60
70
80
90
100
110
8/200:01
8/202:31
8/205:01
8/207:31
8/2010:01
8/2012:31
8/2015:01
8/2017:31
8/2020:01
8/2022:31
8/211:01
8/213:31
8/216:01
8/218:31
8/2111:01
8/2113:31
8/2116:01
8/2118:31
8/2121:01
8/2123:31
Date
Dissolved
Oxygen (%
saturation)
‐100
‐60
‐20
20
60
100
Test Con
dition
Dissolved Oxygen At USGS Station
Test Condition
Figure 2. Continuous measurements of DO in mg/l (top plot) and percent saturation (bottom plot) from the Klamath River near the USGS Gage Station below Iron Gate powerhouse during August 20-21, 2008. Test conditions are indicated by the hatched line with a value determined as explained in the Results section of the report.

RESULTS
PAGE 8
The changes in the continuous measurements of DO as described above suggest two main results. First, the air admission operation that is currently used at the Iron Gate powerhouse appears to provide an increase in DO on the order of about 1 mg/L and 10 percent saturation over what would occur without air admission. Second, additional air admission (turbine venting) appears to provide an additional increase in DO on the order of about 1 mg/L and 10 percent saturation over what occurs with the existing operation condition.
Spot (instantaneous) measurements of DO from various locations downstream of Iron Gate dam taken during the August 2008 test are provided in Appendix B. Maximum, mean, and minimum values from these spot measurements are shown in Figure 3. These maximum, mean, and minimum values were derived by combining measurements across locations during the portion of the August test period when conditions represented: (1) current, existing operations, (2) full air on conditions when turbine flows were about 1000 cfs, and (3) full air on conditions when turbine flows were about 1500 cfs.
The values shown in Figure 3 suggest that full air on conditions produced an increase in DO of up to about 2 mg/L and 20 percent saturation over what occurs with the existing operation condition. The values also suggest that powerhouse discharge may have an effect. In this case, the maximum, mean, and minimum values for the full air on conditions at 1000 cfs are greater than the values at 1500 cfs.
The maximum, mean, and minimum values from the spot measurements suggests a slightly greater increase in DO from turbine venting than is indicated based on the continuous data (Figures 1 and 2). This could be explained at least in part by the potential confounding factor of diurnal and spatial variability. For example, the spot measurements were taken at various times of the day when underlying natural diurnal changes in DO was occurring. This variability increases the uncertainty of the comparisons made based on these measurements. However, even taking such variability into account, the increases in DO from turbine venting indicated in Figure 3 generally support the continuous data results described above.

RESULTS
PAGE 9
7
8
9
10
11
12
13
Existing; All Sites; 1000 cfs Air On; All Sites; 1000 cfs Air On; All Sites; 1500 cfs
Test Condition
Dis
solv
ed O
xyge
n (m
g/L)
Max Mean Min
80
90
100
110
120
130
140
Existing; All Sites; 1000 cfs Air On; All Sites; 1000 cfs Air On; All Sites; 1500 cfs
Test Condition
Dis
solv
ed O
xyge
n (%
sat
urat
ion)
Max Mean Min
Figure 3. Maximum, mean, and minimum DO values in mg/L (top plot) and percent saturation (bottom plot) from spot (instantaneous) measurements taken at various locations below Iron Gate powerhouse during the August 2008 testing event.

RESULTS
PAGE 10
Total Dissolved Gas Continuous measurements of TDG from the Klamath River below Iron Gate powerhouse during the August 2008 test are shown in Figure 4. The continuous measurement data is provided in Appendix A.
The continuous measurements of TDG shown in Figure 4 indicate that turbine venting air admissions produced an increase in TDG in turbine discharges to the river during the August 2008 test. However, these increases were consistently less than those indicated for DO (Figures 1 and 2), and were consistently below 110 percent, which is the criteria established by the U.S. EPA to prevent fish harm from potential gas bubble disease (USEPA 1976).
Spot (instantaneous) measurements of TDG from various locations downstream of Iron Gate dam taken during the August 2008 test are provided in Appendix B. Maximum, mean, and minimum values from these spot measurements are shown in Figure 5. These maximum, mean, and minimum values were derived by combining measurements across locations during the portion of the August test period when conditions represented: (1) current, existing operations, (2) full air on conditions when turbine flows were about 1000 cfs, and (3) full air on conditions when turbine flows were about 1500 cfs.
The values shown in Figure 5 suggest that turbine venting (at full air on conditions) produced only small changes in TDG. Maximum TDG values indicate that all spot measurements of TDG during the August 2008 test period were below 110 percent.

RESULTS
PAGE 11
TDG: August 18‐19, 2008
70
80
90
100
110
120
8/189:01
8/1811:01
8/1813:01
8/1815:01
8/1817:01
8/1819:01
8/1821:01
8/1823:01
8/191:01
8/193:01
8/195:01
8/197:01
8/199:01
8/1911:01
8/1913:01
8/1915:01
8/1917:01
8/1919:01
8/1921:01
8/1923:01
Date
Total D
issolved
Gas (%
saturation)
‐100
‐60
‐20
20
60
100
Test Con
dition
Total Dissolved Gas
Test Condition
TDG: August 20‐21, 2008
70
80
90
100
110
120
8/200:01
8/202:31
8/205:01
8/207:31
8/2010:01
8/2012:31
8/2015:01
8/2017:31
8/2020:01
8/2022:31
8/211:01
8/213:31
8/216:01
8/218:31
8/2111:01
8/2113:31
8/2116:01
8/2118:31
8/2121:01
8/2123:31
Date
Total D
issolved
Gas (%
saturation)
‐100
‐60
‐20
20
60
100
Test Con
dition
Total Dissolved Gas
Test Condition
Figure 4. Continuous measurements of TDG (in percent saturation) from the Klamath River near the USGS Gage Station below Iron Gate powerhouse during August 18-19 (top plot) and August 20-21 (bottom plot). Test conditions are indicated by the hatched line with a value determined as explained in the Results section of the report.

RESULTS
PAGE 12
80
90
100
110
120
130
140
Existing; All Sites; 1000 cfs Air Open; All Sites; 1000 cfs Air Open; All Sites; 1500 cfs
Test Condition
TDG
(% s
atur
atio
n)Max Mean Min
Figure 5. Maximum, mean, and minimum TDG values (in percent saturation) from spot (instantaneous) measurements taken at various locations below Iron Gate powerhouse during the August 2008 testing event.

RESULTS
PAGE 13
Water Quality Measurements During the October 2008 Test Dissolved Oxygen Continuous measurements of DO from the Klamath River below Iron Gate powerhouse (near the Iron Gate Hatchery bridge) and near Blue Heron Park during the October 2008 test are shown in Figure 6. The continuous measurement data is provided in Appendix C.
Test conditions during the October test period are indicated on Figure 6 by a hatched line. The existing operation condition is represented on the plots by a value of +60, which corresponds to the current operation with the admission valve on at a 60 percent gate opening. The test condition when the air is fully on is represented on the plots by a value of +23 with the admission valve on at a 23 percent gate opening.
The continuous measurements of DO shown in Figure 6 indicate that turbine venting (air fully on) produced an increase in DO in turbine discharges to the river during the October 2008 test. A spike in DO is evident at the time that turbine venting (air fully on) commenced on October 10, when DO quickly increased by about 0.5 mg/L and 7 percent saturation (Figure 6). At the end of the turbine venting (air fully on) period on October 11, DO quickly decreased by a similar amount (Figure 6). However, in general, the range in DO values did not change much during the turbine venting (air fully on) condition, particularly in the Klamath River at Blue Heron Park further downstream.
Overall, the continuous measurements indicate that turbine venting provided less increase in DO during the October test than the previous August test. The lesser effect in October may be related to the reservoir beginning to destratify and there is a greater proportion of low-DO water from Iron Gate reservoir than is captured in the penstock to the powerhouse at this time. The consistently higher DO levels measured in the Klamath River at Blue Heron Park further downstream indicates that significant mechanical reaeration of river flow occurs over a relatively short distance downstream of Iron Gate dam.
Spot (instantaneous) measurements of DO from various locations downstream of Iron Gate dam taken during the October 2008 test are provided in Appendix D. Maximum, mean, and minimum values from these spot measurements are shown in Figure 7. These maximum, mean, and minimum values were derived by combining measurements across locations during the portion of the August test period when conditions represented: (1) current, existing operations, and (2) full air on conditions.
The values shown in Figure 7 suggest that full air on conditions produced little, if any increase in DO over what occurs with the existing operation condition. These values show a similar lack of change in the range in DO values as observed in the continuous data, with the exception of the spikes observed in the continuous data at the start and end of the turbine venting period (Figure 6).

RESULTS
PAGE 14
5
6
7
8
9
10
10/912:00
10/914:30
10/917:00
10/919:30
10/922:00
10/100:30
10/103:00
10/105:30
10/108:00
10/1010:30
10/1013:30
10/1016:00
10/1018:30
10/1021:00
10/1023:30
10/112:00
10/114:30
10/117:00
10/119:30
10/1112:00
10/1114:30
Date
Dissolved
Oxygen (m
g/L)
‐100
‐60
‐20
20
60
100
Test Con
dition
Near Hatchery BridgeAt Blue Heron ParkTest Condition
60
70
80
90
100
10/912:00
10/914:30
10/917:00
10/919:30
10/922:00
10/100:30
10/103:00
10/105:30
10/108:00
10/1010:30
10/1013:30
10/1016:00
10/1018:30
10/1021:00
10/1023:30
10/112:00
10/114:30
10/117:00
10/119:30
10/1112:00
10/1114:30
Date
Dissolved
Oxygen (%
saturation)
‐100
‐60
‐20
20
60
100
Test Con
dition
Near Hatchery BridgeAt Blue Heron ParkTest Condition
Figure 6. Continuous measurements of DO in mg/L (top plot) and percent saturation (bottom plot) from the Klamath River near the Iron Gate Hatchery bridge below Iron Gate powerhouse and near Blue Heron Park during October 9-11, 2008. Test conditions are indicated by the hatched line with a value determined as explained in the Results section of the report.

RESULTS
PAGE 15
5
6
7
8
9
10
Existing Conditions Air Fully On
Dis
solv
ed O
xyge
n (m
g/L)
Max Mean Min
60
70
80
90
100
110
Existing Conditions Air Fully On
Test Condition
Dis
solv
ed O
xyge
n (%
sat
urat
ion)
Max Mean Min
Figure 7. Maximum, mean, and minimum DO values in mg/L (top plot) and percent saturation (bottom plot) from spot (instantaneous) measurements taken at various locations below Iron Gate powerhouse during the October 2008 testing event.

RESULTS
PAGE 16
Total Dissolved Gas Continuous measurements of TDG from the Klamath River below Iron Gate powerhouse (near the Iron Gate Hatchery bridge) and near Blue Heron Park during the October 2008 test are shown in Figure 8. The continuous measurement data is provided in Appendix C.
The continuous measurements of TDG shown in Figure 8 indicate that turbine venting air admissions produced a modest increase in TDG in turbine discharges to the river during the October 2008 test. As with DO, a spike in TDG is evident at the time that turbine venting (air fully on) commenced on October 10, when TDG increased by about 4 percent saturation (Figure 8). At the end of the turbine venting (air fully on) period on October 11, TDG decreased by a similar amount (Figure 8). However, in general, the range in TDG values did not change much during the turbine venting (air fully on) condition. The continuous measurements of TDG were consistently below 110 percent.
80
90
100
110
120
10/912:00
10/914:30
10/917:00
10/919:30
10/922:00
10/100:30
10/103:00
10/105:30
10/108:00
10/1010:30
10/1013:30
10/1016:00
10/1018:30
10/1021:00
10/1023:30
10/112:00
10/114:30
10/117:00
10/119:30
10/1112:00
10/1114:30
Date
Total D
issolved
Gas (%
saturation)
‐100
‐60
‐20
20
60
100
Test Con
dition
Near Hatchery BridgeAt Blue Heron ParkTest Condition
Figure 8. Continuous measurements of TDG (in percent saturation) from the Klamath River near the Iron Gate Hatchery bridge below Iron Gate powerhouse and near Blue Heron Park during October 9-11, 2008. Test conditions are indicated by the hatched line with a value determined as explained in the Results section of the report.

RESULTS
PAGE 17
Spot (instantaneous) measurements of TDG from various locations downstream of Iron Gate dam taken during the October 2008 test are provided in Appendix D. Maximum, mean, and minimum values from these spot measurements are shown in Figure 9. These maximum, mean, and minimum values were derived by combining measurements across locations during the portion of the October test period when conditions represented: (1) current, existing operations, and (2) full air on conditions.
The values shown in Figure 9 suggest that turbine venting (at full air on conditions) produced only small changes in TDG. Maximum TDG values indicate that all spot measurements of TDG during the October 2008 test period were below 110 percent.
80
90
100
110
Existing Conditions Air Fully On
Test Condition
TDG
(% s
atur
atio
n)
Max Mean Min
Figure 9. Maximum, mean, and minimum TDG values (in percent saturation) from spot (instantaneous) measurements taken at various locations below Iron Gate powerhouse during the October 2008 testing event.

CONCLUSIONS
PAGE 18
Conclusions
Turbine venting tests and associated water quality monitoring were conducted during 2008 to evaluate the ability and effectiveness of turbine venting to enhance DO downstream of Iron Gate dam and powerhouse. Testing took place on two occasions: (1) August 18-22, 2008; and (2) October 9-12, 2008.
The results of these tests indicate that turbine venting provides enhancement of DO in the Klamath River just downstream of the Iron Gate powerhouse. Monitoring data taken during the tests suggests that full air on conditions produce an increase in DO of about 0.5 to 2 mg/L (about 7 to 20 percent saturation) over what occurs with the current air admission operation. These results are in reasonable agreement with the preliminary assessment by MEI (2005) of the potential use of turbine venting at the Iron Gate powerhouse. MEI (2005) estimated that turbine air admission could result in DO uptake of 1.5 to 2.7 mg/L depending on turbine operation conditions.
In general, the turbine venting provided greater increase in DO during the August test than the October test. The lesser effect in October may be related to a greater proportion of low-DO water from Iron Gate reservoir than is captured in the penstock to the powerhouse at that time. The consistently higher DO levels measured in the Klamath River at Blue Heron Park in October indicates that significant mechanical reaeration of river flow occurs over a relatively short distance downstream of Iron Gate dam.
TDG measurements indicate that turbine venting produces modest, if any increase in TDG in turbine discharges to the river. In all cases, TDG measurements taken during the tests were below 110 percent, which is the criteria established by the U.S. EPA to prevent fish harm from potential gas bubble disease (USEPA 1976).
Although these tests indicate that turbine venting can provide further enhancement of DO, it is evident that the amount of enhancement varies depending on conditions – for example, by time of year (as indicated by the differences between the August and October test results) or river flow amount (as indicated by the differences between flow levels during the August test). In consideration of this variability, it is recommended that additional testing be considered under more varied and extended turbine venting conditions. The resulting additional information will be valuable in better defining the specific operating conditions under which turbine venting is implemented.

REFERENCES
PAGE 19
References
Cooke, G.D., E.B. Welch, S. Peterson, and S.A. Nichols. 2005. Restoration and management of lakes and reservoirs. Third edition. Taylor and Francis/CRC Press. 616 pp.
Corum, S. 2008. Provisional Datasonde Data. Email to Linda Prendergast, PacifiCorp. October 6, 2008.
FERC. 2007. Final Environmental Impact Statement for Hydropower License. Klamath Hydroelectric Project. FERC Project No. 2082-027, Oregon and California. Federal Energy Regulatory Commission, Office of Energy Projects, Division of Hydropower Licensing. Washington, DC. FERC/EIS-0201F. November 2007.
Holdren, C., W. Jones, and J. Taggart. 2001. Managing Lakes and Reservoirs. North American Lake Management Society and Terrene Institute, in cooperation with the U.S. Environmental Protection Agency. Distributed for the North American Lake Management Society. December 2002. 382 pp.
Mobley Engineering Inc. (MEI). 2005. Iron Gate Hydroelectric Project Dissolved Oxygen Enhancement Measures Feasibility Evaluation Report. Prepared for PacifiCorp, Portland, Oregon. Prepared by Mobley Engineering Inc. with assistance from Principia Research Corporation, Hydro Performance Processes Inc., and Reservoir Environmental Management Inc. May 2005. 21 pp. (Attached as Appendix C to PacifiCorp’s February 2008 401 Application to the California State Water Resources Control Board).
PacifiCorp. 2008. Application for Water Quality Certification Pursuant to Section 401 of the Federal Clean Water Act for the Relicensing of the Klamath Hydroelectric Project (FERC No. 2082) in Klamath County, Oregon. Klamath Hydroelectric Project (FERC Project No. 2082). Prepared for: Oregon Department of Environmental Quality, Portland. Prepared by: PacifiCorp, Portland, Oregon. February 2008.
Principia. 2008. PacifiCorp Iron Gate Project. Turbine Performance and Air Admission Tests. Prepared for CH2M HILL, Portland, OR. Prepared by Principia Research Corp., Nashville, TN. October 2008.
Thornton, K.W., Kimmel, B.L., and Payne, F.E. 1990. Reservoir Limnology, Ecological Perspectives. Wiley-Interscience Publication, John Wiley & Sons, Inc., New York, NY.
USEPA. 1976. Quality Criteria for Water. United States Environmental Protection Agency. Washington, D.C.

PAGE 20
Appendix A: Continuous Water Quality Data
from August 18-22, 2008

REFERENCES
PAGE 21

PAGE 22
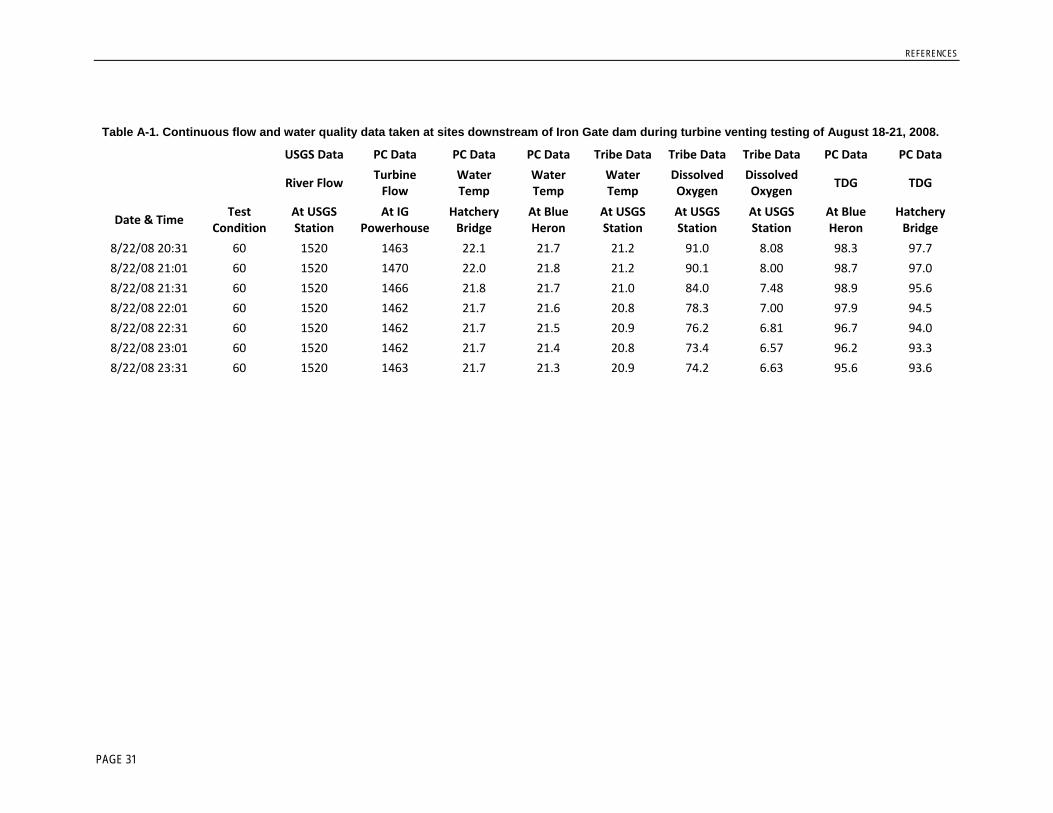
Table A-1. Continuous flow and water quality data taken at sites downstream of Iron Gate dam during turbine venting testing of August 18-21, 2008.
USGS Data PC Data PC Data PC Data Tribe Data Tribe Data Tribe Data PC Data PC Data
River Flow Turbine Flow
Water Temp
Water Temp
Water Temp
Dissolved Oxygen
Dissolved Oxygen
TDG TDG
Date & Time Test
Condition At USGS Station
At IG Powerhouse
Hatchery Bridge
At Blue Heron
At USGS Station
At USGS Station
At USGS Station
At Blue Heron
Hatchery Bridge
(CFS) (CFS) (deg C) (deg C) (deg C) (% sat) (mg/L) (% sat) (% sat)
8/18/08 9:01 60 1030 995 21.9 20.7 85.5 7.67
8/18/08 9:31 60 1030 994 21.9 20.7 86.0 7.71 8/18/08 10:01 60 1030 992 21.9 20.8 87.4 7.82 8/18/08 10:31 60 1040 994 21.9 20.8 88.4 7.91
8/18/08 11:01 60 1030 995 21.9 20.9 88.5 7.91
8/18/08 11:31 60 1040 995 21.9 20.8 88.4 7.90
8/18/08 12:01 60 1040 995 22.0 20.8 90.1 8.06
8/18/08 12:31 60 1040 996 22.0 20.9 92.3 8.24
8/18/08 13:01 60 1040 996 22.0 21.0 91.8 8.19 106.0
8/18/08 13:31 60 1040 994 21.9 20.9 89.7 8.02 105.6
8/18/08 14:01 60 1040 991 21.8 20.9 88.3 7.89 105.3
8/18/08 14:31 60 1030 994 21.8 20.9 87.5 7.82 105.0
8/18/08 15:01 60 1040 996 21.7 20.8 87.0 7.78 104.6
8/18/08 15:31 60 1040 996 21.6 20.7 84.6 7.58 104.1
8/18/08 16:01 60 1030 995 21.5 21.7 20.7 82.8 7.42 106.0 103.9
8/18/08 16:31 60 1040 995 21.5 21.5 20.6 82.4 7.40 105.7 103.7
8/18/08 17:01 60 1040 995 21.3 21.3 20.4 79.4 7.16 105.3 103.0
8/18/08 17:31 60 1040 995 21.2 21.2 20.3 75.5 6.83 104.9 102.4
8/18/08 18:01 60 1030 994 21.1 21.0 20.2 71.8 6.50 104.4 101.7
8/18/08 18:31 60 1040 997 21.0 20.9 20.1 68.1 6.18 103.7 101.4
8/18/08 19:01 60 1040 1000 21.0 20.8 20.0 68.0 6.18 103.1 101.4
8/18/08 19:31 60 1040 999 21.2 20.7 20.1 69.2 6.27 102.7 102.1
8/18/08 20:01 60 1040 998 21.4 20.6 20.3 73.3 6.62 102.4 103.0

REFERENCES
PAGE 23
Table A-1. Continuous flow and water quality data taken at sites downstream of Iron Gate dam during turbine venting testing of August 18-21, 2008.
USGS Data PC Data PC Data PC Data Tribe Data Tribe Data Tribe Data PC Data PC Data
River Flow Turbine Flow
Water Temp
Water Temp
Water Temp
Dissolved Oxygen
Dissolved Oxygen
TDG TDG
Date & Time Test
Condition At USGS Station
At IG Powerhouse
Hatchery Bridge
At Blue Heron
At USGS Station
At USGS Station
At USGS Station
At Blue Heron
Hatchery Bridge
8/18/08 20:31 60 1040 997 21.5 20.7 20.4 75.6 6.82 102.6 103.4
8/18/08 21:01 60 1040 996 21.5 20.9 20.5 76.1 6.85 103.0 103.6
8/18/08 21:31 60 1040 996 21.5 21.0 20.4 76.5 6.89 103.1 103.6
8/18/08 22:01 60 1040 995 21.6 21.0 20.4 77.6 6.99 103.3 103.7
8/18/08 22:31 60 1050 999 21.5 21.0 20.4 79.3 7.15 103.3 103.4
8/18/08 23:01 60 1030 1002 21.5 21.1 20.4 78.9 7.11 103.6 103.7
8/18/08 23:31 60 1030 999 21.5 21.1 20.3 78.6 7.10 103.6 103.4
8/19/08 0:01 60 1040 995 21.4 21.0 20.4 78.3 7.06 103.1 103.4
8/19/08 0:31 60 1040 997 21.4 21.0 20.4 79.4 7.16 103.0 103.6
8/19/08 1:01 60 1030 998 21.5 20.9 20.4 79.2 7.15 103.0 103.6
8/19/08 1:31 60 1040 994 21.5 20.9 20.3 80.9 7.30 103.0 104.1
8/19/08 2:01 60 1040 989 21.6 20.9 20.4 82.1 7.40 103.0 104.4
8/19/08 2:31 60 1030 991 21.6 21.0 20.4 83.6 7.54 103.3 104.7
8/19/08 3:01 60 1030 993 21.7 21.0 20.5 85.3 7.68 103.4 105.1
8/19/08 3:31 60 1040 995 21.8 21.1 20.6 87.6 7.88 103.7 105.4
8/19/08 4:01 60 1030 997 21.8 21.1 20.6 87.9 7.90 104.0 105.4
8/19/08 4:31 60 1040 995 21.7 21.2 20.5 87.9 7.92 104.1 105.3
8/19/08 5:01 60 1030 993 21.6 21.2 20.5 85.3 7.68 104.1 104.7
8/19/08 5:31 60 1040 994 21.7 21.1 20.4 86.4 7.80 104.0 105.3
8/19/08 6:01 60 1030 994 21.7 21.1 20.5 87.7 7.89 103.8 105.4
8/19/08 6:31 60 1040 997 21.8 21.1 20.6 88.4 7.94 104.0 105.5
8/19/08 7:01 60 1030 999 21.7 21.1 20.6 89.3 8.03 104.3 105.4
8/19/08 7:31 60 1040 994 21.7 21.2 20.5 88.6 7.97 104.6 105.5
8/19/08 8:01 60 1030 989 21.7 21.2 20.6 88.6 7.96 104.6 105.4

REFERENCES
PAGE 24
Table A-1. Continuous flow and water quality data taken at sites downstream of Iron Gate dam during turbine venting testing of August 18-21, 2008.
USGS Data PC Data PC Data PC Data Tribe Data Tribe Data Tribe Data PC Data PC Data
River Flow Turbine Flow
Water Temp
Water Temp
Water Temp
Dissolved Oxygen
Dissolved Oxygen
TDG TDG
Date & Time Test
Condition At USGS Station
At IG Powerhouse
Hatchery Bridge
At Blue Heron
At USGS Station
At USGS Station
At USGS Station
At Blue Heron
Hatchery Bridge
8/19/08 8:31 60 1040 988 21.8 21.2 20.5 88.7 7.99 105.1 105.7
8/19/08 9:01 60 1040 987 21.8 21.3 20.6 91.1 8.19 105.8 105.8
8/19/08 9:31 60 1030 989 21.8 21.4 20.6 92.0 8.26 106.5 106.0
8/19/08 10:01 60 1040 991 21.8 21.5 20.6 91.4 8.21 107.0 106.0
8/19/08 10:31 60 1030 992 21.9 21.6 20.7 93.1 8.35 107.4 106.4
8/19/08 11:01 60 993 21.7 20.8 94.4 8.45 107.7 106.5
8/19/08 11:31 ‐85 1040 993 22.0 21.8 20.8 94.9 8.49 108.3 98.9
8/19/08 12:01 ‐85 1050 992 22.0 21.9 20.8 96.1 8.60 108.4 102.3
8/19/08 12:31 ‐85 1060 1000 21.9 22.0 20.9 87.2 7.79 108.5 96.7
8/19/08 13:01 25 1040 1008 21.9 22.0 20.9 85.6 7.65 106.0 98.7
8/19/08 13:31 25 1003 22.0 21.0 95.1 8.49 102.6 106.8
8/19/08 14:01 25 1040 998 22.0 22.0 21.0 95.8 8.54 104.0 99.7
8/19/08 14:31 25 1040 878 22.0 22.0 21.0 96.8 8.63 108.0 107.4
8/19/08 15:01 25 1040 757 22.0 21.9 21.0 97.5 8.69 108.4 107.5
8/19/08 15:31 25 1040 876 22.0 21.9 21.0 97.1 8.66 108.4 107.5
8/19/08 16:01 25 1040 995 21.8 21.8 20.8 94.0 8.41 107.8 106.8
8/19/08 16:31 25 1040 992 21.8 21.7 20.8 92.1 8.25 107.5 106.7
8/19/08 17:01 25 1040 989 21.8 21.6 20.8 93.4 8.36 107.1 106.7
8/19/08 17:31 25 1030 989 21.8 21.5 20.7 91.7 8.21 106.5 106.4
8/19/08 18:01 25 1040 989 21.7 21.5 20.7 89.1 7.99 106.4 106.3
8/19/08 18:31 25 1040 991 21.7 21.4 20.6 87.9 7.89 105.7 106.1
8/19/08 19:01 25 1040 993 21.7 21.3 20.6 86.3 7.74 105.1 106.0
8/19/08 19:31 25 1040 993 21.7 21.3 20.6 86.1 7.74 104.8 105.8
8/19/08 20:01 25 1030 992 21.7 21.2 20.7 87.2 7.82 104.7 106.1

REFERENCES
PAGE 25
Table A-1. Continuous flow and water quality data taken at sites downstream of Iron Gate dam during turbine venting testing of August 18-21, 2008.
USGS Data PC Data PC Data PC Data Tribe Data Tribe Data Tribe Data PC Data PC Data
River Flow Turbine Flow
Water Temp
Water Temp
Water Temp
Dissolved Oxygen
Dissolved Oxygen
TDG TDG
Date & Time Test
Condition At USGS Station
At IG Powerhouse
Hatchery Bridge
At Blue Heron
At USGS Station
At USGS Station
At USGS Station
At Blue Heron
Hatchery Bridge
8/19/08 20:31 25 1030 993 21.6 21.2 20.5 85.9 7.74 104.6 105.7
8/19/08 21:01 25 1030 993 21.6 21.2 20.5 84.0 7.56 104.7 105.4
8/19/08 21:31 25 1040 994 21.6 21.2 20.5 83.8 7.54 104.6 105.3
8/19/08 22:01 25 1030 994 21.5 21.1 20.4 83.2 7.50 104.4 105.3
8/19/08 22:31 25 1040 993 21.5 21.1 20.4 82.0 7.40 104.3 105.0
8/19/08 23:01 25 1040 992 21.5 21.1 20.4 82.7 7.46 104.3 105.3
8/19/08 23:31 25 1040 993 21.6 21.1 20.4 83.4 7.52 104.1 105.4
8/20/08 0:01 25 1040 994 21.5 21.1 20.5 83.1 7.48 104.3 105.3
8/20/08 0:31 25 1030 994 21.5 21.1 20.4 83.2 7.51 104.3 105.3
8/20/08 1:01 25 1030 994 21.5 21.1 20.5 81.7 7.36 104.1 105.0
8/20/08 1:31 25 1030 994 21.5 21.1 20.4 81.3 7.33 104.1 105.0
8/20/08 2:01 25 1030 993 21.5 21.0 20.4 80.8 7.28 104.0 105.0
8/20/08 2:31 25 1030 993 21.5 21.0 20.4 81.3 7.34 104.0 105.0
8/20/08 3:01 25 1040 993 21.5 21.0 20.4 81.2 7.32 104.0 105.0
8/20/08 3:31 25 1030 992 21.6 21.0 20.4 82.1 7.41 104.0 105.3
8/20/08 4:01 25 1030 991 21.6 21.0 20.5 83.1 7.49 104.0 105.4
8/20/08 4:31 25 1030 992 21.6 21.1 20.5 84.3 7.58 104.1 105.7
8/20/08 5:01 25 1040 992 21.6 21.1 20.6 85.1 7.64 104.3 105.5
8/20/08 5:31 25 1030 992 21.6 21.1 20.5 83.1 7.48 104.4 105.1
8/20/08 6:01 25 1040 992 21.5 21.1 20.4 82.0 7.40 104.3 105.0
8/20/08 6:31 25 1030 993 21.5 21.1 20.4 80.8 7.29 104.1 104.7
8/20/08 7:01 25 1040 993 21.4 21.0 20.4 79.9 7.20 104.1 104.6
8/20/08 7:31 25 1030 993 21.4 21.0 20.3 79.6 7.19 104.1 104.4
8/20/08 8:01 25 1030 992 21.4 21.0 20.3 79.6 7.19 104.3 104.4

REFERENCES
PAGE 26
Table A-1. Continuous flow and water quality data taken at sites downstream of Iron Gate dam during turbine venting testing of August 18-21, 2008.
USGS Data PC Data PC Data PC Data Tribe Data Tribe Data Tribe Data PC Data PC Data
River Flow Turbine Flow
Water Temp
Water Temp
Water Temp
Dissolved Oxygen
Dissolved Oxygen
TDG TDG
Date & Time Test
Condition At USGS Station
At IG Powerhouse
Hatchery Bridge
At Blue Heron
At USGS Station
At USGS Station
At USGS Station
At Blue Heron
Hatchery Bridge
8/20/08 8:31 25 1030 992 21.4 21.0 20.3 79.9 7.22 104.8 104.4
8/20/08 9:01 25 1030 991 21.4 21.1 20.3 80.9 7.31 105.3 104.7
8/20/08 9:31 25 1030 991 21.5 21.1 20.4 82.2 7.41 105.3 105.0
8/20/08 10:01 25 1040 991 21.5 21.1 20.5 83.7 7.54 105.4 105.3
8/20/08 10:31 25 1030 990 21.6 21.3 20.5 84.5 7.60 106.3 105.3
8/20/08 11:01 25 1040 989 21.6 21.3 20.5 83.6 7.53 106.5 105.3
8/20/08 11:31 25 1030 989 21.6 21.4 20.4 84.7 7.64 106.8 105.4
8/20/08 12:01 25 1030 988 21.6 21.3 20.5 85.5 7.69 106.1 105.3
8/20/08 12:31 25 1040 1002 21.5 21.3 20.5 85.3 7.67 106.1 105.3
8/20/08 13:01 25 1120 1016 21.6 21.4 20.7 85.3 7.64 106.7 104.8
8/20/08 13:31 25 1300 1131 21.6 21.4 20.7 83.5 7.48 106.7 102.7
8/20/08 14:01 25 1430 1246 21.7 21.6 20.9 83.3 7.44 106.5 102.1
8/20/08 14:31 25 1510 1350 21.7 21.6 20.9 82.2 7.35 105.1 100.9
8/20/08 15:01 40 1570 1454 21.6 21.6 20.8 79.3 7.10 103.8 100.1
8/20/08 15:31 60 1570 1471 21.7 21.6 21.0 94.5 8.43 103.1 110.5
8/20/08 16:01 85 1550 1488 21.6 21.5 20.9 91.0 8.13 107.7 107.7
8/20/08 16:31 ‐85 1540 1489 21.6 21.5 20.8 80.6 7.21 109.1 100.7
8/20/08 17:01 ‐30 1560 1489 21.7 21.4 20.8 82.2 7.35 105.3 105.8
8/20/08 17:31 ‐55 1540 1485 21.6 21.4 20.9 85.0 7.59 100.6 104.4
8/20/08 18:01 ‐85 1550 1480 21.6 21.4 20.8 71.6 6.41 105.3 94.2
8/20/08 18:31 ‐85 1560 1489 21.6 21.3 20.7 66.6 5.97 101.1 92.2
8/20/08 19:01 ‐85 1560 1497 21.6 21.3 20.8 69.6 6.23 96.3 92.9
8/20/08 19:31 ‐85 1560 1497 21.6 21.3 20.8 70.0 6.26 95.7 92.6
8/20/08 20:01 ‐85 1570 1496 21.6 21.3 20.7 69.4 6.23 95.7 92.5

REFERENCES
PAGE 27
Table A-1. Continuous flow and water quality data taken at sites downstream of Iron Gate dam during turbine venting testing of August 18-21, 2008.
USGS Data PC Data PC Data PC Data Tribe Data Tribe Data Tribe Data PC Data PC Data
River Flow Turbine Flow
Water Temp
Water Temp
Water Temp
Dissolved Oxygen
Dissolved Oxygen
TDG TDG
Date & Time Test
Condition At USGS Station
At IG Powerhouse
Hatchery Bridge
At Blue Heron
At USGS Station
At USGS Station
At USGS Station
At Blue Heron
Hatchery Bridge
8/20/08 20:31 ‐85 1560 1495 21.6 21.3 20.7 68.2 6.11 95.2 92.2
8/20/08 21:01 ‐85 1570 1493 21.6 21.3 20.7 67.7 6.06 95.0 92.3
8/20/08 21:31 ‐85 1560 1497 21.6 21.2 20.7 69.5 6.23 94.7 92.6
8/20/08 22:01 ‐85 1560 1501 21.6 21.3 20.7 68.8 6.17 94.9 92.2
8/20/08 22:31 ‐85 1560 1500 21.6 21.3 20.7 66.7 5.97 94.9 91.9
8/20/08 23:01 ‐85 1560 1499 21.6 21.2 20.7 68.8 6.16 94.5 92.3
8/20/08 23:31 ‐85 1560 1497 21.7 21.2 20.8 70.8 6.33 94.6 92.9
8/21/08 0:01 ‐85 1560 1495 21.6 21.3 20.8 71.2 6.38 94.9 92.8
8/21/08 0:31 ‐85 1560 1499 21.5 21.3 20.6 69.0 6.20 95.0 91.9
8/21/08 1:01 ‐85 1570 1503 21.5 21.3 20.6 65.4 5.88 94.7 91.2
8/21/08 1:31 ‐85 1560 1500 21.4 21.2 20.6 62.8 5.64 94.0 90.8
8/21/08 2:01 ‐85 1560 1497 21.4 21.1 20.5 63.1 5.68 93.6 90.9
8/21/08 2:31 ‐85 1560 1492 21.4 21.1 20.6 64.2 5.77 93.5 91.1
8/21/08 3:01 ‐85 1560 1486 21.4 21.1 20.5 64.4 5.80 93.6 91.1
8/21/08 3:31 ‐85 1560 1492 21.4 21.1 20.5 64.3 5.79 93.6 91.1
8/21/08 4:01 ‐85 1560 1497 21.4 21.1 20.4 63.7 5.74 93.6 91.1
8/21/08 4:31 ‐85 1560 1497 21.4 21.0 20.5 64.5 5.81 93.6 91.2
8/21/08 5:01 ‐85 1560 1497 21.4 21.0 20.5 65.2 5.87 93.6 91.3
8/21/08 5:31 ‐85 1560 1495 21.4 21.1 20.6 64.7 5.81 93.8 91.2
8/21/08 6:01 ‐85 1560 1492 21.4 21.0 20.4 65.8 5.94 93.8 91.3
8/21/08 6:31 ‐85 1560 1491 21.4 21.0 20.4 66.8 6.02 93.8 91.6
8/21/08 7:01 ‐85 1560 1489 21.4 21.0 20.4 65.6 5.91 94.0 91.3
8/21/08 7:31 ‐85 1510 1472 21.4 21.0 20.4 65.9 5.94 94.0 91.5
8/21/08 8:01 ‐85 1500 1454 21.4 21.0 20.4 67.7 6.10 94.2 96.3

REFERENCES
PAGE 28
Table A-1. Continuous flow and water quality data taken at sites downstream of Iron Gate dam during turbine venting testing of August 18-21, 2008.
USGS Data PC Data PC Data PC Data Tribe Data Tribe Data Tribe Data PC Data PC Data
River Flow Turbine Flow
Water Temp
Water Temp
Water Temp
Dissolved Oxygen
Dissolved Oxygen
TDG TDG
Date & Time Test
Condition At USGS Station
At IG Powerhouse
Hatchery Bridge
At Blue Heron
At USGS Station
At USGS Station
At USGS Station
At Blue Heron
Hatchery Bridge
8/21/08 8:31 ‐85 1500 1444 21.5 21.1 20.5 69.4 6.25 94.9 92.5
8/21/08 9:01 ‐85 1500 1433 21.6 21.2 20.6 72.7 6.53 95.5 93.0
8/21/08 9:31 ‐85 1500 848 21.6 21.3 20.5 73.4 6.60 96.4 93.2
8/21/08 10:01 ‐85 1500 263 21.6 21.4 20.7 71.9 6.44 97.2 92.9
8/21/08 10:31 ‐85 1500 264 21.6 21.5 20.6 79.0 7.09 97.3 99.4
8/21/08 11:01 ‐85 1500 264 21.6 21.5 20.7 80.1 7.18 100.0 100.1
8/21/08 11:31 ‐85 1510 757 21.7 21.5 20.7 81.7 7.33 103.0 100.6
8/21/08 12:01 ‐85 1510 1250 21.7 21.6 20.8 83.8 7.49 103.4 101.0
8/21/08 12:31 ‐85 1510 1349 21.9 21.7 20.9 85.8 7.66 104.0 101.6
8/21/08 13:01 ‐85 1510 1447 21.9 21.8 21.1 88.5 7.88 104.4 102.0
8/21/08 13:31 ‐85 1510 1449 21.9 21.9 21.1 89.5 7.96 105.0 102.1
8/21/08 14:01 ‐85 1510 1451 21.9 21.9 21.1 89.1 7.93 105.1 102.1
8/21/08 14:31 ‐85 1510 1443 21.9 21.9 21.1 89.0 7.92 105.1 102.1
8/21/08 15:01 ‐85 1510 1434 21.9 21.9 21.0 89.5 7.98 105.0 102.3
8/21/08 15:31 ‐85 1510 1438 22.1 21.7 21.2 92.9 8.24 103.8 103.0
8/21/08 16:01 60 1510 1442 22.1 21.8 21.4 93.8 8.29 104.4 103.3
8/21/08 16:31 60 1500 1328 22.2 22.0 21.3 93.8 8.31 105.0 103.3
8/21/08 17:01 60 1510 1213 22.3 22.0 21.4 97.3 8.60 104.7 104.3
8/21/08 17:31 60 1510 1319 22.5 22.0 21.7 101.7 8.94 104.8 105.1
8/21/08 18:01 60 1510 1424 22.6 22.1 21.8 104.0 9.13 105.5 105.8
8/21/08 18:31 60 1510 1437 22.7 22.2 21.8 104.1 9.14 106.0 106.1
8/21/08 19:01 60 1500 1450 22.5 22.3 21.7 101.7 8.94 105.8 105.5
8/21/08 19:31 60 1510 1445 22.4 22.3 21.5 98.3 8.68 105.5 104.8
8/21/08 20:01 60 1510 1439 22.4 22.1 21.5 97.9 8.64 105.0 104.8

REFERENCES
PAGE 29
Table A-1. Continuous flow and water quality data taken at sites downstream of Iron Gate dam during turbine venting testing of August 18-21, 2008.
USGS Data PC Data PC Data PC Data Tribe Data Tribe Data Tribe Data PC Data PC Data
River Flow Turbine Flow
Water Temp
Water Temp
Water Temp
Dissolved Oxygen
Dissolved Oxygen
TDG TDG
Date & Time Test
Condition At USGS Station
At IG Powerhouse
Hatchery Bridge
At Blue Heron
At USGS Station
At USGS Station
At USGS Station
At Blue Heron
Hatchery Bridge
8/21/08 20:31 60 1510 1442 22.5 22.1 21.5 99.4 8.77 104.5 105.1
8/21/08 21:01 60 1510 1445 22.4 22.1 21.4 99.8 8.83 104.7 105.0
8/21/08 21:31 60 1510 1442 22.3 22.1 21.4 97.4 8.62 104.8 104.5
8/21/08 22:01 60 1500 1439 22.2 22.0 21.3 95.7 8.48 104.7 103.8
8/21/08 22:31 60 1510 1447 22.1 21.9 21.3 94.0 8.34 104.1 103.5
8/21/08 23:01 60 1510 1455 22.1 21.8 21.1 92.0 8.17 104.0 103.3
8/21/08 23:31 60 1500 1457 22.1 21.7 21.1 93.0 8.27 103.6 103.5
8/22/08 0:01 60 1510 1458 22.1 21.7 21.2 93.9 8.34 103.5 103.7
8/22/08 0:31 60 1510 1447 22.1 21.7 21.0 93.4 8.32 103.7 103.4
8/22/08 1:01 60 1510 1436 22.0 21.7 21.0 93.3 8.31 103.5 103.3
8/22/08 1:31 60 1510 1434 22.1 21.7 21.1 92.7 8.25 103.5 103.3
8/22/08 2:01 60 1510 1432 22.0 21.6 21.0 92.9 8.27 103.3 103.3
8/22/08 2:31 60 1510 1435 22.0 21.7 21.1 91.6 8.16 103.4 103.0
8/22/08 3:01 60 1510 1438 21.9 21.6 20.9 90.2 8.05 103.3 102.7
8/22/08 3:31 60 1510 1437 21.9 21.6 21.1 90.3 8.04 103.0 102.7
8/22/08 4:01 60 1510 1436 21.9 21.5 20.8 89.2 7.97 103.0 102.4
8/22/08 4:31 60 1510 1432 21.8 21.5 20.8 88.0 7.87 102.8 102.1
8/22/08 5:01 60 1510 1428 21.9 21.5 20.8 87.3 7.81 102.6 102.1
8/22/08 5:31 60 1500 1429 21.9 21.4 20.9 88.8 7.93 102.4 102.4
8/22/08 6:01 60 1510 1429 21.8 21.4 20.9 89.8 8.02 102.6 102.4
8/22/08 6:31 60 1510 1429 21.8 21.4 20.8 88.0 7.87 102.7 102.1
8/22/08 7:01 60 1510 1429 21.7 21.4 20.8 86.5 7.75 102.7 101.7
8/22/08 7:31 60 1510 1433 21.7 21.3 20.8 86.3 7.72 102.4 101.7
8/22/08 8:01 60 1510 1437 21.7 21.3 20.7 85.7 7.68 102.6 101.6

REFERENCES
PAGE 30
Table A-1. Continuous flow and water quality data taken at sites downstream of Iron Gate dam during turbine venting testing of August 18-21, 2008.
USGS Data PC Data PC Data PC Data Tribe Data Tribe Data Tribe Data PC Data PC Data
River Flow Turbine Flow
Water Temp
Water Temp
Water Temp
Dissolved Oxygen
Dissolved Oxygen
TDG TDG
Date & Time Test
Condition At USGS Station
At IG Powerhouse
Hatchery Bridge
At Blue Heron
At USGS Station
At USGS Station
At USGS Station
At Blue Heron
Hatchery Bridge
8/22/08 8:31 60 1510 1441 21.6 21.3 20.7 84.6 7.59 102.8 101.1
8/22/08 9:01 60 1530 1444 21.6 21.4 20.6 80.6 7.25 103.1 96.7
8/22/08 9:31 60 1530 1465 21.6 21.4 20.6 74.7 6.71 103.0 93.6
8/22/08 10:01 60 1530 1485 21.6 21.4 20.7 73.8 6.61 98.3 93.3
8/22/08 10:31 60 1530 1471 21.6 21.5 20.6 73.1 6.57 97.6 93.0
8/22/08 11:01 60 1530 1456 21.6 21.5 20.7 72.7 6.53 97.6 92.9
8/22/08 11:31 60 1530 1461 21.6 21.5 20.7 74.2 6.65 97.4 93.2
8/22/08 12:01 60 1530 1465 21.7 21.6 20.8 75.4 6.75 97.6 93.5
8/22/08 12:31 60 1530 1471 21.7 21.7 20.9 76.7 6.85 98.0 93.6
8/22/08 13:01 60 1530 1477 21.7 21.7 20.9 77.5 6.93 98.3 93.8
8/22/08 13:31 60 1530 1476 21.7 21.8 21.0 78.0 6.95 98.4 93.9
8/22/08 14:01 60 1530 1475 21.8 21.8 21.0 78.9 7.02 98.3 94.0
8/22/08 14:31 60 1530 1475 21.8 21.8 21.1 79.6 7.09 98.4 94.3
8/22/08 15:01 60 1540 1475 21.8 21.8 21.1 81.1 7.22 98.4 94.5
8/22/08 15:31 60 1540 1478 21.9 21.8 21.1 80.4 7.16 98.4 94.3
8/22/08 16:01 60 1540 1480 21.9 21.8 21.1 80.0 7.12 98.3 94.3
8/22/08 16:31 60 1530 1479 22.0 21.8 21.2 78.8 6.99 98.0 94.3
8/22/08 17:01 60 1530 1478 22.0 21.8 21.2 78.7 6.99 97.7 94.3
8/22/08 17:31 60 1530 1474 21.9 21.8 21.2 77.7 6.90 97.3 94.0
8/22/08 18:01 60 1520 1469 22.0 21.8 21.2 78.9 7.00 97.0 94.5
8/22/08 18:31 60 1520 1462 22.0 21.7 21.1 81.0 7.20 96.7 95.0
8/22/08 19:01 60 1530 1455 21.9 21.7 21.0 81.4 7.25 97.0 95.2
8/22/08 19:31 60 1520 1456 22.0 21.6 21.0 82.2 7.32 97.2 95.9
8/22/08 20:01 60 1520 1456 22.1 21.6 21.2 88.2 7.83 97.0 97.3
REFERENCES
PAGE 31
Table A-1. Continuous flow and water quality data taken at sites downstream of Iron Gate dam during turbine venting testing of August 18-21, 2008.
USGS Data PC Data PC Data PC Data Tribe Data Tribe Data Tribe Data PC Data PC Data
River Flow Turbine Flow
Water Temp
Water Temp
Water Temp
Dissolved Oxygen
Dissolved Oxygen
TDG TDG
Date & Time Test
Condition At USGS Station
At IG Powerhouse
Hatchery Bridge
At Blue Heron
At USGS Station
At USGS Station
At USGS Station
At Blue Heron
Hatchery Bridge
8/22/08 20:31 60 1520 1463 22.1 21.7 21.2 91.0 8.08 98.3 97.7
8/22/08 21:01 60 1520 1470 22.0 21.8 21.2 90.1 8.00 98.7 97.0
8/22/08 21:31 60 1520 1466 21.8 21.7 21.0 84.0 7.48 98.9 95.6
8/22/08 22:01 60 1520 1462 21.7 21.6 20.8 78.3 7.00 97.9 94.5
8/22/08 22:31 60 1520 1462 21.7 21.5 20.9 76.2 6.81 96.7 94.0
8/22/08 23:01 60 1520 1462 21.7 21.4 20.8 73.4 6.57 96.2 93.3
8/22/08 23:31 60 1520 1463 21.7 21.3 20.9 74.2 6.63 95.6 93.6

PAGE 32
Appendix B: Spot Measurements Taken During August 18-22, 2008

REFERENCES
PAGE 33

PAGE 34
Table B-1. Spot (instantaneous) measurements taken at sites downstream of Iron Gate dam during turbine venting testing of August 18-21, 2008.
Location Test Conditions Flow Date Time Temp (oC)
DO (% sat)
DO (mg/l)
TDG (mmHg)
TDG (% sat)
Powerhouse Tailrace Existing conditions 1000 Aug-19 11:07 21.7 108 10.2 764 109
Air Fully Off 1000 Aug-19 12:10 21.6 93 8.8 702 100
Air Fully On 1000 Aug-19 13:40 21.6 110 10.4 770 110
Air Fully Off 1500 Aug-21 8:45 21.5 85 8.1 680 97
Air Fully Off 1500 Aug-21 9:55 21.5 82 7.8 673 96
Air Fully On 1500 Aug-21 10:15 21.4 93 8.9 727 103
Air Fully On 1500 Aug-21 15:10 21.9 114 10.8 744 106
At Hatchery Bridge Existing conditions 1000 Aug-18 13:26 21.8 95 9.0 740 106
Air Fully Off 1500 Aug-21 9:45 21.5 -- -- 683 97
Air Fully On 1500 Aug-21 15:30 -- -- -- 724 103
Below Hatchery Bridge Existing conditions 1000 Aug-18 14:12 21.8 97 9.7 730 104
Air Fully Off 1000 Aug-19 12:25 22.1 109 10.3 708 101
Air Fully On 1000 Aug-19 14:25 22.0 115 10.8 755 107
Air Fully Off 1500 Aug-21 9:15 21.5 88 8.4 679 97
Air Fully On 1500 Aug-21 11:40 21.7 100 9.5 724 103
Air Fully On 1500 Aug-21 15:40 22.1 111 10.5 724 103
USGS Gaging Station Air Fully Off 1000 Aug-19 12:44 20.8 107 9.7 702 100
Air Fully On 1000 Aug-19 14:40 20.9 122 11.8 750 107
Air Fully Off 1500 Aug-21 9:00 20.5 88 8.5 687 98
Air Fully On 1500 Aug-21 11:50 20.8 102 9.8 720 102
Blue Heron RV Park Existing conditions 1000 Aug-18 15:30 21.7 105 10.0 726 104

REFERENCES
PAGE 35
Table B-1. Spot (instantaneous) measurements taken at sites downstream of Iron Gate dam during turbine venting testing of August 18-21, 2008.
Location Test Conditions Flow Date Time Temp (oC)
DO (% sat)
DO (mg/l)
TDG (mmHg)
TDG (% sat)
Air Fully On 1000 Aug-19 15:00 21.9 126 11.9 753 107
Air Fully On 1500 Aug-21 12:25 21.6 108 10.3 728 103
Fish Hook Restaurant Air Fully Off 1000 Aug-19 13:20 22.3 125 11.7 733 104
Air Fully On 1000 Aug-19 15:15 22.1 131 12.3 746 106
Air Fully Off 1500 Aug-21 9:13 21.3 93 8.9 688 98
Air Fully On 1500 Aug-21 12:35 21.9 112 10.5 736 104
Klamathon Bridge Existing Conditions 1000 Aug-18 17:25 22.5 116 10.8 718 103
Air Fully On 1000 Aug-19 15:40 24.4 138 12.6 746 106
Air Fully Off 1500 Aug-21 7:15 20.6 86 8.4 675 96
Air Fully On 1500 Aug-21 14:00 22.8 128 11.9 736 104

PAGE 36
Appendix C: Continuous Water Quality Data
from October 9-12, 2008

REFERENCES
PAGE 37

PAGE 38
Table C-1. Continuous flow and water quality data taken at sites downstream of Iron Gate dam during turbine venting testing of October 9-11, 2008.
USGS Data
PC Data PC Data PC Data PC Data PC Data PC Data PC Data PC Data PC Data
River Flow
Turbine Flow
Water Temp
Water Temp
Dissolved Oxygen
Dissolved Oxygen
Dissolved Oxygen
Dissolved Oxygen
TDG TDG
Date & Time Test
Condition At USGS Station
At IG Pwrhse
Hatchery Bridge
At Blue Heron
Hatchery Bridge
At Blue Heron
Hatchery Bridge
At Blue Heron
Hatchery Bridge
At Blue Heron
(CFS) (CFS) (deg C) (deg C) (% sat) (% sat) (mg/L) (mg/L) (% sat) (% sat)
10/9/2008 12:00 60 1320 1150 16.4 16.1 71 87 6.96 9.29 98 100
10/9/2008 12:30 60 1320 1150 16.4 16.1 71 84 6.97 8.96 98 100
10/9/2008 13:00 60 1320 1150 16.4 16.2 71 87 6.95 9.23 98 101
10/9/2008 13:30 60 1320 1150 16.4 16.2 71 85 6.98 9.06 98 101
10/9/2008 14:00 60 1320 1150 16.5 16.2 72 85 7.03 9.09 98 100
10/9/2008 14:30 60 1320 1150 16.5 16.2 72 83 6.99 8.84 98 100
10/9/2008 15:00 60 1320 1150 16.5 16.3 72 84 7.01 8.92 98 101
10/9/2008 15:30 60 1320 1150 16.5 16.3 72 88 7.06 9.32 98 100
10/9/2008 16:00 60 1320 1150 16.5 16.2 73 84 7.09 8.93 98 100
10/9/2008 16:30 60 1320 1150 16.5 16.1 73 81 7.11 8.64 98 100
10/9/2008 17:00 60 1320 1150 16.5 16 74 81 7.19 8.6 98 99
10/9/2008 17:30 60 1320 1150 16.4 16 74 80 7.25 8.54 98 99
10/9/2008 18:00 60 1320 1150 16.4 16 74 78 7.23 8.41 98 99
10/9/2008 18:30 60 1320 1150 16.4 15.9 74 77 7.19 8.3 98 99
10/9/2008 19:00 60 1320 1150 16.3 15.8 73 76 7.15 8.18 98 98
10/9/2008 19:30 60 1320 1150 16.3 15.8 73 75 7.14 8.1 98 98
10/9/2008 20:00 60 1320 1150 16.3 15.8 73 75 7.11 8.05 98 98
10/9/2008 20:30 60 1320 1150 16.3 15.8 72 75 7.09 8.03 98 98
10/9/2008 21:00 60 1320 1150 16.3 15.8 72 75 7.09 8.03 98 98
10/9/2008 21:30 60 1320 1150 16.3 15.8 72 75 7.08 8.01 98 98
10/9/2008 22:00 60 1320 1150 16.2 15.7 72 74 7.07 8 98 98
10/9/2008 22:30 60 1320 1150 16.2 15.7 72 74 7.03 8 98 98

REFERENCES
PAGE 39
Table C-1. Continuous flow and water quality data taken at sites downstream of Iron Gate dam during turbine venting testing of October 9-11, 2008.
USGS Data
PC Data PC Data PC Data PC Data PC Data PC Data PC Data PC Data PC Data
River Flow
Turbine Flow
Water Temp
Water Temp
Dissolved Oxygen
Dissolved Oxygen
Dissolved Oxygen
Dissolved Oxygen
TDG TDG
Date & Time Test
Condition At USGS Station
At IG Pwrhse
Hatchery Bridge
At Blue Heron
Hatchery Bridge
At Blue Heron
Hatchery Bridge
At Blue Heron
Hatchery Bridge
At Blue Heron
(CFS) (CFS) (deg C) (deg C) (% sat) (% sat) (mg/L) (mg/L) (% sat) (% sat)
10/9/2008 23:00 60 1320 1150 16.2 15.7 72 74 7.03 7.99 98 98
10/9/2008 23:30 60 1320 1150 16.2 15.7 71 74 7.02 7.98 98 98
10/10/2008 0:00 60 1320 1150 16.2 15.7 71 74 7 7.98 98 98
10/10/2008 0:30 60 1320 1150 16.2 15.7 71 74 6.96 7.97 97 98
10/10/2008 1:00 60 1320 1150 16.2 15.6 71 74 6.95 7.98 97 98
10/10/2008 1:30 60 1320 1150 16.1 15.6 71 74 6.94 8.03 97 98
10/10/2008 2:00 60 1320 1150 16.1 15.6 70 75 6.9 8.05 97 98
10/10/2008 2:30 60 1320 1150 16.1 15.6 70 74 6.87 8.03 97 98
10/10/2008 3:00 60 1320 1150 16.1 15.6 69 74 6.79 8.02 97 98
10/10/2008 3:30 60 1320 1150 16.1 15.6 69 74 6.76 8.02 97 98
10/10/2008 4:00 60 1320 1150 16.1 15.6 68 74 6.67 7.99 97 98
10/10/2008 4:30 60 1320 1150 16.1 15.6 67 74 6.64 7.94 97 98
10/10/2008 5:00 60 1320 1150 16.1 15.6 67 73 6.58 7.94 97 98
10/10/2008 5:30 60 1320 1150 16.1 15.5 66 73 6.54 7.92 97 98
10/10/2008 6:00 60 1320 1150 16.1 15.5 66 73 6.48 7.88 97 97
10/10/2008 6:30 60 1320 1150 16 15.5 66 73 6.49 7.86 97 97
10/10/2008 7:00 60 1320 1150 16 15.5 66 73 6.48 7.85 97 97
10/10/2008 7:30 60 1320 1150 16 15.5 66 73 6.49 7.86 97 97
10/10/2008 8:00 60 1320 1150 16 15.5 66 73 6.49 7.91 97 98
10/10/2008 8:30 25 1320 1150 16 15.5 65 74 6.45 7.99 97 98
10/10/2008 9:00 25 1320 1150 16 15.5 65 75 6.46 8.08 101 99
10/10/2008 9:30 25 1320 1150 16 15.5 72 78 7.06 8.41 101 102

REFERENCES
PAGE 40
Table C-1. Continuous flow and water quality data taken at sites downstream of Iron Gate dam during turbine venting testing of October 9-11, 2008.
USGS Data
PC Data PC Data PC Data PC Data PC Data PC Data PC Data PC Data PC Data
River Flow
Turbine Flow
Water Temp
Water Temp
Dissolved Oxygen
Dissolved Oxygen
Dissolved Oxygen
Dissolved Oxygen
TDG TDG
Date & Time Test
Condition At USGS Station
At IG Pwrhse
Hatchery Bridge
At Blue Heron
Hatchery Bridge
At Blue Heron
Hatchery Bridge
At Blue Heron
Hatchery Bridge
At Blue Heron
(CFS) (CFS) (deg C) (deg C) (% sat) (% sat) (mg/L) (mg/L) (% sat) (% sat)
10/10/2008 10:00 25 1320 1150 16 15.6 72 81 7.09 8.75 101 103
10/10/2008 10:30 25 1320 1150 16 15.7 72 82 7.1 8.83 101 103
10/10/2008 11:30 25 1320 1150 16 15.7 73 82 7.18 8.8 101 103
10/10/2008 12:00 25 1320 1150 16 15.7 72 82 7.13 8.87 101 103
10/10/2008 12:30 25 1320 1150 16 15.8 73 84 7.16 8.98 102 104
10/10/2008 13:00 25 1320 1150 16 15.9 74 84 7.26 9.04 102 104
10/10/2008 13:30 25 1320 1150 16.1 15.9 74 85 7.33 9.09 102 104
10/10/2008 14:00 25 1320 1150 16.1 15.9 75 85 7.36 9.09 102 104
10/10/2008 14:30 25 1320 1150 16.1 15.9 75 84 7.38 9.05 102 104
10/10/2008 15:00 25 1320 1150 16.1 15.9 76 84 7.46 9 102 103
10/10/2008 15:30 25 1320 1150 16.1 15.9 76 84 7.49 8.96 102 103
10/10/2008 16:00 25 1320 1150 16.2 15.8 76 83 7.47 8.9 102 103
10/10/2008 16:30 25 1320 1150 16.1 15.8 76 82 7.51 8.8 102 103
10/10/2008 17:00 25 1320 1150 16.1 15.8 76 81 7.5 8.74 102 102
10/10/2008 17:30 25 1320 1150 16.1 15.7 76 80 7.52 8.65 102 102
10/10/2008 18:00 25 1320 1150 16.1 15.6 76 79 7.48 8.48 102 102
10/10/2008 18:30 25 1320 1150 16.1 15.6 75 77 7.42 8.36 102 101
10/10/2008 19:00 25 1320 1150 16 15.6 75 77 7.42 8.29 101 101
10/10/2008 19:30 25 1320 1150 16 15.5 75 76 7.36 8.25 101 101
10/10/2008 20:00 25 1320 1150 16 15.5 75 76 7.37 8.25 101 101
10/10/2008 20:30 25 1320 1150 16 15.5 74 76 7.34 8.23 101 101
10/10/2008 21:00 25 1320 1150 15.9 15.4 74 76 7.34 8.23 101 101

REFERENCES
PAGE 41
Table C-1. Continuous flow and water quality data taken at sites downstream of Iron Gate dam during turbine venting testing of October 9-11, 2008.
USGS Data
PC Data PC Data PC Data PC Data PC Data PC Data PC Data PC Data PC Data
River Flow
Turbine Flow
Water Temp
Water Temp
Dissolved Oxygen
Dissolved Oxygen
Dissolved Oxygen
Dissolved Oxygen
TDG TDG
Date & Time Test
Condition At USGS Station
At IG Pwrhse
Hatchery Bridge
At Blue Heron
Hatchery Bridge
At Blue Heron
Hatchery Bridge
At Blue Heron
Hatchery Bridge
At Blue Heron
(CFS) (CFS) (deg C) (deg C) (% sat) (% sat) (mg/L) (mg/L) (% sat) (% sat)
10/10/2008 21:30 25 1320 1150 15.9 15.4 74 76 7.31 8.22 101 101
10/10/2008 22:00 25 1320 1150 15.9 15.4 74 76 7.32 8.23 101 101
10/10/2008 22:30 25 1320 1150 15.9 15.4 74 76 7.33 8.23 101 101
10/10/2008 23:00 25 1320 1150 15.8 15.3 74 76 7.32 8.23 101 101
10/10/2008 23:30 25 1320 1150 15.8 15.3 74 76 7.36 8.23 101 101
10/11/2008 0:00 25 1320 1150 15.8 15.3 74 76 7.36 8.22 101 101
10/11/2008 0:30 25 1320 1150 15.8 15.3 74 76 7.33 8.21 101 101
10/11/2008 1:00 25 1320 1150 15.8 15.3 74 75 7.34 8.21 101 101
10/11/2008 1:30 25 1320 1150 15.8 15.2 74 75 7.33 8.2 101 101
10/11/2008 2:00 25 1320 1150 15.7 15.2 73 75 7.28 8.16 101 101
10/11/2008 2:30 25 1320 1150 15.7 15.2 73 75 7.29 8.15 101 101
10/11/2008 3:00 25 1320 1150 15.7 15.2 73 75 7.25 8.12 101 101
10/11/2008 3:30 25 1320 1150 15.7 15.2 73 75 7.25 8.12 101 101
10/11/2008 4:00 25 1320 1150 15.7 15.1 73 74 7.2 8.11 101 101
10/11/2008 4:30 25 1320 1150 15.7 15.1 73 74 7.22 8.09 101 101
10/11/2008 5:00 25 1320 1150 15.7 15.1 72 74 7.18 8.1 101 100
10/11/2008 5:30 25 1320 1150 15.7 15.1 72 74 7.18 8.08 101 100
10/11/2008 6:00 25 1320 1150 15.6 15.1 72 74 7.14 8.07 101 100
10/11/2008 6:30 25 1320 1150 15.6 15 72 74 7.15 8.05 101 100
10/11/2008 7:00 25 1320 1150 15.6 15 72 74 7.12 8.05 101 100
10/11/2008 7:30 25 1320 1150 15.6 15 72 74 7.13 8.06 101 100
10/11/2008 8:00 25 1320 1150 15.6 15 71 74 7.11 8.08 101 101

REFERENCES
PAGE 42
Table C-1. Continuous flow and water quality data taken at sites downstream of Iron Gate dam during turbine venting testing of October 9-11, 2008.
USGS Data
PC Data PC Data PC Data PC Data PC Data PC Data PC Data PC Data PC Data
River Flow
Turbine Flow
Water Temp
Water Temp
Dissolved Oxygen
Dissolved Oxygen
Dissolved Oxygen
Dissolved Oxygen
TDG TDG
Date & Time Test
Condition At USGS Station
At IG Pwrhse
Hatchery Bridge
At Blue Heron
Hatchery Bridge
At Blue Heron
Hatchery Bridge
At Blue Heron
Hatchery Bridge
At Blue Heron
(CFS) (CFS) (deg C) (deg C) (% sat) (% sat) (mg/L) (mg/L) (% sat) (% sat)
10/11/2008 8:30 25 1320 1150 15.6 15 71 75 7.09 8.21 101 101
10/11/2008 9:00 60 1330 1160 15.6 15.1 71 77 7.09 8.36 100 102
10/11/2008 9:30 60 1330 1160 15.6 15.1 70 78 6.94 8.48 96 101
10/11/2008 10:00 60 1330 1160 15.6 15.2 65 76 6.45 8.27 96 99
10/11/2008 10:30 60 1330 1160 15.6 15.3 64 75 6.41 8.19 96 99
10/11/2008 11:00 60 1330 1160 15.6 15.4 64 76 6.4 8.26 96 100
10/11/2008 11:30 60 1330 1160 15.6 15.4 65 77 6.44 8.34 96 100
10/11/2008 12:00 60 1330 1160 15.6 15.4 65 77 6.42 8.39 96 100
10/11/2008 12:30 60 1330 1160 15.6 15.5 65 78 6.44 8.4 97 100
10/11/2008 13:00 60 1330 1160 15.7 15.5 65 79 6.5 8.5 97 100
10/11/2008 13:30 60 1330 1160 15.7 15.5 66 80 6.52 8.67 97 100
10/11/2008 14:00 60 1330 1160 15.7 15.5 66 80 6.55 8.69 97 100
10/11/2008 14:30 60 1330 1160 15.7 15.5 66 79 6.57 8.57 97 100
10/11/2008 15:00 60 1330 1160 15.8 15.5 67 78 6.6 8.46 97 99
10/11/2008 15:30 60 1330 1160 15.8 15.5 67 77 6.62 8.38 97 99
10/11/2008 16:00 60 1330 1160 15.8 15.5 68 77 6.69 8.3 97 99
10/11/2008 16:30 60 1330 1160 15.7 15.4 68 76 6.74 8.23 97 99

REFERENCES
PAGE 43

PAGE 44
Appendix D: Spot Measurements Taken During October 9-12, 2008

REFERENCES
PAGE 45
PAGE 46
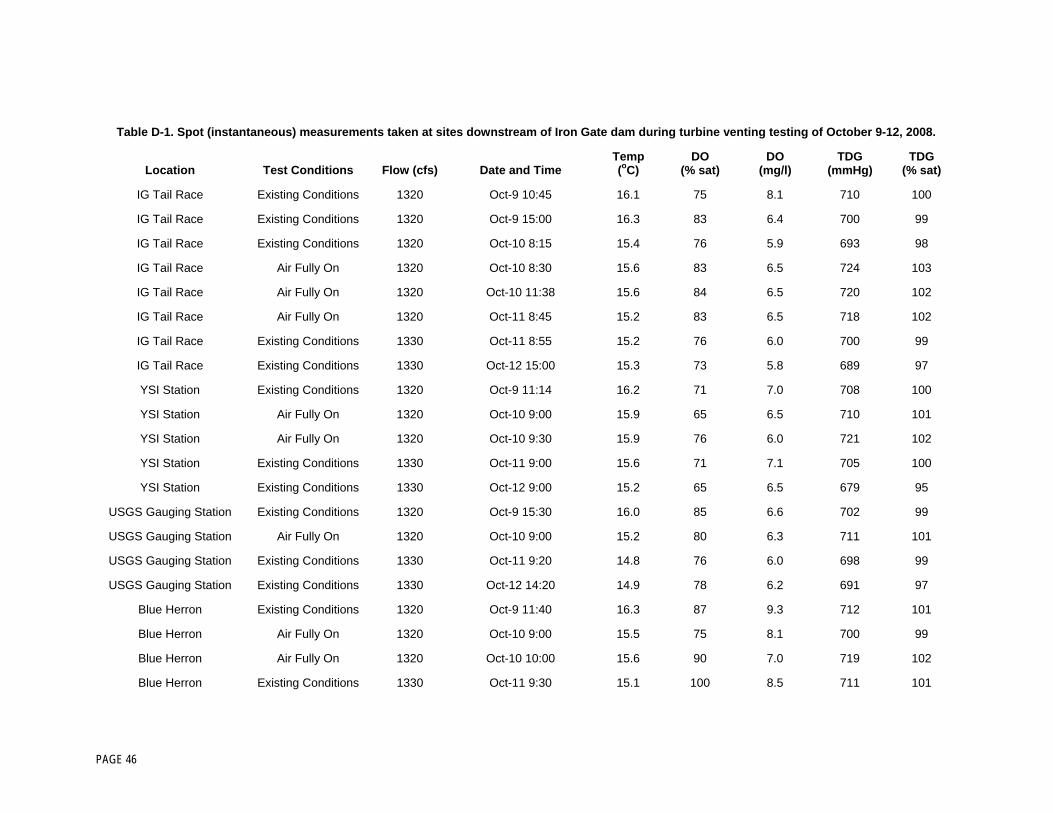
Table D-1. Spot (instantaneous) measurements taken at sites downstream of Iron Gate dam during turbine venting testing of October 9-12, 2008.
Location Test Conditions Flow (cfs) Date and Time Temp (oC)
DO (% sat)
DO (mg/l)
TDG (mmHg)
TDG (% sat)
IG Tail Race Existing Conditions 1320 Oct-9 10:45 16.1 75 8.1 710 100
IG Tail Race Existing Conditions 1320 Oct-9 15:00 16.3 83 6.4 700 99
IG Tail Race Existing Conditions 1320 Oct-10 8:15 15.4 76 5.9 693 98
IG Tail Race Air Fully On 1320 Oct-10 8:30 15.6 83 6.5 724 103
IG Tail Race Air Fully On 1320 Oct-10 11:38 15.6 84 6.5 720 102
IG Tail Race Air Fully On 1320 Oct-11 8:45 15.2 83 6.5 718 102
IG Tail Race Existing Conditions 1330 Oct-11 8:55 15.2 76 6.0 700 99
IG Tail Race Existing Conditions 1330 Oct-12 15:00 15.3 73 5.8 689 97
YSI Station Existing Conditions 1320 Oct-9 11:14 16.2 71 7.0 708 100
YSI Station Air Fully On 1320 Oct-10 9:00 15.9 65 6.5 710 101
YSI Station Air Fully On 1320 Oct-10 9:30 15.9 76 6.0 721 102
YSI Station Existing Conditions 1330 Oct-11 9:00 15.6 71 7.1 705 100
YSI Station Existing Conditions 1330 Oct-12 9:00 15.2 65 6.5 679 95
USGS Gauging Station Existing Conditions 1320 Oct-9 15:30 16.0 85 6.6 702 99
USGS Gauging Station Air Fully On 1320 Oct-10 9:00 15.2 80 6.3 711 101
USGS Gauging Station Existing Conditions 1330 Oct-11 9:20 14.8 76 6.0 698 99
USGS Gauging Station Existing Conditions 1330 Oct-12 14:20 14.9 78 6.2 691 97
Blue Herron Existing Conditions 1320 Oct-9 11:40 16.3 87 9.3 712 101
Blue Herron Air Fully On 1320 Oct-10 9:00 15.5 75 8.1 700 99
Blue Herron Air Fully On 1320 Oct-10 10:00 15.6 90 7.0 719 102
Blue Herron Existing Conditions 1330 Oct-11 9:30 15.1 100 8.5 711 101

REFERENCES
PAGE 47
Table D-1. Spot (instantaneous) measurements taken at sites downstream of Iron Gate dam during turbine venting testing of October 9-12, 2008.
Location Test Conditions Flow (cfs) Date and Time Temp (oC)
DO (% sat)
DO (mg/l)
TDG (mmHg)
TDG (% sat)
Blue Herron Existing Conditions 1330 Oct-12 9:00 14.7 71 7.9 693 97
Klamathon Existing Conditions 1320 Oct-9 13:15 16.4 105 8.0 716 101
Klamathon Air Fully On 1320 Oct-10 10:15 15.4 95 7.4 710 100
Klamathon Existing Conditions 1330 Oct-11 9:45 14.7 94 7.5 708 100
Klamathon Existing Conditions 1330 Oct-12 13:05 15.9 105 8.1 722 101