Water Quality Management Plan for Patalganga … et al. Water Quality Management Plan for Patalganga...
17
International Journal of Scientific Research in Environmental Sciences, 3(2), pp. 0071-0087, 2015 Available online at http://www.ijsrpub.com/ijsres ISSN: 2322-4983; ©2015; Author(s) retain the copyright of this article http://dx.doi.org/10.12983/ijsres-2015-p0071-0087 71 Full Length Research Paper Water Quality Management Plan for Patalganga River for Drinking Purpose and Human Health Safety Asheesh Shrivastava*, Shalini A Tandon, Rakesh Kumar National Environmental Engineering Research Institute, 89-B, Dr. A.B. Road, Worli, Mumbai – 400 018, India * Corresponding Author: Email: [email protected], Tel.: +91-022-24973521; Fax: +91-022-24936635 Received 27 October 2014; Accepted 02 February 2015 Abstract. Deteriorating water quality of rivers is of major concern in India; this is especially true for rivers being used as drinking water sources. One such river considered in this study is the Patalganga, which is located about 60 km from Mumbai and is a significant source of water supply for Panvel, Alibaug and Rasayani. This paper aims to determine the polluting sources responsible for the poor water quality of the Patalganga River and to suggest a scientifically sound water quality management plan to improve the same. A total of 14 water samples from different point sources of pollution were collected and tested for physico-chemical parameters (pH, temperature, DO, BOD, COD, TSS, TDS, EC, PO 4 3- , NO 3 -N and NH 3 -N), metals (As, Cd, Co, Cr, Cu, Fe, Mn, Ni, Pb and Zn) and microbiological parameter using World Health Organization (WHO) and the Bureau of Indian Standards (BIS) standards. Based on, the water quality at most of the sampling stations was found to be unsuitable for drinking. Hierarchical cluster analysis (HCA) classified the 14 sampling stations into three clusters. The HCA identified a uniform source of parameters (physico-chemical and nutrients) for all the sampling stations, excluding two sampling stations (7 and 12) that exhibited anomalous concentrations. Furthermore, as per the WQI, the water quality status of Patalganga River fell under good category, except at the sampling station 7 and 12 where the water quality index were bad (49) and medium (51) category, respectively, and were totally unfit for drinking purpose. Water quality management plan specific to the individual sites has been delineated in the paper. Keywords: Classification, Cluster, Metals, Nutrients, Patalganga River, Water quality, Water quality index 1. INTRODUCTION Universally, requirement for freshwater will continue to rise significantly over the coming decades to meet the needs of increasing populations, growing economies, changing lifestyles and evolving consumption patterns. This will greatly amplify the pressure on limited natural resources and ecosystems. Unsafe water and sanitation account for almost one tenth of the global burden of disease (Fewtrell et al., 2007). Total 768 million and 2.5 billion people in the world are living without access to clean water and proper sanitation, respectively (WHO, 2002; WHO and UNICEF, 2013a). According to the World Commission on water for the 21 st century, more than half of the world‟s major rivers are depleted and contaminated to the extent that they threaten human health and poison the surrounding ecosystems (Interpress, 1999). Contaminated drinking water can cause various diseases such as typhoid fever, dysentery, cholera and other intestinal diseases (Udoh, 1987; Adeyemi, 2004; Dixit and Shanker, 2009). In developing countries, about 1.8 million people, mostly children, die every year as a result of water related diseases (Payen, 2011; Onda et al., 2012; Wolf et al., 2013; WHO, 2006; WHO, 2011; WHO/UNICEF, 2013a). Anthropogenic activities have resulted in a significant decrease in surface water quality of aquatic systems in watersheds (Anhar et al., 1998; Mohd Kamil et al., 1997a; 1997b; May et al., 2006). In India, rivers are an important source of water, as many Indian cities are situated on the banks of the rivers. Untreated discharge of pollutants into a river from domestic sewers, storm water discharges, industrial wastewaters, agricultural runoff and other sources can have short-term as well as long-term effects on the water quality of a river system (Singh, 2007; Varghese et al., 2011; Rai et al., 2012; Giri and Singh, 2014). Total 80% of the water in India has become polluted due to the discharge of untreated domestic sewage and partially-treated industrial effluents into the natural water source (Ensink et al., 2009; CPCB 2007a). High levels of pollutant input in river water systems cause an increase in biological oxygen demand (BOD), chemical oxygen demand
Transcript of Water Quality Management Plan for Patalganga … et al. Water Quality Management Plan for Patalganga...

International Journal of Scientific Research in Environmental Sciences, 3(2), pp. 0071-0087, 2015
Available online at http://www.ijsrpub.com/ijsres
ISSN: 2322-4983; ©2015; Author(s) retain the copyright of this article
http://dx.doi.org/10.12983/ijsres-2015-p0071-0087
71
Full Length Research Paper
Water Quality Management Plan for Patalganga River for Drinking Purpose and
Human Health Safety
Asheesh Shrivastava*, Shalini A Tandon, Rakesh Kumar
National Environmental Engineering Research Institute, 89-B, Dr. A.B. Road, Worli, Mumbai – 400 018, India
* Corresponding Author: Email: [email protected], Tel.: +91-022-24973521; Fax: +91-022-24936635
Received 27 October 2014; Accepted 02 February 2015
Abstract. Deteriorating water quality of rivers is of major concern in India; this is especially true for rivers being used as
drinking water sources. One such river considered in this study is the Patalganga, which is located about 60 km from Mumbai
and is a significant source of water supply for Panvel, Alibaug and Rasayani. This paper aims to determine the polluting
sources responsible for the poor water quality of the Patalganga River and to suggest a scientifically sound water quality
management plan to improve the same. A total of 14 water samples from different point sources of pollution were collected
and tested for physico-chemical parameters (pH, temperature, DO, BOD, COD, TSS, TDS, EC, PO43-, NO3-N and NH3-N),
metals (As, Cd, Co, Cr, Cu, Fe, Mn, Ni, Pb and Zn) and microbiological parameter using World Health Organization (WHO)
and the Bureau of Indian Standards (BIS) standards. Based on, the water quality at most of the sampling stations was found to
be unsuitable for drinking. Hierarchical cluster analysis (HCA) classified the 14 sampling stations into three clusters. The HCA
identified a uniform source of parameters (physico-chemical and nutrients) for all the sampling stations, excluding two
sampling stations (7 and 12) that exhibited anomalous concentrations. Furthermore, as per the WQI, the water quality status of
Patalganga River fell under good category, except at the sampling station 7 and 12 where the water quality index were bad (49)
and medium (51) category, respectively, and were totally unfit for drinking purpose. Water quality management plan specific
to the individual sites has been delineated in the paper.
Keywords: Classification, Cluster, Metals, Nutrients, Patalganga River, Water quality, Water quality index
1. INTRODUCTION
Universally, requirement for freshwater will continue
to rise significantly over the coming decades to meet
the needs of increasing populations, growing
economies, changing lifestyles and evolving
consumption patterns. This will greatly amplify the
pressure on limited natural resources and ecosystems.
Unsafe water and sanitation account for almost one
tenth of the global burden of disease (Fewtrell et al.,
2007). Total 768 million and 2.5 billion people in the
world are living without access to clean water and
proper sanitation, respectively (WHO, 2002; WHO
and UNICEF, 2013a). According to the World
Commission on water for the 21st century, more than
half of the world‟s major rivers are depleted and
contaminated to the extent that they threaten human
health and poison the surrounding ecosystems
(Interpress, 1999). Contaminated drinking water can
cause various diseases such as typhoid fever,
dysentery, cholera and other intestinal diseases (Udoh,
1987; Adeyemi, 2004; Dixit and Shanker, 2009).
In developing countries, about 1.8 million people,
mostly children, die every year as a result of water
related diseases (Payen, 2011; Onda et al., 2012; Wolf
et al., 2013; WHO, 2006; WHO, 2011;
WHO/UNICEF, 2013a). Anthropogenic activities
have resulted in a significant decrease in surface water
quality of aquatic systems in watersheds (Anhar et al.,
1998; Mohd Kamil et al., 1997a; 1997b; May et al.,
2006). In India, rivers are an important source of
water, as many Indian cities are situated on the banks
of the rivers. Untreated discharge of pollutants into a
river from domestic sewers, storm water discharges,
industrial wastewaters, agricultural runoff and other
sources can have short-term as well as long-term
effects on the water quality of a river system (Singh,
2007; Varghese et al., 2011; Rai et al., 2012; Giri and
Singh, 2014). Total 80% of the water in India has
become polluted due to the discharge of untreated
domestic sewage and partially-treated industrial
effluents into the natural water source (Ensink et al.,
2009; CPCB 2007a). High levels of pollutant input in
river water systems cause an increase in biological
oxygen demand (BOD), chemical oxygen demand
Shrivastava et al.
Water Quality Management Plan for Patalganga River for Drinking Purpose and Human Health Safety
72
(COD), total dissolved solids (TDS), total suspended
solids (TSS), metals such as Cd, Cr, Ni and Pb, and
fecal coliforms (Mohd Kamil,1991; Sangodoyin,
1991; Chatterjee et al., 2000; Adekunle and Eniola,
2008).
The correlation coefficients (r) between the water
quality parameters were calculated in order to indicate
the nature and the sources of the polluting substances
(Bajpayee et al., 2012). Hierarchical cluster analysis
(HCA) was used to reduce the number of variables
into a small number of indices while preserving the
relationship present in the original data. The
application of HCA helps identify the vital
components or factors which account for most of the
variances of a system (Ouyang et al., 2006; Shrestha
and Kazama, 2007). Various techniques have been
used for quality assessment of surface waters,
amongst which use of water quality indices is one of
most acceptable methods (Nikoo et al., 2011). A water
quality index based on some very important
parameters can provide a single indicator of water
quality. The general WQI was developed by Brown et
al., (1970) and improved by Deininger for the Scottish
Development Department (1975). It is one of the most
effective ways to communicate water quality (Ott,
1978; Pesce and Wunderlin, 2000; Prakirake et al.,
2009; Taner et al., 2011).
The Patalganga River is located between the
Western Ghats and the Arabian Sea. It is an important
source of drinking water and industrial raw water for
the nearby villages and industries, respectively. The
sewage from the towns and villages along the river is
directly disposed into the river without any treatment.
Mainly textile, pharmaceuticals and dye intermediate
manufacturing industries are located in the catchment
of the Patalganga River. It is, therefore, of vital
importance to monitor the water quality parameters of
the Patalganga River to ascertain whether the water
quality is still suitable for various purposes. So, far no
systematic study has been undertaken to assess the
water quality of Patalganga River. The increased
anthropogenic activities in the catchment area will
normally influence water quality downstream and this
will impact on water treatment steps required to
ensure safe water. Therefore, this study envisaged (i)
to quantitative determination of some of the physico-
chemical parameters, microbial status and metals (As,
Cd, Co, Cu, Cr, Fe, Mn, Ni, Pb, and Zn) content of the
Patalganga River water along its 17 km stretch and to
compare the values with the drinking water standards
recommended by the World Health Organization
(WHO) and the national agency, Bureau of Indian
Standards (BIS) (ii) to evaluation of river water
quality using correlation coefficient (r) and water
quality index (WQI) (iii) to apply a hierarchical
cluster analysis for better interpretation of river water
quality data (iv) to provide a water quality
management plan for Patalganga River for drinking
purpose to minimize the health risks.
2. MATERIALS AND METHODS
2.1. Study Area and Sampling
The Patalganga valley is surrounded by the Karnala
ridge, the Matheran ridge and the Sahyadri ranges.
The Patalganga River originates from the hilly range
of Sahyadri and formed by the tailrace water released
from the Tata Hydro Power Station near Khopoli; it
then flows to the west through Khopoli city, Khalapur
region, and ultimately joins the Arabian Sea at the
Dharamtar creek. It is located across 18°48'0" N and
73°4'0" E and at an elevation of 7 m above sea level.
The catchment area of Patalganga River is 338 km2.
The river serves as the southern boundary of the
Mumbai Metropolitan Region and is also the
boundary between Panvel and Khalapur regions. The
stretch from Khopoli (from Tata Hydropower) up to
the Chawane weir is the fresh water zone, whereas in
the stretch beyond the Chawane weir, tidal influence
is observed. Many industries have been established in
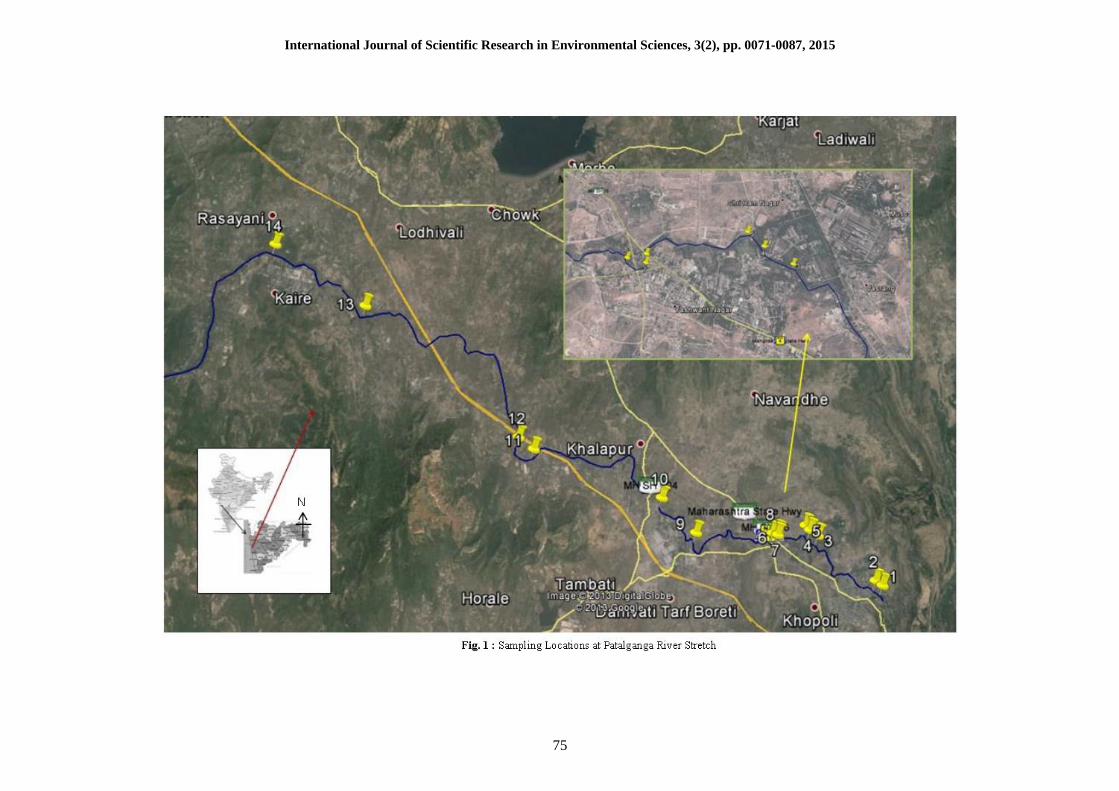
the vicinity of the said river. The sampling stations of
the study area have been described in Table 1 and
depicted in Figure 1. The river water samples were
collected in pre-cleaned, acid washed jerry cans from
the river Patalganga at fourteen sampling stations
located at the river and inlets (sampling stations 5, 7
and 12) during the winter season of 2013 and was
later stored in a refrigerator below 4 °C until used. For
orthophosphate determination, the samples were
collected in glass bottles in order to avoid adsorption
on the walls of polyethylene containers. The glass
bottles were previously soaked in diluted HNO3 and
then rinsed with deionized water. The mean value of
each sampling station was considered for river water
quality assessment.
2.2. Analytical Methods
On site measurement and laboratory analyses were
carried out as per standard methods. On site
measurement included fixation of dissolved oxygen
(DO), electrical conductivity (EC) and temperature.
Dissolved oxygen (DO), biochemical oxygen demand
(BOD), chemical oxygen demand (COD), total
suspended solids (TSS), total dissolved solids (TDS),
total solid (TS), ammoniacal - nitrogen (NH3-N),
nitrate nitrogen (NO3-N), orthophosphate (PO43-), oil
and grease and E. Coli were analyzed as per APHA
Standard Methods (APHA, AWWA, WEF, 1995). For
metal analysis the samples were preserved with the
addition of 2 ml/l HNO3 to avoid precipitation of the
International Journal of Scientific Research in Environmental Sciences, 3(2), pp. 0071-0087, 2015
73
metals. For the analysis of metals samples were
digested with 5 ml of di-acid mixture (10 ml HNO3 +
5 ml HClO4) on a hot plate and filtered by Whatman
No. 42 filter paper and made up the volume to 50 ml
by double distilled water for analysis of metals using
Inductively Coupled Plasma Optical Emission
Spectrophotometer (Optima 4100 DV ICP-OES)
(APHA, 1995).
Table 1: Description of the Sampling Stations
Sampling
stations
Description
1. Gagangiri (upstream): Origin of Patalganga River, background river water quality. This water comes from
Tata Hydro power station with no apparent human habitation in the stretch from the Tata Hydro power
station and Gagangiri Ashram.
2. Gagangiri (downstream): Washing and bathing activities at the Ashram were observed. The Ashram is
equipped with 37 toilets catering to the needs of 5000 regular visitors. During the peak period the number of
visitors increases to 100,000. The untreated sewage directly flows into the Patalganga River.
3. Chemical manufacturing industry upstream.
4. Chemical manufacturing industry downstream.
5. Burning Ghat : River water near the cremation ground mixes with the untreated municipal waste water from
west Khopoli. Khopoli does not have an operational sewage treatment plant. The mean flow rate 70~75
mld.
6. Hanuman Temple (backside water) : The river water was oily as seen from the steps side, further on in its
vicinity sewage water from the public toilets mixes with the river water and flows below the bridge between
the Hanuman temple and the Masjid.
7. Drain : After the Hanuman Temple. Domestic and public toilet wastewater is discharged untreated directly
into the river. The mean flow rate 30~35 mld.
8. Near Masjid : Beyond the drain.
9. Esamba Phata : The river receives water from industries on either side.
10. Savroli Phata: Impact of washing, bathing and tankers washing activities.
11. Kharsundi Bandhara : Reservoir
12. Kharsundi industrial area: The wastewater comes from various industries. The mean flow rate 40~45 mld.
13. Vayal (Raw water): The Vayal weir is made for arresting the river water. Intake point for drinking water
supply to Navi Mumbai and JNPT. The river water is taken in through a small channel into the pumping
station via the screens, pumping 120 MLD of raw river water to the Bhokarpada water treatment pant.
14. Vayal (treated water): Used for drinking purpose.
2.3. Statistical Analysis
Pearson Correlation Coefficient was used to determine
the relationships between observed water quality
characteristics. A Microsoft Excel add-in module
XLSTAT 4.3 was used to carry out the hierarchical
cluster analysis (HCA). The calculation of WQI was
made as per National Sanitation Foundation.
3. RESULTS AND DISCUSSIONS
3.1. Physico-chemical Parameters
Degradation of water quality negatively affects the
accessibility of water for humans and increasing
financial costs for human beings, and diminishing
species diversity and abundance of resident
communities. These changes in environmental quality
can be associated with changes in water quality
parameters (UN GEMS/Water Programme, 2006).
Therefore, assessment of the water samples for
pollution has been made by comparing assessed
values of all the physico-chemical parameters with the
corresponding standards prescribed for drinking water
by various organizations such as World Health
Organization (WHO) and the Bureau of Indian
Standards (BIS), as detailed in Table 2. Water
temperature is one of the most important physical
characteristics of aquatic systems. As water
temperature rises, the rate of photosynthesis increases,
thereby providing adequate amounts of nutrients
(FOEN 2011). The water temperature values were
found to be within the permissible limit of the WHO.
pH is important to quantify the health of a river
since the water is used by the public for drinking
purpose (Sharma and Kansal, 2011). The river water
exhibited a near neutral pH (7.0 to 7.5) and was well
within the acceptable range given by WHO and BIS
for drinking water. The conductivity apparently
increased at sampling stations 7 (1683 µS/cm) and 12
(1082 µS/cm) due to domestic and industrial
wastewaters inflow, respectively. However, this, too,
was well within the acceptable range given by BIS
and WHO for drinking water. The TDS content of
water samples collected at the selected stations ranged
between 22-1128 mg/L, which is well below the limit

Shrivastava et al.
Water Quality Management Plan for Patalganga River for Drinking Purpose and Human Health Safety
74
value of 500 mg/L (WHO 1984) acceptable for
potable use, except at stations 7 (1128 mg/L) and 12
(725 mg/L). In the absence of a suitable potable water
source, the permissible limits for TDS as per WHO
and BIS are 2000 mg/L and 2100 mg/L, respectively.
The steady increase in TDS and conductance indicates
that water is contaminated due to discharge of
domestic and industrial wastewaters.
Dissolved Oxygen (DO) measures the amount of
gaseous oxygen dissolved in an aqueous solution.
Oxygen gets into water by diffusion from the
surrounding air, by aeration and photosynthesis. As a
DO levels drop below 5.0 mg/L, aquatic life is put
under stress (Liu et al., 2009; Li and Bishop, 2004).
DO was much above the desired value (5 mg/L) as per
WHO and BIS guidelines for drinking water quality at
all the sampling stations due to significant turbulence
in the river waters. The highest and lowest DO values
were found from the sample stations 1 and 12,
respectively. The Biological oxygen demand (BOD) is
a measure of organic carbon loading in the water
system that exerts a high level of biological oxygen
demand to the system (Sullivan et al., 2010).
Generally, unpolluted waters typically have BOD
values of 2 mg/L or less, and those receiving
wastewaters may have values up to 10 mg/L or more,
while COD in unpolluted surface waters range from
20 mg/L or less to greater than 200 mg/L in waters
receiving effluents (Agbaire et al., 2009; Garg et al.,
2010; Utang and Akpan, 2012). If effluents with high
BOD levels are discharged into a river, it will
accelerate bacterial growth and consume the dissolved
oxygen in the river (Kulshrestha and Sharma, 2006;
Kumar and Chopra, 2012). Total eleven sampling
stations showed high BOD concentrations above the
permissible limit for drinking water (WHO 1998) with
the peaks at sampling stations 7 (65 mg/L) and 12 (50
mg/L). These are the areas where direct anthropogenic
influence and the discharge of untreated municipal
wastewater have been noticed. Unusually low DO and
high BOD values were observed at sampling stations
7 and 12. The COD concentrations were found to be
more than WHO permissible limit (10 mg/L) at all the
sampling stations with peaks being observed at
sampling stations 7 (122 mg/L) and 12 (76 mg/L)
(Figure 2). Direct discharge of untreated domestic and
industrial wastewater into the river was responsible
for the high organic pollution, and led to very high
BOD and COD values in the downstream sampling
stations.
The NO3-N concentration in surface water is
generally low, but can reach high levels from
agricultural runoff, or from contamination by human
or animal wastes (WHO 1998). NO3-N concentrations
were within the permissible limits at all the sampling
stations. However, NH4-N values were astronomical
when compared with the WHO standard at all the
sampling stations, except at sampling station 1 (0.08
mg/L). Generally, the high concentration of NH4-N
causes a problem with taste and odour of water apart
from toxicity to aquatic lives. Unusually high NH4-N
concentration was reported at sampling station 7 (5.41
mg/L) due to domestic and public toilet wastewater is
discharged untreated directly into the river water. The
high NH4-N concentration at sampling station 14
(drinking water) reflects deterioration of water
quality, which requires additional wastewater
treatment technology (Metcalf and Eddy 2003).
Moreover, drinking water containing more than 0.2
mg/L of ammonia drastically decreases the
disinfection efficiency. Symptoms of NH4-N
poisoning are restlessness, dullness, weakness, muscle
tremors profuse salivation, vocalization, lung edema,
tonic-clonic convulsion, and finally death by heart
failure (Markesbery et al., 1984; Camargo and
Alonso, 2006; Majumder et al., 2006; Ojosipe, 2007).
The high NO3-N with low amount of NH4-N enhanced
the self-purification activities of surface water, by
increasing the rate of nitrification-denitrification
transformation process in river water (Li and Bishop,
2004). The PO43- values reported were well within the
tolerable limits. PO43- is rarely found in high
concentrations in waters as it is actively taken up by
macrophytes and algae. However, high concentrations
of PO43- can show the presence of contamination and
are largely responsible for eutrophic conditions
(WHO, 1998).
Oil and grease in the aquatic environment may be
damaging in a variety of ways. Even at low
concentrations, oil and grease may be toxic to aquatic
life, reduce dissolved oxygen, and alter the usability
and aesthetics of a water body (Khan et al., 2006).
Additionally, oil and grease may interfere with
aerobic and anaerobic biological processes and lead to
decreased wastewater treatment efficiency. Recent
monitoring indicates that oil and grease concentrations
ranged from nil to 19.6 mg/L. Especially, sampling
stations 6 (19.6 mg/L) showed high oil and grease
concentrations compared with BIS standard due to
inflow of temple wastewaters.
E. coli is the traditional bio-indicator of sewage
pollution in aquatic ecosystems and determination
revels vital information regarding water quality
(Wright et al., 2004; Ram et al., 2008). Samples from
sample stations 2 to 13 showed presence of E. coli.
Hence, the data show that the river water is
completely unfit for drinking purposes unless given
proper treatment.
International Journal of Scientific Research in Environmental Sciences, 3(2), pp. 0071-0087, 2015
75

Shrivastava et al.
Water Quality Management Plan for Patalganga River for Drinking Purpose and Human Health Safety
76
Table 2: Physico-chemical and Microbial Characteristics of Patalganga River (all the values in mg/L except pH, temperature, conductivity and E. Coli)
Air Temp
(°C)
Water
Tem (°C) pH
Conductivity
(µS/cm) TDS SS DO BOD COD NO3-N NH4-N PO4
3-
Oil and
Grease
E
coli
WHO - 30-35 6.5-8.5 1800 500 - 5.0 6.0 10.0 45 0.10 - - *
BIS - - 6.5-8.5 - 500 - 5.0 2.0 - 45 - - 10.0
1 31.5 22.5 7.2 33 22 2.0 10.2 5.0 20 0.24 0.08 0.016 1.2 -
2 31.5 23.5 7.2 41 28 3.0 10.0 11.0 33 0.30 0.15 0.014 0.8 +
3 31.5 23.0 7.5 45 30 4.0 9.6 6.0 23 0.36 0.41 0.106 1.8 +
4 34.5 24.0 7.5 88 59 5.0 9.4 8.0 34 0.64 0.45 0.016 3.0 +
5 34.0 24.0 7.2 43 29 6.0 9.8 6.9 46 1.25 0.26 0.040 1.2 +
6 32.0 24.0 7.5 51 34 6.0 8.4 13.0 39 0.57 0.48 0.059 19.6 +
7 32.0 24.5 7.5 1683 1128 65.5 6.5 64.8 122 35.1 5.41 0.356 7.6 +
8 32.0 24.2 7.2 46 31 4.0 10.0 11.5 35 0.87 0.13 0.031 1.2 +
9 34.5 27.0 7.2 167 112 15.0 7.3 15.2 42 1.51 0.16 0.099 0.8 +
10 32.5 25.5 7.0 92 62 11.0 7.6 23.8 59 0.69 0.13 0.086 6.4 +
11 29.5 25.5 7.0 132 88 3.0 8.3 22.6 47 1.27 0.18 0.181 0.4 +
12 31.0 29.0 7.5 1082 725 9.0 5.2 49.6 76 17.3 0.68 0.254 2.4 +
13 31.5 27.3 7.0 107 72 3.0 9.8 19.5 57 2.62 0.42 0.018 0.5 +
14 29.0 25.5 7.0 95 64 1.0 8.9 3.4 10 0.32 0.16 0.016 0.0 -
+ : present; - : absent ; * : Must not be detectable in any 100 ml sample
Table 3: Metals Content in Patalganga River Water (all the values in mg/L)
As Cd Co Cr Cu Fe Mn Ni Pb Zn
BIS 0.05 0.01 - 0.050 0.050 0.30 0.10 0.020 0.050 5.00
WHO 0.01 0.003 0.04 0.200 2.000 0.30 0.10 0.020 0.015 3.00
1. ND ND ND 0.003 0.015 0.17 0.09 0.002 0.001 0.03
2. 1.24 ND ND 0.020 0.015 0.40 0.11 0.003 0.004 0.07
3. ND ND ND 0.008 0.010 0.10 0.05 0.003 0.001 0.06
4. ND ND ND 0.050 0.020 0.26 0.03 0.003 0.001 0.04
5. ND ND ND 0.004 0.010 0.23 0.003 0.002 0.001 0.03
6. 1.00 ND ND 0.008 0.020 0.44 0.18 0.004 0.005 0.08
7. ND ND ND 0.010 0.008 1.18 0.03 0.002 0.0005 0.07
8. 1.46 ND ND 0.005 0.006 0.17 0.03 0.003 0.005 0.06
9. ND ND ND 0.007 0.011 0.25 0.17 0.002 0.0002 0.04
10. ND ND ND 0.003 0.020 0.30 0.02 0.003 0.003 0.06
11. ND ND ND 0.0005 0.010 0.26 0.19 0.020 0.001 0.14
12. 3.57 ND ND 0.001 0.020 0.22 0.03 0.003 0.007 0.09
13. ND ND ND 0.008 0.020 0.16 0.03 0.002 ND 0.06
14. ND ND ND 0.003 0.010 0.20 0.02 0.001 ND 0.02

International Journal of Scientific Research in Environmental Sciences, 3(2), pp. 0071-0087, 2015
77
Fig. 2: Concentrations of (A) Dissolved Oxygen; (B) Biological Oxygen Demand; (C) Chemical Oxygen Demand at 14
Different Sampling Stations

Shrivastava et al.
Water Quality Management Plan for Patalganga River for Drinking Purpose and Human Health Safety
78
3.2. Metals Analysis
Metals enter the river from a variety of sources, which
can be either natural or anthropogenic (Bem et al.,
2003; Wong et al., 2003; Adaikpoh et al., 2005; Akoto
et al., 2008). Usually, in unaffected environments, the
concentrations of most of the metals are very low and
are mostly derived from the mineralogy and
weathering of rocks (Karbassi et al., 2008). Rivers in
urban areas have also been associated with water
quality problems due to the practice of discharge of
untreated domestic and industrial waste into the water
bodies, which lead to an increase in the level of metal
concentrations in the river water (Rim-Rekeh et al.,
2006; Iqbal et al., 2006; Khadse et al., 2008; Juang et
al., 2009; Jumbe et al., 2009; Venugopal et al., 2009;
Sekabira et al., 2010). Metals are non-degradable and
can accumulate in the human body, causing damage to
the nervous system and internal organs (Lee et al.,
2007; Lohani et al., 2008).
The concentration trend of different metals in the
river water and the maximum values for metals in
water have been prescribed by the WHO and BIS, and
shown in Table 3. The As concentrations were
observed high compared with WHO and BIS
standards at sampling stations 2, 6, 8 and 12 due to
inflow of domestic and industrial wastewaters,
respectively. The adverse effects of chronic exposure
to drinking arsenic water on human body are
cardiovascular disease, neurological effects, chronic
lung disease, reproductive disease, adverse renal
affects, developmental abnormalities, hematological
disorders, diabetes mellitus and cancers of skin, lung,
liver, kidney and bladder. In dose-response manner;
the children who use the drinking water with high
arsenic concentration (> 0.05 mg/L) execute lower
performance than those children, using drinking water
with low arsenic (<0.005 mg/L) (Wasserman et al.,
2004; WHO, 2006; Rakib and Bhuiyan 2014). The Cd
and Co concentrations were reported nil at all the
sampling station. The concentrations of Cr, Cu, Ni, Pb
and Zn in the river water were quite low and found
within the WHO and BIS permissible limits. The
concentrations of Fe and Mn were found highest at
sampling station 7 (1.18 mg/L) and 11 (0.19 mg/L),
respectively. The high Fe concentrations could be
attributed to anthropogenic activities and land runoff.
The high level (> 200 mg/L) of Fe can cause
hemochromatosis with symptoms such as chronic
fatigue, arthritis, heart disease, cirrhosis, thyroid
disease. The Fe concentration in water causes
conjunctivitis, choroiditis, and retinitis if it contacts
and remains in the tissues (Huang, 2003; Kayode et
al., 2006). The presence of high concentration of Fe
may also increase the hazard of pathogenic organisms;
since most of them need Fe for their growth (Tiwana
et al., 2005; Anonymous, 2008). Industrial activities
were predominantly responsible for the high
concentrations of Mn in river waters. Mn
concentration over 0.1 mg/L lead to adverse impact on
water coloration, metallic taste, odor problem,
turbidity, biofouling and corrosion, and staining of
laundry and plumbing fixture. The elevated amounts
of Mn may cause apathy, irritability, headache,
insomnia as well as gastrointestinal irritation and
respiratory disease (Apostoli et al., 2000; Roccaro et
al., 2007; Rygel, 2006; Menezes-Filho et al., 2011). In
the worst form, it may lead to a permanent
neurological disorder. However, exposure to Mn from
drinking water is normally substantially lower than
intake from food (USEPA, 2004). Although, in
general, the relative high metals concentrations were
observed at mid-stream as compared to upstream and
downstream, it can be attributed to inflow of industrial
and household wastewater in river stream.
The region has many small-scale as well as large
industrial units located close to the Patalganga River
that use toxic metals for various products and
discharge their effluents directly or indirectly into the
river. Apart from it, its tributaries also pass through
some of the most industrialised belts and carry
effluents that ultimately drain into the Patalganga
River, increasing the load of toxic metals. The
samples from various industrial units contained few
metals above permissible limits of WHO and BIS for
drinking water while some metals such as Cd and Co
were totally absent. The Pb was found above the
permissible limit only in one industrial effluent (a
perfume manufacturing industry). Drinking water
picks up Pb pollution from several sources such as
household paint, vehicle exhausts and industrial
wastes. Pb builds up in the human body over many
years and can damage the brain, red blood cells and
kidneys. It is an accumulative metabolic poison that
affects behavior, as well as the hematopoietic,
vascular, nervous, renal, and reproductive systems of
the human body (USEPA, 2005; Moore and
Ramamoorthy, 1984; Nadeem-ul-Haq et al., 2009;
Singare et al., 2012).
4. DATA ANALYSES
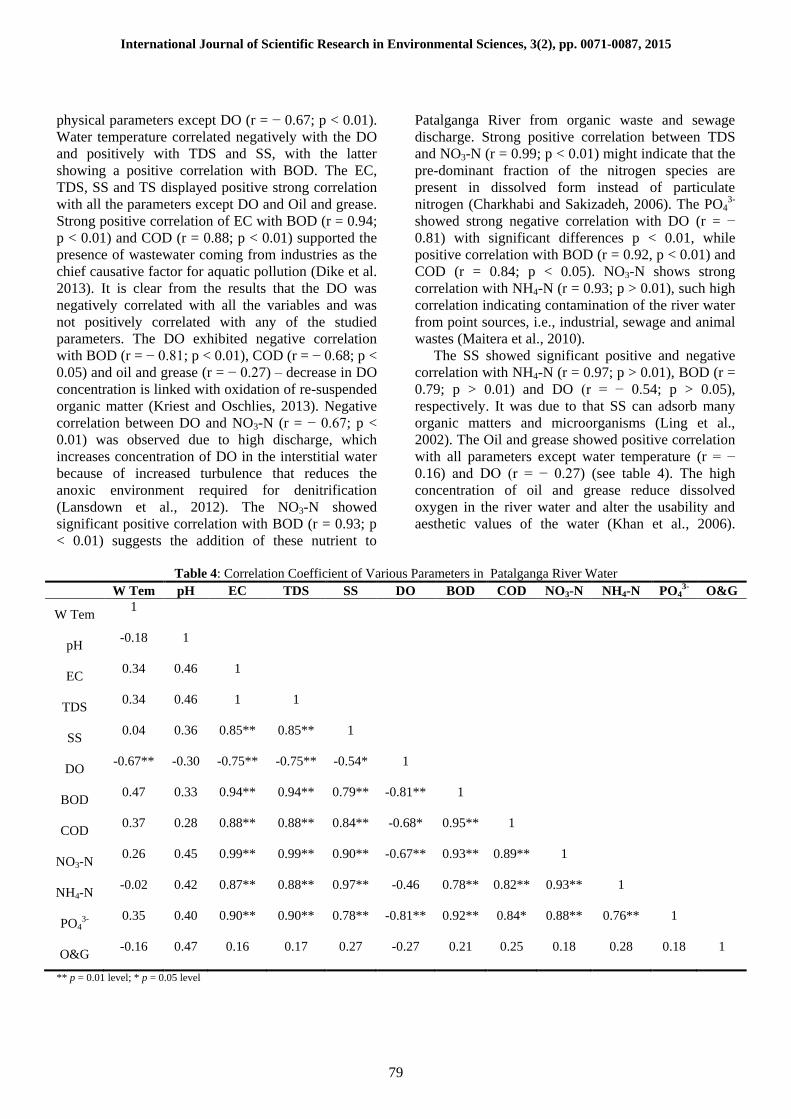
4.1. Correlation Coefficient
In the present study, correlation coefficient was used
to identify the highly correlated water quality
parameters. This can help in selecting the treatments
to minimize pollutants in river water (Joarder et al.,
2008). Simple correlation coefficient (r) computed
between physicochemical properties in Patalganga
River is presented in Table 3. There was no significant
correlation between water temperature and the other
International Journal of Scientific Research in Environmental Sciences, 3(2), pp. 0071-0087, 2015
79
physical parameters except DO (r = − 0.67; p < 0.01).
Water temperature correlated negatively with the DO
and positively with TDS and SS, with the latter
showing a positive correlation with BOD. The EC,
TDS, SS and TS displayed positive strong correlation
with all the parameters except DO and Oil and grease.
Strong positive correlation of EC with BOD (r = 0.94;
p < 0.01) and COD (r = 0.88; p < 0.01) supported the
presence of wastewater coming from industries as the
chief causative factor for aquatic pollution (Dike et al.
2013). It is clear from the results that the DO was
negatively correlated with all the variables and was
not positively correlated with any of the studied
parameters. The DO exhibited negative correlation
with BOD (r = − 0.81; p < 0.01), COD (r = − 0.68; p <
0.05) and oil and grease (r = − 0.27) – decrease in DO
concentration is linked with oxidation of re-suspended
organic matter (Kriest and Oschlies, 2013). Negative
correlation between DO and NO3-N (r = − 0.67; p <
0.01) was observed due to high discharge, which
increases concentration of DO in the interstitial water
because of increased turbulence that reduces the
anoxic environment required for denitrification
(Lansdown et al., 2012). The NO3-N showed
significant positive correlation with BOD (r = 0.93; p
< 0.01) suggests the addition of these nutrient to
Patalganga River from organic waste and sewage
discharge. Strong positive correlation between TDS
and NO3-N (r = 0.99; p < 0.01) might indicate that the
pre-dominant fraction of the nitrogen species are
present in dissolved form instead of particulate
nitrogen (Charkhabi and Sakizadeh, 2006). The PO43-
showed strong negative correlation with DO (r = −
0.81) with significant differences p < 0.01, while
positive correlation with BOD (r = 0.92, p < 0.01) and
COD (r = 0.84; p < 0.05). NO3-N shows strong
correlation with NH4-N (r = 0.93; p > 0.01), such high
correlation indicating contamination of the river water
from point sources, i.e., industrial, sewage and animal
wastes (Maitera et al., 2010).
The SS showed significant positive and negative
correlation with NH4-N (r = 0.97; p > 0.01), BOD (r =
0.79; p > 0.01) and DO (r = − 0.54; p > 0.05),
respectively. It was due to that SS can adsorb many
organic matters and microorganisms (Ling et al.,
2002). The Oil and grease showed positive correlation
with all parameters except water temperature (r = −
0.16) and DO (r = − 0.27) (see table 4). The high
concentration of oil and grease reduce dissolved
oxygen in the river water and alter the usability and
aesthetic values of the water (Khan et al., 2006).
Table 4: Correlation Coefficient of Various Parameters in Patalganga River Water
W Tem pH EC TDS SS DO BOD COD NO3-N NH4-N PO43-
O&G
W Tem 1
pH -0.18 1
EC 0.34 0.46 1
TDS 0.34 0.46 1 1
SS 0.04 0.36 0.85** 0.85** 1
DO -0.67** -0.30 -0.75** -0.75** -0.54* 1
BOD 0.47 0.33 0.94** 0.94** 0.79** -0.81** 1
COD 0.37 0.28 0.88** 0.88** 0.84** -0.68* 0.95** 1
NO3-N 0.26 0.45 0.99** 0.99** 0.90** -0.67** 0.93** 0.89** 1
NH4-N -0.02 0.42 0.87** 0.88** 0.97** -0.46 0.78** 0.82** 0.93** 1
PO43-
0.35 0.40 0.90** 0.90** 0.78** -0.81** 0.92** 0.84* 0.88** 0.76** 1
O&G -0.16 0.47 0.16 0.17 0.27 -0.27 0.21 0.25 0.18 0.28 0.18 1
** p = 0.01 level; * p = 0.05 level

Shrivastava et al.
Water Quality Management Plan for Patalganga River for Drinking Purpose and Human Health Safety
80
4.2. Cluster Analysis
Hierarchical cluster analysis (HCA) was used to
analyze the water quality data for spatial and temporal
differences. The HCA was applied to a subgroup of
the dataset to evaluate their usefulness to classify the
river water samples, and to identify suitability for
drinking water purpose. Guler et al. (2002) described
hierarchical cluster analysis as “an efficient means to
recognize groups of samples that have similar
chemical and physical characteristics”. The distance
cluster represents the degree of association between
elements. The lower the value on the distance cluster,
the more significant is the association. HCA is the
most common approach, which provides intuitive
similarity relationships between any one sample and
the entire data set, and is generally illustrated by a
dendrogram (McKenna, 2003). To classify the water
quality in sampling stations and to determine the
source of pollution, HCA with Ward method,
Euclidean distance based on the standardized mean of
the physico-chemical parameters were used.
According to the thirteen parameters, HCA
categorized fourteen sampling stations into three
distinctive clusters described based on pollution
magnitude as clean, slightly polluted, and polluted.
Examination of Figure 3 shows the identification of
three major branches in the dendrogram, labeled A, B
and C. These were identified as major cluster groups
because the linkage distance at which they combine
with each other is relatively large, indicating that there
are relatively large Euclidean distances between the
samples. Group A consists of 12 sampling stations
while groups B and C are represented by sampling
stations 7 and 12, respectively. The group A was
further divided into two subgroups A‟ and A‟‟. The
subgroup A' mainly represented upstream area and
low nutrient concentrations compared to A" while A"
represented mainly industrial wastewaters. The
upstream area of rivers is less influenced by human
activities. Therefore, the condition of river water was
slightly clean and optimized. The group B (sampling
station 7) was influenced by the inflow of domestic
and public toilets wastewaters. Finally, the group
C (sampling station 12) could be influenced by the
extensive inflow of industrial wastewaters.
Eventually, the result denotes that HCA is an effective
technique to assess and classify river water in the
Patalganga River case study. At the same time, it is
significant to a large extent to authorities and decision
makers to know the latest information on the river
which guide them in the optimal strategy
establishment in which sampling stations can be
reduced.
Table 5: Classification of Water Quality Index
Range Quality
90-100 Excellent
70-90 Good
50-70 Medium
25-50 Bad
0-25 Very bad
4.3. Water Quality Index
Based on the WQI an assessment was made whether
the river water was acceptable for domestic use and
drinking purpose. For this reason, this analysis is
extremely necessary. Also, people living in these
areas can determine from which part of the river they
can draw the best quality water (Adak et al., 2001).
Water quality has been assessed using Water Quality
Index (WQI) developed by the U.S. National
Sanitation Foundation Water Quality Index (NSF
WQI) in 1970. This index has been widely tested on
field and applied to data from a number of different
geographical areas all over the world in order to
calculate Water Quality Index (WQI) of various water
bodies. Critical pollution parameters were considered
(Sharifinia et al., 2013) for computing WQI.
Expression for NSF WQI is given by
p
NSF WQI = ∑ Wi Ii
i=1
Where Ii is the sub-index for ith water quality
parameters; Wi is the weight (in terms of importance)
associated with ith water quality parameter; p is the
number of water quality parameters.
The water quality index uses a scale from 0 to 100
to rate the quality of the water, with 100 being the
highest possible score. The classification criteria
standards based on NSF WQI are given in Table 5.
The computed overall WQI was 100 and can,
therefore, be categorized into five types “excellent” to
“very bad”. The results obtained from this study
revealed that WQI of the Patalganga River waters falls
under the range of 43 to 78 (Figure 4). The study area
WQI assessment showed that water quality of river
waters falls under “Good” category with the majority
of the sampling stations having water quality with
WQI in the range of 70 to 83 and need to be treated
before its use. Sampling stations 7 and 12 showed
“Bad” and “Medium” category, respectively, and were
totally unfit for drinking purpose.

International Journal of Scientific Research in Environmental Sciences, 3(2), pp. 0071-0087, 2015
81
Fig. 3: Dendrogram from Hierarchical Cluster Analysis of Sampling Stations of Patalganga River
5. MANAGEMENT PLAN FOR WATER
QUALITY IMPROVEMENT
Socio economic development is clearly linked to
access to safe drinking-water. Environmental,
economic and social policies associated with waste
management are mostly inadequate and insufficient,
resulting in increasing deterioration of the
environment (Mara, 2003; Goldar and Banerjee, 2004;
Hutton et al., 2007). The poor management of river
water has resulted in a major shift in the quantity and
quality of water and altered ecosystems, limiting the
benefits available for human that depend on them.
Improving the water quality in the Patalganga River is
possible, but requires interventions in both domestic-
municipal and industrial sectors. River pollution can
be controlled by considering multiple options such as:
(a) Installation of STPs and using the treated
wastewater for irrigation and ground water recharge -
as the flow rate of the river is high ex-situ water
purification by anchored PhytoRid will be useful
(Kumar et al., 2010). The high NH4-N concentration
in drinking water requires additional wastewater
treatment technology such as biological nitrification
or physicochemical processes (such as ion exchange,
membrane filtration, air stripping and ozonation).

Shrivastava et al.
Water Quality Management Plan for Patalganga River for Drinking Purpose and Human Health Safety
82
(b) Waste segregation at source, localized
recycling, localized/community level
vermicomposting - in case of temple wastewater
management awareness creation, and employment of
small temporary plastic nets for solid waste removal
are important steps.
(c) Regular monitoring for checking and improving
the management practice.
(d) Public awareness and participation through
media and organizing public programs for spreading
the message effectively is essential.
(e) Low cost sanitation complexes to prevent open
defecation.
(f) A separate truck washing terminal and
treatment of wastewater produced. Use of oil spill
control methods.
(g) Water quality laws and regulations need to be
enforced effectively. Creation of no development zone
about 500 m on the either side of the river.
6. CONCLUSION
Based on the cluster analysis, and on comparing the
water quality parameters with national and
international standards of parameters from 14
sampling stations, the sampling stations were divided
into three major groups to reduce the number of
sampling sites to ease future monitoring exercises.
Three groups and one subgroup were generated from
HCA method. Subgroup A‟ reflects the low physico-
chemical, microbial and metals concentration.
Subgroup A‟‟ is mainly affected by industrial
wastewaters. Group B is mainly influenced by
domestic and public wastewaters. Group C reflects the
characteristic of industrial wastewater. Based on WQI,
it could be inferred that water quality at these above
mentioned sampling stations are “Good”, “Medium”
and “Bad” category and can only be used for drinking
after conventional treatment and disinfection. The
results suggest that anthropogenic activities have had
significant effects on water quality in the river.
From this classification, it is possible to plan for
optimum sampling strategies that can reduce the
number of sampling points during assessment and the
affiliated recurring cost during environmental
monitoring. It was observed that the main causes of
deterioration in water quality were high interference
of anthropogenic activities, lack of proper sanitation,
and industrial and domestic wastewater inflow. This
work may assist the decision makers in the pollution
control of the Patalganga River where the WQI and
clustering process gives an effective overview about
the locations where intensified monitoring activity and
control measures are required. A specific management
plan involving all stakeholders will help improve and
maintain the river water quality.
REFERENCES
Adaikpoh EO, Nwajei GE, Ogala JE (2005). Heavy
metals concentrations in coal and sediments
from river Ekulu in Enugu, Coal City of
Nigeria. Journal of Applied Science and
Environmental Management, 9 (3): 5-8.
Adak MDG, Purohit KM, Datta J ( 2001).
Assessment of drinking water quality of river
Brahmani. Indian Journal of Environmental
Protection, 8(3): 285-291.
Adekunle AS, Eniola ITK (2008). Impact of Industrial
Effluents on Quality of Segment of Asia River
within an Industrial Estate in Ilorin, Nigeria.
New York Science Journal, 1(1): 17-21.
Adeyemi OT (2004). Oil Exploration and
Environmental Degradation: The Nigerian
Experience. Environmental Informatic
Archives, 2: 389-93.
Agbaire PO, Oyibo IP (2009). Seasonal variation of
some physico-chemical properties of borehole
water in Abraka, Nigeria. African Journal of
Pure and Applied Chemistry, 3(6): 116-118.
Akoto OT, Bruce N, Darko G (2008). Metals
pollution profiles in streams serving the Owabi
reservoir. African Journal of Environmental
Science and Technology, 2(11): 354-359.
Anhar S, Yusoff MK, Mok TP (1988). Water quality
profile of Sg. Langat. Pertanika, 10(2): 225-
231.
Anonymous (2008). Assessment of surface water for
drinking quality. Directorate of Land
Reclamation Punjab, Irrigation and Power
Department, Canal Bank, Mughalpura, Lahore,
Pakistan.
APHA, AWWA, WEF (1995). Standard methods for
the examination of water and wastewater. 19th
edition. Volume I. Washington, 1368 pp.
Apostoli P, Lucchini R, Alessi L (2000). Are current
biomarkers suitable for the assessment of
manganese exposure in individual workers?
American Journal of Industrial Medicine,
37:283 - 90.
Bajpayee S, Das R, Ruj B, Adhikari K, Chatterjee PK
(2012). Assessment by multivariate statistical
analysis of groundwater geochemical data of
Bankura, India. International Journal of
Environmental Science, 3(2): 870- 80.
Bem H, Gallorini M, Rizzio E, Krzemin SM (2003).
Comparative studies on the concentrations of
some elements in the urban air particulate
matter in Lodz City of Poland and in Milan,
Italy. Environment International, 29 (4): 423-
428.
BIS (1991) Specification for drinking water IS:
10500: 19 Bureau of Indian Standards, New
International Journal of Scientific Research in Environmental Sciences, 3(2), pp. 0071-0087, 2015
83
Delhi (1983). Indian Standard Specification for
Drinking Water, ISI, New Delhi, IS: 10500
(1991).
Brown RM, McClelland NI, Deininger R A, Tozer R
G (1970). A water quality index: Do we dare?.
Water and Sewage Works, 117: 339-343.
Camargo JA, Alonso A (2006). Ecological and
toxicological effects of inorganic nitrogen
pollution in aquatic ecosystems: a global
assessment. Environment International, 32:
831-849.
Charkhabi AH, Sakizadeh M (2006) “Assessment of
spatial variation of water quality parameters in
most polluted branch of the Anzali wetland,
Northern Iran”. Polish Journal of
Environmental Studies, 15: 395-403.
Chatterjee R, Mehra M, Banerjee S (2000).
Environmental Security in South Asia. TERI
Globe. (Pp 3-7) Newsletter of the Tata Energy
and Resources Institute. Washington D.C.
CPCB (2007a). Evaluation of operation and
maintenance of sewage treatment plants in
India. Central pollution control board, India,
2007.
Dike NI, Ezealor AU, Oniye SJ, Ajibola VO (2013).
Pollution studies of river jakara in kano nigeria,
using selected physico- chemical parameters.
International Journal of Research in
Environmental Science and Technology, 3(4):
122-129.
Dixit U, Shanker R (2009). Detection of water-borne
pathogens: culture plate to genomics. Indian
Journal of Science and Technology, 2:11.
Ensink JHJ, Christopher AS, Simon B, Cairncross S
(2010). Sewage disposal in the Musi-River,
India: water quality remediation through
irrigation infrastructure. Irrigation and Drainage
Systems, 24 (1-2): 65-77.
Federal Office for the Environment (FOEN) (2011).
Indicator Water temperature of surface waters,
Department of the Environment, Transport,
Energy and Communications.
Fewtrell L et al. (2007). Water, sanitation and
hygiene: quantifying the health impact at
national and local levels in countries with
incomplete water supply and sanitation
coverage. Geneva, World Health Organization.
Garg RK, Rao RJ, Uchchariya D, Shukla G, Saksena,
DN (2010). Seasonal variations in water quality
and major threats. African Journal of
Environmental Science and Technology, 4(2):
61- 76.
Giri S, Singh AK (2014). Risk assessment, statistical
source identification and seasonal fluctuation of
dissolved metals in the Subarnarekha River,
India. Journal of Hazardous Materials, 265:
305-314.
Goldar B, Banerjee N (2004). Impact of informal
regulation of pollution on water quality in rivers
in India. Journal of Environmental
Management, 73: 117-130.
Guler C, Thyne GD, McCray JE, Turner KA (2002).
Evaluation of graphical and multivariate
statistical methods for classification of water
chemistry data. Hydrogeology Journal, 10: 455-
474.
Huang X (2003). Iron overload and its association
with cancer risk in humans: evidence for iron as
a carcinogenic metal. Mutation Research, 533:
153-171.
Hutton G, Haller L, Bartram J (2007). Economic and
health effects of increasing coverage of low
cost household drinking water supply and
sanitation interventions Geneva and New York:
WHO/United Nations Development
Programme.
Inter Press Service (IPS) (1999). Most Rivers in the
World are polluted Wastington D.C Inter-press
Service Wire Service. pp. 38-41.
Iqbal F, N Raza, M Ali, Athar M (2006).
Contamination of Kallar Kahar lake by
inorganic elements and metals and their
temporal variations. Journal of Applied Science
and Environmental Management, 10: 95-98.
Joarder MAM, Raihan F, Alam JB, Hasanuzzaman S
(2008). Regression Analysis of Ground Water
Quality Data of Sunamganj District,
Bangladesh. International Journal of
Environmental Research, 2(3): 291-296.
Juang DF, Lee CH, Hsueh SC (2009). Chlorinated
volatile organic compounds found near the
water surface of heavily polluted rivers.
International Journal of Environmental Science
and Technology, 6(4): 545-556.
Jumbe AS, Nandini N (2009). Metals analysis and
sediment quality values in urban lakes.
American Journal of Environmental Science, 5:
678-687.
Karbassi AR, Monavari SM, Nabi Bidhendi GR,
Nouri J, Nematpour K (2008). Metal pollution
assessment of sediment and water in the Shur
River. Environmental Monitoring and
Assessment, 147 (1-3): 107-116.
Kayode AP, Linnemann AR, Hounhouigan, JD, Nout,
MJR, Boekel MA (2006). Genetic and
environmental impact on iron, zinc, and phytate
in food sorghum grown in Benin. Journal of
Agricultural and Food Chemistry, 54: 256-262.
Khadse GK, Patni PM, Kelkar PS, Devotta S
(2008).Qualitative evaluation of Kanhan river
and its tributaries flowing over central Indian

Shrivastava et al.
Water Quality Management Plan for Patalganga River for Drinking Purpose and Human Health Safety
84
plateau. Environmental Monitoring and
Assessment, 147(1-3): 83-92.
Khan S, Lau M, Kayhanian, Stenstrom MK (2006).
Oil and grease measurement in highway runoff-
sampling time and event mean concentration.
Journal of Environmental Engineering, 132:
415-422.
Kriest I, Oschlies A (2013). Swept under the carpet:
organic matter burial decreases global ocean
biogeochemical model sensitivity to
remineralization length scale. Biogeosciences,
10: 8401-8422.
Kulshrestha H, Sharma S (2006). Impact of mass
bathing during Ardhkumbh on water quality
status of River Ganga. Journal of
Environmental Biology, 27(2): 437-440.
Kumar et al. (2010) Treatment Process of Wastewater
using PhytoRid Technology India, Office (IPO)
Pub. No.: 241523 Publication Date:
09/07/2010.
Kumar V, Chopra AK (2012). Monitoring of physico-
chemical and microbial characteristics of
municipal wastewater at treatment plant,
Haridwar city (Uttarakhand) India. Journal of
Environmental Science and Technology, 5(2):
109-118.
Lansdown K, Trimmer M, Heppell CM, Sgouridis F,
Ullah S, Heathwaite AL, Binley A, Zhang H
(2012). Characterization of the key pathways of
dissimilatory nitrate reduction and their
response to complex organic substrates in
hyporheic sediments. Limnology and
Oceanography, 57(2): 387-400.
Lee CL, Li XD, Zhang G, Li J, Ding AJ, Wang T
(2007). Metals and Pb isotopic composition of
aerosols in urban and suburban areas of Hong
Kong and Guangzhou, South China Evidence of
the long-range transport of air contaminants.
Environnemental Pollution, 41(2): 432-447.
Li BK, Bishop PL (2004). Oxidation-reduction
potential changes in aeration tanks and
microprofiles of activated sludge floc in
medium- and low-strength wastewaters. Water
Environment Research, 76(5): 394–403.
Ling, T, Achberger E, Drapcho C (2002). Quantifying
adsorption of an indicator bacteria in a soil-
water system. Transactions of the American
Society of Agricultural Engineers, 45: 669-674.
Liu J, Dong HW, Tang XL (2009). Genotoxicity of
water from the Songhua River, China, in 1994–
1995 and 2002–2003: potential risks for human
health. Environmental Pollution, 157(2): 357-
364.
Lohani MB, Singh S, Rupainwar DC, Dhar DN
(2008). Seasonal variations of heavy metal
contamination in River Gomti of Lucknow city
region. Environmental Monitoring and
Assessment, 147 (1-3): 253-263.
Maitera ON, Ogugbuaja VO, Barminas JT (2010). An
assessment of the organic pollution indicator
levels of River Benue in Adamawa State,
Nigeria. Journal of Environmental Chemistry
and Ecotoxicology, 2(7): 110-116.
Majumder S, Gupta S, Saha RN, Datta JK, Mondal N
(2006) Eutrophication potential of municipal
sewage of Burdwan Town, West Bengal, India.
Pollution Research, 25(2): 299-302.
Mara DD (2003). Water, sanitation and hygiene for
the health of developing nations. Public Health,
117: 452-456.
Markesbery WR, Ehmann WD, Alaudin M, Hossain
TIM (1984). Brain trace element concentrations
in aging. Neurobiology of Aging, 5: 19-28.
May AM, Mutasem E, Mark DS (2006). Factors
influencing development of management
strategies for the Abou Ali River in Lebanon.
Science of the Total Environment, 362: 15-30.
McKenna J (2003). An enhanced cluster analysis
program with bootstrap significance testing for
ecological community analysis. Environmental
Modelling and Software, 18(3): 205-220.
Menezes-Filho JA, Novaes Cde O, Moreira JC,
Sarcinelli, PN, Mergler D (2011). Elevated
manganese and cognitive performance in
school-aged children and their mothers.
Environmental Research, 111(1): 156-163.
Metcalf and Eddy Inc. Wastewater Engineering:
Treatment and Reuse. 4th ed. McGraw-Hill Inc;
New York: 2003.
Moho KY (1991). Hydrological research and
education for a better agricultural production in
Malaysia. In Proceedings of Tsukuba Asian
Seminar on Agricultural and Environmental
Education p. 51-57.
Moho KY, Azizi M, Wan NAS, Moho NH (1997a).
River water quality classification of selected
catchments in Langkawi Island, Malaysia using
Harkin's Index. In Proceedings of the 8th
International Conference of Rainwater
Catchment Systems, ed. B. Aminipouri and J.
Ghoddousi, pp. 622- 629.
Moho KY, Wan NAS, Azizi M, Ramozani A, Ann A
(1997b). Water quality profile of Sg.
Terengganu and Sarawak using DOE-WQI.
Journal of Ensearch, 10(1): 47-53.
Moore JW, Ramamoorthy S (1984). Metals in Natural
Waters. Applied Monitoring and Impact
Assessment, pp.28–246, Springer-Verlag, New
York.
Nadeem-ul-Haq, Arain MA, Haque Z, Badar N.,
Mughal N. (2009). Drinking water
contamination by chromium and lead in
International Journal of Scientific Research in Environmental Sciences, 3(2), pp. 0071-0087, 2015
85
industrial lands of Karachi. Journal of Pakistan
Medical Association, 59: 270-4.
Nikoo MR, et al. (2011). A probabilistic water quality
index for river water quality assessment: a case
study. Environmental Monitoring and
Assessment, 181(1-4): 465-478.
Ojosipe BA (2007). Water and waste water analysis.
Proceedings of the Mandatory Training
Workshop on water. June, 2007 Institute of
Public Analysis of Nigeria (IPAN).
Onda K, LoBuglio J, Bartram J (2012). Global access
to safe water: accounting for water quality and
the resulting impact on MDG progress.
International Journal of Environmental
Research and Public Health, 9(3):880-94.
Ott WR (1978). Water Quality Indices: A survey of
Indices Used in the United States. US
Environmental Protection Agency. Washington
DC, EPA-600/4-78-005, 1-138.
Ouyang Y, Nkedi-Kizza P, Wu Q T, Shinde D, Huang
CH (2006). Assessment of seasonal variations
in surface water quality. Water Research, 40
(20): 3800-3810.
Payen G (2011). Worldwide needs for safe drinking
water are underestimated: billions of people are
impacted, originally published as: „Le Droit à
l‟eau potable et à l‟assainissement, Sa mise en
œuvre en Europe‟, Académie de l‟Eau, Smets et
al., 2011:45–63.
Pesce SF, Wunderlin DA (2000). Use of water quality
indices to verify the impact of Córdoba City
(Argentina) on Suquía River. Water Research,
34 (11):2915-2926.
Prakirake C, Chaiprasert P, Tripetchkul S (2009).
Development of Specific Water Quality Index
For Water Quality Supply In Thailand.
Songklanakarian. Journal of Science and
Technology, 31(1): 91-104.
Rai AK, Biswajit P, Nawal K (2012). A study of the
sewage disposal on water quality of Harmu
River in Ranchi city Jharkhand, India.
International Journal of plan, animal and
environmental science, 2 (1): 102-106.
Rakib MA, Bhuiyan MAH (2014) Arsenic
Contamination: Food Toxicity and Local
Perception. International Journal of Scientific
Research in Environmental Sciences, 2(1): 1-7.
Ram S, Vajpayee P, Shanker R (2008). Contamination
of potable water distribution systems by multi
antimicrobial-resistant enterohemorrhagic
Escherichia coli. Environmental Health
Perspectives, 116 (4): 448-452.
Rim-Rukeh A, Ikhifa OG, Okokoyo AP (2006).
Effects of agricultural activities on the water
quality of Orogodo River, Agbor Nigeria.
Journal of Applied Sciences Research, 2(5):
256-259.
Roccaro P, Barone C, Mancini G, Vagliasindi FGA
(2007). Removal of manganese from water
supplies intended for human consumption: a
case study. Desalination, 210: 205-214.
Rygel AC (2006). Manganese in drinking water
distribution systems. Thesis of Doctor of
Philosophy. Department of Civil and Resource
Engineering. Dalhousie University.
Sangodoyin AY (1991). Groundwater and Surface
Water Pollution by Open Refuse Dump in
Ibadan, Nigeria. Journal of Discovery and
Innovations, 3 (1): 24-31.
Scottish Development Department (1975). Towards
cleaner water. Edinburgh: HMSO, Report of a
River Pollution Survey of Scotland.
Sekabira K, Oryem Origa H, Basamba TA, Mutumba
G, Kakudidi E (2010). Assessment of heavy
metal pollution in the urban stream sediments
and its tributaries. International Journal of
Environmental Science and Technology, 7 (3):
435-446.
Sharifinia M, Zohreh R, Javid I, Abbas M, Tahsin R
(2013). Water quality assessment of the Zarivar
Lake using physico-chemical parameters and
NSF- WQI indicator, Kurdistan Province-Iran
International. Journal of Advanced Biological
and Biomedical Research, 1(3): 302-312.
Sharma D, Kansal A (2009). Water quality analysis of
River Yamuna using water quality index in the
national capital territory, India (2000–2009).
Applied Water Science, 1:147-157.
Shrestha S, Kazama F (2007). Assessment of surface
water quality using multivariate statistical
techniques: A case study of the Fuji River
basin, Japan. Environmental Modelling and
Software, 22 (4): 464-475.
Singare PU, Mishra RM, Trivedi MP (2012). Heavy
Metal Pollution in Mithi River of Mumbai.
Frontiers in Science, 2 (3): 28-36.
Singh LB (2007). River Pollution. 1st Edn., APH
Publishing, New Delhi, ISBN-10: 8131300854,
pp. 192.
Sullivan AB,Snyder DM, Rounds SA ( 2010).
Controls on biochemical oxygen demand in the
upper klamath river, oregon. Chemical
Geology, 269(1-2): 12-21.
Taner MU, Ustun B, Erdinçler A (2011). A simple
tool for the assessment of water quality in
polluted lagoon systems: A case study for
Küçükçekmece Lagoon, Turkey". Ecological
Indicators, 11(2): 749-756.
Tiwana NS, Jerath N, Singh G, Ravleen M (2005).
Heavy metal pollution in Punjab rivers, in
Newsletter Environmental Information System
Shrivastava et al.
Water Quality Management Plan for Patalganga River for Drinking Purpose and Human Health Safety
86
(ENVIS).3(1):3–7, Punjab State Council for
Science and Technology, India.
Udoh RK (1987). Geographical Regions of Nigeria,
Ibadan, Nigeria: Heinemann Educational Books
(Nigeria) Ltd., Ibadan, pp. 22-27.
UNEP GEMS/Water Programme (2006). Water
Quality for Ecosystem and Human Health.
UNEP GEMS/Water, Burlington, Ontario.
USEPA (2004). Drinking water health advisory for
manganese. United States Environmental
Protection Agency, Health and Ecological
Criteria Division, Washington, DC 20460.
USEPA (2005). United States Environmental
Protection Agency, National Primary Drinking
Water Regulations.
Utang PB, Akpan HE (2012). Water quality
impediments to sustainable aquaculture
development along selected segments of the
New Calabar River, Niger Delta, Nigeria.
Research Journal of Environmental and Earth
Sciences, 4 (1): 34-40.
Venugopal T, Giridharan L, Jayaprakash M (2009b).
Characterization and risk assessment studies of
bed sediments of River Adyar-An application
of speciation study. International Journal of
Environmental Research, 3 (4): 581-598.
Verghese GK, Shah IK, Mudliar SL, Babu JA (2011).
Integrated source water protection plan for an
urban water body –
A case study of Tapi river, India.
International Journal
of Environmental Sciences, 1(7): 1559-1573.
Wasserman GA, Liu X, Pervez F, Ahsan H, Litvak
PF, Geen AV, Slavkovich V, Lolacono NJ,
Cheng Z, Hussain I, Momotaj H, Grazian JH
(2004). Water arsenic exposure and children‟s
Intellectual function in Araihazar, Bangladesh.
Environmental Health Perspectives, 112: 1329-
1333.
WHO and UNICEF (2013a). Joint Monitoring
Programme: The Different Faces of Disparity in
Access to Water and Sanitation. New York:
UNICEF, WHO.
Wolf J, Bonjour S, Prüss-Ustün A (2013). An
exploration of multilevel modeling for
estimating access to drinking water and
sanitation. Journal of Water and Health,
11(1):64-77.
Wong CSC, Li XD, Zhang G, Qi SH, Peng XZ
(2003). Atmospheric deposition of heavy
metals in the Pearl River Delta, China.
Atmospheric Environment, 37(6): 767-776.
World Health Organization (WHO) (1984).
Guidelines for drinking water quality. Volume
1.
World Health Organization (WHO) (1998). Anon.,
1998. Guidelines for Drinking Water Quality.
World Health Organization, Geneva.
World Health Organization (WHO) (2002).
Quantifying selected major risks to health. In:
The World Health Report 2002: Reducing
Risks, Promoting Healthy Life. Geneva: World
Health Organization, 47-97.
World Health Organization (WHO) (2006).
Guidelines for drinking-water quality,
incorporating first addendum, Vol. 1,
Recommendations, 3rd ed.
World Health Organization (WHO) (2011). Valuing
water, valuing livelihoods : Guidance on social
cost-benefit analysis of drinking-water
interventions, with special reference to small
community water supplies. Edited by John
Cameron, Paul Hunter, Paul Jagals and
Katherine Pond London, England, U.K.: IWA
Publishing.
Wright J, Gundry S, Conroy R (2004). Household
drinking water in developing countries: a
systematic review of microbiological
contamination between source and point-of-use.
Tropical Medicine and International Health, 9
(1): 106-117.
International Journal of Scientific Research in Environmental Sciences, 3(2), pp. 0071-0087, 2015
87
Dr. Kumar is a Director Grade Scientist in Mumbai Zonal Lab of NEERI, Mumbai. Dr. Rakesh Kumar
received M.Tech in Environment Science and Engineering from IIT, Bombay and PhD in
Environmental Engineering from Nagpur University, India in 1994. He has published more than 65
papers in international journals and 43 papers in national refereed journals with 2 books and 9 chapters
in different books. He has 8 patents to his credit. Additionally, he has published several technical
reports on research/consultancy conducted for government agencies and private industries. Dr.Rakesh
Kumar has about 26 years of experience in the field of environmental science and engineering. He has
received 9 awards for his outstanding contribution to Environmental Science & Engineering.
Dr Shalini A Tandon is a scientist in National Environmental Engineering Research Institute (A
Council of Scientific and Industrial Research Institute), Mumbai. She obtained her PhD in
Environmental Sciences from Indian Agricultural Research Institute, New Delhi. Her major field of
study is Environmental monitoring and waste water recycling.
Dr. Asheesh Shrivastava is a Research Associate in Mumbai Zonal Lab of NEERI, Mumbai. Dr.
Asheesh Shrivastava received his doctorate in Environmental Science from Kyoto University, Kyoto,
Japan in 2010. He is recipient of the Japanese Government Scholarship (MEXT). His current research
interest includes environmental monitoring and restoration of water bodies by natural process.