Water Quality and Treatment
113
Outreach Program of the Water Purification Science and Technology Research Group at UNC-Chapel Hill – Visit us at http://coronell.web.unc.edu/outreach Water Quality and Treatment Lessons For Middle/High School Prepared by: Ariel Atkinson, Kasia Grzebyk, Lin Lin, Jingbo Wang, Orlando Coronell PhD Department of Environmental Sciences and Engineering Gillings School of Global Public Health University of North Carolina at Chapel Hill Robert Greenberg Chapel Hill High School, Chapel Hill, North Carolina June 2014
Transcript of Water Quality and Treatment

Outreach Program of the Water Purification Science and Technology Research Group at UNC-Chapel Hill – Visit us at http://coronell.web.unc.edu/outreach
Water Quality and Treatment
Lessons For
Middle/High School
Prepared by:
Ariel Atkinson, Kasia Grzebyk, Lin Lin, Jingbo Wang, Orlando Coronell PhD
Department of Environmental Sciences and Engineering Gillings School of Global Public Health
University of North Carolina at Chapel Hill
Robert Greenberg
Chapel Hill High School, Chapel Hill, North Carolina
June 2014
This packet serves as a guideline for middle/high school teachers to educate students about drinking water quality and production. Others who plan to hold outreach programs on water education may also use this as an additional support. This packet is a product of an outreach program conducted in 2014 at Chapel Hill High School in Chapel Hill, North Carolina.
This packet contains:
• A description of the purpose, content, and prerequisites for the lessons.
• A day-by-day layout of the outreach lectures, assignments, activities, and other support materials.
• Sample slides that were used in a series of lectures given in 2014 and instruction for the corresponding activities.
• Photos that were taken during the outreach in the spring of 2014.
2
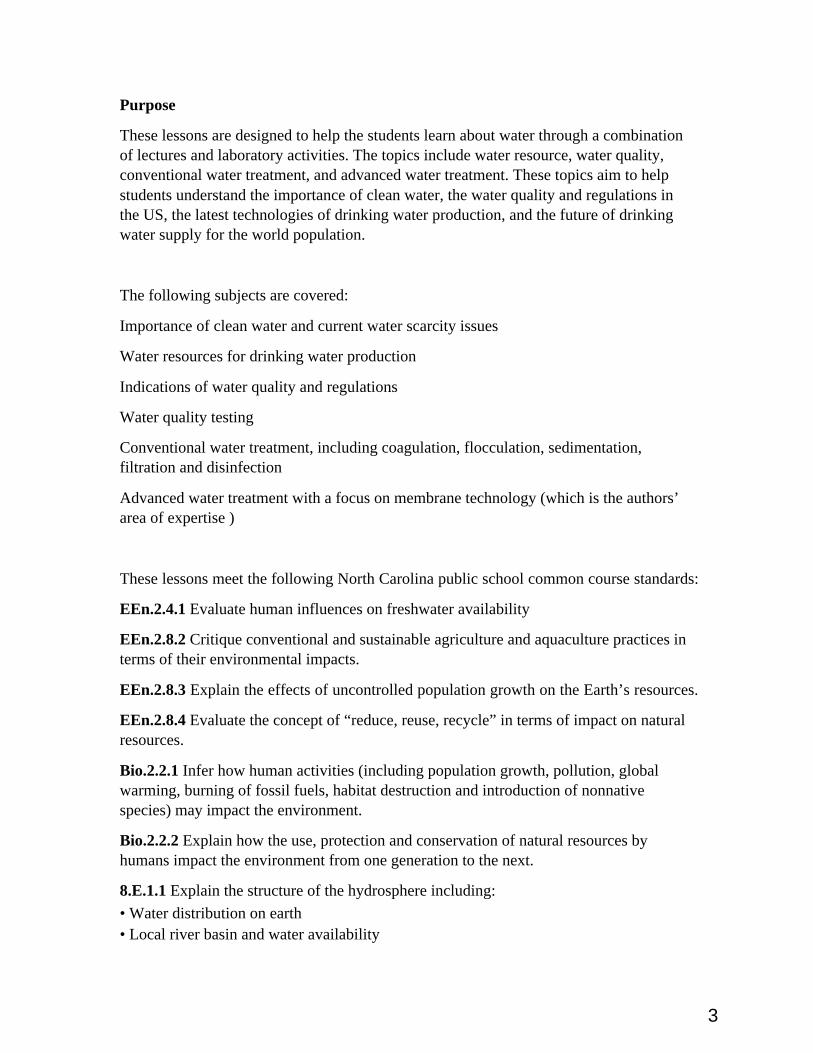
Purpose
These lessons are designed to help the students learn about water through a combination of lectures and laboratory activities. The topics include water resource, water quality, conventional water treatment, and advanced water treatment. These topics aim to help students understand the importance of clean water, the water quality and regulations in the US, the latest technologies of drinking water production, and the future of drinking water supply for the world population.
The following subjects are covered:
Importance of clean water and current water scarcity issues
Water resources for drinking water production
Indications of water quality and regulations
Water quality testing
Conventional water treatment, including coagulation, flocculation, sedimentation, filtration and disinfection
Advanced water treatment with a focus on membrane technology (which is the authors’ area of expertise )
These lessons meet the following North Carolina public school common course standards:
EEn.2.4.1 Evaluate human influences on freshwater availability
EEn.2.8.2 Critique conventional and sustainable agriculture and aquaculture practices in terms of their environmental impacts.
EEn.2.8.3 Explain the effects of uncontrolled population growth on the Earth’s resources.
EEn.2.8.4 Evaluate the concept of “reduce, reuse, recycle” in terms of impact on natural resources.
Bio.2.2.1 Infer how human activities (including population growth, pollution, global warming, burning of fossil fuels, habitat destruction and introduction of nonnative species) may impact the environment.
Bio.2.2.2 Explain how the use, protection and conservation of natural resources by humans impact the environment from one generation to the next.
8.E.1.1 Explain the structure of the hydrosphere including: • Water distribution on earth • Local river basin and water availability
3
8.E.1.2 Summarize evidence that Earth’s oceans are a reservoir of nutrients, minerals, dissolved gases, and life forms: • Estuaries • Marine ecosystems • Upwelling • Behavior of gases in the marine environment • Value and sustainability of marine resources • Deep ocean technology and understandings gained
8.E.1.3 Predict the safety and potability of water supplies in North Carolina based on physical and biological factors, including: • Temperature • Dissolved oxygen • pH • Nitrates and phosphates • Turbidity • Bio-indicators
8.E.1.4 Conclude that the good health of humans requires: • Monitoring of the hydrosphere • Water quality standards • Methods of water treatment • Maintaining safe water quality • Stewardship Prerequisites
It is suggested students have been introduced to the following concepts before participating in these lessons:
• Hydrosphere and water cycle (Earth/Environmental Science)
• Health effects of bacteria and viruses (Biology)
• pH, acidic and basic (Chemistry)
• Filtration (Physics)
4
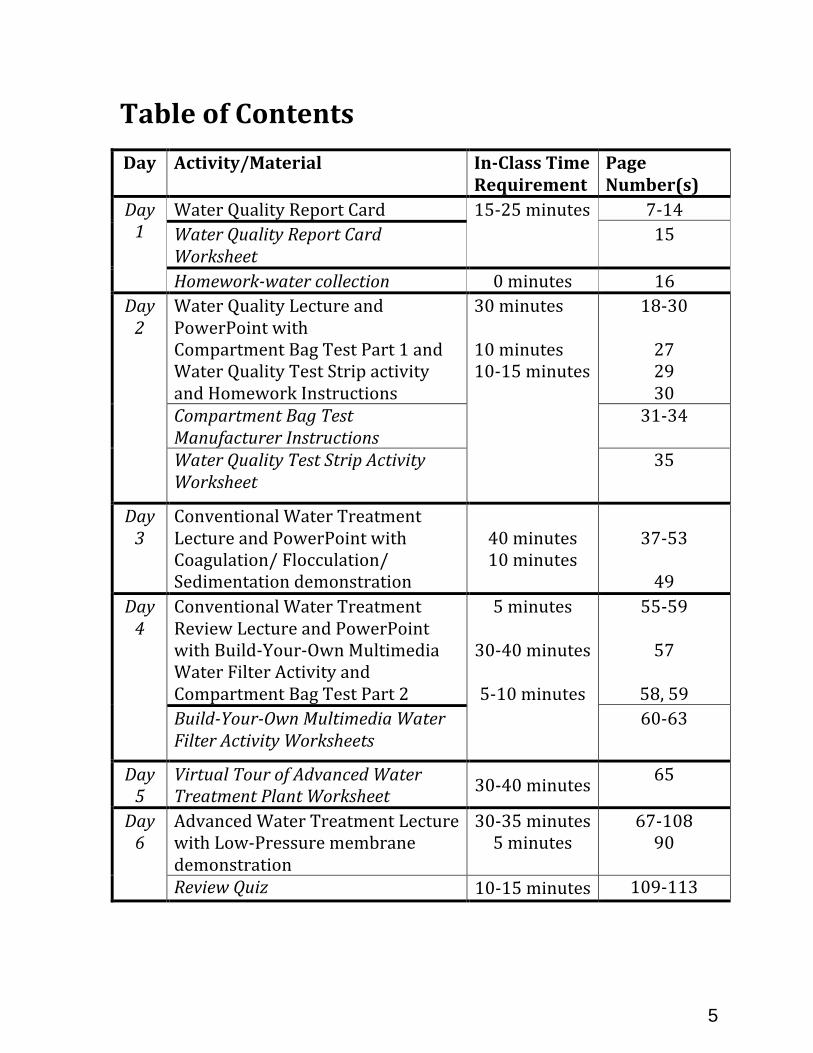
Table of Contents Day Activity/Material In-‐Class Time
Requirement Page Number(s)
Day 1
Water Quality Report Card 15-‐25 minutes 7-‐14 Water Quality Report Card Worksheet
15
Homework-‐water collection 0 minutes 16 Day 2
Water Quality Lecture and PowerPoint with Compartment Bag Test Part 1 and Water Quality Test Strip activity and Homework Instructions
30 minutes 10 minutes 10-‐15 minutes
18-‐30 27 29 30
Compartment Bag Test Manufacturer Instructions
31-‐34
Water Quality Test Strip Activity Worksheet
35
Day 3
Conventional Water Treatment Lecture and PowerPoint with Coagulation/ Flocculation/ Sedimentation demonstration
40 minutes 10 minutes
37-‐53 49
Day 4
Conventional Water Treatment Review Lecture and PowerPoint with Build-‐Your-‐Own Multimedia Water Filter Activity and Compartment Bag Test Part 2
5 minutes
30-‐40 minutes
5-‐10 minutes
55-‐59 57
58, 59 Build-‐Your-‐Own Multimedia Water Filter Activity Worksheets
60-‐63
Day 5
Virtual Tour of Advanced Water Treatment Plant Worksheet 30-‐40 minutes 65
Day 6
Advanced Water Treatment Lecture with Low-‐Pressure membrane demonstration
30-‐35 minutes 5 minutes
67-‐108 90
Review Quiz 10-‐15 minutes 109-‐113
5
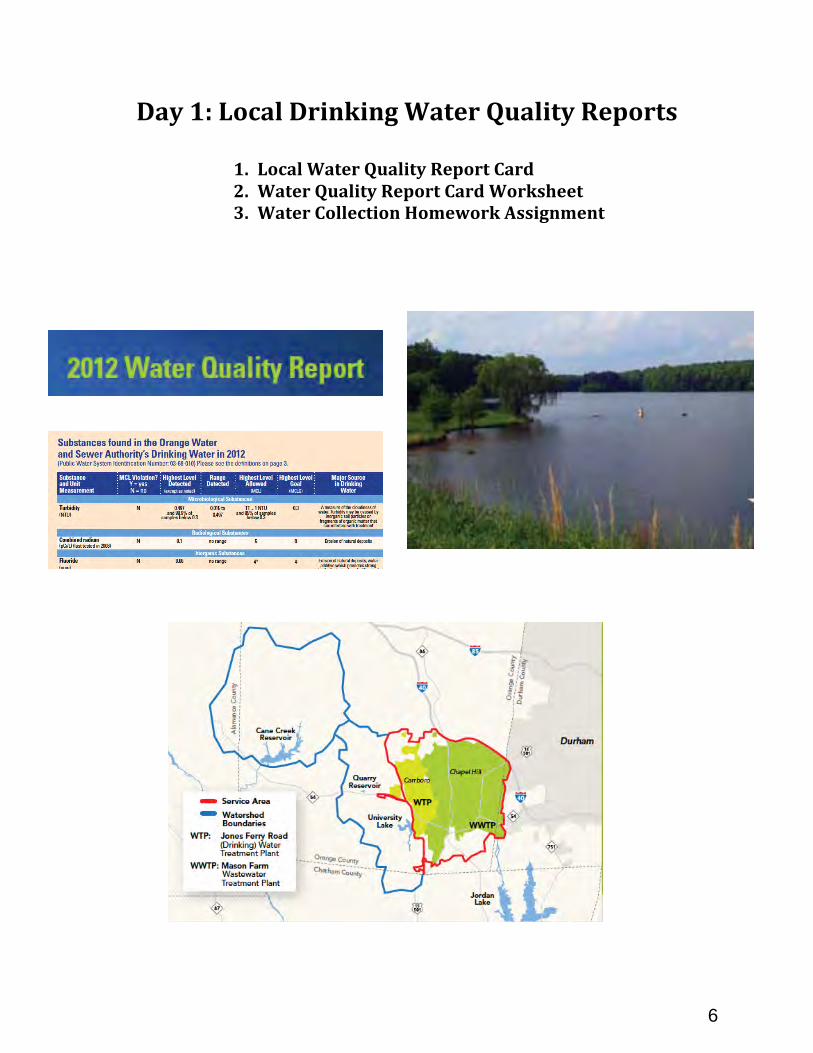
Day 1: Local Drinking Water Quality Reports
1. Local Water Quality Report Card 2. Water Quality Report Card Worksheet 3. Water Collection Homework Assignment
6

����9CVGT3WCNKV[5HSRUW&DUG
2012 Water Quality ReportWe are pleased to provide this report on the quality ofour drinking water in 2012. We are committed to supplying excellent water for our community’s quality of life, health and safety and economic vitality.
In 2012, we treated about 2.6 billion gallons of drinking water, or 7.3 million gallons per day, in accord with Federal standards under the Safe Drinking Water Act, and related State standards.
Orange Water and Sewer Authority, 400 Jones Ferry Road, Carrboro, NC 27510
PRSRT STDU.S. POSTAGE
PAIDPERMIT NO. 1
ZIP CODE 14304
�7
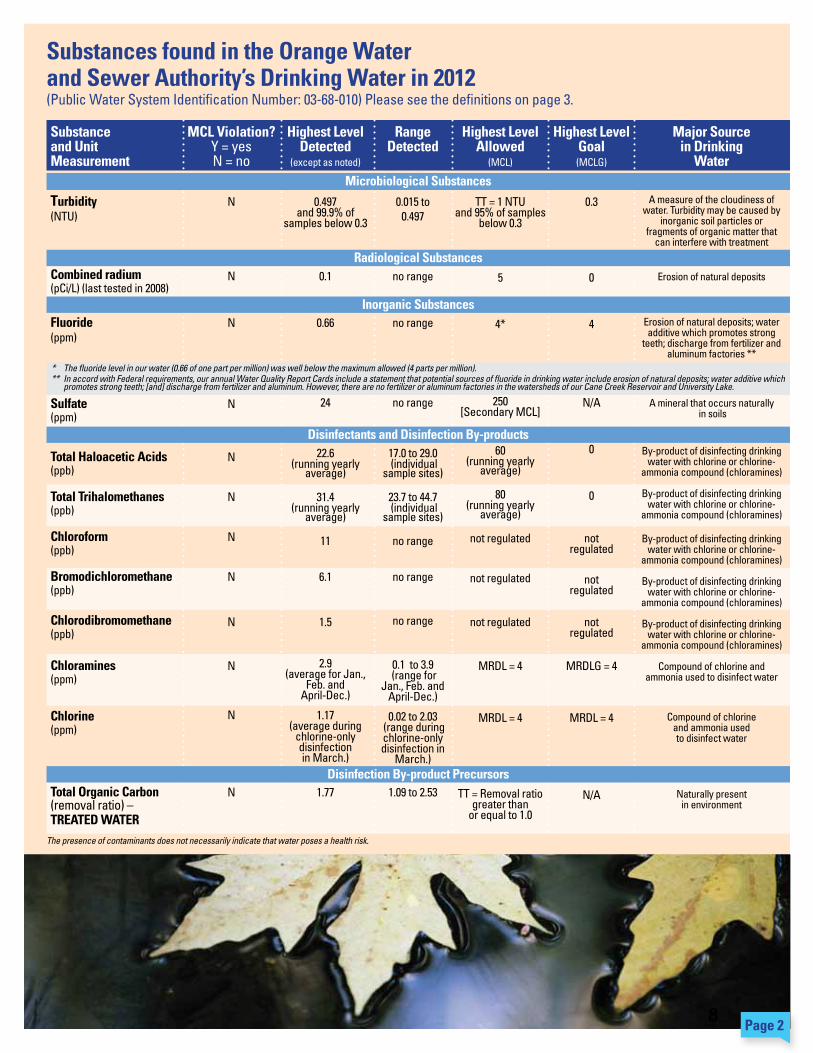
Substances found in the Orange Waterand Sewer Authority’s Drinking Water in 2012(Public Water System Identification Number: 03-68-010) Please see the definitions on page 3.
Substanceand Unit Measurement
Turbidity(NTU)
Combined radium(pCi/L) (last tested in 2008)
Fluoride (ppm)
Sulfate (ppm)
Total Haloacetic Acids (ppb)
Total Trihalomethanes (ppb)
Chloroform (ppb)
Bromodichloromethane (ppb)
Chlorodibromomethane (ppb)
Chloramines (ppm)
Chlorine(ppm)
Total Organic Carbon (removal ratio) – TREATED WATER
Highest LevelDetected
(except as noted)
0.497and 99.9% of
samples below 0.3
0.1
0.66
24
22.6(running yearly
average)
31.4(running yearly
average)
11
6.1
1.5
2.9(average for Jan.,
Feb. andApril-Dec.)
1.17(average during
chlorine-onlydisinfectionin March.)
1.77
Highest LevelAllowed
(MCL)
TT = 1 NTUand 95% of samples
below 0.3
5
4*
250[Secondary MCL]
60 (running yearly
average)
80 (running yearly
average)
not regulated
not regulated
not regulated
MRDL = 4
MRDL = 4
TT = Removal ratio greater than
or equal to 1.0
Highest LevelGoal (MCLG)
0.3
0
4
N/A
0
0
notregulated
notregulated
notregulated
MRDLG = 4
MRDL = 4
N/A
Major Source in Drinking
Water
A measure of the cloudiness of water. Turbidity may be caused by
inorganic soil particles orfragments of organic matter that
can interfere with treatment
Erosion of natural deposits
Erosion of natural deposits; water additive which promotes strong
teeth; discharge from fertilizer and aluminum factories **
A mineral that occurs naturally in soils
By-product of disinfecting drinking water with chlorine or chlorine-
ammonia compound (chloramines)
By-product of disinfecting drinking water with chlorine or chlorine-
ammonia compound (chloramines)
By-product of disinfecting drinking water with chlorine or chlorine-
ammonia compound (chloramines)
By-product of disinfecting drinking water with chlorine or chlorine-
ammonia compound (chloramines)
By-product of disinfecting drinking water with chlorine or chlorine-
ammonia compound (chloramines)
Compound of chlorine andammonia used to disinfect water
Compound of chlorineand ammonia usedto disinfect water
Naturally presentin environment
MCL Violation? Y = yesN = no
N
N
N
N
N
N
N
N
N
N
N
N
RangeDetected
0.015 to0.497
no range
no range
no range
17.0 to 29.0 (individual
sample sites)
23.7 to 44.7 (individual
sample sites)
no range
no range
no range
0.1 to 3.9 (range for
Jan., Feb. and April-Dec.)
0.02 to 2.03 (range during chlorine-only disinfection in
March.)
1.09 to 2.53
Microbiological Substances
Radiological Substances
Inorganic Substances
Disinfectants and Disinfection By-products
Disinfection By-product Precursors
The presence of contaminants does not necessarily indicate that water poses a health risk.
Page 2
* The fluoride level in our water (0.66 of one part per million) was well below the maximum allowed (4 parts per million).** In accord with Federal requirements, our annual Water Quality Report Cards include a statement that potential sources of fluoride in drinking water include erosion of natural deposits; water additive which promotes strong teeth; [and] discharge from fertilizer and aluminum. However, there are no fertilizer or aluminum factories in the watersheds of our Cane Creek Reservoir and University Lake.
�8
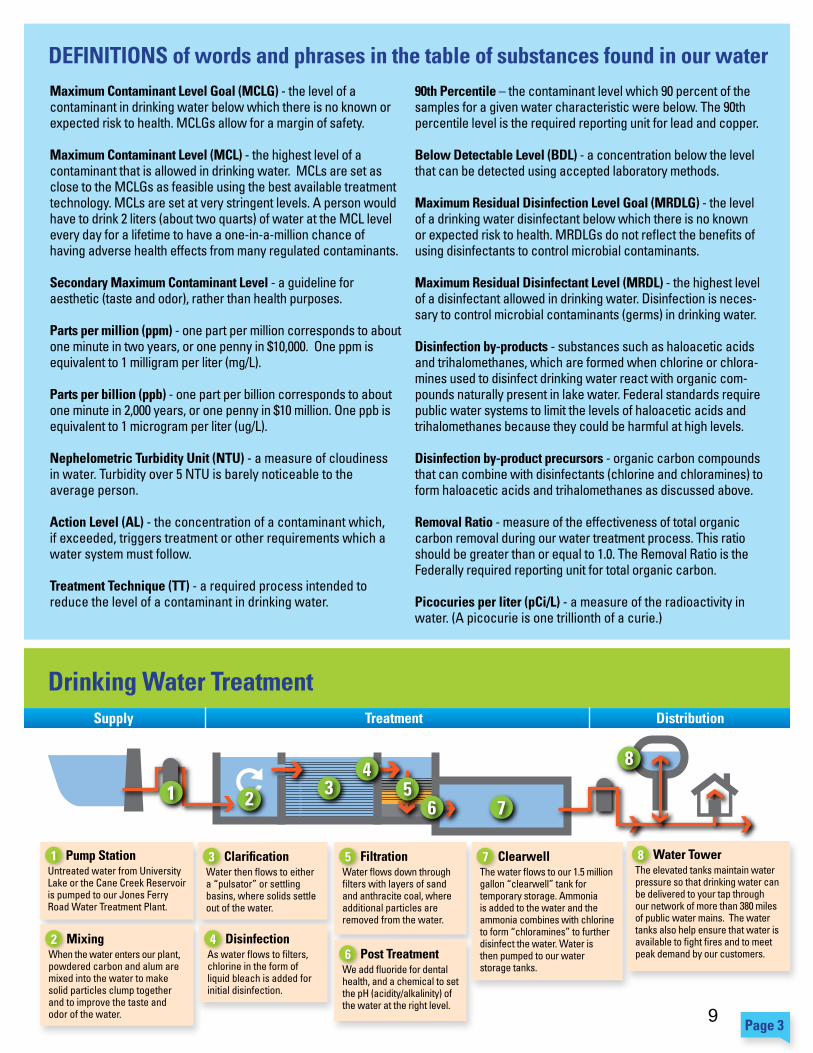
Drinking Water Treatment
Page 3
1 2 76
43 5
8
Pump StationUntreated water from University Lake or the Cane Creek Reservoir is pumped to our Jones Ferry Road Water Treatment Plant.
1
MixingWhen the water enters our plant, powdered carbon and alum are mixed into the water to make solid particles clump together and to improve the taste and odor of the water.
2
ClarificationWater then flows to either a “pulsator” or settling basins, where solids settle out of the water.
3
DisinfectionAs water flows to filters, chlorine in the form of liquid bleach is added for initial disinfection.
4
FiltrationWater flows down through filters with layers of sand and anthracite coal, where additional particles are removed from the water.
5
Post TreatmentWe add fluoride for dental health, and a chemical to set the pH (acidity/alkalinity) of the water at the right level.
6
ClearwellThe water flows to our 1.5 million gallon “clearwell” tank fortemporary storage. Ammonia is added to the water and the ammonia combines with chlorine to form “chloramines” to further disinfect the water. Water isthen pumped to our waterstorage tanks.
7 Water TowerThe elevated tanks maintain water pressure so that drinking water can be delivered to your tap through our network of more than 380 miles of public water mains. The water tanks also help ensure that water is available to fight fires and to meet peak demand by our customers.
8
Supply DistributionTreatment
DEFINITIONS of words and phrases in the table of substances found in our waterMaximum Contaminant Level Goal (MCLG) - the level of a contaminant in drinking water below which there is no known or expected risk to health. MCLGs allow for a margin of safety.
Maximum Contaminant Level (MCL) - the highest level of a contaminant that is allowed in drinking water. MCLs are set as close to the MCLGs as feasible using the best available treatment technology. MCLs are set at very stringent levels. A person would have to drink 2 liters (about two quarts) of water at the MCL level every day for a lifetime to have a one-in-a-million chance ofhaving adverse health effects from many regulated contaminants.
Secondary Maximum Contaminant Level - a guideline foraesthetic (taste and odor), rather than health purposes.
Parts per million (ppm) - one part per million corresponds to about one minute in two years, or one penny in $10,000. One ppm is equivalent to 1 milligram per liter (mg/L).
Parts per billion (ppb) - one part per billion corresponds to about one minute in 2,000 years, or one penny in $10 million. One ppb is equivalent to 1 microgram per liter (ug/L).
Nephelometric Turbidity Unit (NTU) - a measure of cloudinessin water. Turbidity over 5 NTU is barely noticeable to theaverage person.
Action Level (AL) - the concentration of a contaminant which,if exceeded, triggers treatment or other requirements which awater system must follow.
Treatment Technique (TT) - a required process intended toreduce the level of a contaminant in drinking water.
90th Percentile – the contaminant level which 90 percent of the samples for a given water characteristic were below. The 90th percentile level is the required reporting unit for lead and copper.
Below Detectable Level (BDL) - a concentration below the level that can be detected using accepted laboratory methods.
Maximum Residual Disinfection Level Goal (MRDLG) - the level of a drinking water disinfectant below which there is no known or expected risk to health. MRDLGs do not reflect the benefits of using disinfectants to control microbial contaminants.
Maximum Residual Disinfectant Level (MRDL) - the highest level of a disinfectant allowed in drinking water. Disinfection is neces-sary to control microbial contaminants (germs) in drinking water.
Disinfection by-products - substances such as haloacetic acids and trihalomethanes, which are formed when chlorine or chlora-mines used to disinfect drinking water react with organic com-pounds naturally present in lake water. Federal standards require public water systems to limit the levels of haloacetic acids and trihalomethanes because they could be harmful at high levels.
Disinfection by-product precursors - organic carbon compounds that can combine with disinfectants (chlorine and chloramines) to form haloacetic acids and trihalomethanes as discussed above.
Removal Ratio - measure of the effectiveness of total organiccarbon removal during our water treatment process. This ratio should be greater than or equal to 1.0. The Removal Ratio is the Federally required reporting unit for total organic carbon.
Picocuries per liter (pCi/L) - a measure of the radioactivity in water. (A picocurie is one trillionth of a curie.)
9

Page 7
Lead and Your Health
TESTING Our Drinking Water for Lead
If present, elevated levels of lead can cause serious health problems, especially for pregnant women and young children. Lead in drinking water is primarily from materials and components associated with service lines and home plumbing. OWASA is responsible for providing high quality drinking water, but cannot control the variety of materials used in plumbing components. Plumbing code limits for lead in solder and fixtures were tightened in 1986 to reduce the potential for lead to dissolve from pipes, solder or fixtures into drinking water.
When your water has been sitting for several hours, you can minimize the potential for lead exposure by running water for 30seconds to 2 minutes before using water for drinking or cooking.
If you are concerned about lead in your water, you may wish to have your water tested (please see additional information below). Information on lead in drinking water, testing methods, and steps you can take to minimize exposure is available from theEPA’s Safe Drinking Water Hotline, 800.426.4791, or at www.epa.gov/safewater/lead.
The Federal limit on lead in drinking water is a maximum of 15 parts per billion in at least 90% of the samples tested. (One part per billion corresponds to one penny in $10 million.) Our testing results are significantly better than this standard.
We regularly test our water as it leaves the Jones Ferry Road Water Treatment Plant. For over 10 years, all of these test results have been less than the detectable level of 3 parts per billion. In accord with Federal and State standards, we also test every three years for lead in tap water at 30 homes built between 1983
and 1985. The results from this testing in 2011 were all below the detectable level of 3 parts per billion.
In response to customers’ requests in 2012, we tested tap water for lead in 12 homes. In all of the water samples, lead was below the detectable level of 3 ppb.
For more information, including how you can have the water inyour home tested for lead at no charge, please contact the OWASA Laboratory staff at 919.537.4227 or [email protected].
GETTING INVOLVED in Water Quality and Supply IssuesYou can get involved in water resource issues at the local, State and national level.
• Being informed is the first step in being an effective participant.
• You can learn about water and water resource issues from news media; books in the library; websites such as those of the U.S. Environmental Protection Agency, American Water Works Association and other organizations; and by contacting OWASA (telephone: 919.968.4421; e-mail: [email protected]; website: www.owasa.org).
• If you have an e-mail address, we would be glad to send you our electronic notices and news releases about OWASA-related topics of interest to you. We invite you to contact OWASA Public Affairs at 919.537.4267 or [email protected] about the topics you are interested in.
• Expressing your views at public meetings, by contacting public officials, etc. is important when improvements, plans, policies and standards affecting water quality and watershed protection are needed or proposed.
We invite you to attend and participate in meetings of the OWASA Board of Directors, which makes decisions on plans and policies and adopts the annual budget for our water and wastewater services. The OWASA Board meets at 7 PM on second Thursdays of most months in the Community Room on the lower floor of the OWASA Administration Building, 400 Jones Ferry Road, Carrboro; and on fourth Thursdays at the Chapel Hill Town Hall. On fourth Thursdays, OWASA Board meetings are televised live on channel 18 of the cable television systems serving Chapel Hill and Carrboro.
Tip! If you are a residential customer and you use more than an average of 4,000 gallons per month, feel free to contact us or visitour website for information on conservation opportunities.
10

If you have any questions or comments about our drinking water, we invite you to contact our Water Treatment Plant Laboratory Supervisor at 919.537.4227 or our Water Supply and Treatment Manager at 919.537.4232; visit our website, www.owasa.org;or send us a letter (400 Jones Ferry Road, Carrboro, NC 27510), an e-mail ([email protected]) or fax (919.968.4464).
We welcome your questions and feedback!
Orange Water and Sewer AuthorityPublic Water Supply No.: 03-68-010
400 Jones Ferry RoadCarrboro, NC 27510919.968.4421 | [email protected] | www.owasa.orgTwitter: @owasa1EPA’s Safe Drinking Water Hotline: 800.426.4791
A public, non-profit agencyproviding water, sewer and reclaimed water services to the Carrboro-Chapel Hill community.
For More Information
Page 8
WATER CONSERVATION: Part of Our Sustainable Quality of LifeWater conservation makes us better prepared for future droughts, reduces the community’s long-term costs for water and sewer system capacity and lowers greenhouse gas emissions. (All water and wastewater is pumped, and most of the energy for pumping comes from fossil fuels comprised of hydrocarbons.) For information on the best ways to conserve, please visit the Conservation and Education part of our website, www.owasa.org; or contact OWASA Public Affairs at 919.537.4267 or [email protected].
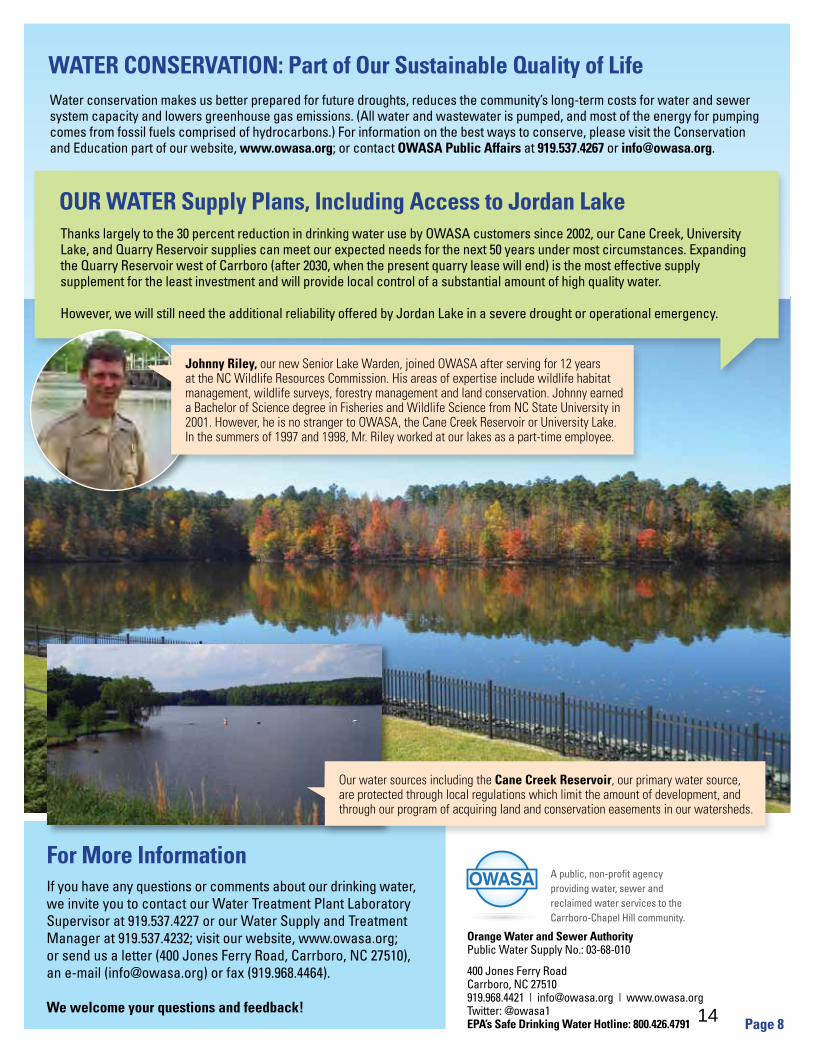
OUR WATER Supply Plans, Including Access to Jordan LakeThanks largely to the 30 percent reduction in drinking water use by OWASA customers since 2002, our Cane Creek, University Lake, and Quarry Reservoir supplies can meet our expected needs for the next 50 years under most circumstances. Expanding the Quarry Reservoir west of Carrboro (after 2030, when the present quarry lease will end) is the most effective supplysupplement for the least investment and will provide local control of a substantial amount of high quality water.
However, we will still need the additional reliability offered by Jordan Lake in a severe drought or operational emergency.
Johnny Riley, our new Senior Lake Warden, joined OWASA after serving for 12 years at the NC Wildlife Resources Commission. His areas of expertise include wildlife habitat management, wildlife surveys, forestry management and land conservation. Johnny earned a Bachelor of Science degree in Fisheries and Wildlife Science from NC State University in 2001. However, he is no stranger to OWASA, the Cane Creek Reservoir or University Lake.In the summers of 1997 and 1998, Mr. Riley worked at our lakes as a part-time employee.
Our water sources including the Cane Creek Reservoir, our primary water source, are protected through local regulations which limit the amount of development, and through our program of acquiring land and conservation easements in our watersheds.
11
FOR PEOPLE With Special Risk of Infection
N.C. SOURCE Water Assessment Program Results
Some people may be more vulnerable to contaminants in drinking water than the general population. People with compromisedimmune systems such as those undergoing chemotherapy for cancer, people who have had organ transplants, people with HIV/AIDS or other immune system disorders, some elderly people and infants may be particularly at risk for infection.
These people should seek advice from their health care providers about drinking water. Guidelines from the U.S. Environmental Protection Agency (EPA) and Centers for Disease Control and Prevention (CDC) on appropriate means to lessen the risk of infection by Cryptosporidium (please see additional information in this report about Cryptosporidium) and other microbial contaminants are available from the EPA’s Safe Drinking Water Hotline, 800.426.4791.
Water that has received extra filtration (reverse osmosis) and disinfected with ultraviolet light is available at several supermarkets in our community.
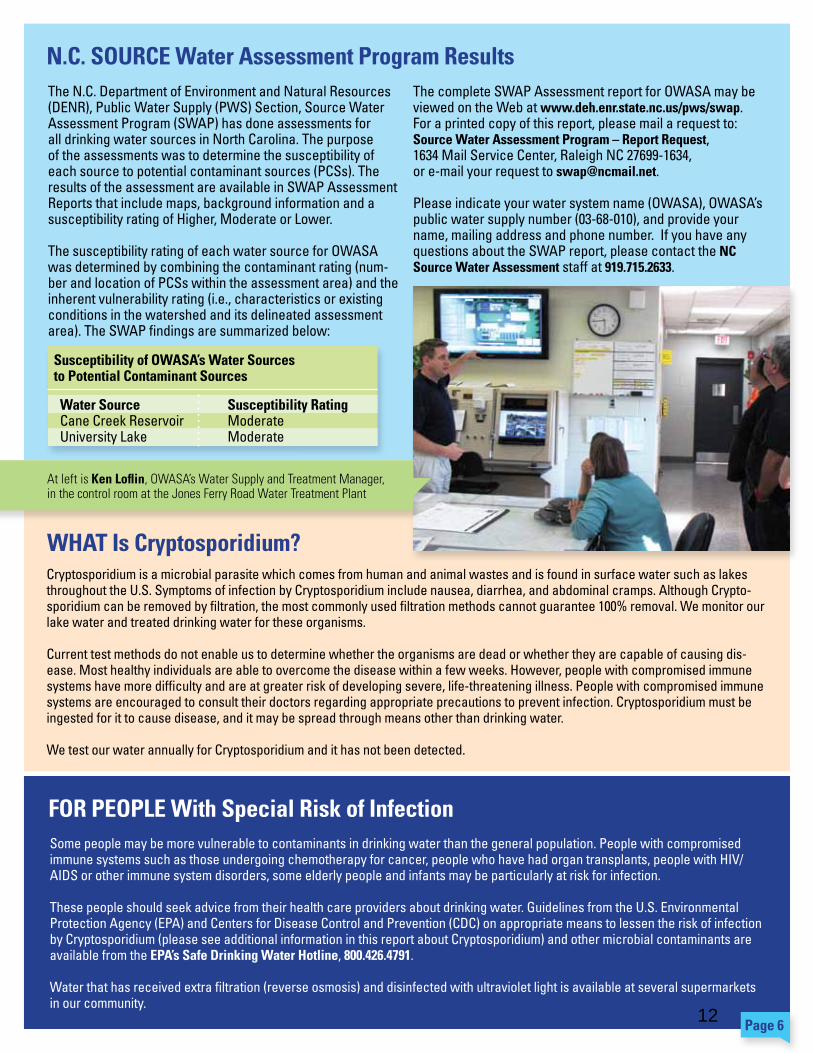
The N.C. Department of Environment and Natural Resources (DENR), Public Water Supply (PWS) Section, Source Water Assessment Program (SWAP) has done assessments for all drinking water sources in North Carolina. The purpose of the assessments was to determine the susceptibility of each source to potential contaminant sources (PCSs). The results of the assessment are available in SWAP Assessment Reports that include maps, background information and a susceptibility rating of Higher, Moderate or Lower.
The susceptibility rating of each water source for OWASA was determined by combining the contaminant rating (num-ber and location of PCSs within the assessment area) and the inherent vulnerability rating (i.e., characteristics or existing conditions in the watershed and its delineated assessment area). The SWAP findings are summarized below:
The complete SWAP Assessment report for OWASA may be viewed on the Web at www.deh.enr.state.nc.us/pws/swap.For a printed copy of this report, please mail a request to: Source Water Assessment Program – Report Request,1634 Mail Service Center, Raleigh NC 27699-1634,or e-mail your request to [email protected].
Please indicate your water system name (OWASA), OWASA’s public water supply number (03-68-010), and provide your name, mailing address and phone number. If you have any questions about the SWAP report, please contact the NC Source Water Assessment staff at 919.715.2633.
Page 6
WHAT Is Cryptosporidium?Cryptosporidium is a microbial parasite which comes from human and animal wastes and is found in surface water such as lakes throughout the U.S. Symptoms of infection by Cryptosporidium include nausea, diarrhea, and abdominal cramps. Although Crypto-sporidium can be removed by filtration, the most commonly used filtration methods cannot guarantee 100% removal. We monitor our lake water and treated drinking water for these organisms.
Current test methods do not enable us to determine whether the organisms are dead or whether they are capable of causing dis-ease. Most healthy individuals are able to overcome the disease within a few weeks. However, people with compromised immune systems have more difficulty and are at greater risk of developing severe, life-threatening illness. People with compromised immune systems are encouraged to consult their doctors regarding appropriate precautions to prevent infection. Cryptosporidium must be ingested for it to cause disease, and it may be spread through means other than drinking water.
We test our water annually for Cryptosporidium and it has not been detected.
Water Source Susceptibility RatingCane Creek Reservoir ModerateUniversity Lake Moderate
Susceptibility of OWASA’s Water Sources to Potential Contaminant Sources
At left is Ken Loflin, OWASA’s Water Supply and Treatment Manager, in the control room at the Jones Ferry Road Water Treatment Plant
12
Page 7
Lead and Your Health
TESTING Our Drinking Water for Lead
If present, elevated levels of lead can cause serious health problems, especially for pregnant women and young children. Lead in drinking water is primarily from materials and components associated with service lines and home plumbing. OWASA is responsible for providing high quality drinking water, but cannot control the variety of materials used in plumbing components. Plumbing code limits for lead in solder and fixtures were tightened in 1986 to reduce the potential for lead to dissolve from pipes, solder or fixtures into drinking water.
When your water has been sitting for several hours, you can minimize the potential for lead exposure by running water for 30seconds to 2 minutes before using water for drinking or cooking.
If you are concerned about lead in your water, you may wish to have your water tested (please see additional information below). Information on lead in drinking water, testing methods, and steps you can take to minimize exposure is available from theEPA’s Safe Drinking Water Hotline, 800.426.4791, or at www.epa.gov/safewater/lead.
The Federal limit on lead in drinking water is a maximum of 15 parts per billion in at least 90% of the samples tested. (One part per billion corresponds to one penny in $10 million.) Our testing results are significantly better than this standard.
We regularly test our water as it leaves the Jones Ferry Road Water Treatment Plant. For over 10 years, all of these test results have been less than the detectable level of 3 parts per billion. In accord with Federal and State standards, we also test every three years for lead in tap water at 30 homes built between 1983
and 1985. The results from this testing in 2011 were all below the detectable level of 3 parts per billion.
In response to customers’ requests in 2012, we tested tap water for lead in 12 homes. In all of the water samples, lead was below the detectable level of 3 ppb.
For more information, including how you can have the water inyour home tested for lead at no charge, please contact the OWASA Laboratory staff at 919.537.4227 or [email protected].
GETTING INVOLVED in Water Quality and Supply IssuesYou can get involved in water resource issues at the local, State and national level.
• Being informed is the first step in being an effective participant.
• You can learn about water and water resource issues from news media; books in the library; websites such as those of the U.S. Environmental Protection Agency, American Water Works Association and other organizations; and by contacting OWASA (telephone: 919.968.4421; e-mail: [email protected]; website: www.owasa.org).
• If you have an e-mail address, we would be glad to send you our electronic notices and news releases about OWASA-related topics of interest to you. We invite you to contact OWASA Public Affairs at 919.537.4267 or [email protected] about the topics you are interested in.
• Expressing your views at public meetings, by contacting public officials, etc. is important when improvements, plans, policies and standards affecting water quality and watershed protection are needed or proposed.
We invite you to attend and participate in meetings of the OWASA Board of Directors, which makes decisions on plans and policies and adopts the annual budget for our water and wastewater services. The OWASA Board meets at 7 PM on second Thursdays of most months in the Community Room on the lower floor of the OWASA Administration Building, 400 Jones Ferry Road, Carrboro; and on fourth Thursdays at the Chapel Hill Town Hall. On fourth Thursdays, OWASA Board meetings are televised live on channel 18 of the cable television systems serving Chapel Hill and Carrboro.
Tip! If you are a residential customer and you use more than an average of 4,000 gallons per month, feel free to contact us or visitour website for information on conservation opportunities.
13
If you have any questions or comments about our drinking water, we invite you to contact our Water Treatment Plant Laboratory Supervisor at 919.537.4227 or our Water Supply and Treatment Manager at 919.537.4232; visit our website, www.owasa.org;or send us a letter (400 Jones Ferry Road, Carrboro, NC 27510), an e-mail ([email protected]) or fax (919.968.4464).
We welcome your questions and feedback!
Orange Water and Sewer AuthorityPublic Water Supply No.: 03-68-010
400 Jones Ferry RoadCarrboro, NC 27510919.968.4421 | [email protected] | www.owasa.orgTwitter: @owasa1EPA’s Safe Drinking Water Hotline: 800.426.4791
A public, non-profit agencyproviding water, sewer and reclaimed water services to the Carrboro-Chapel Hill community.
For More Information
Page 8
WATER CONSERVATION: Part of Our Sustainable Quality of LifeWater conservation makes us better prepared for future droughts, reduces the community’s long-term costs for water and sewer system capacity and lowers greenhouse gas emissions. (All water and wastewater is pumped, and most of the energy for pumping comes from fossil fuels comprised of hydrocarbons.) For information on the best ways to conserve, please visit the Conservation and Education part of our website, www.owasa.org; or contact OWASA Public Affairs at 919.537.4267 or [email protected].
OUR WATER Supply Plans, Including Access to Jordan LakeThanks largely to the 30 percent reduction in drinking water use by OWASA customers since 2002, our Cane Creek, University Lake, and Quarry Reservoir supplies can meet our expected needs for the next 50 years under most circumstances. Expanding the Quarry Reservoir west of Carrboro (after 2030, when the present quarry lease will end) is the most effective supplysupplement for the least investment and will provide local control of a substantial amount of high quality water.
However, we will still need the additional reliability offered by Jordan Lake in a severe drought or operational emergency.
Johnny Riley, our new Senior Lake Warden, joined OWASA after serving for 12 years at the NC Wildlife Resources Commission. His areas of expertise include wildlife habitat management, wildlife surveys, forestry management and land conservation. Johnny earned a Bachelor of Science degree in Fisheries and Wildlife Science from NC State University in 2001. However, he is no stranger to OWASA, the Cane Creek Reservoir or University Lake.In the summers of 1997 and 1998, Mr. Riley worked at our lakes as a part-time employee.
Our water sources including the Cane Creek Reservoir, our primary water source, are protected through local regulations which limit the amount of development, and through our program of acquiring land and conservation easements in our watersheds.
14
Name:________________________________________ Water Quality Report Card Worksheet Review the water quality drinking report card and answer questions below. 1) What is an MCL? Were there any MCL Violations? 2) What categories of contaminants are listed? What are the different sources of contamination? 3) Were any of the contaminants above the “goal” level? Why do you think they establish “goal” levels? 4) Why should we conserve water? And how can you personally conserve it? 5) How do you feel about drinking tap water? Why?
15
Name:________________________________________ Water Collection Homework
1) Collect a clear colorless liquid sample in the provided collection vial. Fill approximately ¾ of the way full. Do not collect colored or opaque liquids. Examples of recommended liquids: tap water, bottled water, club soda, pond water, swimming pool water, boiled water, vinegar Examples of liquids NOT to collect: coca-cola, orange soda, juice, milk, balsamic vinegar, pepto-bismol, windex
2) The pH of a liquid indicates how acidic or basic liquid is. Drinking water should be neutral between pH 6-8. Sodas, lemon juice, and vinegar have acidic pH around 2-3. Soapy water and baking soda have basic pH around 10-12. Based on this information predict the pH of your liquid.
3) Chlorine is a disinfectant that is used to inactivate harmful microorganisms in drinking water. The concentration of chlorine goes down with time, but it is desirable to maintain some chlorine in tap water before it is consumed to prevent harmful pathogens from contaminating or growing before the water reaches the consumer. However, too much chlorine can also cause eye and skin irritation. Chlorine is also used at higher concentrations in pools and spas to prevent the spread of pathogens. Based on this information hypothesize whether your liquid has too high of a concentration, an ideal or normal concentration, a low concentration, or no chlorine left.
4) Alkalinity is the concentration of dissolved carbonates (carbon dioxide, baking soda) in a liquid, which prevents rapid changes in pH. The bubbly in carbonated water and soda is dissolved carbon dioxide. Based on this information predict whether your liquid has high alkalinity, an ok/good alkalinity to maintain pH, or too low/no alkalinity. Keeping in mind what you know about the use of your liquid and about pH, do you think it would be desirable to keep the pH of your liquid the same over time?
16

Day 2: Water Quality
1. Water Quality Lecture Powerpoint with Compartment Bag Test Part 1 Activity 2. Compartment Bag Test Instructions 3. Water Quality Test Strip Activity Worksheet
17
For the whole presenta.on, ask students to answer ques.ons then reinforce by repea.ng what they say (perhaps wri.ng down as well) and adding answers they did not get a<er they finish.
18
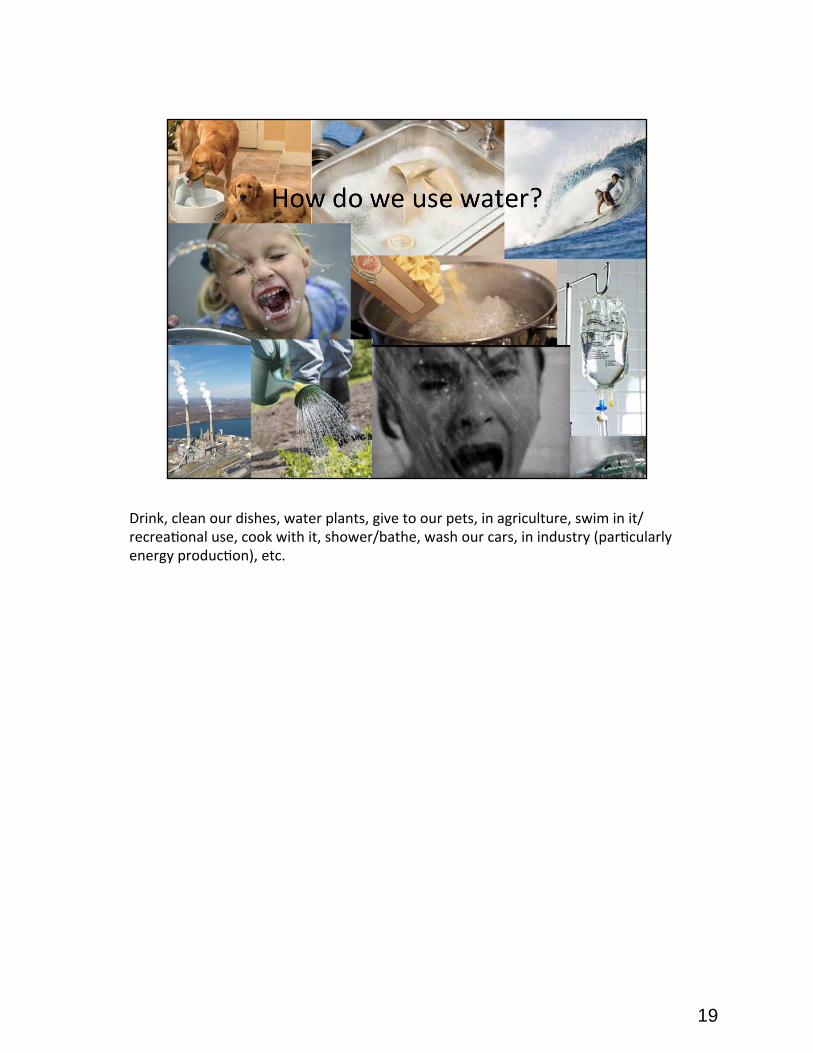
Drink, clean our dishes, water plants, give to our pets, in agriculture, swim in it/recrea.onal use, cook with it, shower/bathe, wash our cars, in industry (par.cularly energy produc.on), etc.
19
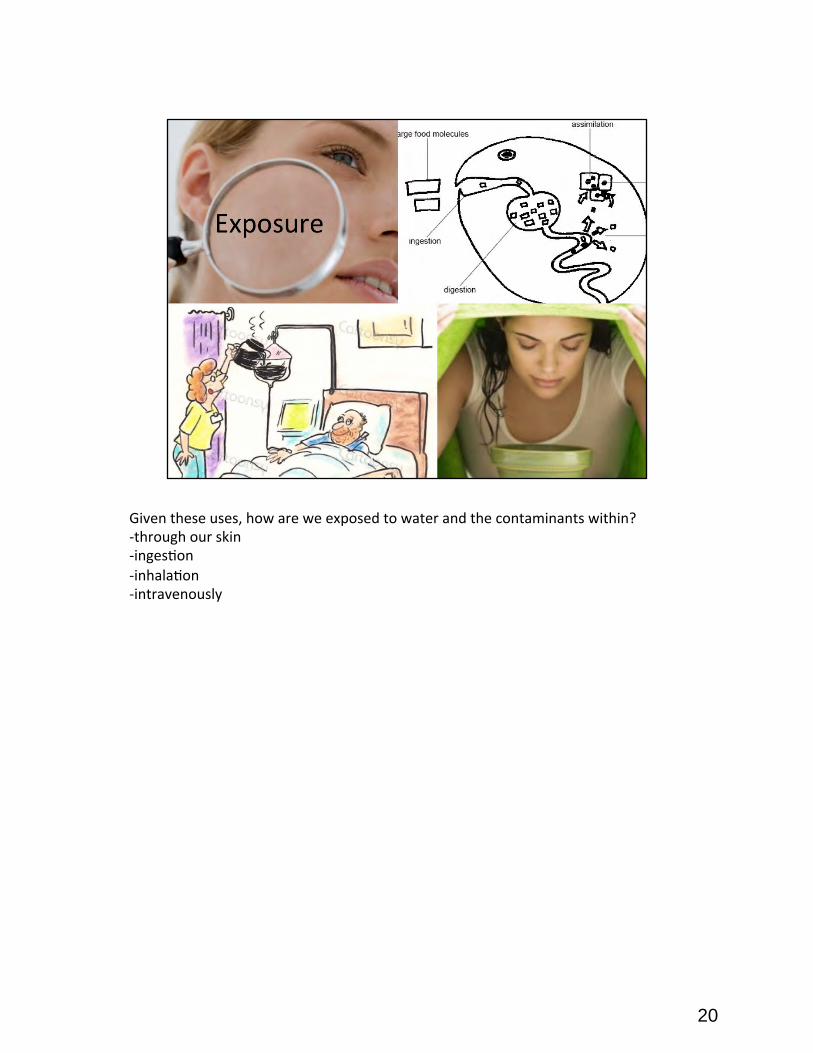
Given these uses, how are we exposed to water and the contaminants within? -‐through our skin -‐inges.on -‐inhala.on -‐intravenously
20
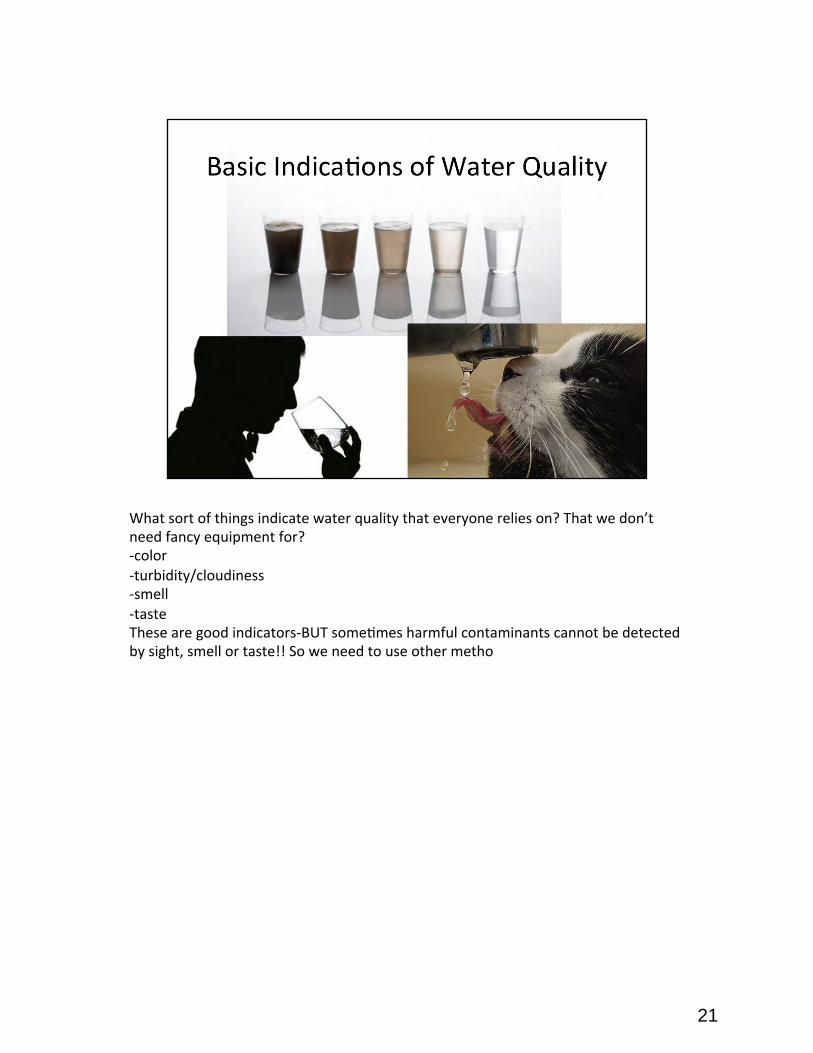
What sort of things indicate water quality that everyone relies on? That we don’t need fancy equipment for? -‐color -‐turbidity/cloudiness -‐smell -‐taste These are good indicators-‐BUT some.mes harmful contaminants cannot be detected by sight, smell or taste!! So we need to use other metho
21
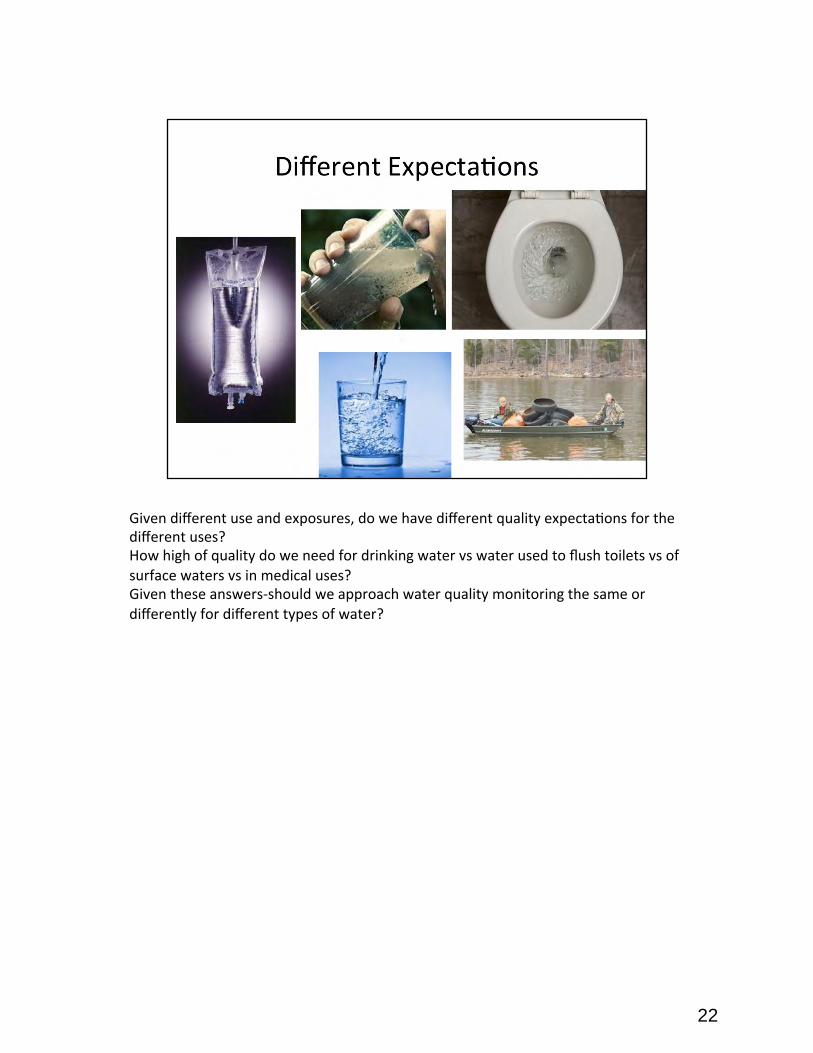
Given different use and exposures, do we have different quality expecta.ons for the different uses? How high of quality do we need for drinking water vs water used to flush toilets vs of surface waters vs in medical uses? Given these answers-‐should we approach water quality monitoring the same or differently for different types of water?
22
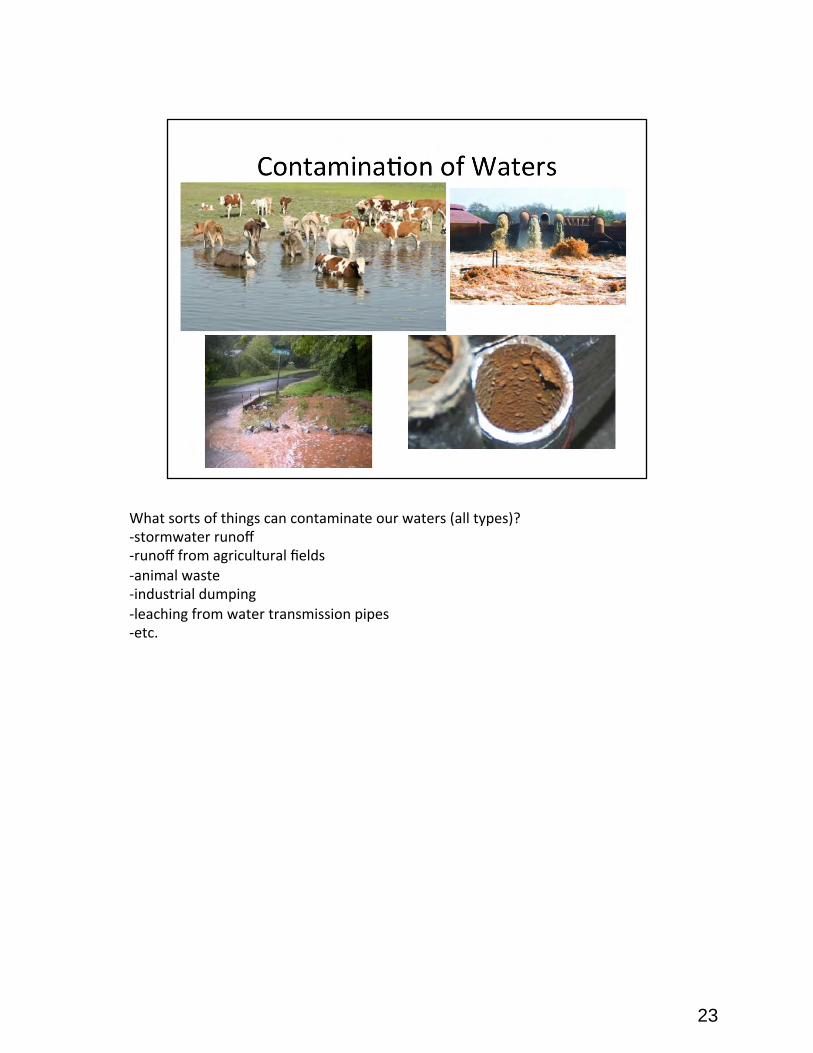
What sorts of things can contaminate our waters (all types)? -‐stormwater runoff -‐runoff from agricultural fields -‐animal waste -‐industrial dumping -‐leaching from water transmission pipes -‐etc.
23
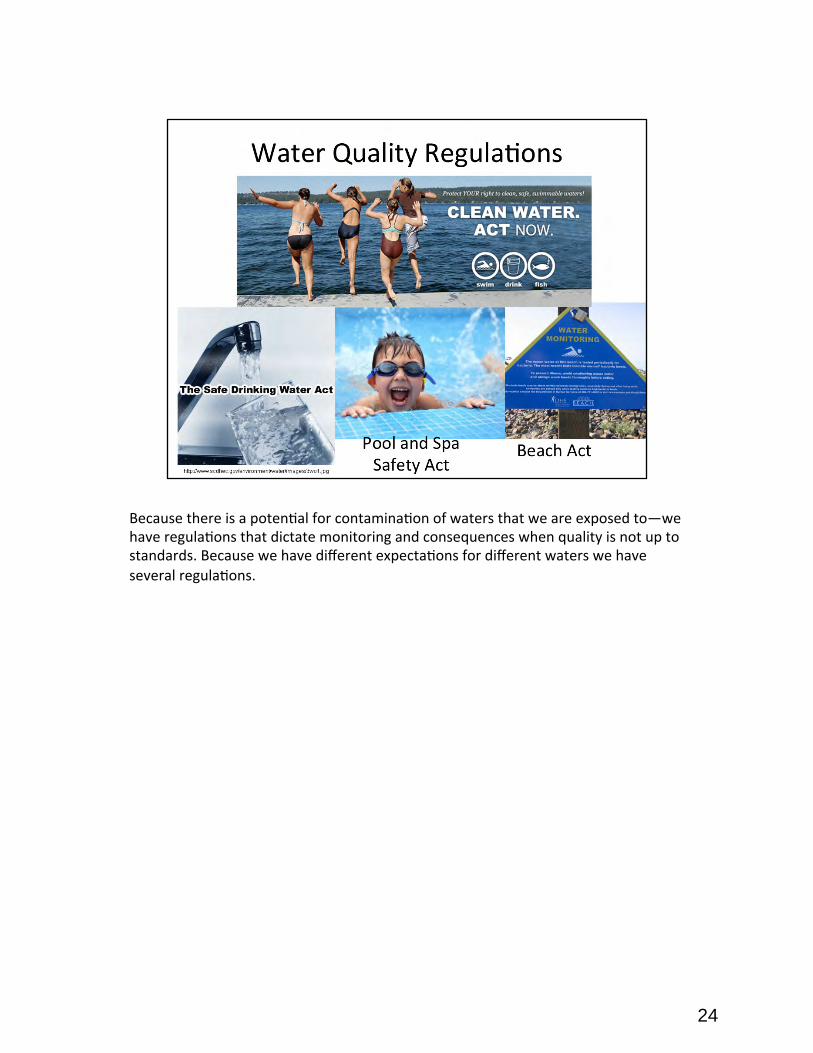
Because there is a poten.al for contamina.on of waters that we are exposed to—we have regula.ons that dictate monitoring and consequences when quality is not up to standards. Because we have different expecta.ons for different waters we have several regula.ons.
24

Discuss local water quality report and the homework/worksheet that went with it. Ask-‐what are the different types of contaminants that were listed in the report? Give examples for each type. Ask for explana.on of what a disinfec.on by-‐product is and what a precursor is (natural organic maZer=precursors, precursors react with disinfectant to make poten.ally harmful disinfec.on by-‐products ) Why are these contaminants regulated? What is an MCL? What is the difference between goal levels and MCL? Why do we have goal levels?
25

How do we monitor these contaminants in water? For microbes-‐it’s very difficult to see low concentra.ons of microbes-‐so most methods involve incuba.on allowing for reproduc.on/growth then physically coun.ng colonies of bacteria (ex. Agar plate-‐colony counts)à Go to compartment bag test slide
26

The compartment bag test is a water quality test. It tells us how much E.Coli is in a water sample. E.Coli is indicates the amount of harmful pathogens in the water sample. This test determines whether there is a high, low, or no risk from microbial contaminants if you were to drink the water. For the ac.vity it is best to have 2 different water samples here, one clean water (ex. tap water) and a dir.er water (ex.river or pond water). Refer to the aZached Compartment Bag Test Instruc.ons.
27
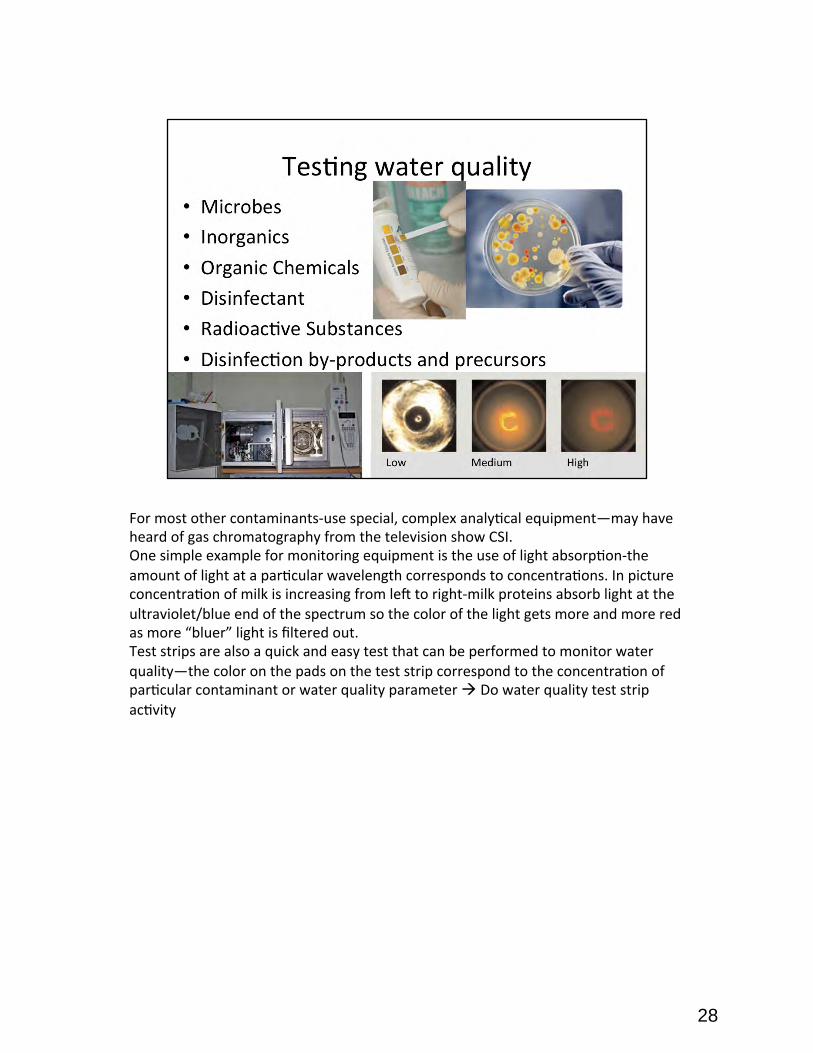
For most other contaminants-‐use special, complex analy.cal equipment—may have heard of gas chromatography from the television show CSI. One simple example for monitoring equipment is the use of light absorp.on-‐the amount of light at a par.cular wavelength corresponds to concentra.ons. In picture concentra.on of milk is increasing from le< to right-‐milk proteins absorb light at the ultraviolet/blue end of the spectrum so the color of the light gets more and more red as more “bluer” light is filtered out. Test strips are also a quick and easy test that can be performed to monitor water quality—the color on the pads on the test strip correspond to the concentra.on of par.cular contaminant or water quality parameter à Do water quality test strip ac.vity
28
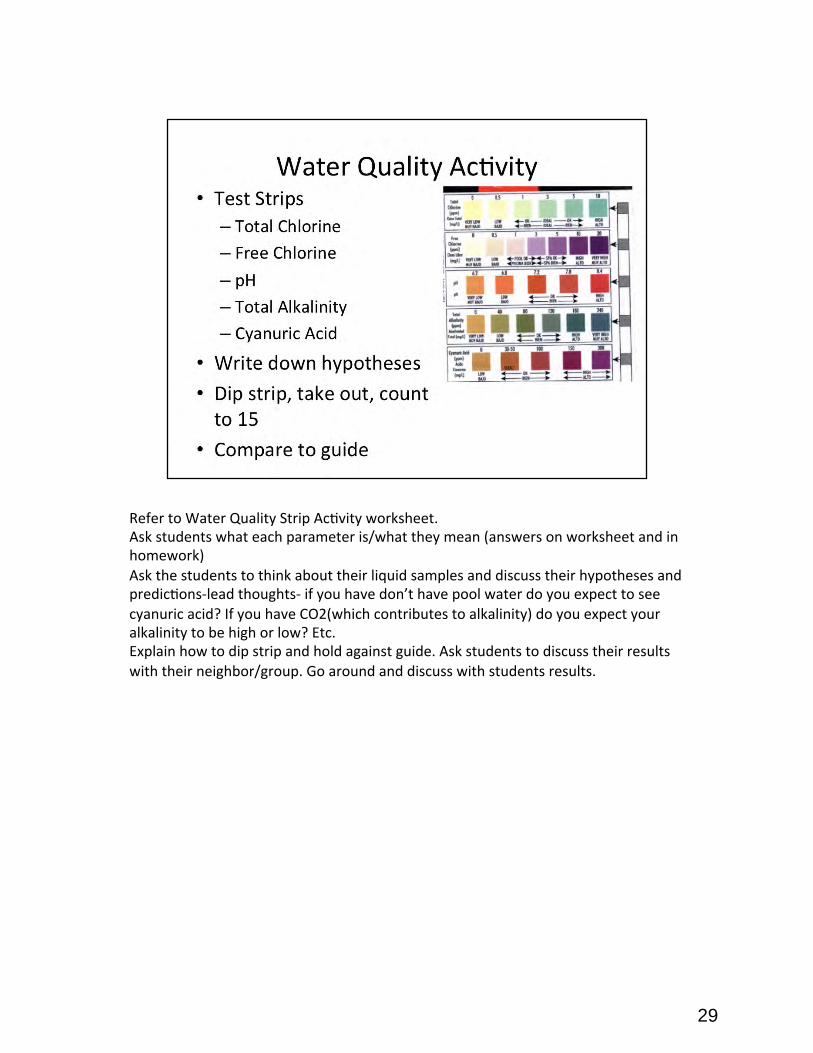
Refer to Water Quality Strip Ac.vity worksheet. Ask students what each parameter is/what they mean (answers on worksheet and in homework) Ask the students to think about their liquid samples and discuss their hypotheses and predic.ons-‐lead thoughts-‐ if you have don’t have pool water do you expect to see cyanuric acid? If you have CO2(which contributes to alkalinity) do you expect your alkalinity to be high or low? Etc. Explain how to dip strip and hold against guide. Ask students to discuss their results with their neighbor/group. Go around and discuss with students results.
29
30
&RPSDUWPHQW�%DJ�7HVW��,QVWUXFWLRQV�IRU�8VH
7gkW][dnIW\[�mWj[h�\eh�Wdoed["�Wdom^[h["�Wdoj_c[
.LW�&RPSRQHQWV &RPSDUWPHQW�%DJ�9ROXPHV
����P/
����P/
����P/
���P/
���P/
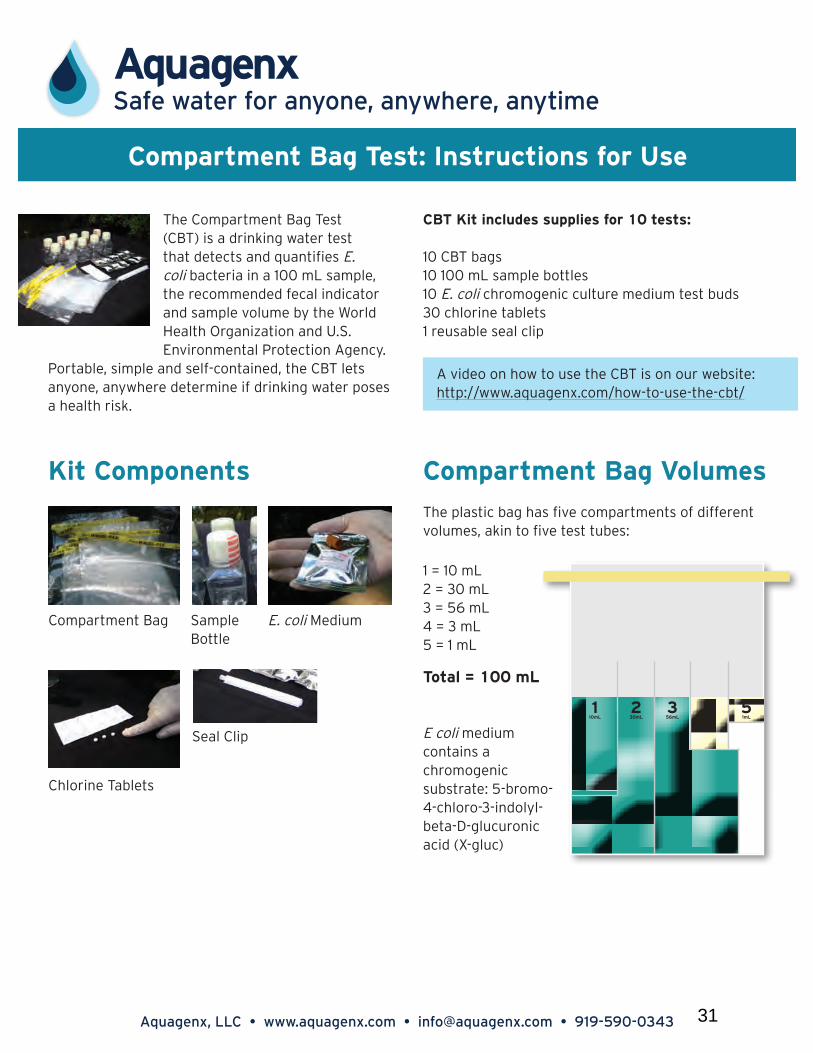
J^[�9ecfWhjc[dj�8W]�J[ij��98J��_i�W�Zh_da_d]�mWj[h�j[ij�j^Wj�Z[j[Yji�WdZ�gkWdj_Ó[i�;$�Yeb_�XWYj[h_W�_d�W�'&&�cB�iWcfb["�j^[�h[Yecc[dZ[Z�\[YWb�_dZ_YWjeh�WdZ�iWcfb[�lebkc[�Xo�j^[�MehbZ�>[Wbj^�Eh]Wd_pWj_ed�WdZ�K$I$�;dl_hedc[djWb�Fhej[Yj_ed�7][dYo$�
FehjWXb["�i_cfb[�WdZ�i[b\#YedjW_d[Z"�j^[�98J�b[ji�Wdoed["�Wdom^[h[�Z[j[hc_d[�_\�Zh_da_d]�mWj[h�fei[i�W�^[Wbj^�h_ia$
98J�A_j�_dYbkZ[i�ikffb_[i�\eh�'&�j[iji0���
'&�98J�XW]i'&�'&&�cB�iWcfb[�Xejjb[i'&�;$�Yeb_�Y^hece][d_Y�Ykbjkh[�c[Z_kc�j[ij�XkZi)&�Y^beh_d[�jWXb[ji'�h[kiWXb[�i[Wb�Yb_f
7�l_Z[e�ed�^em�je�ki[�j^[�98J�_i�ed�ekh�m[Xi_j[0�^jjf0%%mmm$WgkW][dn$Yec%^em#je#ki[#j^[#YXj%
9ecfWhjc[dj�8W]
9^beh_d[�JWXb[ji
I[Wb�9b_f
IWcfb[�8ejjb[
;$�Yeb_�C[Z_kc
J^[�fbWij_Y�XW]�^Wi�Ól[�YecfWhjc[dji�e\�Z_\\[h[dj�lebkc[i"�Wa_d�je�Ól[�j[ij�jkX[i0
'�3�'&�cB(�3�)&�cB)�3�+,�cB*�3�)�cB+�3�'�cB
JejWb�3�'&&�cB
;�Yeb_�c[Z_kc�YedjW_di�W�Y^hece][d_Y�ikXijhWj[0�+#Xhece#*#Y^behe#)#_dZebob#X[jW#:#]bkYkhed_Y�WY_Z��N#]bkY�
$TXDJHQ[��//&��v��ZZZ�DTXDJHQ[�FRP��v��LQIR#DTXDJHQ[�FRP��v�������������� 31
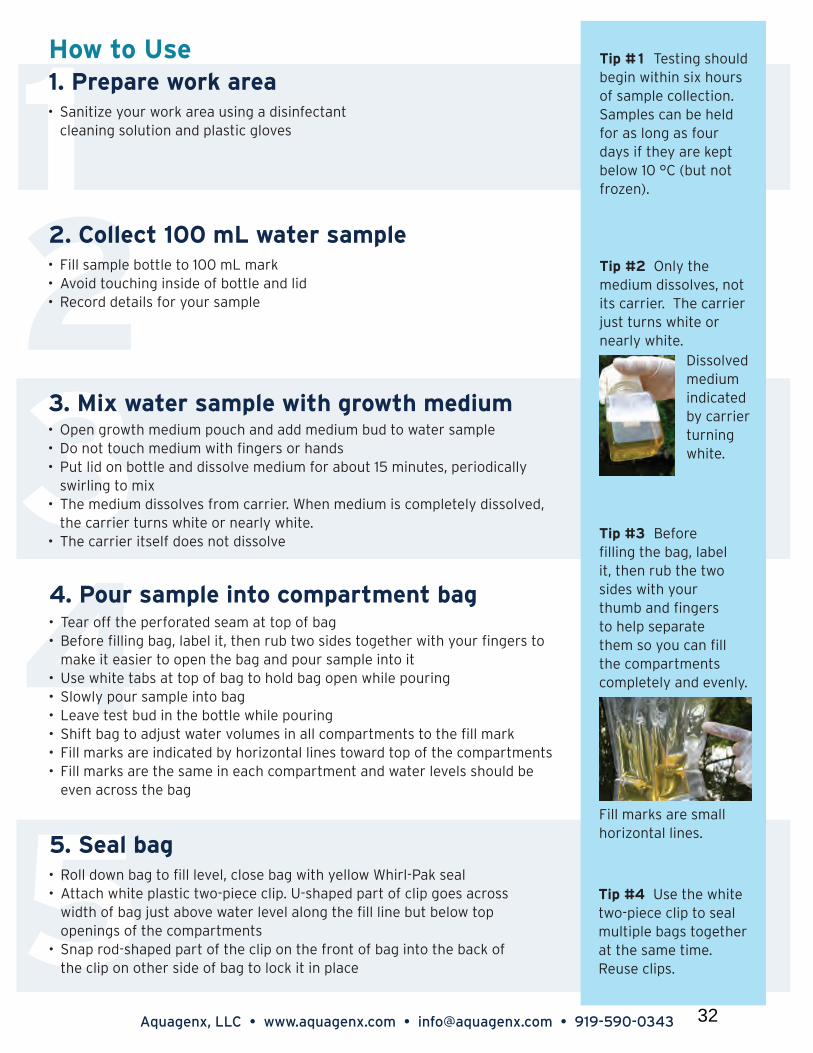
����3UHSDUH�ZRUN�DUHD�� IWd_j_p[�oekh�meha�Wh[W�ki_d]�W�Z_i_d\[YjWdj�Yb[Wd_d]�iebkj_ed�WdZ�fbWij_Y�]bel[i
����6HDO�EDJ�� Hebb�Zemd�XW]�je�Óbb�b[l[b"�Ybei[�XW]�m_j^�o[bbem�M^_hb#FWa�i[Wb��� 7jjWY^�m^_j[�fbWij_Y�jme#f_[Y[�Yb_f$�K#i^Wf[Z�fWhj�e\�Yb_f�]e[i�WYheii�m_Zj^�e\�XW]�`kij�WXel[�mWj[h�b[l[b�Wbed]�j^[�Óbb�b_d[�Xkj�X[bem�jef�ef[d_d]i�e\�j^[�YecfWhjc[dji�
�� IdWf�heZ#i^Wf[Z�fWhj�e\�j^[�Yb_f�ed�j^[�\hedj�e\�XW]�_dje�j^[�XWYa�e\�j^[�Yb_f�ed�ej^[h�i_Z[�e\�XW]�je�beYa�_j�_d�fbWY[
$TXDJHQ[��//&��v��ZZZ�DTXDJHQ[�FRP��v��LQIR#DTXDJHQ[�FRP��v��������������
+RZ�WR�8VH
����&ROOHFW�����P/�ZDWHU�VDPSOH�� <_bb�iWcfb[�Xejjb[�je�'&&�cB�cWha��� 7le_Z�jekY^_d]�_di_Z[�e\�Xejjb[�WdZ�b_Z�� H[YehZ�Z[jW_bi�\eh�oekh�iWcfb[
����0L[�ZDWHU�VDPSOH�ZLWK�JURZWK�PHGLXP�� Ef[d�]hemj^�c[Z_kc�fekY^�WdZ�WZZ�c[Z_kc�XkZ�je�mWj[h�iWcfb[���� :e�dej�jekY^�c[Z_kc�m_j^�Ód][hi�eh�^WdZi�� Fkj�b_Z�ed�Xejjb[�WdZ�Z_iiebl[�c[Z_kc�\eh�WXekj�'+�c_dkj[i"�f[h_eZ_YWbbo�im_hb_d]�je�c_n��
�� J^[�c[Z_kc�Z_iiebl[i�\hec�YWhh_[h$�M^[d�c[Z_kc�_i�Yecfb[j[bo�Z_iiebl[Z"�j^[�YWhh_[h�jkhdi�m^_j[�eh�d[Whbo�m^_j[$��
�� J^[�YWhh_[h�_ji[b\�Ze[i�dej�Z_iiebl[
����3RXU�VDPSOH�LQWR�FRPSDUWPHQW�EDJ�� J[Wh�e\\�j^[�f[h\ehWj[Z�i[Wc�Wj�jef�e\�XW]���� 8[\eh[�Óbb_d]�XW]"�bWX[b�_j"�j^[d�hkX�jme�i_Z[i�je][j^[h�m_j^�oekh�Ód][hi�je�cWa[�_j�[Wi_[h�je�ef[d�j^[�XW]�WdZ�fekh�iWcfb[�_dje�_j
�� Ki[�m^_j[�jWXi�Wj�jef�e\�XW]�je�^ebZ�XW]�ef[d�m^_b[�fekh_d]��� Ibembo�fekh�iWcfb[�_dje�XW]�� B[Wl[�j[ij�XkZ�_d�j^[�Xejjb[�m^_b[�fekh_d]�� I^_\j�XW]�je�WZ`kij�mWj[h�lebkc[i�_d�Wbb�YecfWhjc[dji�je�j^[�Óbb�cWha����� <_bb�cWhai�Wh[�_dZ_YWj[Z�Xo�^eh_pedjWb�b_d[i�jemWhZ�jef�e\�j^[�YecfWhjc[dji�� <_bb�cWhai�Wh[�j^[�iWc[�_d�[WY^�YecfWhjc[dj�WdZ�mWj[h�b[l[bi�i^ekbZ�X[�[l[d�WYheii�j^[�XW]
J_f��'��J[ij_d]�i^ekbZ�X[]_d�m_j^_d�i_n�^ekhi�e\�iWcfb[�Yebb[Yj_ed$�IWcfb[i�YWd�X[�^[bZ�\eh�Wi�bed]�Wi�\ekh�ZWoi�_\�j^[o�Wh[�a[fj�X[bem�'&��9��Xkj�dej�\hep[d�$
J_f��(��Edbo�j^[�c[Z_kc�Z_iiebl[i"�dej�_ji�YWhh_[h$��J^[�YWhh_[h�`kij�jkhdi�m^_j[�eh�d[Whbo�m^_j[$
:_iiebl[Z�c[Z_kc�_dZ_YWj[Z�Xo�YWhh_[h�jkhd_d]�m^_j[$
J_f��)��8[\eh[�Óbb_d]�j^[�XW]"�bWX[b�_j"�j^[d�hkX�j^[�jme�i_Z[i�m_j^�oekh�j^kcX�WdZ�Ód][hi�je�^[bf�i[fWhWj[�j^[c�ie�oek�YWd�Óbb�j^[�YecfWhjc[dji�Yecfb[j[bo�WdZ�[l[dbo$��
<_bb�cWhai�Wh[�icWbb�^eh_pedjWb�b_d[i$
J_f��*��Ki[�j^[�m^_j[�jme#f_[Y[�Yb_f�je�i[Wb�ckbj_fb[�XW]i�je][j^[h�Wj�j^[�iWc[�j_c[$��H[ki[�Yb_fi$
32

����6FRUH�DQG�UHFRUG�WHVW�UHVXOWV�� O[bbem%o[bbem#Xhemd�_dZ_YWj[i�d[]Wj_l[��WXi[dY[��e\�;$�Yeb_"�8bk[%Xbk[#]h[[d�_dZ_YWj[i�fei_j_l[��fh[i[dY[��e\�;$�Yeb_
�� 9edY[djhWj_ed�e\�\[YWb�XWYj[h_W�_d�j^[�iWcfb[�_i�[ij_cWj[Z�\hec�j^[�YecX_dWj_ed�e\�fei_j_l[�WdZ�d[]Wj_l[�YecfWhjc[dji"�]_l_d]�W�Ceij�FheXWXb[�DkcX[h��CFD��[ij_cWj[�e\�;$�Yeb_�f[h�'&&�cB
�� Ki[�CFD�JWXb[�ed�d[nj�fW][�je�Z[j[hc_d[�;$�Yeb_�YedY[djhWj_ed�� H[YehZ�CFD�h[ikbj
$TXDJHQ[��//&��v��ZZZ�DTXDJHQ[�FRP��v��LQIR#DTXDJHQ[�FRP��v��������������
+HDOWK�5LVN�%DVHG�RQ�:RUOG�+HDOWK�2UJDQL]DWLRQ�*XLGHOLQHV�IRU�'ULQNLQJ�:DWHU�4XDOLW\������
>[Wbj^�H_ia�9Wj[]eho ;$�Yeb_�9<K �f[h�'&&�cB
IW\[ 2'
?dj[hc[Z_Wj[�H_ia%FheXWXbo�IW\[ '#'&
>_]^�H_ia%FheXWXbo�KdiW\[ 4'&#'&&
L[ho�>_]^�H_ia%KdiW\[ 4'&&
CFD�WdZ�9<K��Yebedo�\ehc_d]�kd_ji��Wh[�[gk_lWb[dj�j[hci"�Xkj�CFD�_i�eXjW_d[Z�_d�gkWdjWb�j[iji�ikY^�Wi�j^[�98J�WdZ�9<K�_i�eXjW_d[Z�_d�Yebedo#XWi[Z�j[iji�ikY^�Wi�c[cXhWd[�ÓbjhWj_ed$
J_f��+��?dYkXWj_d]�98Ji�Z[l[bef�Wd�eZeh$�M[�h[Yecc[dZ�fbWY_d]�98Ji�_d�Wdej^[h�i[Wb[Z�fbWij_Y�XW]�eh�_dikbWj[Z�YedjW_d[h�Zkh_d]�_dYkXWj_ed�f[h_eZ$
����,QFXEDWH�� ?dYkXWj[�j^[�i[Wb[Z�YecfWhjc[dj�XW]�\eh�XWYj[h_Wb�]hemj^�� ?dYkXWj_d]�Wj�WcX_[dj�j[cf[hWjkh[�_i�Ód[�\eh�j[cf[hWjkh[i�e\�(+�9�WdZ�WXel[$�<eh�j[cf[hWjkh[i�X[bem�(+�9"�ki[�Wd�_dikbWj[Z�YedjW_d[h�eh�fehjWXb[�_dYkXWjeh$��
?dYkXWj_ed�J_c[�WdZ�J[cf[hWjkh[�H[Yecc[dZWj_edi0�
)+#**$+�90� _dYkXWj[�(&#(*�^ekhi)&#)+�90� _dYkXWj[�(*#)&�^ekhi(+#)&�90� _dYkXWj[�*&#*.�^ekhi�
����'HFRQWDPLQDWH�� Ef[d�XW]�WdZ�WZZ�)�Y^beh_d[�jWXb[ji�je�jef�e\�XW]$�7]_jWj[�XW]�kdj_b�Y^beh_d[�jWXb[ji�Z_iiebl[$�B[j�XW]�ijWdZ�\eh�*+�c_dkj[i$�
�� 7\j[h�*+�c_dkj[i"�fekh�b_gk_Z�Yedj[dji�_dje�W�i_da"�je_b[j�eh�^eb[�_d�j^[�]hekdZ�WdZ�iW\[bo�Z_ifei[�e\�j^[�[cfjo�XW]
�� H[jW_d�m^_j[�fbWij_Y�Yb_f�\eh�h[ki[�
O[bbem%O[bbem#8hemd��3�7Xi[dY[�e\�;$�9eb_8bk[%8bk[#=h[[d��3�Fh[i[dY[�e\�;$�Yeb_
33
$TXDJHQ[��//&��v��ZZZ�DTXDJHQ[�FRP��v��LQIR#DTXDJHQ[�FRP��v��������������
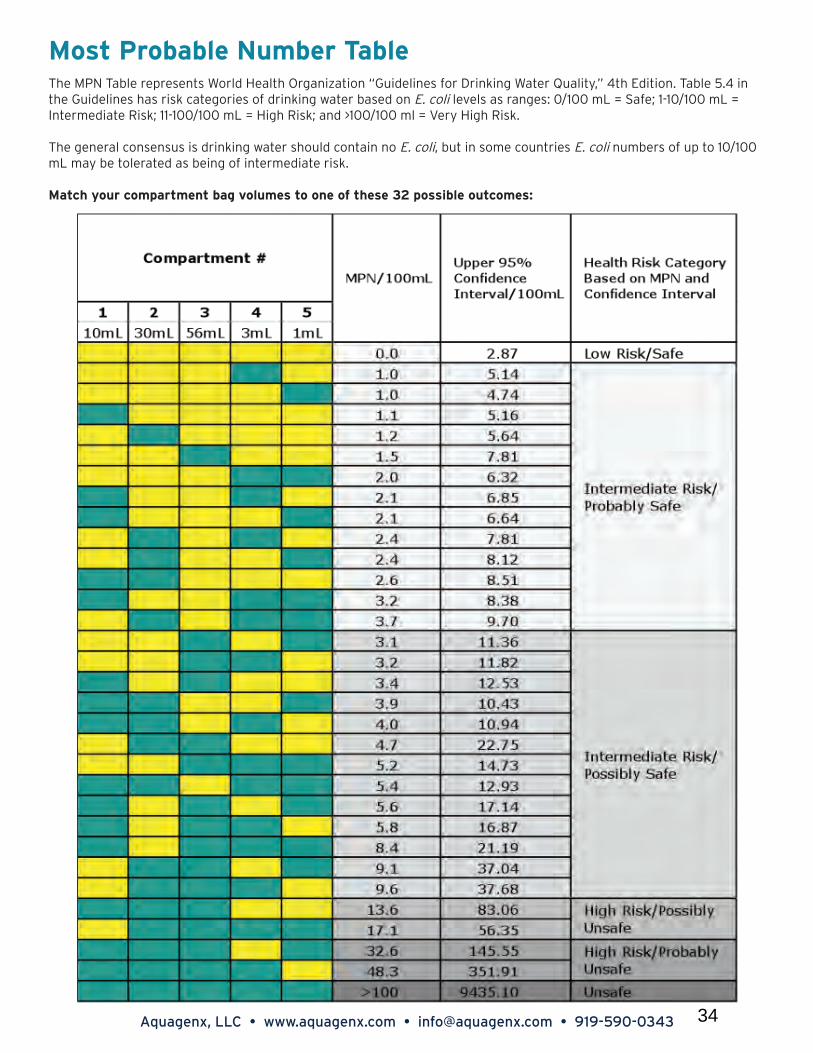
0RVW�3UREDEOH�1XPEHU�7DEOHJ^[�CFD�JWXb[�h[fh[i[dji�MehbZ�>[Wbj^�Eh]Wd_pWj_ed�Ç=k_Z[b_d[i�\eh�:h_da_d]�MWj[h�GkWb_jo"È�*j^�;Z_j_ed$�JWXb[�+$*�_d�j^[�=k_Z[b_d[i�^Wi�h_ia�YWj[]eh_[i�e\�Zh_da_d]�mWj[h�XWi[Z�ed�;$�Yeb_�b[l[bi�Wi�hWd][i0�&%'&&�cB�3�IW\[1�'#'&%'&&�cB�3�?dj[hc[Z_Wj[�H_ia1�''#'&&%'&&�cB�3�>_]^�H_ia1�WdZ�4'&&%'&&�cb�3�L[ho�>_]^�H_ia$�
J^[�][d[hWb�Yedi[diki�_i�Zh_da_d]�mWj[h�i^ekbZ�YedjW_d�de�;$�Yeb_"�Xkj�_d�iec[�Yekdjh_[i�;$�Yeb_�dkcX[hi�e\�kf�je�'&%'&&�cB�cWo�X[�jeb[hWj[Z�Wi�X[_d]�e\�_dj[hc[Z_Wj[�h_ia$
CWjY^�oekh�YecfWhjc[dj�XW]�lebkc[i�je�ed[�e\�j^[i[�)(�feii_Xb[�ekjYec[i0
34
Name, Liquid: __________________________ Hypotheses Results
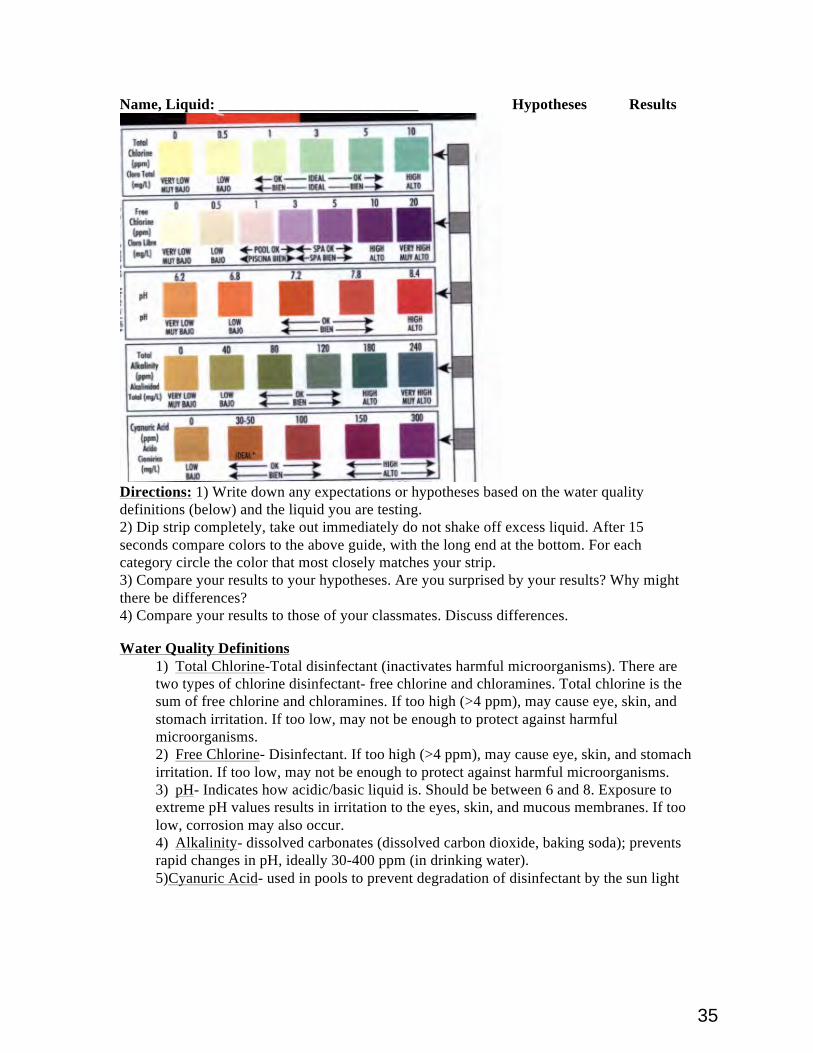
Directions: 1) Write down any expectations or hypotheses based on the water quality definitions (below) and the liquid you are testing. 2) Dip strip completely, take out immediately do not shake off excess liquid. After 15 seconds compare colors to the above guide, with the long end at the bottom. For each category circle the color that most closely matches your strip. 3) Compare your results to your hypotheses. Are you surprised by your results? Why might there be differences? 4) Compare your results to those of your classmates. Discuss differences. Water Quality Definitions
1) Total Chlorine-Total disinfectant (inactivates harmful microorganisms). There are two types of chlorine disinfectant- free chlorine and chloramines. Total chlorine is the sum of free chlorine and chloramines. If too high (>4 ppm), may cause eye, skin, and stomach irritation. If too low, may not be enough to protect against harmful microorganisms. 2) Free Chlorine- Disinfectant. If too high (>4 ppm), may cause eye, skin, and stomach irritation. If too low, may not be enough to protect against harmful microorganisms. 3) pH- Indicates how acidic/basic liquid is. Should be between 6 and 8. Exposure to extreme pH values results in irritation to the eyes, skin, and mucous membranes. If too low, corrosion may also occur. 4) Alkalinity- dissolved carbonates (dissolved carbon dioxide, baking soda); prevents rapid changes in pH, ideally 30-400 ppm (in drinking water). 5)Cyanuric Acid- used in pools to prevent degradation of disinfectant by the sun light
35
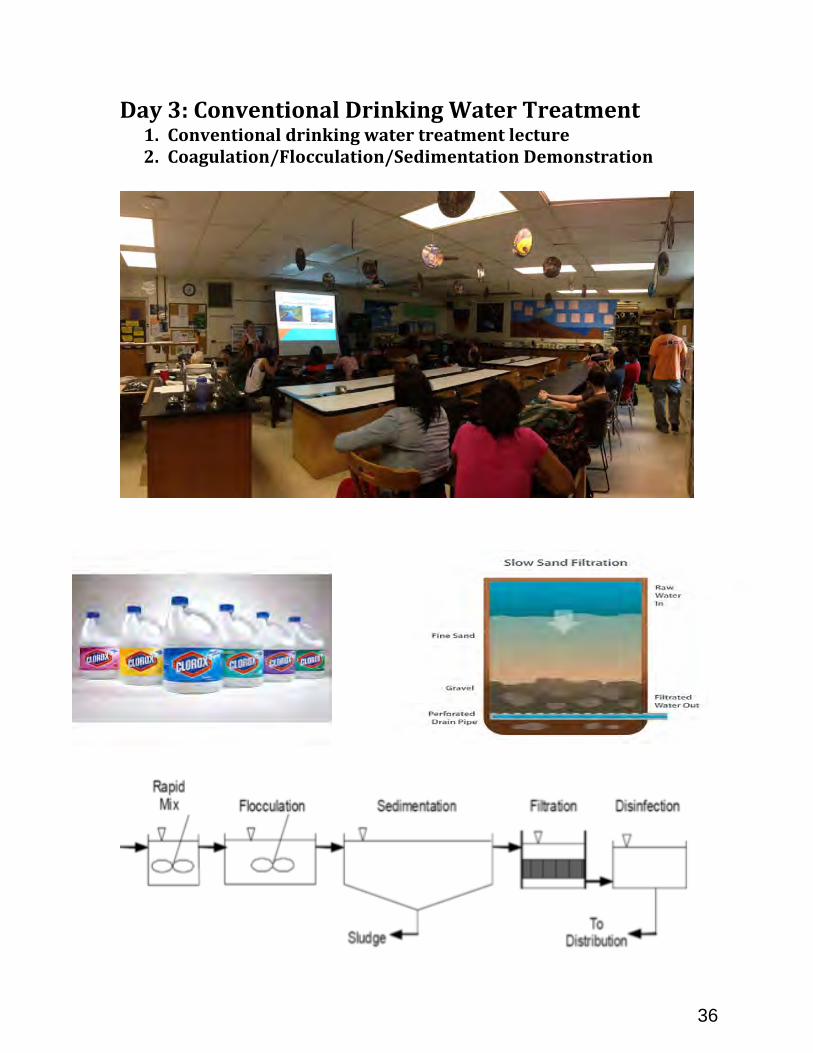
Day$3:$Conventional$Drinking$Water$Treatment$1. Conventional$drinking$water$treatment$lecture$2. Coagulation/Flocculation/Sedimentation$Demonstration$$
36
Today I’ll be expanding on what was discussed yesterday. So before we get started, can you all tell me some of the things you remember from the previous lecture?
37
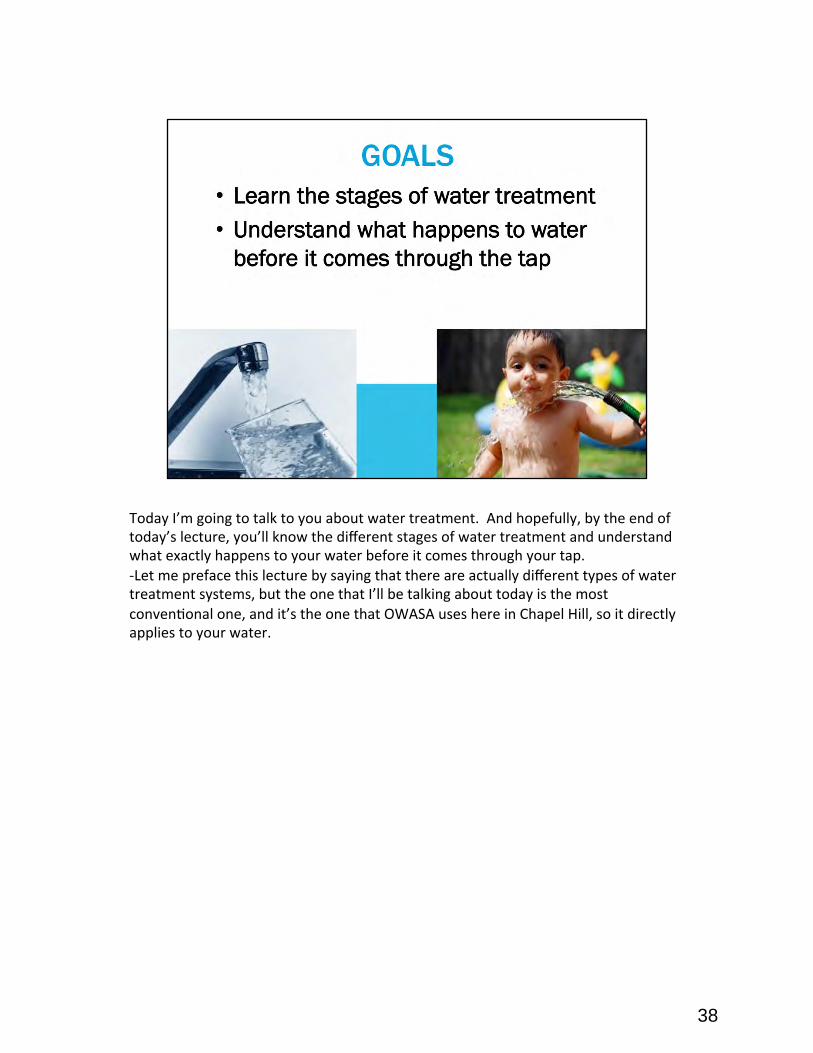
Today I’m going to talk to you about water treatment. And hopefully, by the end of today’s lecture, you’ll know the different stages of water treatment and understand what exactly happens to your water before it comes through your tap. -‐Let me preface this lecture by saying that there are actually different types of water treatment systems, but the one that I’ll be talking about today is the most convenEonal one, and it’s the one that OWASA uses here in Chapel Hill, so it directly applies to your water.
38
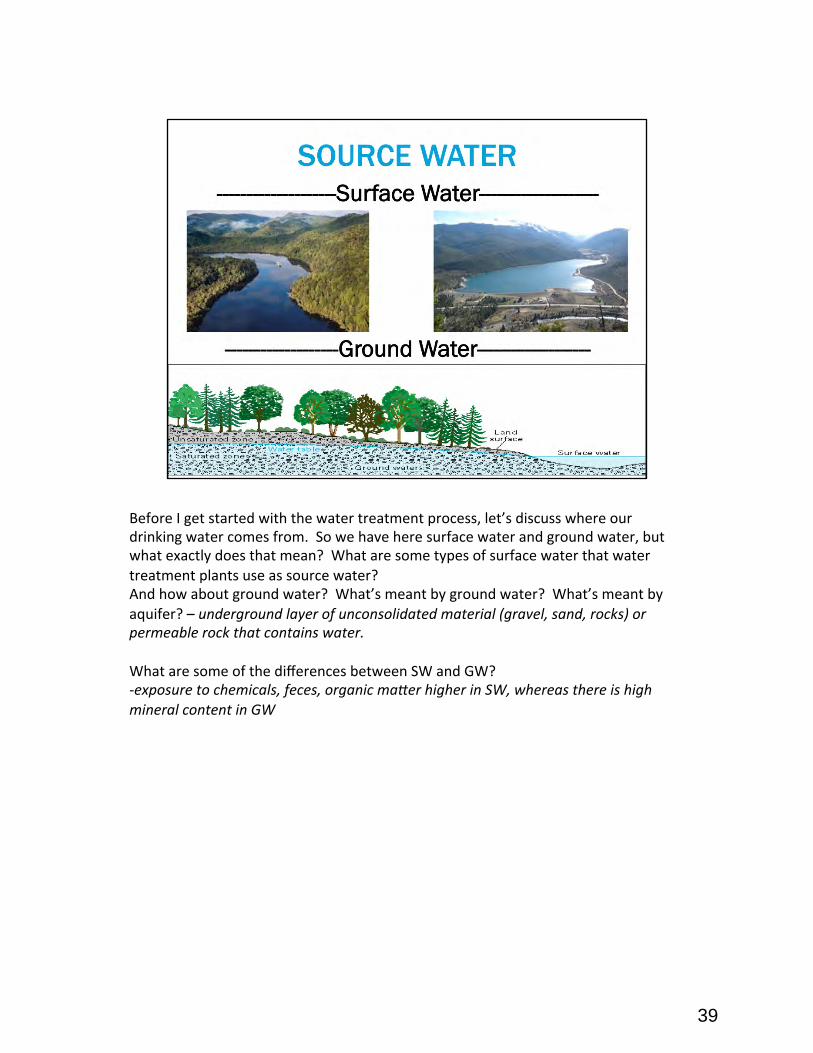
Before I get started with the water treatment process, let’s discuss where our drinking water comes from. So we have here surface water and ground water, but what exactly does that mean? What are some types of surface water that water treatment plants use as source water? And how about ground water? What’s meant by ground water? What’s meant by aquifer? – underground layer of unconsolidated material (gravel, sand, rocks) or permeable rock that contains water. What are some of the differences between SW and GW? -‐exposure to chemicals, feces, organic ma>er higher in SW, whereas there is high mineral content in GW
39
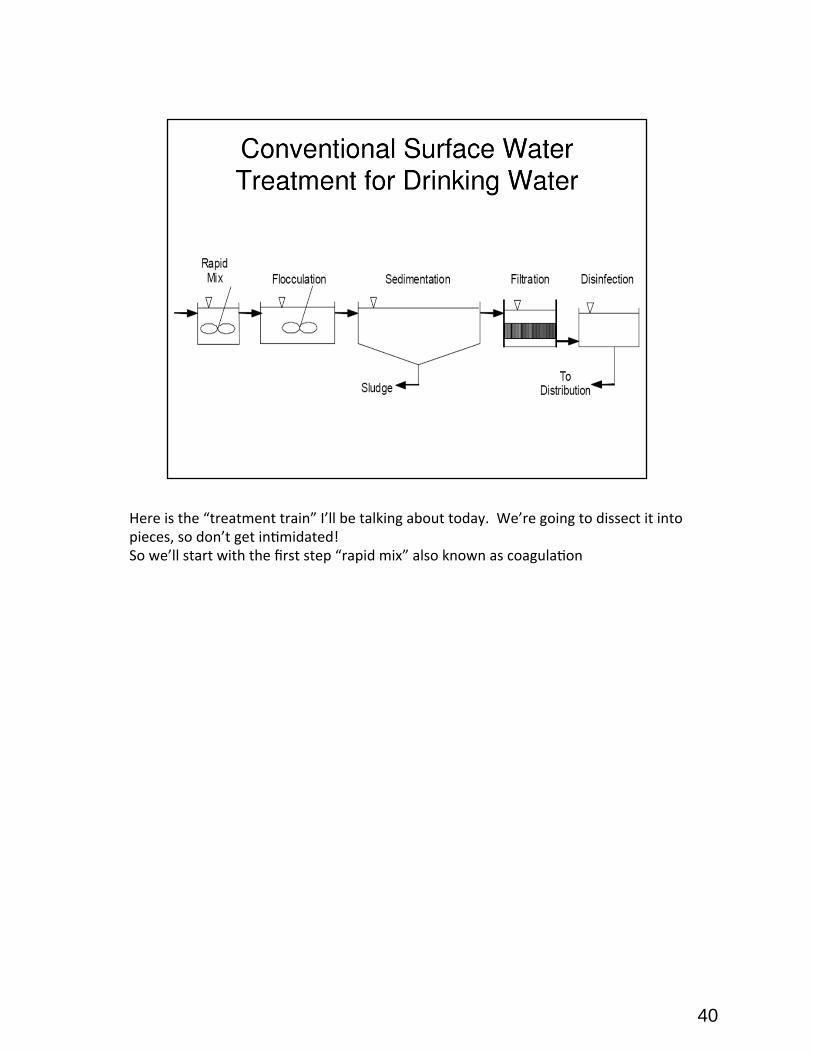
Here is the “treatment train” I’ll be talking about today. We’re going to dissect it into pieces, so don’t get inEmidated! So we’ll start with the first step “rapid mix” also known as coagulaEon
40
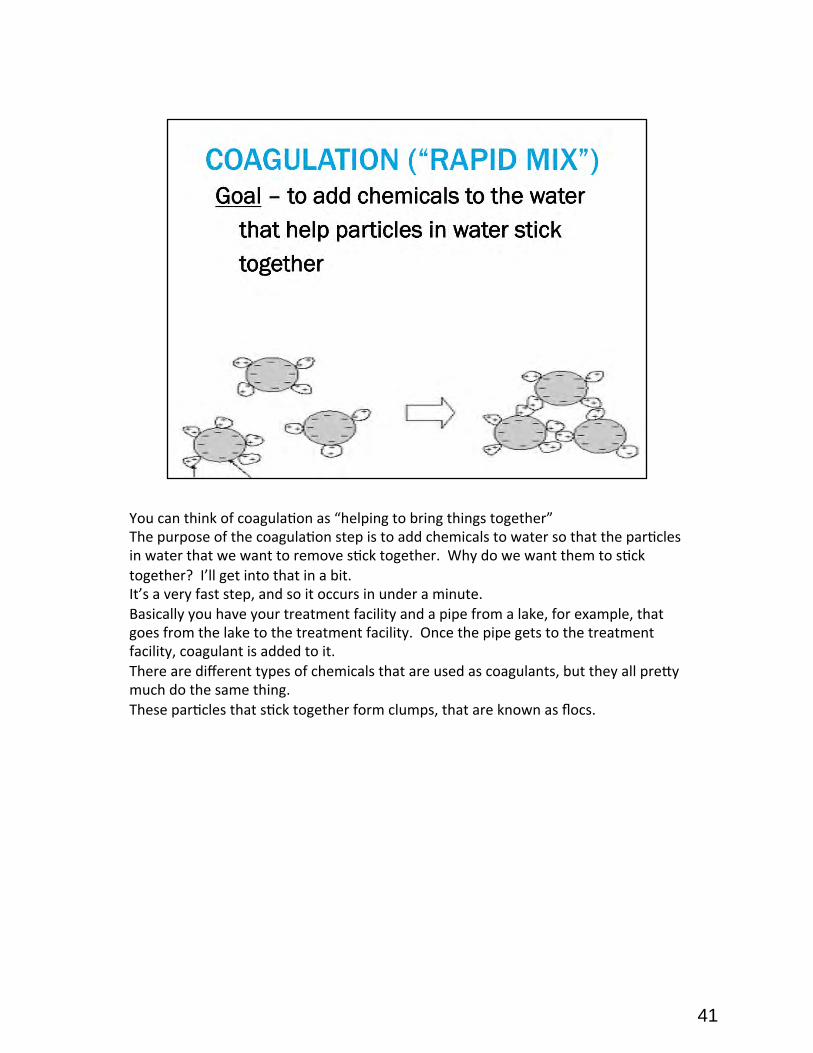
You can think of coagulaEon as “helping to bring things together” The purpose of the coagulaEon step is to add chemicals to water so that the parEcles in water that we want to remove sEck together. Why do we want them to sEck together? I’ll get into that in a bit. It’s a very fast step, and so it occurs in under a minute. Basically you have your treatment facility and a pipe from a lake, for example, that goes from the lake to the treatment facility. Once the pipe gets to the treatment facility, coagulant is added to it. There are different types of chemicals that are used as coagulants, but they all preVy much do the same thing. These parEcles that sEck together form clumps, that are known as flocs.
41

So what was the goal of coagulaEon again? EssenEally in coagulaEon you’re adding chemicals to the water that help the parEcles sEck together. The next step, logically then, is the act of the parEcles sEcking together. This step is called flocculaEon, because the small clumps of parEcles are called flocs. So coagulaEon happened in a pipe, right? Well flocculaEon actually happens in a big tank that has a mixer in it. Why do you think we need a mixer? (To get the water moving so that parCcles actually have a chance to interact) Do we want the mixing to be fast or slow? (We want it to be pre>y fast but not too fast. If it’s too slow the water won’t move enough. If it’s too fast they’ll hit each other too hard and break apart) Why do we want the parEcles to come together (to form bigger, heavier, denser parCcles so that they eventually sink).
42

So before I begin this next step, someone tell me what the purpose of flocculaEon was. And why did we want bigger parEcles? (We want these big parCcles to sink.) So that is the next step – the sinking of the parEcles. Which is called sedimentaEon. Which makes sense, right? SedimentaEon occurs naturally in lakes and rivers, when clay and rocks sink to the boVom of the water. It’s the same principle here. The flocs formed in the previous step are now heavy enough to sink and form sediment. This step also occurs in a tank, but there’s no mixing involved. Why do you think this step is so important? The picture will give you a hint. Compare the quality of water on the le\ to that on the right. Most of the pollutants that were floaEng in the water as flocs sink to the boVom. And what’s le\ is this clearer, cleaner water on top.
43
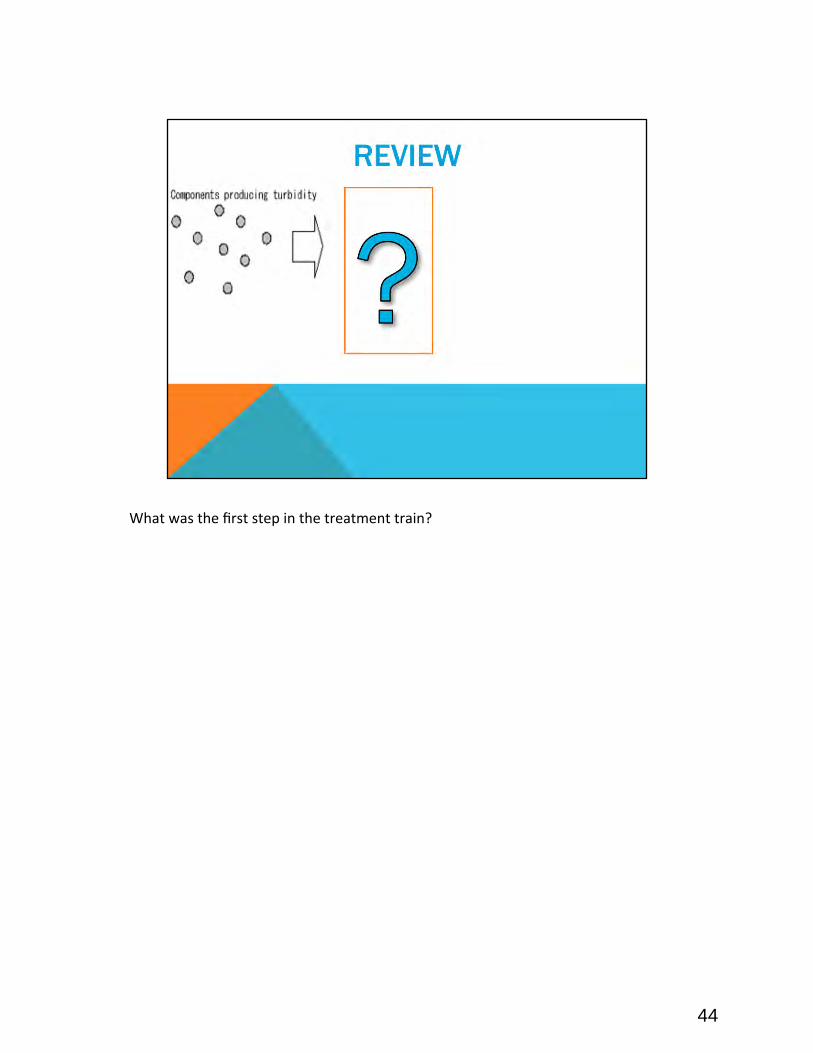
What was the first step in the treatment train?
44
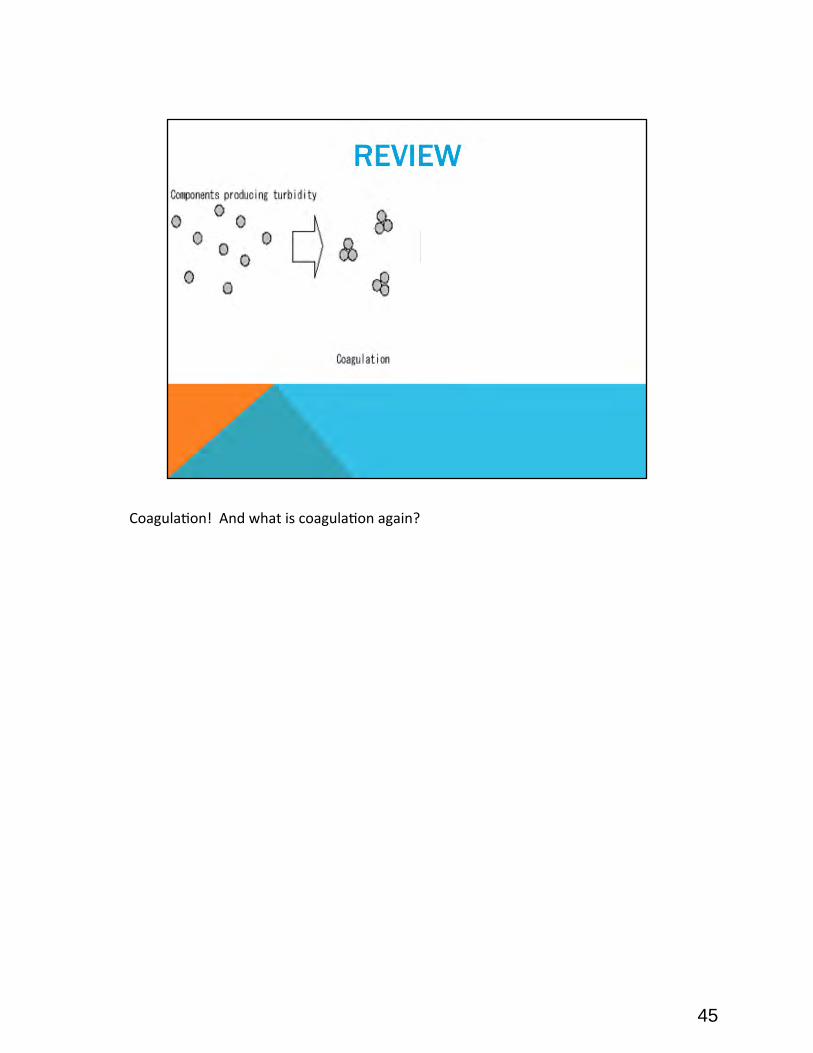
CoagulaEon! And what is coagulaEon again?
45
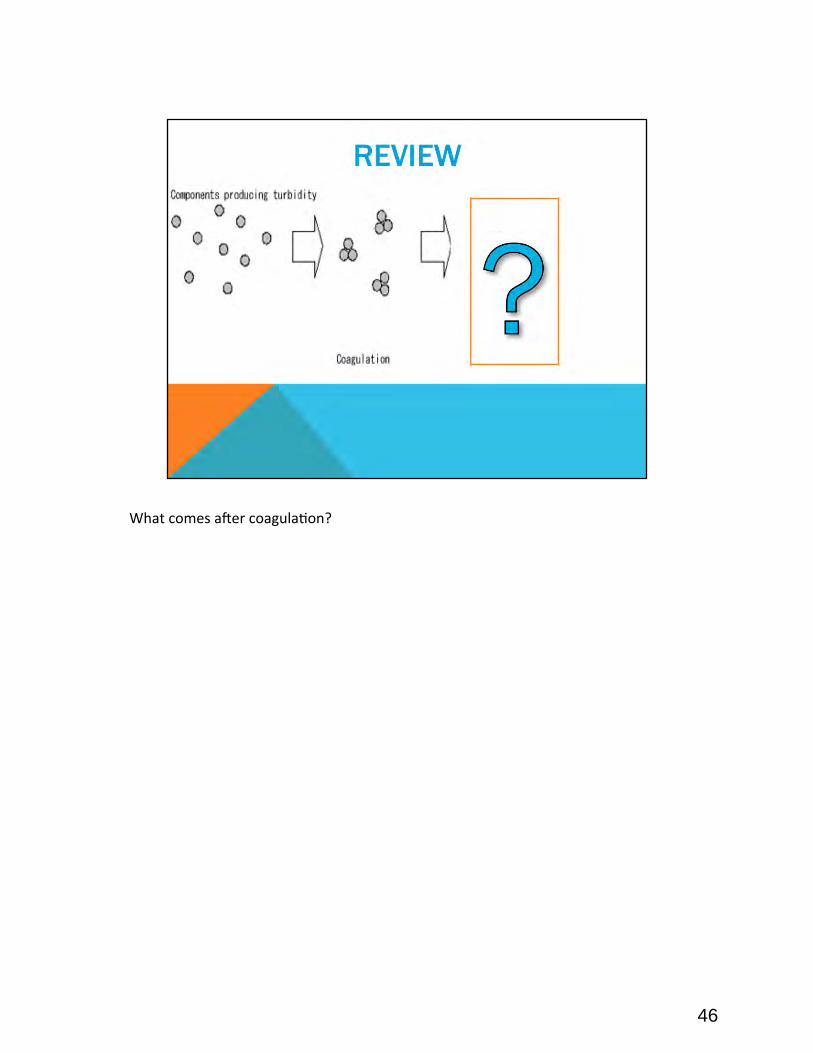
What comes a\er coagulaEon?
46
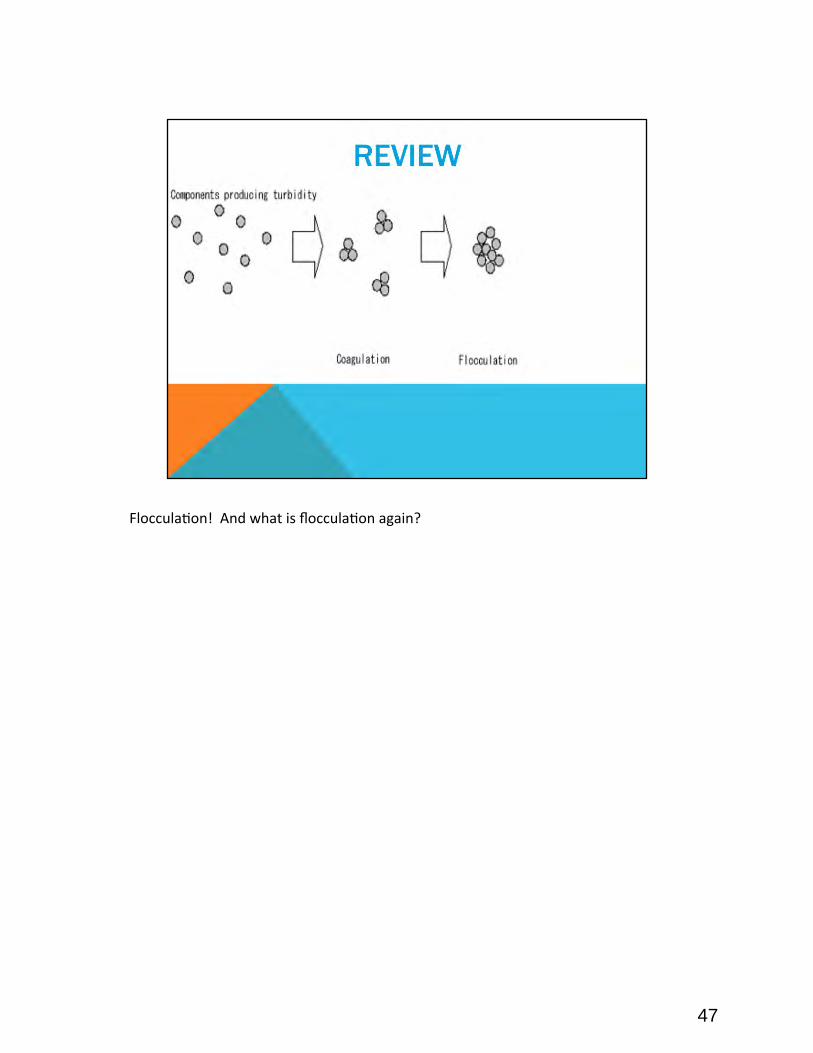
FlocculaEon! And what is flocculaEon again?
47

What comes a\er flocculaEon?
48
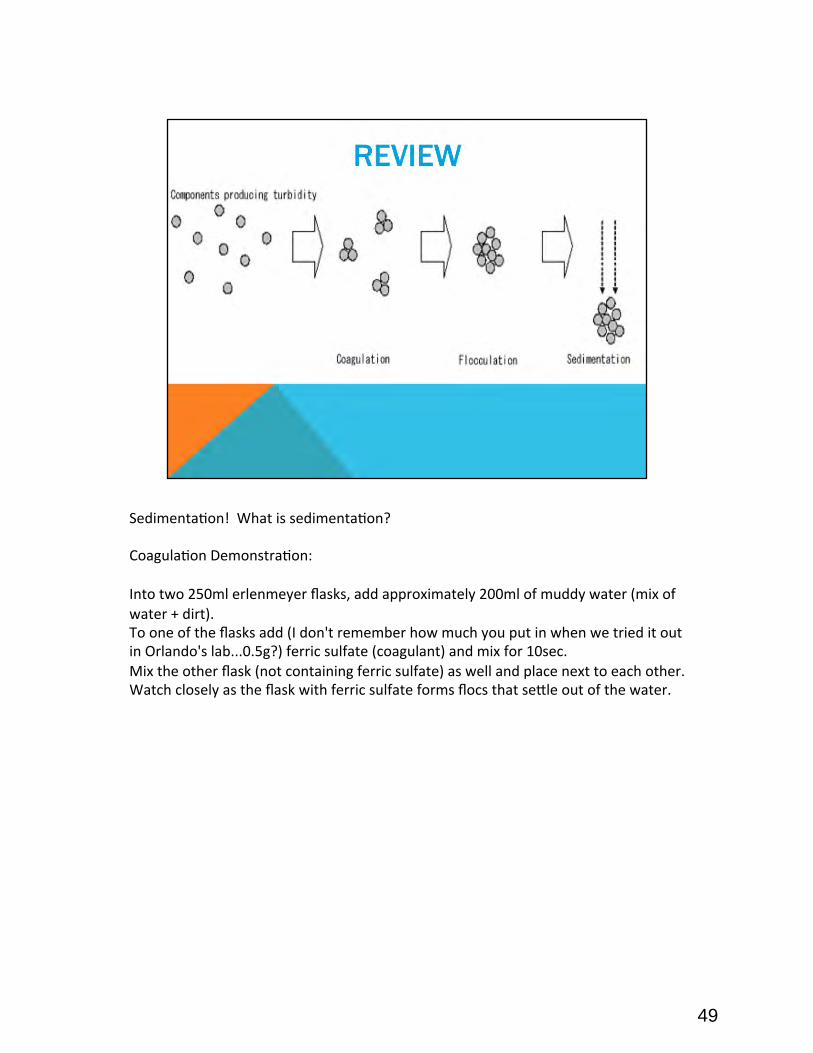
Sedimenta)on! What is sedimenta)on? Coagula)on Demonstra)on: Into two 250ml erlenmeyer flasks, add approximately 200ml of muddy water (mix of water + dirt). To one of the flasks add (I don't remember how much you put in when we tried it out in Orlando's lab...0.5g?) ferric sulfate (coagulant) and mix for 10sec. Mix the other flask (not containing ferric sulfate) as well and place next to each other. Watch closely as the flask with ferric sulfate forms flocs that seOle out of the water.
49
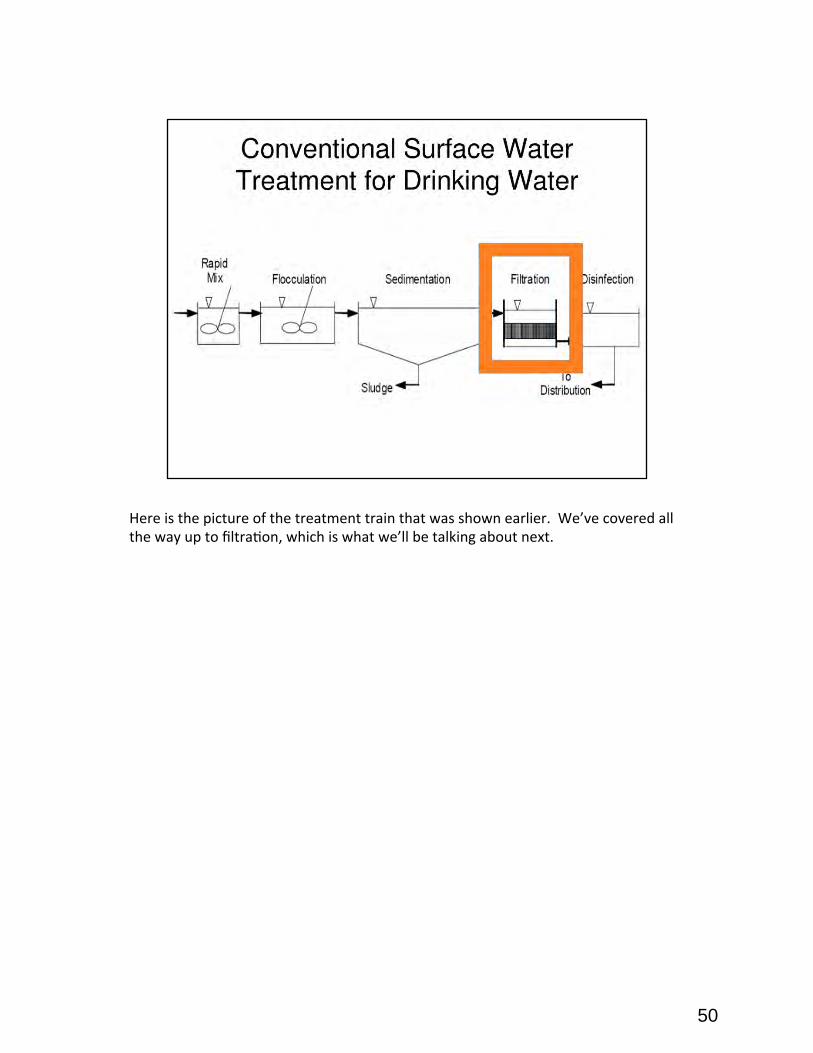
Here is the picture of the treatment train that was shown earlier. We’ve covered all the way up to filtraEon, which is what we’ll be talking about next.
50
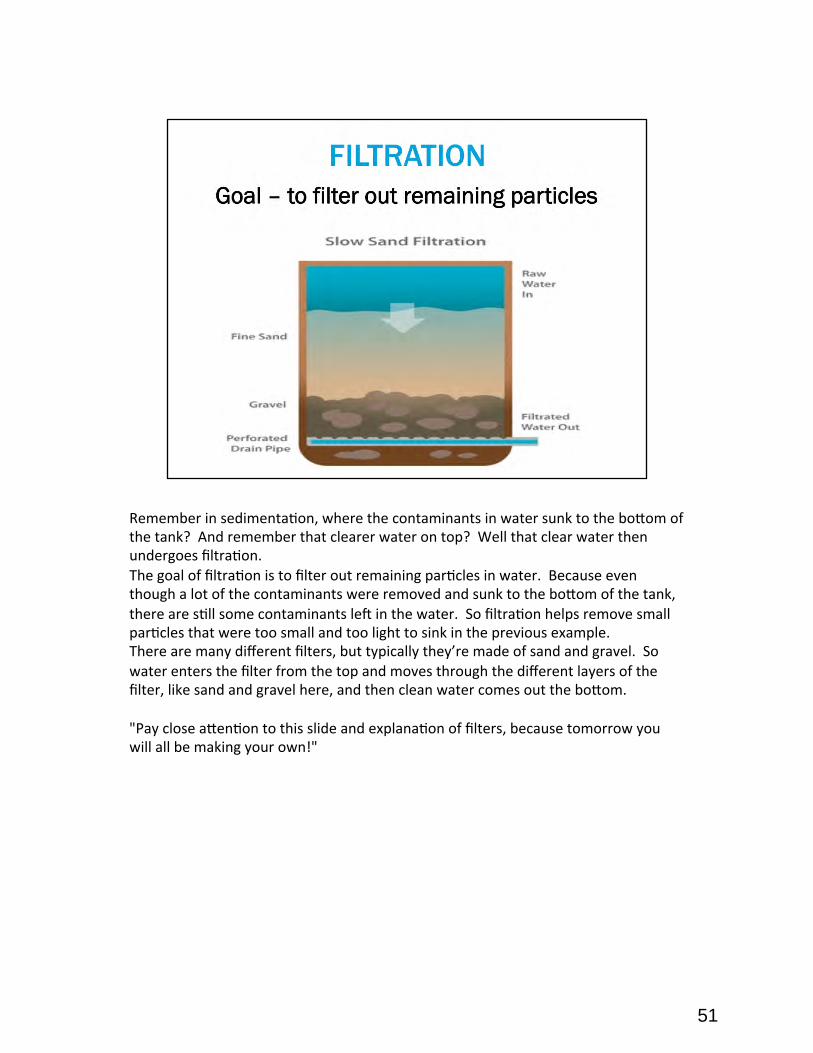
Remember in sedimentaEon, where the contaminants in water sunk to the boVom of the tank? And remember that clearer water on top? Well that clear water then undergoes filtraEon. The goal of filtraEon is to filter out remaining parEcles in water. Because even though a lot of the contaminants were removed and sunk to the boVom of the tank, there are sEll some contaminants le\ in the water. So filtraEon helps remove small parEcles that were too small and too light to sink in the previous example. There are many different filters, but typically they’re made of sand and gravel. So water enters the filter from the top and moves through the different layers of the filter, like sand and gravel here, and then clean water comes out the boVom. "Pay close aVenEon to this slide and explanaEon of filters, because tomorrow you will all be making your own!"
51
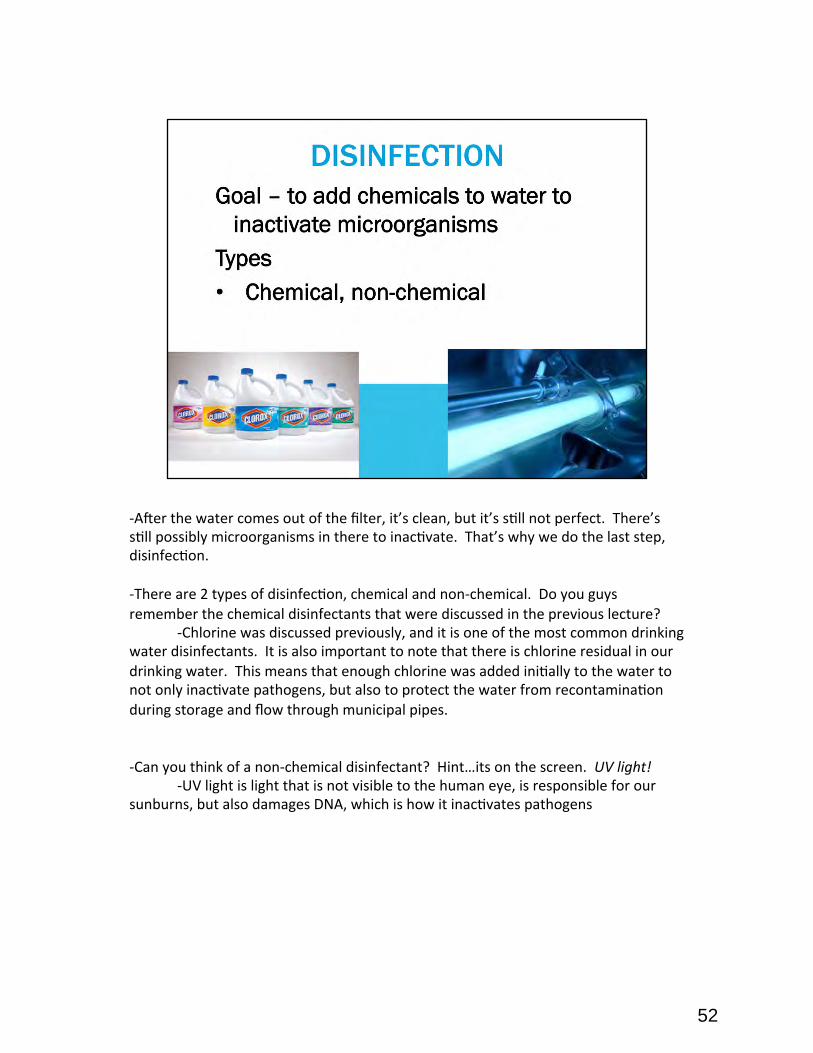
-‐A\er the water comes out of the filter, it’s clean, but it’s sEll not perfect. There’s sEll possibly microorganisms in there to inacEvate. That’s why we do the last step, disinfecEon. -‐There are 2 types of disinfecEon, chemical and non-‐chemical. Do you guys remember the chemical disinfectants that were discussed in the previous lecture?
-‐Chlorine was discussed previously, and it is one of the most common drinking water disinfectants. It is also important to note that there is chlorine residual in our drinking water. This means that enough chlorine was added iniEally to the water to not only inacEvate pathogens, but also to protect the water from recontaminaEon during storage and flow through municipal pipes. -‐Can you think of a non-‐chemical disinfectant? Hint…its on the screen. UV light!
-‐UV light is light that is not visible to the human eye, is responsible for our sunburns, but also damages DNA, which is how it inacEvates pathogens
52
53

Day 4: Multimedia Water Filter and Compartment Bag Test Results
1. Conventional Water Treatment Review Lecture with Filter Activity and Compartment Bag Test Part 2 Activity
2. Build-‐your-‐own multimedia filter activity handouts
54
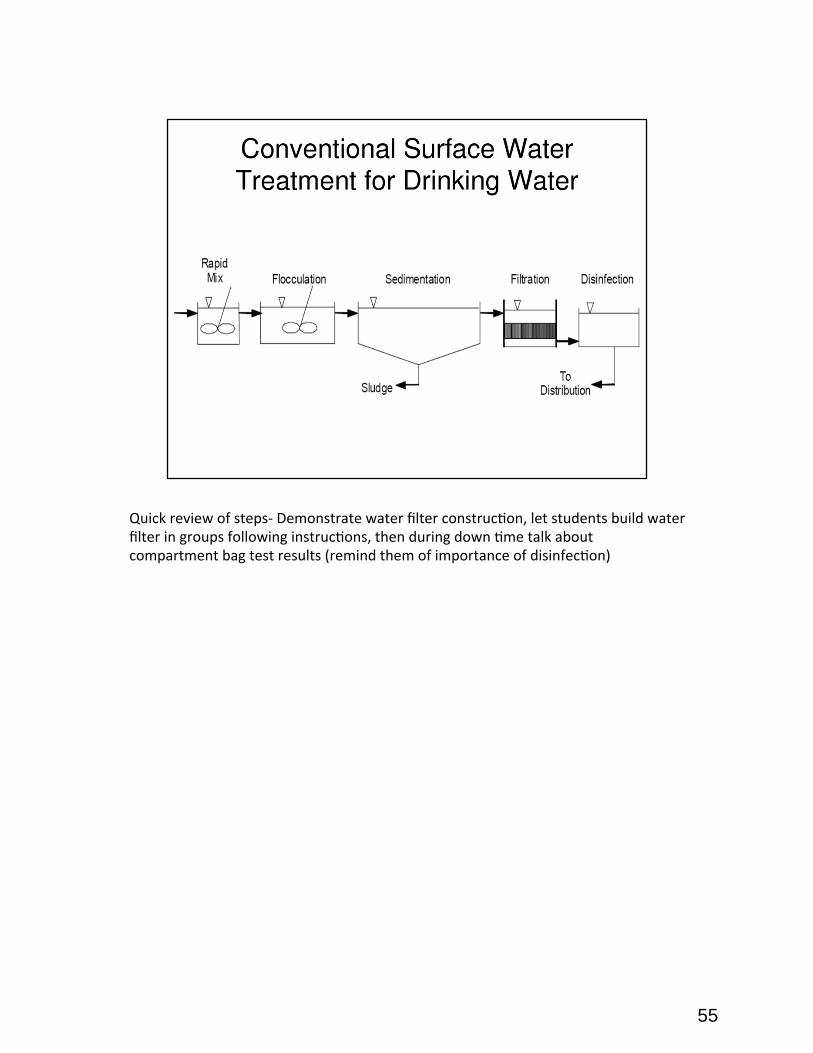
Quick review of steps-‐ Demonstrate water filter construc7on, let students build water filter in groups following instruc7ons, then during down 7me talk about compartment bag test results (remind them of importance of disinfec7on)
55
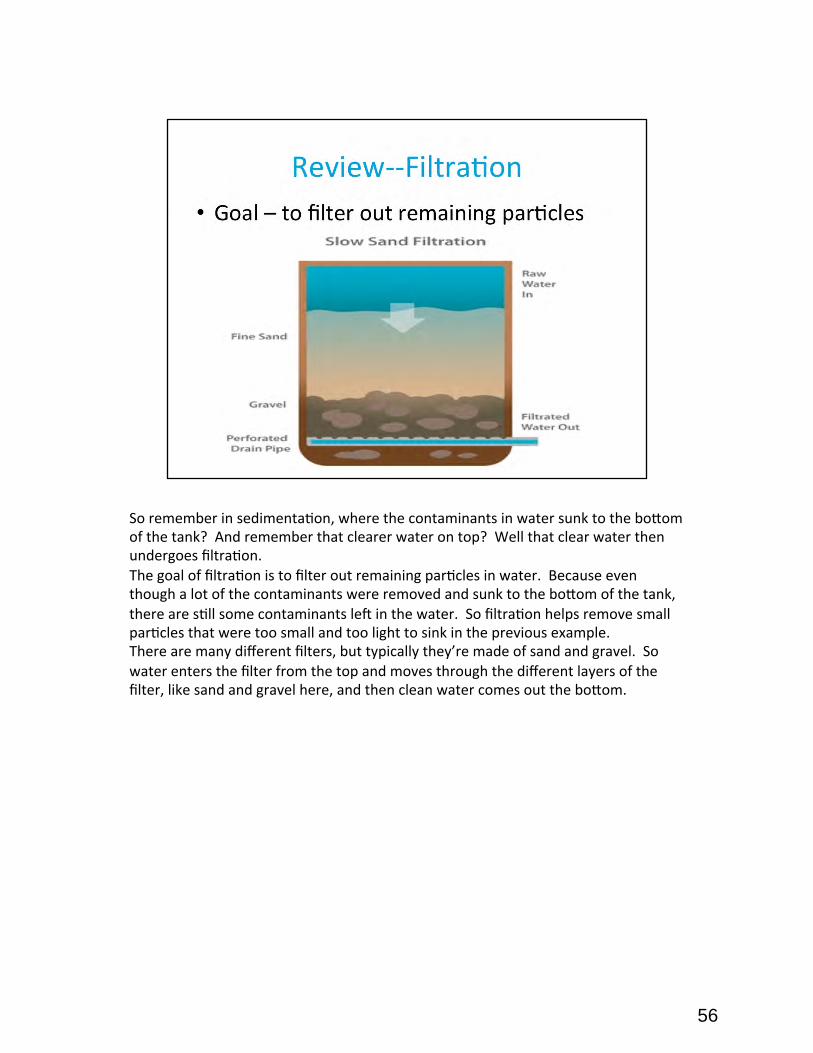
So remember in sedimenta7on, where the contaminants in water sunk to the boAom of the tank? And remember that clearer water on top? Well that clear water then undergoes filtra7on. The goal of filtra7on is to filter out remaining par7cles in water. Because even though a lot of the contaminants were removed and sunk to the boAom of the tank, there are s7ll some contaminants leH in the water. So filtra7on helps remove small par7cles that were too small and too light to sink in the previous example. There are many different filters, but typically they’re made of sand and gravel. So water enters the filter from the top and moves through the different layers of the filter, like sand and gravel here, and then clean water comes out the boAom.
56
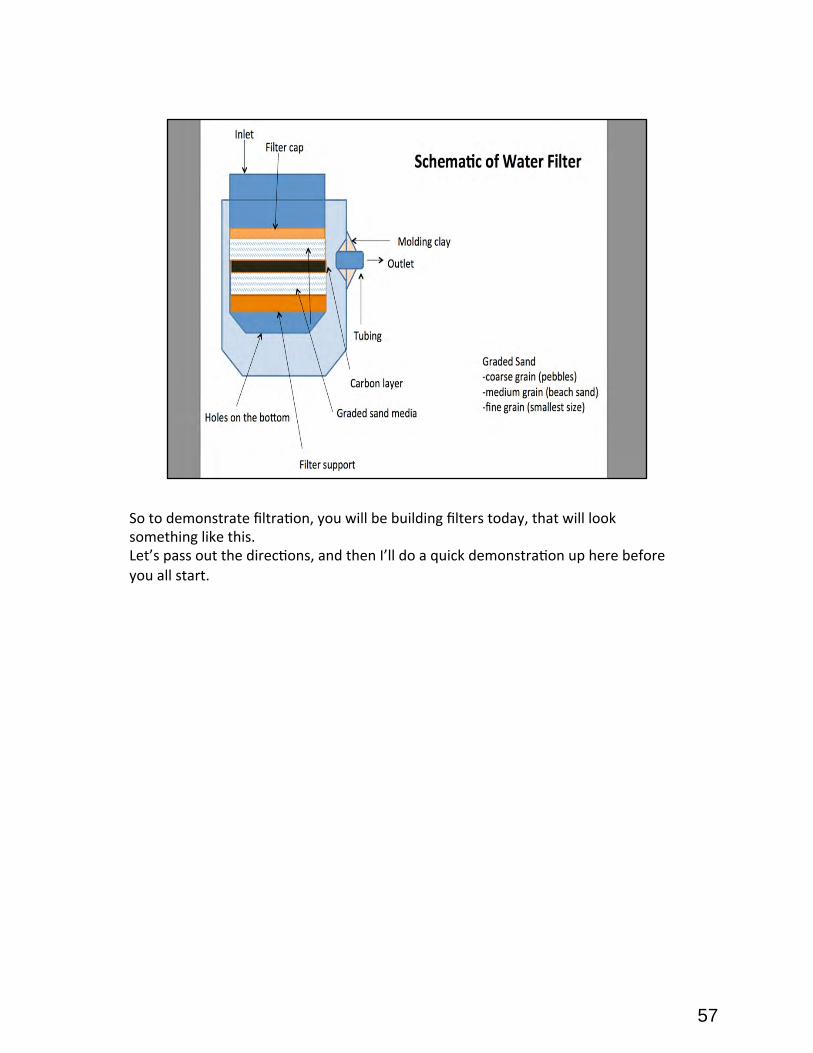
So to demonstrate filtra7on, you will be building filters today, that will look something like this. Let’s pass out the direc7ons, and then I’ll do a quick demonstra7on up here before you all start.
57
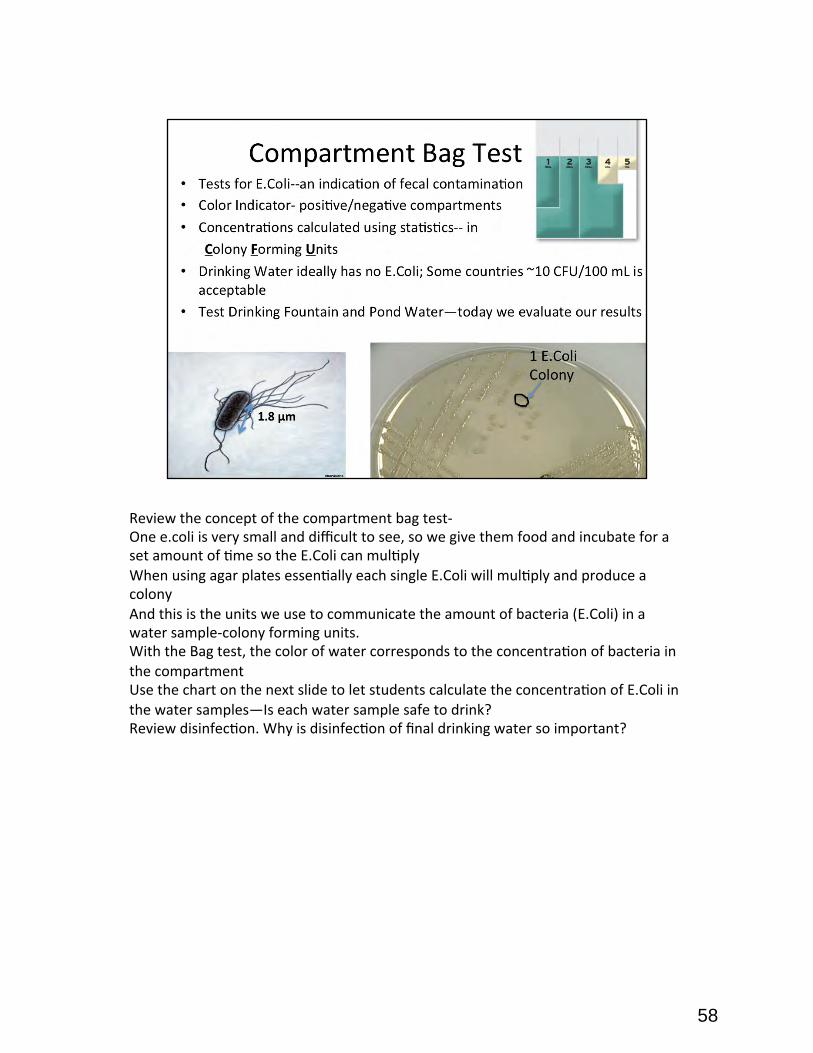
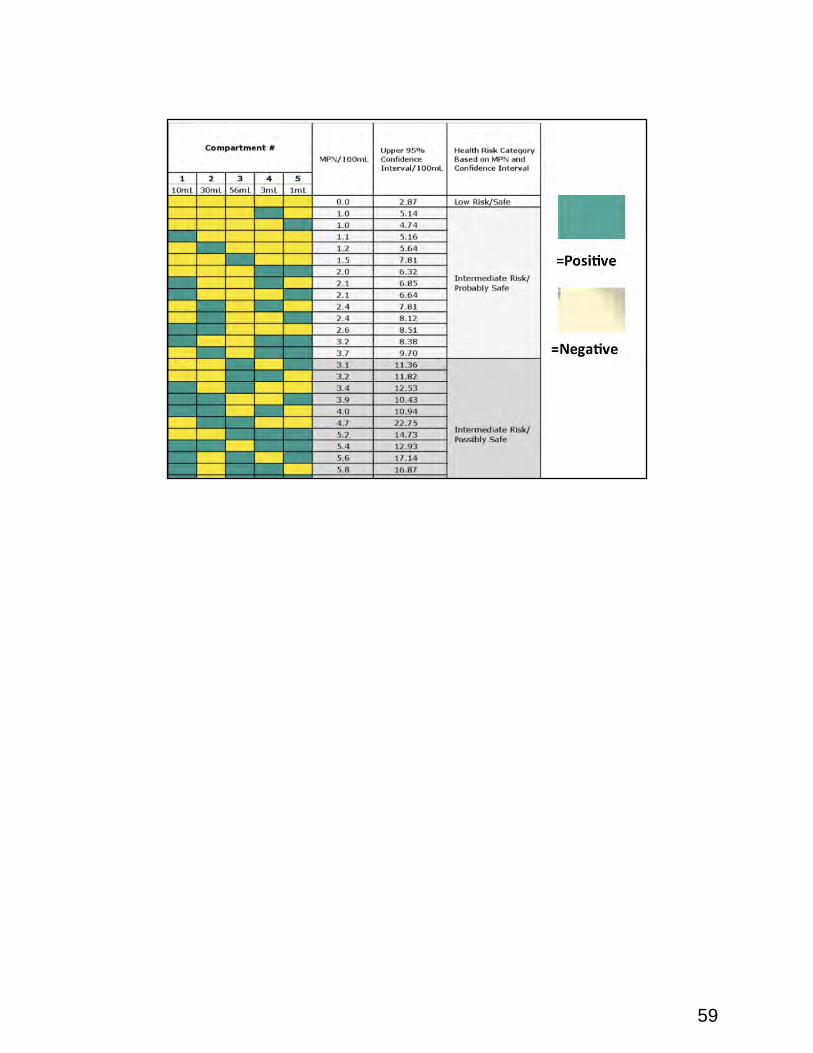
Review the concept of the compartment bag test-‐ One e.coli is very small and difficult to see, so we give them food and incubate for a set amount of 7me so the E.Coli can mul7ply When using agar plates essen7ally each single E.Coli will mul7ply and produce a colony And this is the units we use to communicate the amount of bacteria (E.Coli) in a water sample-‐colony forming units. With the Bag test, the color of water corresponds to the concentra7on of bacteria in the compartment Use the chart on the next slide to let students calculate the concentra7on of E.Coli in the water samples—Is each water sample safe to drink? Review disinfec7on. Why is disinfec7on of final drinking water so important?
58
59

Schema'c(of(Water(Filter(
Graded&Sand&)coarse&grain&(pebbles)&)medium&grain&(beach&sand)&)fine&grain&(smallest&size)&
Tubing&
Graded&sand&media&
Filter&cap&
Holes&on&the&bo=om&
Outlet&
Filter&support&
Molding&clay&
Inlet&
Carbon&layer&
60
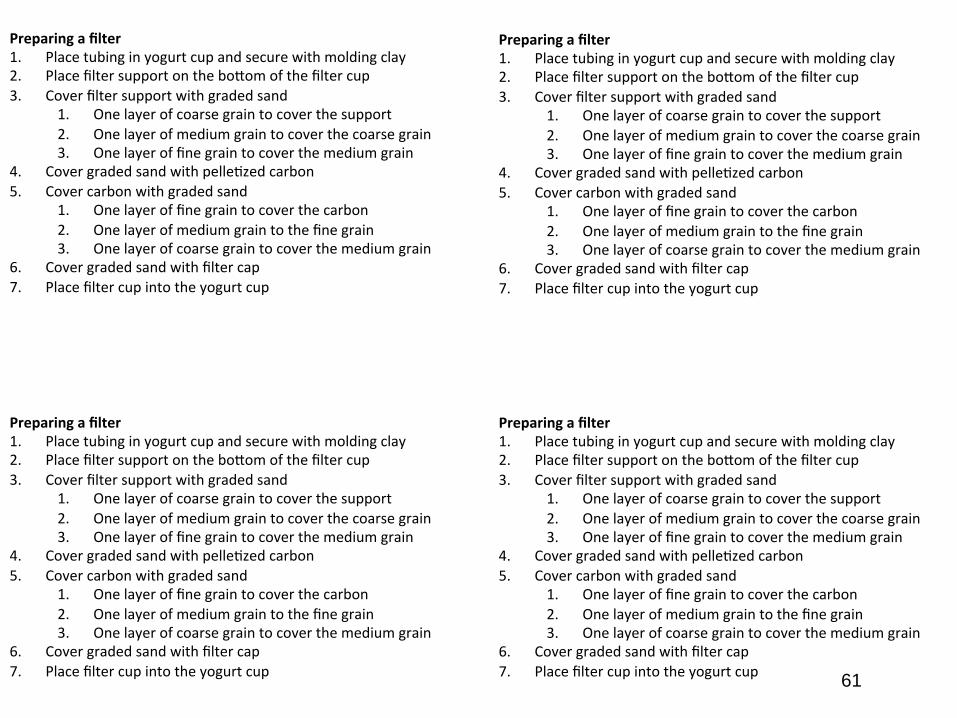
Preparing(a(filter(1. Place&tubing&in&yogurt&cup&and&secure&with&molding&clay&2. Place&filter&support&on&the&bo=om&of&the&filter&cup&3. Cover&filter&support&with&graded&sand&
1. One&layer&of&coarse&grain&to&cover&the&support&2. One&layer&of&medium&grain&to&cover&the&coarse&grain&3. One&layer&of&fine&grain&to&cover&the&medium&grain&
4. Cover&graded&sand&with&pelleLzed&carbon&5. Cover&carbon&with&graded&sand&
1. One&layer&of&fine&grain&to&cover&the&carbon&2. One&layer&of&medium&grain&to&the&fine&grain&3. One&layer&of&coarse&grain&to&cover&the&medium&grain&
6. Cover&graded&sand&with&filter&cap&7. Place&filter&cup&into&the&yogurt&cup&&
Preparing(a(filter(1. Place&tubing&in&yogurt&cup&and&secure&with&molding&clay&2. Place&filter&support&on&the&bo=om&of&the&filter&cup&3. Cover&filter&support&with&graded&sand&
1. One&layer&of&coarse&grain&to&cover&the&support&2. One&layer&of&medium&grain&to&cover&the&coarse&grain&3. One&layer&of&fine&grain&to&cover&the&medium&grain&
4. Cover&graded&sand&with&pelleLzed&carbon&5. Cover&carbon&with&graded&sand&
1. One&layer&of&fine&grain&to&cover&the&carbon&2. One&layer&of&medium&grain&to&the&fine&grain&3. One&layer&of&coarse&grain&to&cover&the&medium&grain&
6. Cover&graded&sand&with&filter&cap&7. Place&filter&cup&into&the&yogurt&cup&
Preparing(a(filter(1. Place&tubing&in&yogurt&cup&and&secure&with&molding&clay&2. Place&filter&support&on&the&bo=om&of&the&filter&cup&3. Cover&filter&support&with&graded&sand&
1. One&layer&of&coarse&grain&to&cover&the&support&2. One&layer&of&medium&grain&to&cover&the&coarse&grain&3. One&layer&of&fine&grain&to&cover&the&medium&grain&
4. Cover&graded&sand&with&pelleLzed&carbon&5. Cover&carbon&with&graded&sand&
1. One&layer&of&fine&grain&to&cover&the&carbon&2. One&layer&of&medium&grain&to&the&fine&grain&3. One&layer&of&coarse&grain&to&cover&the&medium&grain&
6. Cover&graded&sand&with&filter&cap&7. Place&filter&cup&into&the&yogurt&cup& 61

Tes'ng(the(filter&1. CondiLon&the&filter&by&adding&water&unLl&flow&from&&&&&&&&&&&&the&outlet&is&achieved&&&&&&&&&&&&***Be&careful¬&to&disturb&the&filter&surface***&2. Add&50&mL&of&dyed&water&to&the&top&of&the&filter&3. Keep&adding&water&to&the&filter&cup&unLl&the&dyed&&&&&&&&&&&&water&appears&in&the&outlet&of&the&yogurt&cup&&&&&&&&&&&Note&how&long&it&takes&for&the&dyed&water&to&flow&&&&&&&&&through&the&filter&and&exit&through&the&outlet&&&&&&&&&Is&there&any&noLceable&color&change&from&the&original&&&&&&&&&dyed&water?&
Tes'ng(the(filter&1. CondiLon&the&filter&by&adding&water&unLl&flow&from&&&&&&&&&&&&the&outlet&is&achieved&&&&&&&&&&&&***Be&careful¬&to&disturb&the&filter&surface***&2. Add&50&mL&of&dyed&water&to&the&top&of&the&filter&3. Keep&adding&water&to&the&filter&cup&unLl&the&dyed&&&&&&&&&&&&water&appears&in&the&outlet&of&the&yogurt&cup&&&&&&&&&&&Note&how&long&it&takes&for&the&dyed&water&to&flow&&&&&&&&&through&the&filter&and&exit&through&the&outlet&&&&&&&&&Is&there&any&noLceable&color&change&from&the&original&&&&&&&&&dyed&water?&
Tes'ng(the(filter&1. CondiLon&the&filter&by&adding&water&unLl&flow&from&&&&&&&&&&&&the&outlet&is&achieved&&&&&&&&&&&&***Be&careful¬&to&disturb&the&filter&surface***&2. Add&50&mL&of&dyed&water&to&the&top&of&the&filter&3. Keep&adding&water&to&the&filter&cup&unLl&the&dyed&&&&&&&&&&&&water&appears&in&the&outlet&of&the&yogurt&cup&&&&&&&&&&&Note&how&long&it&takes&for&the&dyed&water&to&flow&&&&&&&&&through&the&filter&and&exit&through&the&outlet&&&&&&&&&Is&there&any&noLceable&color&change&from&the&original&&&&&&&&&dyed&water?&
Tes'ng(the(filter&1. CondiLon&the&filter&by&adding&water&unLl&flow&from&&&&&&&&&&&&the&outlet&is&achieved&&&&&&&&&&&&***Be&careful¬&to&disturb&the&filter&surface***&2. Add&50&mL&of&dyed&water&to&the&top&of&the&filter&3. Keep&adding&water&to&the&filter&cup&unLl&the&dyed&&&&&&&&&&&&water&appears&in&the&outlet&of&the&yogurt&cup&&&&&&&&&&&Note&how&long&it&takes&for&the&dyed&water&to&flow&&&&&&&&&through&the&filter&and&exit&through&the&outlet&&&&&&&&&Is&there&any&noLceable&color&change&from&the&original&&&&&&&&&dyed&water?&
62
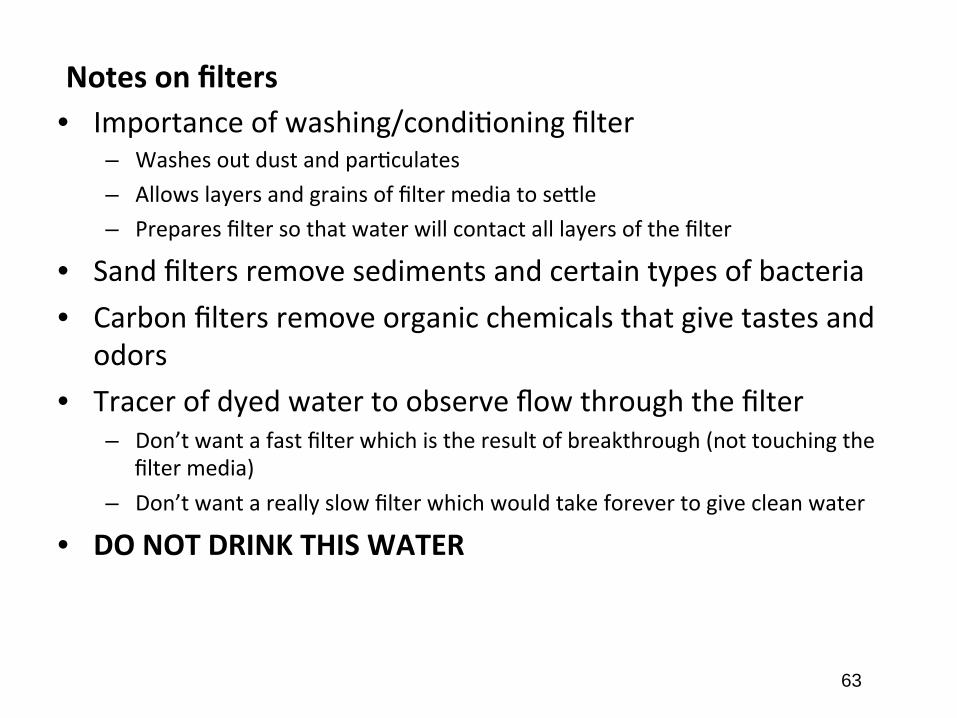
Notes(on(filters(• Importance&of&washing/condiLoning&filter&
– Washes&out&dust&and&parLculates&– Allows&layers&and&grains&of&filter&media&to&se=le&– Prepares&filter&so&that&water&will&contact&all&layers&of&the&filter&
• Sand&filters&remove&sediments&and&certain&types&of&bacteria&• Carbon&filters&remove&organic&chemicals&that&give&tastes&and&
odors&&• Tracer&of&dyed&water&to&observe&flow&through&the&filter&
– Don’t&want&a&fast&filter&which&is&the&result&of&breakthrough&(not&touching&the&filter&media)&
– Don’t&want&a&really&slow&filter&which&would&take&forever&to&give&clean&water&
• DO(NOT(DRINK(THIS(WATER(
63
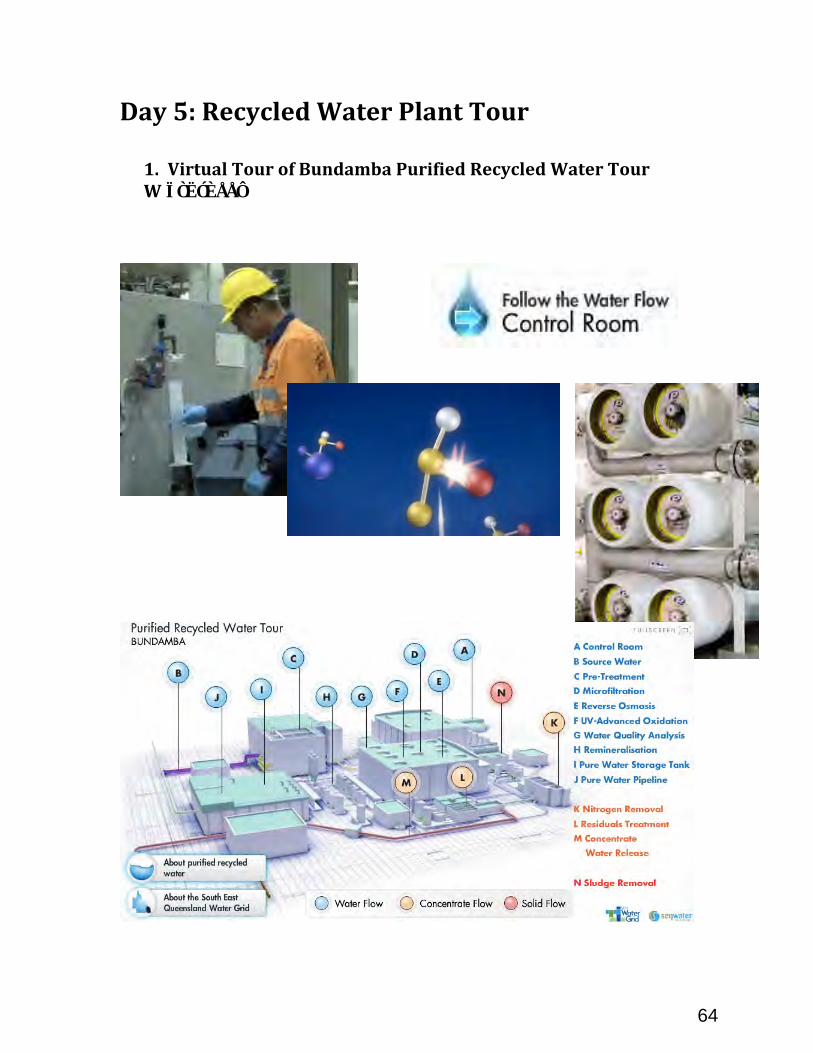
Day$5:$Recycled$Water$Plant$Tour$$1. Virtual$Tour$of$Bundamba$Purified$Recycled$Water$Tour$W ÏÒËÓÈÅÅÔ
64

Advanced water treatment plant virtual tour worksheet Go to: http://www.seqwater.com.au/education/virtual-tour/bundamba-0 Follow the water flow to take the virtual tour. Click on videos and more info at each step. Answer the following questions as you go through the tour. 1) What is the source water for this water treatment plant? Based on what you’ve learned from previous classes, are there any potential alternative water sources and how will you judge whether they can/can’t be the source water? 2) What’s the purpose of pre-treatment? Briefly describe what happened during this process. 3) What’s inside of the vessels? How do they work to purify water? How often are the vessels washed during microfiltration? What’s the purpose of back washing? How do they check the integrity of filters? 4) What has been removed during the reverse osmosis process? How do spiral-wound modules work? Briefly describe the process based on the following spiral-wound schematic. What’s the percentage of source water that becomes purified water?
5) What’s the purpose of UV-advanced oxidation and how does it work? 6) What water quality parameters are analyzed? Name at least four and explain why they are important based on what you learned from previous classes. 7) Why is the remineralisation step necessary? What is added into the water and what is the purpose of adding it?
65
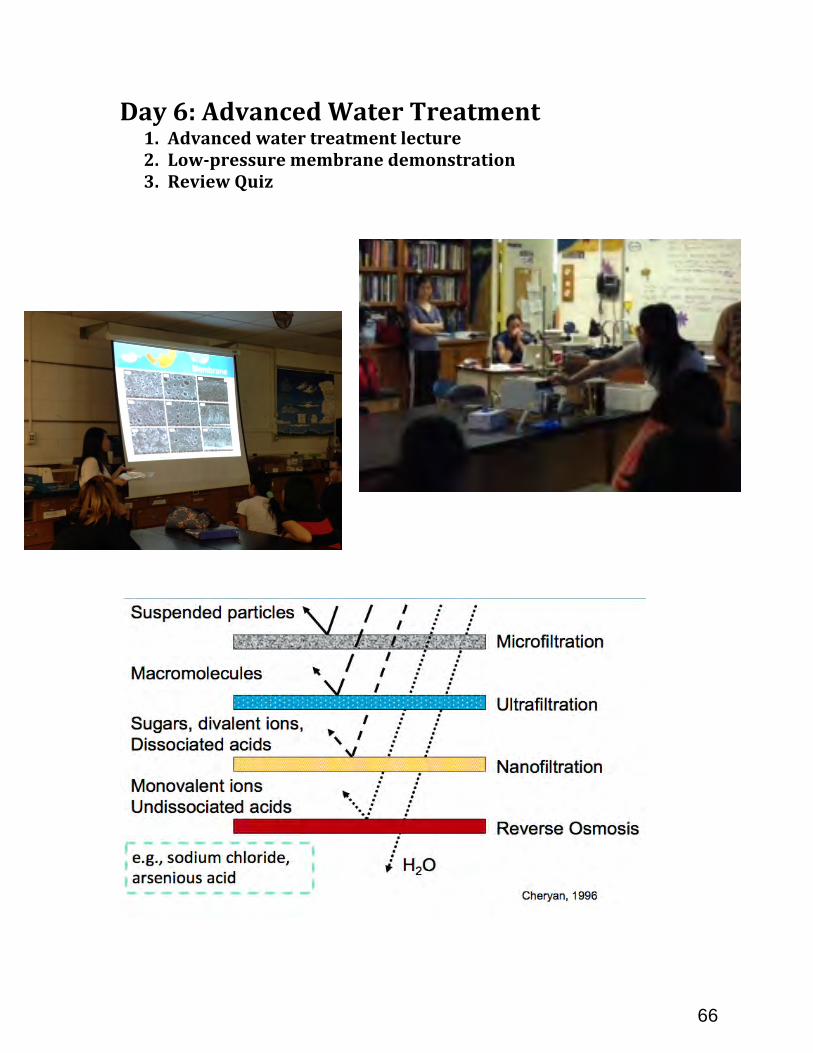
Day 6: Advanced Water Treatment 1. Advanced water treatment lecture 2. Low-‐pressure membrane demonstration 3. Review Quiz
66

67

Review from previous class: ask students to describe what happens in each step briefly. Lead to new topic of this class: Conven>onal water and wastewater treatment processes have been long established in removing many chemical and microbial contaminants of concern to public health and the environment. However, it may have problems.
68

For example, researches showed possible link between halogenerated disinfec>on by-‐products (DBPs) and cancers, and the recent outbreaks caused by Giardia cysts and Cryptosporidium oocysts.
69
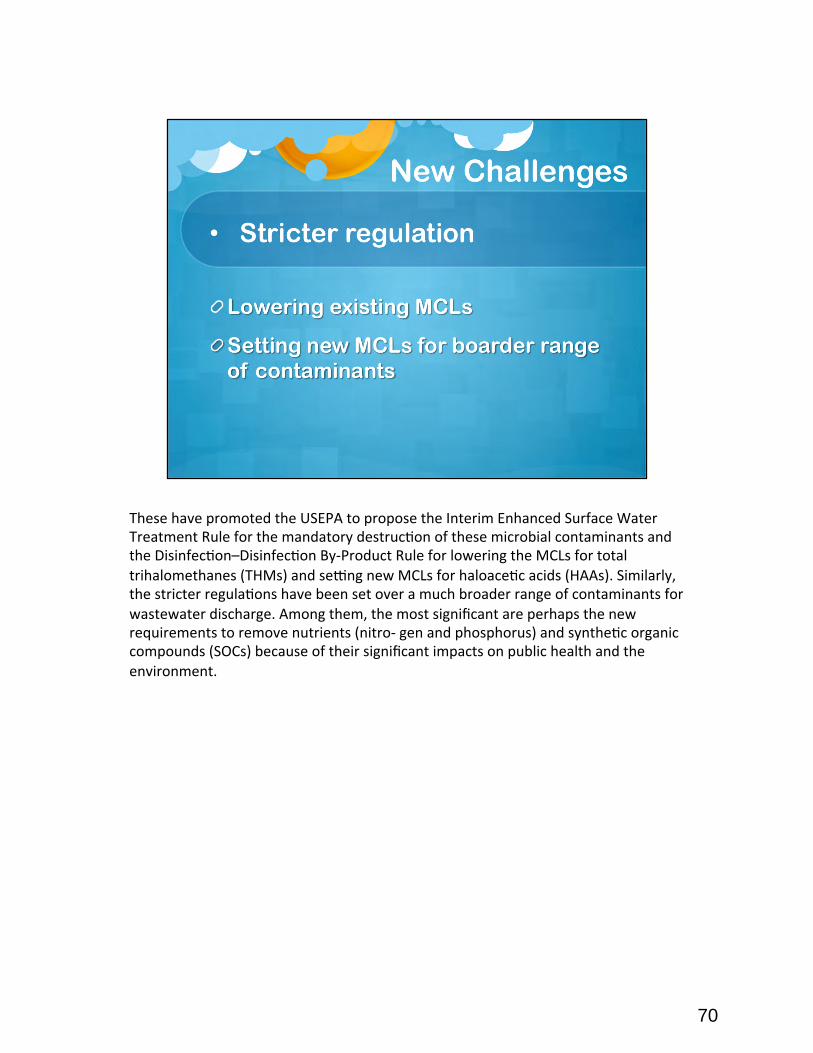
These have promoted the USEPA to propose the Interim Enhanced Surface Water Treatment Rule for the mandatory destruc>on of these microbial contaminants and the Disinfec>on–Disinfec>on By-‐Product Rule for lowering the MCLs for total trihalomethanes (THMs) and seUng new MCLs for haloace>c acids (HAAs). Similarly, the stricter regula>ons have been set over a much broader range of contaminants for wastewater discharge. Among them, the most significant are perhaps the new requirements to remove nutrients (nitro-‐ gen and phosphorus) and synthe>c organic compounds (SOCs) because of their significant impacts on public health and the environment.
70
71
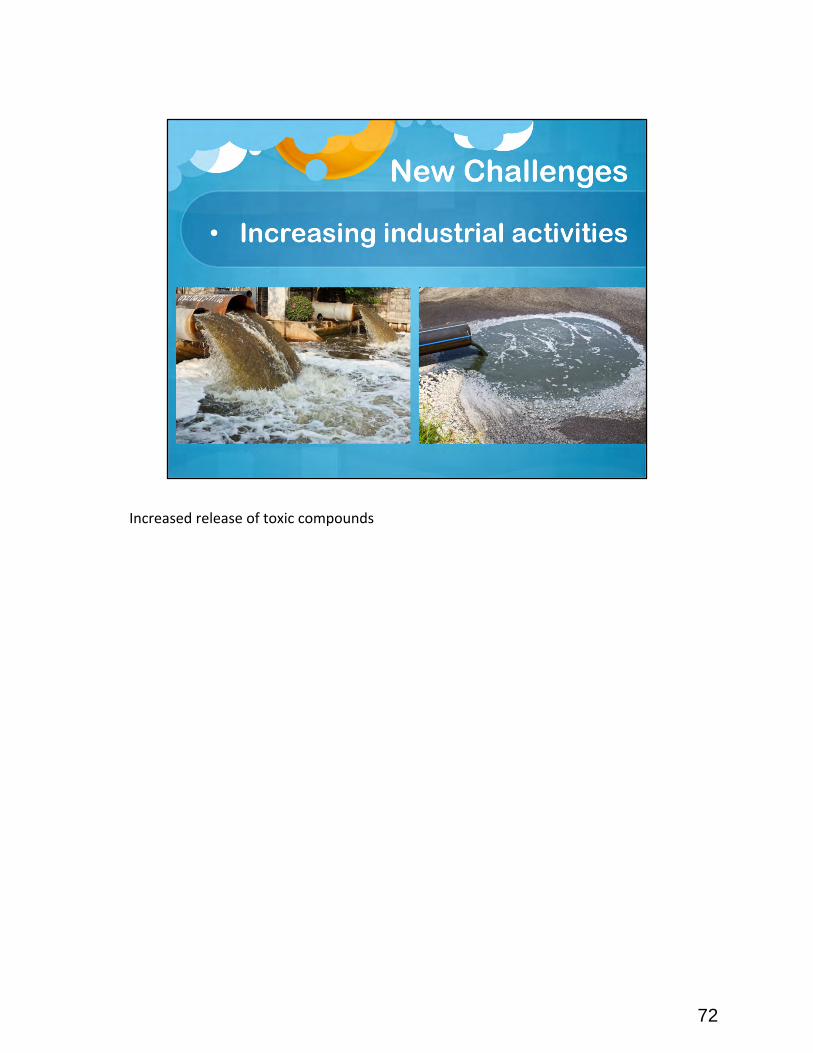
Increased release of toxic compounds
72

the reuse of municipal and industrial wastewaters and the recovery of poten>al pollutants used in industrial processes become more cri>cal. This is especially true in arid or semiarid areas where the potable water and irriga>on water must be imported at great expense. The reclama>on may be further jus>fied in view of growing concern over the contamina>on of water resources by the release of more toxic compounds.
73
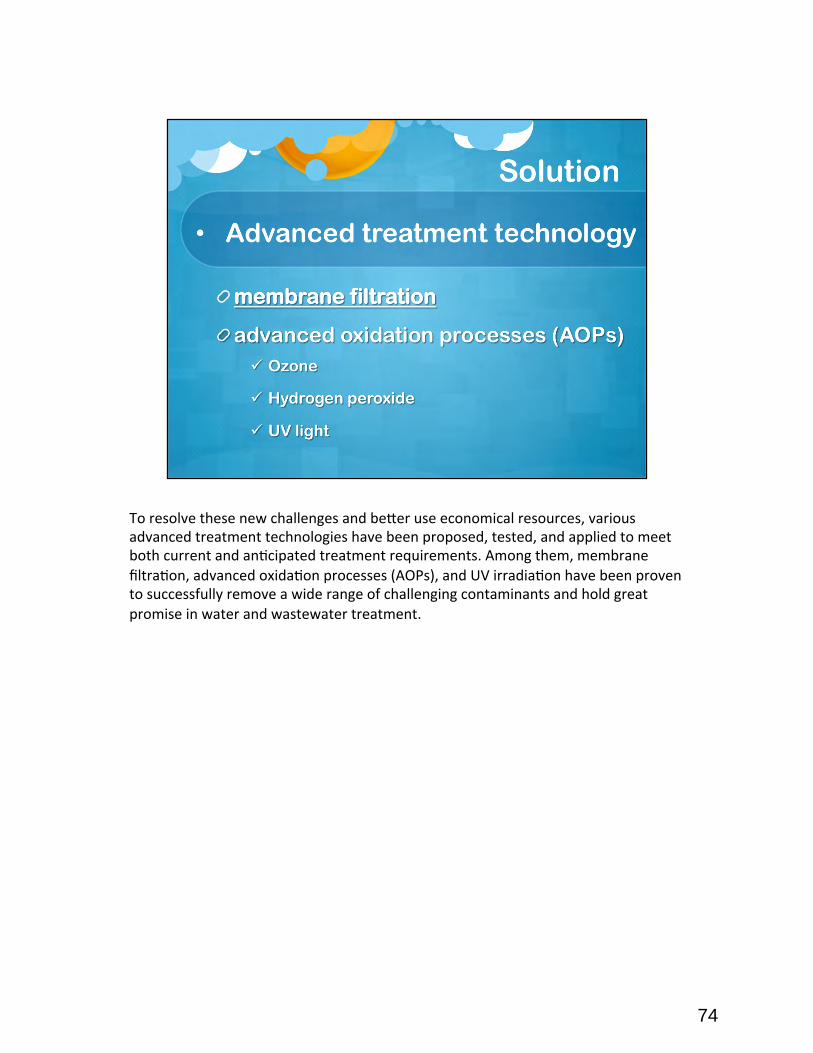
To resolve these new challenges and be^er use economical resources, various advanced treatment technologies have been proposed, tested, and applied to meet both current and an>cipated treatment requirements. Among them, membrane filtra>on, advanced oxida>on processes (AOPs), and UV irradia>on have been proven to successfully remove a wide range of challenging contaminants and hold great promise in water and wastewater treatment.
74

Pass around real membranes if possible. Flat sheet membrane: Membranes are cast as a sheet and used as a single layer in a special filtra>on cell. Common in laboratory separa>on but difficult to implement at an industrial scale. (will introduce more widely-‐used membrane elements in industry later)
75
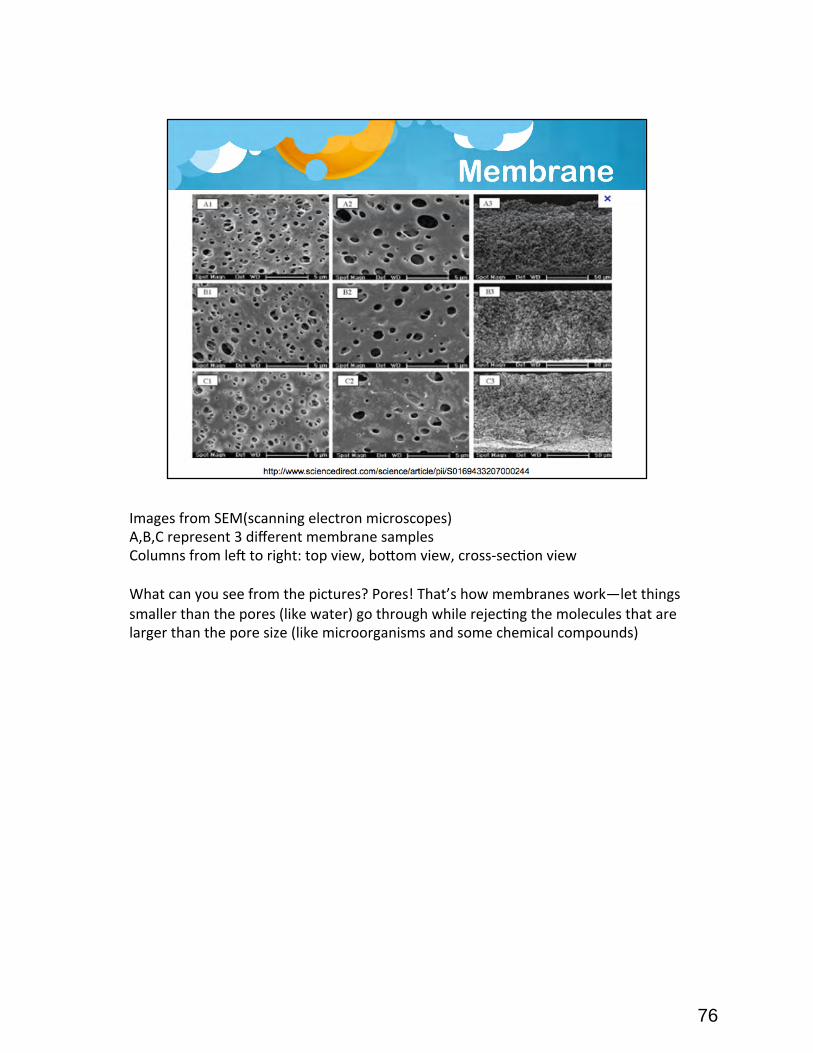
Images from SEM(scanning electron microscopes) A,B,C represent 3 different membrane samples Columns from led to right: top view, bo^om view, cross-‐sec>on view What can you see from the pictures? Pores! That’s how membranes work—let things smaller than the pores (like water) go through while rejec>ng the molecules that are larger than the pore size (like microorganisms and some chemical compounds)
76
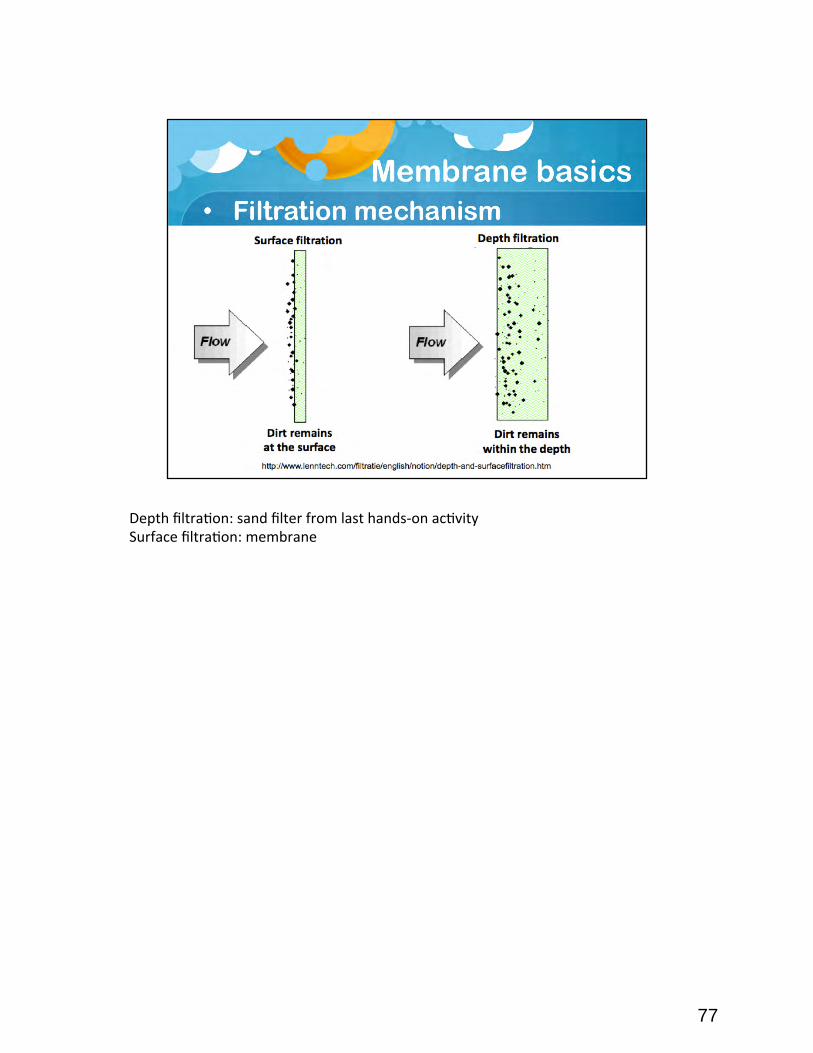
Depth filtra>on: sand filter from last hands-‐on ac>vity Surface filtra>on: membrane
77
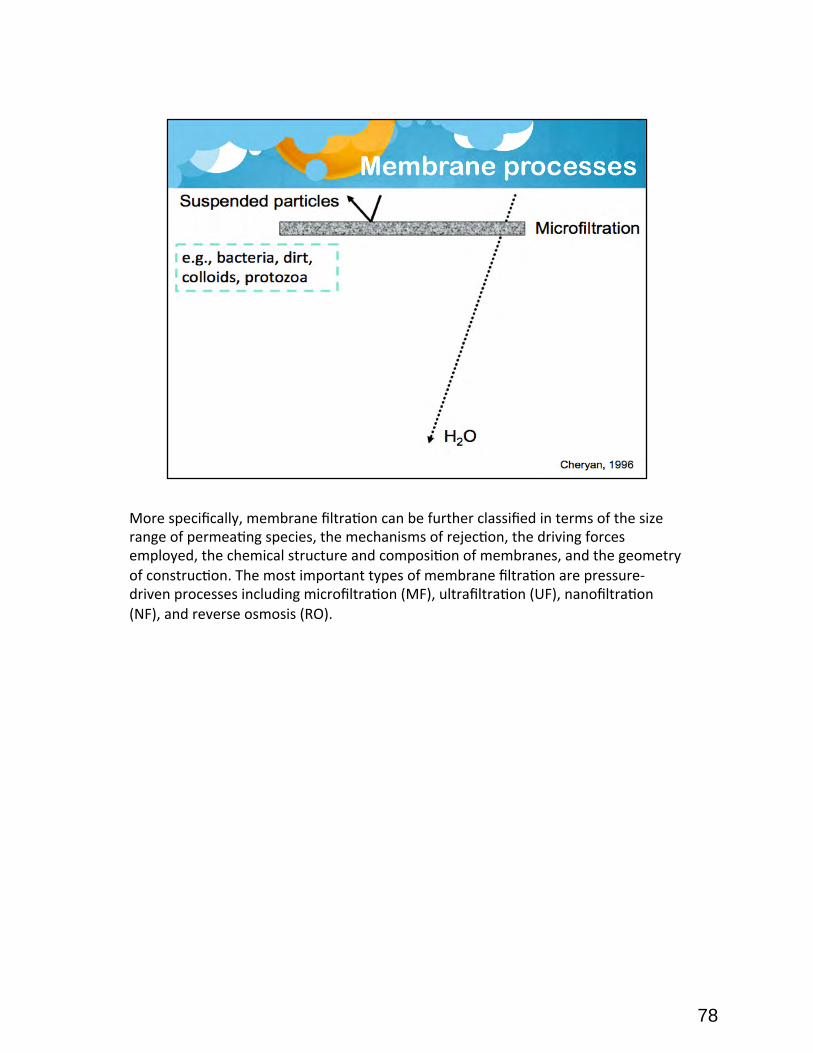
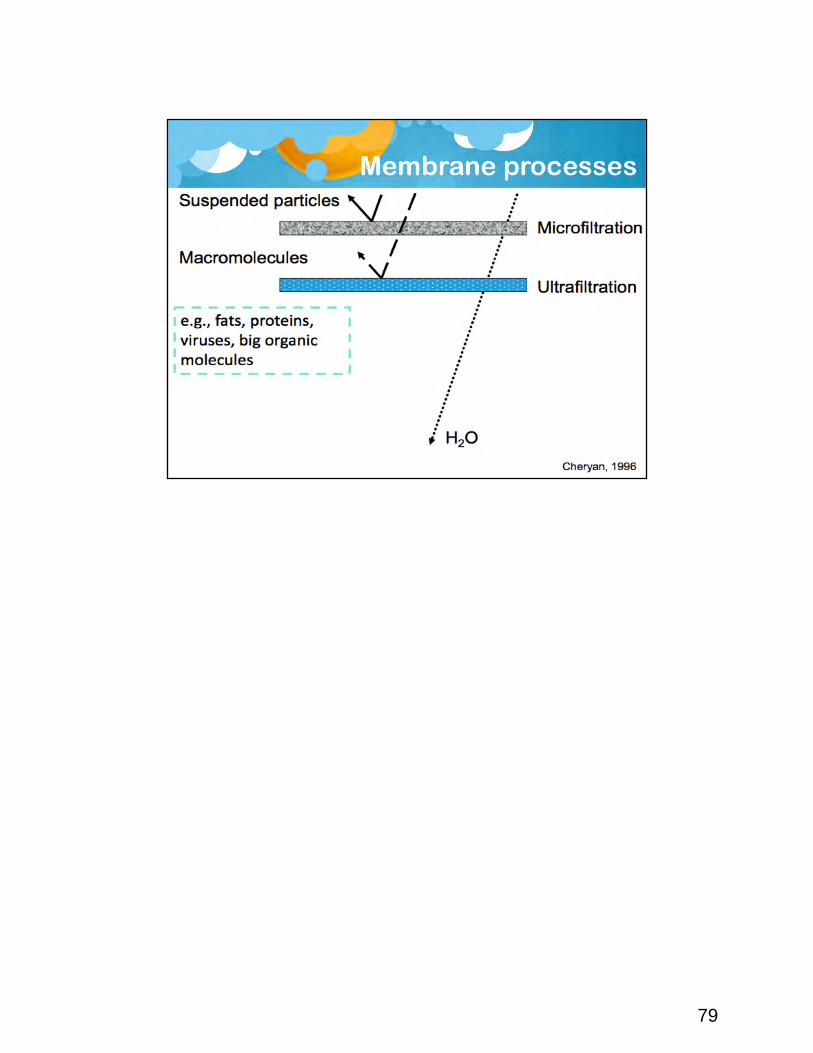
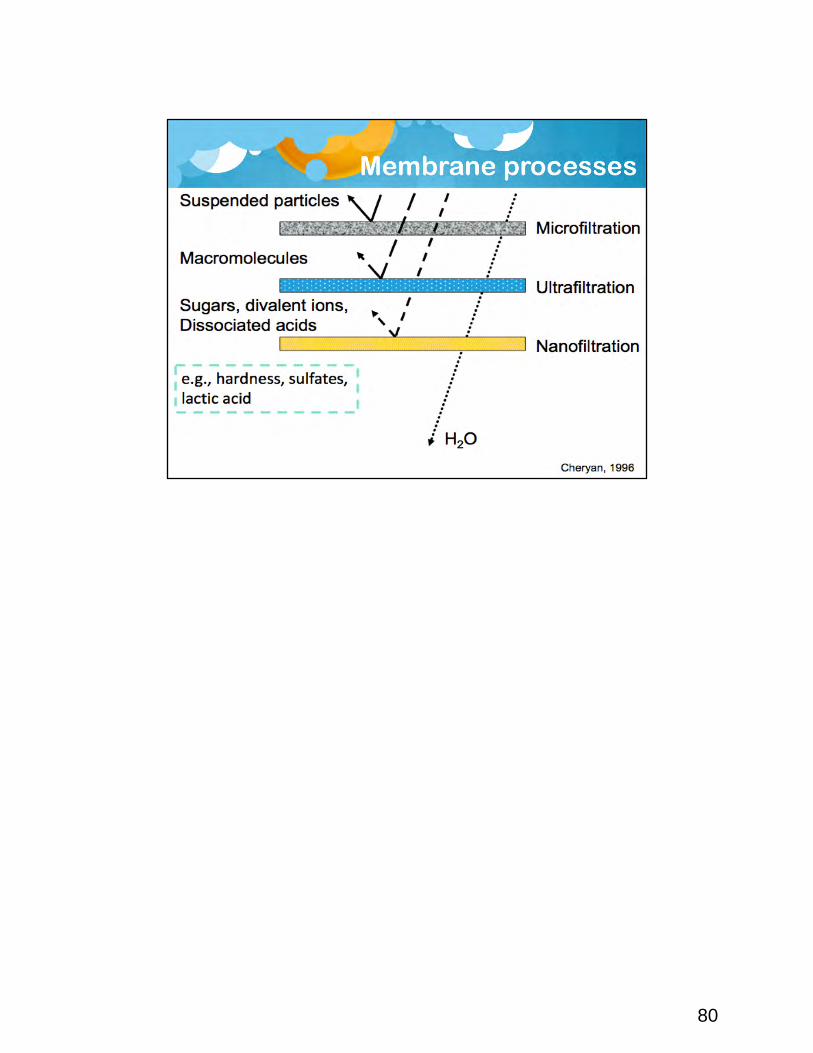
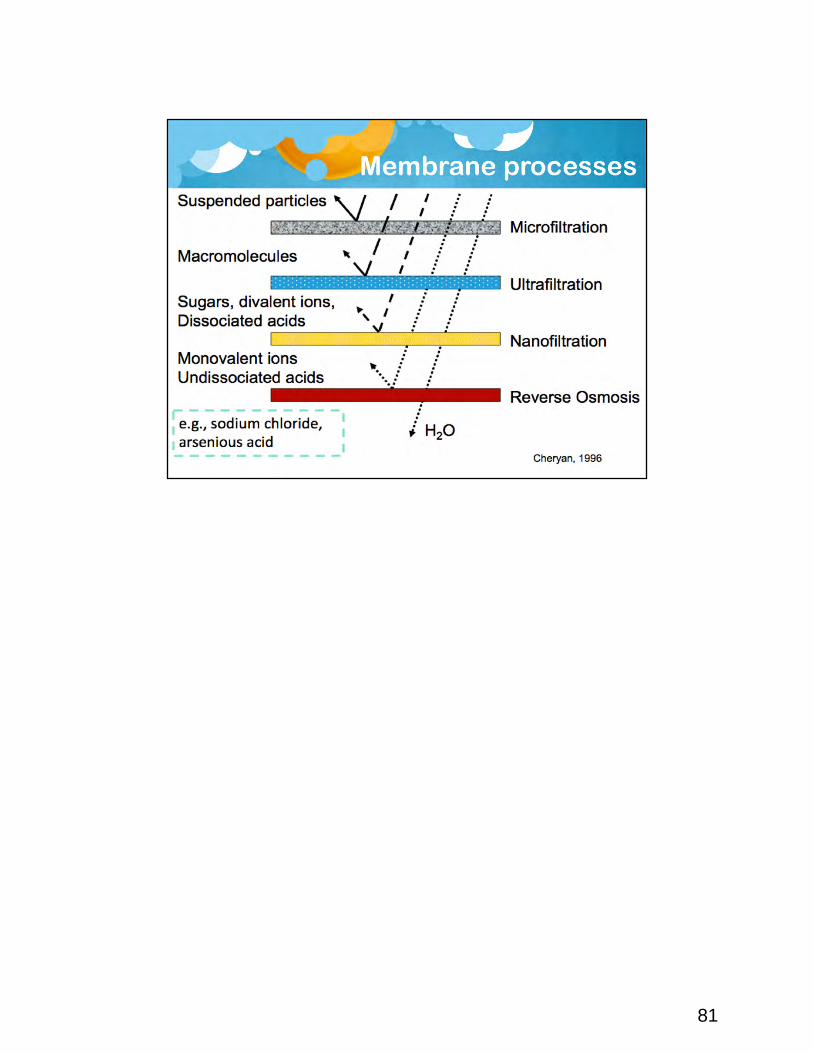
More specifically, membrane filtra>on can be further classified in terms of the size range of permea>ng species, the mechanisms of rejec>on, the driving forces employed, the chemical structure and composi>on of membranes, and the geometry of construc>on. The most important types of membrane filtra>on are pressure-‐ driven processes including microfiltra>on (MF), ultrafiltra>on (UF), nanofiltra>on (NF), and reverse osmosis (RO).
78
79
80
81
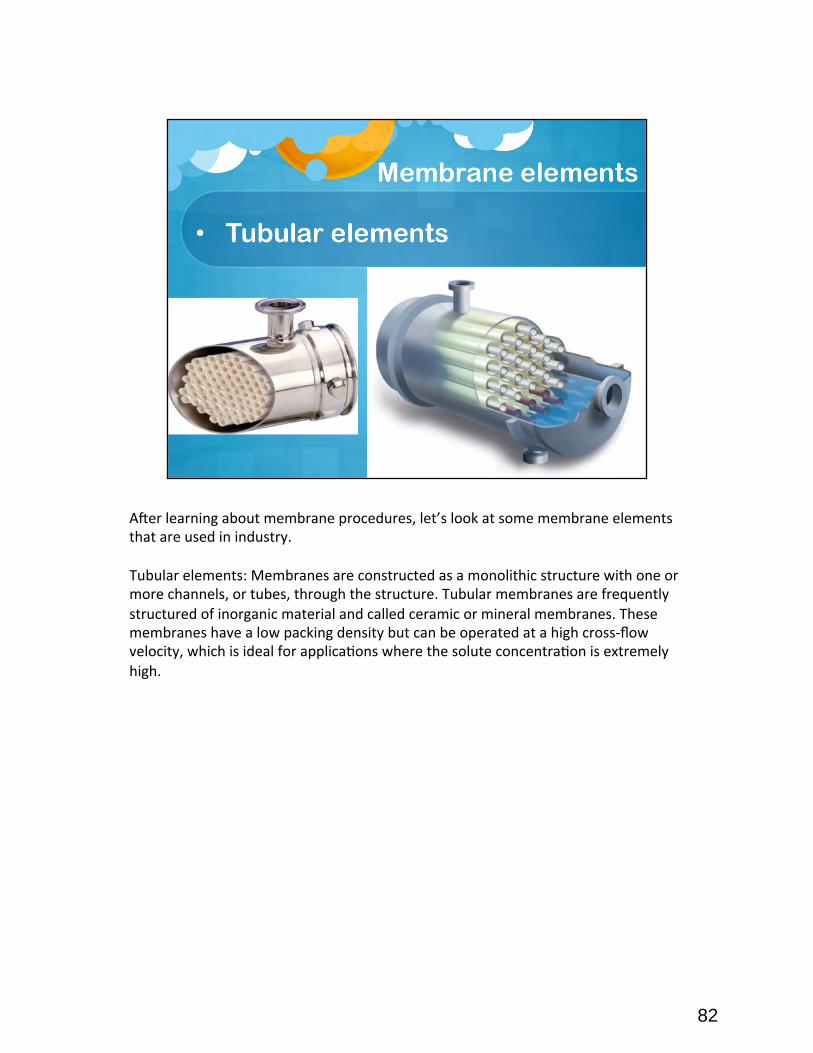
Ader learning about membrane procedures, let’s look at some membrane elements that are used in industry. Tubular elements: Membranes are constructed as a monolithic structure with one or more channels, or tubes, through the structure. Tubular membranes are frequently structured of inorganic material and called ceramic or mineral membranes. These membranes have a low packing density but can be operated at a high cross-‐flow velocity, which is ideal for applica>ons where the solute concentra>on is extremely high.
82
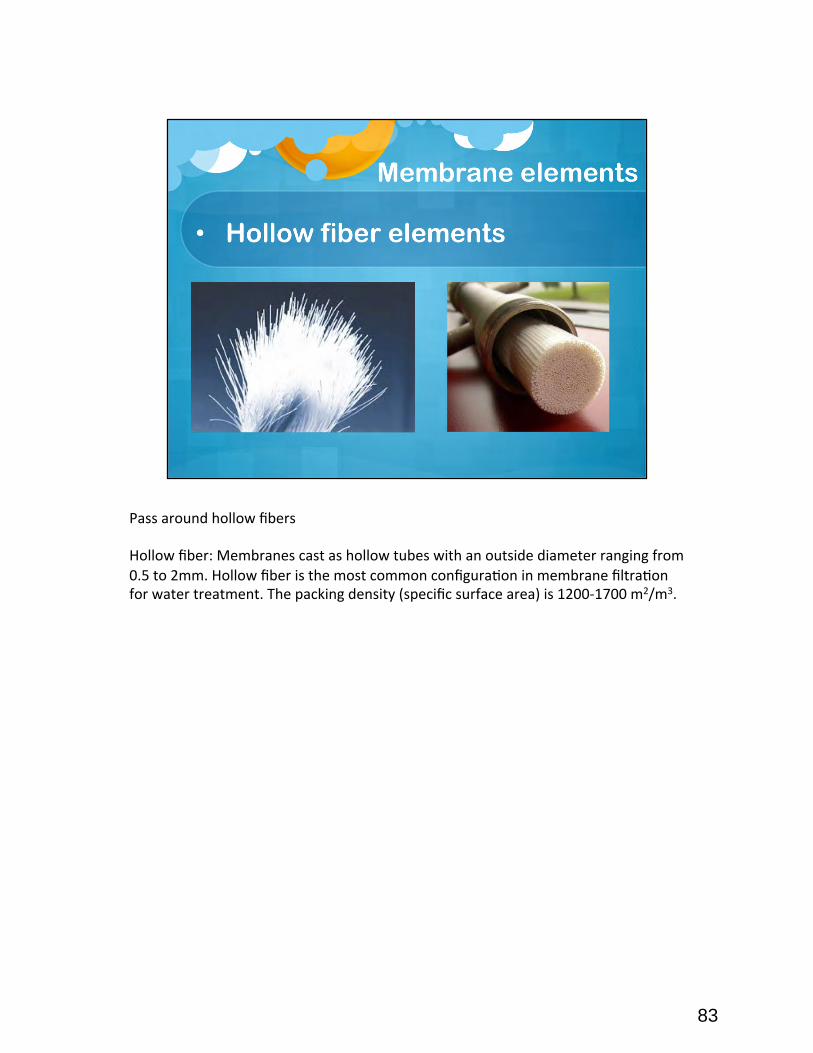
Pass around hollow fibers Hollow fiber: Membranes cast as hollow tubes with an outside diameter ranging from 0.5 to 2mm. Hollow fiber is the most common configura>on in membrane filtra>on for water treatment. The packing density (specific surface area) is 1200-‐1700 m2/m3.
83
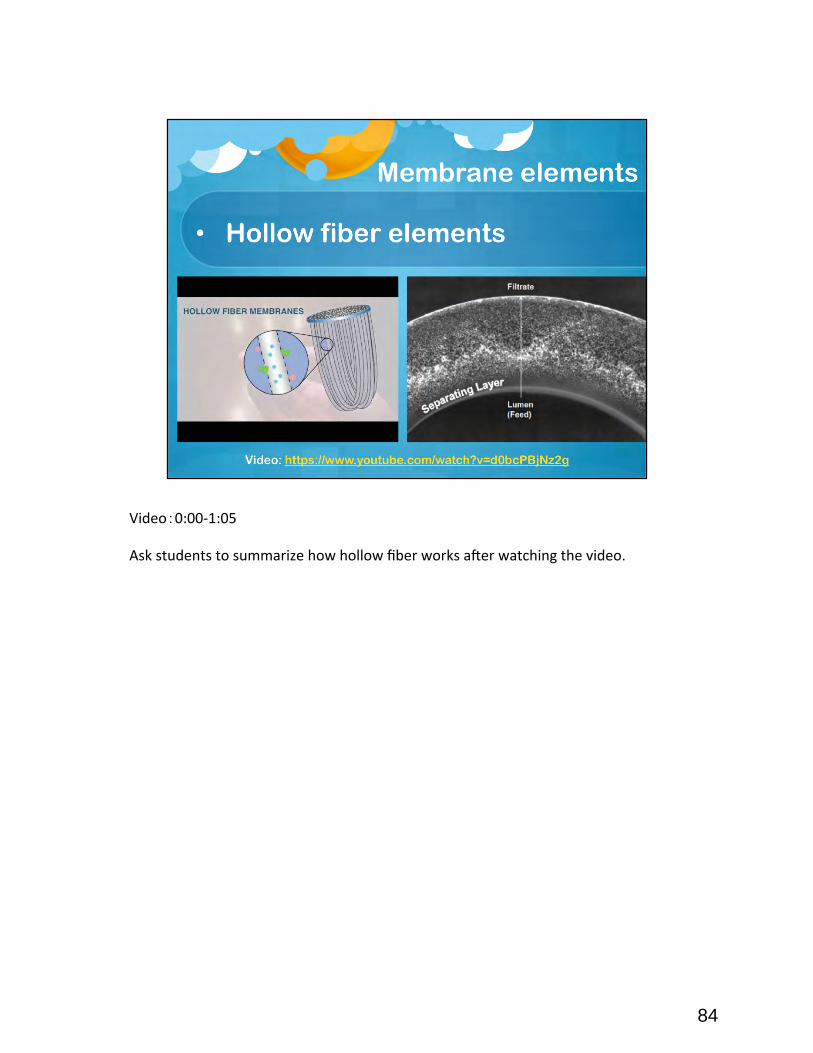
Video:0:00-‐1:05 Ask students to summarize how hollow fiber works ader watching the video.
84
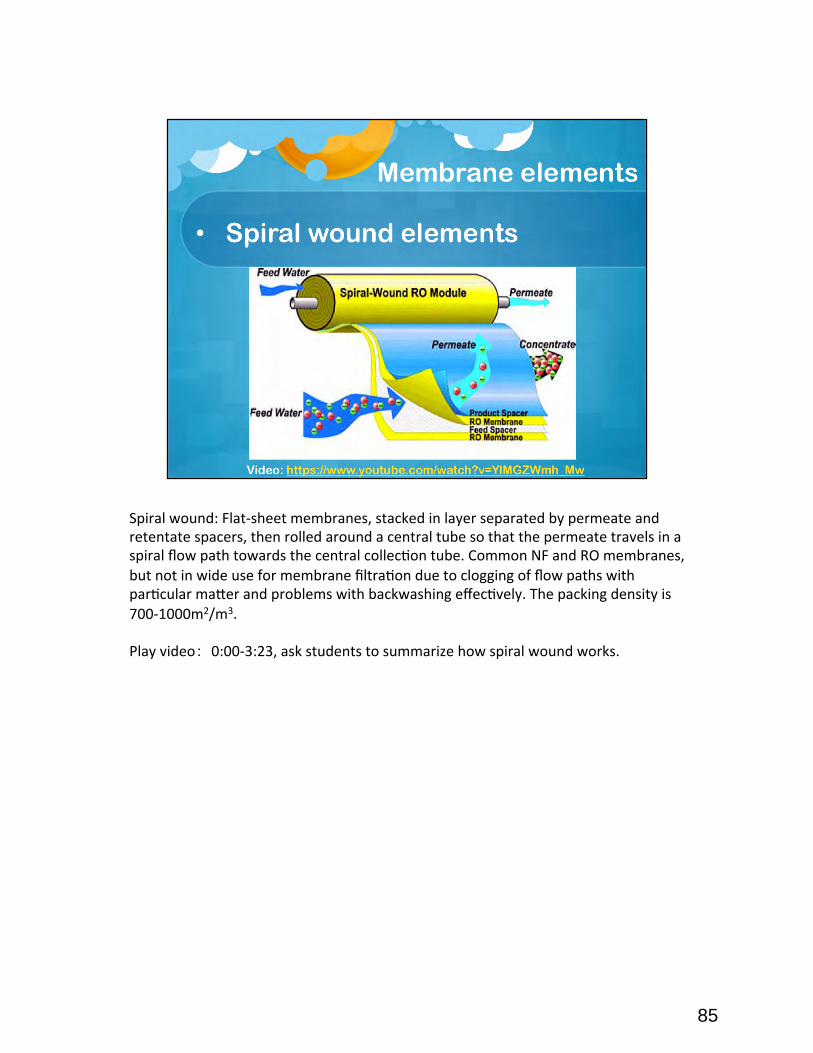
Spiral wound: Flat-‐sheet membranes, stacked in layer separated by permeate and retentate spacers, then rolled around a central tube so that the permeate travels in a spiral flow path towards the central collec>on tube. Common NF and RO membranes, but not in wide use for membrane filtra>on due to clogging of flow paths with par>cular ma^er and problems with backwashing effec>vely. The packing density is 700-‐1000m2/m3. Play video: 0:00-‐3:23, ask students to summarize how spiral wound works.
85
86

Dead-‐end filtra>on opera>on: The bulk feed water flow is transverse (perpendicular) to and toward the membrane surface during dead-‐end filtra>on, so all solids accumulate on the membranes during the filtra>on cycle and are removed during backwash cycle.
87
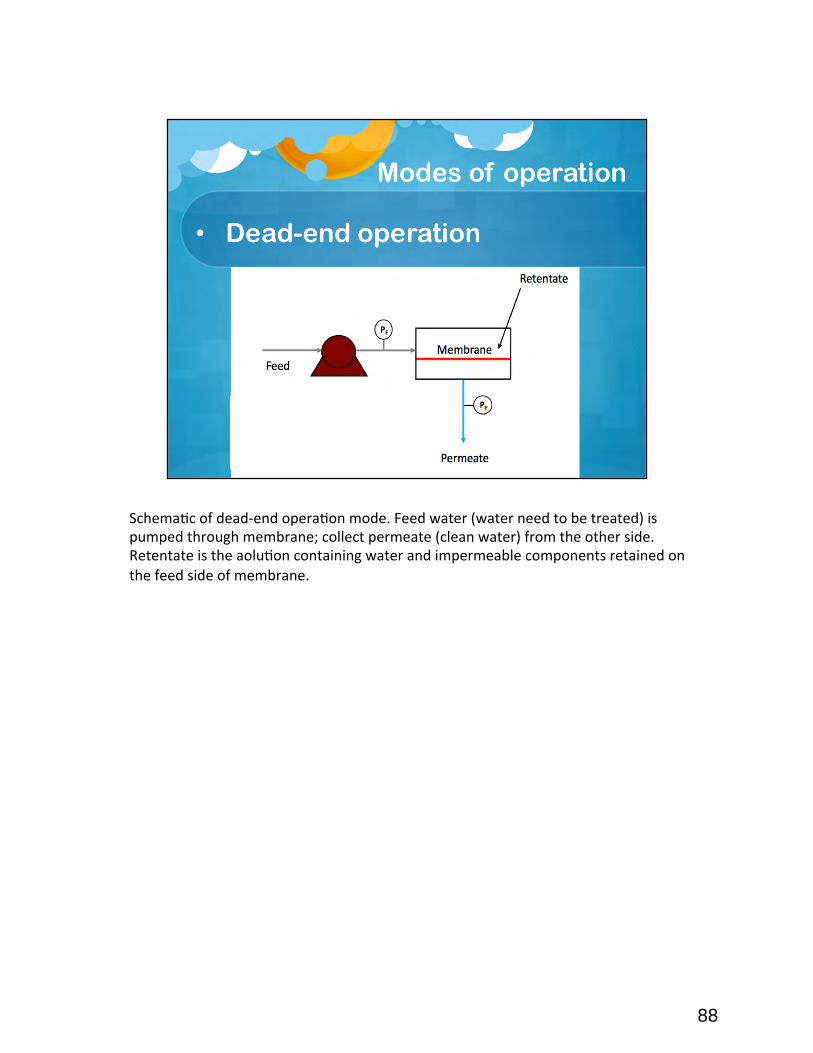
Schema>c of dead-‐end opera>on mode. Feed water (water need to be treated) is pumped through membrane; collect permeate (clean water) from the other side. Retentate is the aolu>on containing water and impermeable components retained on the feed side of membrane.
88
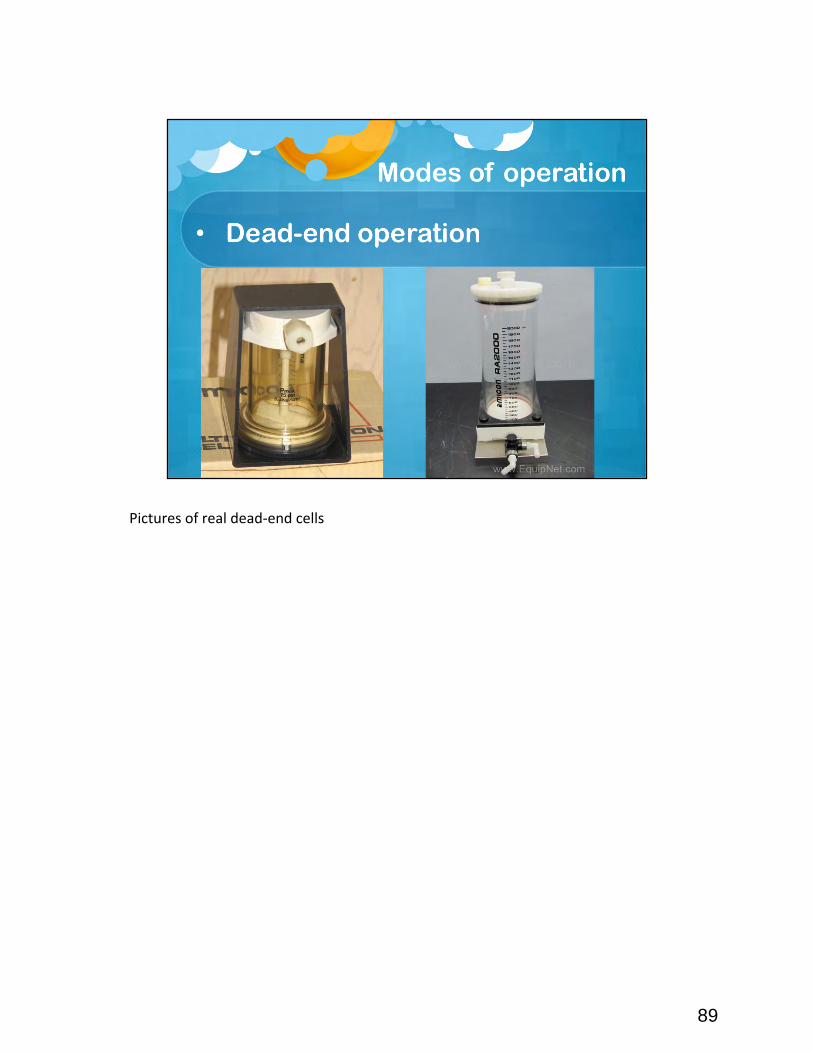
Pictures of real dead-‐end cells
89
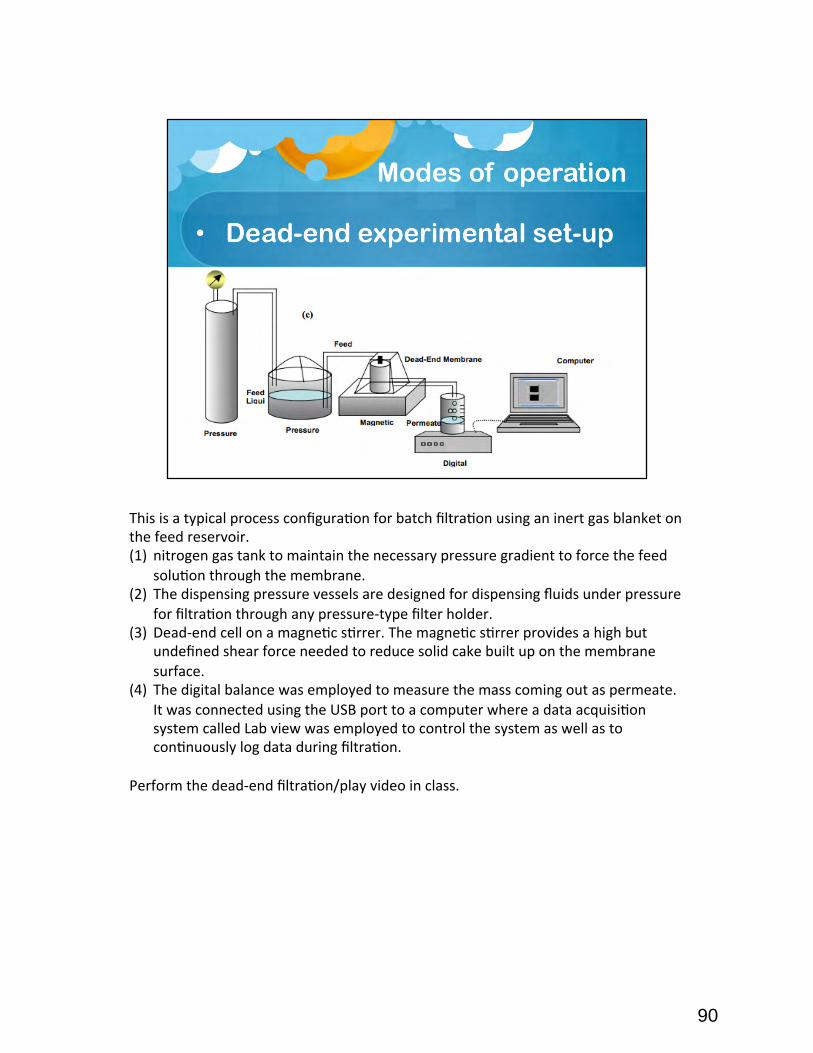
This is a typical process configura>on for batch filtra>on using an inert gas blanket on the feed reservoir. (1) nitrogen gas tank to maintain the necessary pressure gradient to force the feed
solu>on through the membrane. (2) The dispensing pressure vessels are designed for dispensing fluids under pressure
for filtra>on through any pressure-‐type filter holder. (3) Dead-‐end cell on a magne>c s>rrer. The magne>c s>rrer provides a high but
undefined shear force needed to reduce solid cake built up on the membrane surface.
(4) The digital balance was employed to measure the mass coming out as permeate. It was connected using the USB port to a computer where a data acquisi>on system called Lab view was employed to control the system as well as to con>nuously log data during filtra>on.
Perform the dead-‐end filtra>on/play video in class.
90
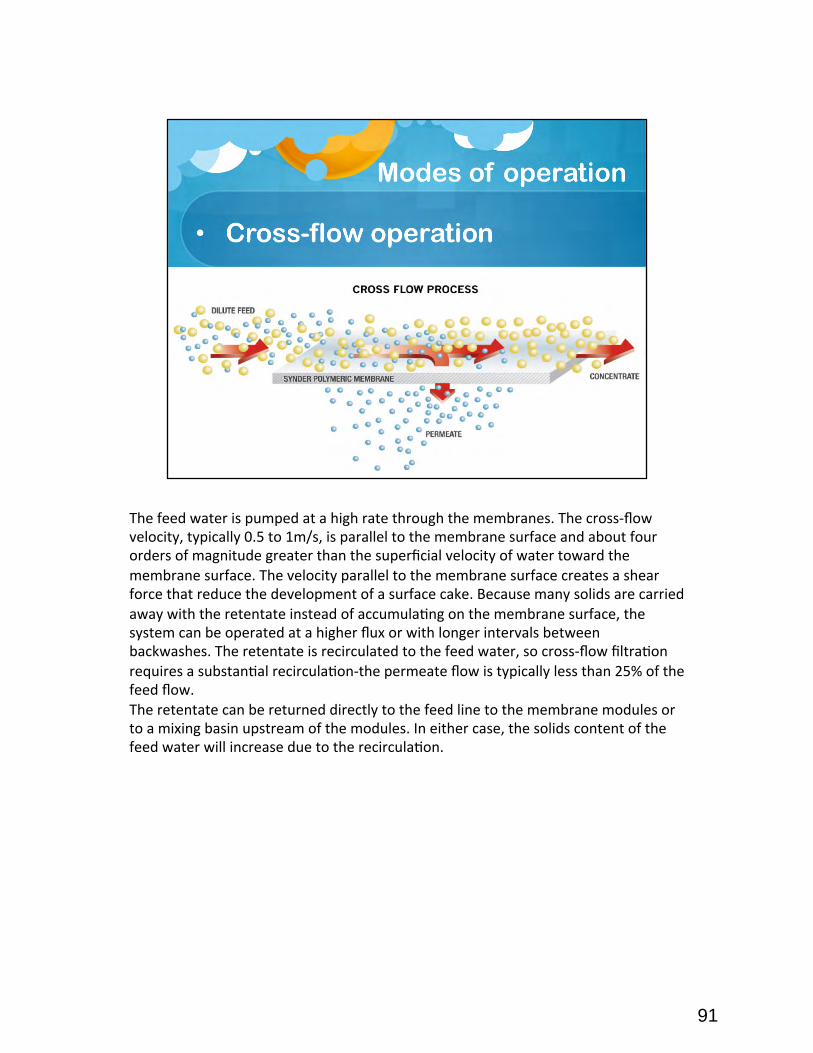
The feed water is pumped at a high rate through the membranes. The cross-‐flow velocity, typically 0.5 to 1m/s, is parallel to the membrane surface and about four orders of magnitude greater than the superficial velocity of water toward the membrane surface. The velocity parallel to the membrane surface creates a shear force that reduce the development of a surface cake. Because many solids are carried away with the retentate instead of accumula>ng on the membrane surface, the system can be operated at a higher flux or with longer intervals between backwashes. The retentate is recirculated to the feed water, so cross-‐flow filtra>on requires a substan>al recircula>on-‐the permeate flow is typically less than 25% of the feed flow. The retentate can be returned directly to the feed line to the membrane modules or to a mixing basin upstream of the modules. In either case, the solids content of the feed water will increase due to the recircula>on.
91

92

Ques>on: which is dead-‐end opera>on? Which is ross-‐flow opera>on? Why? The greater solids accumula>on during the dead-‐end filtra>on run may result in lower average flux values than those achieved with cross-‐flow filtra>on.
93
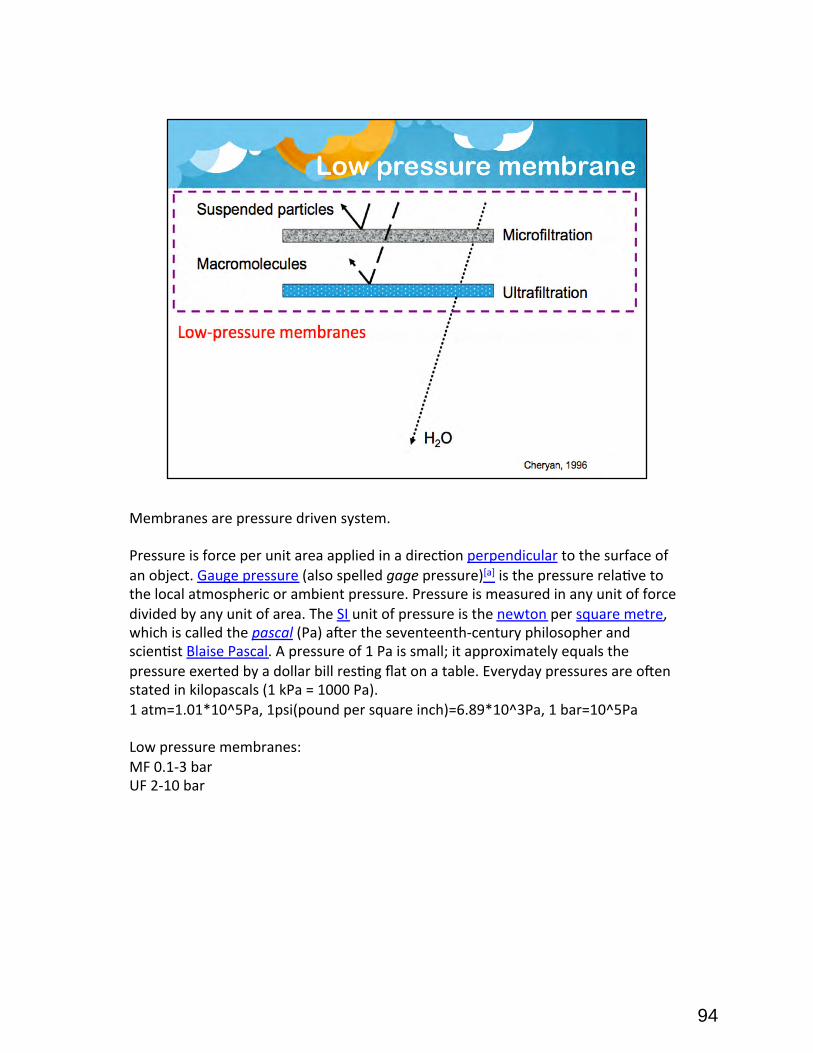
Membranes are pressure driven system. Pressure is force per unit area applied in a direc>on perpendicular to the surface of an object. Gauge pressure (also spelled gage pressure)[a] is the pressure rela>ve to the local atmospheric or ambient pressure. Pressure is measured in any unit of force divided by any unit of area. The SI unit of pressure is the newton per square metre, which is called the pascal (Pa) ader the seventeenth-‐century philosopher and scien>st Blaise Pascal. A pressure of 1 Pa is small; it approximately equals the pressure exerted by a dollar bill res>ng flat on a table. Everyday pressures are oden stated in kilopascals (1 kPa = 1000 Pa). 1 atm=1.01*10^5Pa, 1psi(pound per square inch)=6.89*10^3Pa, 1 bar=10^5Pa Low pressure membranes: MF 0.1-‐3 bar UF 2-‐10 bar
94
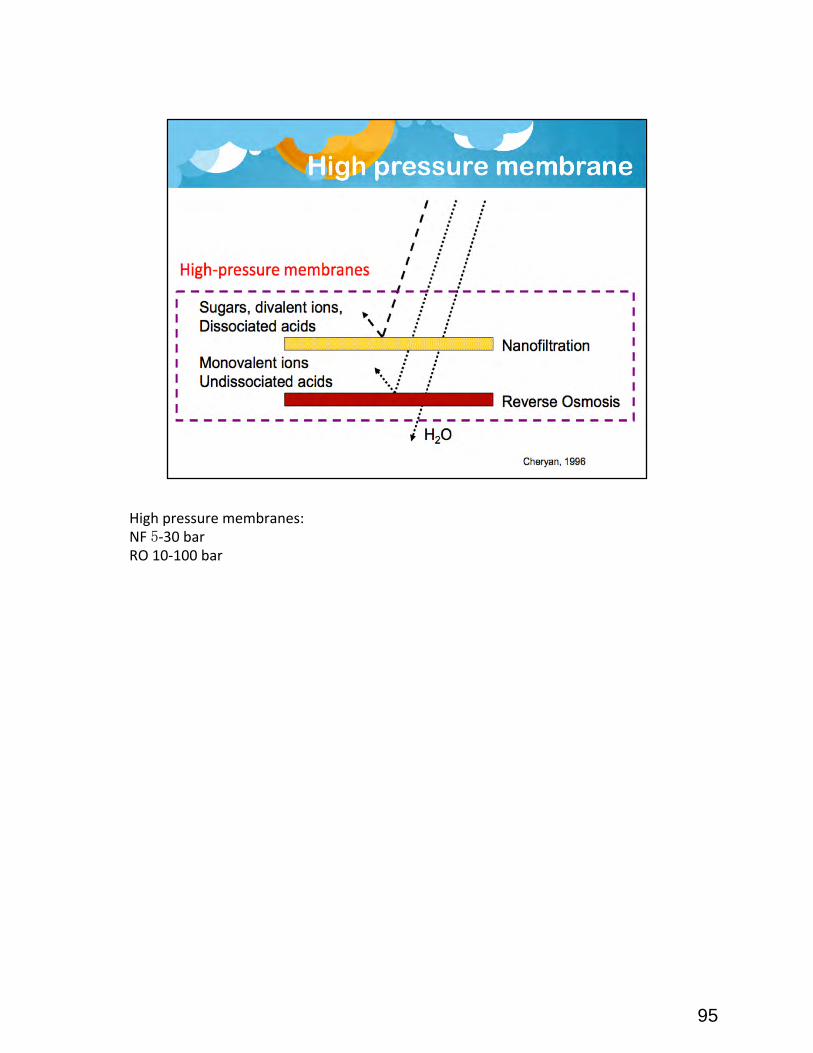
High pressure membranes: NF 5-‐30 bar RO 10-‐100 bar
95

Fouling: process resul>ng in loss of performance of a membrane due to the deposi>on of suspended or dissolved substances on its external surfaces, at its pore openings, or within its pores.
96

Pass around fouled membrane sheet
97
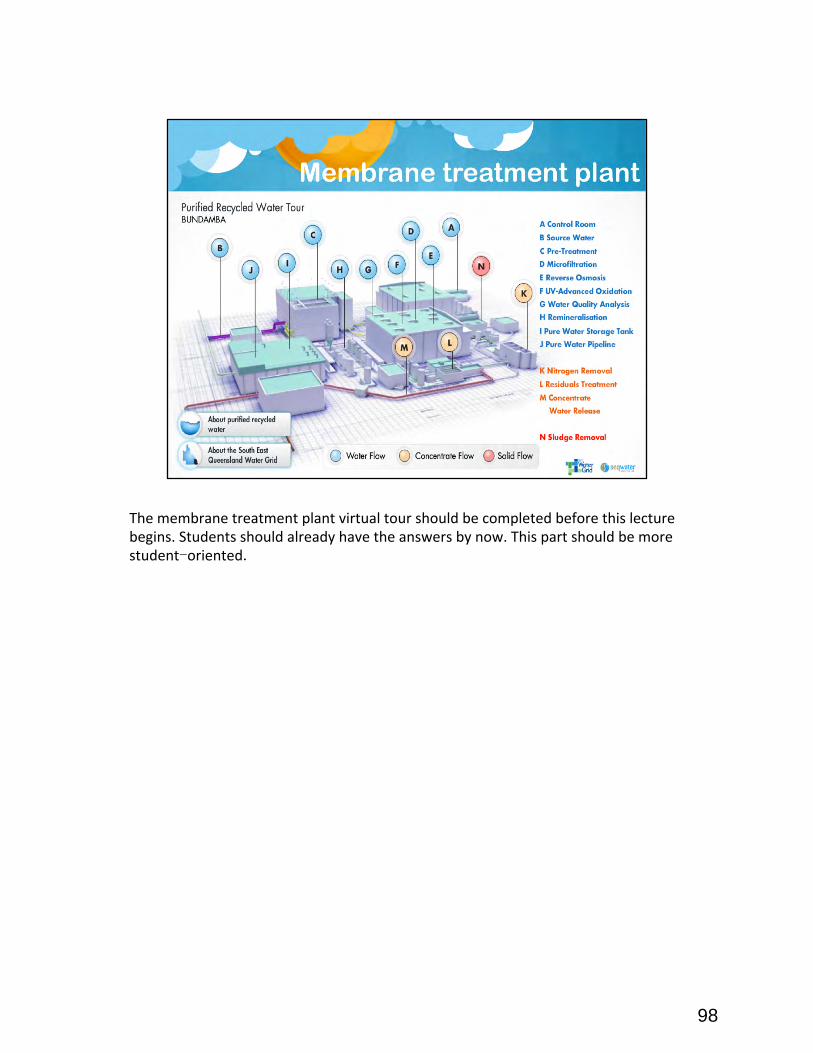
The membrane treatment plant virtual tour should be completed before this lecture begins. Students should already have the answers by now. This part should be more student-oriented.
98
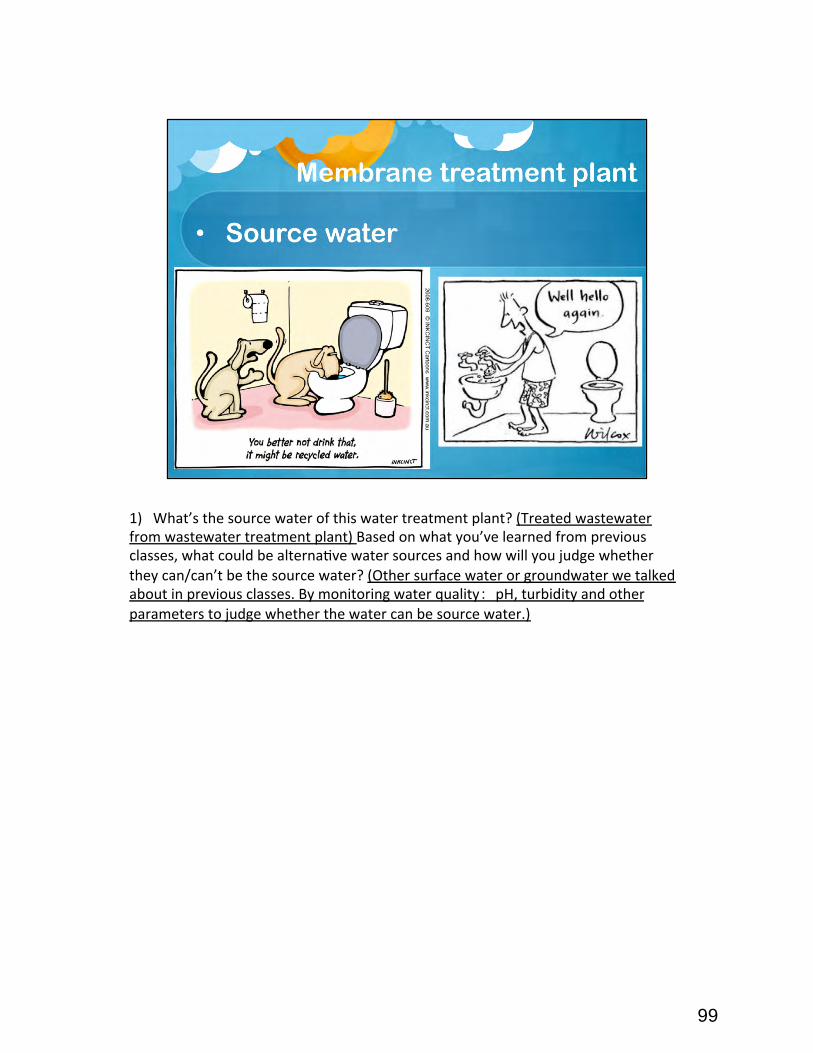
1) What’s the source water of this water treatment plant? (Treated wastewater from wastewater treatment plant) Based on what you’ve learned from previous classes, what could be alterna>ve water sources and how will you judge whether they can/can’t be the source water? (Other surface water or groundwater we talked about in previous classes. By monitoring water quality: pH, turbidity and other parameters to judge whether the water can be source water.)
99
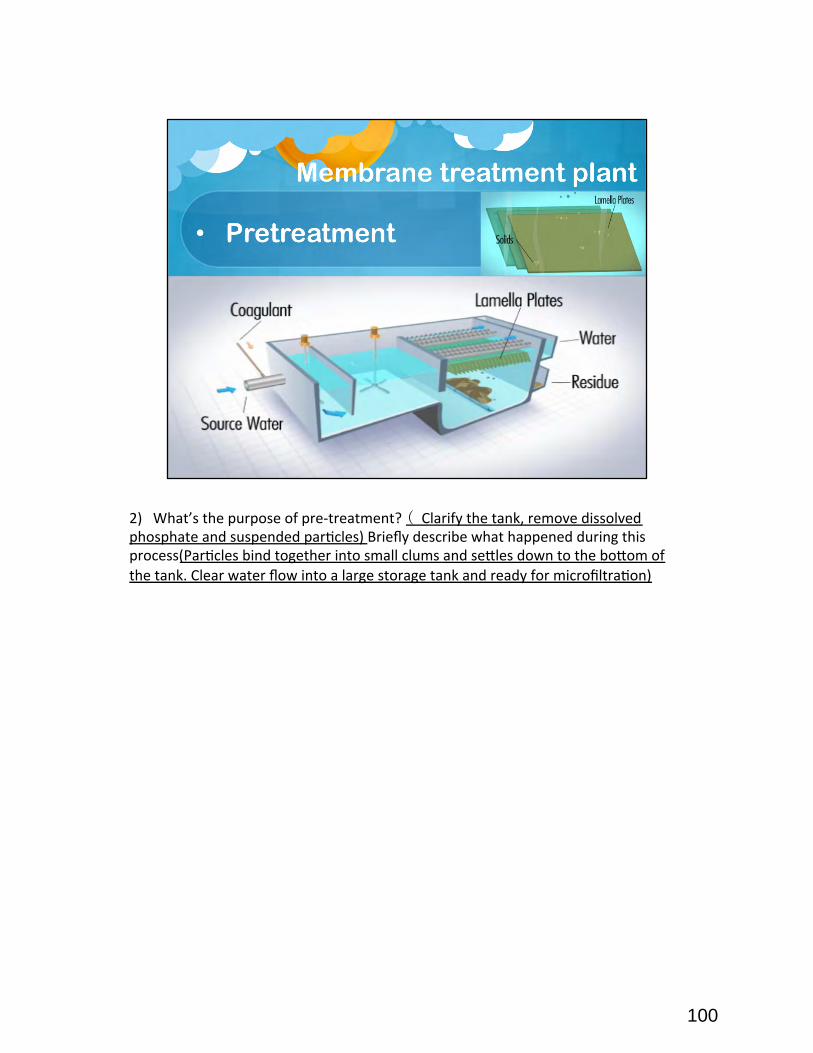
2) What’s the purpose of pre-‐treatment? ( Clarify the tank, remove dissolved phosphate and suspended par>cles) Briefly describe what happened during this process(Par>cles bind together into small clums and se^les down to the bo^om of the tank. Clear water flow into a large storage tank and ready for microfiltra>on)
100

3) What’s inside of the vessels? (Thousands of hollow fibers)
101
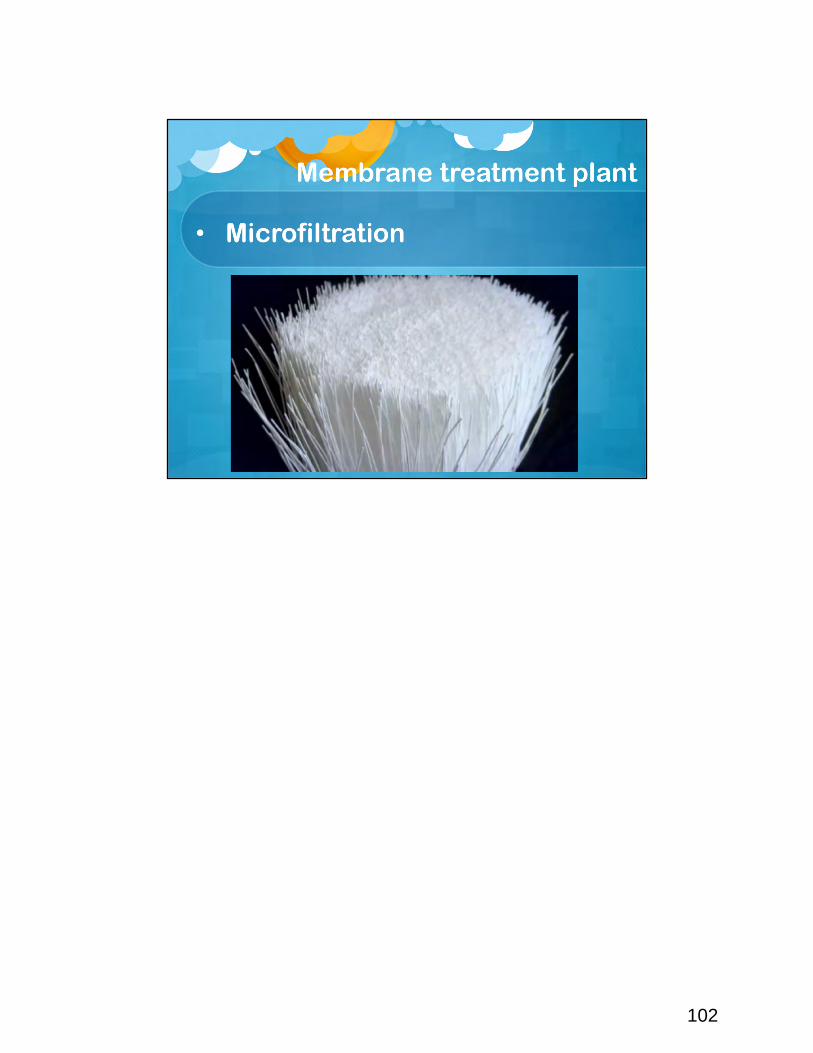
102
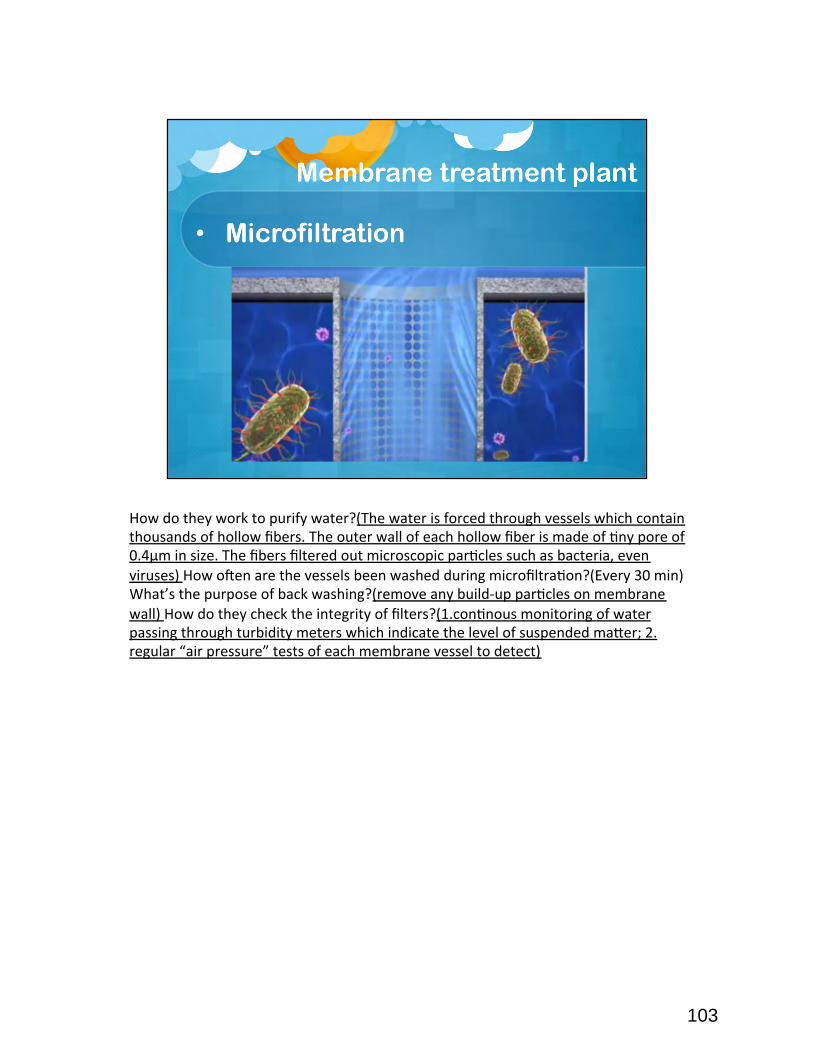
How do they work to purify water?(The water is forced through vessels which contain thousands of hollow fibers. The outer wall of each hollow fiber is made of >ny pore of 0.4μm in size. The fibers filtered out microscopic par>cles such as bacteria, even viruses) How oden are the vessels been washed during microfiltra>on?(Every 30 min) What’s the purpose of back washing?(remove any build-‐up par>cles on membrane wall) How do they check the integrity of filters?(1.con>nous monitoring of water passing through turbidity meters which indicate the level of suspended ma^er; 2. regular “air pressure” tests of each membrane vessel to detect)
103
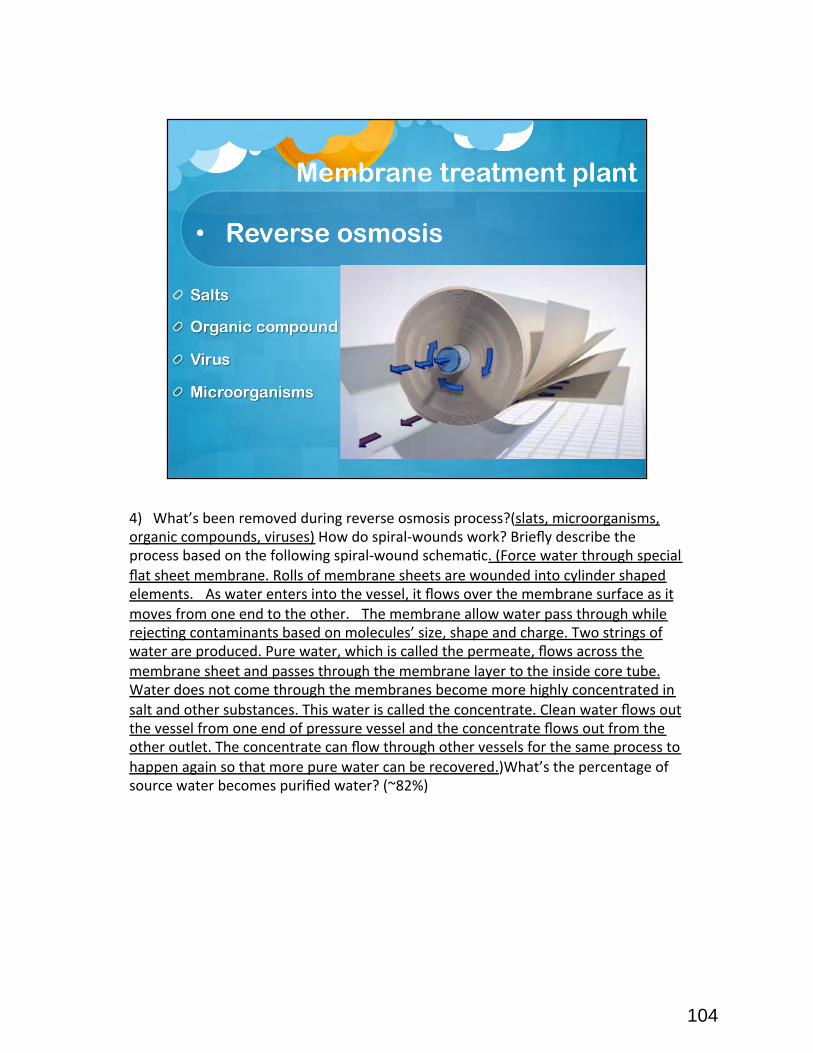
4) What’s been removed during reverse osmosis process?(slats, microorganisms, organic compounds, viruses) How do spiral-‐wounds work? Briefly describe the process based on the following spiral-‐wound schema>c. (Force water through special flat sheet membrane. Rolls of membrane sheets are wounded into cylinder shaped elements. As water enters into the vessel, it flows over the membrane surface as it moves from one end to the other. The membrane allow water pass through while rejec>ng contaminants based on molecules’ size, shape and charge. Two strings of water are produced. Pure water, which is called the permeate, flows across the membrane sheet and passes through the membrane layer to the inside core tube. Water does not come through the membranes become more highly concentrated in salt and other substances. This water is called the concentrate. Clean water flows out the vessel from one end of pressure vessel and the concentrate flows out from the other outlet. The concentrate can flow through other vessels for the same process to happen again so that more pure water can be recovered.)What’s the percentage of source water becomes purified water? (~82%)
104

5) What’s the purpose of UV-‐advanced oxida>on and how does it work? (Water is dosed with hydrogen peroxide and exposed to strong UV lights. It removes any trace of organic molecules. It can instantly destroy the gene>cs material-‐DNA within any virus and break down organic molecules.)
105
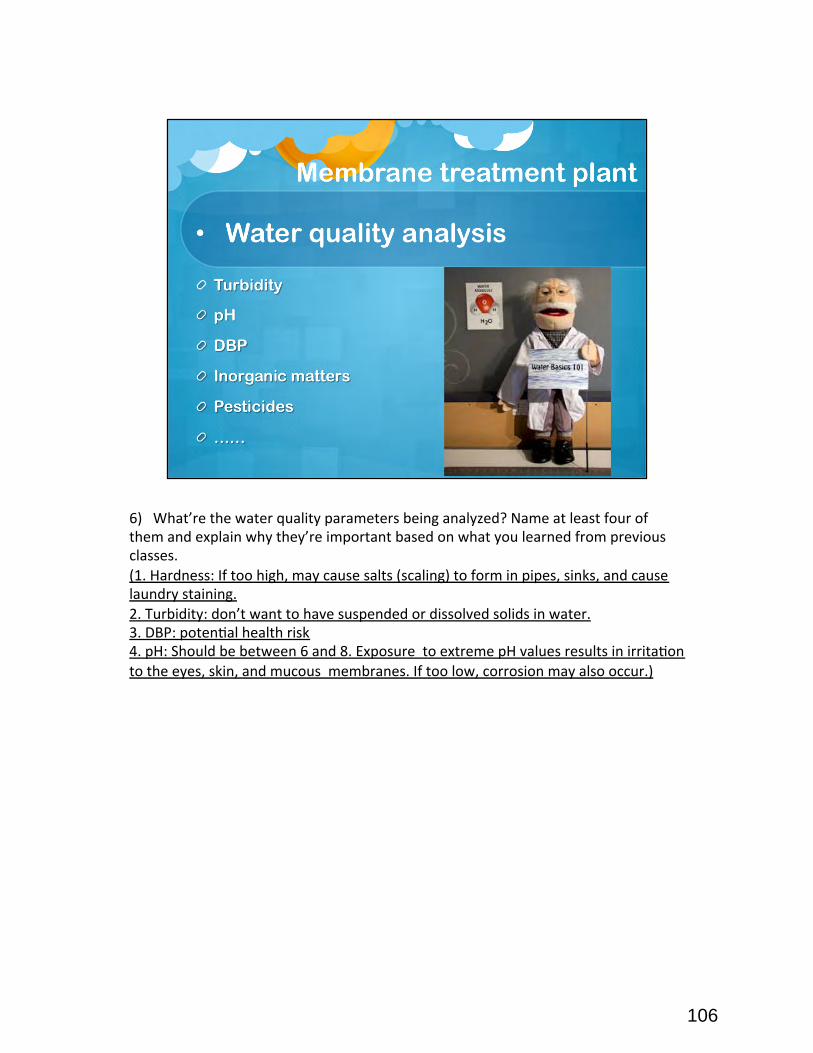
6) What’re the water quality parameters being analyzed? Name at least four of them and explain why they’re important based on what you learned from previous classes. (1. Hardness: If too high, may cause salts (scaling) to form in pipes, sinks, and cause laundry staining. 2. Turbidity: don’t want to have suspended or dissolved solids in water. 3. DBP: poten>al health risk 4. pH: Should be between 6 and 8. Exposure to extreme pH values results in irrita>on to the eyes, skin, and mucous membranes. If too low, corrosion may also occur.)
106
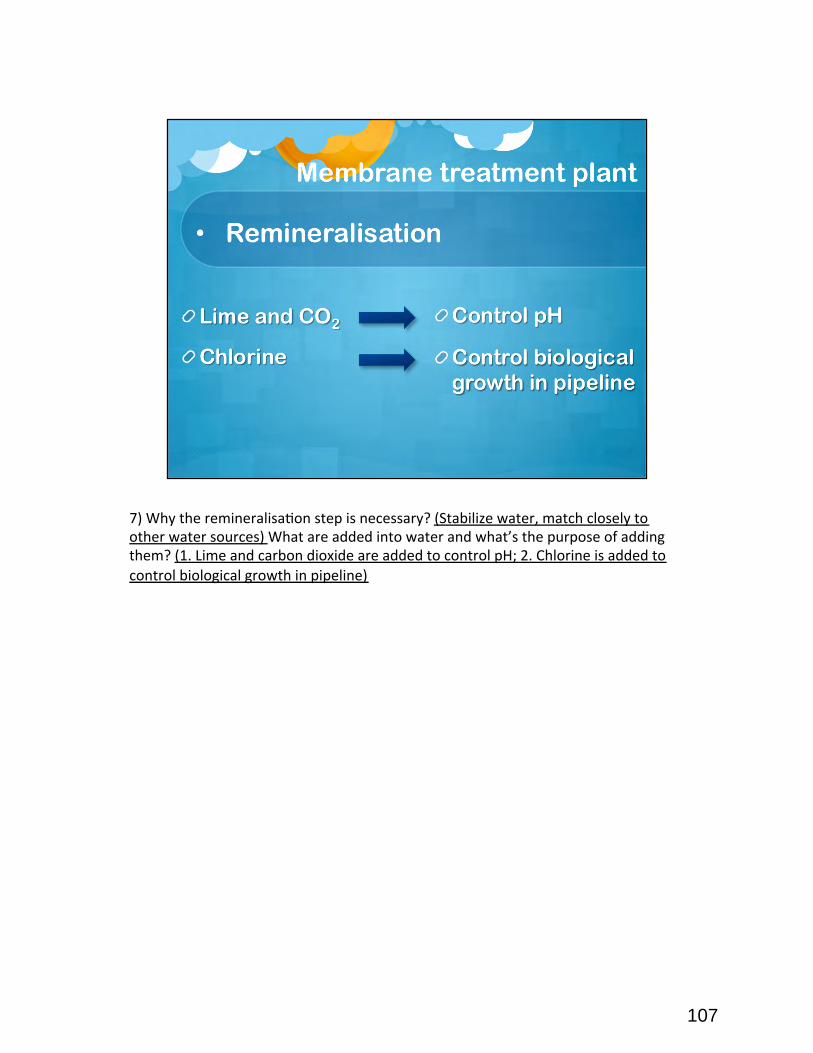
7) Why the remineralisa>on step is necessary? (Stabilize water, match closely to other water sources) What are added into water and what’s the purpose of adding them? (1. Lime and carbon dioxide are added to control pH; 2. Chlorine is added to control biological growth in pipeline)
107

108
Review Quiz: Water quality and water treatment
1. List 2 points of human exposure to water.
2. List 2 potential sources of contamination for our waters.
3. List 2 contaminants that may exist in our water. (hint: listed in water quality report card)
4. What does MCL stand for in the water quality report card?
5. List 2 sources of drinking water.
6. What does AOP stand for in water treatment?
109
7. Which of the following is a water quality parameter? (You may choose more than one answer.)
a. pH
b. Color
c. Turbidity
d. Odor
8. What is the correct order of treatments in a conventional drinking water treatment plant?
a. Filtration, disinfection, coagulation/flocculation/sedimentation
b. Coagulation/flocculation/sedimentation, filtration, disinfection
c. Disinfection, jar test
d. Carbonation, disinfection, desalination
9. What is the purpose of coagulation in water treatment?
a. Help particles in water stick together by using chemicals
b. Filter out particles in water
c. Inactivate microorganisms
d. Test water quality
10. Which one of the following is a commonly used disinfectant in drinking water treatment plants?
a. Sodium Chloride
b. Chlorine
c. Organic matter
d. A strong base
11. Which of the following can also be used for disinfection?
a. Nitrogen
b. Flocculation
c. Compartment bag test
d. UV light
110
12. Which of the following is an advanced treatment?
a. Disinfection
b. Clearwell storage
c. Jar test
d. Membrane filtration
13. Which of the following is a membrane technology? (You may choose more than one answer).
a. Microfiltration
b. Ultrafiltration
c. Nanofiltration
d. Reverse osmosis
14. Which of the following is NOT a membrane element configuration?
a. Tubular
b. Hollow fiber
c. Spiral wound
d. Permeate
15. Which of the following is a membrane operation configuration?
a. Cross flow
b. Complete mix
c. Plug flow
d. Filtration
111
Answer key:
1. Through our skin (Dermal exposure)
Ingestion
Inhalation
Intravenously
2. Stormwater runoff
Runoff from agricultural fields
Animal waste
Industrial dumping
Leaching from wastewater transmission pipes
etc.
3. Microbes
Radioactive Substances
Inorganics
Disinfectants
Disinfection by-‐products and precursors
Organic Chemicals
4. Maximum Contaminant Level
5. Surface water
Ground water
Seawater
Water reuse
6. Advanced oxidation process
112
7. a, b, c, d
8. b
9. a
10. b
11. d
12. d
13. a, b, c, d
14. d
15. a
113