Water Quality and its Importance for Eastern Brook …fwni.org/tpd/Water Quality Trout Habitat -...
70
Water Quality and its Importance for Eastern Brook Trout Kevin Gianini Introduction This is an interdisciplinary unit that is taught throughout the school year. The main goal is for students to develop their skills in using the scientific process as they make a positive contribution to their community. We begin by testing Sawyer Brook (in Grantham, NH) for e-coli. Next, we investigate the water cycle and the heat capacity of water. We then investigate watersheds and ideal eastern brook trout habitat. Students will also use a stream table to investigate stream geomorphology. The life cycle of the eastern brook is investigated as students document the developing trout that we will release into the brook behind our school in May. Students will conduct water quality assessments to ensure that we are releasing them into a healthy environment. The unit concludes in May when the fish are released and the students present their water quality data to New Hampshire Fish and Game. Topics The unit will consist of four related topics: 1. River geomorphology 2. Ecology and life cycle of brook trout 3. Watershed geology and geography 4. Physical, chemical, and biological assessment of water quality Objectives By the end of this unit my students will be able to: 1. Describe and illustrate the water cycle including the processes of precipitation, condensation, and evaporation. 2. Describe why it is important for town planners to consider stream geomorphology when planning construction projects. 3. Describe the life cycle of a brook trout. 4. Describe some aspects of brook trout ecology including organisms that benefit brook trout and those that indicate a healthy habitat. 5. Describe the local geology and geography of the Connecticut River Watershed. 6. Perform physical, biological, and chemical water quality assessments, hands on investigations, and follow the scientific process to find out if Sawyer Brook (in Grantham, NH) is an appropriate site to release brook trout. 7. Write a report and use it to create a Power point presentation of their watershed assessment data. This will be presented to a Judy Tumosa of New Hampshire Fish and Game. 8. The values I hope they gain from this experience are respect for our watershed, a desire to conserve and protect this resource, and an appreciation for our connection and dependence on it.
Transcript of Water Quality and its Importance for Eastern Brook …fwni.org/tpd/Water Quality Trout Habitat -...
Water Quality and its Importance for Eastern Brook Trout
Kevin Gianini
Introduction
This is an interdisciplinary unit that is taught throughout the school year. The main goal is for
students to develop their skills in using the scientific process as they make a positive contribution
to their community. We begin by testing Sawyer Brook (in Grantham, NH) for e-coli. Next, we
investigate the water cycle and the heat capacity of water. We then investigate watersheds and
ideal eastern brook trout habitat. Students will also use a stream table to investigate stream
geomorphology. The life cycle of the eastern brook is investigated as students document the
developing trout that we will release into the brook behind our school in May. Students will
conduct water quality assessments to ensure that we are releasing them into a healthy
environment. The unit concludes in May when the fish are released and the students present their
water quality data to New Hampshire Fish and Game.
Topics
The unit will consist of four related topics:
1. River geomorphology
2. Ecology and life cycle of brook trout
3. Watershed geology and geography
4. Physical, chemical, and biological assessment of water quality
Objectives
By the end of this unit my students will be able to:
1. Describe and illustrate the water cycle including the processes of precipitation,
condensation, and evaporation.
2. Describe why it is important for town planners to consider stream geomorphology when
planning construction projects.
3. Describe the life cycle of a brook trout.
4. Describe some aspects of brook trout ecology including organisms that benefit brook
trout and those that indicate a healthy habitat.
5. Describe the local geology and geography of the Connecticut River Watershed.
6. Perform physical, biological, and chemical water quality assessments, hands on
investigations, and follow the scientific process to find out if Sawyer Brook (in
Grantham, NH) is an appropriate site to release brook trout.
7. Write a report and use it to create a Power point presentation of their watershed
assessment data. This will be presented to a Judy Tumosa of New Hampshire Fish and
Game.
8. The values I hope they gain from this experience are respect for our watershed, a desire
to conserve and protect this resource, and an appreciation for our connection and
dependence on it.
New Hampshire Grade Five Standards Addressed
S:SPS1:6:1.1 Make observations and record measurements using a variety of tools and instruments. S:SPS1:6:1.2 Provide examples of how all organisms, including humans, impact their
environment; and explain how some changes can be detrimental to other organisms.
S:LS3:6:1.2 Explain how changes in environmental conditions can affect the survival of individual
organisms and the entire species.
S:SPS1:6:1.8 Ask questions about relationships between and among observations. S:SPS1:6:4.1 Use appropriate tools to organize, represent, analyze and explain data. S:SPS1:6:4.5 Draw appropriate conclusions based on data collected.
S:LS2:6:1.1 Identify and describe the factors that influence the number and kinds of organisms
an ecosystem can support, including the resources that are available, the differences in
temperature, the composition of the soil, any disease, the threat of predators, and competition
from other organisms.
S:LS3:6:1.1 Provide examples of how all organisms, including humans, impact their environment; and explain how some changes can be detrimental to other organisms. S:LS3:6:1.2 Explain how changes in environmental conditions can affect the survival of individual organisms and the entire species.
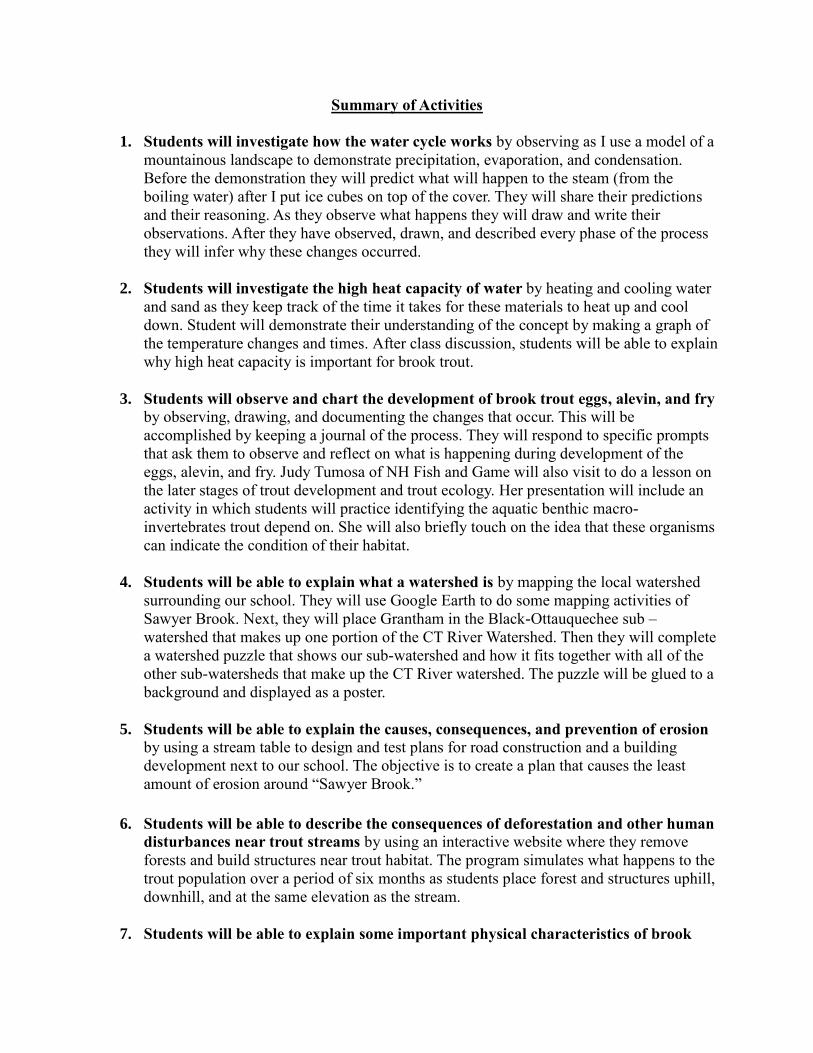
Summary of Activities
1. Students will investigate how the water cycle works by observing as I use a model of a
mountainous landscape to demonstrate precipitation, evaporation, and condensation.
Before the demonstration they will predict what will happen to the steam (from the
boiling water) after I put ice cubes on top of the cover. They will share their predictions
and their reasoning. As they observe what happens they will draw and write their
observations. After they have observed, drawn, and described every phase of the process
they will infer why these changes occurred.
2. Students will investigate the high heat capacity of water by heating and cooling water
and sand as they keep track of the time it takes for these materials to heat up and cool
down. Student will demonstrate their understanding of the concept by making a graph of
the temperature changes and times. After class discussion, students will be able to explain
why high heat capacity is important for brook trout.
3. Students will observe and chart the development of brook trout eggs, alevin, and fry
by observing, drawing, and documenting the changes that occur. This will be
accomplished by keeping a journal of the process. They will respond to specific prompts
that ask them to observe and reflect on what is happening during development of the
eggs, alevin, and fry. Judy Tumosa of NH Fish and Game will also visit to do a lesson on
the later stages of trout development and trout ecology. Her presentation will include an
activity in which students will practice identifying the aquatic benthic macro-
invertebrates trout depend on. She will also briefly touch on the idea that these organisms
can indicate the condition of their habitat.
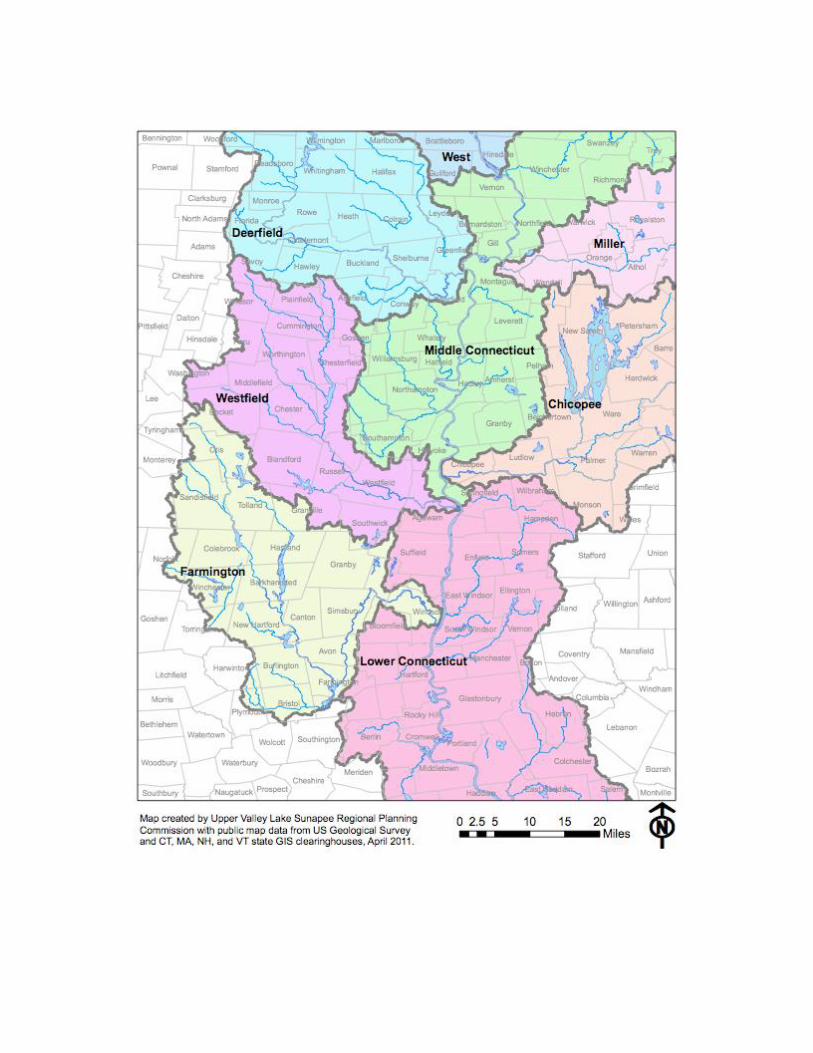
4. Students will be able to explain what a watershed is by mapping the local watershed
surrounding our school. They will use Google Earth to do some mapping activities of
Sawyer Brook. Next, they will place Grantham in the Black-Ottauquechee sub –
watershed that makes up one portion of the CT River Watershed. Then they will complete
a watershed puzzle that shows our sub-watershed and how it fits together with all of the
other sub-watersheds that make up the CT River watershed. The puzzle will be glued to a
background and displayed as a poster.
5. Students will be able to explain the causes, consequences, and prevention of erosion
by using a stream table to design and test plans for road construction and a building
development next to our school. The objective is to create a plan that causes the least
amount of erosion around “Sawyer Brook.”
6. Students will be able to describe the consequences of deforestation and other human
disturbances near trout streams by using an interactive website where they remove
forests and build structures near trout habitat. The program simulates what happens to the
trout population over a period of six months as students place forest and structures uphill,
downhill, and at the same elevation as the stream.
7. Students will be able to explain some important physical characteristics of brook

trout habitat by researching, drawing, and defining specific features that these fish
require. Then they will create a diorama of an ideal brook trout stream that includes all of
those features.
8. Students will be able to describe some of the benthic macro-invertebrates (BMIs)
that indicate good water quality for brook trout by participating in activities in which
they match pictures of these macro-invertebrates with descriptions. Then they will
practice performing BMI indexing using pictures of these organisms. (BMI indexing is an
analysis of the BMIs that helps determine water quality.) Finally, they will conduct field
work collecting BMIs from the brook behind the school, and perform BMI indexing to
assess the water quality. Jenna Guarino (Content Specialist) will help with the practice
activities and the field work.
9. Students will be able to explain some of the physical and chemical analyses used to
determine habitat health by measuring the depth, velocity, temperature, embeddedness,
turbidity, and dissolved oxygen of Sawyer Brook.
10. Students will use the data they collect from their fieldwork to write a report and
create a presentation using Power point software. The presentation will be shared with
NH Fish and Game.
Assessment
All of the activities summarized above will be assessed using the student performance rubric
below. The grading system of 1-4 is the same one we use on all assignments and report cards in
our school. Informal assessment of student input during discussions and activities will occur
throughout the unit as well.
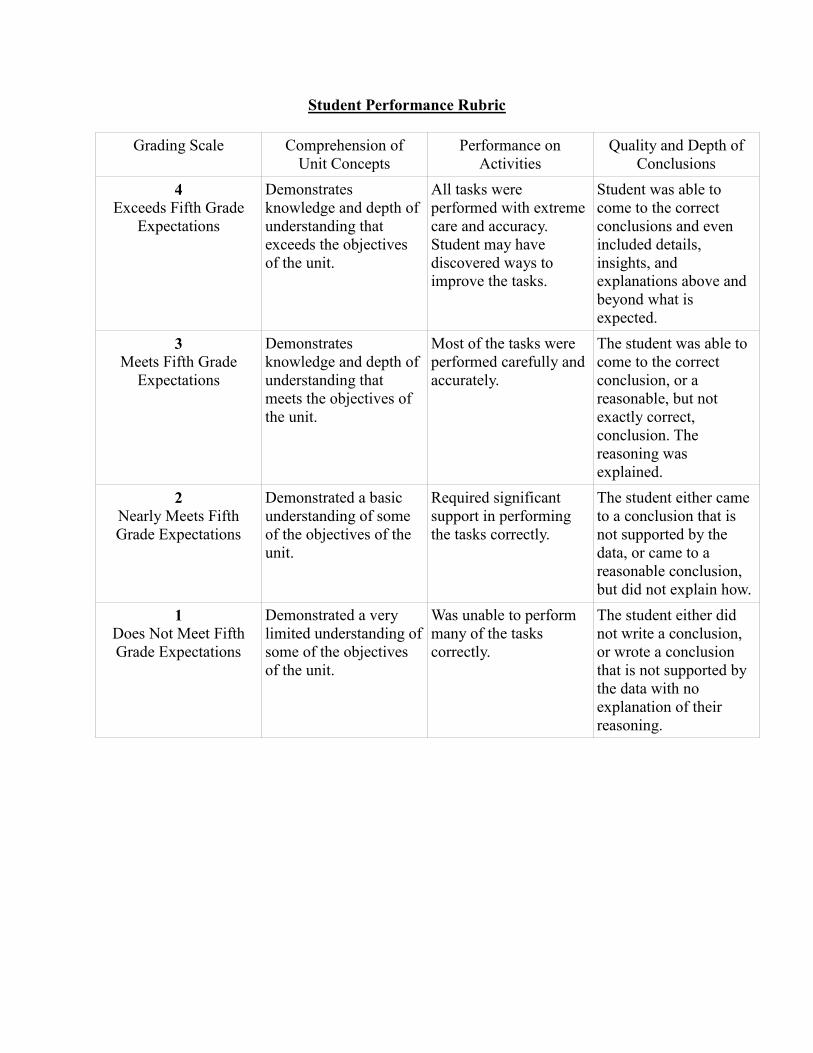
Student Performance Rubric
Grading Scale Comprehension of
Unit Concepts
Performance on
Activities
Quality and Depth of
Conclusions
4
Exceeds Fifth Grade
Expectations
Demonstrates
knowledge and depth of
understanding that
exceeds the objectives
of the unit.
All tasks were
performed with extreme
care and accuracy.
Student may have
discovered ways to
improve the tasks.
Student was able to
come to the correct
conclusions and even
included details,
insights, and
explanations above and
beyond what is
expected.
3
Meets Fifth Grade
Expectations
Demonstrates
knowledge and depth of
understanding that
meets the objectives of
the unit.
Most of the tasks were
performed carefully and
accurately.
The student was able to
come to the correct
conclusion, or a
reasonable, but not
exactly correct,
conclusion. The
reasoning was
explained.
2
Nearly Meets Fifth
Grade Expectations
Demonstrated a basic
understanding of some
of the objectives of the
unit.
Required significant
support in performing
the tasks correctly.
The student either came
to a conclusion that is
not supported by the
data, or came to a
reasonable conclusion,
but did not explain how.
1
Does Not Meet Fifth
Grade Expectations
Demonstrated a very
limited understanding of
some of the objectives
of the unit.
Was unable to perform
many of the tasks
correctly.
The student either did
not write a conclusion,
or wrote a conclusion
that is not supported by
the data with no
explanation of their
reasoning.

Water Cycle
Question:
What do you think the steam will do after we put the ice on top of the cover?
Procedure:
1. Observe what happens as Mr. Gianini pours the hot water into the tray.
Write your observations below, and draw this in your science notebook.
2. After the ice is put on top of the cover, observe the inside of the top of the
cover for a few minutes. Write your observations below, and draw this in
your science notebook.
Conclusions:
1. Think about the two changes you observed in step 2. Now, make a guess as
to why these changes took place.

What Heats up and Cools down Faster, Water or Sand? The Answer is Important to Brook
Trout Survival
Question:
1. What heats up and cools down faster, water or sand?
2. Why do you believe this?
Procedure:
1. Use a balance to measure 200 g of sand, and put it into one of the foam cups.
2. Pour 200 ml of water into the other foam cup. (Since 1 ml of water has a mass of 1 g, 200 ml
of water has a mass of 200 g. So use the balance.)
3. Attach the utility clamps to the ring stand.
4. Suspend the thermometers from the utility clamps with string. Adjust the height of each clamp
so the bulb of each thermometer is just covered by the sand or water. Make sure the thermometer
enters the sand and water at the center of the container.
5. Position the lamp 30 cm above the containers. Make sure the lamp gives an equal amount of
light to both containers.
6. Record the starting temperatures of the sand and water in the data table.
7. Turn on the lamp and record the temperatures of the sand and water every minute for 15
minutes. Make sure you also record observations and comments in the data table every time you
take a reading. For example: “water temperature rose faster this minute than it did the last
minute.”
8. After 15 minutes, turn the lamp off. Continue recording the temperatures of the sand and water
every minute for 15 more minutes.
9. Use your data table and grid paper to make a line graph that shows the temperature changes
and times for the water and the sand. The bottom of your graph should show the times, and the
side should show the temperatures. Make sure you use a different color line for the sand and the
water.

Conclusions: Answer these questions on the next page:
1. How much did the water and sand heat up after the first 15 minutes?
2. How much did the water and sand cool down after the last 15 minutes?
3. Which substance heated up faster?
4. Which substance kept its heat energy and cooled off more slowly?
5. If you add heat to matter (like water) the molecules that it’s made of move around faster.
The water needed more heat to get as hot as the sand because its molecules needed more
heat to start moving around faster. Why do you think water needs more heat to get the
molecules moving around faster? (Hint: Remember what we learned about water
molecules being “stuck” together.)
6. As we observed, water requires a lot of energy to heat up. This means that Sawyer Brook
will take longer to heat up in the spring than the land around it. Why is this important
for trout eggs laid by trout in the brook? (Hint: If trout eggs are kept cool, they grow
more slowly and hatch later in the spring. Think about how we are using he chiller to
keep the water in the tank cold so that the trout eggs don’t hatch too soon.)

Data Table
Time
(minutes)
Sand
Temperature
(Celsius)
Water
Temperature
(Celsius)
Comments
1
2
3
4
5
6
7
8
9
10
11
12
13
14
15
16
17
18
19
20
21
22
23
24
25
26
27
28
29
30

Water and Sand Temperature (Celsius)
T
E
M
P
E
R
A
T
U
R
E
T I M E
Testing Sawyer Brook for E coli
Learning Goals:
1. Students will learn that high levels of E coli can indicate pollution of the water from
septic systems and agricultural fields.
2. Students will learn how to use the Coliquant EZ test for E coli.
Materials:
Coliquant EZ - E coli test kit (available from Acorn Naturalists)
Cardboard box about 2 feet square
Heat lamp with a 100 watt bulb
thermometer
Directions:
1. Build background knowledge on the implications of excessive e-coli populations by reading “Water-Quality Indicators-Bacteria” and “How are Bacteria Measured?” with the
students.
2. About one week before you test the water source for e-coli, make an incubator using
the cardboard box by removing the top.
3. Place the heat lamp about 1 foot above the box shining down onto the box.
4. Place a thermometer in the box and let the temperature rise to its highest point.
5. You want the incubator to be 90-95 degrees F, so if it’s at that temperature keep the
lamp in that position. If not, raise or lower the lamp to adjust the temperature. It’s best
to make these adjustments before setting up the test so that it’s ready for when you
test the water. Keep track of the incubator temperature by having students record the
temperatures each day for one week. This will help you decide if adjustments needs to
be made.
6. To help the students build more background knowledge, show them the slide show
labeled “Slide Show E coli.”
7. Demonstrate to students the protocol described in the Coliquant EZ test kit.
8. Split students into groups of 3 and give each group a water sample vial.
9. Go outside to obtain water samples. Each group collects 1 sample.
10. Help students process the samples following the protocol described earlier. They should
include only 2 mL of the sample in the petri dish.
11. 24-72 hours later have students count the number of E coli colonies.
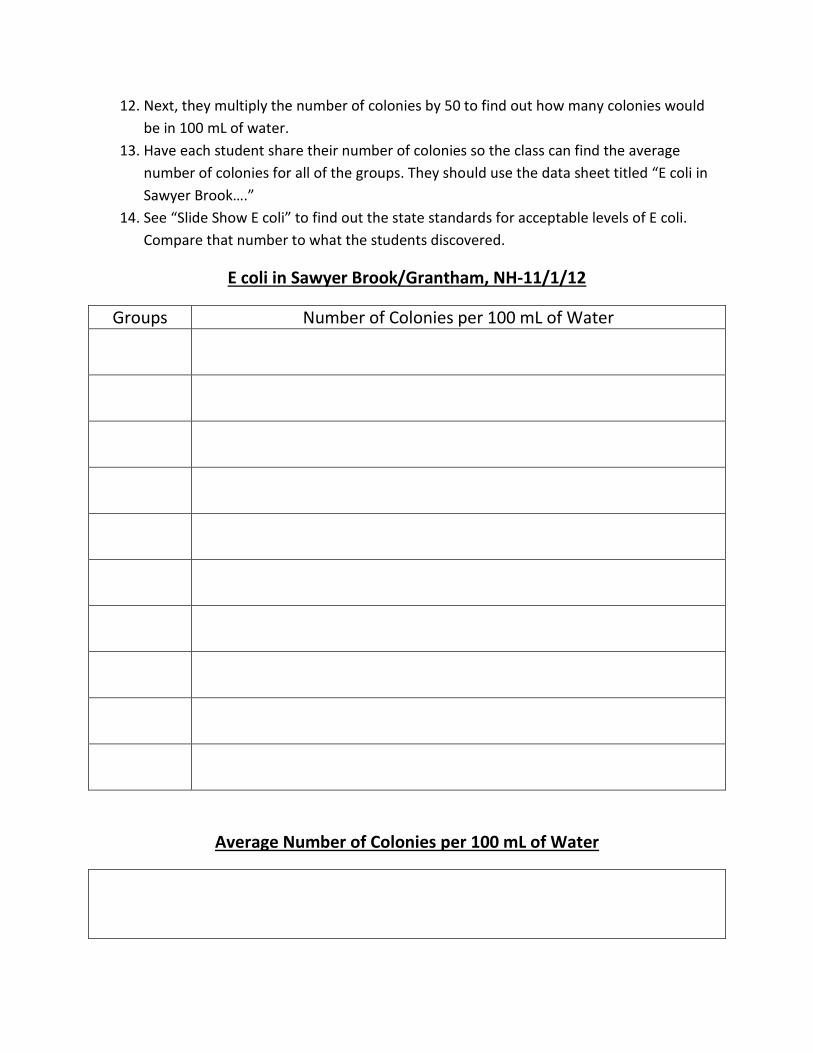
12. Next, they multiply the number of colonies by 50 to find out how many colonies would
be in 100 mL of water.
13. Have each student share their number of colonies so the class can find the average
number of colonies for all of the groups. They should use the data sheet titled “E coli in
Sawyer Brook….”
14. See “Slide Show E coli” to find out the state standards for acceptable levels of E coli.
Compare that number to what the students discovered.
E coli in Sawyer Brook/Grantham, NH-11/1/12
Groups Number of Colonies per 100 mL of Water
Average Number of Colonies per 100 mL of Water
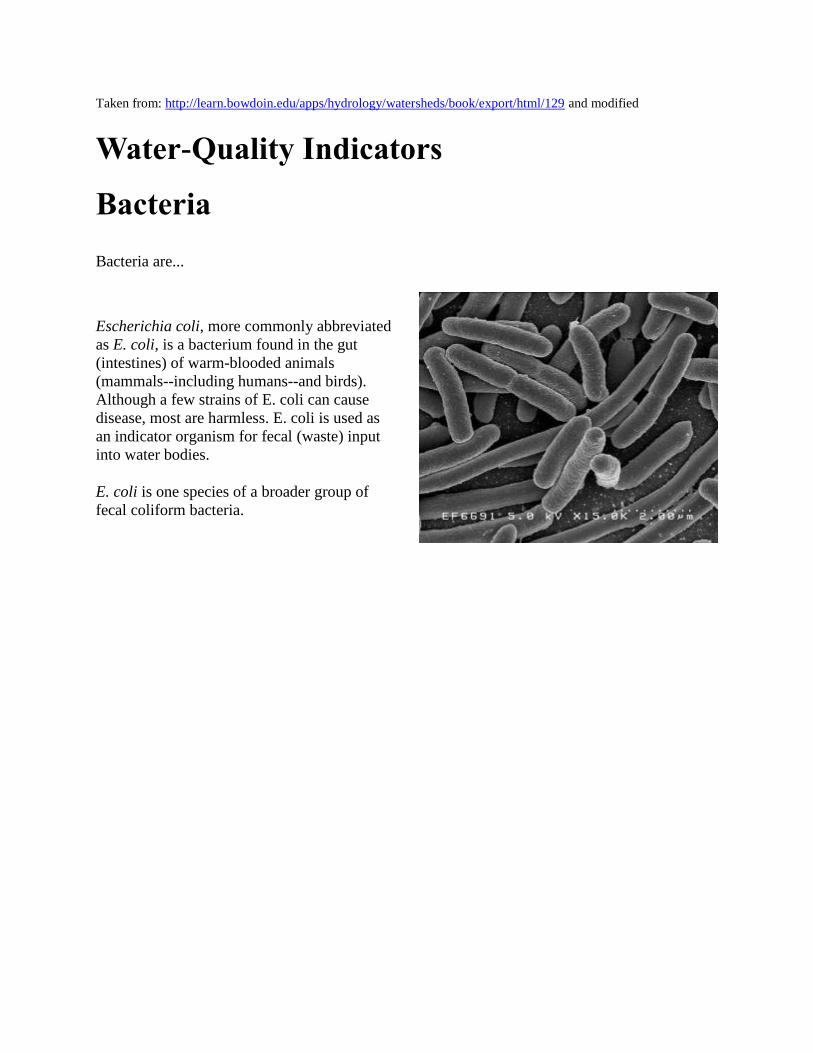
Taken from: http://learn.bowdoin.edu/apps/hydrology/watersheds/book/export/html/129 and modified
Water-Quality Indicators
Bacteria
Bacteria are...
Escherichia coli, more commonly abbreviated
as E. coli, is a bacterium found in the gut
(intestines) of warm-blooded animals
(mammals--including humans--and birds).
Although a few strains of E. coli can cause
disease, most are harmless. E. coli is used as
an indicator organism for fecal (waste) input
into water bodies.
E. coli is one species of a broader group of
fecal coliform bacteria.
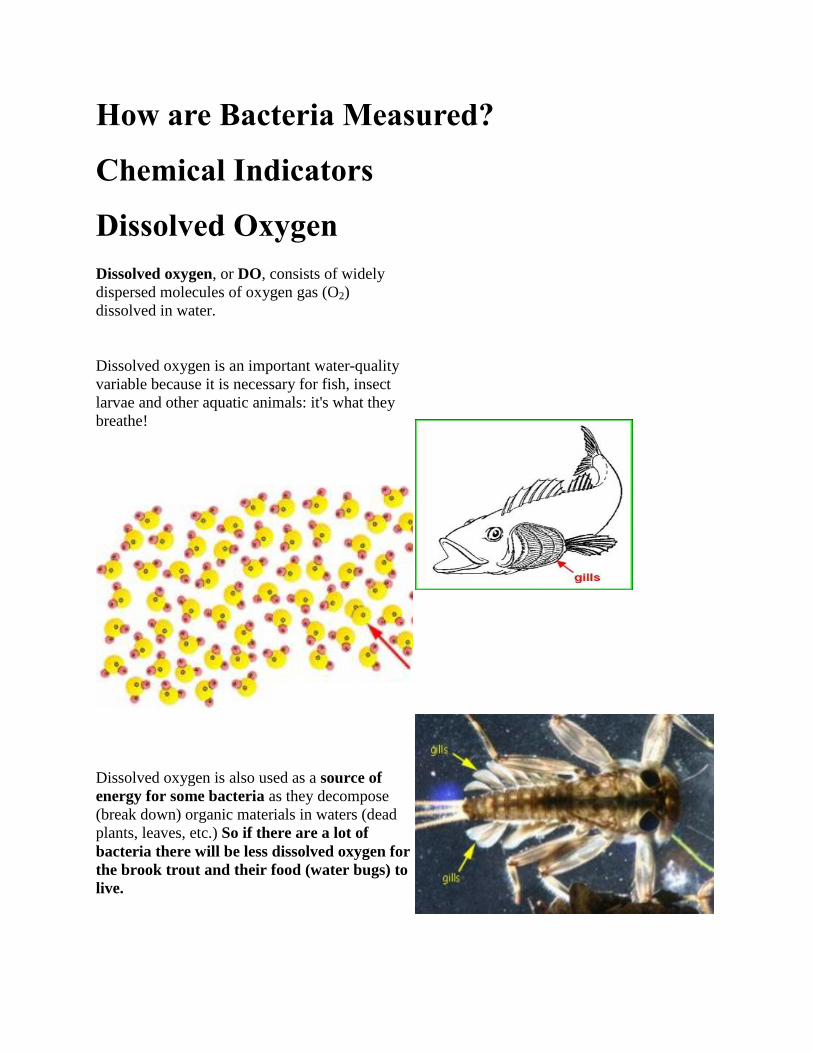
How are Bacteria Measured?
Chemical Indicators
Dissolved Oxygen
Dissolved oxygen, or DO, consists of widely
dispersed molecules of oxygen gas (O2)
dissolved in water.
Dissolved oxygen is an important water-quality
variable because it is necessary for fish, insect
larvae and other aquatic animals: it's what they
breathe!
Dissolved oxygen is also used as a source of
energy for some bacteria as they decompose
(break down) organic materials in waters (dead
plants, leaves, etc.) So if there are a lot of
bacteria there will be less dissolved oxygen for
the brook trout and their food (water bugs) to
live.
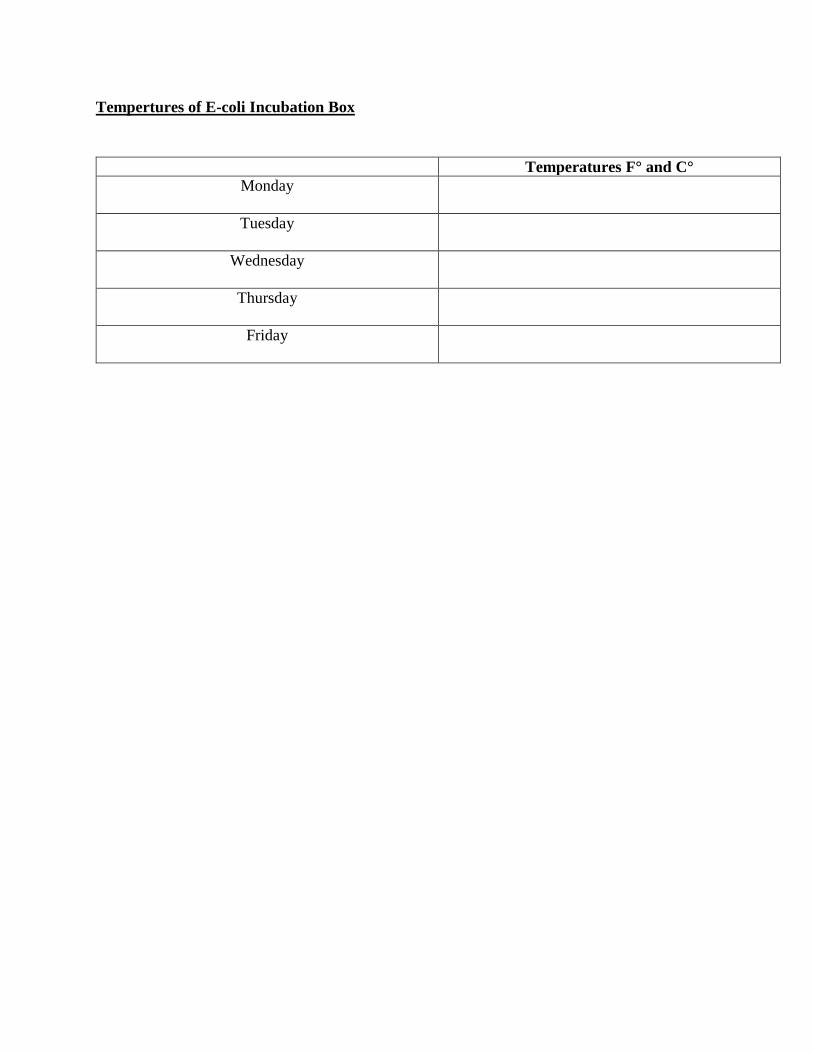
Tempertures of E-coli Incubation Box
Temperatures F° and C°
Monday
Tuesday
Wednesday
Thursday
Friday

What is a Watershed?
A watershed is an area of land, such as a
mountain or valley, which collects rainwater into a common outlet. In Hawai‘i, the common
outlet is ultimately the ocean. Some of the rain is absorbed by plants, some of it is absorbed
underground, and the rest flows into surface rivers and streams. A critical component of a
watershed’s ability to collect rainwater is the existence of forests. Fog condensing on trees high
up in watershed areas can increase
rainfall collection and absorption by as much as 30% annually.
The Hawaiian equivalent of a watershed is the ahupua‘a. In Hawaiian cultural tradition, an
ahupua‘a is a land division with the streams and valleys serving as boundaries, varying on
different islands from as little as 100 acres to more than 100,000 acres. Ahupua‘a included the
land from the mountains to the coast, and the coastal ocean extending out to and including the
coral reef. Native Hawaiians also recognized the importance of forests in water production,
described in this proverb: “Hahai nō ka ua i ka ulu lā’au” – Rain always follows the forest (click
here to read more about linkages between forested watersheds and Native Hawaiian cultural
resources).
“In Hawai‘i, the most valuable product of the forest is water, rather than wood.”
— Ralph S. Hosmer, First Territorial Forester

Connecticut River Watershed Puzzle
1. Cut out each piece along the inner border.
2. Fit the pieces together correctly.
3. Show it to an adult to be sure it’s correct.
4. Glue each sub-watershed piece together with a glue stick.
5. Find Grantham and outline it with a black sharpie.
6. Color each sub-watershed a different color using only colored pencil.
7. Glue the attached sub-watersheds on to a poster board.
8. Outline the CT River using pencil first. Then after you have it checked by an
adult, outline it with a blue sharpie.
9. Use the map on the back to draw the states where the CT River Watershed
is.

STUDENT ACTIVITY
CONNECTICUT RIVER WATERSHED PUZZLE For this activity, explain to students that many sub-watersheds fit together like puzzle pieces to make the entire the Connecticut River watershed. Cut out the Connecticut River sub-watersheds on the following pages, then have students fit them together to form the entire four-state watershed (see diagram below). Note: You may want to photocopy these puzzle pieces on stiff paper so they are easier to work with. We suggest that you tape the pieces together and post this map on a wall where everyone in the school can see it during your WoW Express visit. Other student activities to do with the assembled map:
Use other maps to find their school’s location and mark it with a star.
Add the names of the major rivers, lakes, and cities in your area.
Research the birds that migrate along the Connecticut River and add their pictures to the map.
Write a story about the adventures of a water drop as it travels from the boundary of your subwatershed down to the Connecticut River and out to Long Island Sound. What happens to the water drop when it gets to the ocean?
Research the history of the Connecticut River valley and add historical points of interest to the map.
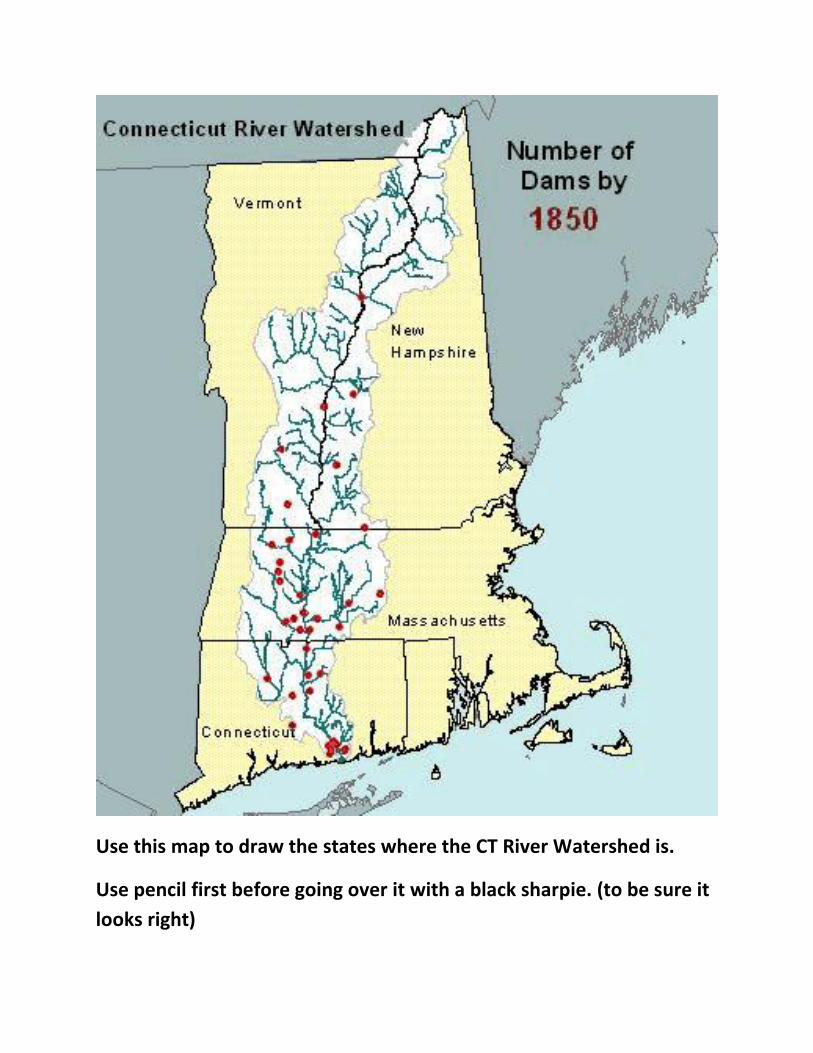
Use this map to draw the states where the CT River Watershed is.
Use pencil first before going over it with a black sharpie. (to be sure it
looks right)
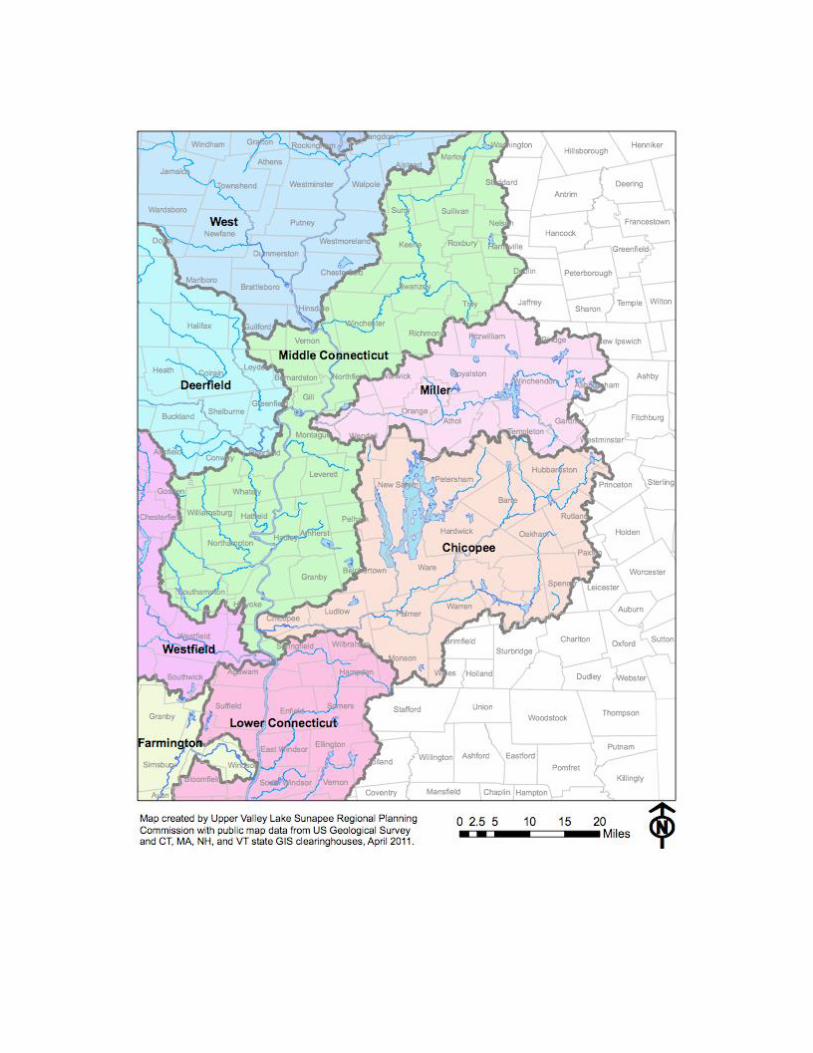
When you have finished putting together your watershed puzzle go to the
following website to find out about Sawyer Brook:
http://vt.water.usgs.gov/projects/ct_atlas/index.htm
1. Scroll down and click on “Start Stream Information Tool.”
2. Click “hybrid.”
3. Zoom in on Grantham and find Learning Drive. You have found GVS.
4. Continue to zoom in until you can clearly see Sawyer Brook behind the
school.
5. Double click on the brook and wait for information to come up. Click on
“Stream and Watershed Characteristics Report.”
6. Observe the blue outline. You have now found the local watershed that
drains into Sawyer Brook.
7. Zoom out until you can see where our Sawyer Brook watershed is located
in the entire CT River Watershed.
8. Outline our Sawyer Brook Watershed on the CT River Watershed map
that you made with your group.
9. Go to the “Stream Information Report” page. Scroll down to the second
page and find the “mean annual temperature” of the brook and write it
down on the back of this sheet. This is the brook’s average temperature
throughout the year.
10. On the same page find out if there are any “toxic release sites” or “point
sources” of pollution. Write the answers on the back of this sheet.
11. Scroll down to page 3 and find out “the percent developed” (houses,
buildings) and “the percent forested.” Write the answers on the back of
this sheet.
12. Type up these facts that you discovered and attach it to the border of
your CT River Watershed map.


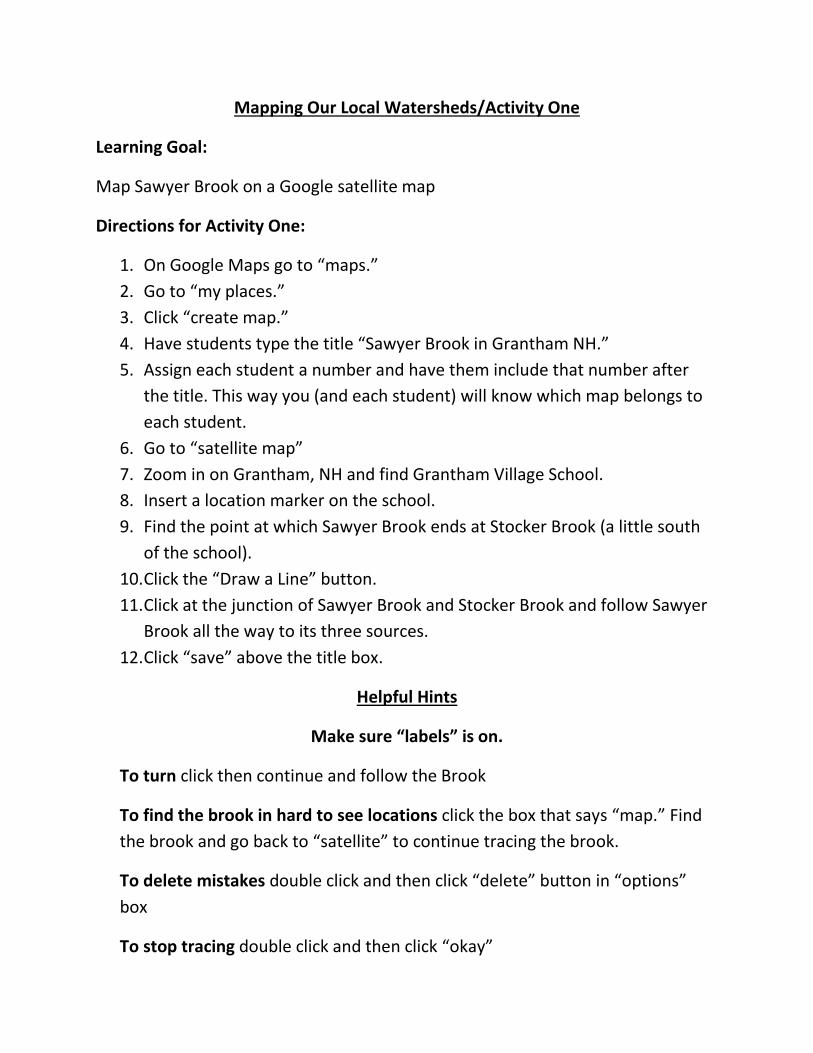
Mapping Our Local Watersheds/Activity One
Learning Goal:
Map Sawyer Brook on a Google satellite map
Directions for Activity One:
1. On Google Maps go to “maps.”
2. Go to “my places.”
3. Click “create map.”
4. Have students type the title “Sawyer Brook in Grantham NH.”
5. Assign each student a number and have them include that number after
the title. This way you (and each student) will know which map belongs to
each student.
6. Go to “satellite map”
7. Zoom in on Grantham, NH and find Grantham Village School.
8. Insert a location marker on the school.
9. Find the point at which Sawyer Brook ends at Stocker Brook (a little south
of the school).
10. Click the “Draw a Line” button.
11. Click at the junction of Sawyer Brook and Stocker Brook and follow Sawyer
Brook all the way to its three sources.
12. Click “save” above the title box.
Helpful Hints
Make sure “labels” is on.
To turn click then continue and follow the Brook
To find the brook in hard to see locations click the box that says “map.” Find
the brook and go back to “satellite” to continue tracing the brook.
To delete mistakes double click and then click “delete” button in “options”
box
To stop tracing double click and then click “okay”
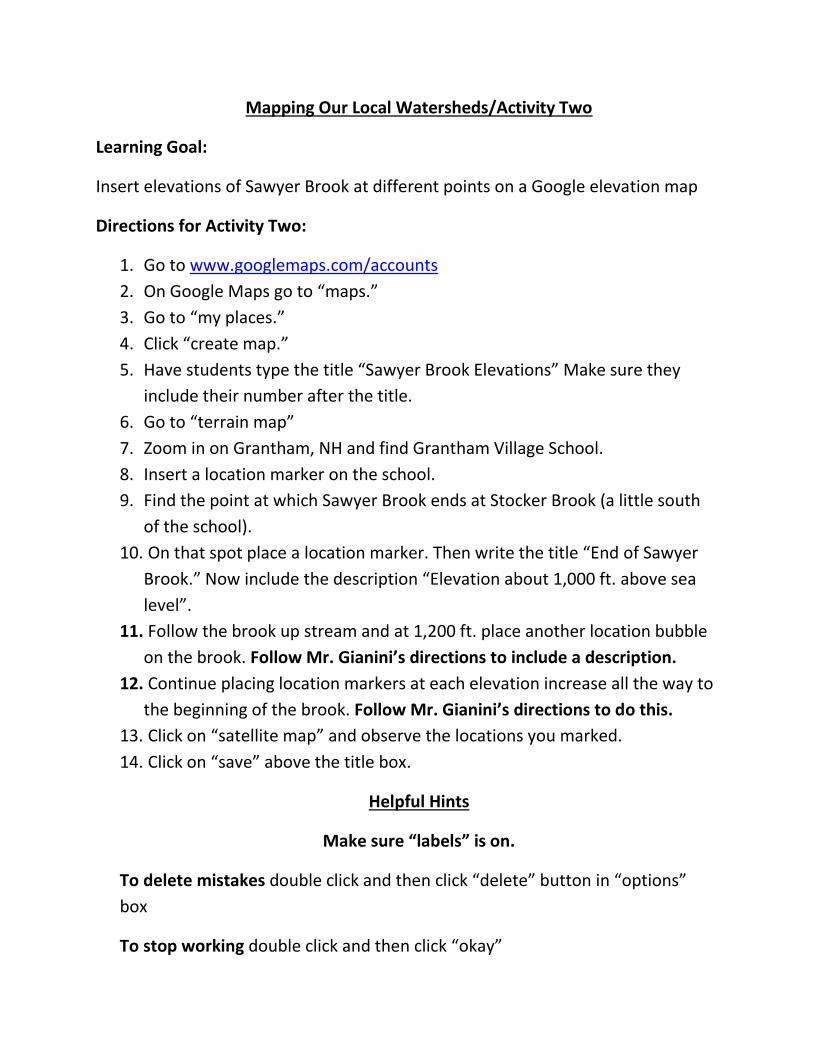
Mapping Our Local Watersheds/Activity Two
Learning Goal:
Insert elevations of Sawyer Brook at different points on a Google elevation map
Directions for Activity Two:
1. Go to www.googlemaps.com/accounts
2. On Google Maps go to “maps.”
3. Go to “my places.”
4. Click “create map.”
5. Have students type the title “Sawyer Brook Elevations” Make sure they
include their number after the title.
6. Go to “terrain map”
7. Zoom in on Grantham, NH and find Grantham Village School.
8. Insert a location marker on the school.
9. Find the point at which Sawyer Brook ends at Stocker Brook (a little south
of the school).
10. On that spot place a location marker. Then write the title “End of Sawyer
Brook.” Now include the description “Elevation about 1,000 ft. above sea
level”.
11. Follow the brook up stream and at 1,200 ft. place another location bubble
on the brook. Follow Mr. Gianini’s directions to include a description.
12. Continue placing location markers at each elevation increase all the way to
the beginning of the brook. Follow Mr. Gianini’s directions to do this.
13. Click on “satellite map” and observe the locations you marked.
14. Click on “save” above the title box.
Helpful Hints
Make sure “labels” is on.
To delete mistakes double click and then click “delete” button in “options”
box
To stop working double click and then click “okay”

Mapping Our Local Watersheds/Activity Three
Learning Goal:
Insert locations of possible sources of pollution along Sawyer Brook on a Google
satellite map
Directions for Activity Three:
1. Go to www.googlemaps.com/accounts
2. On Google Maps go to “maps.”
3. Go to “my places.”
4. Click “create map.”
5. Have students type the title “Possible Source of Pollution for Sawyer Brook”
Make sure they include their number after the title.
6. Go to “satellite map”
7. Zoom in on Grantham, NH and find Grantham Village School.
8. Now find the small pond behind the school. (It’s next to Sawyer Brook.)
9. Insert a location marker on that pond and follow Mr. Gianini’s directions to
write a title and description.
10. Follow Mr. Gianini’s directions to mark the locations of possible sources of
pollution all the way to the beginning of the brook.
11. Click on “save” above the title box.
Helpful Hints
Make sure “labels” is on.
To delete mistakes double click and then click “delete” button in “options” box
To stop working double click and then click “okay”
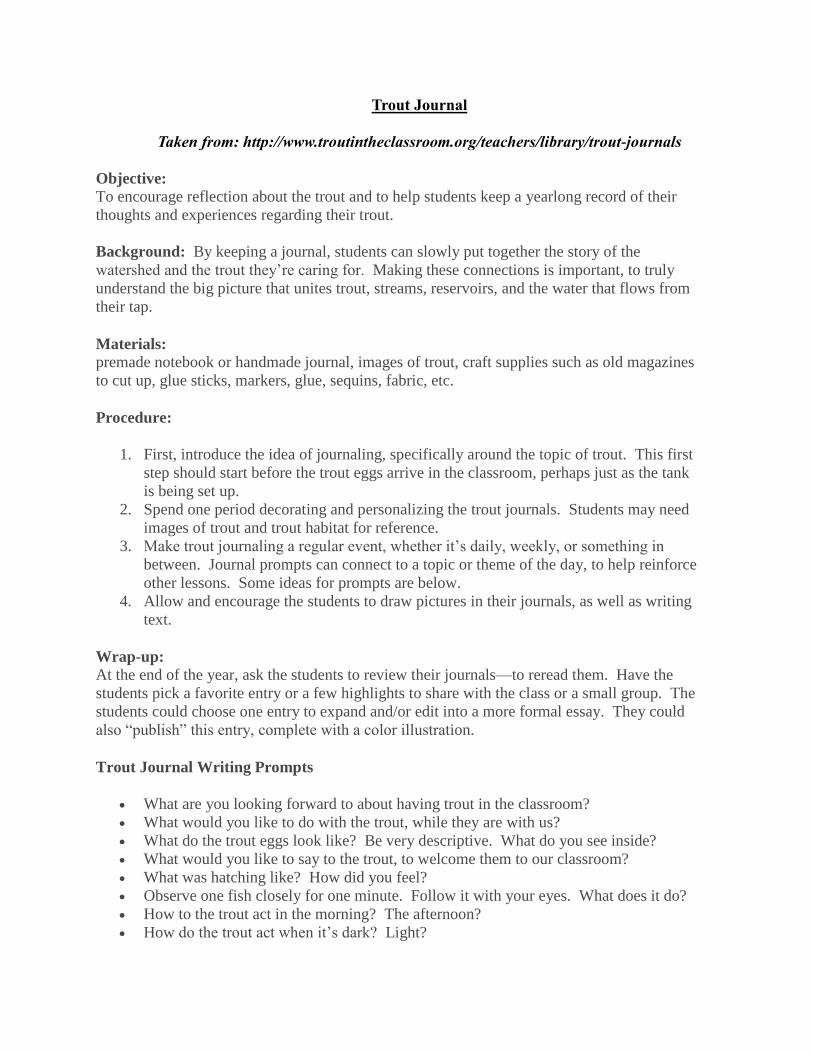
Trout Journal
Taken from: http://www.troutintheclassroom.org/teachers/library/trout-journals
Objective: To encourage reflection about the trout and to help students keep a yearlong record of their
thoughts and experiences regarding their trout.
Background: By keeping a journal, students can slowly put together the story of the
watershed and the trout they’re caring for. Making these connections is important, to truly
understand the big picture that unites trout, streams, reservoirs, and the water that flows from
their tap.
Materials: premade notebook or handmade journal, images of trout, craft supplies such as old magazines
to cut up, glue sticks, markers, glue, sequins, fabric, etc.
Procedure:
1. First, introduce the idea of journaling, specifically around the topic of trout. This first
step should start before the trout eggs arrive in the classroom, perhaps just as the tank
is being set up.
2. Spend one period decorating and personalizing the trout journals. Students may need
images of trout and trout habitat for reference.
3. Make trout journaling a regular event, whether it’s daily, weekly, or something in
between. Journal prompts can connect to a topic or theme of the day, to help reinforce
other lessons. Some ideas for prompts are below.
4. Allow and encourage the students to draw pictures in their journals, as well as writing
text.
Wrap-up: At the end of the year, ask the students to review their journals—to reread them. Have the
students pick a favorite entry or a few highlights to share with the class or a small group. The
students could choose one entry to expand and/or edit into a more formal essay. They could
also “publish” this entry, complete with a color illustration.
Trout Journal Writing Prompts
What are you looking forward to about having trout in the classroom?
What would you like to do with the trout, while they are with us?
What do the trout eggs look like? Be very descriptive. What do you see inside?
What would you like to say to the trout, to welcome them to our classroom?
What was hatching like? How did you feel?
Observe one fish closely for one minute. Follow it with your eyes. What does it do?
How to the trout act in the morning? The afternoon?
How do the trout act when it’s dark? Light?

How do the trout act before feeding? After?
How do the trout act in cold weather? Warm weather?
What is your favorite trout job? Why?
What is your least favorite trout job? Why?
What happens when we feed the trout? Why do you think that is?
Are there any special trout in your tank? Why are they special?
What do you think the trout see when they look out of the tank? What are they
thinking?
How have the trout changed over the past few months? What is the same?
How do you feel about our upcoming release of trout? Why?
What advice would you give our trout on their way to their new home?
What did you see while releasing our trout? How did they behave?
How did you feel about releasing our trout? Why?
What was the most important thing you learned from raising trout?

Trout Development
Date Temperature Percent of
Development Today
Total Percent of
Development
2/29 40.0 F .714% 47.71%
3/1 40.0 F .714% 48.48%
3/2 39.9 F .708% 49.13%
Investigate the Effects of Development Near Trout Habitat
Learning Goal:
Find out how the construction of park can affect a nearby brook trout.
Directions for Investigation:
1. Log on to the internet and Google “pond-er this discovery,” read the
introduction with the class.
2. Follow directions on your computer as Mr. Gianini models how to do the
investigation. Be sure to write the results on the data sheet you were given.
3. Try running more tests on your own. First you must include the parking lot,
hiking trails, and playground equipment in all the possible locations.
(There are 6 different combinations possible). Then you can include
whichever things you want until your data sheet is completed. Don’t
forget to record your results after every test.
4. On your data sheet, look at the number of fish still alive at the end of
August. Put a star next to the combination that includes hiking trails,
parking lot, and playground equipment with the highest number of live
fish. Put a check mark next to the combination that includes hiking trails,
parking lot, and playground equipment with the lowest number of live
fish.
Conclusions:
1. Write the names of the things you put in each location for the combination
with the highest number of live fish at the end of August.
Area 1 Area 2 Area 3
2. Explain why you think that combination worked the best.
3. Write the names of the things you put in each location for the combination
with the lowest number of live fish at the end of August.
Area 1 Area 2 Area 3
4. Explain why you think so many fish died with that combination.
5. Pretend you are a developer in the real world and you want to build an
apartment complex with 10 units. The land you want to build on is
wooded. Part of it is uphill from a brook trout stream, and the rest is
downhill from the stream. You must use all of the property. Use
construction paper to draw a diagram of how you would build the
complex. Your goal is to place each part of the complex in a location that is
least likely to damage the stream. Show it from the side so that the uphill
and downhill areas can be seen. Be sure to label the diagram.
Then use writing paper to write a paragraph explaining why each thing is
in the location you placed it. Glue the paragraph on to the back of your
diagram. Don’t forget to include an introduction that explains what you’re
writing about, and a conclusion to sum up what you have written.
You must include the following:
a road leading into the complex
an apartment building
one parking lot
a recreation area that includes 3 play structures
a wooded area with hiking trails

Dream Stream
Taken from: http://www.troutintheclassroom.org/teachers/library/dream-stream
Objective: To verify that students understand the anatomy of a healthy stream, purposes of various parts,
and vocabulary to describe trout streams.
Background:
The clean cold streams of the Catskill Mountains provide an ideal habitat for trout and a
reliable source of drinking water for over 8 million New York City residents. The health of a
stream depends on many factors including vegetation, surrounding land, forested cover and
substrate. New York City's watershed steams and surrounding lands are monitored and taken
care of in order to protect the valuable resource of clean, cool and fresh water.
A healthy stream has many important parts. First, it has a partially to fully rocky substrate
(stream bed), such as gravel or boulders. As the cool water flows, it meanders (weaves back and
forth) over and around this substrate. The pattern of rocks and gravel makes the water act
differently in different parts of the stream. Sometimes, the water pools in flatter, calmer areas
and the water flow slows. In other areas, the highly variable substrate creates riffles—the areas
of bubbly, white water—that help oxygenate the water. When water flows quickly without
interruption by substrate, this is a run.
A healthy stream also holds and is bordered by many living things. Aquatic
macroinvertebrates, such as insects, mollusks, and crustaceans, live in every level of the water
column. Fish and plants also live within the stream. Then, the riparian zone—the area next to
the stream—must also be full of life. A healthy riparian zone has trees, shrubs, and/or
herbaceous plants, as well as animal wildlife. This riparian zone (the roots and debris) helps
filter surface water runoff and groundwater that might carry sediments and other pollutants that
would otherwise enter the stream.
Materials: images of healthy trout streams (start at www.tu.org), shoeboxes or other small boxes,
construction paper, glue, glue sticks, saran wrap, clay, and natural materials such as sticks, rocks,
leaves, small plants, etc.
Procedure:
1. Share trout stream images and vocabulary with your students, using magazines, books, or
the internet. (Older students can do this research themselves.)
2. Ask the students to imagine, in their minds’ eyes, the perfect trout stream. What is in the
stream? What is the shape of the stream’s path? What grows next to the stream? Where
are the best trout hiding spots?
3. In their shoeboxes, ask students to delineate their “dream stream” path, using a
pencil. This is a good first step to help them plan out everything else.
4. Now, let them go with materials. Students can use anything they brought or found, as

well as share with others. Gravel makes great substrate. Sticks with leaves or paper
make excellent trees, and stand up well in little balls of clay. As a final touch, it’s nice to
add saran wrap as the stream water.
5. Wrap-up: In small groups or as a class, ask students to share their dream streams with each
other. Have them give a tour. Perhaps they can give the tour as an angler, trout, or
mayfly, pointing out what is most important to them from that perspective.
Write the definitions of these terms. Then draw an example of each term on
the back.
1. Substrate
2. Pool
3. Riffle
4. Aquatic macro-invertebrate
5. Riparian zone
6. Runoff
7. Sediment

Building Your Dream Stream
You will build a stream that is ideal for brook trout using a box, construction paper,
sticks, plastic wrap, clay, glue, rocks, leaves, small plants and other natural
materials.
1. Imagine in your mind’s eye the perfect trout stream. What is the shape of the
stream’s path? What is in the stream? What grows next to the stream? Where
are the best trout hiding spots?
2. Use a pencil to draw the stream path. Be sure to include a pool.
3. Use the pictures and definitions of the terms you worked on so that you can
show the answers to the questions from step 1. Every term should be shown
in your project, and each one must be numbered so that you can include a
key that explains what each object is.
Helpful Hints:
Gravel, sand, and soil make great substrate.
Sticks with leaves or paper make excellent trees, and stand up well in little balls of
clay.
Plastic wrap over the surface of your stream makes it look more realistic. Color the
underside blue to make it look more like water.
Narrow strips of plastic wrap colored blue underneath make good runoff.
Make sure that the riparian zone is slightly higher than the stream.
Have Fun!!!

Trout Interactive Data Sheet
Test Area 1 Area 2 Area 3 Trout Alive in the end of June
Trout Alive in the end of July
Trout Alive in the end of August

Station #1: The River Table
Adapted from WoW Express, Silvio O. Conte National Fish and Wildlife Refuge
Purpose: The purpose of this lesson is to introduce students to river and watershed terminology, the ways in
which rivers shape the earth’s surface, and management decisions that can be made to manage rivers more
effectively. This lesson will focus on additional concepts based on related state science standards specified for
each grade level. Additional topics may include the water cycle, natural resource management, and pollution.
Objectives: As a result of this lesson, students will be able to:
1. Define various terms related to watersheds and river geomorphology. 2. Describe how water can shape the earth’s surface. 3. Make decisions to effectively manage rivers. 4. Explain how pollution on land within the watershed can be carried into rivers, and ultimately the ocean.
Duration: 20 Minutes
Materials:
Emriver Em2 geomodel river table, with a meandering river channel formed through the center
Colored water in a squirt container
Objects for students to place in the river table, such as plastic houses, vegetation, farm animals, tractors, plastic parking lot, etc.
Instructional Procedures:
1) Begin with the water turned off. Introduce the river table and how it works, pointing out the recirculating water system. If the water cycle is part of the state standards of the group you are talking to, ask the students to explain how water is brought back to the top of the river in nature. Briefly explain the concepts of condensation, precipitation and evaporation and how these terms apply to watersheds.
2) Point out some main river features, such as the headwaters and the mouth of the river. Explain a little about the river meanders and how they form, including the outside bends (cut banks) and inside bends (point bars). Describe how erosion and deposition of sediments occurs in river bends.
3) Turn on the water to demonstrate these concepts to the students.
4) Hand each student a laminated vocabulary word. One word at a time, explain what the word means and allow the student to place it in the appropriate location on the river table.
5) Once all the words have been placed, ask the students to observe the river and tell you how it has changed since the water was turned on.
6) Hand each student a plastic item, such as vegetation, farms, farm animals or houses. Ask students to make a management decision about where they think the best location is for their item. One at a time, allow students to place their items on the table and explain why they chose the location that they did.
7) If pollution or natural resource management is part of the state standards of the group you are talking to, discuss how pollution on land can flow into rivers, and ultimately the ocean. Squirt food coloring, representing fertilizer, on the farm fields to show the students that groundwater can carry the fertilizer to rivers.
8) Place a flat piece of plastic next to the river to represent an impermeable parking lot. Squirt food coloring, representing oil and gas released from cars, on the plastic and ask students to observe what happens. Did more color go into the river from the ground water or the impermeable parking lot? Why do they think this happened? (Discuss the role of groundwater in filtering pollutants out of water)
9) Ask the students to come up with ways in which these pollution sources can be limited (for example, paving parking lots with permeable pavement). Also, discuss ways in which the students can help limit their contribution to pollution in their everyday lives.
10) As a conclusion to the activity, ask the students to raise their hands and answer some questions regarding watersheds and rivers. You should include questions about river behavior, vocabulary, pollution, ways that they can help limit pollution and their location within the CT River Watershed.
Assessment:
In the Post-Visit School Packet, teachers will be given a quick multiple-choice quiz to implement during class time.
The results of this quiz will be submitted to WoW Express personnel in order to evaluate student understanding.
Student work from the erosion prevention task will also be assessed for comprehension of the objectives described
above.
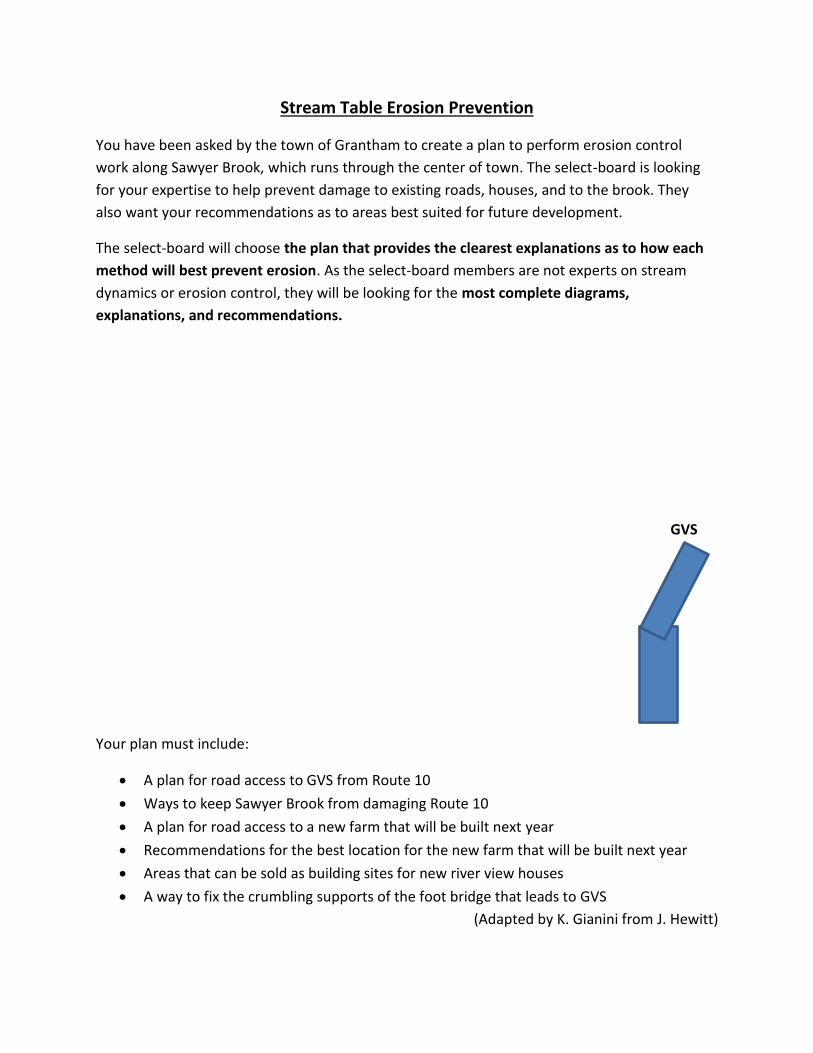
Stream Table Erosion Prevention
You have been asked by the town of Grantham to create a plan to perform erosion control
work along Sawyer Brook, which runs through the center of town. The select-board is looking
for your expertise to help prevent damage to existing roads, houses, and to the brook. They
also want your recommendations as to areas best suited for future development.
The select-board will choose the plan that provides the clearest explanations as to how each
method will best prevent erosion. As the select-board members are not experts on stream
dynamics or erosion control, they will be looking for the most complete diagrams,
explanations, and recommendations.
GVS
Your plan must include:
A plan for road access to GVS from Route 10
Ways to keep Sawyer Brook from damaging Route 10
A plan for road access to a new farm that will be built next year
Recommendations for the best location for the new farm that will be built next year
Areas that can be sold as building sites for new river view houses
A way to fix the crumbling supports of the foot bridge that leads to GVS
(Adapted by K. Gianini from J. Hewitt)
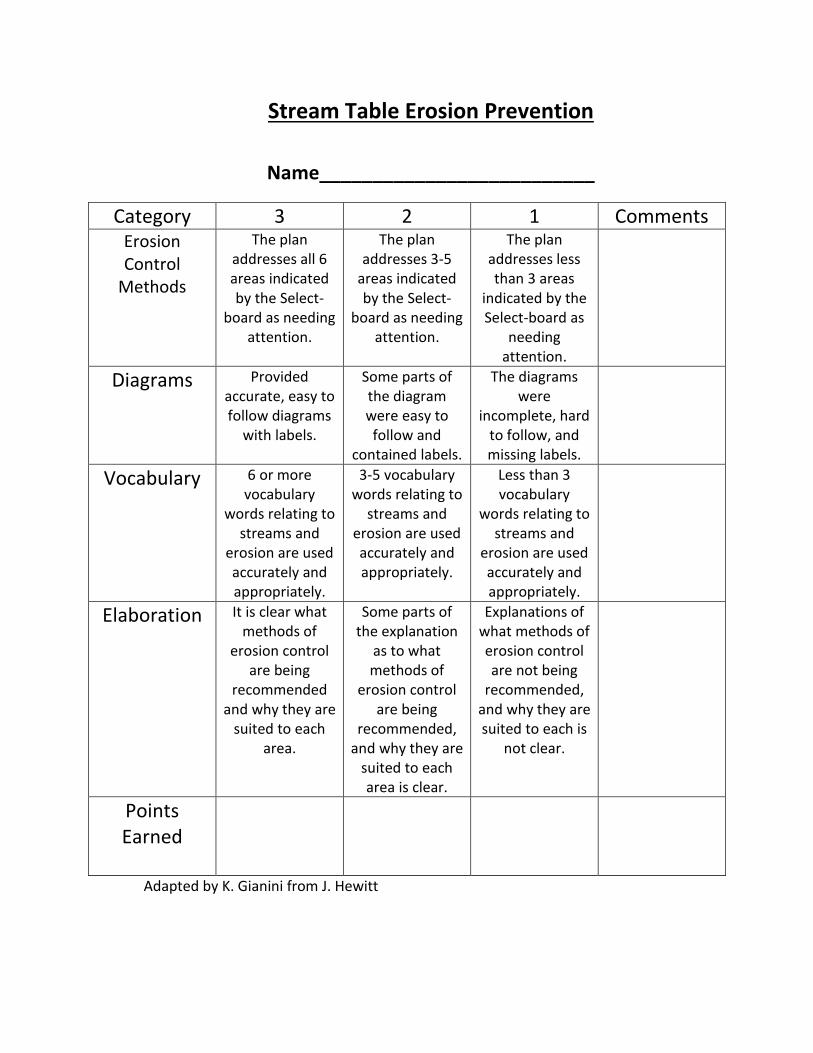
Stream Table Erosion Prevention
Name__________________________
Category 3 2 1 Comments Erosion Control
Methods
The plan addresses all 6 areas indicated by the Select-
board as needing attention.
The plan addresses 3-5
areas indicated by the Select-
board as needing attention.
The plan addresses less than 3 areas
indicated by the Select-board as
needing attention.
Diagrams Provided accurate, easy to follow diagrams
with labels.
Some parts of the diagram were easy to follow and
contained labels.
The diagrams were
incomplete, hard to follow, and missing labels.
Vocabulary 6 or more vocabulary
words relating to streams and
erosion are used accurately and appropriately.
3-5 vocabulary words relating to
streams and erosion are used accurately and appropriately.
Less than 3 vocabulary
words relating to streams and
erosion are used accurately and appropriately.
Elaboration It is clear what methods of
erosion control are being
recommended and why they are
suited to each area.
Some parts of the explanation
as to what methods of
erosion control are being
recommended, and why they are
suited to each area is clear.
Explanations of what methods of erosion control are not being
recommended, and why they are suited to each is
not clear.
Points Earned
Adapted by K. Gianini from J. Hewitt
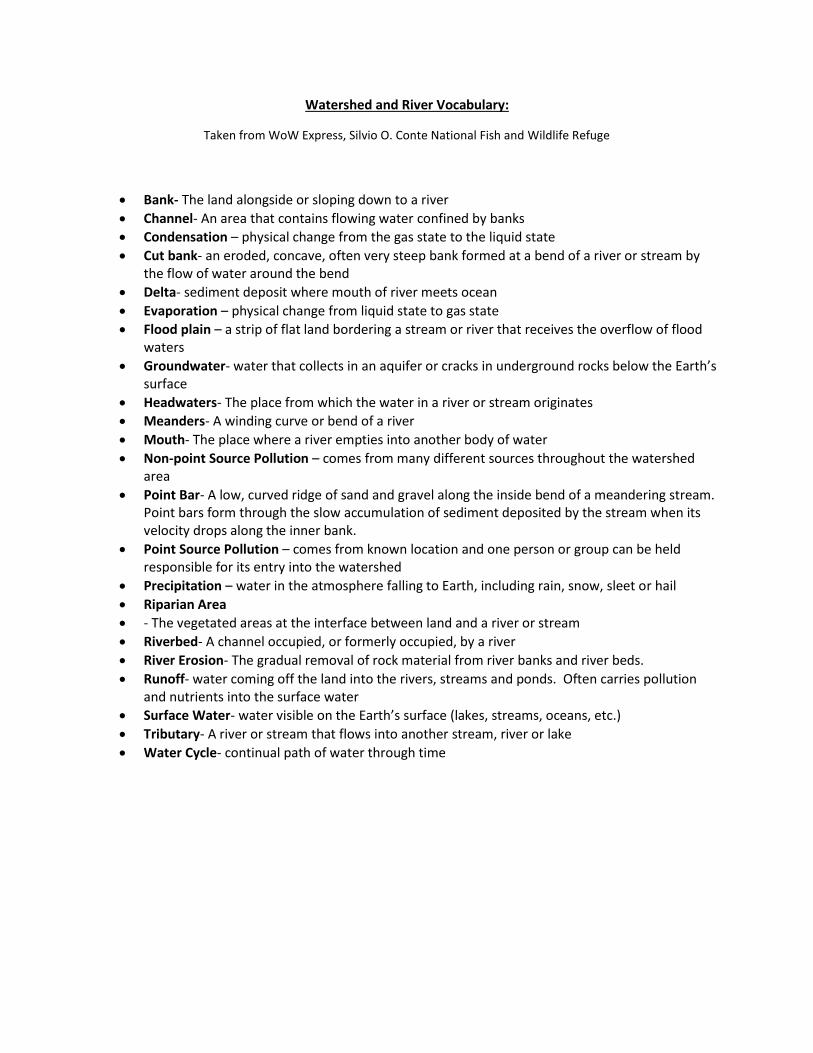
Watershed and River Vocabulary:
Taken from WoW Express, Silvio O. Conte National Fish and Wildlife Refuge
Bank- The land alongside or sloping down to a river
Channel- An area that contains flowing water confined by banks
Condensation – physical change from the gas state to the liquid state
Cut bank- an eroded, concave, often very steep bank formed at a bend of a river or stream by the flow of water around the bend
Delta- sediment deposit where mouth of river meets ocean
Evaporation – physical change from liquid state to gas state
Flood plain – a strip of flat land bordering a stream or river that receives the overflow of flood waters
Groundwater- water that collects in an aquifer or cracks in underground rocks below the Earth’s surface
Headwaters- The place from which the water in a river or stream originates
Meanders- A winding curve or bend of a river
Mouth- The place where a river empties into another body of water
Non-point Source Pollution – comes from many different sources throughout the watershed area
Point Bar- A low, curved ridge of sand and gravel along the inside bend of a meandering stream. Point bars form through the slow accumulation of sediment deposited by the stream when its velocity drops along the inner bank.
Point Source Pollution – comes from known location and one person or group can be held responsible for its entry into the watershed
Precipitation – water in the atmosphere falling to Earth, including rain, snow, sleet or hail
Riparian Area
- The vegetated areas at the interface between land and a river or stream
Riverbed- A channel occupied, or formerly occupied, by a river
River Erosion- The gradual removal of rock material from river banks and river beds.
Runoff- water coming off the land into the rivers, streams and ponds. Often carries pollution and nutrients into the surface water
Surface Water- water visible on the Earth’s surface (lakes, streams, oceans, etc.)
Tributary- A river or stream that flows into another stream, river or lake
Water Cycle- continual path of water through time
Bank
Channel
Condensation
Cut bank
Delta
Evaporation
Flood plain
Groundwater
Headwaters

Meanders
Mouth
Point Source Pollution
Precipitation
Non-point Source Pollution
Point Bar
Riparian Area
Riverbed
River Erosion

Runoff
Surface Water
Tributary
Water Cycle
The land alongside or sloping down to a river
An area that contains flowing water confined by banks
physical change from the gas state to the liquid state
an eroded, concave, often very steep bank formed at a bend of a river or stream by the flow of water around the bend
sediment deposit where mouth of river meets ocean
physical change from liquid state to gas state
a strip of flat land bordering a stream or river that receives the overflow of flood waters
water that collects in an aquifer or cracks in underground rocks below the Earth’s surface
The place from which the water in a river or stream originates
A winding curve or bend of a river
The place where a river empties into another body of water
comes from many different sources throughout the watershed area
A low, curved ridge of sand and gravel along the inside bend of a meandering stream. Point bars form through the slow accumulation of sediment deposited by the stream when its velocity drops along the inner bank.

comes from known location and one person or group can be held responsible
for its entry into the watershed
water in the atmosphere falling to Earth, including rain, snow, sleet or hail
The vegetated areas at the interface between land and a river or stream
A channel occupied, or formerly occupied, by a river
The gradual removal of rock material from river banks and river beds.
water coming off the land into the rivers, streams and ponds. Often carries pollution and nutrients into the surface water
water visible on the Earth’s surface (lakes, streams, oceans, etc.)
A river or stream that flows into another stream, river or lake
continual path of water through time
Identifying Macro-invertebrates
Before the identification activities were completed, Jenna Guarino (content specialist) came
in to discuss with students the concepts of watersheds and using benthic macro-
invertebrates as indicators of water quality. She also showed them a Power point
presentation to illustrate the concepts that they were discussing. The identification and
water monitoring activities described below were created by Mrs. Guarino. The activity
sheets can be obtained by contacting her.
Activity One
Directions:
1. Spend a few minutes discussing the “background information” sheet on macro-
invertebrates. Begin by drawing three large circles on the board, each one standing for the
concept of the Mayfly, Stonefly, and Caddisfly taxonomic orders. Have students read the
characteristics common to each order. Then, inside of the large mayfly circle draw three
smaller circles, each one standing for the concept of flat headed mayfly, swimming
mayfly, and burrowing mayfly taxonomic families. Discuss the relationship between
orders and families, and have students read the characteristics common to each family of
mayfly.
2. Have the students use the “background information” sheet to complete the “Identifying
Macro-invertebrate Activity” sheet, parts one and two.
Activity Two
Have students work in pairs using a field guide for benthic macro-invertebrates to identify, label,
draw, and write the three most noticeable characteristics that were used to identify real
specimens. After they have identified every specimen, have them find a new partner to compare
their identification and explain their reasoning if their partner identified a specimen differently.
Understanding the Sensitivity Index
The activity sheets can be obtained by contacting Jenna Guarino.
Directions:
1. Distribute the “Color Profile” to help students understand the color coding system used to
identify organisms that are sensitive, moderately sensitive, or tolerant to pollution in
brook trout habitat.
2. Distribute the “Benthic Macro-invertebrate Color Sensitivity Index” and have the
students identify the BMIs. A good resource to use for this is, “A Volunteer Monitor’s
Field Guide to Aquatic Macroinvertebrates,” published by the Izaak Walton League of
America.
3. Divide the class into three groups, distribute one “Sensitivity Groups Field Sheet”, one
“Practice Stream” set of macro-invertebrate cards, and one “Water Quality Score Field
Sheet” to each group. Guide them through the process of drawing one card at a time,
identifying it on the “Sensitivity Groups Field Sheet”, writing down the total count
(found on the card), and circling the abundance code. Next, guide them on how to use the
data from the “Sensitivity Groups Field Sheet” to complete the “Water Quality Score
Field Sheet.” Repeat this procedure three times so that each group gets a chance to
practice with all three sets of “Practice Stream” cards. This will prepare them to find a
water quality score for a real stream after collecting real macroinvertebrates.
Field Work
Students will collect benthic macro-invertebrates to perform a water quality score, test dissolved
oxygen and ph, and assess the stream habitat to determine the quality of the release site.
Materials:
Kick nets
Waders
Buckets
Sensitivity Groups Field Sheet
Water Quality Score Field Sheet
A Volunteer Monitor’s Field Guide to Aquatic Macro-invertebrates (or another macro-
invertebrate field guide)
Clipboards
Pencils
Water proof mats (to place macro-invertebrates on for identification)
Dissolved oxygen test kit
Ph test kit
Procedure:
To ensure that all students are busy assessing the health of the release site at all times, they
should be divided into groups so that while one group is performing a BMI assessment,
another group is performing a chemical and habitat assessment. Each group should have
an opportunity to perform all three assessments.
1. Use the kick nets to collect BMIs down stream from where a helper carefully disturbs the
substrate.
2. When enough have been collected carefully place them in containers with stream water.
An adult should separate them into orders (mayfly, stonefly, caddisfly, etc.) Then
students can identify, count, and enter data on to the Sensitivity Groups Field Sheet.
3. Repeat step two until enough BMI’s have been collected and identified.
4. Have the groups use the data from their Sensitivity Groups Field Sheet to complete the
Water Quality Score Field Sheet.
5. Have adult helpers assist students in using the dissolved oxygen and ph test kits. Students
should record the results of these tests on the “General Information Session” sheet. This
is the chemical assessment that we will use to help us determine the health of our release
site. Then they should work with an adult by the edge of the brook to complete the
“Stream Habitat Assessment” sheet.
Presentation of Release Site Data
First, the students will meet with their field work group to organize and summarize the
biological (BMI), chemical, and physical data that they collected. The next task is to
independently write a five paragraph report of the data. Then they will create a Power
Point presentation of this data including photos that were taken during the field work.
1. The groups will work together to write a narrative summary that begins with a
general statement about the quality of the release site (biological or physical).
Then they will support that statement with specific data that they gathered. The
summary will conclude with a statement about whether or not they feel confident
about the suitability of this release site for our brook trout.
2. Next, they will decide which pictures to include with their summary. They will be
responsible for copying and pasting them into the document. (Photographs will be
downloaded for them to choose from beforehand.)
3. Each group’s summary will be pasted into one document that includes the
biological and physical summaries of our assessment. As a whole class we will
decide on a title and a picture for the opening page of the presentation. I will
choose a helper to complete the opening page.
4. Copies of the presentation will be printed for all of the students. One will also be
sent to Judy Tumosa of New Hampshire Fish and Game.

Water Quality Report Planner
Your name:________________________
Names of people in your group:________________________
Introduction including what you found out about Sawyer Brook, and why this is
important
Details_____________________________________________________________
___________________________________________________________________
___________________________________________________________________
___________________________________________________________________
Information from your General Information Session sheet including school
name, site name, community name, county name, river system name, date,
directions to site, weather, air temperature, water temperature.
Details:_____________________________________________________________
___________________________________________________________________
___________________________________________________________________
___________________________________________________________________
___________________________________________________________________
___________________________________________________________________
___________________________________________________________________
Information from your Stream Habitat Assessment sheet including all
information that you checked and the Stream Habitat Assessment Rating (total
score), dissolved oxygen, and pH.
Details:_____________________________________________________________
___________________________________________________________________
___________________________________________________________________
___________________________________________________________________
___________________________________________________________________
___________________________________________________________________
___________________________________________________________________
___________________________________________________________________
___________________________________________________________________
___________________________________________________________________
___________________________________________________________________
Information from both Benthic Macro-invertebrate Assessment sheets including
the numbers of every bug you found and the water quality score.
Details:_____________________________________________________________
___________________________________________________________________
___________________________________________________________________
___________________________________________________________________
___________________________________________________________________
___________________________________________________________________
___________________________________________________________________
___________________________________________________________________
___________________________________________________________________
___________________________________________________________________
___________________________________________________________________
Conclusion including a brief restatement of what your group discovered, and
why it is important.
Details:_____________________________________________________________
___________________________________________________________________
___________________________________________________________________
___________________________________________________________________

Student Directions for the Power Point Presentation
Now it’s time to present what you learned about Sawyer Brook to New Hampshire
Fish and Game. You will work with a group to write a summary of the data you
collected. Group 1 will summarize the macro-invertebrate data and group 2 will
summarize the stream habitat data. I will assign groups when we begin.
1. Begin with a general introduction that explains what you discovered. Does
your data show excellent, fair, or poor water/habitat quality? Remember, you
don’t need to include a lot of details here.
2. Continue with a body that describes your data in detail:
Group 1 You should include the name, abundance code, and sensitivity group
name and number of every macro-invertebrate you collected. The water
quality index value for all three groups and the total water quality score should
also be included.
Group 2 You need to include all of the information from the “general
information session” sheet. Next, you should summarize the features you
checked off on the “Stream Habitat Assessment” sheet. Use complete
sentences. You don’t need to include the points for each section, but you do
need to include the total score.
3. Finish your report with a conclusion that explains what the total score
means. Then state whether or not you feel comfortable releasing the trout at
our site.
4. Meet with the other group that summarized the same data that your group
did to share your summaries. Choose the best writing from each summary to
create a revised summary. This is the version that will be typed on Power
point.
5. Observe the pictures that were taken during our assessments. Copy and paste
the ones that show children completing the assessment that you described.
I will copy and paste the reports from both groups into one document that
includes the entire assessment.

Release Day
Our release site has been used many times for the Trout in the Classroom Program, so I will
assume that the water quality will be acceptable for releasing the trout when they are ready. My
students are all aware that when the fish begin to swim up to the surface of the tank, they are
hungry and ready for release. When a significant number of them have come to the surface in
search of food, I will gather the class with cups of tank water, scoop up a few of the fish for each
student, and we will walk down to the stream to see them off on their journey.
Water Testing Information and Procedures By Jenny Hewitt
Adapted by Kevin Gianini
Velocity – how fast an object is moving in a certain direction
Background: The water in stream and rivers is always moving, usually at
different speeds in different places. This movement is called a current.
Currents affect the plants and animals living in the water by shaping the
bottom, carrying food into the area, and carrying wastes away. The speed or
velocity of the current can determine what organisms will live in the water.
The velocity is determined by dropping an orange into the water and timing
how long it takes the orange to travel 50 feet. An orange is used because it
has the same density as water. This means it won’t sink and will travel at the
same velocity as the water.
Procedure:
1. Measure 50 feet using a tape measure.
2. Assign roles of starter, stopper, dropper, timer, and catcher.
3. Place an object, say a stick or a notebook, at the spot where you start
measuring, and at the spot where you stopped measuring.
4. The dropper drops the orange into the water upstream from the starter
and the start line.
5. The starter yells start when the orange crosses the start line. This is when
the timer starts the stopwatch or timer.
6. The stopper yells stop when the orange crosses the finish line. The timer
stops the stopwatch.
7. The catcher retrieves the orange only if he/she can safely do so. It’s okay
if you can’t reach it because it won’t harm the stream.
8. Everyone in the group record the time in seconds on the data sheets.
9. We will calculate the velocity back in the classroom.
10. Repeat the test in 1 more area.

Embeddedness – the amount of sediment around rocks
Background: When spaces between rocks on a streambed become filled
with sand and sediment, the streambed is degraded. Macro-invertebrates
can no longer hold onto the sides of the rocks or hide underneath them. If
there is a lot of sand and sediment, macro-invertebrates may get washed
downstream or buried. Fish, especially trout and salmon, lay their eggs in
gravel on the streambed and the eggs incubate (develop) there for about 6
months. If the gravel is embedded, the eggs will die from lack of oxygen
and/or get washed away because the eggs are not anchored on the
streambed. Embeddedness of 50% means that the rocks are buried about
halfway up in sediment. At 50% embedded, trout and salmon are usually
not able to spawn.
Procedure:
1. Place weighted ring into the water. The space within the ring is the
sample space.
2. Choose a common size rock from this space. Do not pick it up yet.
3. Measure the height of this rock without moving it from its spot.
Write down the height on your data sheet.
4. Use “your claw grip” to pick up the rock. Your fingertips should be at
the level of the rock that was embedded.
5. Measure and record how much of the rock was embedded in the
streambed.
6. Repeat steps 3, 4, and 5 nine times.
7. We will calculate the average in the classroom. If you have extra time,
please do this at the river.

Temperature and Depth
Background: In the northeastern United States, water that is too warm will not
support diverse animal life. Cold water can hold more dissolved oxygen than warm
water, and many of our aquatic plants and animals required high levels of
dissolved oxygen.
Thermal pollution exists when the water is heated above its normal temperature.
This can happen when we clear trees near stream banks because it eliminates
shade. Power plants and factories also contribute to thermal pollution when they
use cool water from streams, rivers, and lakes to cool machinery. This heated water
is then returned to the water body at a higher temperature. Thermal pollution also
occurs in urban and suburban areas where runoff from paved roads and parking
areas empties into storm drains. The rain water is heated by the hot black top and
when it enters water bodies it heats the water there.
Procedure:
We will record the temperature and depth of the water in three different locations,
taking note of the surroundings at each spot.
1. Use the meter stick to measure the depth in centimeters. Record it on your
data sheet.
2. Hold the thermometer near the bottom while you watch the mercury go
down. When it stops, record the temperature (on your data sheet) in
Fahrenheit and Celsius.
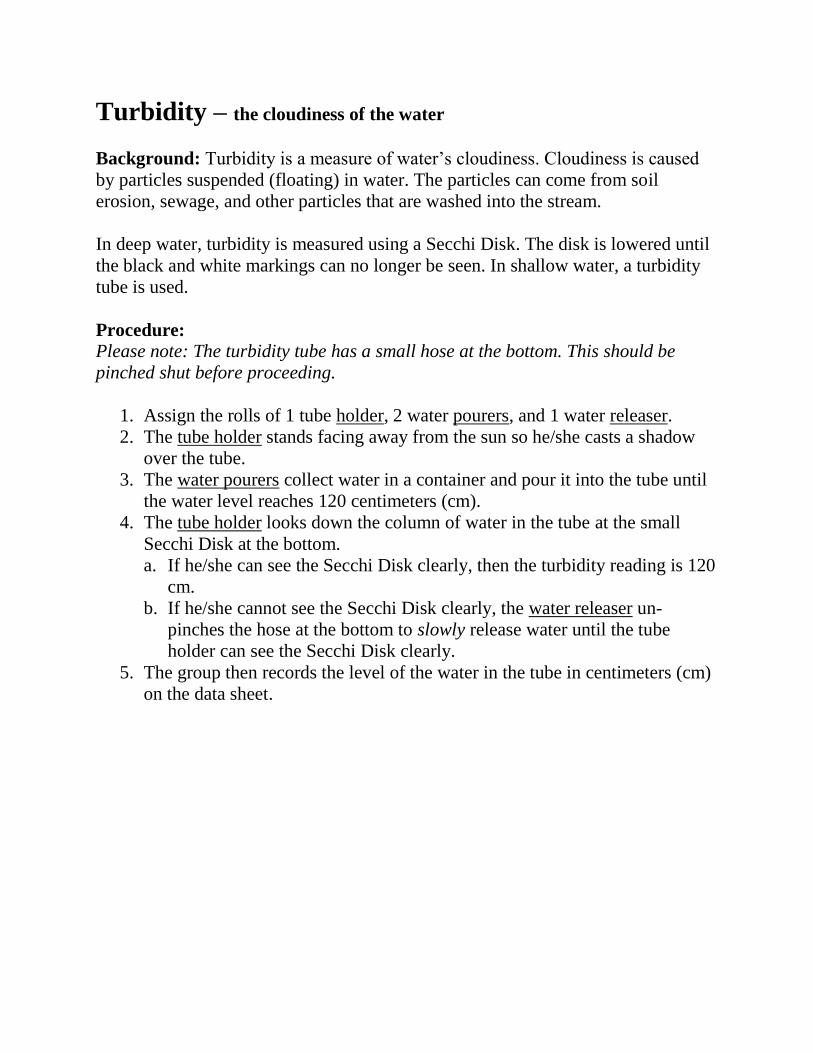
Turbidity – the cloudiness of the water
Background: Turbidity is a measure of water’s cloudiness. Cloudiness is caused
by particles suspended (floating) in water. The particles can come from soil
erosion, sewage, and other particles that are washed into the stream.
In deep water, turbidity is measured using a Secchi Disk. The disk is lowered until
the black and white markings can no longer be seen. In shallow water, a turbidity
tube is used.
Procedure:
Please note: The turbidity tube has a small hose at the bottom. This should be
pinched shut before proceeding.
1. Assign the rolls of 1 tube holder, 2 water pourers, and 1 water releaser.
2. The tube holder stands facing away from the sun so he/she casts a shadow
over the tube.
3. The water pourers collect water in a container and pour it into the tube until
the water level reaches 120 centimeters (cm).
4. The tube holder looks down the column of water in the tube at the small
Secchi Disk at the bottom.
a. If he/she can see the Secchi Disk clearly, then the turbidity reading is 120
cm.
b. If he/she cannot see the Secchi Disk clearly, the water releaser un-
pinches the hose at the bottom to slowly release water until the tube
holder can see the Secchi Disk clearly.
5. The group then records the level of the water in the tube in centimeters (cm)
on the data sheet.

Dissolved Oxygen – the amount of oxygen in the water
Background: Most animals need oxygen to survive. Humans and other land
animals get their oxygen from the air. Many aquatic animals, like fish, get their
oxygen from the water. Oxygen in water is called dissolved oxygen (DO). Many
aquatic animals get dissolved oxygen through gills in their bodies. Some aquatic
animals absorb dissolved oxygen directly through the surface of their bodies.
Other aquatic animals have lungs and must come to the water’s surface to take
oxygen from the air. Water that has high DO levels can support many different
kinds of aquatic animals. Water that has low dissolved oxygen levels can only
support a few kinds of aquatic animals.
Many things affect the amount of DO in water:
Temperature - Cold water can hold more DO than warm water. If cold water
warms up, it loses DO.
Velocity - Fast-flowing water mixes air (containing oxygen) into the water. If
water slows down, it loses DO.
Aquatic plants - Aquatic plants release oxygen into the water during
photosynthesis.
Pollution & dead plants - Aquatic bacteria that decompose pollution and dead
plants and animals cause DO to drop because they need lots of DO to do their
work.
Measuring Dissolved Oxygen
Dissolved oxygen is measured in parts per million (ppm). DO in water can range
from 0-18 ppm. The amount of DO that can be held by water at each temperature is
called the percent saturation of dissolved oxygen. Water is saturated with
dissolved oxygen when it is completely full.
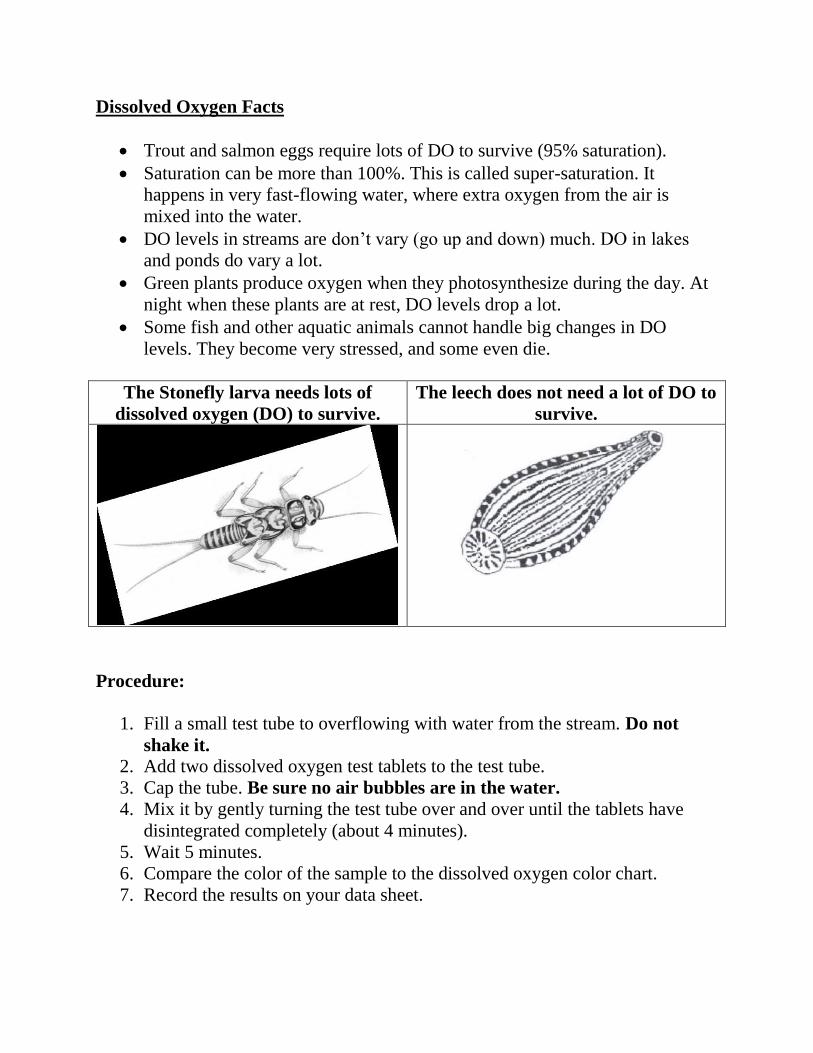
Dissolved Oxygen Facts
Trout and salmon eggs require lots of DO to survive (95% saturation).
Saturation can be more than 100%. This is called super-saturation. It
happens in very fast-flowing water, where extra oxygen from the air is
mixed into the water.
DO levels in streams are don’t vary (go up and down) much. DO in lakes
and ponds do vary a lot.
Green plants produce oxygen when they photosynthesize during the day. At
night when these plants are at rest, DO levels drop a lot.
Some fish and other aquatic animals cannot handle big changes in DO
levels. They become very stressed, and some even die.
The Stonefly larva needs lots of
dissolved oxygen (DO) to survive.
The leech does not need a lot of DO to
survive.
Procedure:
1. Fill a small test tube to overflowing with water from the stream. Do not
shake it.
2. Add two dissolved oxygen test tablets to the test tube.
3. Cap the tube. Be sure no air bubbles are in the water.
4. Mix it by gently turning the test tube over and over until the tablets have
disintegrated completely (about 4 minutes).
5. Wait 5 minutes.
6. Compare the color of the sample to the dissolved oxygen color chart.
7. Record the results on your data sheet.

Aquatic Macro-invertebrates – aquatic animals without a
backbone that can be seen without a microscope
Background: Aquatic macro-invertebrate are the food source for some fish,
amphibians, and other macro-invertebrates. Some macro-invertebrates are
herbivores, some are carnivores, and others are omnivores. Many macro-
invertebrates are aquatic insects. In the water there are many young insects
called larvae and nymphs. Larvae change completely as they grow into
adults, and go through a resting stage called a pupa. Nymphs resemble their
parents and do not go through a resting stage.
Macro-invertebrates are indicators of water quality, which means that their
presence or absence can tell us about the quality of the water. Some, like
stoneflies and mayflies, are very sensitive to pollution. Therefore, they
indicate healthy water just be their presence. Other macro-invertebrates can
tolerate pollution-some even thrive in it. Some macro-invertebrates are in
between-they are somewhat tolerant of pollution.
Procedure:
1. Two students hold up a kick net in the water so that the bottom is on the
stream bed and the water is flowing through the net.
2. One or two other students get into the water upstream from the net and
gently shuffle their feet on the stream bed. This dislodges macro-
invertebrates from the bottom so that they flow into the net.
3. Empty the net into a tray of water.
4. Repeat steps 1 and 2 if you don’t get many macro-invertebrates.
5. Carefully sort macro-invertebrates into separate ice cube tray cubicles.
6. Use the macro-invertebrate identification guide and the 2-way insect
viewer to begin identifying them.
7. Back in the class room, you will identify the rest of your catch and
perform calculations to assign a score to it.

Stream Velocity
Distance (feet) Time (seconds) Velocity (feet
per second)
Distance ÷Time
Site 1
50
Site 2
50
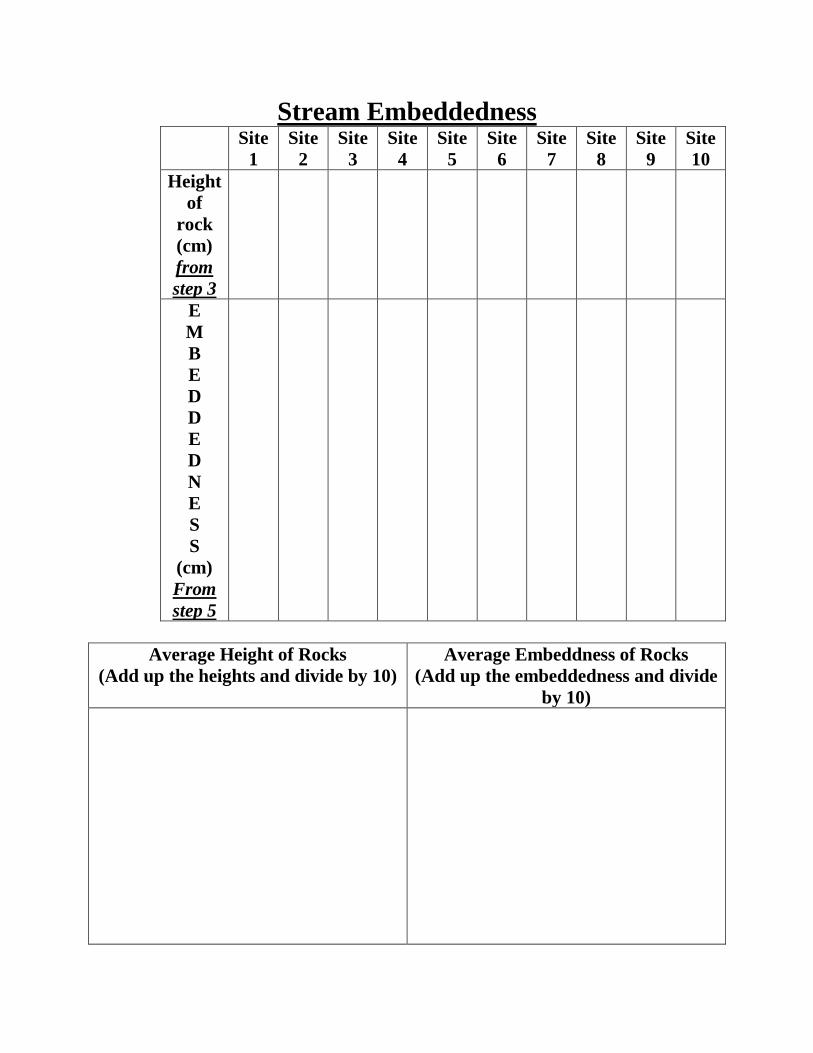
Stream Embeddedness
Site
1
Site
2
Site
3
Site
4
Site
5
Site
6
Site
7
Site
8
Site
9
Site
10
Height
of
rock
(cm)
from
step 3
E
M
B
E
D
D
E
D
N
E
S
S
(cm)
From
step 5
Average Height of Rocks
(Add up the heights and divide by 10)
Average Embeddness of Rocks
(Add up the embeddedness and divide
by 10)

Temperature and Depth Depth Temperature
Site 1
Site 2
Site 3
Averages
Turbidity
_______________________ cm.
Dissolved Oxygen
___________________ppm (parts per Million)