Water Progress paper Eng FINAL - OECD.org · Figure 3: Non Revenue Water ... water supply, pipe...
43
� � ����������� FINANCING WATER SUPPLY AND SANITATION IN EECCA COUNTRIES AND PROGRESS IN ACHIEVING THE WATER- RELATED MILLENNIUM DEVELOPMENT GOALS (MDGs)
Transcript of Water Progress paper Eng FINAL - OECD.org · Figure 3: Non Revenue Water ... water supply, pipe...

��������������������
��
�����������
Available data suggest that the overall situation in the water supply and sanitation sector of EECCA has deteriorated further since originally assessed as critical seven years ago at a conference of EECCA Finance/Economy and Environment Ministers. This appears to be especially true for the quality of water services, where relevant indicators have shown deterioration in virtually all EECCA countries, and for key financial indicators. Collected revenues often do not cover operational costs, let alone maintenance and capital costs. Overall, investment falls short by a factor of 5 to 10 of the level that would be required to maintain and renew existing water infrastructure. The consequences for public health, the environment, and economic development in the region are serious. To reverse these trends, a number of critical steps must be taken before a series of reforms can be successfully implemented. This report draws on work carried-out over the last 7 years by the EAP Task Force and other actors in the EECCA region to draw a complete picture of the water supply and sanitation sector in the region and identifies some of the key reforms that will need to be undertaken to achieve the water-related MDGs.
FINANCING WATER SUPPLY AND SANITATION IN EECCA COUNTRIES AND PROGRESS IN ACHIEVING THE WATER-RELATED MILLENNIUM DEVELOPMENT GOALS (MDGs)
FINANCING WATER SUPPLY AND SANITATION IN EECCA COUNTRIES AND PROGRESS IN ACHIEVING THE WATER-RELATED MILLENNIUM DEVELOPMENT GOALS (MDGs)

EAP Task Force
FINANCING WATER SUPPLY AND SANITATION IN EECCA COUNTRIES AND PROGRESS IN ACHIEVING THE WATER-RELATED MILLENNIUM
DEVELOPMENT GOALS (MDGs)

2
ORGANISATION FOR ECONOMIC CO-OPERATION AND DEVELOPMENT
The OECD is a unique forum where the governments of 30 democracies work together to address the economic, social and environmental challenges of globalisation. The OECD is also at the forefront of efforts to understand and to help governments respond to new developments and concerns, such as corporate governance, the information economy and the challenges of an ageing population. The Organisation provides a setting where governments can compare policy experiences, seek answers to common problems, identify good practice and work to co-ordinate domestic and international policies.
The OECD member countries are: Australia, Austria, Belgium, Canada, the Czech Republic, Denmark, Finland, France, Germany, Greece, Hungary, Iceland, Ireland, Italy, Japan, Korea, Luxembourg, Mexico, the Netherlands, New Zealand, Norway, Poland, Portugal, the Slovak Republic, Spain, Sweden, Switzerland, Turkey, the United Kingdom and the United States. The Commission of the European Communities takes part in the work of the OECD.
OECD Publishing disseminates widely the results of the Organisation’s statistics gathering and research on economic, social and environmental issues, as well as the conventions, guidelines and standards, as agreed by its members.
© OECD 2007
No reproduction, copy, transmission or translation of this publication may be made without written permission. Applications should be sent to OECD Publishing: [email protected] or by fax (33 1) 45 24 13 91. Permission to photocopy a portion of this work should be addressed to Centre français d’exploitation du droit de copie, 20, rue des Grands-Augustins, 75006 Paris, France ([email protected]).
The work presented in this document has been supported by the European Commission, Germany, Norway and the UK.
This work is published on the responsibility of the Secretary-General of the OECD. The opinions expressed and arguments employed herein do not necessarily reflect the official views of the Organisation or of the governments of its member countries.

3
TABLE OF CONTENTS
EXECUTIVE SUMMARY ............................................................................................................................ 5
1. BACKGROUND AND INTRODUCTION ............................................................................................... 8
2. CURRENT STATE OF THE WATER SUPPLY AND SANITATION SECTOR IN EECCA ................ 9
2.1 High-income, high-coverage countries ............................................................................................ 9 2.2 Low-income, low-coverage countries .............................................................................................. 9 2.3 Key technical performance indicators show a steady deterioration of urban water infrastructure over the last years........................................................................................................................... 11 2.4 Key financial utility performance indicators are stagnating at low levels, despite some recent improvements ................................................................................................................................. 18 2.5 The situation in the rural water sector ............................................................................................ 21 2.6 Public health impacts are negative, but hard to substantiate in a systematic manner..................... 22 2.7 Municipal water utilities have become the predominant source of pollution of surface waters .... 23
3. LEGAL AND INSTITUTIONAL REFORMS UNDERTAKEN SINCE THE ALMATY CONFERENCE ............................................................................................................................................ 25
3.1 Decentralisation.............................................................................................................................. 25 3.2 Tariff-setting................................................................................................................................... 27 3.3 Subsidies......................................................................................................................................... 28 3.4 Improving collection rates.............................................................................................................. 28 3.5 Performance-based contracts between utilities and municipalities ................................................ 29 3.6 Private sector participation............................................................................................................. 31 3.7 Public participation......................................................................................................................... 31
4. FINANCING WATER SERVICES AND THE SOCIAL IMPLICATIONS OF TARIFF REFORM.. ............................................................................................................................................................ 33
4.1 Introduction .................................................................................................................................... 33 4.2 Major prerequisites......................................................................................................................... 35 4.3 User charges are the main source of finance and should be managed as a policy instrument ....... 35 4.4 Public finance, including central budgets, will continue to play a crucial part in financing water systems in EECCA......................................................................................................................... 36 4.5 External finance – a minor source of finance, with important catalytic effects ............................. 37 4.6 Local debt – a complementary financial instrument ...................................................................... 39
5. CONCLUSIONS................................................................................................................................ 40

4
TABLE OF FIGURES
Figure 1: Coverage of Urban Population in EECCA with Centralised Water Supply ............................. 12 Figure 2: Coverage by Centralised Water and Sewerage Systems and Consumption of Water in Ukraine
in 2004 ...................................................................................................................................... 13 Figure 3: Non Revenue Water.................................................................................................................. 15 Figure 4: Continuity of Service (Hours Per Day)..................................................................................... 16 Figure 5: Continuity of Service by Category of Settlements in Moldova in 2000-2005.......................... 17 Figure 6: Share of Metered Connections (%)........................................................................................... 17 Figure 7: Total Water Consumption (Litres Per Capita Per Day (Lpcd)) ................................................ 18 Figure 8: Ratio between Average Revenue Per M3 of Water Produced and Unit Operational Cost ....... 19 Figure 9: Collection Rates........................................................................................................................ 20 Figure 10: Collection Period Between Billing and Collection of Payment (Days) .................................... 20 Figure 11: Rural Water Supply Sources in the Kyrgyz Republic .............................................................. 21 Figure 12: Access of Rural Population to Sustainable, Clean Drinking Water in the Kyrgyz Republic ... 22 Figure 13: Existing Sources of Financing Water and Wastewater Utilities............................................... 34 Figure 14: Expenditure Need and Supply of Finance in Eur Per Connected Inhabitant, in the First Year of the Baseline Scenario............................................................................................................... 34 Figure 15: Distribution of Yerevan Households by Expenses for Water/Wastewater Services as a Percentage of Household Consumer Expenditures, 2004 and 2005 Projections ..................... 36 Figure 16: Bilateral and Multilateral Official Development Assistance to Water Supply and Sanitation in EECCA Countries, Annual Commitments, Million USD (Constant 2002 Prices) ................... 38
BOXES
Box 1: Water Utility Performance Indicator Database .......................................................................... 11 Box 2: Official MDG indicators paint on overly optimistic picture of the situation regarding access to water and sanitation in EECCA ................................................................................................ 14 Box 3: Status of the wastewater treatment capacity and actual flows in some towns in Moldova in 2005 .......................................................................................................................................... 24 Box 4: Ukrainian Law on Housing and Communal Services (passed in June 2004) ........................... 28 Box 5: Implementation of the Household Arrears Restructuring Programme in Armenia................... 29 Box 6: Surgut’s Municipal Services Development Project .................................................................. 30

5
EXECUTIVE SUMMARY
At their meeting in Almaty in October 2000, EECCA Ministers of Environment, Finance, and Economy, Ministers and senior representatives from several OECD countries, as well as senior officials from International Financial Institutions (IFI), International Organisations, non-governmental organisations, and the private sector, recognised the critical condition of the urban water supply and sanitation sector in EECCA and endorsed “Guiding Principles for the Reform of the Urban Water Supply and Sanitation Sector in the NIS”.
Participants requested the EAP Task Force to assess progress in implementing these Guiding Principles for review at a major conference of stakeholders that took place in 2005 in Yerevan, Armenia. This paper is an update of a report that was prepared for the Ministerial meeting in Yerevan, drawing on more recent data, and responds to the Ministers’ request to prepare such a paper for the Environment for Europe Conference in 2007.
Available data suggest that the overall situation in the water supply and sanitation sector of EECCA has deteriorated further since originally assessed as critical seven years ago. This appears to be especially true for the quality of water services, where relevant indicators have shown deterioration in virtually all EECCA countries. But the situation is not entirely negative: there is reason for some optimism as the situation in EECCA, as of today, presents a significantly more favourable context for sector reform than in 2000.The economies of most EECCA countries have significantly improved since the year 2000, which, both at the level of governments and households, creates new opportunities to improve the sector’s performance; and there are now examples of reforms that demonstrate how some of the existing problems can be successfully addressed.
The coverage of urban populations with centralised water services remains high, but disruptions of water supply, pipe breaks, and unaccounted-for water have steadily increased or remained at high levels compared to international benchmarks since 2000. Similarly, key financial indicators suggest stagnation at poor performance levels. Collected revenues often do not cover operational costs, let alone maintenance and capital costs. Overall, investment falls short by a factor of 5 to 10 of the level that would be required to maintain and renew existing water infrastructure.
Some indicators have shown positive signs, such as significantly increased levels of metered water connections in virtually all countries, decreasing levels of water consumption, and improved rates of bill collection. These do not suffice however to reverse an overall negative trend: the EECCA water sector is deteriorating further, and so far there are no signs that deterioration will slow or that this trend will be reversed in the near future.
The consequences for public health, the environment, and economic development in the region are serious. The WHO estimates that in the member countries of the UN Economic Commission for Europe1 more than 13 000 children under the age of 14 die every year from poor water conditions, probably most of them in the EECCA region.
1 The UN’s Economic Commission for Europe has 55 member countries from Europe, Caucasus and Central Asia, as well as Canada and the United States.

6
However, while the trend towards further deterioration of water services is broadly the same across the EECCA region, the overall state of water services and their adverse impacts is quite diverse. The situation in the poorest EECCA countries is significantly more alarming than in the more affluent states, especially in terms of water quality and resulting health impacts. There is also an important difference between urban and rural areas. Water services in many rural areas have collapsed following the dismantling of the state and collective farm system in the 1990s.
To achieve the Millennium Development Goals (MDG) on water supply and sanitation, it has been estimated that a total of about EUR seven billion would be needed annually i.e. roughly double the current level of finance. Because of financial constraints, most utilities in the region have had to decrease the levels of service they provide in order to save on costly inputs such as electricity and chemical reagents for water treatment. In addition, utilities have been unable to carry out basic maintenance, further accelerating the deterioration of infrastructure.
To reverse these trends, a number of critical steps must be taken before a series of reforms can be successfully implemented. EECCA countries will have to: improve the operational efficiency of water utilities, thereby reducing operational costs; combine all sources of finance to enhance synergies; avoid crowding out other sources of finance; and maximise leverage on total flows. A number of case studies in the region have shown that this is possible.
User charges are, and will remain, the most important source of finance. A number of EECCA countries could still significantly increase user charges before reaching affordability limits. Sound tariff-setting rules and mechanisms should be established to promote more efficient use of water resources and to ensure transparency and predictability. Tariff levels should be economically and socially justifiable, and prevent any abuse of the monopoly position that utilities generally enjoy.
Public budgets are the second largest source of finance for the water sector; their share can amount to 50 per cent in some countries or regions. Simulations using FEASIBLE2 show that to improve and extend water services, including the achievement of the Millennium Development Goals on water supply and sanitation, the magnitude of public finance spent on water-related investment will have to increase substantially. A recent study in Georgia suggests public finance would need to double to achieve the MDGs in urban areas.
External sources of financing will only play a minor role, while having potentially important catalytic and demonstration effects. Official development assistance has stagnated at low levels and is not expected to increase significantly in the coming years. ODA is increasingly concentrated on the poorest countries which are often unable to take on additional debt as they reach their IMF lending ceilings.
A review of the major institutional and legal reforms in EECCA indicates that many countries have undertaken measures to improve the situation in the water supply and sanitation sector, most of them in line with the recommendations in the Almaty Guiding Principles. In particular, central governments have sought to improve the coherence of the institutional set-up governing the water sector, as well as developing framework legislation to better guide local level actors, mainly in setting tariffs.
However, these measures remain partial. Despite recognition that local authorities lack capacity and resources to manage water systems properly, central governments have done little to address these problems. Those actions that have been taken are still very recent, and their implementation at the operational level has not yet yielded results. Equally, lack of reform at the local level, particularly the
2 FEASIBLE is a tool jointly developed by the Danish Government and the OECD to support the development and implementation of financial strategies for the water sector; OECD (2003).

7
establishment of utilities as autonomous, commercially-run institutions, is impeding positive effects from improved institutional and legislative measures taken at the central level.
The focus of policy makers should therefore shift from developing to implementing laws and regulations and from central to local governments and utilities. There are a number of positive examples of reforms at the local level that hold important lessons for how such reforms can be carried out. A key challenge is to find ways to disseminate and scale up these best-practice examples.
Further efforts are needed to integrate water-related objectives into national policies, including Poverty Reduction Strategy Papers, and to take advantage of opportunities to link reform of the water sector to the achievement of the internationally agreed water targets.
As a consequence, the reform agenda set-out in the Almaty “Guiding Principles for the Reform of the Urban Water Supply and Sanitation Sector in the NIS” continues to be relevant and governments in EECCA and donors should continue their efforts to implement reforms in line with these Principles.

8
1. BACKGROUND AND INTRODUCTION
At their meeting in Almaty in October 2000, EECCA Ministers of Environment, Finance, and Economy, Ministers and senior representatives from several OECD countries, as well as senior officials from International Financial Institutions, International Organisations, non-governmental organisations, and the private sector, recognised the critical condition of the urban water supply and sanitation sector in EECCA and endorsed “Guiding Principles for the Reform of the Urban Water Supply and Sanitation Sector in the NIS”. The Guiding Principles identify the key elements of urban water sector reform, which include:
• Establishing strategic objectives for the reforms;
• Reforming institutions and clarifying the roles of the national authorities, local governments, vodokanals, and the public;
• Establishing a framework for financial sustainability of the sector and promoting efficiency and cost-effective use of resources;
• Outlining the sequencing of reforms.
Participants requested the EAP Task Force to develop a focussed programme of work to facilitate the implementation of the Guiding Principles, and asked for a report assessing progress in implementing the Guiding Principles to be prepared for review at a major conference of stakeholders. A follow-up Ministerial meeting in Yerevan, Armenia in 2005, discussed this report. Ministers recognised that the situation had not changed significantly since the year 2000 and that the Guidelines therefore remained relevant in guiding countries in the way that they could address these issues. Ministers also asked the EAP Task Force to update its progress assessment and to present it at the Environment for Europe conference in 2007.
Since the Almaty Conference, water has received significant attention and been identified as one of the major development objectives. The Millennium Summit of 2000 set a target to improve access to safe drinking water, which was later complemented at the World Summit on Sustainable Development in Johannesburg, in 2002, with a target with regard to sanitation. In both cases, the target is to reduce by half those without access to these services by 2015. The World Summit also saw the launching of two major initiatives: the Pan-European East-West Environmental Partnership for Sustainable Development, and the EU Water Initiative. Both these initiatives seek to foster East-West co-operation on water and have components that focus on urban water supply and sanitation, and integrated water resource management.
The present paper responds to the request to update the progress report that had been prepared for the Yerevan Ministerial conference. The paper provides a detailed description of the situation and the main trends in the EECCA urban water sector. In the following sections the report identifies and measures key indicators for the technical condition of the water supply and sanitation infrastructure, and its impacts on public health and the environment; the state of legal and institutional frameworks; as well as the economic and financial dimensions of sector reforms.

9
2. CURRENT STATE OF THE WATER SUPPLY AND SANITATION SECTOR IN EECCA
A look at some key figures relating to EECCA countries reveals a significant diversity of situations between countries (Table 1). This includes populations (from three million in Armenia to almost 144 million in Russia) and what this entails for the complexity of administrative systems, as well as the distribution of the population between urban and rural areas (urban populations range from 25 per cent in Tajikistan to 73 per cent in Russia) and its incidence on coverage rates with centralised water supply and sanitation. These figures also include per capita gross national income that can vary up to a factor of thirteen (from USD 330 in Tajikistan to 4 460 in Russia) and what this entails for the affordability of water services for the population and for public budgets.
Countries can be divided into two groups:
2.1 High-income, high-coverage countries
In these countries, access to what the UN qualifies as “improved” sanitation and water sources tends to be nearly pervasive (even though water is still frequently not safe to drink), and the quality of water services from centralised water systems, measured as the level of continuity of service, is still relatively high (close to 24 hours per day, and therefore continual water supply, with few or no daily interruptions of service). As a consequence, these countries perform relatively better on some of the key water-related health indicators, even though their problems are still well in excess of average OECD levels.
2.2 Low-income, low-coverage countries
In these countries, access to improved sanitation and water sources tends to be much lower, as is the quality of water services. In some of these countries many people would receive water on a scheduled basis, sometimes only every other day for a few hours. Health indicators in these countries are therefore significantly more alarming, with the under-five mortality rate, shown in the table, tending towards low-income country levels in many cases.

10
Table 1: Key EECCA country figures
Country Pop. Total (2005)
Urban Pop. (2004)
GNI per Capita (2005)
Improved water source
(% of pop. with
access) (2004)
Connected to centralised
water supply (% of
population)
Improved Sanitation facilities,
(% of population
with access) (2004)
Connected to centralised sewer (% of population)
(2005)
Mortality Rate,
under 5 (2004)3
Average Daily water supply,
urban (2005)
millions % USD Total
Urban and Rural
Urban Rural Total
Urban and Rural
% per 1000
live births
Number of hours
Armenia 3 64.2 1470 92 68 32 83 67-89 29 9.2 Azerbaijan 8.4 51.5 1240 77 83-95 11 54 31 75 8
Belarus 9.8 71.8 2760 100 94 53 84 68 9 … Georgia 4.5 52.2 1350 82 95 35 97 68 41 11.2
Kazakhstan 15.1 57.1 2930 86 93 26 72 63 63 23 Kyrgyz Republic 5.1 35.7 440 77 … 70 59 … 58
Moldova 4.2 46.5 880 92 79 … 68 63 23 23 Russian Federation 143.8 73.1 4460 97 84 … 87 62 17 24
Tajikistan 6.5 24.9 330 59 86 … 51 27 75 17 Turkmenistan 4.8 46 … 72 80 28 62 61 80 …
Ukraine 47.1 67.6 1520 96 90 26 96 69 14 23 Uzbekistan 26.6 36.7 510 82 65 64 67 … 57 …
World:
Low income countries 2 353 29.9 507 75 38 80 Middle income 3 073 53.2 2 264 84 61 30
High income (OECD) 927 76.8 33 547 100 100 5
Source: World Bank, World Development Indicators, 2004 and 2005 (for population, GNI, water supply and sanitation); OECD (2003), Urban water reform in EECCA – Progress since the Almaty Ministerial Conference; and UNDP, The 2006 Human Development Report.
3 It should be noted that water is only one of factors having an impact on infant mortality rate. Other factors such as the quality of the health care system and of food supplies play an equally important role. There is therefore not necessarily a direct link between the level of access to an improved water source and this health indicator.

11
The following sections describe, in detail, the key trends in the water supply and sanitation sector of the EECCA region that have been observed over recent years. They present aggregated data, country by country, from the World Bank IB-Net database as well as the EAP Task Force Water Utility Performance Indicator Database (Box 1), both of which mainly focus on urban water systems. While this data confirms the diversity of situations identified above, it shows that there are no signs yet that the water supply and sanitation sector might improve in the near future. Most trends in the water supply and sanitation sector point in the direction of further deterioration of water services. This includes the group of high-income, high-coverage countries (maybe with the exception of Russia), where these negative trends are not notably different from low-income, low-coverage countries. This suggests that, in the municipal water sector, these two groups of countries have many, if not most, problems in common.
Box 1: Water Utility Performance Indicator Database
The data presented below has been collected in the framework of several projects aimed at promoting the use of performance indicator-based benchmarking in EECCA water utilities. The indicator methodology that has been used was developed by the World Bank.
The data set is based on input from water utilities in nine EECCA countries (Armenia, Azerbaijan, Georgia, Moldova, Russian Federation, Ukraine, Tajikistan, Kazakhstan, and the Kyrgyz Republic). The most recent surveys were carried out for the 2003 – 2005 period. Most of the data used in this report, covers the 2000 – 2005 period. In the case of Azerbaijan, the most recent data dates back to 2002 and for Ukraine, no additional data has been obtained since 2004. The data was collected by the World Bank and the EAP Task Force, through special surveys conducted in the region on the basis of self-reporting by the utilities. In many of the smaller EECCA countries (such as Armenia, the Kyrgyz Republic, Georgia and Moldova), the survey was nearly comprehensive, covering all major utilities. For Ukraine, Tajikistan and Kazakhstan the data was collected from the largest utilities.
The data-set for Russia has been significantly expanded compared to previous updates of the data-base, and is now based on the data compiled by the national statistical office (statistical reporting is mandatory for all Russian Water utilities). This allows to portray a more comprehensive picture of recent developments in the country.
In the case of Kazakhstan, two sets of indicators are presented. This is due to the fact that the sample used to collect this data has been changed. In previous surveys, the sample covered 34 urban centres, which included big and small cities (more than 25 000 inhabitants) through out the country. Recently, this sample was changed and limited to 18 medium and large cities because of problems linked to data availability. A new set of data, covering the 2000 – 2005 period was obtained on the basis of this new sample. The overall picture illustrated by this new data may be more positive then what could be expected for the entire country. We therefore chose to present both sets of data in order not to misjudge the real evolution that has been taking place in the country as a whole.
The database contains 32 indicators, including technical (e.g. service coverage rates, non-revenue water, pipe breaks, and continuity of service), and financial indicators (e.g. bill collection period, collection ratio, unit operational cost, and average water revenue per m3 of water sold).
2.3 Key technical performance indicators show a steady deterioration of urban water infrastructure over the last years
Coverage with centralised water supply and sanitation services in urban areas of EECCA is generally at high levels compared to countries that are at similar levels of economic development. Water supply through in-house taps and public water points ranges from around 60 per cent of the population in Kyrgyzstan and Azerbaijan to almost 100 per cent in large cities in Kazakhstan and Russia (Figure 1). Coverage with sanitation services is somewhat lower at between 27 per cent and up to 90 per cent. Coverage figures have essentially remained stable over recent years. Where an expansion of water supply and sanitation coverage can be observed, expansion was usually not due to a “real” extension of infrastructure, but rather to the process of consolidating infrastructure in utilities, such as through the transfer of water supply and sanitation (WSS) infrastructure from industries to utilities.

12
Figure 1: Coverage of urban population in EECCA with centralised water supply4
Water Coverage
0%
20%
40%
60%
80%
100%
120%
Armenia Azerbaijan Georgia Kazakhstan Kazakhstan(big cities)
Kyrgyz Rep. Moldova Rep. Russia Tajikistan Ukraine
2000
2001
2002
2003
2004
2005
Source: EAP Task Force Water Utility Performance Indicator Database
It should be noted that the figures that are shown here only cover the populations that are being served by the water utilities from which data was collected. Generally connection rates in rural areas are much lower than in urban areas (e.g. less than 16% of the population in rural areas of Kyrgyzstan). Significant variation exists within the countries/regions depending on the size of the cities. Figure 2, for example, demonstrates the distribution of inhabitants connected to centralised water and sewerage systems in Ukraine and Tajikistan. Figure 2 indicates that the coverage is over 90 per cent for water supply in the largest cities while it is only about half the population in small cities in the Ukraine and Tajikistan. For sanitation the discrepancy between large and small towns is similar.
4 Population with easy access to water services (either with direct service connection or within 200m of a standpost)/total population under utility’s nominal responsibility, expressed as a percentage.

13
Figure 2: Coverage by centralised water and sewerage systems and consumption of water in Ukraine in 2004
0%
10%
20%
30%
40%
50%
60%
70%
80%
90%
100%
>1,000,000 500,000-1,000,000
100,000-500,000
50,000-100,000
25,000-50,000 < 25,000
0
100
200
300
400
500
600
700
litre
/cap
ita/
day
Water supply service coverage Wastew ater service coverage
Water production Water consumption
…and Tajikistan in 2005
0%
10%
20%
30%
40%
50%
60%
70%
80%
90%
100%
Dushanbe 50,000-100,000 < 50,000
0
100
200
300
400
500
600
700
800
900
1000
litr
e/ca
pit
a/d
ay
Water supply service coverage Wastew ater service coverageWater production Water consumption
Source: EAP Task Force Water Utility Performance Indicator Database.
High connection rates in most urban areas, however, mask the fact that the quality of water supply and sanitation services that is being delivered to utility clients has continuously deteriorated over the same period. In this respect, the official UN data, that monitors access to improved drinking water, appears to be similarly misleading (see Box 1). Hence, while a large majority of urban populations have access to water utility services, the quality of services is usually insufficient, and this increasingly so. One indicator demonstrates this situation particularly well. Unaccounted-for water (or non-revenue water), defined as the share of water that is produced, but which is either lost through leakage or stolen from the distribution network, has remained at very high levels in all EECCA countries compared to the international benchmark for unaccounted-for water which is below 20 per cent (Figure 3).

14
Box 2: Official MDG indicators paint on overly optimistic picture of the situation regarding access to water and sanitation in EECCA
The UN Joint Monitoring Programme finds that the share of people in EECCA with access to an improved drinking water source has risen slightly since 1990. As a result, in 2002, 93% of the population had access to drinking water and about 70% had access to improved sanitation.
On the basis of these figures, JMP concludes that for the drinking water target the EECCA region is essentially on track to meet the internationally agreed MDG targets.
Data gathered by the OECD and other organizations, including the World Bank5, however, suggest a for more worrying situation. Extensive urban infrastructure built in the Soviet era provides a large share of the population with water taps in their homes. But these systems are in such a serious state of disrepair that for many people, having a water tap does not necessarily mean that they have sustainable access to safe drinking water. Indeed, these figures suggest that, far from improving, the situation has deteriorated significantly over the past 15 years.
Why is there such discrepancy in the figures? The answer is that official UN statistics for the MDGs only measure whether people of access to an “improved” water source – available at the turn of the tap in your home, from a standpipe, from a protected well, etc. But this does not answer the question whether the water that comes out of the tap or well is actually safe, whether the water is available at all times and whether the system is being lokked after to ensure that the water will remain safe in the future.
The policy implication of the current situation is that official MDG data about access to water supply and sanitation may be misleading EECCA governments and donors, and this could affect their decisions when developing co-operation projects and setting priorities for their assistance to the water sector.
It may therefore be appropriate to develop complementary indicators and targets to better reflect conditions in contexts where infrastructure exists, but is deteriorating. Examples of such indicators include continuity of water supply, leakage in the distribution network, pipe breaks, and quality of water at the tap.
For instance, non-revenue water has reached 52 per cent in Tajikistan in 2005. This trend is very worrisome since non-revenue water levels are not only very high but they are steadily increasing. The situation can seem even worse in Armenia where non-revenue water has gone up from 71 per cent to 81 per cent between 2000 and 2005. However, it is important to note that, in the case of Armenia, improved metering (including at the consumer level) has ensured better monitoring and therefore more transparency. As a result, water utilities are now unable to bill water that is lost in the network, which explains the substantial increase in levels of unaccounted-for-water. As consumer metering expands in other countries in the region, unaccounted-for-water may further increase. Some countries seem to present a more uneven picture. In Russia for example, the overall state of infrastructure is deteriorating which consequently leads to higher levels of non-revenue water in the country as a whole. But this trend is reversed in large cities where the level of unaccounted-for-water is slowly decreasing.
5 World Bank (2006), Monitoring What Matters – Tailoring Millennium Targets and Indicators of Environmental Sustainability to Local Conditions in ECA, Washington

15
Figure 3: Non Revenue Water6
Non Revenue Water
0%
10%
20%
30%
40%
50%
60%
70%
80%
90%
Armenia Azerbaijan Georgia Kazakhstan Kazakhstan(big cities)
Kyrgyz Rep. Moldova Rep. Russia Tajikistan Ukraine
2000
2001
2002
2003
2004
2005
Source: EAP Task Force Water Utility Performance Indicator Database
As for the continuity of water supply, the situation remains unsatisfactory, even if there is a slightly positive trend in a few countries. Apart from Russia, users in the countries surveyed still receive water for much less than 24 hours per day; for example in Georgia in the majority of towns water is supplied 12-16 hours on average, but in some places this can be as low as 4-hours per day; in Armenia7 a similar situation exists with water available for nine to twelve hours per day. However, in most other countries, water is available for at least 15 hours per day. Continuity of supply is subject to important variations depending on the size of the settlement. As illustrated in figure 5, the continuity of service is strongly correlated with the number of inhabitants. This confirms the idea that populations living in smaller settlements are more likely to experience difficulties in accessing water.
It should be noted that both the frequency of pipe breaks and of sewerage clogs has continued to increase in many EECCA countries, suggesting that slightly improved continuity of supply is not linked to improved infrastructure, but rather to reduced pressure on utilities to switch off water supply in order to save costs (e.g. by reduced electricity consumption of water pumps). In large cities in Kazakhstan, the number of sewerage clogs has more than tripled between 2000 and 2005. In Georgia, pipe-breaks have nearly doubled over the same period. All countries, with the exception of Russia, are significantly exceeding international benchmarks on these two indicators. This underlines the poor state of the infrastructure and its continued deterioration in most places in EECCA.
6 Difference between water supplied and water sold expressed as a percentage of net water supplied; as volume of water “lost” per km of water distribution network per day; and volume of water “lost” per water connection per day. 7 It should be noted that the continuity of water supply in Yerevan has improved significantly in the last two years. The private operator of the Yerevan water utility indicates that since the beginning of 2005 about 70 per cent of the population in Yerevan have received water for 24 hours per day.

16
The daily switching on and off of the network (and in many places this happens several times per day), allows micro-biological and other polluting infiltrations to contaminate the network, diminishing the quality of the water supplied, and increasing the wear of the infrastructure. This, coupled with persistently high levels of pipe-breaks throughout the region, allows for cross-contamination between water supply and sanitation pipes.
Hence, while water quality tests at intake into the network usually show only a limited number of samples not in conformity with legal standards, this water is contaminated while it is transported to consumers in the distribution network. The leakage in the sewer network results in significant amounts of effluent leaking into the environment, and reaching surface and ground waters.
Figure 4: Continuity of service (hours per day)8
Continuity of Service
0.00
5.00
10.00
15.00
20.00
25.00
30.00
Armenia Azerbaijan Georgia Kazakhstan Kazakhstan(big cities)
KyrgyzRep.
MoldovaRep.
Russia Tajikistan Ukraine
hrs
/day
2000
2001
2002
2003
2004
2005
Source: EAP Task Force Water Utility Performance Indicator Database
8 Average hours of service per day for water supply.

17
Figure 5: Continuity of service by category of settlements in Moldova in 2000-2005
Source: OECD EAP TF /EUWI /Jacobs (2007), Facilitating policy dialogue, and Developing a National Financing Strategy for Urban and Rural Water Supply and Sanitation in Moldova
One of the most positive trends is that many municipalities have been introducing large-scale metering programmes for households. For instance, Armenia has reached more than 60 per cent while Moldova now features close to 50 per cent of metered connections (Figure 5).
In Yerevan, Armenia, the implementation of a metering programme has resulted in about 80 per cent of connections being metered by 2004. This has had the effect of significantly driving down consumption as well as production. Metering levels have also significantly increased in Ukraine, Russia and Moldova. In the case of Moldova, water consumption decreased by about 30 per cent between 2000 and 2005, with water consumption levels now reaching 150 lpcd (litres per capita per day), similar to many EU countries (Figure 7).
Figure 6: Share of metered connections (%)9
Metering level
0%
10%
20%
30%
40%
50%
60%
70%
80%
90%
Armenia Azerbaijan Georgia Kazakhstan Kazakhstan(big cities)
Kyrgyz Rep. Moldova Rep. Russia Tajikistan Ukraine
2000
2001
2002
2003
2004
2005
Source: EAP Task Force Water Utility Performance Indicator Database
9 Total number of connections with operating meter/ total number of connections, expressed as a percentage.
100%; US 1996
Hours of service by settlement category
0
4
8
12
16
20
24
2000 2001 2002 2003 2004 2005
>200,000
50,000 - 200,000
20,000-50,000
5,000 - 20,000
0 - 5,000
Average
18
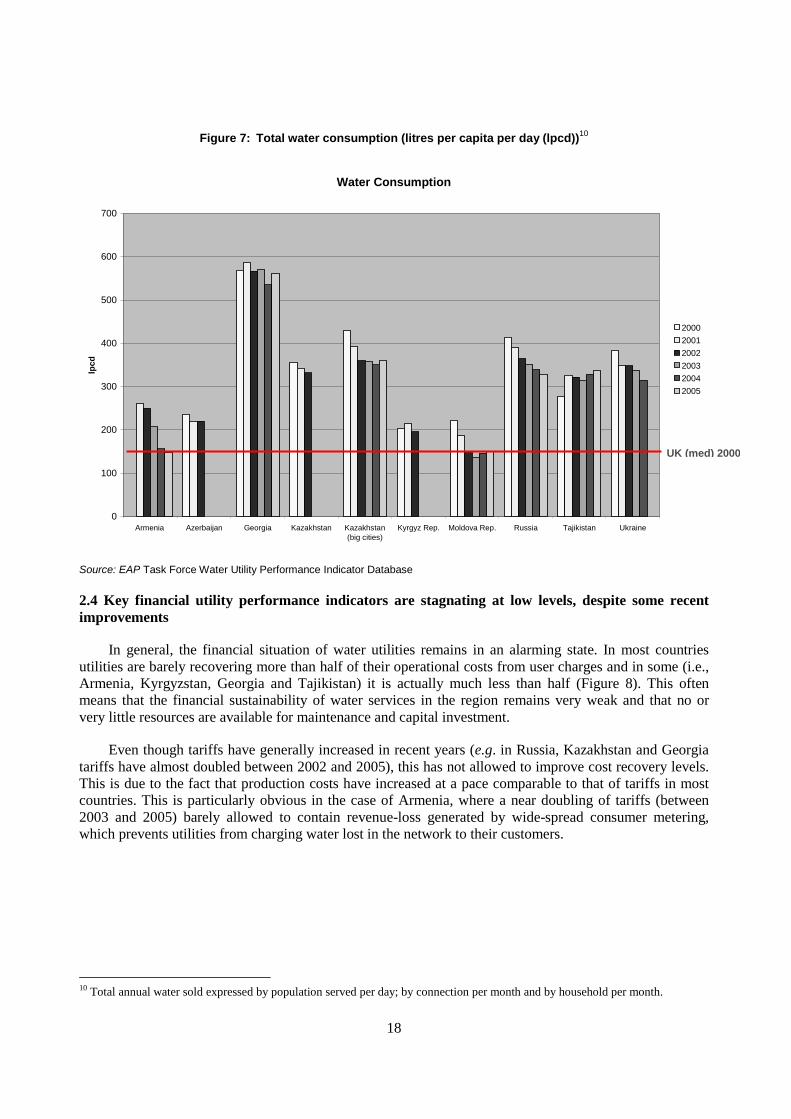
Figure 7: Total water consumption (litres per capita per day (lpcd))10
Water Consumption
0
100
200
300
400
500
600
700
Armenia Azerbaijan Georgia Kazakhstan Kazakhstan(big cities)
Kyrgyz Rep. Moldova Rep. Russia Tajikistan Ukraine
lpcd
2000
2001
2002
2003
2004
2005
Source: EAP Task Force Water Utility Performance Indicator Database
2.4 Key financial utility performance indicators are stagnating at low levels, despite some recent improvements
In general, the financial situation of water utilities remains in an alarming state. In most countries utilities are barely recovering more than half of their operational costs from user charges and in some (i.e., Armenia, Kyrgyzstan, Georgia and Tajikistan) it is actually much less than half (Figure 8). This often means that the financial sustainability of water services in the region remains very weak and that no or very little resources are available for maintenance and capital investment.
Even though tariffs have generally increased in recent years (e.g. in Russia, Kazakhstan and Georgia tariffs have almost doubled between 2002 and 2005), this has not allowed to improve cost recovery levels. This is due to the fact that production costs have increased at a pace comparable to that of tariffs in most countries. This is particularly obvious in the case of Armenia, where a near doubling of tariffs (between 2003 and 2005) barely allowed to contain revenue-loss generated by wide-spread consumer metering, which prevents utilities from charging water lost in the network to their customers.
10 Total annual water sold expressed by population served per day; by connection per month and by household per month.
UK (med) 2000
19
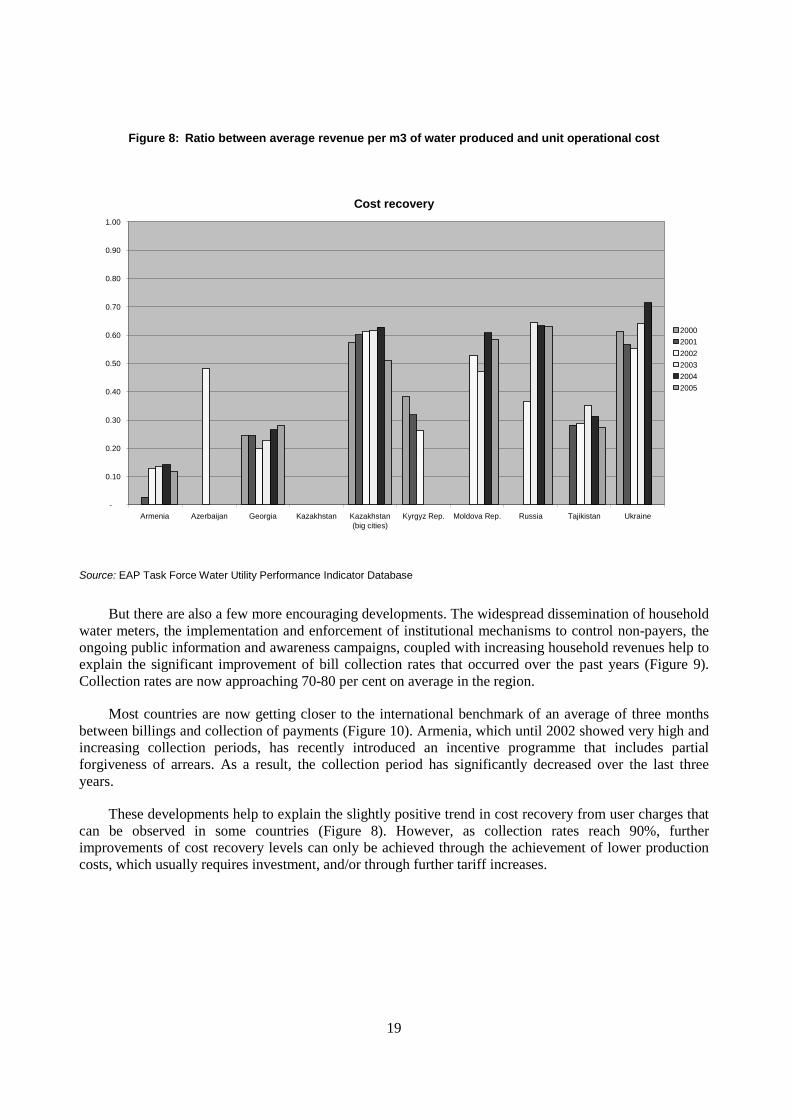
Figure 8: Ratio between average revenue per m3 of water produced and unit operational cost
Cost recovery
-
0.10
0.20
0.30
0.40
0.50
0.60
0.70
0.80
0.90
1.00
Armenia Azerbaijan Georgia Kazakhstan Kazakhstan(big cities)
Kyrgyz Rep. Moldova Rep. Russia Tajikistan Ukraine
2000
2001
2002
2003
2004
2005
Source: EAP Task Force Water Utility Performance Indicator Database
But there are also a few more encouraging developments. The widespread dissemination of household water meters, the implementation and enforcement of institutional mechanisms to control non-payers, the ongoing public information and awareness campaigns, coupled with increasing household revenues help to explain the significant improvement of bill collection rates that occurred over the past years (Figure 9). Collection rates are now approaching 70-80 per cent on average in the region.
Most countries are now getting closer to the international benchmark of an average of three months between billings and collection of payments (Figure 10). Armenia, which until 2002 showed very high and increasing collection periods, has recently introduced an incentive programme that includes partial forgiveness of arrears. As a result, the collection period has significantly decreased over the last three years.
These developments help to explain the slightly positive trend in cost recovery from user charges that can be observed in some countries (Figure 8). However, as collection rates reach 90%, further improvements of cost recovery levels can only be achieved through the achievement of lower production costs, which usually requires investment, and/or through further tariff increases.

20
Figure 9: Collection Rates
Collection rate
0%
10%
20%
30%
40%
50%
60%
70%
80%
90%
100%
Armenia Azerbaijan Georgia Kazakhstan Kazakhstan(big cities)
Kyrgyz Rep. MoldovaRep.
Russia Tajikistan Ukraine
2000
2001
2002
2003
2004
2005
Source: EAP Task Force Water Utility Performance Indicator Database
Figure 10: Collection period between billing and collection of payment (days)11
Collection Period
0.0
500.0
1000.0
1500.0
2000.0
2500.0
Armenia Azerbaijan Georgia Kazakhstan Kazakhstan(big cities)
Kyrgyz Rep. Moldova Rep. Russia Tajikistan Ukraine
day
s
2000
2001
2002
2003
2004
2005
Source: EAP Task Force Water Utility Performance Indicator Database
11 Year-end accounts receivable/Total annual operating revenues expressed in months equivalent of sales.
OECD (av) 2000

21
As a result of these financial weaknesses of water utilities, investments have remained at very low levels with as little as two to four USD of investments per capita in recent years. This is well below the level of investments needed for the maintenance and renewal of infrastructure, estimated at 24USD per capita per annum in Kazakhstan and 16USDper capita per annum in Georgia, and provides an additional indication of the continuing deterioration of the infrastructure.
2.5 The situation in the rural water sector
The situation in rural areas is significantly more serious than in urban areas, but it is also much less well documented. While in urban areas the quality of water services has suffered over the last few years, such services are often no longer provided in rural areas and people have had to resort to private means of providing themselves with water. In rural areas, state and collective farms have traditionally been responsible for operating and maintaining water systems. Following the break up of the former Soviet Union, and the subsequent dismantling of the state and collective farm system, this infrastructure was neglected, since there were usually no arrangements made to transfer responsibility for operation and maintenance from the state and collective farms to other institutions. As a consequence, much of the infrastructure is now out of operation and many rural inhabitants are forced to put in place private solutions where water quality is usually not monitored.
In Kyrgyzstan, for instance, only 67 per cent of the rural population has access to a sustainable water supply (available throughout the year and of sufficient quality for drinking), and this has been continuously decreasing in recent years (Figure 12). Only 16 per cent of the population in rural areas has access to water through in-house water taps, while stand pipes or water collected from canals and rivers remain the main sources of drinking water supply (Figure 11). The most widely used sanitation technology is conventional pit latrines.
Figure 11: Rural water supply sources in the Kyrgyz Republic
Rural Water Supply Sources in Kyrgyz Republic
55,3
21,215,9
4,92,6
0,0
10,0
20,0
30,0
40,0
50,0
60,0
Sta
nd p
ipe
Riv
er, C
anal
In-h
ouse
wat
er ta
p
Wel
l
Sp
ring
%
Source: National Statistical Office of Kyrgyzstan.

22
Figure 12: Access of rural population to sustainable, clean drinking water in the Kyrgyz Republic
Access to sustainable water supply in rural areas of Kyrgyz Republic
78,975,7 76,2
67,3
60
65
70
75
80
2000 2001 2002 2003
%
Source: National Statistical Office of Kyrgyzstan.
In the Ukraine, more than 70 per cent of the rural population (settlements with a population of less than 20 000) are not connected to centralised water systems, and as much as 91 per cent lack access to corresponding sewerage services. As a consequence these populations have to use water from wells, reservoirs, and open springs, which often do not meet sanitary standards. More than 800 000 people use water from vendors, which usually is of poor quality. In recent years, problems with nitrates, oil, and pesticide and bacteriological contamination of these water sources became particularly acute. As most people use this water without any treatment an increasing number of outbreaks of infectious diseases have been observed.12
A problem that is increasingly being faced in rehabilitating and extending rural drinking water infrastructure is that many people in rural areas are now living at subsistence levels and are unable to generate sufficient cash to pay for water services. Unless subsidies from public budgets are available for these people, water supply and sanitation technologies that are put in place in rural areas have to be simple enough so that they can be maintained and operated by local users themselves.
Given the lack of information on rural water infrastructure and the resulting uncertainty about the actual situation, the needs, and the priority actions that could be taken, the first step that EECCA governments need to undertake is to collect such data on a large scale. Recently, the EAP Task Force in collaboration with the EU Water Initiative launched two projects in Armenia and Moldova aimed at developing a financial strategy for water supply and sanitation. A similar project will be undertaken in Georgia in the near future. This work will contribute in solving the data availability problems.
2.6 Public health impacts are negative, but hard to substantiate in a systematic manner
The deterioration of the quality of water services in EECCA countries is undeniable. The increasing levels of leakage and discontinuity of service indicate a parallel decrease in the quality of water that is being delivered. Whether this has generated an increasing number of health incidents is difficult to establish, however, given the complexity of the issue, with a number of other factors influencing key health indicators (water is often not the only aspect affecting people’s health). Data from the WHO Europe
12 Mama-86 (2004), “Models of the technical solutions of drinking water problems in the urban and rural areas of Ukraine”, Kyiv.

23
“Health for all” database indicates that some of the key indicators for water-borne diseases have been slightly declining in the region over the past years (namely figures for infant mortality and under-five mortality from diarrhoeal diseases)13, while others have been steadily increasing (namely the incidence rate of viral hepatitis A).
The fact that the deterioration of water services does not show more clearly in the health figures may be linked to an increasing awareness among the population that tap water is no longer safe to drink and the resultant usage of bottled water or purification techniques, such as boiling or filtering. In the greater Baku area in Azerbaijan for instance, 97 per cent of the population reported that they were systematically boiling water for drinking purposes.
Despite these preventive measures, there are still many cases of outbreaks of epidemics, following accidents in the water supply system, that are being reported from the region. In 2004, in Yerevan, where indications of water quality have been relatively positive, and 80 per cent of the population say that they never use purification devices, several hundred children had to be hospitalised due to a sewerage spill into the supply network. A similar accident occurred in the town of Sukhodolsk in the Ukraine, where more than 700 people had to be taken to hospitals, about 250 of them children. Almost all of them were diagnosed with viral hepatitis A. Similar episodes are reported from many locations in EECCA.
While some of the problems shown via key water-related health indicators may be declining, the overall levels of these indicators still remain very high compared to OECD figures, often by a factor of 50 or more. The WHO estimates that in the ECE region14 more than 13 000 children under the age of 14 die every year due to poor water conditions, most of them in the EECCA region, and that the economic and human benefits of improving water supply and sanitation would be very substantial. The WHO estimates that the cost benefit ratio of investing in improvements in WSS infrastructure in a group of ECE countries could be as high as 13, with one USD invested yielding as much as 13USD in benefits.
2.7 Municipal water utilities have become the predominant source of pollution of surface waters
The level of household connection to sewerage infrastructure is relatively low compared to many OECD countries. Even when households are connected to sanitation infrastructure, the treatment of wastewater is often not assured. While little consolidated information exists about the level of equipment at primary and secondary treatment facilities (tertiary is still an exception in the region), it is clear that existing infrastructure often does not operate effectively and sometimes does not operate at all (Box 2). This is mainly linked to the advanced state of deterioration of this infrastructure, as well as lack of cash for operational purposes.
13 It should be noted that the UNECE questions the reliability of these figures. In surveys that were carried out to verify the official health data in the EECCA region, significant discrepancies appeared, with figures for infant mortality rate and under-five mortality rate being significantly (sometimes up to factor three) higher. According to this data, figures for infant mortality in Azerbaijan and Tajikistan would reach similar levels as in India. Possible reasons for such discrepancies may reside in differences in definitions of “live births”, as well as a decline in the registration of all births due to increased fees (UNECE [2004], Economic survey of Europe No. 1, Geneva. 14 The UN’s Economic Commission for Europe has 55 member countries from Europe, Caucasus, and Central Asia, as well as Canada and the United States.

24
Box 3: Status of the wastewater treatment capacity and actual flows in some towns in Moldova in 2005
Orhei - The capacity of the wastewater network and wastewater treatment plant (WWTP) is 10 000 cu m/day, and the actual water flow was 2 600 cu m/day or 26 per cent of the designed capacity in 2005. Only a quarter of wastewater was collected from households.
Cantemir - The capacity of the pumping station and WWTP is 3 500 cu m/day, and the actual wastewater flow is only 97 cu m/day which corresponds to less than 3 per cent of the designed capacity.
Donduseni - The capacity of the pumping station and WWTP is 2 400 cu m/day, and the actual water flow is 140 cu m/day. None of the collected wastewater is being treated as the WWTP is not in operation.
Telenesti - The capacity of the pumping station and WWTP is 3 100 cu m/day, and the actual water flow is 114 cu m/day, 29 per cent of which were collected from households. None of the collected wastewater is being treated as the WWTP is not in operation.
Ungheni - The capacity of the pumping station and WWTP is 15 000 cu m/day, and the actual water flow is 2265 cu m/day, or 15 percent of the designed capacity. Biological treatment is not in operation. Untreated wastewater is discharged into the Prut.
Source: OECD EAP TF /EUWI /Jacobs (2007), Facilitating policy dialogue, and Developing a National Financing Strategy for Urban and Rural Water Supply and Sanitation in Moldova
As a consequence of this situation, coupled with the decline of many polluting industries in the 1990s, municipal water utilities have now become the main polluters of surface waters in many EECCA countries. In the Russian Federation for instance, communal water systems account for close to 90 per cent of wastewater discharges, of which only 10 per cent are treated according to standards. They are also the source of more than 50 per cent (and up to 90 per cent) of key pollutants that are being discharged into surface waters, such as phosphorus (85 per cent), nitrates (82 per cent), and lead (49.5 per cent)15.
The lack of adequate wastewater treatment is putting EECCA surface waters under serious environmental stress. According to the European Environment Agency (EEA), some of the major rivers in the Russian Federation and their tributaries are now highly polluted. The main water reservoirs are also highly polluted, especially the Volga cascade. In the Ukraine, all river basins are classified as polluted or very polluted. Similar situations exist in most areas in EECCA that feature a high density of population and economic activity. The EEA also reports that most EECCA countries have problems with the quality of their drinking water supplies. The percentage of samples of drinking water exceeding microbiological standards is between five and 30 per cent, this excess being higher in non-centralised drinking water sources, primarily in rural areas.
The EEA also reports that up to 90 per cent of nitrogen and phosphorus discharges into the Black and Caspian Seas originate from riverine inputs, which mostly transport municipal wastewaters. Both seas are assessed as being under severe environmental stress, with significant eutrophication problems in both seas, and frequent closures of beaches on the Ukrainian and Georgian parts of the Black Sea coast due to the poor bacteriological state of the water.
15 “Commonwealth of Independent States in 2002”, Interstate statistical committee of the Commonwealth of Independent States, Moscow 2003

25
3. LEGAL AND INSTITUTIONAL REFORMS UNDERTAKEN SINCE THE ALMATY CONFERENCE
Overall, a review of the major institutional and legal reforms in EECCA conducted by the EAP task Force in 2005 indicates that many countries have undertaken measures to improve the situation in the water supply and sanitation sector, most of them in line with recommendations in the Almaty Guiding Principles. In particular, central governments have sought to improve the coherence of the institutional set-up governing the water sector, as well as developing framework legislation so as to better guide local level actors, mainly in setting tariffs. However, these measures remain partial and many of those that have been taken are still very recent, their implementation at the operational level not being effective yet. Also, lack of reforms at the local level (i.e. the establishment of utilities as autonomous, commercially-run utilities), is impeding positive effects from improved institutional and legislative measures taken at the central level. The focus of policy makers should therefore shift from developing to implementing laws and regulations, as well as to efforts to support local governments and utilities in implementing the Almaty Guiding Principles. Further efforts are needed to integrate water-related objectives into national policies, including PRSPs, and to take advantage of opportunities to link reform of the water sector to the achievement of the internationally agreed water targets. There are a number of positive examples of reforms at the local level that hold important lessons for how such reforms can be carried out. A key challenge is to find ways to disseminate and scale up these best-practice examples.
Table 2 provides an overview of reforms in some key areas. The rest of this section provides more detail on some reform highlights, including decentralisation, tariff setting, subsidies, collection rates, performance indicators, private sector participation, and public participation.
3.1 Decentralisation
The Almaty Guiding Principles recommend decentralising responsibility for water supply and sanitation services to the municipal level (avoiding excessive fragmentation), while in parallel establishing the legal, regulatory, and institutional framework for sound and sustainable municipal finance and management of the sector.
Responsibility for water was decentralised in many EECCA countries in the 1990s (Ukraine, Russia, Azerbaijan, Georgia, Moldova, Kazakhstan, Kyrgyzstan), while it remains centralised at the state level in a few others (Belarus, Turkmenistan, Tajikistan).

26
Table 2: Overview of reforms in key areas of the water supply and sanitation sector carried-out until 2005– selected EECCA countries
Armenia
Kazakhstan Kyrgyzstan Moldova Russia Ukraine
Strategic planning and policy priority
Included in 2003 PRSP
Set up a national sector programme
Included in 2002 PRSP
Included in 2004 PRSP
Set-up a national programme for housing and communal services (HCS) sector reform, incl. WSS. Also, several regions developed HCS and WSS sector strategies
Developed a national strategy for WSS
Regulatory oversight of utility performance
Central gov. responsible for large utilities Local gov. for rural
Municipal Municipal Municipal Municipal (predominant) or Region
Municipal
Asset ownership Central gov. large utilities Local gov. rural
Municipal (predominant) or private
Municipal (90%) State (10%)
Municipal Municipal (predominant) or Region
Municipal (most), few regional or state
Tariff setting Central gov. Public Services Regulatory Commission
Municipal, pending approval by Regional offices of National Monopoly + Competition Regulation Agency + governor; Cost plus basis
Municipal, pending approval by Regional offices of National Monopoly + Competition Regulation Agency; Cost plus basis
Municipal Municipal (predominant), Regions (when region ownership or PSP1)
Municipal
Role of central gov.
Has full responsibility for utility sector, incl. capital expenditures
Little guidance and oversight besides tariffs + capital expenditures
Little guidance and oversight besides tariffs
Recommends tariff methodology, but no implementation at municipal level
Sets framework for tariff setting (currently under implementation)
Sets framework for tariff setting and monitors performance at regional level
Subsidies Income support for the poor
About USD 750 million over 8 years from a national sector programme; Income support for poor
No subsidies for utilities; Income support for the poor
None to utilities; Income support for the poor
Municipalities now have to compensate utilities for difference between tariff and cost; Compensation for cost of privileges; Income support for poor
Central budget subsidies of 80m USD;Compensation for cost of privileges; Income support for poor
Legal status of utilities
Joint Stock Companies 100% state owned (with few exceptions)
Joint Stock Companies, municipal or private owned
Business entities under municipal ownership
Municipal companies (predominant) or Joint Stock Companies
Municipal or State Unitary Enterprises, some joint stock companies
Municipal or Regional Unitary Enterprise
State of PSP Management contracts with private operators in 2 biggest utilities (66% of population), to be replaced with lease contracts soon; Provision for delegated management in Water Code
Many medium-sized cities have domestic private sector owners; Concession law in place
No legal framework for PSP; One management contract with international Private Sector in Osh
Concession law in place, but lack of guidance for implementation; No cases of PSP
Concession law in place (2005); 8% of urban population served by PSP utilities, mostly lease contracts
Concession law, but very little PSP (domestic operators)
Contracts between utility/municipality
Performance contracts in most big utilities
No serious contractual relationship between utilities/municipalities
Only a few cases of performance-based contracts
Only a few performance-based contracts
Strategic planning
WSS financing strategy
WSS financing strategy
WSS financing strategy
WSS financing strategies in several oblasts
WSS financing strategy
Public participation
Public participation in tariff revision possible
No provisions for public participation
Law setting right of access to information and consultation of population
Currently under developed, but new law allows access of public to information from 2006 on
Public hearings in some municipalities; Law on WSS information
Note: 1. PSP = Private Sector Participation.

27
While most countries with centralised responsibility for water supply and sanitation suffer from the usual rigidities and inefficiencies that this form of governance induces, the process of decentralisation has brought its own set of problems. In some cases decentralisation created inconsistent institutional arrangements, with the ownership of WSS assets and responsibilities for investment, tariff-setting, operation, and maintenance residing with different institutions. Many of these inconsistencies have now been removed and these functions are now usually concentrated at the level of local governments. However, the absence of comprehensive inventories of WSS assets, and of correctly functioning property registers in most EECCA countries still hampers the effective functioning of decentralised water management.
In contrast to most other EECCA countries, in 1990 s Armenia chose to recentralise responsibility for, and ownership of, WSS infrastructure. In a small country like Armenia (about three million people), this was perceived to be the most effective way of speeding up the pace of reforms. Now that many reforms are well under way, Armenia is gradually decentralising responsibility for water again, using an institutional set-up that it previously pilot tested in one region.
3.2 Tariff-setting
Inadequate and poorly developed tariff rules and tariff-setting procedures have been one of the main causes for the poor financial situation of the sector. While the situation remains unsatisfactory in a number of countries with the absence of regular tariff reviews, and an inadequate definition of the cost items to be considered for tariff calculation, there are a number of positive developments too. Ukraine and Russia for example, have made significant efforts to improve their tariff-setting frameworks, with the objective of better reflecting the economic realities, as well as seeking to insulate tariff-setting from excessive political interference. In the Ukraine, the 2004 law on Communal and Housing Services requires the regulator to compensate utilities for below-cost tariffs (Box 3), which if enforced, should be a strong incentive for local authorities to effectively implement cost recovery tariffs. While these reforms point in the right direction most are still very recent and time will be needed for effective implementation at the local level and for results to materialise.
Measures such as those taken in Ukraine and Russia will result in increased water tariffs in the short term, if properly implemented. However, this may pose serious problems for low income groups. For instance, in Armenia, about half of the population would have to pay more than four per cent of their income if tariffs were to be increased up to cost recovery levels. As a consequence Armenia is working to improve its income support programme for the poor, in particular through improved targeting of the programme, while considering the possibility of state subsidies to allow tariffs to remain at lower levels in the medium term (these issues are discussed further in document OECD (2006).16
16 OECD (2006): Financing Water Supply and Sanitation in Eastern Europe, Caucasus and Central Asia, Proceedings from a conference of EECCA Ministers of Economy/ Finance and Environment and their Partners, 17-18 November 2005, Yerevan, Armenia.

28
Box 4: Ukrainian Law on Housing and Communal Services (passed in June 2004)
- Introduced a requirement that the Cabinet of Ministers of Ukraine should determine a procedure for setting tariffs for water supply and sanitation services. Before the adoption of the Law, the State Committee for Housing and Communal Economy Affairs developed guidelines and adopted them by its decrees;
- Granted an exclusive right to local government authorities to set tariffs at the local level for utilities in any ownership form;
- Introduced the principle of full recovery of economically justified costs. The law explicitly bans approval of tariffs for housing and communal services below the level of economically justified costs for their production;
- Where a regulator decides to set a tariff below the economically justified costs level, the regulator is obliged to provide to the regulated utility a subsidy from the local budget to cover the gap between the approved tariff and economically justified costs for provision of services.
Under the Ukrainian Law on Housing and Communal Services, tariff-setting procedure for water supply and sanitation services is determined by the Cabinet of Ministers of Ukraine, which considerably limits room for arbitrary political interference on the part of the local authorities.
3.3 Subsidies
Another sign that EECCA governments are increasingly recognizing that local authorities in charge of water infrastructure are in need of support, is the recent creation of central budget funds to subsidize investment. Both the Ukraine and Kazakhstan have set in place such funds with the objective of providing municipalities and utilities with financial support for investments for the prevention of accidents or to improve the efficiency of water systems. In the Ukraine the amount of money allocated for this purpose was about EURO 80 million in 2004. Kazakhstan allocated about USD 750 million over eight years.
Central governments have also made efforts to honour their financial commitments vis-à-vis utilities, most notably by resuming payment of compensation for social services provided through utilities (such as privileges that involve reduced tariffs for certain categories of the population). Also, budget entities (such as administrations, hospitals, etc.) have resumed the payment of their water bills, which in the late 1990s had become the exception rather than the rule. A more detailed discussion of the role of central government in financing municipal water infrastructure is provided in paper OECD (2006).
3.4 Improving collection rates
Collecting payments from water users has been a significant problem in the past. This is an area where many EECCA countries have achieved important improvements recently. For instance, in Russia and the Ukraine collection rates improved from just over 50 per cent in 2000 to close to 90 per cent in 2004. Even more impressive is the achievement in Armenia where, thanks to a programme for the forgiveness of arrears (Box 4), collection rates went from between 10-20 per cent in 2001 to close to 100 per cent in 2004.
Renewed economic growth in the EECCA region has facilitated improved collection rates by generating more tax revenue and industry profits, as well as allowing salaries to be paid on time. Also, many utilities have improved their billing systems, so as to issue bills and register consumers more systematically than in the past.

29
Box 5: Implementation of the Household Arrears Restructuring Programme in Armenia
In November 2002 the National Assembly passed Law No. 441-N, which created an effective incentive framework for improved bill collection by writing off a portion of past arrears for households that install water meters within six months.
Arrear write-off procedure. All the water arrears incurred prior to 1 January 2000 will be written off for water users provided they pay 50 per cent (for households who receive round-the-clock water supply) or 30 per cent (for households who receive a scheduled supply) of the arrear accumulated between 1 January 2000 and 9 December 2002. Those covered by the national family assistance programme (PAROS) and entitled to poverty benefit are required to pay reduced rates of 30 per cent and 15 per cent respectively. Those who have duly paid their water bills throughout this period will be credited 70 per cent of payments made between 1 January 2000 and 9 December 2002 as advance payment for future bills. This settlement is made on the condition that a water meter is installed at the expense of the household, and that current payments are made in full and in a timely manner
It should be noted that the government decree does not obligate households to install meters. However, it is a prerequisite for the arrear write-off.
Programme results. The Household Arrears Restructuring Programme has had a major positive impact on the collection rate. This is because an alternative to installing meters was to pay the full arrears over the entire period of default without any relief. The increased collection rate resulting from the implementation of the Programme facilitated financial rehabilitation of the water supply and sanitation utilities.
The same Programme accounts for mass installation of individual water meters in the households, which also increased the collection rate because, first, this lowered the bill, and, second, increased public confidence in the bills issued. By incorporating the promotion of individual meter installation as one of the key components of the Programme, the Government accomplished several things at once: it improved the financial standing of the water utilities and enhanced transparency in the sector.
3.5 Performance-based contracts between utilities and municipalities
The Almaty Guiding Principles recommend that municipalities use performance-based contracts to create a framework where utilities can be held accountable for their performance. Such contracts are crucial in helping to establish utilities as autonomous and commercially-run entities, as they require a clear definition of the scope of the contract (i.e. the assets that the utility is responsible for operating), the objectives (i.e. performance indicators and objectives that the utility is supposed to achieve), as well as the means (i.e. tariff levels over time and subsidies) that are put at the disposal of the utility to achieve these objectives (see document OECD (2006) for a more detailed discussion).
Even though the legal status of many water utilities in the region has been modified to that of private business entities (such as joint stock companies), this has not in itself helped to render them more autonomous. In most EECCA countries, the vast majority of water utilities (about 95 per cent) continue as extensions of the city administration, thus incurring political interference in day-to-day operations, as well as the use of revenue for non-water purposes.
However, there is now a small number of examples in EECCA where the relationship between municipalities and utilities has been restructured successfully, providing utilities with more autonomy in their operations, and municipalities with the tools to assess their work (Box 5). The key challenge for policy is therefore to effectively disseminate and scale up the positive experience that exists in cities such as Surgut.

30
Box 6: Surgut’s Municipal Services Development Project
The City of Surgut is the largest city of the Khanty-Mansi Autonomous Okrug (administrative region) in Western Siberia with a population of 282 000. The City is regarded as among the best Russian municipalities based on financial strength and city management.
In 2001 the City of Surgut elaborated the Municipal Services Development Project in order to upgrade and rehabilitate its municipal water and district heating services and therefore to put these on a financially sustainable footing. The Project includes capital investments, which yield high economic and financial rates of return, reduce energy consumption, and increase efficiency in the provision of water, wastewater, and district heating services. It also includes an institutional development component to improve financial and operational performance of Surgut municipal utilities. Total Project costs are EUR 87.5 million, of which EUR 45 million is from an EBRD loan. The loan agreement was signed with the European Bank for Reconstruction and Development in June 2002.
The City is responsible for project implementation and all debt service of the loan including interest, fees, and principal repayments. However, debt service payments will be met from income from the municipal utility companies “Gorteploset” and “Gorvodokanal” (hereinafter the "Utilities") that provide district heating, water supply, and wastewater services in Surgut.
To enhance the institutional capacity of the municipal Utilities, the Project includes technical assistance for implementation of a Financial and Operational Performance Improvement Programme aimed at enhancing their commercial viability and administrative and managerial capacities. In 2004 the municipality and the Utilities entered into service contracts.
Main objectives of the service contract for the municipality:
- Replacement of administrative relations by contractual relationship;
- Equal allocation of rights and duties among the parties - the municipality and the Utilities - when providing municipal services, such as water supply, wastewater disposal, and heat supply to the population;
- Change-over to capital costs financing incurred by rehabilitation and extension of a municipal infrastructure by the Utilities as an alternative to the budgetary financing;
- Introduction of commercial management at the Utilities; transference of the Utilities to direct contractual relationship with the population and other consumers of services; to ensure the Utilities’ survival in a competitive environment;
- Increase of capitalization and market value of the Utilities before their privatisation.
The contract’s duration is 30 years. It provides for a two-year transition period during which the following action should be taken:
- Defining and charting distribution perimeters and geographic zones;
- Primary inventory of fixed assets for the purpose of their classification and determination of the following: function, geographical location, renewal character, acquisition date, acquisition price, technical condition, depreciation, net balance value, replacement cost, etc.;
- Analysis of fixed assets’ physical state, deterioration rate, and further operating possibility. Reveal new priority works to be overhauled/reconstructed or replaced in order to update the utilities’ investment programme;
- Development of a medium-term programme for new construction and extension of municipal infrastructure works;
- To define basic principles and tariff regulation procedure for the services provided by the Utilities with consideration of current laws;
- Creation of a financial management service for each Utility, introduction of a budgeting system to the utilities; analytical reporting regarding types of activity, functions, and geographical zone groups;
- Introduction of a management information system;
- Pursuant to the contracts, the municipality delegates to the Utilities exclusive right to operate services under the concession for the period of 30 years. The municipality shall not take any administrative or other decisions that may limit or prevent the Utilities from performance of their exclusive right to operate these services. Moreover, the municipality shall compensate the Utilities’ losses incurred due to the municipality’s actions or failure to act regarding

31
the services. The contracts define terms and procedures for tariff establishment, and penal sanctions for failure to accept tariffs in time.
Principal efficiency indices applied in the service contracts:
- Operating efficiency of the transferred services as volume of water sold to volume of water produced, excluding leakage;
- Total leakage, which includes transportation and delivery leakage, and commercial losses;
- Share of metered connections;
- Collection ratio;
- Average service coverage;
- Service coverage by geographical zones;
- Average investment for new connections.
Annually the municipality prepares and publishes, in the local press, a memorandum on the Utilities’ operating efficiency based on the efficiency indices.
Source: Project Implementation Unit of Surgut’s Municipal Services Development Project, 2005
3.6 Private sector participation
Following the Almaty conference there was a lot of hope that the private sector might play an important role in supporting water sector reforms, including through investment, but also fears that the private sector might use the weak governance of the sector to abuse monopoly power. In the last five years the involvement of the private sector has generally remained at a very low level. There are only very few cases of private sector participation (PSP) in the region, most of them being management or lease contracts where the private sector has very limited risk. Most international private sector actors have become more risk averse, which has largely discouraged them from entering EECCA markets which feature unfavourable investment climates. High levels of perceived political and regulatory risk, lack of reforms at the local level, and reluctance of municipal authorities to engage in PSP arrangements have also deterred stronger private sector involvement.
There are some exceptions to this general situation though. One is Armenia, where almost all major utilities have come under private sector management, and cover about 65 per cent of the population. These management contracts have been put in place in the framework of a number of IFI and donor assistance programmes and take the form of management contracts involving international operators. The other is the Russian Federation, where a number of domestic private sector operators have been created over the past two years. These new operators have been moving into the water market very aggressively, establishing mostly short term lease contracts in about 20 cities, covering approximately eleven per cent of the urban population in Russia. In some cases, the involvement of the private sector has helped to improve the operational efficiency of utilities, but whether this trend is sustainable and whether domestic firms are able to improve water services for the population in the long run still remains to be seen.
3.7 Public participation
The Almaty Guiding Principles recommend that “the public should be directly engaged in the reform process”, including “through the participation in key decision processes, as well as the provision of information so as to ensure that the interests of all stakeholders are protected”.
While many EECCA countries seem not to have achieved big progress in this area, a few countries have undertaken measures. There are now a number of EECCA government agencies that have set up public relations offices, created web pages, and organise seminars and conferences. Some governments

32
also started publishing national reports on water, e.g. the Ukrainian Law on Drinking Water stipulates that the relevant sector authority publishes an annual national report on drinking water quality and on the situation in the water supply and sanitation sector. A number of water utilities (e.g. Moscow, St Petersburg, Kiev) have established public relations units, telephone “hot lines”, as well as launched information campaigns. These routinely inform the population about current problems and solutions, initiate public discussions, and work with debtors on an individual basis.
Several countries have also taken legal dispositions to allow for public participation in decision making. For instance, the Armenian Water Code contains a provision to involve civil society groups in the tariff approval process. Similarly, Moldova has set in place a law that stipulates the consumer’s right of access to information, as well as an obligation to consult the population for key decisions.
According to NGOs who are working in the field, and despite some positive examples, overall, the level of public involvement in the reform process in EECCA has remained very low. Even where legal requirements for a public participation process have been set in place, this may often be done in a “stealthy” manner. The main problems appear to be the lack of information about such public participation procedures (in some cases authorities might deliberately choose to give such processes a low profile), the information on planned reforms that is made available to the public, as well as its quality. These factors tend to significantly reduce the potential for the active engagement of civil society groups.

33
4. FINANCING WATER SERVICES AND THE SOCIAL IMPLICATIONS OF TARIFF REFORM
4.1 Introduction
The water supply and sanitation (WSS) sector in EECCA is chronically under funded and as a result has been deteriorating for more than 20 years as has been shown in previous sections of this report. If this trend is to be reversed, and the internationally-agreed targets for water supply and sanitation (Millennium Development Goal 7 target 10) achieved, appropriate policy and institutional reforms will have to be put in place to ensure the financial sustainability of the sector. Recent up-turn in GDP growth and household income in most EECCA countries provides a more favourable context, than at the time of the Almaty Ministerial Meeting in 2000, to undertake such measures.
Between 50 and 90 per cent of water utility revenue is currently generated by user charges; the remainder mostly comes from public budgets (Figure 13). However, these funds are insufficient even to cover operational costs, let alone maintenance and capital costs. In many countries utility revenue covers only about 60 per cent of operation costs (see figure 8 in section 2). Between USD 15 to 34 per capita per year of additional finance would be needed if present infrastructure were to be properly maintained and renewed, where this is necessary (Figure 14). To achieve the Millennium Development Goals (MDG) on water supply and sanitation, it has been estimated that a total of about EUR seven billion would be needed annually i.e. roughly double the current level of finance.17 Given this financial shortfall, most utilities in the region have had to decrease the levels of service that they provide in order to save on costly inputs such as electricity and chemical reagents for water treatment. In addition, utilities have been unable to carry out basic maintenance, further accelerating the deterioration of infrastructure. This has significant negative impacts on public health and the environment, as well as for economic development, as we have seen.
17 Danish Ministry of Environment DANCEE (2004), Financial needs of achieving the Millennium Development Goals for water and sanitation in the EECCA region, draft main report, ref. No. M 128/000-0051.

34
Figure 13: Existing sources of financing water and wastewater utilities
0%
20%
40%
60%
80%
100%
Novgorod Pskov Kaliningradoblast
Rostov Moldova Georgia Ukraine Kazakhstan EasternKazakhstan
User charges Public budgets Other
Source: OECD (2003)18.
To reverse these trends, a number of prerequisites have to be met before a series of reforms can be successfully implemented. EECCA countries will have to improve the operational efficiency of water utilities, thereby reducing operational costs, combine all sources of finance to enhance synergies, avoid crowding out other sources of finance, and maximise leverage on total flows. A number of case studies in the region have shown that this is possible.
Figure 14: Expenditure need and supply of finance in EUR per connected inhabitant, in the first year of the baseline scenario
0
8
17
25
34
42
51
Pskov Ukraine Georgia Novgorod Kazakhstan Moldova Rostov Kaliningradoblast
EasternKazakhstan
EU
R p
er c
onne
cted
inha
bita
nt
Per capita expenditure needs Per capita supply of finance
Source: FEASIBLE, except Kaliningrad oblast for which individual model calculations are presented.
18 OECD (2003): “Financing strategies for water and environmental infrastructure”.

35
4.2 Major prerequisites
The scale of financing required would be significantly reduced if the operational efficiency of water utilities were improved. To save on costs, the problems of oversized infrastructures, energy intensive equipment, water leaks, and unaccounted-for water should be addressed. In many utilities, electricity costs account for 50 per cent or more of production costs (where all consumables account for less than 30 per cent of the operation costs of WSS services in France). Unaccounted-for water can be as high as 70 per cent, while international best practice suggests that it should not exceed 10 to 20 per cent.
In addition, municipalities should choose the level of service and the related technologies in accordance with the financial resources available to cover the costs. Politically difficult choices might be required to adapt service levels to available finance. For instance, a study in Georgia showed that achieving improved water services, and extending such services to achieve the Millennium Development Goals, would only be affordable if a significant share of the population was served through stand pipes rather than in-house connections.
Central governments can provide useful incentives, by developing national or regional financial strategies. All financial decisions, including investment choices and maintenance operations, should be based on medium-term financial plans, in line with water policy priorities set by competent jurisdictions. Such plans should be incorporated into wider, binding budgetary processes, such as medium-term expenditure programmes, at both national and local levels. To induce such behaviour, central governments should allocate their financial contributions to projects and municipalities that have adopted such financial frameworks.
4.3 User charges are the main source of finance and should be managed as a policy instrument
User charges are, and will remain, the most important source of finance. A number of EECCA countries could still significantly increase user charges before reaching affordability limits. Sound tariff-setting rules and mechanisms should be established to promote more efficient use of water resources and to ensure transparency and predictability. Tariff levels should be economically and socially justifiable, and prevent any abuse of the monopoly position that utilities generally enjoy.
There are legitimate affordability concerns: social assessments in a number of EECCA countries show that as much as 50 per cent of the population may in some cases exceed the four per cent income threshold that is often used as a “rule-of-thumb” to determine the maximum acceptable level of spending on water (Figure 15); the poorest 20 per cent of the population may sometimes have to spend close to 10 per cent of their income. This issue should be addressed directly and not used to keep tariffs at levels that undermine the financial sustainability of utilities. So, on the one hand, tariffs should be set at a level that is economically justified - requiring municipal budgets to cover the difference between cost recovery and actual tariff levels has proven to be an effective incentive. On the other hand, adequate social protection mechanisms should be introduced in EECCA, in conjunction with reforming tariff systems.

36
Figure 15: Distribution of Yerevan households by expenses for water/wastewater services as a percentage of household consumer expenditures, 2004 and 2005 projections
29,1
9,8
4,1
38,7
7,1
12,4
27,7
5,3 3,4
2,3 1,01,1 0,80,2
3,0
11,1
3,56,6
26,9
2,91,1 1,9
0,0
5,0
10,0
15,0
20,0
25,0
30,0
35,0
40,0
45,0
0-1% 1-2% 2-3% 3-4% 4-5% 5-6% 6-7% 7-8% 8-9% 9-10% 10%and
more
Percentage of water/wastewater chages
Sh
are
of
ho
use
ho
lds,
%
2004
2005
Source: OECD/EAP Task Force (2004)19.
Many countries have such mechanisms in place, either in the form of income support or through cross-subsidised tariffs. However, for the former, targeting could be improved by enhancing the procedures for determining and verifying household incomes, and by linking benefits more closely with real needs. If this is done, social protection measures can be an effective way to overcome social resistance to increased user charges, and help to generate significant additional revenue for water utilities.
Increasing block tariffs (where water tariffs increase step-wise as consumption levels increase, with a first subsidised block), now widely used in many OECD countries, is a powerful alternative. However, it requires that connections are metered, and therefore is not usually yet an option in most EECCA countries. This option could be considered in Armenia where a programme for addressing payment arrears has resulted in the share of metered connections in Yerevan reaching 80 per cent.
4.4 Public finance, including central budgets, will continue to play a crucial part in financing water systems in EECCA
Public budgets are the second largest source of finance for the water sector; their share can amount to 50 per cent in some countries or regions. Simulations using FEASIBLE20 show that to improve and extend water services, including the achievement of the Millennium Development Goals on water supply and sanitation, the magnitude of public finance spent on water-related investment will have to increase substantially. A recent study in Georgia suggests public finance would need to double to achieve the MDGs in urban areas.
19 OECD/EAP Task Force (2004): “Consumer protection in urban water sector reforms in Armenia: ability to pay and social protection of low income households.” 20 FEASIBLE is a tool jointly developed by the Danish Government and the OECD to support the development and implementation of financial strategies for the water sector; OECD (2003).

37
In a decentralised sector, municipalities, which usually own the assets, do not have the financial means to support these efforts themselves. In the OECD and many EECCA countries, a significant share (about 25 per cent in OECD and up to 50 per cent in EECCA) of local government budgets are provided through fiscal transfers from central budgets. Thus the question arises as to how such transfers should be best devised, in order to meet the requirements of the water sector. Experience gained in the OECD and in CEE countries shows that two important criteria should be taken into account when organising these transfers.
First, intergovernmental transfers should generate stable revenues, which can be incorporated in the medium-term financial strategies of municipalities. Schemes in use in some countries, which allow for extensive revision of the amounts to be transferred, generate uncertainties in sub-sovereign governments’ revenues, and run counter to the needs of a sector that is capital intensive and involves long-living assets.
Second, the procedure should be designed in accordance with one of two objectives:
• Either to ensure that national targets are reached, e.g. to ensure the efficiency of WSS operations, or to support the implementation of environmental or other standards. Funds can then be transferred on a non-permanent basis, as transfers should be stopped once the target is achieved. Earmarking can be an option, as it facilitates monitoring of the allocation of the funds;
• Or to allow municipalities to allocate funds according to their own priorities. This option is economically justified, as soon as local governments can establish that they have the capacity to elaborate sound and realistic plans, to implement them, and to be fully accountable for their implementation. Under such circumstances, general purpose grants have proved to be the most flexible and efficient means of transfer, as in the case of the “Sub-National Governments Financial Support Fund” in the Russian Federation.
When designed according to these criteria, intergovernmental transfers create incentives for improved financial sustainability and creditworthiness of local jurisdictions, thereby eventually helping to decrease demands on central budgets.
In addition, environmental administration and local governments should allocate their budget resources in a way to leverage other sources of finance. All things being equal, the aim should be to minimise the contribution of public financial resources and to maximise the contributions of alternative sources of finance. Public funds should not crowd out private financing for projects that are commercially viable. Where possible, public finance, including international financial institutions (IFI) loans, should be channelled through (or complemented by) commercial banks in order to build capacity to support investments in water supply and sanitation.
4.5 External finance – a minor source of finance, with important catalytic effects
4.5.1 Official Development Assistance
Official development assistance (ODA) is another potential source of finance for the EECCA water sector, albeit a much smaller one. Flows of ODA into the EECCA water sector have been at persistently low levels since the beginning of the 1990s (EUR 50-100 million per year), with the exception of a few outliers. This is in line with the trend in total ODA allocations to the region, which have also been flat over the same period. It should be noted that bilateral donors have been decreasing their support to the region, while multilateral donors have been compensating this by increasing theirs.

38
Figure 16: Bilateral and multilateral official development assistance to water supply and sanitation in EECCA countries, annual commitments, million USD (constant 2002 prices)
DAC Countries
Multilateral donors
Memo: Other Official Flows
0
50
100
150
200
250
300
1994 1995 1996 1997 1998 1999 2000 2001 2002 2003 2004 2005
US
D m
illio
n (c
onst
ant 2
004
pric
es)
Geographical distribution of ODA/OA flows to water supply and sanitation, 1994-2005
Armenia14%
Azerbaijan22%
Georgia1%
Kazakhstan30%
Kyrgyz Rep.4%
Moldova4%
Russian Fed.9%
Tajikistan3%
Ukraine4%
Uzbekistan9%
Notes: 1. The members of the DAC are: Australia, Austria, Belgium, Canada, Denmark, Finland, France, Germany, Greece, Italy, Ireland, Japan, Luxembourg, the Netherlands, New Zealand, Norway, Portugal, Spain, Sweden, Switzerland, the United Kingdom, the United States and the Commission of the European Communities. 2. Other Official Flows (OOF): transactions by the official sector with countries on the List of Aid Recipients which do not meet the conditions for eligibility as Official Development Assistance or Official Aid, either because they are not primarily aimed at development, or because they have a Grant Element of less than 25 per cent.
Notes: 1. Since 2005, DAC members are no more required to report ODA/OA to countries of the part II of the DAC list of aid recipients (which includes Belarus, Russian Federation and Ukraine). 2. Other Official Flows (OOF): transactions by the official sector with countries on the List of Aid Recipients which do not meet the conditions for eligibility as Official Development Assistance or Official Aid, either because they are not primarily aimed at development, or because they have a Grant Element of less than 25 per cent. 3. The peaks in the chart are explained by three big projects: 1997 and 2000 IBRD non-export credits of 75 and 122 mln USD to Uzbekistant and Russia; 2003 a loan of 169 mnl USD of Japan JBIC to Kazakhstan for the rehabilitation of water supply and sewarage plant.

39
Despite the low level of financial support donor assistance is probably producing results at a larger
scale. Donor projects are widely recognised as having particularly positive effects because of the demonstration of their experience, and also the catalytic effects that they often generate. Many of the obstacles to a further expansion of ODA flows lie in limited availability of grants and in the unwillingness and/or inability of EECCA countries to take on external debt.
A key challenge is how to scale up and disseminate the positive experiences from donor and IFI experience. Improved coordination among donors and IFIs could help to avoid overlaps and competition. A focus on priority issues integrated into comprehensive strategies, and the systematic development of local capacity to prepare and implement projects would further increase the leverage of these resources.
4.5.2 Private sector financing
The private sector is unlikely to be a major source of finance in the foreseeable future. While there has been a notable increase of the number of public-private partnerships for the operation of water utilities in Russia and Armenia in recent years, very little private finance is being mobilised by these partnerships. As mentioned previously, most public-private partnerships take the form of lease or management contracts, which do generally not involve private sector investment.
4.6 Local debt – a complementary financial instrument
Debt is a means to manage cash flow problems linked to the magnitude of up-front investment costs. However, it is not an additional source of funding: the capital and interest payments associated with debt have to be repaid through user charges, local, and/or central public budgets. Debt from IFIs can be attractive in terms of interest rates and repayment periods, but currency risks can be significant. In most market-based countries, local debt, consisting of municipal bonds and loans from commercial banks, is a normal component of financing strategies for WSS. Properly managed, this allows access to private savings and puts less strain on public budgets, at both central and local levels. In the CEE and OECD, debt contributes a significant share of capital expenditure. The average level of debt of local authorities in CEE amounted to 1.5 per cent of GDP in 2001; it was 5.6 per cent in the EU.
In most EECCA countries, the role of local capital and financial markets is something for the future. However, the dynamics of decentralisation, strengthened capacities at the local level and improved general economic conditions have recently revived the interest of using local debt as an instrument to finance investments for WSS in some countries. The Ukraine has specifically identified the sub-national credit market as an instrument to support urban environmental infrastructure financing (including WSS). Other countries where such markets have serious development potential are Russia and Kazakhstan.

40
5. CONCLUSIONS
Available data suggests that the overall situation in the water supply and sanitation sector of EECCA, which had already been assessed as being in a critical condition seven years ago in Almaty, has been deteriorating further since. This appears to be especially true with respect to the quality of water services, where relevant indicators have been deteriorating in virtually all EECCA countries, even if the situation seems to have stabilised in a few countries, i.e. Russia and Kazakhstan. The situation in rural areas appears to be even more critical than that of urban infrastructure, even though a lack of data makes it difficult to assess the exact extent of the problem. As a consequence, the risks for public health and the environment emanating from water supply and sanitation have continued to grow over the past years, inflicting significant economic, environmental, and human costs on these countries. The most serious situation with respect to the incidence of water on public health exists in a group of low-income, low-coverage countries, which includes most of the Caucasus and Central Asia.
The financial situation of the water supply and sanitation sector remains serious in all countries in the region and constitutes a major cause of the continued deterioration of water services. In order to overcome the problem of chronically under-funded water systems water utilities need to reduce their costs, i.e. by reducing unaccounted-for-water, but also by carefully planning their investment and by adapting service levels to what users and public budgets can afford. Revenue from water users and support from public budgets will also need to increase to overcome this situation.
Hence, despite the significant progress in bringing about institutional and legal changes in the water sector that has recently been achieved in some EECCA countries, the quality of services that consumers are receiving and the financial situation of the sector have not improved. Several factors may help to explain this apparent contradiction:
1. Many changes have only been put in place fairly recently, and there is an important time-lag between the moment where legislation or institutional change is enacted and the moment where it is fully implemented and starts to produce results. This is compounded by the fact that the most recent performance figures that are available are usually two years old and therefore do not reflect the present performance of the sector.
2. Some reforms may lead to the temporary deterioration of performance before the situation starts to improve. For instance, the introduction of household water meters, due to the reduction in consumption that it induces, usually results in decreased revenue for utilities, as well as increasing unit costs (as fixed costs need to be covered through fewer units of water sold). Only once regulators have been convinced that water tariffs need to be increased significantly to reflect increased unit costs, will the financial situation of utilities substantially improve.
3. Due to the inter-dependencies between different types of reforms (i.e. at different levels of government) some reform efforts may have been neutralized due to inaction at another level. This is most obviously the case with the lack of reforms that seems to exist at the local level. While central governments in some EECCA countries have undertaken measures to improve the coherence of the institutional system, vesting most regulatory powers in local administrations, a lack of commitment and/or capacity in municipalities to use their new powers to the benefit of the population has largely neutralized these improvements. To date, very few water utilities have been established as autonomous, commercially-run entities. Instead, many municipalities still regard water utilities as instruments to further their short-term political objectives. The reasons

41
are an important lack of resources and capacity to deal with these issues at the local level. Central governments, some of which have started to realize this, should put more effort into helping overcome this situation.
As a consequence, the reform agenda set-out in the Almaty “Guiding Principles for the Reform of the Urban Water Supply and Sanitation Sector in the NIS” continues to be relevant and governments in EECCA and donors should continue their efforts to implement reforms in line with these Principles.

��������������������
��
�����������
Available data suggest that the overall situation in the water supply and sanitation sector of EECCA has deteriorated further since originally assessed as critical seven years ago at a conference of EECCA Finance/Economy and Environment Ministers. This appears to be especially true for the quality of water services, where relevant indicators have shown deterioration in virtually all EECCA countries, and for key financial indicators. Collected revenues often do not cover operational costs, let alone maintenance and capital costs. Overall, investment falls short by a factor of 5 to 10 of the level that would be required to maintain and renew existing water infrastructure. The consequences for public health, the environment, and economic development in the region are serious. To reverse these trends, a number of critical steps must be taken before a series of reforms can be successfully implemented. This report draws on work carried-out over the last 7 years by the EAP Task Force and other actors in the EECCA region to draw a complete picture of the water supply and sanitation sector in the region and identifies some of the key reforms that will need to be undertaken to achieve the water-related MDGs.
FINANCING WATER SUPPLY AND SANITATION IN EECCA COUNTRIES AND PROGRESS IN ACHIEVING THE WATER-RELATED MILLENNIUM DEVELOPMENT GOALS (MDGs)
FINANCING WATER SUPPLY AND SANITATION IN EECCA COUNTRIES AND PROGRESS IN ACHIEVING THE WATER-RELATED MILLENNIUM DEVELOPMENT GOALS (MDGs)