Water Productivity and Upgrading Rainfed Results from the Comprehensive Assessment of Water...
37
Water Productivity and Upgrading Rainfed Results from the Comprehensive Assessment of Water Management in Agriculture Co-Sponsors:
-
Upload
kellie-perkins -
Category
Documents
-
view
215 -
download
1
Transcript of Water Productivity and Upgrading Rainfed Results from the Comprehensive Assessment of Water...
Water Productivity and Upgrading Rainfed
Results from the Comprehensive Assessment of Water Management in AgricultureCo-Sponsors:
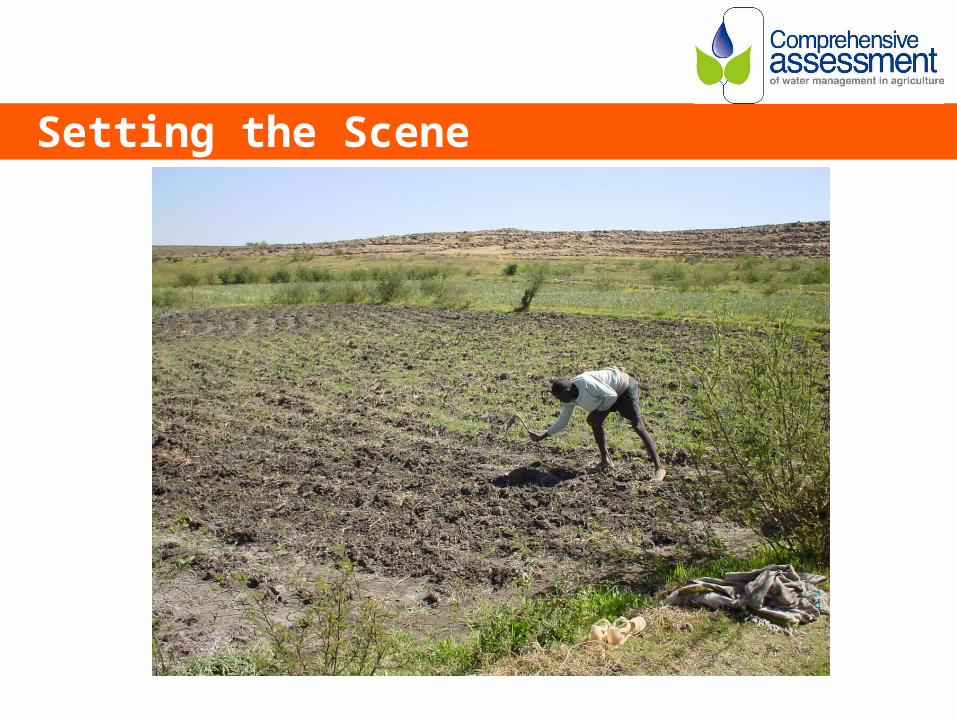
Setting the Scene

Most hungry and poor people live where water challenges pose a constraint to food production
Hunger Goal Indicator: Prevalence of undernourished in developing countries, percentage 2001/2002 (UNstat, 2005)
the semi-arid and arid tropics: 840 million malnourished people remaining

Smallholder farmers
Urban poor
Rural landless
Pastoralists, fishers,forest-dependent
Source: FAO data, graphic from SEI
The 840 million undernourished.
Dependent on Water for Agriculture?
Nutrition, food security, incomeLower Food Prices
Employment
Vulnerable to loss of water

0
500
1,000
1,500
2,000
2,500
1960 1965 1970 1975 1980 1985 1990 1995 2000 2005
Million US$
0
40
80
120
160
200
240
280
320
Irrigation (million hectares)
Food price index (1990=100)
WB lending (1990 constant price)
Investing in Irrigation

Water Scarcity 2000
Little or no water scarcity
Physical water scarcity
Approaching physical water scarcity
Economic water scarcity
Not estimated

Reasons for poverty, hunger, water scarcity, and gender inequity are political and institutional, not technical
• Support institutions need to be able to better support women to reach MDGs
• Need more informed negotiations to make difficult choices
• More effort is required to clarify rights to land and water to promote investments.
• No blue print approach

The Dilemma:
• Major investments in water have helped economic growth, prevented famine and achieved record low food prices
• But agriculture drives water scarcity and environmental degradation.
• But poor people need more water for food and livelihoods
• Where will it come from? Who gets it?
The Water-Food-Environment Dilemma

Debates on the way forward
• Relative investments in small and large, rainfed and irrigated
• Role of trade• The prioritization of
ecosystem water needs• The role of agriculture
itself in poverty alleviation
The CA combined a diverse group to engage in these debates

The CA and the Millennium Development Goals
How can water for food be developed and managed to…• Help end poverty and hunger?• Ensure environmentally sustainable water-agriculture
practices?• Find the balance between food and environmental
security?
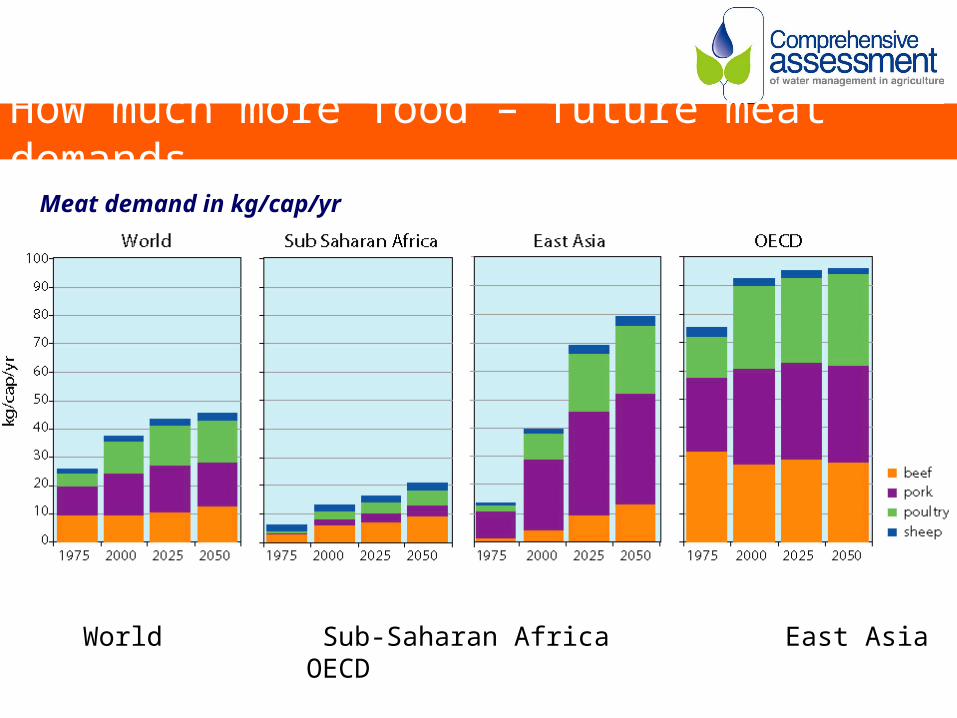
How much more food – future meat demands
World Sub-Saharan Africa East Asia OECD
Meat demand in kg/cap/yr

How much more cereals?Kg/cap/yr
World Sub-Saharan Africa East Asia OECD

Total food demand nearly doubles by 2050
Water (ET) demand doubles if no increases in water productivity
0
500
1000
1500
2000
2500
3000
3500
2000 2025 2050
food feed other
0
200
400
600
800
1000
1200
1400
1600
1800
2000 2025 2050
0
500
1000
1500
2000
2500
2000 2025 2050
Grain Sugarcane Vegetables
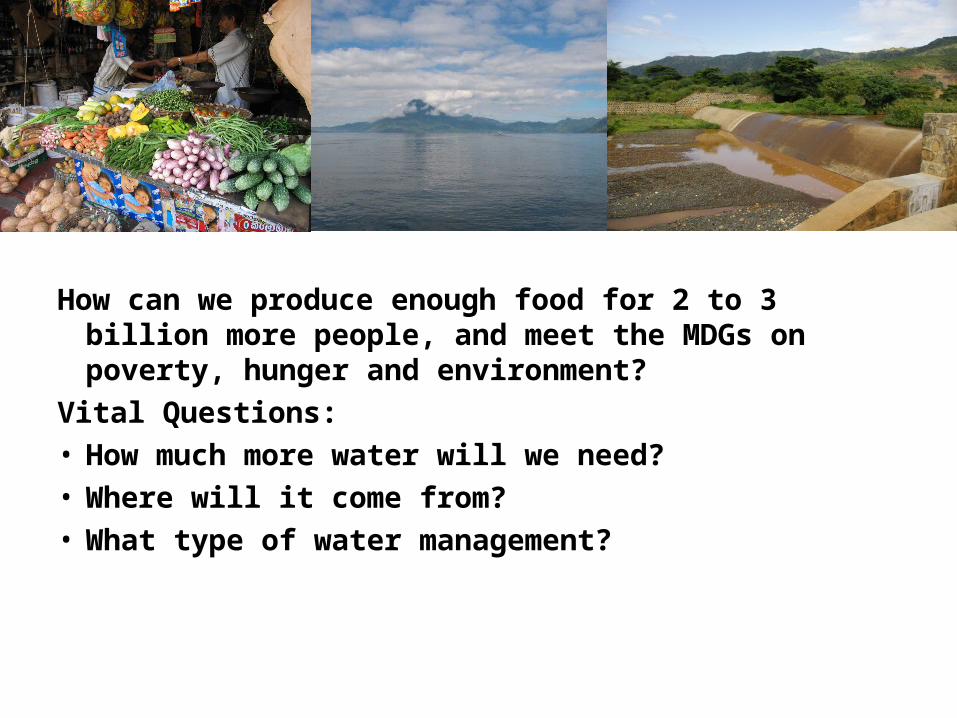
How can we produce enough food for 2 to 3 billion more people, and meet the MDGs on poverty, hunger and environment?
Vital Questions: • How much more water will we need?• Where will it come from?• What type of water management?

Where to find the water? Options:
1. Expand irrigated areas – divert more “blue water” from rivers and aquifers
2. Expand rainfed areas – turn more natural area in to arable land – use more “green water”
3. Increase water productivity: produce more with less water, i.e. more crop per drop, but also more animal products with less water
4. Manage demand – diets, reducing post-harvest losses from farm to fork
5. Trade in virtual water

Dependence on green and blue water 2000
August 2006
114
654
1080
239
787
1505
1692
907
219
Areas in green: agriculture mainly under rainfed
Areas in blue: agriculture mainly under irrigation
Circles depict total crop depletion

-250
-200
-150
-100
-50
0
50
100
150
200
250
1960 1970 1980 1990 2000
Years
National rainfall index: Variation from trend (mm)
-800
-600
-400
-200
0
200
400
600
800
Total cereal production - Variation from trend ('000 tons)
National rainfall index
Cereal production
Burkina Faso: Relation between rainfall and cereal production

Water Productivity
• Physical Water Productivity– Kilograms produce per unit of water (ET or
diverted)
• Economic Water productivity– Value per unit of water (ET or diverted)

0
500
1,000
1,500
2,000
2,500
3,000
3,500
4,000
4,500
5,000
0 2 4 6 8 10 12 14 16 18yield (t ha -1 )
wheat
maize
rice
rockstrom
Potential for water productivity gains small –
already met.
Highest potential for WP gains, usually in rainfed
areas
Where can gains in physical water productivity be made?
2 4 6 8
Wat
er P
rod
uct
ivit
y (m
3 /E
T)
per
kg
)
Yield (kg/ha)2 4 6
1
2
3
8

Growth in yields
0
1
2
3
4
5
6
7
8
9
10
1866187118761881188618911896190119061911191619211926193119361941194619511956196119661971197619811986199119962001
yield in ton/ha
USA SSA L America China

A Range of Ag Water Management Options

Upgrade Rainfed AgricultureWater management in rainfed areas deserves more attention
Enhance Water ProductivitySoil-water managementSupplementing rainfall with a little blue water at the right timeWater harvesting, groundwater for source Soil fertility plus water – synergistic effect
Investments in small scale water managements show quick returns, do not necessarily require large public funding
Can benefit a lot of people

Making it happen• Managing risk is a key – create a good
environment to invest in agricultural inputs
• Water at the right time is part of the risk management strategy (storage)
• Extension – more on how to manage water (why doesn’t Ministry of Water Resources look after upgrading RF systems?)
• Step up the scale of research and attention to the topic

What about irrigation?
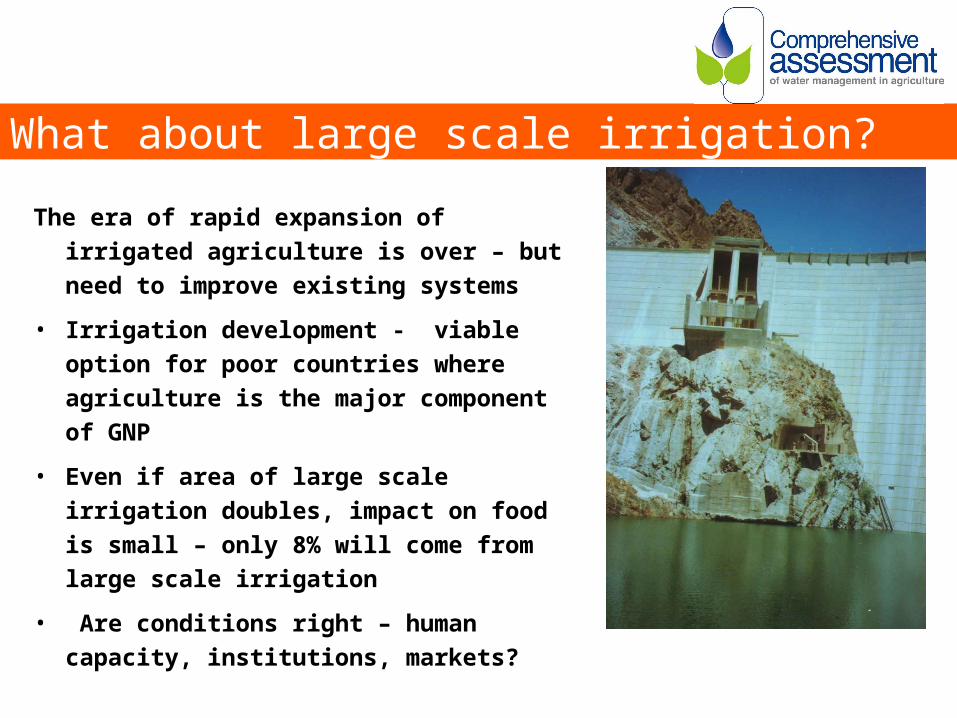
What about large scale irrigation?
The era of rapid expansion of irrigated agriculture is over – but need to improve existing systems
• Irrigation development - viable option for poor countries where agriculture is the major component of GNP
• Even if area of large scale irrigation doubles, impact on food is small – only 8% will come from large scale irrigation
• Are conditions right – human capacity, institutions, markets?

Kumasi

Timbuktu

• Area developed (22 schemes): 8,750 ha• Actually irrigated area: 5,200 ha
Formal irrigation sector
Informal irrigation sector• Irrigated area around
cities in central Ghana: 45,000 ha
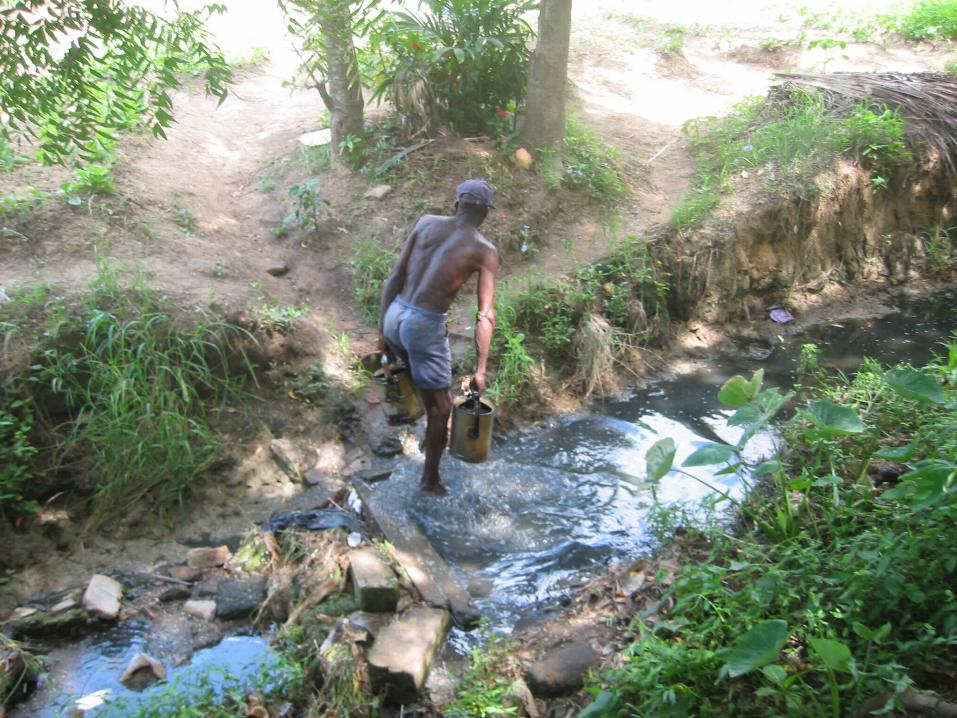
Informal, small-scale irrigation is big in Africa
Ghana
Source: IWMI

Significance for livelihood support
Vegetable irrigation Formal Informal
Distance from water source
88% >500 m 65% <100 m
Cost of production (US$/acre)
2240 160
Gross Revenue (US$/acre)
2860 530
Net returns (US$/acre)
620 370
B/C ratio
1.3
3.3
Source: IWMI

Economic Productivity – more value per drop
• Increasing yield per unit of blue or green water• Changing from low to high value crops (ie wheat
to flowers)• Reallocating water from low to higher valued
uses (ie from agriculture to cities)• Increase benefits: health and value of ecological
services• Decrease costs: inputs, social, health and
environmental costs • Obtain multiple benefits per unit of water (ie use
water for drinking and agriculture)

Multiple Use Systems
More Value Per DropMultiple-use systems – integrating domestic water,
irrigation, fisheries, livestock – provide income, nutrition and health benefits, and improve water productivity.
• Provide women with opportunities• But irrigation needs to adjust to manage for multiple
uses
In Conclusions• Investments in water and agriculture essential to
meet MDGs on poverty and hunger• Upgrading rainfed and small scale water
management are keys• Investments needed in human capacity
– Education – integrated approaches to water management
– Research to adapt to local conditions– Institutional reform to support sustainable agricultural
water management

Thank you

Per capita per day calorie supply
1,750
2,000
2,250
2,500
2,750
3,000
3,250
3,500
1955 1960 1965 1970 1975 1980 1985 1990 1995 2000 2005
Calorie supply (Kcal)
World Developed Countries Developing Countries Sub Saharan Africa South Asia
Source: FAOSTAT, 2001
Developed
Sub-Saharan Africa
WorldSouth Asia
Asia
Acceptable Level
It takes a litre of water to produce every calorie, on average

0
2
4
6
8
10
1960 1970 1980 1990 2000 2010 2020 2030 2040 2050
Exp
loitab
le yield g
ap
FAO data
high
medium
low
To
ns
per
hec
tare
Maize
AT 2030
Exploitable yield gap in SSA rain fed areas more than 4 tons/ha
Yield growth projections:
low = 20% of yield gap bridged; med = 40% of yield gap bridged high = 80% of yield gap bridged
Maximum attainable yield 6 ton/ha
Actual yield 1.4 ton/ha
* Based on GAEZ attainable yields

0
2
4
6
8
10
1960 1970 1980 1990 2000 2010 2020 2030 2040 2050
FAO data
Exp
loitab
le yield g
apT
ons
per
hect
are
AT 2030
Exploitable yield gap in OECD rain fed areas less than 0.5 tons/ha
* Based on GAEZ attainable yields
Maximum attainable yield 9.1 ton/haActual yield 8.6 ton/ha
Maize