water lily cross breeding mechanisms of pre-fertilization ...
25
Page 1/25 Transcriptomic and proteomic analysis reveals mechanisms of pre-fertilization barriers during water lily cross breeding Chun-Qing Sun Zhen jiang institute of agricultural science of the Jiang-zhen hilly district Fa-Di Chen Nanjing Agricultural University Nian-Jun Teng Nanjing Agricultural University Yue-Mei Yao Zhenjiang institute of agricultural science of the Jiang-zhen hilly district Xi Shan Zhenjiang institute of agricultural science in Jiangsu hilly areas zhongliang dai ( [email protected] ) Zhenjiang Institute of Agricultural Sciences in Jiangsu Hilly Areas Research article Keywords: Nymphaea, Interspecic reproductive barriers, Transcriptomic, Proteomic, Pollen-stigma interaction, ROS, Flavonoids Posted Date: July 23rd, 2019 DOI: https://doi.org/10.21203/rs.2.11829/v1 License: This work is licensed under a Creative Commons Attribution 4.0 International License. Read Full License Version of Record: A version of this preprint was published on December 5th, 2019. See the published version at https://doi.org/10.1186/s12870-019-2166-3.
Transcript of water lily cross breeding mechanisms of pre-fertilization ...

Page 1/25
Transcriptomic and proteomic analysis revealsmechanisms of pre-fertilization barriers duringwater lily cross breedingChun-Qing Sun
Zhen jiang institute of agricultural science of the Jiang-zhen hilly districtFa-Di Chen
Nanjing Agricultural UniversityNian-Jun Teng
Nanjing Agricultural UniversityYue-Mei Yao
Zhenjiang institute of agricultural science of the Jiang-zhen hilly districtXi Shan
Zhenjiang institute of agricultural science in Jiangsu hilly areaszhongliang dai ( [email protected] )
Zhenjiang Institute of Agricultural Sciences in Jiangsu Hilly Areas
Research article
Keywords: Nymphaea, Interspeci�c reproductive barriers, Transcriptomic, Proteomic, Pollen-stigmainteraction, ROS, Flavonoids
Posted Date: July 23rd, 2019
DOI: https://doi.org/10.21203/rs.2.11829/v1
License: This work is licensed under a Creative Commons Attribution 4.0 International License. Read Full License
Version of Record: A version of this preprint was published on December 5th, 2019. See the publishedversion at https://doi.org/10.1186/s12870-019-2166-3.

Page 2/25
AbstractBackground In water lily (Nymphaea) hybrid breeding, breeders often encounter non-viable seeds, whichmake it di�cult to transfer desired or targeted genes of different Nymphaea germplasm. We found thatpre-fertilization barriers were the main factor in the failure of the hybridization of Nymphaea. Themechanism of low compatibility between the pollen and stigma remains unclear; therefore, we studiedthe differences of stigma transcripts and proteomes at 0, 2, and 6 hours after pollination (HAP). Moreover,some regulatory genes and functional proteins that may cause pre-fertilization barriers in Nymphaeawere identi�ed. Results RNA-seq was performed for three comparisons (2 vs 0 HAP, 6 vs 2 HAP, 6 vs 0HAP), and the number of differentially expressed genes (DEGs) was 8,789 (4,680 were up-regulated),6,401 (3,020 were up-regulated), and 11,284 (6,148 were up-regulated), respectively. Using label-freeanalysis, 75 (2 vs 0 HAP) proteins (43 increased and 32 decreased), nine (6 vs 2 HAP) proteins (threeincreased and six decreased), and 90 (6 vs 0 HAP) proteins (52 increased and 38 decreased) were de�nedas differentially expressed proteins (DEPs). Gene Ontology (GO) and Kyoto Encyclopedia of Genes andGenomes (KEGG) enrichment analyses revealed that the DEGs and DEPs were mainly involved in cell wallorganization or biogenesis, S-adenosylmethionine (SAM) metabolism, hydrogen peroxide decompositionand metabolism, reactive oxygen species (ROS) metabolism, secondary metabolism, secondarymetabolite biosynthesis, and phenylpropanoid biosynthesis. Conclusions These results indicated thatgenes involved in regulation and gene pathways involved in stress response might overlap in the processof pollination process forming the hybridization barrier in Nymphaea. These results indicate that thepollen tube entering stigma tissue was very similar to the process of external injury, further suggestingthat these genes involved in defense and stress response were necessary in the early stage of interactionbetween the pollen and stigma. This study strengthens our understanding of the mechanism of pre-fertilization barriers in Nymphaea at the molecular level, and provides a theoretical basis for overcomingthe pre-fertilization barriers in Nymphaea in the future.
BackgroundWater lilies (Nymphaea) are important �owering plants that are distributed worldwide from the tropics totemperate regions [1]. With the rapid improvement of China's economy and the overall quality of life, thedemand is increasing for new water lily hybrids with different characteristics. Therefore, it is necessary tobreed new water lily hybrids with excellent ornamental characteristics. However, in the breeding of waterlily hybrids, breeders often encounter non-viable seeds, which makes it di�cult to transfer the desired ortargeted genes of various water lily germplasm [2, 4]. For example, many breeders have hoped to transferthe colorful �owers of tropical water lilies to hardy water lilies through crossbreeding; however, viablehardy water lily varieties with blue �owers have not yet been developed [3]. To address the possibleincomplete hybridization of water lily, we conducted a systematic study on the pre-fertilization and post-fertilization barriers to arti�cial hybridization of water lily by means of plant structure, cell biology, andreproductive biology [4]. The results showed that pre-fertilization barriers were the main factor in thefailure of the hybridization of water lily [4]. We infer that there may be some inhibiting factors on the

Page 3/25
stigma during the interaction between the pollen and stigma, which hinders the normal germination ofpollen and leads to less abnormal germination of the pollen on the stigma [4]. The mechanism of lowcompatibility between the pollen and stigma is unclear and requires further research.
Low compatibility between the pollen and stigma is a common issue that negatively impacts thee�ciency of plant breeding and the yield of seeds or fruit [5, 6]. Therefore, over the past several decades,many researchers have conducted studies to investigate factors that cause plant pre-fertilization barriers[7-10]. However, most of these studies have mainly focused on morphological, anatomical, andphysiological barriers due to the limitations of traditional biological techniques. Few studies have beenconducted on the factors contributing to plant pre-fertilization barriers at a molecular level. Therefore, themechanisms underlying plant pre-fertilization barriers remain poorly understood.
The recent development of modern molecular biology techniques, such as novel high-throughputsequencing technologies like Illumina RNA sequencing (RNA-seq) and a new proteomics approach (i.e.,Label-free), may provide a promising means to address the genes and proteins associated with pre-fertilization barriers [11-13]. In particular, transcriptome sequencing is a useful method for identifyingnovel transcripts and analyzing gene expression [14-15]. Transcriptomic and proteomic analyses havebeen extensively applied to many plant species, but limited transcriptome and proteome data existsregarding pre-fertilization barriers in water lily [16-17]. To understand the mechanism of pre-fertilizationbarriers in water lily at the genomic level, Illumina paired-end sequencing and a label-free analysis of thestigma after pollination were conducted. This comprehensive analysis of the transcriptome and proteomemay substantially improve the overall understanding of the potential molecular mechanisms involved inpre-fertilization barriers in water lily and pave the way for further analyses. This study aimed to provideimportant molecular data supporting a deep understanding of pre-fertilization barriers in water lily andalso provides an important clue to overcome hybridization barriers.
ResultsPollen germination on stigmas after pollination
In the ‘Peter Slocum’ × N. micrantha cross, no pollen tubes penetrated stigmatic tissue between 2 and 6HAP. In addition, the accumulation of wax between the stigma and the surface of the pollen grainshampered the germination of pollen grains (Fig. 1).
Overview of the transcriptomic analysis and proteomics analysis
Using Fragments Per Kilobase Million (FPKM), we explored the gene expression levels in the stigmas 0, 2,and 6 HAP. In three comparisons (2 vs 0 HAP, 6 vs 2 HAP, 6 vs 0 HAP), the number of DEGs was 8,789(4,680 were up-regulated), 6,401 (3,020 were up-regulated), and 11,284 (6,148 were up-regulated),respectively. Further details of the DEGs are presented in Additional �le 1. Using the label-free analysis, atotal of 3,176 proteins were identi�ed within a false discover rate (FDR) of 1% (Additional �le 2).Following the statistical analysis, 75 proteins (2 vs 0 HAP; 43 increased and 32 decreased), nine proteins

Page 4/25
(6 vs 2 HAP; three increased and six decreased), and 90 proteins (6 vs 0 HAP; 52 increased and 38decreased) were de�ned as DEPs.
Comparison analysis of transcriptome and proteome data
To identify robust pathways that were supported by both datasets, we integrated DEGs and DEPs to �ndthe corresponding genes and proteins, and the results are listed in Additional �le 3. Overlaps betweenDEPs and DEGs are shown by Venn diagrams in Fig. 2. Speci�cally, there were considerable non-overlapsbetween DEPs and DEGs, probably due to the relatively low sensitivity of proteome detection. Forinstance, among the 234 differentially regulated proteins in the 2 vs 0 HAP comparison, only 67 genesand their corresponding proteins were regulated. These results also showed a strong correlation betweenthe transcripts and proteins (Fig. 2A). Similarly, for the 6 vs 2 HAP and 6 vs 0 HAP comparisons, 12 and127 of the DEPs, respectively, were correlated to the corresponding DEGs (Fig. 2B, 2C).
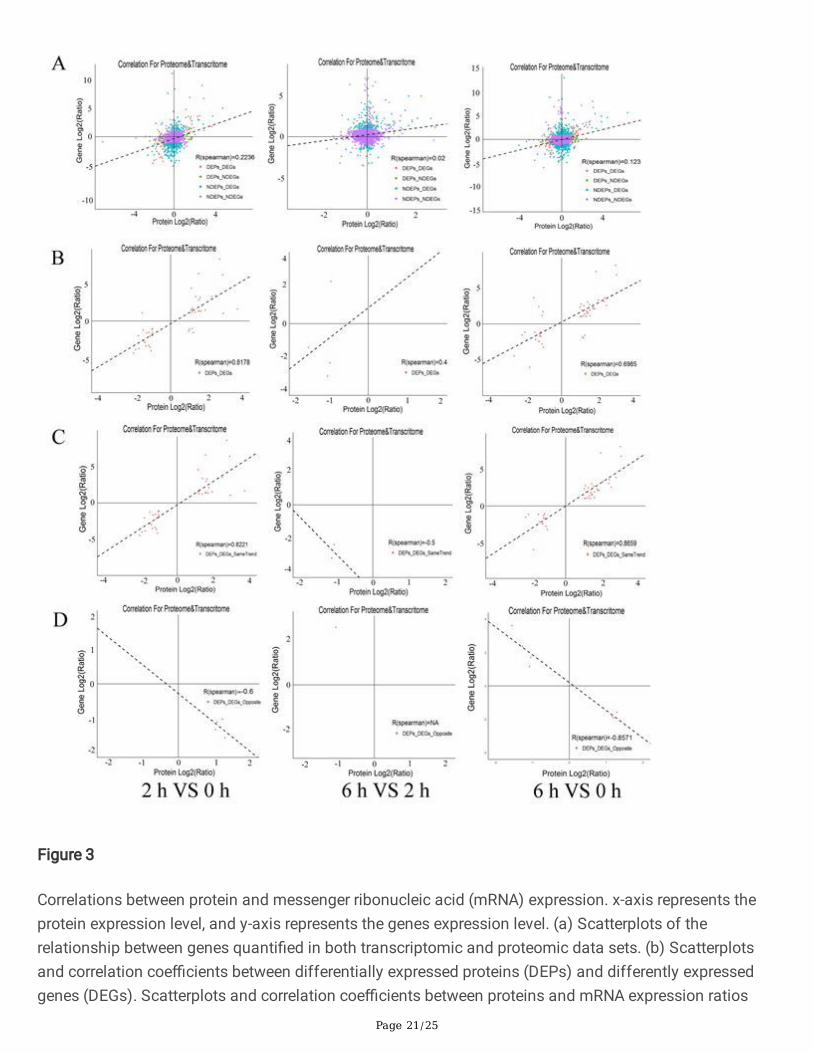
All expression data associated with protein level and transcription level were analyzed and Personcorrelation coe�cient was calculated. Globally, the correlation coe�cients of all quantitative proteins andtheir corresponding genes at 2 vs 0 HAP, 6 vs 2 HAP, and 6 vs 0 HAP were 0.2236, 0.02 and 0.123,respectively (Fig. 3A). However, there is a high correlation between the DEGs and their correspondingDEPs (r=0.8178, 0.4, and 0.6985, respectively; Fig. 3B). The correlation between proteins and theircorresponding mRNAs with the same or opposite trend was analysed, and the comparative group 2 vs 0HAP and 6 vs 0 HAP had higher positive or negative correlations (Fig. 3C and Fig. 3D). However, we foundpoor correlations between proteins at 6 vs 2 HAP and their corresponding mRNAs with the same oropposite trend (Fig. 3C and Fig. 3D). Among the cor-DEGs-DEPs genes, 39 (2 vs 0 HAP), three (6 vs 2HAP), and 41 (6 vs 0 HAP) genes had the same trend, while �ve (2 vs 0 HAP), one (6 vs 2 HAP), and seven(6 vs 0 HAP) genes had the opposite trend (Additional �le 4). Thus, we suggest that some of these cor-DEGs-DEPs genes might play important roles in causing pre-fertilization barriers during water lilybreeding.
Cluster analysis of expression patterns in the cor-DEGs-DEPs genes
Cluster analysis of the DEPs and their corresponding DEGs can visually show their expression patterns,and the results are shown in Figure 4. Cluster analysis showed that 44 (2 vs 0 HAP), four (6 vs 2 HAP),and 48 (6 vs 0 HAP) DEPs were correlated with the change of mRNA abundance, and 16 (2 vs 0 HAP), one(6 vs 2 HAP), and 21 (6 vs 0 HAP) DEPs were matched with corresponding DEGS. However, 16 (2 vs 0HAP), one (6 vs 2 HAP) and six (6 vs 0 HAP) DEPS were opposite to their mRNA expression pattern. Intotal, 15 of the cor-DEGs-DEPs genes at 2 vs 0 HAP and 6 vs 0 HAP showed the same expression pattern;thus, we infer that these genes, which are continuously expressed from 2 to 6 HAP after pollination, maycause pre-pollination barriers in interspeci�c hybridization of water lily.
GO and pathway enrichment analysis of the cor-DEGs-DEPs genes

Page 5/25
To carry out a functional analysis, we assigned GO terms to the cor-DEGs-DEPs genes at 2 vs 0 HAP, 6 vs2 HAP, and 6 vs 0 HAP. The results showed that 27 (2 vs 0 HAP), 0 (6 vs 2 HAP), 19 (6 vs 0 HAP) GO termswere highly enriched at both mRNA and protein levels (Fig. 5). The subcategory identi�ed in the cellularcomponent category was extracellular region in both 2 vs 0 HAP and 6 vs 0 HAP. For the molecularfunction category, peroxidase activity, heme binding, antioxidant activity, and oxidoreductase activity,acting on peroxide as acceptor were the most abundant categories in both 2 vs 0 HAP and 6 vs 0 HAP.The most abundant biological processes categories identi�ed in both 2 vs 0 HAP and 6 vs 0 HAP werecell wall organization or biogenesis, phenylpropanoid metabolic process, sulfur compound biosyntheticprocess, hydrogen peroxide catabolic process, and ROS metabolic process. In addition, no GO terms weresigni�cantly enriched in the cor-DEGs-DEPs genes at 6 vs 2 HAP.
To obtain an overview of the correlation between the protein and transcript levels of genes, the KEGGenrichment of the cor-DEGs-DEPs genes was analyzed (Fig. 6). The results showed that two KEGGpathways were highly enriched at both mRNA and protein levels including phenylpropanoid biosynthesis(ko00940) and stilbenoid, diarylheptanoid, and gingerol biosynthesis (ko00945) in both 2 vs 0 HAP and 6vs 0 HAP. For the cor-DEGs-DEPs genes at 2 vs 0 HAP, cutin, suberin, and wax biosynthesis (ko00073) and�avonoid biosynthesis (ko00941) were signi�cant pathways in both the proteome and transcriptome. Inaddition, no KEGG pathways were signi�cantly enriched in the cor-DEGs-DEPs genes at 6 vs 2 HAP.
Parallel reaction monitoring (PRM) analysis
Four differentially expressed proteins (mainly related to �avonoid biosynthesis, peroxidase activity andphenylpropanoid biosynthesis) were chosen for PRM analysis. According to the relative expressionquantity of the corresponding peptide fragment of four target proteins in different sample groups, therelative expression quantity differences of target proteins were obtained (Table 1). Detailed proteinquantitative information and signi�cant difference analysis results are shown in Additional �le 5. Theresults from this analysis indicated that expression quantities of the four target proteins in the 2 vs 0 HAPand 6 vs 0 HAP comparisons were markedly up-regulated, whereas the expression quantity of the fourtarget proteins in the 6 vs 2 HAP comparison was not signi�cantly changed. The results of the PRManalysis indicated that the four candidate proteins show similar trends as the label-free results, whichsupported the credibility of the proteomics data.
DiscussionPre-fertilization barriers during water lily breeding are associated with the metabolism of ROS
In this study, the combined transcriptome and proteome analysis showed that the expression of genesand proteins related to the metabolism of ROS on the stigma increased signi�cantly in the 2 vs 0 HAPand 6 vs 0 HAP comparisons, suggesting that ROS may be involved in regulating the interaction betweenthe pollen and stigma of water lily after pollination. With the initiation of pollen tube germination, pollenbegins to communicate with the stigma. The membrane protein layer of stigma papilla cells and the

Page 6/25
protein in the pollen exine participate in early pollen-stigma communication [18]. The communication ofthe pollen and stigma during pollen tube germination also involves ROS, which play an important role inplant growth and development. In addition, ROS can regulate plant reproduction and development as asignaling molecule. ROS participate in many pollen-related processes, such as tapetum and pollendevelopment [19-21], in vitro pollen germination [22], growth of the pollen tube apex [23-25], the rupture ofthe pollen tube to release sperm [26], and self-incompatibility [27]. The role of ROS in pollen tube growthhas been well established, but little is known about its involvement in the early stage of pollengermination. The biological function of ROS and hydrogen peroxide on the stigma may be involved insome signal crosslinks in the interaction between the pollen and stigma [28,29]. Numerous experimentshave shown that mature pollen grains produce a large amount of Nitric Oxide (NO), which inhibits ROSproduction in stigma papilla cells [28,30,31]. The mutual exclusion of ROS and NO during pollen tubegrowth suggests that there may be a coordination mechanism between these signaling molecules duringpollen tube growth [32]; this which indicates that ROS from the stigma and NO from the pollen participatein the pollen-stigma interaction as signaling molecules [33]. In addition, ROS are mainly composed ofhydrogen peroxide on the stigma, which is considered the most important redox signaling moleculebecause of its unique physical and chemical properties as well as its stability in cells. Hydrogen peroxidecan oxidize the thiol group of target protein cysteine, thus changing the structure and function of proteins[34].
However, the regulatory mechanism is unclear. We infer that the halting of pollen tube growth on thestigma surface after pollination is due to the change of the level of ROS on the stigma. ROS may act as asignaling molecule to oxidize downstream target proteins. The oxidized target proteins cannot functionproperly, affecting the growth of the pollen tube on the stigma surface. Therefore, the metabolic processof ROS on the stigma is related to the interaction between the pollen and the stigma of water lily.
Effects of stigma �avonoids on pre-fertilization barriers during water lily breeding
Flavonoids, which can affect plant physiology, growth, and development, are common secondarymetabolites in vascular plants [35,36]. Flavonoids are mainly involved in the physiological processes ofplant symbiosis, defense against disease and insect pests, auxin transport, seed and pollen germination,and root development. In addition, �avonoids can affect plant reproductive and developmental processesand participate in the interaction between the pollen and stigma [37,38]. In this study, our transcriptomeand proteome analyses showed that there were signi�cant differences in genes and proteins related to�avonoid biosynthesis between unpollinated stigmas and stigmas at 2 and 6 HAP. For example, theexpression and content of �avonol synthase in stigmas after pollination are lower than those ofunpollinated stigmas, which indicates that the �avonoid content on the stigma after pollination is greatlyreduced. Flavonoids are the key substances for pollen germination and pollen tube growth of manyplants. Other transcriptomic studies on rice stigmas revealed that numerous genes encoding �avonolswere expressed, and these genes were expressed on rice stigmas, suggesting that �avonoids play animportant role in the interaction between pollen and stigma [37]. Similarly, the pollen of a �avonoid-de�cient mutant of petunia could not germinate on the stigma, but the addition of the exogenous

Page 7/25
�avonoid kaempferol could induce pollen germination on the stigma. This indicates that kaempferol mayplay a role in pollen germination [37,38]. Because �avonoids are the key substances in pollen germinationand pollen tube growth of many plant species, we infer that the biosynthesis of �avonoids is closelyrelated to the pre-fertilization barrier of water lily.
Effects of SAM metabolism on pre-fertilization barriers during water lily breeding
The SAM participates in many important physiological processes, such as transamination of propyl,methyl, and sulfur in plants, and is the main hub of methionine metabolism [39,40]. Studies have shownthat SAM plays an important role in regulating plant adaptability to iron de�ciency and drought [41, 42].In addition, SAM is involved in resistance to pathogens and senescence [43, 44]. SAM can also be usedas a precursor of ethylene and polyamine [45]. Moreover, polyamines with appropriate concentrations areimportant for pollen germination and pollen tube growth [46]. The results in the present study showedthat the SAM synthase gene was up-regulated by pollination, which facilitated the synthesis ofpolyamines and ethylene by the stigma papilla cells, and then regulated pollen germination and pollentube growth. Similarly, a previous study has shown that ethylene plays a role in pollen tube growth afterpollination in tobacco [47]. Therefore, we inferred that the metabolic pathway of SAM participated in theinteraction between the pollen and stigma of water lily and plays an important role in the regulationmechanism of the pollen-stigma interaction.
Cell wall organization or biogenesis is associated with pre-fertilization barriers during water lily breeding
During the interaction between the pollen and stigma, some enzymes in stigma papilla cells are activatedand released by certain signals. These enzymes are mainly involved in modifying cell walls, such asenzymes that degrade pectin, cellulose, and hemicellulose [48-50]. In our study, the combinedtranscriptome and proteome analysis showed that many DEGs involved in cell wall tissue metabolismwere found on stigma at 2 and 6 h after pollination, suggesting that genes involved in cell wall synthesiswere induced by pollination. Transcriptome studies on the stigma of many species have con�rmed thatthere are a large number of cell wall metabolism-related genes in the stigma [37, 51-53], and the productsof these genes may be secreted by stigma papillae to help pollen tubes penetrate the stigma. In addition,the GO annotation showed that the expression of endoglucanase involved in cellulose hydrolysis wassigni�cantly down-regulated, while beta-galactosidase and xyloglucan endotransglucosylase/hydrolasegenes involved in cell wall modi�cation were signi�cantly up-regulated. Thus, we infer that beta-galactosidase may be involved in cellulose synthesis and cell wall elongation during cell wall metabolismof Nymphaea stigmas [54], whereas xyloglucan endotransglucosylase/hydrolase is mainly involved incell wall reinforcement [55]. The KEGG analysis showed that the gene expression abundances involved incutin, suberin, and wax biosynthesis were signi�cantly increased, which resulted in cutin, suberin, andwax deposition on the cell walls of stigma cells, thereby increasing cell wall strength [56]. Signi�cant up-regulation of key genes involved in phenylpropanoid biosynthesis further con�rmed the accumulation oflignin in stigma the cell wall of water lily after pollination because suberin biosynthesis is closely relatedto phenylpropanoid biosynthesis [57]. We infer that the accumulation of cutin, suberin, and wax on the

Page 8/25
cell wall enhances the strength and thickness of the cell wall, thus hindering the growth of the pollen tubeon the stigma. Therefore, cell wall organization or biogenesis is closely related to the interspeci�chybridization barrier of Nymphaea species.
Other enzymes involved in the interspeci�c hybridization barrier of Nymphaea spp.
In this study, the combined analysis of transcriptome and proteome showed that the activity ofperoxidase increased signi�cantly after pollination. Peroxidase mainly removes peroxides andparticipates in stress response, auxin metabolism, and signal transduction [28]. Previous research hasshown that the peroxidase activity of a mature stigma increased signi�cantly and reached the highestvalue when the stigma developed was the most receptive to pollen, which is a common method used tojudge stigma maturity in the �eld [52]. Mc Innis was the �rst to discover stigma-speci�c peroxidase, whichhas cell speci�city and speci�c expression patterns, and is speci�cally expressed in the cytoplasm andcell surface of stigma epidermal cells [28]. Based on our results and previously published papers, we inferthat in the process of interaction between the pollen and stigma of Nymphaea, peroxidase may directlyparticipate in the process of mutual recognition between the stigma and pollen, perhaps guiding thepollen tube.
Glutathione S-transferase (GST) is a ubiquitous enzyme that regulates plant secondary metabolism,detoxi�cation, and defense, and plays an important role in cell response to stress [58]. A previous studyon maize showed that the expression of GST was up-regulated at the early stage of silk-pollen interactionand pollen tube germination [59]. GST was also upregulated in this study. It is possible that GSTparticipated in the pollen-stigma interaction of Nymphaea, but its mechanism of involvement needsfurther study.
Cytochrome P450 has a wide range of catalytic activities. It mainly participates in the synthesis andmetabolism of terpenoids, alkaloids, sterols, fatty acids, plant hormones, signal molecules,phenylpropane, �avonoids, and iso�avones. Cytochrome P450 is also involved in plant resistance tobiotic and abiotic stressors [60]. Our results showed that cytochrome P450 participated in thebiosynthesis of phenylpropane and �avonoids, and its expression increased signi�cantly, indicating thatcytochrome P450 indirectly participated in the pollen-stigma interaction of water lily.
Mitogen-activated protein kinase (MAPK) is an evolutionarily conserved serine/threonine protein kinase ineukaryotic organisms. It is responsible for regulating signal transduction between cells and amplifyingstimulus signals from outside cells to induce appropriate physiological and biochemical reactions inreceptor cells [61]. In this study, we found that the expression of MAPK on the stigma of water lily wassigni�cantly increased after pollination. Additionally, MAPK participated in SAM biosynthesis and plantsecondary metabolism. We infer that MAPK plays a signaling role in the pollen-stigma interaction andplays an important role in the regulation of the complex network of pre-fertilization barriers in water lily.
Conclusions

Page 9/25
In this paper, the differences of stigma transcripts and proteomes at 0, 2, and 6 hours after pollinationwere compared, resulting in the identi�cation of some regulatory genes and functional proteins that maycause pre-fertilization barriers in water lily. The functional analysis showed that differential transcriptswere mainly involved in cell wall organization or biogenesis, SAM, hydrogen peroxide decomposition andmetabolism, ROS metabolism, secondary metabolism, secondary metabolite biosynthesis, andphenylpropanoid biosynthesis. These results indicated that genes involved in regulatory and genepathways involved in stress response might overlap in the process of pollination with hybridizationbarrier in water lily, indicating that the process of pollen tube entering stigma tissue was very similar tothe process of external injury, which further indicated that these genes involved in defense and stressresponse were necessary in the early stage of interaction between pollen and stigma. This studystrengthens our understanding of the mechanism of pre-fertilization barriers in Nymphaea at themolecular level and provides a theoretical basis for overcoming the pre-fertilization barriers in water liliesin the future.
Materials And MethodsExperimental materials
An interspeci�c cross between the female Nymphaea ‘Peter Slocum’ and male N. micrantha wasperformed as described in a previous report. These plants were grown in ponds in Xingxiang, Zhenjiang,Jiangsu Province, China.
The stigmas of 0, 2, and 6 HAP were collected. Each treatment had three biological repeats. Non-pollinated stigmas were used as the control, and the stigmas from 2 and 6 HAP were used as thetreatment to dynamically study the interaction between the pollen and stigma after pollination. Aftercollection, the three samples, non-pollinated stigmas, the stigmas of 2 HAP, and the stigmas of 6 HAP,were immediately frozen in liquid nitrogen and stored at - 80°C.
High-throughput RNA-seq and data processing
Total RNA was extracted using Trizol reagent according to the manufacturer’s protocol (Takara Bio Inc.,Otsu, Japan). The total RNA was checked for quality and quantity using an Agilent 2100 bioanalyzer(Agilent Technologies, CA, USA). The mRNA samples were enriched by oligo(dT) magnetic beads andthen cut into fragments with fragmentation buffer at 80°C. First-strand cDNA was synthesized usingrandom hexamers as the primers. Second-strand cDNA was synthesized from �rst-strand cDNA usingRNase H, DNA polymerase I, and dNTPs. After puri�cation and terminal repair, double-stranded DNA polyA and adaptor sequences were ligated to the end of the cDNA. cDNA libraries were constructed by PCRampli�cation after selecting for fragment size and undergoing a quality check with an Agilent 2100Bioanalyzer system. Finally, the quali�ed cDNA libraries were sequenced with an Illumina HiSeq 2500system. Three biological replicates were used in the RNA-seq experiments involving each sample.

Page 10/25
Clean reads were obtained from the raw reads after �ltering out low-quality reads and were used for denovo transcriptome assembly. Trinity software was used to assemble the transcriptomes according to thestudy from Grabherr et al. [62]. High-quality reads were assembled into contigs, transcripts, and unigenesusing Trinity (http://trinityrnaseq.sourceforge.net/) [62, 63]. The functional annotation of all-unigeneswas performed using a BLAST search (http://blast.ncbi.nlm.nih.gov/Blast.cgi) against the GO, Pfam,KEGG, Nr, and Swiss-Prot databases.
FPKM was used to quantify the gene expression [64]. FPKM values were normalized, DEGs weredetermined when FDR≤0.001 and |log2fold change| ≥ 1. Functional annotation and classi�cation of theDEGs were conducted using the Blast 2 GO program (http://www.blast2go.com/b2ghome) [65].Additionally, a KEGG pathway analysis (http://www.genome.jp/kegg-bin/search_pathway) wasperformed. The heat map was produced using Cluster 3.0 and treeview.
Label-free analysis of the stigma proteome of water lily
Protein extraction and peptide enzymolysis. Protein extraction was performed using the SDT (4% SDS,100 mM DTT, 150 mM Tris-HCl pH 8.0) method. The protein concentrations were quanti�ed with the BCAProtein Assay Kit (Bio-Rad, USA), and the samples were stored at -80°C. Protein digestion (200 g for eachsample) was performed using the �lter aided proteome preparation procedure described by Wisniewski[66]. The peptides from each sample were desalted on C18 cartridges, concentrated by vacuumcentrifugation, and reconstituted in 40 L of 0.1% (v/v) formic acid.
MS/MS protein identi�cation and quanti�cation. Each fraction was injected for nanoLC-MS/MS analysis.The peptide mixture was loaded onto a reverse-phase trap column (Thermo Fisher Scienti�c AcclaimPepMap100, 100 m × 2 cm, nanoViper C18) connected to the C18-reverse phase analytical column(Thermo Fisher Scienti�c Easy Column, 10 cm long, 75 m inner diameter, 3 m, C18-A2) in buffer A (0.1%formic acid) and separated with a linear gradient of buffer B (84% acetonitrile, 0.1% formic acid) at a �owrate of 300 nL/min controlled by IntelliFlow technology.
LC-MS/MS analysis was performed on a Q Exactive mass spectrometer (Thermo Fisher Scienti�c)coupled to an Easy nLC (Proxeon Biosystems, now Thermo Fisher Scienti�c) for 240 min. The massspectrometer was operated in the positive ion mode. MS data was acquired using a data-dependenttop10 method, dynamically choosing the most abundant precursor ions from the survey scan (300–1,800m/z) for higher collision energy dissociation (HCD) fragmentation. The automatic gain control target wasset to 1e6, and the maximum injection time was 50 ms. The duration of dynamic exclusion was 60.0 s.Survey scans were acquired at a resolution of 70,000 at 200 m/z; resolution for HCD spectra was set to17,500 at m/z 200, the isolation width was 2 m/z, the normalized collision energy was 30 eV, and theunder-�ll ratio was de�ned as 0.1%.
For protein identi�cation, the MS raw �les were processed by Maxquant1.5.3.17 software [67]. Theacquired MS/MS spectra were searched against the predicted protein databases translated from theabove transcriptome databases in this study. The minimum peptide length was set to six amino acids

Page 11/25
and the maximum FDR was set to 1% for both peptides and proteins. The other parameters were set asfollows: peptide mass tolerance = ± 20 ppm; enzyme = trypsin; max missed cleavage = 2; �xedmodi�cation: carbamidomethyl (C); variable modi�cation: oxidation (M), acetyl (protein N-term). Proteinquanti�cation was based on both ‘razor’ and unique peptides [67, 68], and the label free quantitationalgorithm was performed [69]. For each fraction, peptides were matched across different LC-MS/MS runsbased on mass and retention time (set to the match between runs option in MaxQuant) using the timewindow of 2 min.
DEPs were analyzed for signi�cant downregulation or upregulation. For quantitative changes, a 2.0-foldcutoff was set to determine upregulated and downregulated proteins, with a p-value < 0.05 present in atleast two replicates.
Bioinformatics analysis
A functional annotation analysis was performed with Blast2GO software (http://www.geneontology.org/)[70]. We used the KAAS (Automatic Annotation Server) software to annotate DEPs and to investigate thebiochemical pathways of molecular interactions [71]. Three biological replicates of each sample wereused in the label-free analysis.
Selection of target peptides for PRM analysis
Peptide mixtures of nine samples were prepared using trypsin as described above for the label-freeanalysis. Equivalent peptides from each sample were pooled, and 2 µg of the pooled sample wasintroduced into an HPLC system via a trap column (100 μm×50 mm, 5 μm-C18) and then via an analyticalcolumn (75 μm×200 mm, 3 μm-C18). Separated peptides were then analyzed using a Q-Exactive massspectrometer (Thermo Fisher Scienti�c). Raw �les were analyzed using Maxquant 1.5.3.17 software(enzyme = trypsin/P, missed cleavage = 0). Only peptides with scores over 40 were selected as targetpeptides.
Quantitative PRM analysis for target proteins
A total of eight target peptides of the four DEPs were selected and used for quantitative analysis todetermine their feasibility. Peptide Retention Time Calibration mixture was added into the peptide mixture,and the labeled peptide “TASEFDSAIAQDK” (the bold “K” indicates the heavy isotopic labeling) was usedas the internal standard. Two micrograms of peptide mixture containing 20 fmol labeled peptide wasseparated by HPLC and then analyzed by a Q-Exactive mass spectrometer. Quantitative analysis wasrepeated three times and the raw data was calculated by Skyline 3.5.0.
AbbreviationsHAP, hours after pollination; DEGs, differentially expressed genes; DEPs, differentially expressed proteins;GO, Gene Ontology; KEGG, Kyoto Encyclopedia of Genes and Genomes; SAM, S-adenosylmethionine

Page 12/25
metabolism;ROS, reactive oxygen species; RNA-seq, RNA sequencing; FPKM, Fragments Per KilobaseMillion; PRM, Parallel reaction monitoring; LC-PRM/MS, Liquid Chromatography-Parallel ReactionMonitoring/Mass Spectrometry; NO, Nitric Oxide; GST, Glutathione S-transferase; MAPK, Mitogen-activated protein kinase
DeclarationsAcknowledgements
Not applicable
Funding
This study was supported by the National Natural Science Foundation of
China (31701948).
Availability of data and material
The raw data from the three samples have been submitted separately to the National Center forBiotechnology Information (NCBI) under the accession number PRJNA548276(http://www.ncbi.nlm.nih.gov/sra/ PRJNA548276).
Authors’contributions
CQS, FDC, NJT and ZLD designed the experiments. CQS, XS and YMY performed the experiments. CQS,NJT and ZLD analyzed the data. CQS wrote the manuscript. All authors have read and approved the �nalmanuscript.
Competing interests
The authors declare that they have no competing interests.
Consent for publication
Not applicable.
Ethics approval and consent to participate
Not applicable.
References1. Huang GZ, Deng HQ, Li Z, Li G. Water lily. Beijing: China Forestry Press; 2009.

Page 13/25
2. Sun CQ, Ma ZH, . Sun GS, Dai ZL,Teng NJ, Pan YP. Cellular mechanisms of reproductive barriers insome crosses of water lily (Nymphaea spp.) cultivars. Hort Science. 2015; 50:30-35.
3. Pairat S, Vipa H. Intersubgeneric cross in Nymphaea spp. L. to develop a blue hardy waterlily. ScientiaHorticulturae. 2010; 124:475-481.4. Sun CQ, Ma ZH, Zhang ZC, Sun GS, Dai ZL. Factors in�uencing cross barriers in interspeci�chybridizations of water lily. Journal of the American Society for Horticultural Science. 2018; 143(2):1-6.
5. Sun CQ, Chen FD, Teng NJ, Liu ZL, Fang WM, Hou XL. Factors affecting seed set in the crossesbetween Dendranthema grandi�orum (Ramat.) Kitamura and its wild species. Euphytica. 2010; 171:181–192.
6. Teng NJ, Wang YL, Sun CQ, Fang WM, Chen FD. Factors in�uencing fecundity in experimental crossesof water lotus (Nelumbo nucifera Gaertn.) cultivars. BMC Plant Biology. 2012; 12:82.
7. De Graaf BHJ, Derksen JWM, Mariani C. Pollen and pistil in the progamic phase. Sexual PlantReproduction. 2001; 14:41-55.
8. Ram SG, Ramakrishnan SH, Thiruvengadam V, Bapu JRK. Prefertilization barriers to interspeci�chybridization involving Gossypium hirsutum and four diploid wild species. Plant Breeding. 2008; 127:295-300.
9. Ram SG, Sundaravelpandian K, Kumar M, Vinod KK, Bapu JRK, Raveendran TS. Pollen-pistil interactionin the inter-speci�c crosses of Sesamum sp. Euphytica. 2006; 152:379-385.
10. Mazzucato A, Olimpieri I, Ciampolini F, Cresti M, Soressi GP. A defective pollen-pistil interactioncontributes to hamper seed set in the parthenocarpic fruit tomato mutant. Sexual Plant Reproduction.2003; 16:157-164.
11. Wang Z, Gerstein M, Snyder M. RNA-Seq: a revolutionary tool for transcriptomics. Nat. Rev. Genet.2009; 10:57–63.
12. Sun QQ, Zhang N, Wang JF, Cao YY, Li XS, Zhang HJ, Zhang L, Tan DX, Guo YD. A label-freedifferential proteomics analysis reveals the effect of melatonin on promoting fruit ripening andanthocyanin accumulation upon postharvest in tomato. Journal of Pineal Research. 2016; 61(2):138-153.
13. Ma DY, Huang X, Hou JF, Ma Y, Han QX, Hou GG, Wang CY, Guo TC.Quantitative analysis of the grainamyloplast proteome reveals differences in metabolism between two wheat cultivars at two stages ofgrain development. BMC Genomics. 2018; 19:768.
14. Raherison E, Rigault P, Caron S, Poulin PL,Boyle B, Verta JP, Giguère I, Bomal C, Bohlmann J, MacKayJ. Transcriptome pro�ling in conifers and the PiceaGenExpress database show patterns of diversi�cationwithin gene families and interspeci�c conservation in vascular gene expression. BMC Genomics. 2012;13: 434.

Page 14/25
15. Qiu ZB, Wan LC, Chen T, Wan YL, He XQ, Lu SF, Wang YW, Liu JX. The regulation of cambial activity inChinese �r (Cunninghamia lanceolata) nvolves extensive transcriptome remodeling. New Phytol. 2013;199:708-719.
16. Sheoran IS, Pedersen EJ, Ross AR, Sawhney VK. Dynamics of protein expression during pollengermination in canola (Brassica napus). Planta, 2009; 230(4): 779-793.
17. Samuel MA, Tang W, Jamshed M, Northey J, Patel D, Siu KW, Muench DG, Wang ZY, Goring DR.Proteomic analysis of Brassica stigmatic proteins following the self-incompatibility reaction reveals arole for microtubule dynamics during pollen responses. Mol Cell Proteomics. 2011; 10(12):111-113.
18. Knox RB, Willing RR, Ashford AE. Role of pollen wall proteins as recognition substances ininterspeci�c hybridization in poplars. Nature. 1972; 237:381-383.
19. Hu L, Liang W, Yin C, Cui X, Zong J, Wang X, Hu J, Zhang D. Rice MADS3 regulates ROS homeostasisduring late anther development. Plant Cell. 2011; 23:515-533.
20. Luo D, Xu H, Liu Z, Guo J, Li H, Chen L, Fang C, Zhang Q, Bai M, Yao N. A detrimental mitochondrial-nuclear interaction causes cytoplasmic male sterility in rice. Nat Genet. 2013; 45:573-577.
21. Xie HT, Wan ZY, Li S, Zhang Y. Spatiotemporal production of reactive oxygen species by NADPHoxidase is critical for tapetal programmed cell death and pollen development in Arabidopsis. The PlantCell. 2014; 26:2007-2023.
22. Speranza A, Crinelli R, Scoccianti V, Geitmann A. Reactive oxygen species are involved in pollen tubeinitiation in kiwifruit. Plant Biol. 2012; 14:64-76.
23. Potocky M, Jones MA, Bezvoda R, Smirnoff N, Zarsky V. Reactive oxygen species produced by NADPHoxidase are involved in pollen tube growth. New Phytol. 2007; 174:742-751.
24. Kaya H, Nakajima R, Iwano M, Kanaoka MM, Kimura S, Takeda S, Kawarazaki T, Senzaki E,Hamamura Y, Higashiyama T. Ca2+-activated reactive oxygen species production by Arabidopsis RbohHand RbohJ is essential for proper pollen tube tip growth. Plant Cell. 2014; 26:1069-1080.
25. Lassig R, Gutermuth T, Bey TD, Konrad KR, Romeis T. Pollen tube NAD(P)H oxidases act as a speedcontrol to dampen growth rate oscillations during polarized cell growth. Plant J. 2014; 78:94-106.
26. Duan Q, Kita D, Johnson EA, Aggarwal M, Gates L, Wu HM, Cheung AY. Reactive oxygen speciesmediate pollen tube rupture to release sperm for fertilization in Arabidopsis. Nat Commun. 2014; 5:3129.
27. Wilkins KA, Bancroft J, Bosch M, Ings J, Smirnoff N, Franklin-Tong VE. Reactive oxygen species andnitric oxide mediate actin reorganization and programmed cell death in the self-incompatibility responseof papaver. Plant Physiol. 2011; 156:404-416.

Page 15/25
28. Mc Innis SM, Emery DC, Porter R, Desikan R, Hancock JT, Hiscock SJ. The role of stigma peroxidasesin �owering plants: Insights from further characterization of a stigma-speci�c peroxidase (SSP) fromSenecio squalidus (Asteraceae). Journal of Experimental Botany. 2006; 57(8):1835-1846.
29. Hiscock SJ, Bright J, Mcinnis SM, Desikan R, Hancock JT. Signaling on the stigma: potential newroles for ROS and NO in plant cell signaling. Plant signaling&Behavior. 2007; 2(1):23-24.
30. Bright J, Hiscock SJ, James PE, Hancock JT. Pollen generates nitric oxide and nitrite: a possible linkto pollen-induced allergic responses. Plant Physiology and Biochemistry. 2009; 47(1):49-55.
31. Zafra A, Rodríguezgarcía MI, Alché JD. Cellular localization of ROS and NO in olive reproductivetissues during �ower development. BMC Plant Biology. 2010; 10(1):36.
32. Popescu SC, Popescu GV, Bachan S, Zhang Z, Seay M, Gerstein M, Snyder M, Dinesh-Kumar S.Differential binding of calmodulin-related proteins to their targets revealed through high-densityArabidopsis protein microarrays. Proceedings of the National Academy of Sciences. 2007; 104:4730-4735.
33. Sharma B, Bhatla SC. Accumulation and scavenging of reactive oxygen species and nitric oxidecorrelate with stigma maturation and pollen-stigma interaction in sun�ower. Acta PhysiologiaePlantarum. 2013; 35(9):2777-2787.
34. Tian Y, Fan M, Qin Z, Lv H, Wang M, Zhang Z, Zhou W, Zhao N, Li X, Han C, Ding Z, Wang W, Wang ZY.Hydrogen peroxide positively regulates brassinosteroid signaling through oxidation of theBRASSINAZOLE-RESISTANT1 transcription factor. Nature Communication. 2018; 9:1063.
35. Winkel-shirley B. Flavonoid biosynthesis. A colorful model for genetics, biochemistry, cell biology, andbiotechnology. Plant Physiol. 2001; 126(2):485-493.
36. Tsai CJ, Harding SA, Tschaplinski TJ, Lindroth RL, Yuan Y. Genome-wide analysis of the structuralgenes regulating defense phenylpropanoid metabolism in Populus. New Phytol. 2006; 172(1): 47-62.
37. Li M, Xu W, Yang W, Kong Z, Xue Y. Genome-wide gene expression pro�ling reveals conserved andnovel molecular functions of the stigma in rice. Plant Physiol. 2007; 144:1797-1812.
38. Cheung AY, Wu HM, Di Stilio V, Glaven R, Chen C, Wong E, Ogdahl J, Estavillo A. Pollen-pistilinterantiongs in Nicotiana tabacum. Ann Bot. 2000; 85(S1):29-37.
39. Shen B, Li C, Tarczynski MC. High free-methionine and decreased lignin content result from amutation in the Arabidopsis S-adenosyl-L-methionnine synthetase 3 gene. The Plant Journal. 2002;29(3):371-380.
40. Martinez-López N, Varela-Rey M, Ariz U, Embade N, Vazquez-Chantada M, Fernandez-Ramos D,Gomez-Santos L, Lu SC, Mato JM, Martinez-Chantar ML. S-adenosylmethionine and proliferation: new

Page 16/25
pathways, new targets. Biochemical Society transactions. 2008; 36(5):848-852.
41. Lan P, Li W, Wen TN, Shi JY, Wu YC, Lin W, Schmidt W. iTRAQ protein pro�le analysis of arabidopsisroots reveals new aspects critical for iron homeostasis. Plant Physiology. 2011; 155(2):821-34.
42. Gong B, Wang X, Wei M, Yang F, Li Y, Shi Q. Overexpression of s-adenosy-l-methionine synthetase 1enhances tomato callus tolerance to alkali stress through polyamine and hydrogen peroxide cross-linkednetworks. Plant Cell Tissue & Organ Culture. 2016; 124(2):377-391.
43. Fujimoto T, Tomitaka Y, Abe H, Tsuda ., Futai K, Mizukubo T. Expression pro�le of jasmonic acid-induced genes and the induced resistance against the root-knot nematode (Meloidogyne incognita) intomato plants (Solanum lycopersicum) after foliar treatment with methyl jasmonate. Journal of PlantPhysiology. 2011; 168(10):1084-97.
44. Owiti J, Grossmann J, Gehrig P, Dessimoz C, Laloi C, Hansen MB, Gruissem W, Vanderschuren H.iTRAQ-based analysis of changes in the cassava root proteome reveals pathways associated with post-harvest physiological deterioration. Plant Journal. 2011; 67:145-156.
45. Roje S. S-Adenosyl-L-methionine: beyond the universal methyl group donor. Phytochemistry. 2006;67(15): 1686-1698.
46. Wolukau JN, Zhang SL, Xu GH, Chen D. The effect of temperature, polyamines and polyaminesynthesis inhibitor on invitro pollen germination and pollen tube growth of Prunus mume. ScientiaHorticulturae. 2004; 99(3-4):289-299.
47. Martinis DD, Cotti C, Hekker SL. Ethylene response to pollen tube growth in Nicotiana tabacum�owers. Planta. 2002; 214(5):806-812.
48. Tian GW, Chen MH, Zaltsman A, Citovsky V. Pollen-speci�c pectin methylesterase involved in pollentube growth. Developmental Biology. 2006; 294:83-91.
49. Kim J, Shiu SH, Thoma S, Li WH, Patterson SE. Patterns of expansion and expression divergence inthe plant polygalacturonase gene family. Genome Biology. 2006; 9: 87.
50. Suen DF, Huang AH. Maize pollen coat xylanase facilitates pollen tube penetration into silk duringsexual reproduction. J. Biol. Chem. 2007; 282:625-636.
51. Swanson R, Clark T, Preuss D. Expression pro�ling of Arabidopsis stigma tissue identi�es stigma-speci�c genes. Sex. Plant Reprod. 2005; 18:163-171.
52. Tung CW, Dwyer KG, Nasrallah ME, Nasrallah JB. Genome-wide identi�cation of genes expressed inArabidopsis pistils speci�cally along the path of pollen tube growth. Plant Physiol. 2005; 138: 977-989.

Page 17/25
53. Quiapim AC, Brito MS, Bernardes LA, Dasilva I, Malavazi I, De Paoli HC, Molfetta-Machado JB, GiuliattiS, Goldman GH, Goldman MH. Analysis of the Nicotiana tabacum stigma/style transcriptome revealsgene expression differences between wet and dry stigma species. Plant Physiol. 2009; 149:1211-1230.
54. Roach MJ, Mokshina NY, Badhan A, Snegireva AV, Hobson N, Deyholos MK, Gorshkova TA.Development of cellulosic secondary walls in �ax �bers requires beta-galactosidase. Plant Physiology.2011;156:1351-1363.
55. Campbell P, Braam J. Xyloglucan endotransglycosylases: diversity of genes, enzymes and potentialwall-modifying functions. Trends in Plant Science. 1999; 4(9):361-366.
56. Huckelhoven R. Cell wall-associated mechanisms of disease resistance and susceptibility. Annu RevPhytopathol. 2007; 45:101-127.
57. Bernards MA. Demystifying suberin. Can J Bot. 2002; 80:227-240.
58. Dixon DP, Skipsey M, Edwards R. Roles for glutathione transferases in plant secondary metabolism.Phytochemistry. 2010, 71:338-350.
59. Liu HH, Wang LW, Liu X, Ma X, Ning LH, Zhang H, Cui DZ. Jiang C, Chen HB. Proteomic analyses ofthe early pollen-silk ineraction in maize, Scientia Agricultura Sinica. 2010; 43(24):5000-5008.
60. Schuler MA, Werck-Reichhart D. Functional genomics of P450s. Annu Rev Plant Biol. 2003; 54:629-667.
61. Group M. Mitogen-activated protein kinase cascades in plants: a new nomenclature. Trends Plant Sci.2002; 7(7):301-308.
62. Grabherr MG, Has BJ, Yassour M. Full-length transcriptome assembly from RNA-seq data without areference genome. Nat Biotech. 2011; 29:644-652.
63. Liu FL, Sun XT, Wang WJ, Liang ZR, Wang FJ. Denovo transcriptome analysis-gained insights intophysiological and metabolic characteristics of Sargassum thunbergii (Fucales, Phaeophyceae). J ApplPhycol. 2014; 26:1519-1526.
64. Mortazavi A, Williams BA, McCue K, Schaeffer L, Wold B. Mapping and quantifying mammaliantranscriptomes by RNA-Seq. Nat Methods. 2008; 5(7):621-628.
65. Conesa A, GÖtz S, García-Gómza JM, Terol J, Talón M, Robles M. Blast2go: a universal tool forannotation, visualization and analysis in functional genomics research. Bioinformatics. 2005; 21:3674 –676.
66. Wisniewski JR, Zougman A, Nagraj N, Mann M. Universal sample preparation method for proteomeanalysis. Nat Methods. 2009; 6:359-362.

Page 18/25
67. Cox J, Mann M. MaxQuant enables high peptide identi�cation rates, individualized p.p.b.-range massaccuracies and proteome-wide protein quanti�cation. Nat Biotechnol. 2008; 26(12):1367-1372.
68. Hubner NC, Mann M. Extracting gene function from protein-protein nteractions using quantitative BACInteracCtomics (QUBIC). Methods. 2011; 53:453-459.
69. Cox J, Hein MY, Luber CA, Paron I, Nagaraj N, Mann M. Accurate proteome-wide label-freequanti�cation by delayed normalization and maximal peptide ratio extraction, termed MaxLFQ. Mol CellProteomics. 2014; 13(9):2513-2526.
70. Conesa A, Gotz S, García-Gómez JM, Terol J, Talón M, Robles M. et al. Blast2GO: a universal tool forannotation, visualization and analysis in functional genomics research. Bioinformatics. 2005; 21: 3674-3676.
71. Moriya Y, Itoh M, Okuda S, Yoshizawa AC, Kanehisa M. KAAS: an automatic genome annotation andpathway reconstruction server. Nucleic Acids Res. 2007; 35:182-185.
Additional File LegendAdditional �le 1. Differential expression genes in 0, 2 and 6 HAP. (XLS 37376 kb)
Additional �le 2. Up- and down-regulated DEPs identi�ed by label-free analysis in 0, 2 and 6 HAP. (XLS10752 kb)
Additional �le 3. The correlation between DEPs and DEGs. (XLS 855 kb)
Additional �le 4. The cor-DEGs-DEPs genes with the same or opposite trend. (XLS 31 kb)
Additional �le 5. The Skyline analysis results of eight target peptide fragments of the four target proteins.(PDF 14848 kb)
Additional �le 6. The peak area results of each target peptide fragment from the Skyline analyses. (PDF14848 kb)
Additional �le 7. Detailed results from the data analysis including quantitative information at the peptidefragment level, data calibration, and statistical analyses.. (PDF 85 kb)
TableTable 1 Relative quantitative of target peptide segment by PRM analysis

Page 19/25
Peptide Sequence Protein Name Ratio
2 HAP/0 HAP
Ratio
6 HAP/0 HAP
Ratio
6 HAP/2HAPLADEWASTK TRINITY DN44636 c2 g1 1.82 2.15 1.18
EGPDGLVGAAEVER TRINITY DN44636 c2 g1 2.86 3.88 1.36HPIPSYTHTGK TRINITY DN50288 c0 g2 2.99 3.04 1.02
YDFDPLDVTTTWPEDLLPLQPVGR TRINITY DN50288 c0 g2 3.62 5.19 1.43THLGAVAFNNTTR TRINITY DN35350 c0 g1 5.92 6.71 1.13
WAFPLEEDAIAK TRINITY DN35350 c0 g1 4.66 5.64 1.21DSTVISGGPYWEVPLGR TRINITY DN53782 c2 g1 2.94 3.92 1.33
GLLNTDEILFTQNK TRINITY DN53782 c2 g1 3.17 4.14 1.30
Figures
Figure 1
Pollen germination on stigma on stigmas at 6 h after pollination with scanning electron microscope.Accumulation of wax between the stigma and the surface of the pollen grains was commonly observed.Scale bar = 25 µm. W= Wax.

Page 20/25
Figure 2
Venn diagram showing all identi�ed, as well as all signi�cantly enriched, mRNAs and proteins and theiroverlap. All protein: Represents all quanti�able proteins in the proteome; All Gene: Represents allquanti�able genes obtained in the transcriptome; DE Protein: Represents differentially expressed proteinsidenti�ed by the proteome; DE mRNA: Represents differentially expressed genes identi�ed by thetranscriptome.
Page 21/25
Figure 3
Correlations between protein and messenger ribonucleic acid (mRNA) expression. x-axis represents theprotein expression level, and y-axis represents the genes expression level. (a) Scatterplots of therelationship between genes quanti�ed in both transcriptomic and proteomic data sets. (b) Scatterplotsand correlation coe�cients between differentially expressed proteins (DEPs) and differently expressedgenes (DEGs). Scatterplots and correlation coe�cients between proteins and mRNA expression ratios

Page 22/25
which are the same (c) or opposite (d) changing tendency. The purple plot indicates none DEPs andDEGs; green plot indicates DEPs but none DEGs; blue plot indicates DEGs but none DEPs; red plotindicates DEPs and DEGs, and all data were log2-transformed.
Figure 4
Cluster analysis of associated differential proteins and differential mRNA expression patterns. Each rowin the graph represents a protein/mRNA, and each column in the graph represents a sample (theproteome sample on the left and the corresponding transcriptome sample on the right). Numbers are

Page 23/25
listed as the log 2 value of difference multiples. Expression differences are shown in different colors; redindicates up-regulation, while blue indicates down-regulation.
Figure 5
GO enrichment analyses of DEGs and DEPs. Each column in the �gure represents a GO secondaryannotation entry, red represents differentially expressed proteins, and blue represents differentially

Page 24/25
expressed genes. From left to right, the number of differentially expressed proteins is arranged from highto low. BP: Biological process, CC: Cellular component, MF: Molecular function.
Figure 6
KEGG enrichment analyses of DEGs and DEPs. Each column in the �gure represents a KEGG pathway,and different colors represent different histology. The red column in the �gure represents the KEGGenrichment result of proteome, and the blue column represents the KEGG enrichment result oftranscriptome. The abscissa is the name of the enriched KEGG pathway, and the ordinate represents thenumber of enriched proteomes and transcriptomes. From left to right, the number of differentiallyexpressed proteins ranged from high to low.
Supplementary Files
This is a list of supplementary �les associated with this preprint. Click to download.
supplement1.xls
supplement2.xls
supplement3.xls
supplement4.xls
supplement5.xls
supplement6.xls