Water - IRC :: Home · 2 Water: a unique natural resource 123 ... Annual returns from selling...
40
iStockphoto/Morgan Mansour
Transcript of Water - IRC :: Home · 2 Water: a unique natural resource 123 ... Annual returns from selling...
iSto
ckph
oto/
Mor
gan
Man
sour

Investing in natural capitalWater
ADVANCE COPY
ONLINE RELEASE[ ]
Towards a green economy
Chapter Coordinating Author: Prof. Mike D. Young, Executive Director, The Environment Institute, University of Adelaide, Australia.
Nicolas Bertrand of UNEP managed the chapter, including the handling of peer reviews, interacting with the coordinating author on revisions, conducting supplementary research and bringing the chapter to final production. Derek Eaton reviewed and edited the modelling section of the chapter.
Eleven Background Technical Papers were prepared for this chapter by the following individuals: Arfiansyah, Pam Lyonnaise Jaya (PALYJA); Paulina Beato, Pompeu Fabra University, Spain; Alvaro Calzadilla, Kiel Institute for the World Economy, Germany; Irma Damayanti, Pam Lyonnaise Jaya (PALYJA); Fulton Eaglin, Pegasys Strategy and Development; Philippe Folliasson, Pam Lyonnaise Jaya (PALYJA); Vincent Fournier, Pam Lyonnaise Jaya, (PALYJA); David Kaczan, M.Sc. candidate, University of Alberta, Canada; Sharon Khan, independent consultant; Anna Lukasiewicz, PhD candidate, Charles Sturt University, Australia; Luc Martin, Pam Lyonnaise Jaya (PALYJA); Claude Ménard, University of Paris-Pantheon Sorbonne, France; Mike Muller, University of Witwatersrand, South Africa; Andrew Ogilvie, IRD UMR G-eau; Guy Pegram, Pegasys Strategy and Development; Katrin Rehdanz, Kiel Institute for the World Economy and Christian-Albrechts-University of Kiel, Germany; Rathinasamy Maria Saleth, Madras Institute of Development Studies, India; Barbara Schreiner, Pegasys Strategy and Development; Richard S.J. Tol, Economic and Social Research Institute, Ireland and Institute for Environmental Studies and the Department of Spatial Economics, Vrije Universiteit, The Netherlands; Håkan Tropp, Stockholm International Water Institute (SIWI), Sweden; Antonio Vives, Cumpetere and Stanford University; Constantin von der Heyden, Pegasys Strategy and Development; and John Ward, CSIRO, Australia. An edited reprint of the executive summary of the 2030 Water Resources Group report, Charting Our Water Future (initially published in 2009) and an updated version of “Free basic water – a sustainable instrument for a sustainable future in South Africa” (initially published in 2008 in Environment & Urbanization) were prepared as additional Background Technical Papers. Additional material was prepared by Andrea M. Bassi, John P. Ansah and Zhuohua Tan (Millennium Institute); and Carlos Carrión-Crespo and Ana Lucía Iturriza (ILO).
The compilation of Background Technical Papers was edited by Christine S. Esau.
During the development of the chapter, the Chapter Coordinating Author received invaluable advice from a Global Reference Group consisting (in their personal capacity) of Shahid Ahmad (Member, Natural Resources, Pakistan Agriculture Research Council); Dianne d’Arras (Senior Vice President, Technology and Research Suez Environnement); Wouter Lincklaen Arriens (Lead Water Resources Specialist, Asian Development Bank); Ger Bergkamp (Director General, World Water Council); Don Blackmore (Chair, eWater CRC Board; former CEO, Murray Darling Basin Commission); Benedito Braga (Vice President, World Water Council; Professor of Civil and Environmental Engineering, University of São Paolo); Margaret
AcknowledgementsCatley Carlson (Chair, Global Water Partnership; former Deputy Minister of Health and Welfare Canada); Vasile Ciomos (President, Romanian Water Association); Alberto Garrido (Associate Professor, Technical University of Madrid); Jerry Gilbert (consultant); Vincent Gouarne (Director, Latin America and the Caribbean, International Finance Corporation); R. Quentin Grafton (Professor, Australian National University); David Grey (Senior Advisor, World Bank); Kathy Jacobs (Executive Director, Arizona Water Institute); Mohamed Ait Kadi (President, General Council of Agricultural Development, Morocco); Helmut Kroiss (Head, Institute for Water Quality, Vienna University of Technology); Alain Locussol (formal Specialist, World Bank); David Molden (Deputy Director General, International Water Management Institute); Jack Moss (Senior Advisor, AquaFed – The International Federation of Private Water Operators); Mike Muller (former Director-General, Department of Water Affairs and Forestry, Government of South Africa); Herbert Oberhaensli (Assistant Vice President, Economic and International Relations, Nestlé S.A.); Kirit Parikh (Emeritus Professor and Founder Director, Indira Gandhi Institute of Development Research); Usha Rao-Monari (Senior Manager, Infrastructure Department, International Finance Corporation); Brian Richter (Director, Sustainable Waters Programme, The Nature Conservancy); Rathinasamy Maria Saleth (Director, Madras Institute of Development Studies); Mark Smith (Head, IUCN Water Programme); A. Dan Tarlock (Distinguished Professor of Law, Chicago-Kent College of Law); Lee Travers (Sector Manager, World Bank); Henry J. Vaux Jr. (Professor, University of California-Berkeley); Antonio Vives (former Manager, Sustainable Development Department, Inter-American Development Bank); Hao Wang (Academician, Chinese Academy of Engineering, China Institute of Water Resources and Hydropower Research; Vice President, Chinese Committee of Global Water Partnership); James Winpenny (Consultant, Wychwood Economic Consulting Ltd.); and Sascha Zehnder (Science Director, Alberta Water Research Institute).
We would like to thank the many colleagues and individuals who commented on various drafts, including Joana Akrofi (UNEP), Chizuru Aoki (UNEP), Joseph Alcamo (UNEP), Ger Bergkamp (World Water Council), Peter Börkey (OECD), Munyaradzi Chenje (UNEP), David Coates (CBD Secretariat), Salif Diop (UNEP), Renate Fleiner (UNEP), Ryuichi Fukuhara (UNEP), Habib El-Habr (UNEP), Melanie Hutchinson (UNEP), Elizabeth Khaka (UNEP), Arnold Kreilhuber (UNEP), Olivia la O’Castillo (UNSGAB), Razi Latif (UNEP), Lifeng Li (WWF International), Peter Manyara (UNEP), Robert McGowan, Patrick Mmayi (UNEP), Madiodio Niasse (International Land Coalition), Lara Ognibene (UNEP), Neeyati Patel (UNEP), Elina Rautalahti (UNEP), Nadia Scialabba (FAO), David Smith (UNEP), David Tickner (WWF-UK), Chris Tomkins, Cornis van der Lugt (UNEP), and Lew Young (Ramsar Convention Secretariat). Renate Fleiner, in particular, coordinated input from the UNEP Interdivisional Water Group on the Review Draft and subsequent versions of the chapter. The support of the UNEP Division of Environmental Policy Implementation (DEPI) / Freshwater Ecosystems Unit (Thomas Chiramba, Chief ), throughout the project, is also gratefully acknowledged.
Within the University of Adelaide, the following individuals are also to be thanked: Sam Fargher, Nobiko Wynn, Adriana Russo, Sarah Streeter, Husam Seif, Jane Rathjen and Sanjee Peiris.
Copyright © United Nations Environment Programme, 2011
114
ContentsKey messages 118
1 Introduction 1201.1 The aim of this chapter . . . . . . . . . . . . . . . . . . . . . . . . . . . . . . . . . . . . . . . . . . . . . . . . . . . . . . . . . . . . . . . . . . . . . . . 1201.2 Scope and definition . . . . . . . . . . . . . . . . . . . . . . . . . . . . . . . . . . . . . . . . . . . . . . . . . . . . . . . . . . . . . . . . . . . . . . . . . 1201.3 Water in a green economy – A vision . . . . . . . . . . . . . . . . . . . . . . . . . . . . . . . . . . . . . . . . . . . . . . . . . . . . . . . . . . 1201.4 Measuring progress towards a green economy . . . . . . . . . . . . . . . . . . . . . . . . . . . . . . . . . . . . . . . . . . . . . . . . 1211.5 The world’s water resources. . . . . . . . . . . . . . . . . . . . . . . . . . . . . . . . . . . . . . . . . . . . . . . . . . . . . . . . . . . . . . . . . . . 122
2 Water: a unique natural resource 1232.1 Services from natural infrastructure . . . . . . . . . . . . . . . . . . . . . . . . . . . . . . . . . . . . . . . . . . . . . . . . . . . . . . . . . . . 1232.2 Water accounting . . . . . . . . . . . . . . . . . . . . . . . . . . . . . . . . . . . . . . . . . . . . . . . . . . . . . . . . . . . . . . . . . . . . . . . . . . . . 1232.3 Water and energy . . . . . . . . . . . . . . . . . . . . . . . . . . . . . . . . . . . . . . . . . . . . . . . . . . . . . . . . . . . . . . . . . . . . . . . . . . . . 124
3 Challenges and opportunities 1263.1 Challenges . . . . . . . . . . . . . . . . . . . . . . . . . . . . . . . . . . . . . . . . . . . . . . . . . . . . . . . . . . . . . . . . . . . . . . . . . . . . . . . . . . . 1263.2 Opportunities . . . . . . . . . . . . . . . . . . . . . . . . . . . . . . . . . . . . . . . . . . . . . . . . . . . . . . . . . . . . . . . . . . . . . . . . . . . . . . . . 130
4 The economics of greening water use 1354.1 The economics of investing in water and ecosystems . . . . . . . . . . . . . . . . . . . . . . . . . . . . . . . . . . . . . . . . . . 1354.2 Selecting projects and initiatives for investment. . . . . . . . . . . . . . . . . . . . . . . . . . . . . . . . . . . . . . . . . . . . . . . 1354.3 Flow of benefits from investment in the water supply and sanitation sector . . . . . . . . . . . . . . . . . . . . 137
5 Enabling conditions – Overcoming barriers and driving change 1385.1 Improving general institutional arrangements. . . . . . . . . . . . . . . . . . . . . . . . . . . . . . . . . . . . . . . . . . . . . . . . . 1385.2 International trade arrangements . . . . . . . . . . . . . . . . . . . . . . . . . . . . . . . . . . . . . . . . . . . . . . . . . . . . . . . . . . . . . 1385.3 Using market-based instruments . . . . . . . . . . . . . . . . . . . . . . . . . . . . . . . . . . . . . . . . . . . . . . . . . . . . . . . . . . . . . 1405.4 Improving entitlement and allocation systems . . . . . . . . . . . . . . . . . . . . . . . . . . . . . . . . . . . . . . . . . . . . . . . . 1415.5 Reducing input subsidies and charging for externalities . . . . . . . . . . . . . . . . . . . . . . . . . . . . . . . . . . . . . . . 1425.6 Improving water charging and finance arrangements . . . . . . . . . . . . . . . . . . . . . . . . . . . . . . . . . . . . . . . . . 142
6 Conclusions 148
References 149
Water
115

Towards a green economy
List of figuresFigure 1: “Green water” refers to rainwater stored in the soil or on vegetation, which cannot be diverted to a different use. “Blue water” is surface and groundwater, which can be stored and diverted for a specific purpose . . . . . . . . . . . . . . . . . . . . . . . . . . . . . . . . . . . . . . . . . . . . . . . . . . . . . . . . . . . . . . . . . . . . . . . . . . . . . . . . . . . . 121Figure 2: Prevailing patterns of threat to human water security and biodiversity. Adjusted human water security threat is contrasted against incident biodiversity threat. A breakpoint of 0.5 delineates low from high threat. . . . . . . . . . . . . . . . . . . . . . . . . . . . . . . . . . . . . . . . . . . . . . . . . . . . . . . . . . . . . . . . . . . . . . . . . . . . . . . . 123Figure 3: Water consumption for power generation, USA (2006) . . . . . . . . . . . . . . . . . . . . . . . . . . . . . . . . . . . . . . 124Figure 5: Progress towards attainment of the Millennium Development Goals’ sanitation target to half the number of people without adequate sanitation by 2015 . . . . . . . . . . . . . . . . . . . . . . . . . . . . . . . . . . . . . 127Figure 4: Global progress towards Millennium Development Goals’ target to reduce the number of people without access to adequate sanitation services to 1.7 billion people by 2015. . . . . . . . . . . . . . . . . . 127Figure 6: Areas of physical and economic water scarcity. . . . . . . . . . . . . . . . . . . . . . . . . . . . . . . . . . . . . . . . . . . . . . 128Figure 7: Number of people living in water-stressed areas in 2030 by country type. . . . . . . . . . . . . . . . . . . . 129Figure 8: Aggregated global gap between existing accessible, reliable supply and 2030 water withdrawals, assuming no efficiency gains . . . . . . . . . . . . . . . . . . . . . . . . . . . . . . . . . . . . . . . . . . . . . . . . . . . . . . . . . . . . . . . . . . . . . . . 130Figure 9: Projection of the global demand for water and, under a business-as-usual scenario, the amount that can be expected to be met from supply augmentation and improvements in technical water use efficiency (productivity) . . . . . . . . . . . . . . . . . . . . . . . . . . . . . . . . . . . . . . . . . . . . . . . . . . . . . . . . . . . . . . . . . . 130Figure 10: Assessment of expected increase in the annual global demands for water by region. . . . . . . . 131Figure 11: Schematic representation of a master meter system managed by a community-based organisation. . . . . . . . . . . . . . . . . . . . . . . . . . . . . . . . . . . . . . . . . . . . . . . . . . . . . . . . . . . . . . . . . . . . . . . . . . . . . . . . . . . . . . . . 133Figure 12: Relative costs of different methods of supplying water in China . . . . . . . . . . . . . . . . . . . . . . . . . . . . 136Figure 13: Predicted effect of a 10 per cent and 20 per cent reduction in the proportion of people obtaining their primary water supply from surface water or unprotected well water on child mortality and child morbidity (stunting), Niger basin . . . . . . . . . . . . . . . . . . . . . . . . . . . . . . . . . . . . . . . . . . . . . . . . . . . . . . . . . . 136Figure 14: Regional virtual water balances and net interregional virtual water flows related to the trade in agricultural products, 1997–2001 . . . . . . . . . . . . . . . . . . . . . . . . . . . . . . . . . . . . . . . . . . . . . . . . . . . . . . . . . . . 139Figure 15: Annual returns from selling allocations and capital growth in the value of a water entitlement compared with an index of the value of shares in the Australian Stock Exchange, Goulburn Murray System, Murray-Darling Basin . . . . . . . . . . . . . . . . . . . . . . . . . . . . . . . . . . . . . . . . . . . . . . . . . . . . . . . . . . . . . . . . . . . . . . . 142Figure 16: Development of Murray Darling Basin water entitlement transfers . . . . . . . . . . . . . . . . . . . . . . . . . 143Figure 17: Array of mixes of transfer, tax and tariff approaches to the provision of infrastructure finance . . . 144
116

Water
List of tablesTable 1: Examples of the estimated costs and benefits of restoration projects in different biomes. . . . . . 132Table 2: Modelled results of the Green Investment scenario . . . . . . . . . . . . . . . . . . . . . . . . . . . . . . . . . . . . . . . . . . 135Table 3: Change in regional welfare over 20 years as a result of climate change and trade liberalisation . . . 140Table 4: Water Tariff Structure in Western Jakarta, US$ per m3. . . . . . . . . . . . . . . . . . . . . . . . . . . . . . . . . . . . . . . . . 146
List of boxesBox 1: Economic impacts of poor sanitation . . . . . . . . . . . . . . . . . . . . . . . . . . . . . . . . . . . . . . . . . . . . . . . . . . . . . . . . . 126Box 2: Millennium Development Goals and water. . . . . . . . . . . . . . . . . . . . . . . . . . . . . . . . . . . . . . . . . . . . . . . . . . . . 127Box 3: Two examples of governments investing in river restoration . . . . . . . . . . . . . . . . . . . . . . . . . . . . . . . . . . . 131Box 4: Micro-scale infrastructure provision in Western Jakarta . . . . . . . . . . . . . . . . . . . . . . . . . . . . . . . . . . . . . . . . 133Box 5: Empirical analysis of the relationship between poverty and the provision of access to water and sanitation in the Niger basin . . . . . . . . . . . . . . . . . . . . . . . . . . . . . . . . . . . . . . . . . . . . . . . . . . . . . . . . . . . . . . . . . . . . 137Box 6: Australian experience in the role of water markets in facilitating rapid adaption to a shift to a drier climatic regime. . . . . . . . . . . . . . . . . . . . . . . . . . . . . . . . . . . . . . . . . . . . . . . . . . . . . . . . . . . . . . . . . . . . . . . . . . . . . . . . 143Box 7: Recent experience of private companies providing water to households . . . . . . . . . . . . . . . . . . . . . . . 146
117

Towards a green economy
Key messages
1. Water, a basic necessity for sustaining life, goes undelivered to many of the world’s poor. Nearly 1 billion people lack access to clean drinking water; 2.6 billion lack access to improved sanitation services; and 1.4 million children under five die every year as a result of lack of access to clean water and adequate sanitation services. At the current rate of investment progress, the Millennium Development Goal for sanitation will be missed by 1 billion people, mostly in Sub-Saharan Africa and Asia.
2. The existing provision of water and sanitation services generates considerable social costs and economic inefficiencies. When people do not have access to water, either large amounts of their disposable income have to be spent on purchasing water from vendors or large amounts of time, in particular from women and children, have to be devoted to carting it. This erodes the capacity of the poor to engage in other activities. When sanitation services are inadequate, the costs of water-borne disease are high. Cambodia, Indonesia, the Philippines and Vietnam, for instance, lose about US$9 billion a year because of poor sanitation – or approximately 2 per cent of combined GDP. Access to reliable, clean water and adequate sanitation services for all is a foundation block of a green economy.
3. Business-as-usual (BAU) translates as a massive and unsustainable gap between global supply and water withdrawals. With no improvement in the efficiency of water use, water demand is projected to overshoot supply by 40 per cent in 20 years time. Historical levels of improvement in water productivity, as well as increases in supply (such as through the construction of dams and desalination plants as well as increased recycling) are expected to address 40 per cent of this gap, but the remaining 60 per cent needs to come from investment in infrastructure, water-policy reform and in the development of new technology. The failure of such investment or policy reform to materialise will lead to the deepening of water crises.
118

Water
4. The availability of an adequate quantity of water, of sufficient quality, is a service provided by ecosystems. The management of, and investment in, ecosystems is therefore essential to address water security for both people and ecosystems in terms of water scarcity, the over-abundance of water (flood risk) and its quality.
5. Accelerated investment in water-dependent ecosystems, in water infrastructure and in water management can be expected to expedite the transition to a green economy. Modeling suggests that, under the green investment scenario, water use at the global level is kept within sustainable limits and all the MDGs for water are achieved in 2015. Water use is more efficient, enabling increased agricultural, biofuel and industrial production. The number of people living in a water-stressed region is 4 per cent less than under BAU by 2030, up to 7 per cent less by 2050.
6. When investment is coupled with improvements in institutional arrangements, entitlement and allocation systems; the expansion of Payments for Ecosystem Services; and the improvement of water charging and finance arrangements, the amount that needs to be invested in water can be reduced significantly. Moreover, a significant proportion of water-management policies and measures in other sectors such as input subsidies are undermining opportunities to improve water management. Resolving global water supply problems is heavily dependent upon the degree to which agricultural water use can be improved. Irrigated land produces 40 per cent of the world’s food and, as populations grow, a significant proportion of this water will need to be transferred to urban, commercial and industrial uses.
119

Towards a green economy
1 Introduction
1 1 The aim of this chapter
This chapter has three broad aims. First, it highlights the importance of providing all households with sufficient and affordable access to clean water supplies as well as adequate sanitation.
Second, it makes a case for early investment in water management and infrastructure, including ecological infrastructure. The potential to make greater use of biodiversity and ecosystem services in reducing water treatment costs and increasing productivity is emphasised.
Third, the chapter provides guidance on the suite of governance arrangements and policy reforms, which, if implemented, can sustain and increase the benefits associated with making such a transition.
1 2 Scope and definition
The scope of this chapter is restricted to freshwater ecosystems, the water supply and sanitation1 sectors and the government and market processes that influence how and where this water is used.
The crucial contribution water makes to agriculture, fisheries, forestry, energy and industrial production is discussed in other chapters.
The perspective offered in this chapter is one that looks forward 20 years to 2030 and, where possible, to 2050. During the next 20 years, a considerable rise in demand for water of sufficient quantity and quality is expected and changes in local supply conditions are forecast.
The chapter builds on a substantial body of work undertaken in recent years by organisations and committees concerned about the way water resources are being managed.2 To assist with its preparation, 11 background papers were prepared. References to these papers are marked in bold.
Structure of the chapterThis chapter identifies the contribution that water can play in assisting a transition to a green economy. We first present a vision of the role that water ecosystems can play in the transition to a green economy and then provide an overview of the world’s water resources and the services offered by the water supply and sanitation sector. After highlighting some of the more unique characteristics of water, challenges and opportunities to make better use of water and water dependent ecosystems are identified. Building on this knowledge base, the benefits of investing in the water supply and sanitation sector as a means to assist with a transition to a green economy are quantified. The chapter closes by identifying institutional reforms, which, if implemented, would increase the returns from a commitment to a transition to a green economy.
1 3 Water in a green economy – A vision
As stressed in earlier chapters, in a green economy there is emphasis on the pursuit of opportunities to invest in sectors that rely upon and use natural resources and ecosystem services. At the same time, there is a transition to a suite of policy and administrative arrangements that neither degrade the environment nor impose costs on others. The interests of future generations are considered carefully. In the case of water, many of the potential gains are achieved simply by deciding to invest in the provision of water and sanitation services. Where water is scarce, this scarcity is acknowledged and managed carefully. Progress towards the pursuit of green objectives can be accelerated through the redesign of governance arrangements, the improved specification of property
1. The World Health Organisation defines “sanitation” as “the provision of facilities and services for the safe disposal of human urine and faeces. Inadequate sanitation is a major cause of disease world-wide and improving sanitation is known to have a significant beneficial impact on health both in households and across communities. The word ‘sanitation’ also refers to the maintenance of hygienic conditions, through services such as garbage collection and wastewater disposal.” http://www.who.int/topics/sanitation/en/
2. The recommendations developed in this chapter have been significantly influenced by the:
• Development of the Dublin principles in 1992 which observes that “Water has an economic value in all its competing uses and should be recognized as an economic good” (Global Water Partnership 1992);
• Camdessus Report on financing water infrastructure that called for drastic improvements in accountability, transparency and capacity-building in the public utility sector coupled with a doubling of funding for the sector (Winpenny 2003);
• Guria Task Force Report on “Financing water for all” which recommends a transition to full cost recovery, the phasing out of subsidies and the devolution of responsibility for water supply and treatment to local government and municipalities (Guria 2006);
• World Commission on Dams (2000) which warned of the need to carefully assess the costs and likely benefits of major infrastructure investments;
• World Health Organization's various reports on global water supply and sanitation; and
• 2030 Water Resources Group’s report (2009) on ways to avoid water crises.
120

Water
rights, the adoption of policies that reflect the full costs of use including the costs of adverse impacts on the environment, and through improved regulation. Use is kept within sustainable limits.
In green economies, the role of water in both maintaining biodiversity and ecosystem services and in providing water is recognised, valued and paid for. The use of technologies that encourage efficient forms of recycling and reuse is encouraged.
1 4 Measuring progress towards a green economy
In many countries, there is a lack of reliable data on the water-storage capacities of river basins, the condition of built infrastructure and the performance of the water supply and sanitation sector. One of the more significant opportunities to improve investment and management is to assemble data in a manner that enables the performance of one region to be accurately compared with other regions.
Signposts of success in terms of progress towards a greener set of economic arrangements include:
■ Evidence of increased investment in the water supply and sanitation sector that gives consideration to the environment;
■ The formal definition of rights to use water and its allocation to users and the environment;
■ Legislative recognition of the important role that ecosystem services can play in supporting an economy;
■ Investment in the development of institutional capacity to manage ecosystems, including water, on a sustainable basis or using an ecosystem approach;
■ The removal of policies that discourage ecosystem conservation and/or have perverse effects on water use and investment;
■ Progress towards arrangements that reflect the full costs of resource use in ways that do not compromise the needs of disadvantaged people in a community; and
■ Addressing ecosystem degradation by increasing efforts for restoring and protecting ecosystems critical to supply of water quantity and quality.
Indicators to be tracked include data on:
■ The number of people without access to reliable supplies of clean water and adequate sanitation;
■ The volume of water available per person in a region;
■ The efficiency of water supply in the urban sector and water use;
■ The efficiency of water use in the agricultural and industrial sectors; and
■ The “water footprint” of companies and countries.
36%Ocean
Rainfall(thousands
of cubickilometresper year)
110100%
Bioenergyforest
productsgrazing lands
biodiversity
Landscape56% Crops
livestock
Rainfed agriculture
45%
Water storageaquatic biodiversity
�sheries
Openwater
evaporation1.3%
Cropslivestock
aquaculture
Irrigatedagriculture
0.6% 1.4%
Cities andindustries
0.1%
Blue waterGreen water
RiversWetlandsLakesGroundwater
Bluewater
Soilmoisturefrom rain
Greenwater
Figure 1: “Green water” refers to rainwater stored in the soil or on vegetation, which cannot be diverted to a different use “Blue water” is surface and groundwater, which can be stored and diverted for a specific purposeSource: after Molden (2007)
121
Towards a green economy
1 5 The world’s water resources
Access to the world’s water resources is heavily dependent upon the nature of the water cycle. While a massive amount of water reaches the earth’s land surface, much less, around 40 per cent, makes its way into creeks, rivers, aquifers, wetlands, lakes and reservoirs, before cycling back into the atmosphere (see Figure 1). Of the water that is extracted for human purposes, on average, approximately:
■ 70 per cent is used for agricultural purposes;
■ 20 per cent is used by industry (including power generation); and
■ 10 per cent is used for direct human consumption.
Given that the vast majority of usable fresh water is channelled towards agriculture, any global consideration of water allocation must consider the factors that determine the efficiency of water use in the sector. Irrigated land produces around 40 per cent of the world’s
food (Hansen and Bhatia 2004; Tropp 2010). One of the biggest challenges facing water managers is to find a way to significantly increase the productivity of irrigated agriculture so that water can be transferred to other sectors without adversely affecting the environment or food security. In many parts of the world there are few opportunities to enhance supplies at reasonable cost.
But general observations can be misleading. No two water bodies are the same. Managing large, complex, trans-boundary water systems typically requires a different approach to overseeing smaller water systems, where local issues are often all that need to be considered. In developing countries, water management and investment is typically geared towards ways of reducing poverty and enabling economic development, while the priority for developed nations tends to be maintaining infrastructure and supplying access to water at reasonable cost. Demand and supply also vary greatly. In Singapore, for example, almost all water is extracted for urban and industrial purposes, while in many other parts of the world, the majority of water is extracted for agricultural or mining purposes (Cosgrove and Rijsberman 2000).
122

Water
2 Water: a unique natural resourceUnlike most other natural resources, water flows readily across and through landscapes in complex ways that affect its availability and opportunities to manage it. Understanding these water flows is critical to the design of investment programmes and policies necessary to support a transition to a green economy.
2 1 Services from natural infrastructure
Water makes an irreplaceable contribution to ecosystem services that stem from the earth’s “natural capital”. Protecting the natural ecosystems of river basins and restoring degraded catchment areas is crucial to securing the world’s water supplies, maintaining their quality, regulating floods and mitigating climate change (Khan 2010; TEEB 2008, 2009a, b, c). The role of other ecosystems, such as forests, wetlands and floodplains in providing access to water also needs to be recognised and quantified – gauging the true value that these ecosystems provide is a key part of charting a course to a green economy.
Recent analysis is showing a close global correlation between the threats to biodiversity and threats to water security. As shown in Figure 2, regions where
water security is high but the threat to biodiversity is low are rare. When the threat to water security is high, usually the threat to biodiversity is high. This suggests that there may be considerable opportunities for governments to improve biodiversity outcomes by investing in water security (Vörösmarty et al. 2010). Water-dependant ecosystems also play an important role in the provision of cultural benefits (Millennium Ecosystem Assessment 2005).
2 2 Water accounting
As water flows through and across land, it is used and reused. This makes information about water difficult to assemble and use for management. When, for example, a policy promotes a more efficient irrigation system, it is critical to decide whether or not the “savings” are to be used to expand irrigation or returned back to the river or aquifer from which the water was taken (Molden 1997). Gains in one area can be associated with losses in another area. When the savings are not returned back to the river or aquifer, the result can be a significant reduction in the quantity of water available to the environment and to other users (Independent Evaluation Group 2010).
Biodiversity threatLow High
Hum
an w
ater
secu
rity
thre
at
Hig
hLo
w
Figure 2: Prevailing patterns of threat to human water security and biodiversity Adjusted human water security threat is contrasted against incident biodiversity threat A breakpoint of 0 5 delineates low from high threatSource: Vörösmarty et al. (2010)
123
Towards a green economy
Geothermal steam - CL Tower
5.300Litres per MegaWatt/hour
Average value
Minimum value
Maximum value
2.000
350
Solar troughCL Tower
NuclearCL Pond
NuclearCL Tower
Fossil, biomass or waste - CL Tower
Fossil, biomass or waste - CL Pond
NuclearOL Cooling
Fossil, biomass or waste - OL Cooling
Coal IGCCCL Tower
Natural gasCL Tower
Natural gasOL Cooling
Notes:OL - Open Loop coolingCL - Closed Loop coolingCC - Combined CycleIGCC - Integrated Gasi�cation Combined-Cycle
Another common water accounting error is to assume that ground and surface water systems are not connected to one another and to administer them separately. Many rivers play an important role in replenishing aquifers, while aquifers can provide much of a river’s base flow (Evans 2007). Failing to account for these interactions can result in the serious problems of over-use and degradation. One administrative solution is to reverse the onus of proof and require managers to assume that ground and surface water resources are linked and manage them as a single connected resource until such time as disconnection can be shown (NWC 2009).
Land-use changes can have similar effects on the volume of water available for use. Whenever someone establishes a plantation forest, terraces a hillside, constructs a farm dam, etc., typically run-off is reduced and, as a result, the quantity of water available for extraction from a river or aquifer is less than it otherwise would be. Accounting for water in a way that is consistent with the hydrological cycle and that avoids double counting of its potential to contribute is critical to developing the robust allocation and management systems that underpin a green economy (Young and McColl 2008).
2 3 Water and energy
The interdependence of water and energy demands also needs careful attention as arrangements are put in place for a transition to a green economy. There are at least two dimensions to this relationship.
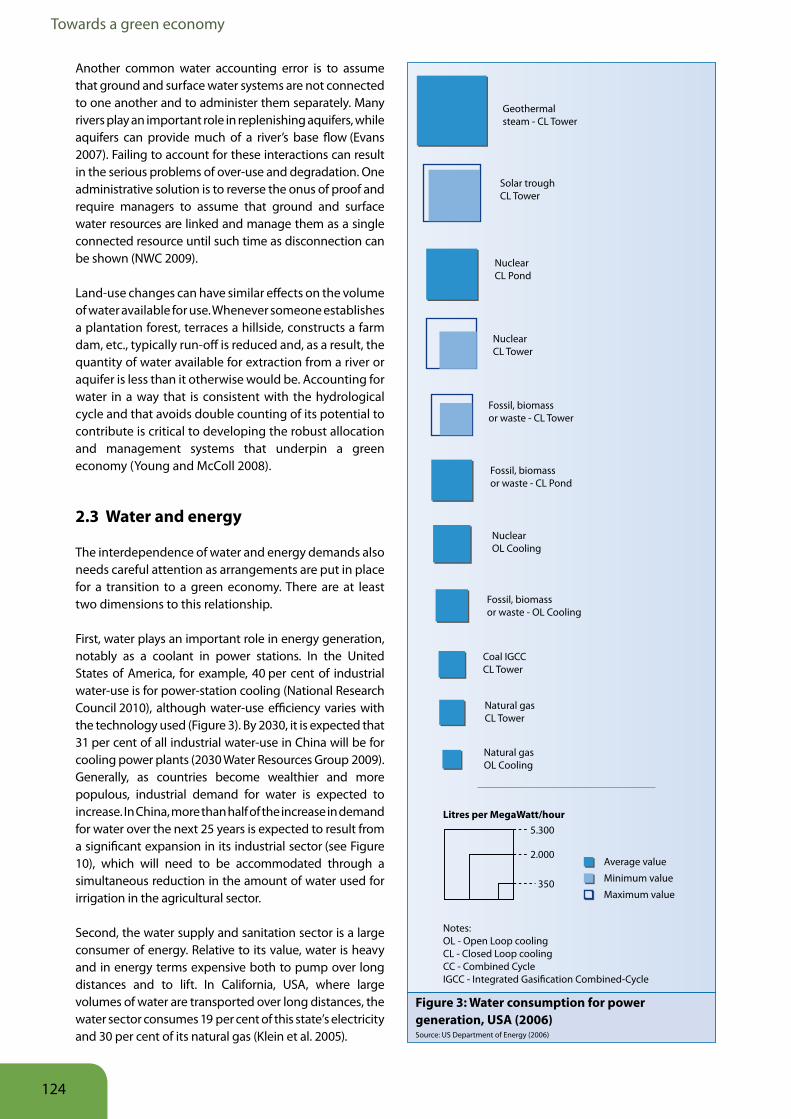
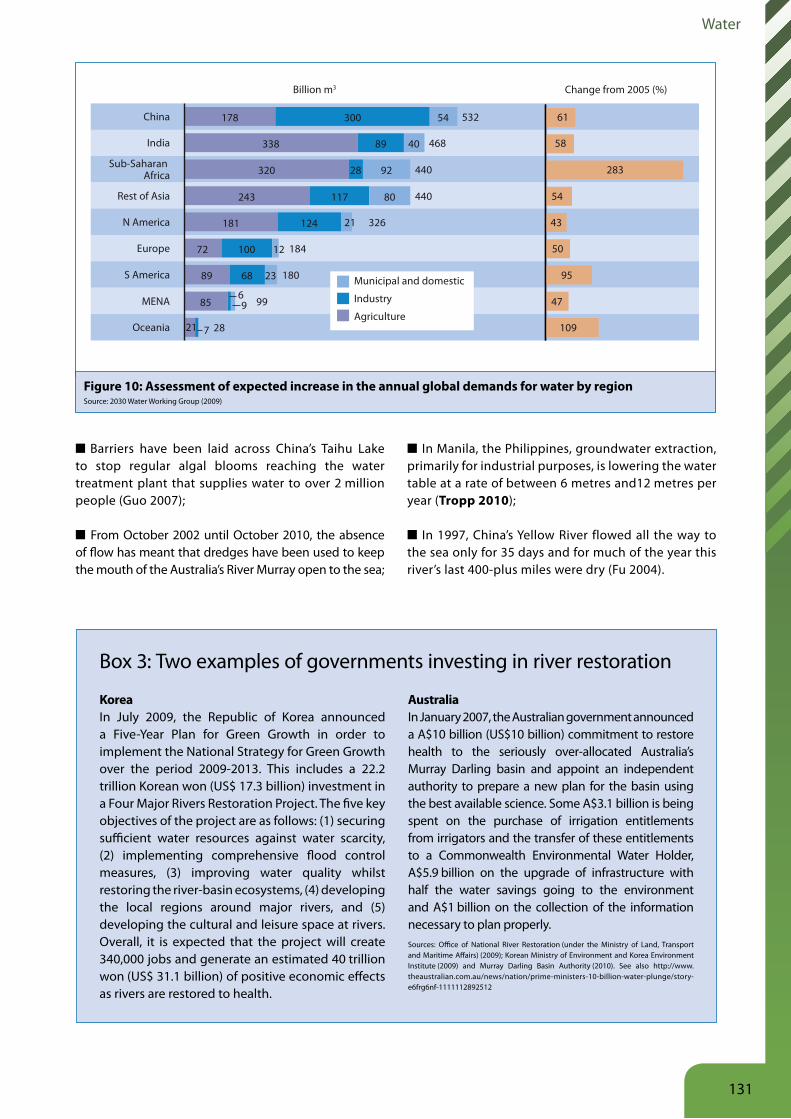
First, water plays an important role in energy generation, notably as a coolant in power stations. In the United States of America, for example, 40 per cent of industrial water-use is for power-station cooling (National Research Council 2010), although water-use efficiency varies with the technology used (Figure 3). By 2030, it is expected that 31 per cent of all industrial water-use in China will be for cooling power plants (2030 Water Resources Group 2009). Generally, as countries become wealthier and more populous, industrial demand for water is expected to increase. In China, more than half of the increase in demand for water over the next 25 years is expected to result from a significant expansion in its industrial sector (see Figure 10), which will need to be accommodated through a simultaneous reduction in the amount of water used for irrigation in the agricultural sector.
Second, the water supply and sanitation sector is a large consumer of energy. Relative to its value, water is heavy and in energy terms expensive both to pump over long distances and to lift. In California, USA, where large volumes of water are transported over long distances, the water sector consumes 19 per cent of this state’s electricity and 30 per cent of its natural gas (Klein et al. 2005).
Figure 3: Water consumption for power generation, USA (2006)Source: US Department of Energy (2006)
124

Water
In developed countries, the relatively high energy costs of pumping and treating water for household, industrial or mining purposes are broadly accepted. In developing countries, great care must be taken to ensure that water treatment and distribution systems remain affordable. The relatively modest financial returns from food production in both developed and developing countries means it rarely pays to pump water over long distances for agricultural purposes. In recognition of this, Saudi Arabia has recently shifted its food security policy from one that subsidises water use at home to one that invests in the development of agriculture in other countries where water supplies are more abundant. This is enabling Saudi Arabia to access food at more affordable prices and use the revenue saved for other, more sustainable, purposes (Lippman 2010).
Appreciation of the nexus between water and energy highlights a set of green investment opportunities that are starting to emerge. In Durham, Canada, for example, a water efficiency field trial3 was able to reduce water use by 22 per cent, electricity by 13 per cent and gas by 9 per cent with a resultant annual reduction in CO2 emissions of 1.2 tonnes per household – an 11 per cent reduction (Veritec Consulting 2008).
3. The field trial took a sample of 175 households in the region of Durham, east of Toronto. The sample homes were given upgrades in efficient clothes washers, dishwashers, toilets, showerheads, fridges, and landscape packages to quantify the potential water, energy, gas, and CO2 savings from efficient fixtures, appliances, and landscape design. To control and measure demand for each of the resources, sub-meters and data loggers were installed on fixtures and appliances within the home. The savings in resources could be attributed to both efficient fixtures and appliances and efficient water and energy use habits of the homeowners. The annual utility cost savings are expected to be more than US$200 a year, which allows recovery of the additional installation cost in 3.4 years.
125

Towards a green economy
3 Challenges and opportunitiesThis section identifies the challenges associated with water scarcity and declining water quality in many parts of the world and it outlines opportunities for societies to more efficiently manage their water resources and make the transition to a green economy and, in so doing, achieve the Millennium Development Goals.
3 1 Challenges
Poverty, access to clean water and adequate sanitation servicesNearly 1 billion people lack access to clean drinking water and 2.6 billion lack access to improved sanitation services (WHO/UNICEF 2010). As a direct result, every year, 1.4 million children4 under five die as a result of lack of access to clean water and adequate sanitation services (UNICEF 2004). In east Nigeria and north
4. 3,900 children per day.
Box 1: Economic impacts of poor sanitation
Cambodia, Indonesia, the Philippines and Vietnam lose an estimated US$9 billion a year because of poor sanitation (based on 2005 prices). This amounts to around 2 per cent of their combined GDP, varying from 1.3 per cent in Vietnam, 1.5 per cent in the Philippines, 2.3 per cent in Indonesia and 7.2 per cent in Cambodia.
The annual economic impact of inadequate sanitation is approximately US$6.3 billion in Indonesia, US$1.4 billion in the Philippines, US$780 million in Vietnam and US$450 million in Cambodia. In these four countries, the total value of this impact is US$8.9 billion per year.
In 1991, a cholera epidemic swept through most of Peru5 and cost US$1 billion to control. If one tenth of this amount (US$100 million) had been spent on the provision of sanitation services the epidemic would not have occurred.
Source: World Bank – Water and Sanitation Program (2008) and Tropp (2010)
5. The epidemic also spread into several other countries in South, Central and North America
Cameroon, every 1 per cent increase in use of unprotected water sources for drinking purposes is directly associated with a 0.16 per cent increase in child mortality (Ward et al 2010).
Gleick (2004, 2009) argues that failure to provide people with affordable and reliable access to water and sanitation services is one of humankind’s greatest failings. Lack of sanitation makes people sick. When water is unclean, water-borne diseases such as diarrhoea and water-washed diseases including scabies and trachoma are common (Bradley 1974). Diarrhoea is the third most common cause of child mortality in West Africa after malaria and respiratory infections (ECOWAS-SWAC/OECD 2008). New water-borne diseases such as the Whipple disease are still emerging (Fenollar et al. 2009).
The adverse impacts of water-borne disease on an economy can be large (Box 1). When people are sick, they cannot work and, among other things, considerable expenditure on medical treatment is needed.
The adverse impacts of inadequate access to clean water, however, do not stop with water-borne disease. When water is not on tap, people (mainly women and children) must either spend a large amount of time fetching water or pay high prices for it to be carted to them. In Western Jakarta, Indonesia, the cost of water purchased from a water cart is ten to fifty times the full cost to a water utility of establishing a reliable mains water supply (Fournier et al 2010). In circumstances, the challenge is to find a way to convince governments and private investors to go ahead when there is a widespread perception that poor people are not able to pay for water (services) and that it is not cost-efficient to supply water to informal settlements. A lack of easy access to clean water also erodes the capacity of the poorest to engage in other activities. When children, for example, spend a large proportion of their days fetching water, they have less opportunity to attend school and gain the education necessary to escape from poverty. When women are forced to spend time carting water they have little opportunity for gainful employment elsewhere. More than a quarter of the population of East Africa live in conditions where every trip to collect water takes more than half an hour (WHO/UNICEF 2010).
From a government perspective, when water supply and sanitation services are inadequate, large amounts of revenue are spent dealing with the impacts of disease rather than generating wealth (Tropp 2010).
126

Water
Box 2: Millennium Development Goals and water
In 2000, governments committed to a wide range of Millennium Development Goals (MDG) that rely upon access to water and made a specific commitment to halve the number of people without access to clean water and adequate sanitation by 2015.
The 2010 update on progress towards the water specific goals reports that 884 million – nearly 1 billion people – lack access to clean drinking water. When it comes to sanitation, 2.6 billion people do not have access to improved sanitation services. One in seven of those people without access to adequate sanitation services live in rural areas (WHO/UNICEF 2010).
At the current rate of investment progress, the Millennium Development Goals for sanitation will be missed by 1 billion people (Figure 4). Most of these people live in sub-Saharan Africa and Asia (Figure 5).
Significant progress has been made in India and China (WHO/UNICEF 2010).
Figure 5: Progress towards attainment of the Millennium Development Goals’ sanitation target to half the number of people without adequate sanitation by 2015Source: WHO/UNICEF (2010)
50
45
40
35
30
25
15
10
5
0
46 4542 40 39 (2008)
36 (projected)
23 (target)
Population without improved sanitation
%
1.7
billi
on1
billi
on
1990 1995 2000 2005 2010 2015
Progress towards MDG target
On track
Progress but insu�cient
Not on track
No or insu�cient data
Figure 4: Global progress towards Millennium Development Goals’ target to reduce the number of people without access to adequate sanitation services to 1 7 billion people by 2015 Source: WHO/UNICEF (2010)
127

Towards a green economy
In recognition of these fundamental and pressing challenges, governments have committed collectively to a set of Millennium Development Goals, which, among other things, aim to halve the number of people without access to clean water and adequate sanitation services by 2015 (Box 2). By providing access to clean water and adequate sanitation services at an affordable price people can begin to save, invest and take a longer-term view of their future. A transition to greener approaches to resource use and investment becomes possible.
Water scarcityExploring opportunities to invest in the construction of dams, the International Water Management Institute (IWMI) has identified two types of water scarcity: physical scarcity and economic scarcity (Figure 6). In regions where there is physical scarcity, the sustainable supply limit has been reached and little opportunity to construct more dams remains. In
regions where the scarcity is economic, however, it is possible to increase supplies if the financial resources necessary to build a new dam can be found. IWMI is of the view that economic scarcity is widespread in sub-Saharan Africa and in parts of South and South-East Asia (Molden 2007).
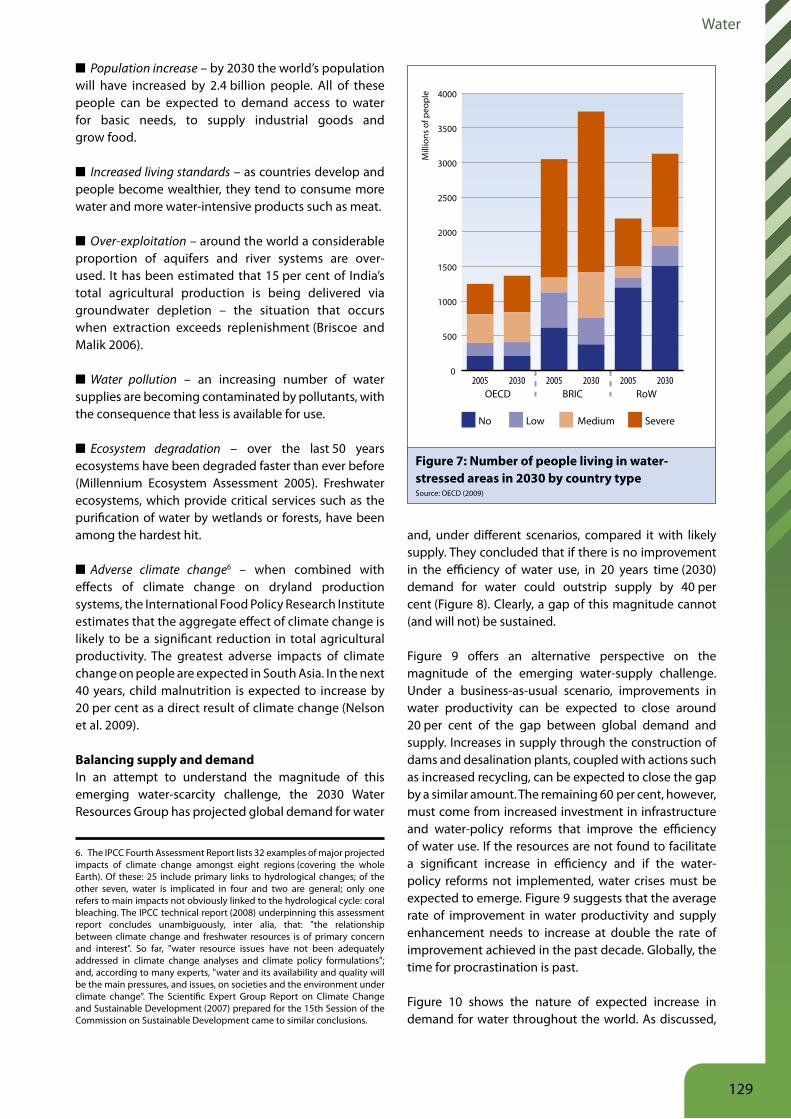
There is general consensus that when people have access to less than 1,700 cubic meters of water per year, a considerable proportion of them will be trapped in poverty (Falkenmark et al. 1989). Taking a different approach, the Organisation for Economic Cooperation and Development (OECD) defines water stress as “severe” when the ratio of total water use to renewable supply exceeds 40 per cent (OECD 2009). Using this measure, the OECD has estimated that by 2030 nearly half the world’s population (3.9 billion people) will be living under conditions of severe water stress (Figure 7). The reasons for the emergence of this scarcity include:
Physical water scarcity
Approaching physical water scarcity
Economic water scarcity
Little or no water scarcity Not estimated
De�nitions and indicatorsLittle or no water scarcity. Abundant water resources relative to use, with less than 25% of water from rivers withdrawn for human purposes. Physical water scarcity (water resources development is approaching or has exceeded sustainable limits). More than 75% of river �ows are withdrawn for agriculture, industry, and domestic purposes (accounting for recycling of return �ows). This de�nition – relating water availability to water demand – implies that dry areas are not necessarily water scarce.Approaching physical water scarcity. More than 60% of river �ows are withdrawn. These basins will experience physical water scarcity in the near future.Economic water scarcity (human, institutional, and �nancial capital limit access to water even though water in nature is available locally to meet human demands). Water resources are abundant relative to water use, with less than 25% of water from rivers withdrawn for human purposes, but malnutrition exists.
••
•
•
Figure 6: Areas of physical and economic water scarcitySource: Molden (2007)
128
Water
■ Population increase – by 2030 the world’s population will have increased by 2.4 billion people. All of these people can be expected to demand access to water for basic needs, to supply industrial goods and grow food.
■ Increased living standards – as countries develop and people become wealthier, they tend to consume more water and more water-intensive products such as meat.
■ Over-exploitation – around the world a considerable proportion of aquifers and river systems are over-used. It has been estimated that 15 per cent of India’s total agricultural production is being delivered via groundwater depletion – the situation that occurs when extraction exceeds replenishment (Briscoe and Malik 2006).
■ Water pollution – an increasing number of water supplies are becoming contaminated by pollutants, with the consequence that less is available for use.
■ Ecosystem degradation – over the last 50 years ecosystems have been degraded faster than ever before (Millennium Ecosystem Assessment 2005). Freshwater ecosystems, which provide critical services such as the purification of water by wetlands or forests, have been among the hardest hit.
■ Adverse climate change6 – when combined with effects of climate change on dryland production systems, the International Food Policy Research Institute estimates that the aggregate effect of climate change is likely to be a significant reduction in total agricultural productivity. The greatest adverse impacts of climate change on people are expected in South Asia. In the next 40 years, child malnutrition is expected to increase by 20 per cent as a direct result of climate change (Nelson et al. 2009).
Balancing supply and demandIn an attempt to understand the magnitude of this emerging water-scarcity challenge, the 2030 Water Resources Group has projected global demand for water
6. The IPCC Fourth Assessment Report lists 32 examples of major projected impacts of climate change amongst eight regions (covering the whole Earth). Of these: 25 include primary links to hydrological changes; of the other seven, water is implicated in four and two are general; only one refers to main impacts not obviously linked to the hydrological cycle: coral bleaching. The IPCC technical report (2008) underpinning this assessment report concludes unambiguously, inter alia, that: "the relationship between climate change and freshwater resources is of primary concern and interest". So far, "water resource issues have not been adequately addressed in climate change analyses and climate policy formulations"; and, according to many experts, "water and its availability and quality will be the main pressures, and issues, on societies and the environment under climate change". The Scientific Expert Group Report on Climate Change and Sustainable Development (2007) prepared for the 15th Session of the Commission on Sustainable Development came to similar conclusions.
and, under different scenarios, compared it with likely supply. They concluded that if there is no improvement in the efficiency of water use, in 20 years time (2030) demand for water could outstrip supply by 40 per cent (Figure 8). Clearly, a gap of this magnitude cannot (and will not) be sustained.
Figure 9 offers an alternative perspective on the magnitude of the emerging water-supply challenge. Under a business-as-usual scenario, improvements in water productivity can be expected to close around 20 per cent of the gap between global demand and supply. Increases in supply through the construction of dams and desalination plants, coupled with actions such as increased recycling, can be expected to close the gap by a similar amount. The remaining 60 per cent, however, must come from increased investment in infrastructure and water-policy reforms that improve the efficiency of water use. If the resources are not found to facilitate a significant increase in efficiency and if the water-policy reforms not implemented, water crises must be expected to emerge. Figure 9 suggests that the average rate of improvement in water productivity and supply enhancement needs to increase at double the rate of improvement achieved in the past decade. Globally, the time for procrastination is past.
Figure 10 shows the nature of expected increase in demand for water throughout the world. As discussed,
0
500
1000
1500
2000
2500
3000
3500
4000
SevereMediumLowNo
203020052030200520302005
Mill
ions
of p
eopl
e
RoWOECD BRIC
Figure 7: Number of people living in water-stressed areas in 2030 by country typeSource: OECD (2009)
129

Towards a green economy
one of the more significant challenges is to find ways to supply more water to the industrial sector while increasing agricultural production. Significant transfers of water from rural areas to the industrial sector can be expected, especially in China and in North America (2030 Working Group 2009). In anticipation of the pressure that these shortages will place on water-dependent business, a number of large companies are beginning to quantify their water footprint and the nature of the water-related risks they face (Lloyds 2010; United Nations 2010a).
3 2 Opportunities
Investing in biodiversity and ecosystem servicesIn terms of ecosystem health and function, global assessments of the health of the world’s water river systems and aquifers suggest that the aggregate trend is one of decline (Millennium Ecosystem Assessment Report 2005; WWF’s Living Planet Report 2010; the UN World Water Development Report 2010). Examples of this decline include:
Basins withsurplus
Municipal &domestic
6,900
Basins withde�cits
Agriculture
Industry
Existing accessible, reliable, sustainable supply1
4,500
Existing withdrawals2
2030withdrawals3
Surface water
Billi
on m
3 , 154
bas
ins/
regi
ons
3,100
4,5003,500
800
1,500
900
600
2,800
1004,200
Groundwater700
-40%CAGR2%
Aggregated global gap between existing accessible, reliable supply1 and 2030 water withdrawals, assuming no e�ciency gains
Relevant supply quantity is much lower
than the absolute renewable water
availability in nature
1 Existing supply which can be provided at 90% reliability, based on historical hydrology and infrastructure investments scheduled through 2010; net of environmental requirements
2 Based on 2010 agricultural production analyses from IFPRI
3 Based on GDP, population projections and agricultural production projections from IFPRI; considers no water productivity gains between 2005-2030
Figure 8: Aggregated global gap between existing accessible, reliable supply and 2030 water withdrawals, assuming no efficiency gainsSource: 2030 Water Resources Group (2009)Business-as-usual approaches will not meet demand for raw water
Billion m3
Historical improvementsin water productivity1
Remaining gap
Increase in supply2 underbusiness-as-usual
Portion of gapPercent
20%
60%
20%
Existing accessible, reliable supply3
Demand with no productivityimprovements
Today2
6,000
5,000
3,000
8,000
7,000
2030
1 Based on historical agricultural yield growth rates from 1990-2004 from FAOSTAT, agricultural and industrial e�ciency improvements from IFPRI2 Total increased capture of raw water through infrastructure buildout, excluding unsustainable extraction3 Supply shown at 90% reliability and includes infrastructure investments scheduled and funded through 2010. Current 90%-reliable supply does not meet average demand
Figure 9: Projection of the global demand for water and, under a business-as-usual scenario, the amount that can be expected to be met from supply augmentation and improvements in technical water use efficiency (productivity)Source: 2030 Water Resources Group (2009)
130
Water
■ Barriers have been laid across China’s Taihu Lake to stop regular algal blooms reaching the water treatment plant that supplies water to over 2 million people (Guo 2007);
■ From October 2002 until October 2010, the absence of flow has meant that dredges have been used to keep the mouth of the Australia’s River Murray open to the sea;
■ In Manila, the Philippines, groundwater extraction, primarily for industrial purposes, is lowering the water table at a rate of between 6 metres and12 metres per year (Tropp 2010);
■ In 1997, China’s Yellow River flowed all the way to the sea only for 35 days and for much of the year this river’s last 400-plus miles were dry (Fu 2004).
Billion m3
Oceania 28
MENA 99
S America 180
Europe 184
N America 326
Rest of Asia 440
Sub-Saharan Africa 440
India 468
China 532
Change from 2005 (%)
61
58
283
54
43
50
95
47
109
Municipal and domestic
Industry
Agriculture9
178
338
320
243
181
72
300
89
28
117
124
100
68
54
40
92
80
2389
85
721
21
6
12
Figure 10: Assessment of expected increase in the annual global demands for water by regionSource: 2030 Water Working Group (2009)
Box 3: Two examples of governments investing in river restoration
KoreaIn July 2009, the Republic of Korea announced a Five-Year Plan for Green Growth in order to implement the National Strategy for Green Growth over the period 2009-2013. This includes a 22.2 trillion Korean won (US$ 17.3 billion) investment in a Four Major Rivers Restoration Project. The five key objectives of the project are as follows: (1) securing sufficient water resources against water scarcity, (2) implementing comprehensive flood control measures, (3) improving water quality whilst restoring the river-basin eco systems, (4) developing the local regions around major rivers, and (5) developing the cultural and leisure space at rivers. Overall, it is expected that the project will create 340,000 jobs and generate an estimated 40 trillion won (US$ 31.1 billion) of positive economic effects as rivers are restored to health.
AustraliaIn January 2007, the Australian government announced a A$10 billion (US$10 billion) commitment to restore health to the seriously over-allocated Australia’s Murray Darling basin and appoint an independent authority to prepare a new plan for the basin using the best available science. Some A$3.1 billion is being spent on the purchase of irrigation entitlements from irrigators and the transfer of these entitlements to a Commonwealth Environmental Water Holder, A$5.9 billion on the upgrade of infrastructure with half the water savings going to the environment and A$1 billion on the collection of the information necessary to plan properly.Sources: Office of National River Restoration (under the Ministry of Land, Transport and Maritime Affairs) (2009); Korean Ministry of Environment and Korea Environment Institute (2009) and Murray Darling Basin Authority (2010). See also http://www.theaustralian.com.au/news/nation/prime-ministers-10-billion-water-plunge/story-e6frg6nf-1111112892512
131

Towards a green economy
There is a new recognition of the positive synergy that emerges between healthy environments and healthy communities. As documented by Le Quesne et al. (2010), some countries are now investing large amounts of money in the restoration of degraded river systems and the development of policies and administrative arrangements designed to prevent degradation of these systems. Two examples are summarised in Box 3. Table 1 summarises the general nature of returns to investment in the restoration of ecosystems. When astute investments in the restoration of ecosystems are made, internal rates of return in excess of 10 per cent are attainable.
Investment in sanitation and drinking water supplyIn many developing countries, one of the biggest opportunities to expedite a transition to a green economy is to invest in the provision of water and sanitation services to the poor.
A recent estimate puts the cost of achieving the 2015 Millennium Development Goals (MDG) at US$142 billion per year for providing sanitation services and US$42 billion per year for drinking water supply to households (Hutton and Bartram 2008b). More investment is required for sanitation services than drinking water as the number of households without access to adequate sanitation services is much higher (WHO/UNICEF 2010; Tropp 2010).
Although the amount of money needed to attain the Millennium Development Goals for water is considerable, when spread over a number of years and divided by the number of people expected to benefit from such expenditure, the investment case is strong. In Ghana, for example, the OECD estimates that investment of US$7.40 per person per year over a decade would enable the country to meet its MDG target (Sanctuary and Tropp 2005). Estimates of the required per capita expenditure in Bangladesh, Cambodia, Tanzania and Uganda range from US$4 to US$7 per capita per year (UN Millennium Project 2004; Tropp 2010).
Taking a different approach, Grey (2004) has estimated the amount that each sub-Saharan country would
need to spend to achieve water supply and sanitation standards now achieved in South Africa. Depending upon the country, the amount needed to be spent varied from US$15 to $70 per capita per year over the ten years from 2005 to 2015.
As shown later in this chapter, returns to investment in the provision of these services can be high. In particular, Sachs (2001) has found that the average rate of economic growth in developing countries where most of the poor have affordable access to clean water and adequate sanitation is 2.7 per cent greater than that attained in countries where these services are not well supplied.7 This observation, reinforced by background papers prepared for this chapter
(Tropp 2010; Ward et al 2010), suggests that failure to invest adequately in the provision of affordable access to clean water and adequate sanitation acts as a barrier to development and that early investment in these areas is a necessary precondition to progress. Grey and Sadoff (2007) argue that a minimum amount of investment in water infrastructure is a necessary precondition to development and using a range of case studies identify a close association between adequate investment in infrastructure and environmental degradation.
Investing in smaller, local water-supply systemsAs observed by Schreiner et al (2010), the presence of economic water scarcity should not be interpreted as a recommendation for the construction of large dams. In many cases, greater returns can be achieved from the construction of smaller storages that are built by and serve local communities. At this scale, community engagement and management of infrastructure is easier and adverse environmental impacts tend to be fewer in both urban and rural settings (Winpenny 2003).
7. Sachs (2001) estimated that the rate of growth in GDP per capita in countries where most of the poor had access to clean water and adequate sanitation services was 3.7 per cent. When these services are not available, however, he found that the average annual rate of growth in GDP per capita was 1.0 per cent.
Table 1: Examples of the estimated costs and benefits of restoration projects in different biomesSource: Adapted from TEEB (2009a)
Biome/ecosystem Typical cost of restoration(high-cost scenario)
Estimated annual benefits from restoration
(avg. cost scenario)
Net present value of benefits over
40 years
Internal rate of return
Benefit/costratio
US$/ha US$/ha % Ratio
Coastal 232,700 73,900 935,400 11% 4.4
Mangroves 2,880 4,290 86,900 40% 26.4
Inland wetlands 33,000 14,200 171,300 12% 5.4
Lake/rivers 4,000 3,800 69,700 27% 15.5
132
Water
In China’s Gansu province, for example, investment in the collection of local rainwater at a cost of US$12 per capita was sufficient to enable a significant upgrade of domestic water supplies and to supplement irrigation. One project benefited almost 200,000 households (Gould 1999). At the micro-scale, it is possible to make much greater use of aid
organisations and local knowledge. In Western Jakarta, for example, the local water utility is working with non-government organisations to provide water to people in informal settlements in a manner that would be impossible for a government utility to do without being seen to sanction the presence of these settlements (see Box 4).
Box 4: Micro-scale infrastructure provision in Western Jakarta
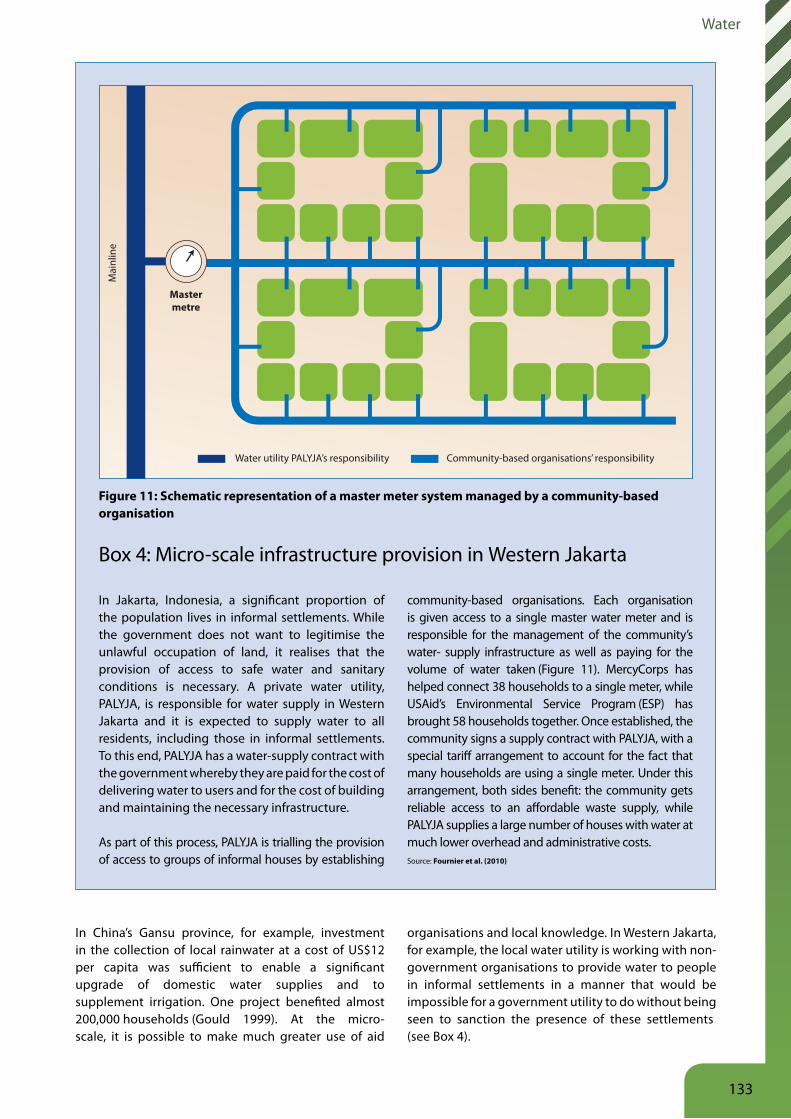
In Jakarta, Indonesia, a significant proportion of the population lives in informal settlements. While the government does not want to legitimise the unlawful occupation of land, it realises that the provision of access to safe water and sanitary conditions is necessary. A private water utility, PALYJA, is responsible for water supply in Western Jakarta and it is expected to supply water to all residents, including those in informal settlements. To this end, PALYJA has a water-supply contract with the government whereby they are paid for the cost of delivering water to users and for the cost of building and maintaining the necessary infrastructure.
As part of this process, PALYJA is trialling the provision of access to groups of informal houses by establishing
community-based organisations. Each organisation is given access to a single master water meter and is responsible for the management of the community’s water- supply infrastructure as well as paying for the volume of water taken (Figure 11). MercyCorps has helped connect 38 households to a single meter, while USAid’s Environmental Service Program (ESP) has brought 58 households together. Once established, the community signs a supply contract with PALYJA, with a special tariff arrangement to account for the fact that many households are using a single meter. Under this arrangement, both sides benefit: the community gets reliable access to an affordable waste supply, while PALYJA supplies a large number of houses with water at much lower overhead and administrative costs. Source: Fournier et al (2010)
Mastermetre
Mai
nlin
e
Community-based organisations’ responsibility Water utility PALYJA’s responsibility
Figure 11: Schematic representation of a master meter system managed by a community-based organisation
133

Towards a green economy
Accessing new (non-traditional) sources of waterOne of the most common approaches to resolving water-supply problems is to build a large dam. Constructing them typically involves significant cost, the dislocation of many people and many adverse environmental problems. Schreiner et al (2010) observe that urban communities have historically relied on large dams for their water supplies. More recently, however, water-supply options have expanded to include the capture and storage of stormwater and desalination, fog interceptions in cloud forests (notably in the Andes mountains), transfers between islands, inter-basin water transfers, bulk transport such as by pipeline or Medusa bags (giant polyfibre bags holding up to 1.5 billion litres of potable water that are towed by ships). Other communities and countries are investing in sewage recycling. Singapore, for example, has invested in the development of systems that treat sewage to a standard allowing it to be used for drinking purposes. Most of these technologies, however, are reliant upon the use of increasing amounts of energy and, as a result, the costs of water provision are rising in most regions where there is physical water scarcity.
Desalination has the advantage that it is climate independent but, as with most of these alternative sources of supply, is disadvantaged by the fact that it requires access to large amounts of energy. Typically, sewage recycling is cheaper than desalination as it uses the same reverse osmosis technology but requires about half as much energy per unit of water treated (Côté et al. 2005). Public opposition to household use of recycled sewage water, however, is strong (Dolnicar and Schäfer 2006). A careful assessment of the costs of these alternative sources of supply often reveals that it is cheaper to invest in demand control (Beato and Vives 2010; 2030 Water Working Group 2010). In a green economy, there
is much more attention to the long-term costs and impacts of resource use on the environment.
Producing more food and energy with less waterAs the world’s population increases, more water will be needed for household and industrial purposes with the consequence that in many areas, either more food will have to be imported, or more food produced with less water. When asked “Is there enough land, water, and human capacity to produce food for a growing population over the next 50 years – or will we ‘run out’ of water?”, analysis undertaken by the International Water Management Institute (IWMI) reports that “It is possible to produce the food – but it is probable that today’s food production and environmental trends, if continued, will lead to crises in many parts of the world” (Molden 2007).
In many developing countries, typical irrigated maize yields are in the vicinity of one to three tonnes per hectare whilst they could be as high as eight tonnes per hectare. There is a significant opportunity to increase crop yields and avoid a global food security crisis. If this opportunity is realised, then not only will it be possible to divert water to other uses, but it will be possible for developing countries to produce a surplus for sale to others.
Institutional reform When coupled with more traditional “hard” approaches to investment in built infrastructure, the “softer” approach of developing more effective administrative arrangements and policies that encourage private investment can significantly reduce the amount of money that governments need to invest in the water sector to achieve the same outcome. Opportunities to do this are developed in section 5. Typically, soft approaches focus on incentives and the factors that motivate consumers to manage their water use.
134

Water
4 The economics of greening water useResearch around the world suggests that there are no single-shot solutions to the world’s mounting water access, sanitation and scarcity problems. Each circumstance has its own unique set of challenges and opportunities. At the most general level, it is becoming apparent that the best results come for the pursuit of mixed solutions. Simple single-shot solutions tend to be prohibitively expensive and, in many cases, are insufficient to solve known supply problems (2030 Water Resources Group 2010). In the Zambezi Basin, it has been estimated that even full development of the area’s irrigation potential would benefit no more than 18 per cent of its rural poor (Björklund et al. 2009). A much more sophisticated investment strategy is needed (Ménard and Saleth 2010).
4 1 The economics of investing in water and ecosystems
Under the global model developed for the Green Economy Report by the Millennium Institute, the green investment scenario assumed investment in the water supply and sanitation sector would equal that estimated by Hutton and Bartram (2008b) as necessary to achieve the MDGs for water by 2015. Once this is achieved, it is assumed that governments will decide, once again, to halve the number of people without access to a reliable mains water supply and adequate sanitation. This new goal is achieved in 2030. Any funds left over during this second period are allocated to other water-related investments. In areas where there is economic water scarcity, priority is given to the construction of dams. In other areas, investment is channelled into making water-use more efficient. Where possible, and economically appropriate, desalination plants are constructed. These are assumed to supply water into the urban sector at a cost of US$0.11/m3 – in constant US$2010, same unit for monetary values below.
From the perspective of water, the economy and value for money, the results from this modelling are encouraging (see Table 2). Under the business-as-usual (BAU) scenario, water use remains unsustainable and stocks of both surface and groundwater decline. Under the green investment scenario, water use at the global level is kept within sustainable limits and all the MDGs for water are achieved in 2015. Water use is more efficient, resulting in increased agricultural, biofuel and industrial production. The number of people living in a water-stressed region is 4 per cent less than under BAU by 2030, up to 7 per cent by 2050.
When compared with the BAU scenario for 2050, total employment and income is greater under the green investment scenario, whereas the number of people working in the water sector is lower. This counter-intuitive finding occurs because the sector becomes much more efficient. Labour and other resources, which, under BAU would have been retained in the water sector, are freed for use in other sectors. In addition, as water is used more efficiently more is available for manufacturing and other purposes with the result that more people are gainfully employed.8
The overall conclusion from this assessment is that, where there is water scarcity or large proportions of a population do not have access to adequate water supply and sanitation services, early investment in water is a necessary precondition to progress.
4 2 Selecting projects and initiatives for investment
While it is useful and informative to examine the economics of investing in water at the global level, investments must be made primarily at the river basin, catchment and local level.
8. These findings are consistent with those of Hagos et al. (2008) who found that, as access to water improves, employment in other sectors expands.
Table 2: Modelled results of the Green Investment scenario
2% GDP invested in green sectors
Unit 2030 2050
Additional investment in water sector US$Bn/year 191 311
Additional water from desalination Km3 27 38
Water from efficiency im-provements (driven by green investments)
Km3 604 1,322
Total employment in the water sector Mn people 38 43
Change in total employment in the water sector relative to BAU 2*
% -13 -22
* BAU2 refers to the BAU scenario with an additional 2% of global GDP per year invested according to current patterns and trends (see Modelling chapter for more detailed explanation of scenarios and results)
135

Towards a green economy
China – Water availability cost curve
SOURCE: 2030 Water Resources Group
Cost
of a
dditi
onal
wat
er a
vaila
bilit
y in
203
0, $
/m3
Incremental availability billion m3
Power: USCSteel: coke dry quenching
Paper: white water reuse
Paper: intermediate water reuseTextile: wastewater reuse
Steel: condensed water coolingPower: condensed water cooling
Paper: concealed �ltration
Commercial building leakageSteel: dry dedusting
No till rainfedPower: wastewater reuse
Municipal leakage
New showerheads
Wastewater reuse in commercial buildingsSteel: wastewater reuse
Others: waste other reuse
Integrated plant stress mgt.(rainfed)
New faucets
Integrated plant stress mgt. (irrigated)
Irrigation scheduling
Genetic crop development (irrigated)
Seawater direct use
Dam & reservoir - large
Rice Intensi�cationImproved fertilizer balance (irrigated)
Retro�t faucetsLocal water pumping
Aquifer rechargeGenetic crop development – rainfed
Post-harvest transport and storageGroundwater pumping - shallow
Dam & reservoir - small
E�cient sprinkler irrigationImproved fertilizer balance (rainfed)
Pipe water conveyanceOn-farm canal lines
Mulching
Groundwater pumping - deepRainwater harvesting
Fresh water transfer – intra-basin
Drip irrigationWastewater reuse – municipal/industrial
Rain water harvesting – roof topFresh water transfer – inter-basin
New toiletsDesalination (RO)
Desalination (thermal) – co-located with power plant New laundry machinesPower: Dry cooling
Retro�t toiletsNo till (irrigated)
Retro�t showerheads
Supply/demand gap in 2030 = 201 billion m3
Total cost to �ll gap = - USD 21.7 billion
Local water conveyance
0
0.60.8
11.21.4
-3.4
-8.2
-0.4
0.2
-0.2
-0.6
-1-0.8
-1.2
-1.6-1.4
-1.8
-2.2-2.0
-2.4
-2.8-2.6
3.0-3.2
0.4
240220140100 20060 12040 80 26016020 180
Agricultural SupplyIndustry Municipal & domesticSpeci�ed de�cit between supply and water requirements in 2030
Estimated child mortality Estimated child morbidity (stunting)
Current
10% reduction
20% reduction
Average age for height ratio(St. Dev. below ref. median)
Average proportion of childhooddeaths (<5 yrs)
0 800400
Kilometres(Low) (High)
Morbidity
Mortality0.0 0.35
0.2 -3.2
Figure 12: Relative costs of different methods of supplying water in ChinaSource: 2030 Water Working Group (2009)
Figure 13: Predicted effect of a 10 per cent and 20 per cent reduction in the proportion of people obtaining their primary water supply from surface water or unprotected well water on child mortality and child morbidity (stunting), Niger basinSource: Ward et al (2010)
136

Water
In areas where the costs of enhancing water supplies from traditional sources are rising, the 2030 Water Working Group is recommending the preparation of formal costs curves similar to those shown in Figure 12. These cost curves rank each potential solution to a problem in terms of the relative cost per unit of desired outcome achieved and can be used to assess the likely costs and benefits of each solution. One of the most striking features of this approach is that one often finds solutions that both make more water available and cost less money. In China, for example, constructing water-availability cost curves identified 21 opportunities to make more water available for use and save money (Figure 12). These include increased paper recycling, investment in leakage reduction, waste-water reuse in power stations and commercial buildings and investment in water-efficient shower heads. All of these approaches are consistent with the development of a green economy, which seeks to minimise the impact of economic activity on the environment.
4 3 Flow of benefits from investment in the water supply and sanitation sector
Many returns to investment in the water sector are indirect. Build a toilet for girls in a school and they are more likely to go to school. This simple statement highlights the fact that investment in water opens up other opportunities for development. Assessing the case for more investment in water infrastructure in the Niger Basin, Ward et al (2010) report that investment in providing access to potable water and in education are the only two variables that are consistently related to poverty reduction across the whole Niger river basin (Box 5).
Highlighting the complex spatial nature of responses to water investment, Figure 13 shows the predicted reductions in child mortality and morbidity from the protection of drinking water supplies.
Box 5: Empirical analysis of the relationship between poverty and the provision of access to water and sanitation in the Niger basin
Ninety four million people live in the Niger basin. The proportion living below the poverty line in Burkina Faso is 70.3 per cent, in Guinea 70.1 per cent and in Niger 65.9 per cent. Childhood mortality rates are up to 250 per 1000 live births. In 2004, only 53 per cent of those living in the Niger basin were found to have access to a reliable and safe source of drinking water. Only 37 per cent had access to adequate sanitation facilities.
The quality of water used by households appears to be as important, or more so, than the total quantity of water available in the environment in predicting poverty levels. The use of unprotected well or surface water is generally positively correlated with increased child mortality and increased stunting.
In north-west Nigeria and east Nigeria, a 10 per cent decrease in the number of people using unprotected water is correlated with a decrease in child mortality of up to 2.4 per cent. Increased irrigation development is correlated with reductions in child stunting in central Mali, north-west Nigeria, central and eastern Nigeria and North Burkina Faso. Increased time spent in education is significantly correlated with a reduction in child mortality and child stunting. In much of the Mali Inner Delta, a one-year rise in the average level of education is associated with an approximate 3 per cent fall in child mortality.
The area of irrigated land was associated with decreases in poverty in only two cases, north-west
Nigeria and eastern Nigeria and northern Cameroon. This suggests that the contribution of irrigation to total rural welfare is low in the Niger basin and that the levels of irrigation potential are too small at present to offer a discernable improvement in livelihoods at this scale of analysis. This is in contrast to the general literature on development in this region that suggests irrigation will be crucial for the future economic wellbeing of the basin, along with improvements in the productivity of rain-fed agriculture. However, it may be that the benefits of irrigation do not yet accrue to the people engaged in its practice or that they do so at levels too small to register in these statistics.
The data suggest poverty reduction initiatives that rely solely on hydrologic probabilities or fail to account for the different causal relationships of spatially-differentiated poverty are likely to be less effective than those that take a mixed approach.
Strong spatial patterning is evident. Education and access to improved water quality are the only variables that are consistently significant and relatively stationary across the Niger Basin. At all jurisdictional scales, education is the most consistent non-water predictor of poverty. Access to protected water sources is the best water-related predictor of poverty. Source: Ward et al (2010).
137

Towards a green economy
5 Enabling conditions – Overcoming barriers and driving changeThe first half of this chapter has focused on the case for investing in the provision of ecosystems services and in the water supply and sanitation sector. In the second half, we focus on the institutional conditions, “softer” approaches, which have the potential to speed the transition to increase the return on investment and reduce the amount of money that needs to be invested in the water sector.
Without significant water policy reform to enable the reallocation of water from one sector to another, financially reward those who make water use more efficient and so forth, global analysis by the 2030 Water Working Group (2010) suggests that some nations will not be able to avoid the emergence of a water crisis in many regions. If wide ranging reforms are adopted, however, then this Group’s analysis suggests that most water crises can be averted. Investment in water policy reform and governance enables greater engagement and use of local knowledge and for investments to be made at a multitude of scales. When such approaches are taken, the 2030 Water Working Group estimates that the global amount of money that needs to be invested in the water sector can be reduced by a factor of four.
5 1 Improving general institutional arrangements
Arguably, the greatest impediment to investment in water infrastructure and management arrangements has been the difficulty in establishing high-level governance and political support for arrangements that support effective governance (Global Water Partnership 2009a). Problems range from a simple lack of institutional capacity to the presence of widespread corruption9 and opportunities to gain political favour. Building upon these observations in a background paper prepared for this chapter, Ménard and Saleth (2010) report that governments are learning that improvement in arrangements for the administration of water resources offers one of the least-cost opportunities to resolve water-management problems in a timely manner. Long-
9. The 2008 Global Corruption Report found that corruption in the water sector is likely to increase the cost of achieving the Millennium Development Goals by US$50 billion (Transparency International 2008). US$50 billion is about the same amount of money as the 2030 Water Resources Group’s estimate of the annual cost of implementing the least-cost solution to the resolution of global water problems.
term solutions such as the establishment of reliable, stable governance arrangements for the supply of water are central to a green economy.
A parallel issue is the question of rights or entitlements to use land and water. When these rights are insecure, the incentive to take the long-term perspective necessary to encourage green approaches to investment is weak. When land tenure, water entitlements and other forms of property rights are well-defined, far more sustainable forms of resource use can be expected. Early investment in the development of land registers and other similar processes are simple ways to expedite the transition to a green economy.
Increases in the capacity of a nation to collect taxes will clearly make it easier to move to full-cost pricing arrangements and, where appropriate, provide rebates and other forms of assistance to the most needy without having to resort to inefficient cross-subsidies.
Another example of an enabling condition is the use of education and information programmes designed to increase awareness of opportunities to act in an environmentally responsible manner. If members of a community feel obligated to look after the environment then they are more likely to do so.
5 2 International trade arrangements
The Enabling Conditions chapter discusses the role of international trade and trade-related measures in influencing green economic activity. Whether or not freer trading arrangements will ultimately be to the benefit of water users depends upon the degree of trade liberalisation that occurs and what exceptions are made. As agriculture uses around 70 per cent of all water extracted for consumptive purposes, and large amounts of water are embodied in many of the agricultural products traded (Figure 14), this policy option deserves careful consideration. When trade is unrestricted and all inputs priced at full cost, communities have the opportunity to take advantage of the relatively abundant sources of water in other parts of the world. When trade in agricultural products is restricted, water use is likely to be less efficient. Fewer crops can be grown per drop of available water.
138

Water
As a whole, the world is generally worse off. However, some countries strive for “food sovereignty” for various reasons including security.
In an attempt to understand the likely impacts of freer trading arrangements on water use, a background paper to this chapter uses a model to estimate the likely effects of agricultural trade liberalisation on water use (Calzadilla et al 2010). The model used differentiates between rain-fed and irrigated agriculture and includes functions that take into account the effects of climate change on the volume of water available for extraction. The trade-liberalisation scenario is based on the proposals being developed as part of the Doha round of negotiations, which seek to move the world towards a regime where agricultural trade is less restricted. In particular, the analysis assumes that there is a 50 per cent reduction in tariffs, a 50 per cent reduction in domestic support to agriculture and that all export subsidies are removed. Given that progress towards such a regime will take time to implement, the scenario is examined with and without climate change. The climate-change scenarios are based on those developed by the International Panel on Climate Change (2008).
Table 3 presents a summary of the findings of this modelling exercise, presented in more detail in the background paper. The introduction of “Doha-like” freer trading arrangements increases global welfare by US$36 billion. If strong climate change occurs, global
welfare is reduced by US$18 billion. The model assumes no change to the policies that determine how the welfare benefits from increased trade are distributed. Calzadilla et al conclude that:
■ Trade liberalisation increases the quantity of agricultural products traded and the capacity of nations to trade with one another with the consequence that global capacity to adjust to climate change is greater than it otherwise would be;
■ Trade liberalisation tends to reduce water use in water-scarce regions and increase water use in water-abundant regions, even though water markets do not exist in most countries; and
■ Trade liberalisation makes each nation more responsive to changing conditions and, as a result, reduces the negative impacts of climate change on global welfare by 2 per cent. Regional changes, however, are much larger than this.
In summary, the modelling suggests that freer international trading arrangements for agriculture will significantly reduce the costs of facilitating adjustment and attaining MDG targets. Trade liberalisation can be expected to reduce water use in places where supplies are scarcest and increase water use in areas where they are abundant. Trade liberalisation increases the capacity to adapt to climate change and reduces its negative effects.
Figure 14: Regional virtual water balances and net interregional virtual water flows related to the trade in agricultural products, 1997–2001 The arrows show net virtual water flows between regions (>10 BCM/yr)Source: Chapagain and Hoekstra (2008)
139

Towards a green economy
5 3 Using market-based instruments
Market-based instruments that can be harnessed to foster a green economy include:
■ Payments for Ecosystem Services (PES);
■ Consumer-driven accreditation and certification schemes that create an opportunity for consumers to identify products that have been produced sustainably and pay a premium for access to them; and
■ Arrangements that send a scarcity signal including the development of offset schemes, the trading of pollution permits and the trading of access rights to water.
Each of these approaches has direct application to the water sector and the degree to which communities are likely to become interested in maintaining and investing in the provision of ecosystem services.
Payments for Ecosystem ServicesFrom a water perspective, there are two main types of payments for ecosystem services – those financed by the user of a service and those financed by a government or donor (Pagiola and Platais 2007; Engel et al. 2008). In either case, such schemes can be successful only when a secure source of money for the scheme has been identified and committed. Arguably, the most
efficient are operated by users who are able to identify which services they want and the price they are willing to pay for them. Most government-financed programmes depend on financing from general revenues and, because they typically cover large areas, they are likely to be less efficient. Moreover, because they are subject to political risk, they are less likely to be sustainable. When a government or financial conditions change, support for the scheme can collapse (Pagiola and Platais 2007; Wunder et al. 2008).
PES schemes are becoming common in Latin America and the Caribbean region. In Ecuador, Quito’s water utility and electric power company pays local people to conserve the watersheds from which this company draws its water (Echavarría 2002a; Southgate and Wunder 2007). In Costa Rica, Heredia’s public-service utility pays for watershed conservation using funds derived from a levy on consumers (Pagiola et al. 2010).
Many small Latin American towns have similar schemes, including Pimampiro in Ecuador; San Francisco de Menéndez in El Salvador and Jesús de Otoro in Honduras (Wunder and Albán 2008; Herrador et al. 2002; Mejía and Barrantes 2003). Hydroelectric producers are also becoming involved. In Costa Rica, for example, public-sector and private-sector hydro-electricity producers are paying for conservation of the watersheds from which they draw water. Pagiola (2008) reports that these companies now contribute around US$0.5 million
Table 3: Change in regional welfare over 20 years as a result of climate change and trade liberalisation, US$ million
Regions50% reduction in tariffs, no export
subsidies and 50% reduction in domestic support to Agriculture
Strong Climate Change Scenario
Both scenarios combined (Free trade and strong climate
change)
United States -1,069 -2,055 -3,263
Canada -285 -20 -237
Western Europe 3,330 1,325 4,861
Japan and South Korea 11,099 -189 10,970
Australia and New Zealand 622 1,022 1,483
Eastern Europe 302 538 883
Former Soviet Union 748 -6,865 -6,488
Middle East 2,104 -3,344 -1,213
Central America 679 -240 444
South America 1,372 805 2,237
South Asia 3,579 -3,632 -28
Southeast Asia 3,196 -3,813 -552
China 5,440 71 5,543
North Africa 4,120 -1,107 3,034
Sub-Saharan Africa 218 283 458
Rest of the World 285 -308 -17
Total 35,741 -17,530 18,116
140
Water
per annum towards the conservation of about 18,000 ha. In Venezuela, CVG-Edelca pays 0.6 per cent of its revenue (about US$2 million annually) towards the conservation of the Río Caroní’s watershed (World Bank 2007). Some irrigation systems, such as those in Colombia’s Cauca Valley, have participated in schemes like these (Echavarría 2002b).
More generally, and as explained in Khan (2010), as countries shift to a greener set of economic arrangements, the costs of more traditional hard engineering approaches to water management involving the construction of treatment plants, engineering works to control floods, etc. become more expensive. In contrast, the cost of operating an ecosystem payment scheme is much less likely to increase. For this to occur, however, parallel investments in the development of property rights and governance arrangements may be necessary to ensure water-supply utilities can enter into contracts that maintain access to ecosystem services and expect these contracts to be honoured. Well-defined land tenure systems, stable governance arrangements, low transaction costs and credible enforcement arrangements are essential (Khan 2010).
As noted elsewhere in this chapter, early attention to governance arrangements is a necessary precondition to the inclusion of water in a transition strategy to a green economy.
Strengthening consumer-driven accreditation schemesWhilst rarely used in the water sector, in recent years there has been a rapid expansion in the use of a variety of product accreditation schemes that enable consumers to pay a premium for access to products that are produced without detriment to the environment including its capacity to supply water-dependent services. As observed by de Groot et al. (2007), these accreditation schemes rely on the self-organising nature of private market arrangements to provide incentives for the beneficiaries of the improved service to pay for it. Once established, these arrangements can play an important role in encouraging the restoration of natural environments.
Arguably, one of the better-known examples is the labelling scheme developed by the Forest Stewardship Council. The Council guarantees that any timber purchased with its label attached has been harvested in a manner that, amongst other things, seeks to maintain ecological functions and the integrity of a forest. Where appropriate, this includes recognition of the essential role that forests play in water purification and in protecting communities from floods.10
10. For more information see http://www.fsc.org/pc.html
Increasing the use of tradeable permit, off-set and banking schemesA broad class of market-based instruments of relevance to a green economy are those that limit opportunity to pollute and / or use a resource. There are many variants of such schemes but all work by using a market mechanism to reward people who are prepared to cease or reduce a water-affecting activity, thus allowing others to take up the same activity and thereby ensuring an overall controlled impact on the environment.
One such example is a mechanism whereby a water treatment plant can release more nutrients into a waterway by arranging for the reduction of nutrient pollution from a nearby dairy farm. In many cases, the result can be a significant improvement in water quality at a much lower cost had the water treatment plant not been allowed to increase its emissions. In rural areas, nitrate pollution charges and trading schemes are often suggested and are now operational in parts of the USA (Nguyen et al. 2006).
Another example, well developed in the USA, is the use of wetland banking schemes that require any person proposing to drain a wetland to first arrange for the construction, restoration or protection of another wetland of greater value (Robertson 2009). In these schemes, it is possible for a person to restore a wetland and then bank the credits until a third party wishes to use them. Three quarters of these wetland banking arrangements involve the use of third-party credits (Corps 2006; Environmental Law Institute 2006).11
5 4 Improving entitlement and allocation systems
The last class of market-based instruments of particular relevance to water are those that use water entitlement and allocation systems to allow adjustment to changing economic and environmental conditions by allowing people to trade water entitlements and allocations.
In well-designed systems, water-resource plans are used to define rules for determining how much water is to be allocated to each part of a river or aquifer and a fully-specified entitlement system is then used to distribute this water among users. Under such an arrangement rapid changes in supply conditions can be managed efficiently (Young 2010). Australian experience in the development of fully-specified entitlement systems is described in Box 6. Among other things, the approach enables people to use bottom-up market based
11. In each of these schemes banking and trading is possible only because they involve the development of indices that enable wetlands of differing value per hectare to be compared with one another.
141
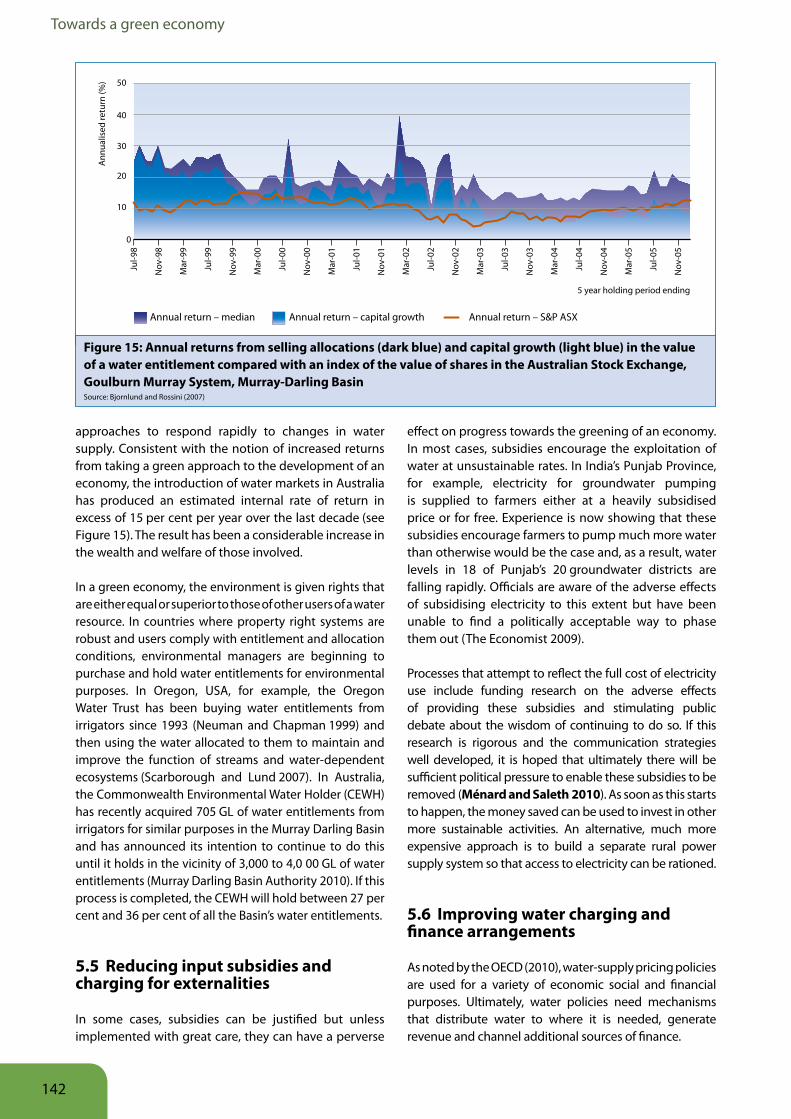
Towards a green economy
approaches to respond rapidly to changes in water supply. Consistent with the notion of increased returns from taking a green approach to the development of an economy, the introduction of water markets in Australia has produced an estimated internal rate of return in excess of 15 per cent per year over the last decade (see Figure 15). The result has been a considerable increase in the wealth and welfare of those involved.
In a green economy, the environment is given rights that are either equal or superior to those of other users of a water resource. In countries where property right systems are robust and users comply with entitlement and allocation conditions, environmental managers are beginning to purchase and hold water entitlements for environmental purposes. In Oregon, USA, for example, the Oregon Water Trust has been buying water entitlements from irrigators since 1993 (Neuman and Chapman 1999) and then using the water allocated to them to maintain and improve the function of streams and water-dependent ecosystems (Scarborough and Lund 2007). In Australia, the Commonwealth Environmental Water Holder (CEWH) has recently acquired 705 GL of water entitlements from irrigators for similar purposes in the Murray Darling Basin and has announced its intention to continue to do this until it holds in the vicinity of 3,000 to 4,0 00 GL of water entitlements (Murray Darling Basin Authority 2010). If this process is completed, the CEWH will hold between 27 per cent and 36 per cent of all the Basin’s water entitlements.
5 5 Reducing input subsidies and charging for externalities
In some cases, subsidies can be justified but unless implemented with great care, they can have a perverse
effect on progress towards the greening of an economy. In most cases, subsidies encourage the exploitation of water at unsustainable rates. In India’s Punjab Province, for example, electricity for groundwater pumping is supplied to farmers either at a heavily subsidised price or for free. Experience is now showing that these subsidies encourage farmers to pump much more water than otherwise would be the case and, as a result, water levels in 18 of Punjab’s 20 groundwater districts are falling rapidly. Officials are aware of the adverse effects of subsidising electricity to this extent but have been unable to find a politically acceptable way to phase them out (The Economist 2009).
Processes that attempt to reflect the full cost of electricity use include funding research on the adverse effects of providing these subsidies and stimulating public debate about the wisdom of continuing to do so. If this research is rigorous and the communication strategies well developed, it is hoped that ultimately there will be sufficient political pressure to enable these subsidies to be removed (Ménard and Saleth 2010). As soon as this starts to happen, the money saved can be used to invest in other more sustainable activities. An alternative, much more expensive approach is to build a separate rural power supply system so that access to electricity can be rationed.
5 6 Improving water charging and finance arrangements
As noted by the OECD (2010), water-supply pricing policies are used for a variety of economic social and financial purposes. Ultimately, water policies need mechanisms that distribute water to where it is needed, generate revenue and channel additional sources of finance.
50
40
30
20
10
0
Ann
ualis
ed re
turn
(%)
Jul-9
8
Nov
-98
Mar
-99
Jul-9
9
Nov
-99
Mar
-00
Jul-0
0
Nov
-00
Mar
-01
Jul-0
1
Nov
-01
Mar
-02
Jul-0
2
Nov
-02
Mar
-03
Jul-0
3
Nov
-03
Mar
-04
Jul-0
4
Nov
-04
Mar
-05
Jul-0
5
Nov
-05
5 year holding period ending
Total returns – median allocation and entitlement prices compared to capital growth, and S&P ASX accumulation index returns
Annual return – median Annual return – capital growth Annual return – S&P ASX
Figure 15: Annual returns from selling allocations (dark blue) and capital growth (light blue) in the value of a water entitlement compared with an index of the value of shares in the Australian Stock Exchange, Goulburn Murray System, Murray-Darling BasinSource: Bjornlund and Rossini (2007)
142
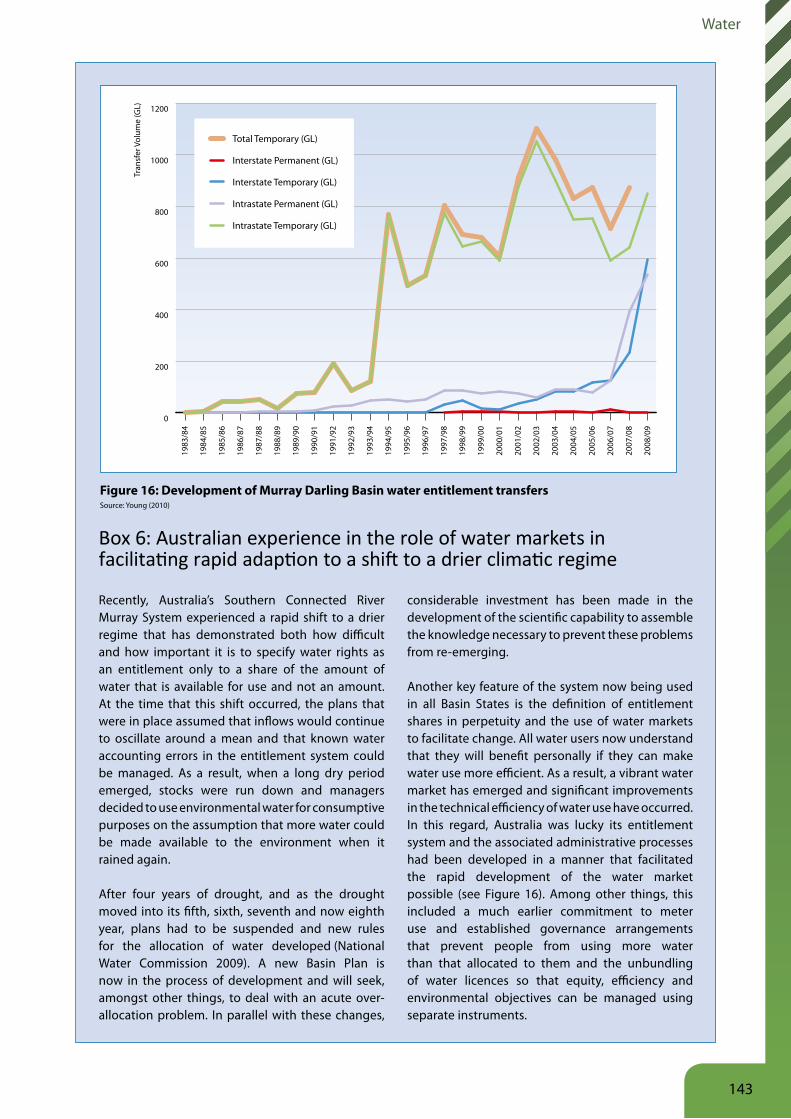
Water
Box 6: Australian experience in the role of water markets in facilitating rapid adaption to a shift to a drier climatic regime
Recently, Australia’s Southern Connected River Murray System experienced a rapid shift to a drier regime that has demonstrated both how difficult and how important it is to specify water rights as an entitlement only to a share of the amount of water that is available for use and not an amount. At the time that this shift occurred, the plans that were in place assumed that inflows would continue to oscillate around a mean and that known water accounting errors in the entitlement system could be managed. As a result, when a long dry period emerged, stocks were run down and managers decided to use environmental water for consumptive purposes on the assumption that more water could be made available to the environment when it rained again.
After four years of drought, and as the drought moved into its fifth, sixth, seventh and now eighth year, plans had to be suspended and new rules for the allocation of water developed (National Water Commission 2009). A new Basin Plan is now in the process of development and will seek, amongst other things, to deal with an acute over-allocation problem. In parallel with these changes,
considerable investment has been made in the development of the scientific capability to assemble the knowledge necessary to prevent these problems from re-emerging.
Another key feature of the system now being used in all Basin States is the definition of entitlement shares in perpetuity and the use of water markets to facilitate change. All water users now understand that they will benefit personally if they can make water use more efficient. As a result, a vibrant water market has emerged and significant improvements in the technical efficiency of water use have occurred. In this regard, Australia was lucky its entitlement system and the associated administrative processes had been developed in a manner that facilitated the rapid development of the water market possible (see Figure 16). Among other things, this included a much earlier commitment to meter use and established governance arrangements that prevent people from using more water than that allocated to them and the unbundling of water licences so that equity, efficiency and environmental objectives can be managed using separate instruments.
Figure 16: Development of Murray Darling Basin water entitlement transfersSource: Young (2010)
0
200
400
600
800
1000
1200
2008
/09
2007
/08
2006
/07
2005
/06
2004
/05
2003
/04
2002
/03
2001
/02
2000
/01
1999
/00
1998
/99
1997
/98
1996
/97
1995
/96
1994
/95
1993
/94
1992
/93
1991
/92
1990
/91
1989
/90
1988
/89
1987
/88
1986
/87
1985
/86
1984
/85
1983
/84
Total Temporary (GL)
Interstate Permanent (GL)
Interstate Temporary (GL)
Intrastate Permanent (GL)
Intrastate Temporary (GL)
Tran
sfer
Vol
ume
(GL)
143

Towards a green economy
From a greening economy perspective, we recognise, however, that there is little agreement about the best way to charge for access to water and sanitation services. Three background papers were adapted to assist with preparation of this chapter – a primer on the economics of water use, a primer on financing and a paper on South African experience with the supply of free access to basic water (Beato and Vives 2010; Vives and Beato 2010; Muller 2010). Relevant insights can also be gained from the background paper on Indonesian experience with the provision of water to Western Jakarta (Fournier et al 2010). The United Kingdom is pioneering various pricing arrangements that reflect the full costs of providing water. The approach emphasises the role of pricing and charging in catalysing innovation and in encouraging communities to share access to water resources.
Sources of revenueKnown as the “3 Ts,” in essence, there are three ways to finance water infrastructure and the costs associated with operating that infrastructure (OECD 2009):
1. Users can be charged a tariff for the water provided to them;
2. Tax revenue can be used to subsidise operating costs and cover capital costs; and
3. Grants and other forms of transfer payment can be sourced from other countries.
Figure 17 shows how different countries combine each of these approaches. Very few countries rely only upon tariffs to finance infrastructure investment, even though economic theory would suggest that charging people a tariff in proportion to the service provided is the most efficient option. Reliance on tax revenue is common and, when donors are willing, transfer payments (donations) can play a significant role. In OECD countries, it is now common for urban water-supply utilities to set a tariff that is sufficient to cover the full operating costs of supplying water (OECD 2010).
Charging for access to waterShifting to a green economy usually involves a commitment to begin charging for the full costs of resource use. With regard to water, however, there is a dilemma as access to clean water and adequate sanitation services is a human right (United Nations 2010a). To this end, many people believe that access to clean water and sanitation services for household purposes should be supplied either for free or at charge, which is much less than the cost of providing these services. In a green economy, the efficient use of resources is encouraged, as is investment in built infrastructure. There is also an emphasis on equity.
When considering the most appropriate charge to set, from an efficiency perspective, it is useful to distinguish between:
■ The capture, storage, treatment and supply of water for public rather than private purposes;
■ Situations where water supplies are abundant and when supplies are scarce;
■ The supply of water to households, to industry and for irrigation;
■ Regions where institutional capacity to collect charges is strong and when it is weak; and
■ The need to recover daily operating costs and the need to make an adequate return on capital so that the supplier can afford to maintain both natural and built infrastructure.
Complicating the issue, there is also a need to consider the implications of charging people for the full cost of providing sanitation services. First, sanitation service provision generally requires access to water. Second, there are important public health issues to consider. When, for example, one person defecates in the open, health risks
100
90
80
70
60
50
40
30
20
10
0
%
1. Includes ODA grants as well as private grants, such as through non-governmental organisations.2. Water supply3. Wastewater4. Composition of capital investment for water supply and sanitation5. 2005/066. Rural WS, 20067. 20068. 20059. 2007
Source: OECD (2009b), Strategic Financial Planning for Water Supply and Sanitation, OECD internal document, www.oecd.org/water
Tari�s Taxes Transfers1
Egyp
t (Ca
iro)
Geo
rgia
9
Arm
enia
8
Mol
dova
7
Moz
ambi
que6
Ethi
opia
5
Mex
ico
Czec
h Re
publ
ic
inv
WSS
4
Kore
a
Aust
ria W
W3
Aust
ria W
S2
Fran
ce
Figure 17: Array of mixes of transfer, tax and tariff approaches to the provision of infrastructure financeSource: OECD (2009)
144

Water
are imposed on all who live nearby. In an attempt to avoid the emergence of such problems, governments normally set building standards that require the provision of toilets and connection either to a sanitation service or an appropriate on-site treatment of the waste. When there is no effective building control and, especially when informal settlements are involved, a way to efficiently engage with communities needs to be found.
When water is used for public purposes, such as the maintenance of a wetland for biodiversity or recreational benefits, access is usually provided for free and funded by the government. Usually, this is efficient as the beneficiaries are numerous and not easily identified. Moreover, there is no congestion problem; many people can benefit without detracting from the benefit received by others.
When water supply (consumption) is for private benefit, however, use by one person typically excludes use by another. In such situations, the efficient strategy is to make water available to those who want it at, at least, the full cost of supply. Then, every water user has a greater incentive to use water efficiently. But this simple observation fails to consider important equity considerations that are discussed in the next section.
When water supplies are scarce, the efficient strategy is to price access to water at the marginal cost of supplying the next unit of water (Beato and Vives 2010). Costs increase as more and more water is produced. The efficient charge is equal to marginal cost – the cost of producing the next unit of water. Typically, this cost rises as more and more water is supplied.
When water supplies are scarce and no more water can be accessed by, for example, more desalination or recycling, economic theory would suggest the need for a scarcity charge.
When water supply is abundant, however, water pricing theorists face an interesting dilemma. As more and more water is supplied, the cost per unit of water supplied declines. Moreover, the cost of supplying the next unit of water is less than the average cost of supply. The result is a regime where, if water charges are set at marginal cost of supply, the revenue collected will not be sufficient to cover average costs - the water supply business will go bankrupt unless the supply charge is set above average long run cost of supply and/or a government makes up the short fall (Beato and Vives 2010).
The question of whether or not a government should fund any revenue short fall experienced by a water utility depends upon its capacity to collect revenue from other sources. When institutional capacity to collect revenue is strong, the most efficient charge is one that charges all users in proportion to the metered volume of water
taken. When institutional capacity is weak, however, it may not be possible to do this. Before volumetric charges can be introduced, meters must be installed and revenue collection procedures established.
Finally, it is necessary to differentiate between day-to-day operating costs and the cost of ensuring that sufficient money is set aside to fund infrastructure upgrades and maintenance, ecosystem restoration and to ensure an adequate return on capital. The former is sometimes known as the “lower bound cost” and the latter as the “upper bound cost”.
As a general rule, the faster any system shifts to lower bound cost and then onto upper bound cost, the more efficient, the more sustainable and more innovative water use will be. When institutional capacity is strong, the most efficient strategy is to set a price that is the greater of marginal cost and average cost. Mechanisms other than water pricing policies should be used to transfer income to disadvantaged households and businesses. We can now turn to the consideration of equity issues.
Financing access for the poorThroughout the world, strong views are held about the role of access to adequate water and sanitation service provision in regional development. Where the poor are involved there is definitely no consensus. Some people are of the view that the poor should be given access to water either for free or at a nominal charge. Others are of the view that all water users should have to pay the full costs of supplying water to them.
In an environment where a large number of children die as a result of lack of access to adequate water, what is the right tariff to set? Western Jakarta provides an illustrative case study. Some 37 per cent of the people living in Western Jakarta do not have access to a reliable mains water supply. Most of these people are poor and either buy water from carts operated by water vendors or collect it from an unhygienic source. Those forced to buy water from a cart pay up to 50 times the full cost of providing water access to a mains water supply. Government policy, however, requires the poor be provided access at a highly subsidised price so, in practice, those poor people who get access to mains water are supplied it at a price that is 70 times less than the price paid to water vendors. But, as the government cannot afford to pay this subsidy, it is actively discouraging the water utility from making water available to these people (Fournier et al 2010). The poor who receive access to reliable subsidised water benefit but this assistance is of no benefit to the 37 per cent of people who do not have access to a reliable mains water supply. Table 4 shows the tariff structure used in Western Jakarta.
South Africa provides a different perspective on the question of what tariff to set. In 1996, South Africa
145

Towards a green economy
devolved responsibility for water management to local government and then introduced a policy that required local governments to provide a basic amount of water to all people free of charge, using funds redirected from central government. As a result, the proportion of the population without access to a reliable water supply has dropped from 33 per cent to 8 per cent (Muller 2010). Whether or not the same, or more, progress could have been made if users had been required to pay the full cost of supplying water to them is not known and probably cannot be determined reliably as water has played a central role in the political transformation of this country. Recently, the Constitutional Court of South Africa (2009) ruled that a local government could charge for access and use pre-paid meters as a means to do this.
Seeking empirical evidence in the Niger Basin, Ward et al (2010) found that access to education and to clean water are the most consistent predictors of economic progress. Having analysed the data and, particularly, the high costs of delaying access because of revenue shortfall, one can observe that if countries cannot afford to make drinking water available at less than full cost of supplying it to all poor people, then an alternative approach is to focus on the efficient provision of water to all poor people at the cost of supply. From a green economy perspective, the strategy to pricing to adopt is the one that most speeds the transition.
Cross-subsidising (selectively taxing) water useIn many countries, the water tariff regimes are used to cross-subsidise the cost of supplying water to the poor.
As is the case in Jakarta, this is achieved by charging wealthier households and/or those who use large volumes of water more than the cost of supply and then using the resultant revenue to enable water to be supplied to the poor at less than full cost (Table 4). As a transitional strategy in countries with little other capacity to transfer wealth from the rich to the poor, a case can be made for the use of cross-subsidies, even though this approach distorts investment in water use. In developed countries, however, the use of a water charging regime to transfer income from one group of people or one region
Table 4: Water Tariff Structure in Western Jakarta, US$ per m3
Source: Adapted from Fournier et al (2010)
Code Customer TypeVolume of water used
0-10 m3 11-20 m3 >20 m3
K2 Low-Income Domestic $0.105 $0.105 $0.158
K3A Middle-Income Domestic $0.355 $0.470 $0.550
K313High-Income Domestic and Small Business
$0.490 $0.600 $0.745
K4A $0.683 $0.815 $0.980
K413 Non-Domestic $1.255 $1.255 $1.255
Prices converted to US$ and rounded to 3 decimal places
Box 7: Recent experience of private companies providing water to households
Phnom Penh Water Supply Authority in Cambodia has seen major transformations between 1993 and 2009. The number of connections increased seven-fold, non-revenue water fell from 73 per cent to 6 per cent, collection efficiency rose from 48 per cent to 99.9 per cent, and total revenues increased from US$300,000 to US$25 million, with a US$8 million operating surplus. After receiving initial grants and soft loans from international financial institutions, the utility is now self-financing. Tariffs increased steeply in the early years, but they have been held constant at around US$0.24/m3 since 2001, because the combination of service expansion, reduced water losses and high collection rates has guaranteed a sufficient cash flow for debt repayment as well as capital expenditure.
Balibago Waterworks Systems serves around 70,000 customers in a rural area of the Philippines. The business has grown by going out to adjacent towns and villages and asking each community whether they would like the Balibago to build a network that would enable them to supply piped water to it. When Balibago does this, it begins by showing the community its regulated schedule of tariffs. The community is then asked if they want access to piped water and are prepared to pay the scheduled price for access to it. Balibago is finding that in many cases, the result is judged as an attractive proposition for communities that might previously have relied on hand pumps and wells, and it makes good money for the company’s investors. Source: Adapted from Global Water Intelligence (2010)
146
Water
to another is extremely inefficient. For this reason alone, Beato and Vives (2010) conclude that subsidies should be targeted as tightly as possible and accompanied by a transparent strategy for their removal. The result is the emergence of a regime that encourages investment and innovation. Infrastructure is located in places where its use can be sustained. Sustainable jobs and more green growth follows.12
Increasing private-sector participation As a transition to efficient supply of water at full cost occurs, opportunities for the involvement of private enterprise in the provision of water supply and sanitation services increase. The main reason for considering such arrangements is that research is showing that private-sector engagement can help to deliver benefits at less cost and thereby release
12. When water is supplied to businesses at less than full cost, businesses tend to locate in locations chosen on the assumption that subsidised access to water will continue. This, in turn, encourages people to live in and migrate to such places and locks an economy into a regime that becomes dependent upon the subsidy. As each of these steps occurs, opportunities for development are undermined.
revenue for green growth in other sectors. Once again, this opportunity is controversial. Several private-sector participation arrangements have failed. Nevertheless, there is little to suggest that the frequency with which these problems occur is less than that found among publicly-run systems (Ménard and Saleth 2010).
Closer analysis is showing that when contractual arrangements are well developed, use of the private sector can offer a wide range of benefits and, when the well designed contractual arrangements are in place, can outperform the public sector Argentina, for example, has privatised approximately 30 per cent of its water supplies with very positive results. Child mortality is now 8 per cent lower in areas where water provision has been privatised. Moreover, this effect is largest (26 per cent) in the areas where people are poorest (Galani et al. 2002). The experience is equally positive in regions where businesses are allowed to supply water at full cost – operators are finding that many people are prepared to pay for the services they offer (Box 7).
147

Towards a green economy
6 ConclusionsAccess to clean water and adequate sanitation services is critical to the future of each and every household. Water is clearly fundamental to food production and providing ecosystem services and vital for industrial production and energy generation.
Finding a way to use the world’s water more efficiently and making it available to all at a reasonable cost while leaving sufficient quantities to sustain the environment are formidable challenges. In an increasing number of regions, affordable opportunities to access more water are limited. But progress has to be made to improve efficiency use and working within scientifically established and common practice limits. Direct benefits to society can be expected to flow both from increased investment in the water supply and sanitation sector, including investment in the conservation of ecosystems critical for water.
Research shows that by investing in green sectors, including the water sector, more jobs and greater prosperity can be created. Arguably, these opportunities are strongest in areas where people still do not have access to clean water and adequate sanitation services. Early investment in the provision of these services appears to be a precondition for progress. Once made, the rate of progress will be faster and more sustainable. Transition becomes possible.
Arrangements that encourage the increased conservation and sustainable use of ecosystem services can be expected to improve prospects for a transition to a green economy.
Ecosystem services play a critical role in the production of many goods and in many of the services needed by the world’s human population but pressure on them is increasing. By investing in arrangements that protect these services and, where appropriate, enhance them there is opportunity to ensure that the greatest advantage is taken of these services. Often the most effective way forward is to invest first in the development of supply and distribution infrastructure so that pressure is taken off the systems that supply ecosystem services.
Significant opportunities for improvement include the development of arrangements that pay people who provide and do the work necessary to maintain access to ecosystem services.
Another opportunity is the formal allocation of water rights to the environment. Where water resources have
been over-allocated, there are significant opportunities to fund restoration before changes become irreversible at reasonable cost.
The costs of achieving a transition will be much less if the increased investment is accompanied by improvements in governance arrangements, the reform of water policies and the development of partnerships with the private sector.
The opportunity to improve governance arrangements is one of the biggest opportunities to speed transition to a greener economy. In any area where there is water scarcity, it is critical that governance arrangements are put in place to prevent over-use and over development of the available water resource. Building administrative regimes that are respected and trusted by local communities and industry takes time, but is essential in ensuring a return on the investments suggested in this chapter. Among other things, these new arrangements will need to be able to facilitate the transfer of water from one sector to another.
Individual decisions about how to use resources and where to invest are influenced by policy. From a green economy perspective, there are significant opportunities to reform policies in ways that can be expected to significantly reduce the size of the investment needed to facilitate progress. Phasing out subsidies that have a perverse effect on water use and adopting freer trading arrangements, brings direct benefits to many sectors. Other opportunities, such as the establishment of tradeable water entitlement and allocation systems, bring benefits initially to the water sector.
A sensitive issue is the question of how best to charge poor households for access to water and sanitation services. In green economies, there is a commitment to factoring social equity into the transition to arrangements, such as full cost accounting, that influence investment and decisions by people and industry. Ultimately, the question of how fast this transition should occur depends on a case-by-case assessment of the influence of the arrangement on the expected rate of progress. Where capacity exists, financial transfers and tax revenues collected from other sources can be used to fund the infrastructure necessary to provide households with access to services but, when this approach slows progress, tariffs should be raised to at least cover the full costs of service provision. Preference should go to the various pricing arrangements that enable most rapid progress.
148

Water
ReferencesBackground papers prepared to underpin development of this chapter
The macro-economic case for investment in water2030 Water Resources Group (2010). Charting our water future.
Adapted from a report of the same name.Tropp, H. (2010). Making water a part of economic development: The
economic benefits of improved water management and services.Calzadilla, A.; Rehdanz, K. and Tol, R.J.S. (2010). The impacts of trade
liberalisation and climate change on global agriculture.Khan, S. (2010). The costs and benefits of investing in ecosystem
services for water supply and flood protection.
Policy Guidelines for investment in waterBeato, P. and Vives, A. (2010). A primer on water economics.Vives, A. and Beato, P. (2010). A primer on water financing.Ménard, C. and Saleth, R.M (2010). The effectiveness of alternative
water governance arrangements.
Regional experienceFournier, V.; Folliasson, P.; Martin, L. and Arfiansyah (2010). PALYJA
“Water for All” programs in Western Jakarta.Muller, M. (2010). Free basic water – a sustainable instrument for a
sustainable future in South Africa. Adapted from Environment and Urbanization 20(1):67–87.
Schreiner, B.; Pegram, G.; von der Heyden, C. and Eaglin, F. (2010). Opportunities and constraints to development of water resources infrastructure investment in Sub-Saharan Africa.
Ward, J.; Kazcan, D.; Olgilvie, A. and Lukasiewicz, A. (2010). Challenging hydrological panaceas: evidence from the Niger River Basin.
Other references cited in chapter
2030 Water Resources Group (2009). Charting our water future: Economic frameworks to inform decision making: The economics of water resources. McKinsey and Company, Munich.
Björklund, G.; Bullock, A.; Hellmuth, M.; Rast, W.; Vallée, D. and Winpenny, J. (2009). Water’s many benefits in The UN world water development report 3: Water in a changing world. Earthscan, London.
Bjornlund, H. and Rossini, P. (2007). An Analysis of the returns from an investment in water entitlements in Australia, Pacific Rim Property Research Journal 13(3):344–360.
Bradley, D.J. (1974). Chapter in Human Rights in Health, Ciba Foundation Symposium 23:81–98.
Briscoe, J. and Malik, R.P.S. (2006). India’s water economy: Bracing for a turbulent future. World Bank and Oxford University Press, Oxford.
Calzadilla, A.; Rehdanz, K.; Betts, R.; Falloon, P.; Wiltshire, A. and Tol, R. (2010). Climate Change Impacts on Global Agriculture. Kiel Working Paper, 1617, Kiel Institute for the World Economy, Kiel.
Cave, M. (2009). Independent Review of Competition and Innovation in Water Markets: Final report. Office of Public Sector Information, Surrey. Available at www.defra.gov.uk/environment/water/industry/cavereview
Chapagain, A.K. and Hoekstra, A.Y. (2008). The global component of freshwater demand and supply: an assessment of virtual water flows between nations as a result of trade in agricultural and industrial products, Water International, 33(1):19–32
Constitutional Court of South Africa (2009). Case CCT 39/09 2009 ZACC 28.
Corps (US Army Corps of Engineers) (2006). Draft environmental assessment, finding of no significant impact, and regulatory analysis for proposed compensatory mitigation regulation. US Army Corps of Engineers, Washington, DC. March 13, 2006.
Cosgrove, W.J. and Rijsberman, F.R. (2000). World water vision: Making water everybody’s business. Earthscan, London.
Côté, P.; Siverns, S. and Monti, S. (2005). Comparison of membrane-based solutions for water reclamation and desalination, Desalination 182:251–257.
Credit Suisse Research Institute (2009). Water: The next challenge. Credit Suisse. Available at https://emagazine.credit-suisse.com/app/shop/index.cfm?fuseaction=OpenShopCategory&coid=254070&lang=EN
Dolnicar, S. and Schäfer, A.I. (2006). Public perception of desalinated versus recycled water in Australia. Available at http://ro.uow.edu.au/commpapers/138
Echavarría, M. (2002a). Financing watershed conservation: The FONAG water fund in Quito, Ecuador in Pagiola, S.; Bishop, J. and Landell-Mills, N. (eds.) Selling Forest Environmental Services: Market-based Mechanisms for Conservation and Development, pp. 91–102. Earthscan, London.
Echavarría, M. (2002b). Water User Associations in the Cauca Valley: A Voluntary Mechanism to Promote Upstream-Downstream Cooperation in the Protection of Rural Watersheds, Land-Water Linkages in Rural Watersheds Case Study Series. Food and Agriculture Organisation, Rome.
ECOWAS-SWAC/OECD (2008). Communicable diseases, Population series. Available at http://www.oecd.org/dataoecd/56/39/40997324.pdf
Engel, S.; Pagiola, S.; and Wunder, S. (2008). Designing payments for environmental services in theory and practice: An overview of the issues, Ecological Economics 65:663–674.
Evans, R. (2007). The Impact of groundwater use on Australia’s rivers: Exploring the technical, management and policy challenges. Land and Water Australia, Canberra. Available at http://lwa.gov.au/files/products/innovation/pr071282/pr071282.pdf
Environmental Law Institute (ELI) (2006). 2005 Status report on compensatory mitigation in the United States. ELI, Washington, DC.
Falkenmark, M. (1989). The Massive Scarcity Now Threatening Africa : Why Isn’t it Being Addressed?, Ambio 18(2):112–118.
Fenollar, F.; Trape, J-J.; Bassene, H.; Sokhna, C. and Raoult, D. (2009). Tropheryma whipplei in fecal samples from children, Senegal. Emerging Infectious Diseases 15(6).
Fu, G.; Chen, S. and C. Liu, C. (2004). “Water Crisis in the Huang Ho (Yellow) River: Facts, Reasons, Impacts, and Countermeasures.” Paper presented at the 7th International Riversymposium (31 August– 3 September, Brisbane, Australia).
Galiani, S., Gertler, P.; and Schargrodsky, E. (2002). Water for Life: The Impact of the Privatization of Water Services on Child Mortality, Journal of Political Economy 113:83–120.
Gleick, P. (2004). The World’s water: The biennial report on freshwater resources 2004–2005, Island Press.
Gleick, P. (2009). The World’s water: The biennial report on freshwater resources 2008–2009. Island Press, London.
Global Water Intelligence (2010). Five things I learned at the Global Water Summit. Global Water Intelligence Newsletter April 2010. Available at www.globalwaterintel.com
Global Water Partnership (1992). Dublin statement and principles. Available at http://www.gwpforum.org/servlet/PSP?iNodeID=1345
Global Water Partnership (2000). Integrated Water Resource Management: TAC Background Paper No.4 www.cepis.ops-oms.org/bvsarg/i/fulltext/tac4/tac4.pdf
Global Water Partnership (2009a). Triggering change in water policies. Global Water Partnership.
Global Water Partnership (2009b). A Handbook for Integrated Water Resources Management in Basins. Global Water Partnership and the International Network of Basin Organizations.
Gould, J. (1999). Contributions Relating to Rainwater Harvesting, Contribution to the World Commission on Dams, Thematic Review IV.3: Assessment of Water Supply Options.
Grey, D. (2004). The World Bank and Water Resources: Management and Development. Presentation at World Bank Water Week 2004.
Grey, D. and Sadoff, C.W. (2007). Sink or Swim? Water security for growth and development, Water Policy 9:545–571.
de Groot, R.; de Wit, M.; Brown Gaddis, E.J.; Kousky, C.; McGhee, W. and Young, M.D. (2007). Making Restoration Work: Financial Mechanisms in Aronson, J.; Milton, S.J. and Blignaut, J.N. (eds.) Restoring Natural Capital: Science, Business and Practice. Island Press, London.
Guo, L. (2007). Ecology: Doing battle with the green monster of Taihu Lake, Science 317(5842): 1166.
Guria, A. (Chair). (2006). Enhancing access to finance for local governments. Financing Water for Agriculture. Report 1 of the Task Force on Financing Water for All. World Water Council, Marseille.
Hagos, F.; Boelee, E.; Awulachew, S.B.; Slaymaker, T.; Tucker. J. and Ludi, E. (2008). Water supply and sanitation (WSS) and poverty micro-level
149
Towards a green economy
linkages in Ethiopia. RIPPLE (Research Inspired Policy and Practice Learning in Ethiopia and the Nile Region) Working Paper Nº 8. Available at http://www.rippleethiopia.org/library.php/files/file/20090121-wp8-wss- and-poverty
Hansen, S. and Bhatia, R. (2004). Water and Poverty in a Macro-Economic Context. Norwegian Ministry of the Environment.
Herrador, D.; Dimas, L. A. and Méndez, V. E. (2002). Pago por servicios ambientales en El Salvador: Oportunidades y riesgos para pequeños agricultores y comunidades rurales (San Salvador: Fundación PRISMA).
Hutton, G. and Bartram, J. (2008a). Regional and global costs of attaining the water supply and sanitation target (target 10) of the Millennium Development Goals. World Health Organisation. http://www.who.int/water_sanitation_health/economic/cba_interventions/en/index.html
Hutton, G. and Bartram, J. (2008b). Global costs of attaining the Millennium Development Goal for water supply and sanitation, Bulletin of the World Health Organization 86:13–19.
Independent Evaluation Group (2010). Water and Development: An evaluation of World Bank Support, 1997-2007. World Bank, Washington DC.
Intergovernmental Panel on Climate Change (IPCC) (2008). Climate Change and Water. Technical Paper of the IPCC. Document IPCC-XXVIII/Doc.13 (8.IV.2008); pp. 7–8.
International Institute for Labour Studies (2009). World of Work Report 2009: The Global Jobs Crisis and Beyond. International Labour Office, Geneva.
Klein, G.; Krebs, M.; Hall, V.; O’Brien, T. and Blevins, B.B. (2005). California’s Water – Energy Relationship. Californian Energy Commission, Millennium Ecosystem Assessment (MEA). (2005). Ecosystems and Human Well-Being: Synthesis. Island Press, Washington, DC.
Korean Ministry of Environment and Korea Environment Institute (2009). Four major river restoration project of Republic of KOREA. Korea Environmental Policy Bulletin (KEPB), Issue 3, Volume VII.
Le Quesne, T.; Kendy, E. and Weston, D. (2010). The implementation challenge: Taking stock of government policies to protect and restore environmental flows. WWF Report. Available at http://www.hydrology.nl/images/docs/alg/2010_The_Implementation_Challenge.pdf
Lippman, T.W. (2010). Saudi Arabia’s quest for “food security”, Middle East Policy 17(1):90.
Lloyds (2010). Global water scarcity: Risks and Challenges for Business. Lloyds 360 Risk Insight Report. Available at http://www.greenbiz.com/business/research/report/2010/04/27/global-water-scarcity-risks-and-challenges-business
Marin, P. (2009). Public-private partnerships for urban water utilities – A review of experiences in developing countries. Trends and Policy Options No. 8. World Bank. World Bank Publications, Washington, DC.
Mejía, M.A., and Barrantes, G., 2003. Experiencia de pago por servicios ambientales de la Junta Administradora de Agua Potable y Disposición de Excretas (JAPOE) de Jesús de Otoro, Intibucá, Honduras. Tegucigalpa: PASOLAC.
Millennium Ecosystem Assessment (2005). Ecosystems and Human Well-being: Synthesis. Island Press, Washington, DC.
Molden, D. (1997). Accounting for water use and productivity. SWIM Paper 1 Available at http://www.iwmi.cgiar.org/publications/SWIM_Papers/PDFs/SWIM01.PDF
Molden, D. (ed.) (2007). Water for life, water for good: A comprehensive assessment of water management in agriculture. International Water Management Institute, Columbo and Earthscan, London.
Murray Darling Basin Authority (2010). Guide to the proposed Basin Plan. Murray Darling Basin Authority, Canberra.
Muller, M. (2008). Free basic water – a sustainable instrument for a sustainable future in South Africa, Environment and Urbanization 20(1): 67–87.
National Research Council (2010). Electricity from Renewable Resources: Status Prospects and Impediments. The National Academies Press, Washington, DC.
National Water Commission (2009). Australian water policy reform 2009: Second biennial assessment of progress in implementation of the National Water Initiative. National Water Commission, Canberra. Available at http://www.nwc.gov.au/resources/documents/2009_BA_complete_report.pdf
Nelson, G.C.; Rosegrant, M.W.; Koo, J.; Robertson, R.; Sulser, T.; Zhu, T.; Ringler, C.; Msangi, S.; Palazzo, A.; Batka, M.; Magalhaes, M.; Valmonte-Santos, R.; Ewing, M. and Lee, D. (2009). Climate Change: Impact on Agriculture and Costs of Adaptation. International Food Policy Research Institute Food Policy Report, Washington, D.C.
Neuman, J. and Chapman, C. (1999). Wading into the water market: The first five years of the Oregon Water Trust, Journal of Environmental
Law and Litigation 14:146–48. Available at http://www.law.uoregon.edu/org/jell/docs/v14_1_con.pdf
Nguyen, T.N.; Woodward, R.T.; Matlock, M.D.; Denzer, A. and Selman, M. (2006). A guide to market-based approaches to water quality. World Resources Institute, Washington, D.C.
OECD (2009). Managing water for all: An OECD perspective on pricing and financing. OECD, Paris.
OECD (2010). Pricing water resources and water sanitation services. OECD, Paris.
Office of National River Restoration (under Ministry of Land, Transport and Maritime Affairs). (2009). Restoration of four major rivers – Revival of rivers: A new Korea.
Pagiola, S. (2008). Payments for environmental services in Costa Rica, Ecological Economics 65(4):712–724.
Pagiola, S. and Platais, G. (2007). Payments for Environmental Services: From Theory to Practice. World Bank, Washington, DC.
Pagiola, S.; Zhang, W. and Colom, A. (2010). Can payments for watershed services help finance biodiversity conservation? A spatial analysis of Highland Guatemala, Journal of Natural Resources Policy Research 2(1):7–24.
Parikh, S.K. (Chair) (2007). Report of the Expert Group on “Groundwater management and ownership”. Government of India Planning Commission, New Delhi, September.
Robertson, M. (2009). The work of wetland credit markets: two cases in entrepreneurial wetland banking, Wetlands Ecology and Management 17(1):35–51.
Sachs, J.D. (2001). Macroeconomics and health: Investing in health for economic development. Report of the Commission on Macroeconomics and Health prepared for WHO.
Sanctuary, M. and Tropp, H. (2005). Making water a part of economic development: The economic benefits of improved water management services. Stockholm International Water Institute, Stockholm.
Scarborough, B. and Lund, H.L. (2007). Saving our streams: harnessing water markets, a practical guide. The Property & Environment Research, Bozeman, MT.
Scientific Expert Group Report on Climate Change and Sustainable Development (2007). Confronting climate change: Avoiding the unmanageable and managing the unavoidable. Full Report, Prepared for the 15th Session of the Commission on Sustainable Development. Scientific Expert Group on Climate Change (SEG), February 2007.
Southgate, D. and Wunder, S. (2007). Paying for watershed services in Latin America: A review of current initiatives. Working Paper 07–07. Blacksburg, VA: SANREM CRSP.
The Economics of Ecosystems and Biodiversity (TEEB) (2008). The economics of ecosystems and biodiversity. An interim report.
The Economics of Ecosystems and Biodiversity (TEEB) (2009a). The economics of ecosystems and biodiversity. Climate Issues Update.
The Economics of Ecosystems and Biodiversity (TEEB) (2009b). The economics of ecosystems and biodiversity for national and international policy makers. Summary: Responding to the value of nature.
The Economics of Ecosystems and Biodiversity (TEEB) (2009c). The Economics of Ecosystems and Biodiversity for National and International Policy Makers. Chapter 9: Investing in Ecological Infrastructure.
The Economist (2009). When rain falls. 12 September 2009, pp. 31–33.Transparency International (2008). Global Corruption Report 2008:
Corruption in the Water Sector. Cambridge University Press, Cambridge.UNESCO (2006). Water a shared responsibility: The United Nations
World Water Development Report 2. UNESCO Paris and Berghan Books, New York.
UNICEF (2004). State of the world’s children 2005. UNICEF, New York.United Nations Millennium Project (2004). Millennium development
goals needs assessments for Ghana, Tanzania, and Uganda. Background paper.
United Nations (2010a). UN CEO Water Mandate: Framework for responsible business engagement with water policy. Available at http://www.unglobalcompact.org/issues/Environment/CEO_Water_Mandate/
United Nations (2010b). The UN World Water Development Report: Water for people, water for life. Available at http://www.unesco.org/water/wwap/wwdr/table_contents.shtml
United Nations Economic Commission for Africa (UNECA) (1999). Global Economic Outlook 2000. Earthscan, London.
US Department of Energy (2006). Energy Demands on Water Resources. Report to
Congress on the Independency of Energy and Water, U.S. National Research
Council, Washington, DC. Available at http://www.sandia.gov/energy-water/docs/121-RptToCongress-EWwEIAcomments-FINAL.pdf
150

Water
Veritec Consulting (2008). Region of Durham efficient community: Final report, Regional Municipality of Durham, Ontario. Available at http://www.durham.ca/departments/works/water/efficiency/ECfinalReport.pdf
Vörösmarty, C.J.; McIntyre, C.J.; Gessner, M.O.; Dudgeon, D.; Prusevich, A.; Green, P.; Glidden, S.; Bunn, S.E.; Sullivan, C. A.; Reidy Liermann, C. and Davies, P.M. (2010). Global threats to human water security and river biodiversity, Nature 467:556–561.
Ward, J.; Kaczan, D. and Lukasiewicz, A. (2009). A water poverty analysis of the Niger Basin, West Africa Niger Basin Focal Project: Work Package 1. CSIRO Sustainable Ecosystems Report to the CGIAR Challenge Program on Water and Food.
WHO/UNICEF (2010). Progress on sanitation and drinking-water: 2010 Update. Available at http://www.who.int/water_sanitation_health/publications/9789241563956/en/index.html
Winpenny, J. (2003). Financing water for all: Report of the World Panel on Financing Water Infrastructure. World Water Council, Marseille.
World Bank (2005). Managing water resources to maximise sustainable growth: A country water resources assistance strategy for Ethiopia. Word Bank, Washington, DC. Available at http://vle.worldbank.org/bnpp/files/TF050714Ethiopiafinaltextandcover.pdf
World Bank (2007). Venezuela Expanding Partnerships for the National Parks System Project: Project Appraisal Document, Report No. 37502-VE. World Bank, Washington, DC.
World Bank – Water and Sanitation Programme (2008). Economic Impacts of Sanitation in Southeast Asia: A four-country study conducted in Cambodia, Indonesia, the Philippines and Vietnam under the Economics of Sanitation Initiative (ESI). World Bank, Jakarta.
World Commission on Dams (2000). Dams and development: a new framework for decision making. Earthscan, London.
World Health Organisation (2004). Water, sanitation and hygiene links to health: Facts and figures. WHO, Geneva.
World Health Organisation (2008). Progress on drinking water and sanitation: Special focus on sanitation: WHO/UNICEF joint monitoring programme for water supply and sanitation http://www.who.int/water_sanitation_health/monitoring/jmp2008/en/index.html
World Health Organisation (2010). UN-Water Global Annual Assessment of Sanitation and Drinking-Water. World Health Organisation: Targeting Resources for Better Results. Available at http://www.who.int/water_sanitation_health/glaas/en/
World Wide Fund for Nature (WWF) (2010). Living planet report 2010: Biodiversity, biocapacity and development. Available at http://wwf.panda.org/about_our_earth/all_publications/living_planet_report/
Wunder, S. and Albán, M. (2008). Decentralized payments for environmental services: The cases of Pimampiro and PROFAFOR in Ecuador, Ecological Economics 65(4):685–698.
Wunder, S.; Engel, S., and Pagiola, S. (2008). Taking stock: A comparative analysis of payments for environmental services programs in developed and developing countries, Ecological Economics 65(4):834–852.
Young, M. and McColl, J. (2010). A robust framework for the allocation of water in an ever changing world. Chapter 5 in Bjornlund, H. Ed. Incentive and Instruments for Sustainable Irrigation. WIT Press, Southampton.
Young, M.D. and McColl, J.C (2008). Double trouble: the importance of accounting for and defining water entitlements consistent with hydrological realities, Australian Journal of Agricultural and Resource Economics 53:19–35.
Young, M.D. (2010). Environmental effectiveness and economic efficiency of water use in agriculture: The experience of and lessons from the Australian water policy reform programme. Consultant report prepared for the OECD, Paris.
151