
Simulation of Water and Gas Injection in an Oil Reservoir ...

83 Int. Jnl. of Multiphysics Volume 11 · Number 1 · 2017
Water Injection for Oil Recovery by using Reservoir Simulation via CFD
G Silva1, B Correia1*, A Cunha2, B Santos1, A Lima1
1. Federal University of Campina Grande (UFCG), Brazil 2. Federal University of Sergipe (UFS), Brazil
ABSTRACT Water flooding process involves the water injection into the reservoir to
increase the oil recovery by oil displacement and pressure maintenance
mechanisms. This article is based on three-dimensional numerical
simulation of a homogeneous reservoir saturated by oil, 22.1°API, with water
injection using a non-structured mesh. In order to analyze the behavior of
formation and prediction of the fluid production, it was used the ANSYS CFX
12.0® commercial software. The model consists in a reservoir with the
dimensions, 270x180x15 m³, and two in parallel five-spot meshes,
considering the internal injection, and in the top of the reservoir, and
variations of water rate injected, during a total time of 72,000 hours of
project. Results of recovery factor, water production, saturation advance
front and pressure are presented and analyzed. Was observed that
increasing the water rate injected caused an increment in the oil recovery,
and consequently the water production, however better results were
obtained with injection on the top. This study allowed identifying best
practices to water injection optimization.
1. INTRODUCTION The oil field productivity depends on the reservoir size, complexity, primary mechanisms and the type and quantity of fluids it contains. Thereby, it is essential to define the formation characteristics and prediction of the production with the view to establish the feasibility in the oil exploration [1]. For this reason, reservoir simulation is widely used to analyze the reservoir behavior and to set and optimize a development plan for increasing the oil recovery efficiency. Further, simulation studies assists in reservoir development decisions, information about the porous media, its geology, and its degree of het-erogeneity and production–injection history, considering the importance of the time and pressure in reservoir to evaluate the potential applicability of different recovery processes [2]. When the reservoir pressure is reduced and decreases the produced oil rate, water or gas is injected to increase the reservoir pressure, wherewith some production wells are converted to injection wells. The mechanism for pressure maintenance in the reservoir has been designated as secondary oil recovery, and presents recovery factor ranging from 20 to 50%, depending the porous media properties and fluid characteristics. On the other hand, water injection is largely employed due ‘to the general availability of water, the relative ease with which water is injected and the ability with which water spreads through an oil-bearing
___________________________________ *Corresponding Author: [email protected]
84 Water Injection for Oil Recovery by using Reservoir Simulation via CFD
formation and water’s efficiency in displacing oil [3]. Thus, this paper intent to study reservoir simulation, applying water injection, in a homogeneous reservoir saturated by oil. Using an unstructured mesh it was considered Darcy’s law and Navier-Stokes equations to modelling the physical phenomena occur-ring in the reservoir. And basic flow equations for multiphase flow with the black oil model, explained by Aziz and Settari [4] which is the model of the fluid flow problem that assumes the existence at most three distinct phases: oil, water and gas. In this study, the problem is two-phase flow such that the black oil model considers water and oil in reservoir. Then, water is the wetting phase and the water phase and oil phase are immiscible with each other and they do not exchange mass or change phase. 2. PETROLEUM RESERVOIR 2.1. Reservoir Properties The study of the properties of the porous media is primordial to reservoir engineering science and reservoir simulation, inasmuch as allows knowing the production formation and enables to decide practical actions to improve the oil recovery. With the knowledge of the reservoir is possible to simulate fluid flow in a reservoir to obtain information about oil and water production and implement recovery methods.
Porosity, permeability, fluid saturations and distributions, electrical conductivity of the rock and the fluids, pore structure, and radioactivity are some of the more important petro physical properties of rocks [5].
Porosity is a measure of the space available for storage of petroleum; it is formally ‘de-fined as the ratio of the void space in a rock to the bulk volume of that multiplied by 100 to express in percent [6].
Porosity of the rocks can be original and induced: original porosity is that developed in the deposition of the material and induced porosity is that developed by some geologic process subsequent to deposition of the rock, and is typified by fracture development [6].
According to Craft and Hawkins [5] the effective porosity is the amount of the void space that contributes to the flow of fluids, which is usually measured in laboratory and utilized in calculations of the fluid flow. The measure in laboratory includes Boyle’s law, water-saturation and organic-liquid saturation methods.
Permeability of the porous media is defined as a measure of its ability to let through by fluids, or yet, permeability is a measure of the fluid conductivity of the particular material [7]. Relative permeability is a relation between the effective permeability and absolute permeability. Effective permeability is when the rock is only partially saturated with the fluid [8].
Relative permeability must be determined empirically or experimentally for each particular porous medium of interest, and depends on the water saturation (wetting phase saturation) but also on the direction of the saturation change (drainage or imbibition) [9].
Fanchi [10] explains that wettability is the ability of the fluid phase to preferentially wet a solid surface in the presence of a second immiscible phase. Capillary pressure is the pressure difference across the curved interface formed by two immiscible fluids in a small capillary tube. Capillary pressure increases with height above oil-water contact as water saturation decreases.

85 Int. Jnl. of Multiphysics Volume 11 · Number 1 · 2017
Mobility is a measure of the ability of a fluid to move through interconnected pore space.
Fluid phase mobility is defined as the ratio of the effective phase permeability to phase viscosity. Mobility for oil and water are given as follows [10]:
oo
o
kλµ
= (1)
ww
w
kλµ
= (2)
Mobility ration is defined as the mobility of the displacing fluid λD behind the front divided by the mobility of the displaced fluid λd ahead of the front. So, the mobility ratio of the water to oil for a water flooding is given by:
owcro
worrw
so
swow Sk
SkMwc
or
µµ
λλ
/)(/)(
)()(
, == (3)
2.2. Oil Recovery Processes The progressive oil recovery to production wells provoke a reducing reservoir pressure due to dissipation of primary energy. This fact, plus the resistance to fluid flow in the reservoir, translated into viscous and capillary forces in the porous medium, causes loss of productivity of the wells [7]. Accordingly, a range of oil recovery methods has been employed to improve the efficiency of the recovery, with supplementation of reservoir primary energy. Donaldson and collaborators [11] subdivide the oil recovery processes into three categories: primary, secondary and enhanced oil recovery.
Secondary oil recovery involves the introduction of energy into a reservoir by injection of one kind of fluid (gas or water) under pressure.
Energy added promotes the displacement of oil, providing additional recovery at increased rates [12]. According to Terry [13] on average, conventional production methods produce about 30% of the initial volume of oil in place. The remaining oil, about 70% of the initial attractive feature is a factor for enhanced oil recovery methods. Enhanced oil recovery methods include any method applied to recover more oil from a reservoir than would not be obtained by primary or secondary recovery. Farouq Ali et al. [14], report the thermal methods and the non-thermal methods as enhanced recovery methods. Some examples are steam injection for viscosity reduction and miscible methods, as miscible gas injection, and chemical methods [15].
2.2.1. Water Injection Water flooding is inexpensive and simple to use. Thus, it is dominant among fluid injection methods and is without question responsible for the current high oil producing rate within the America and Canada [8].
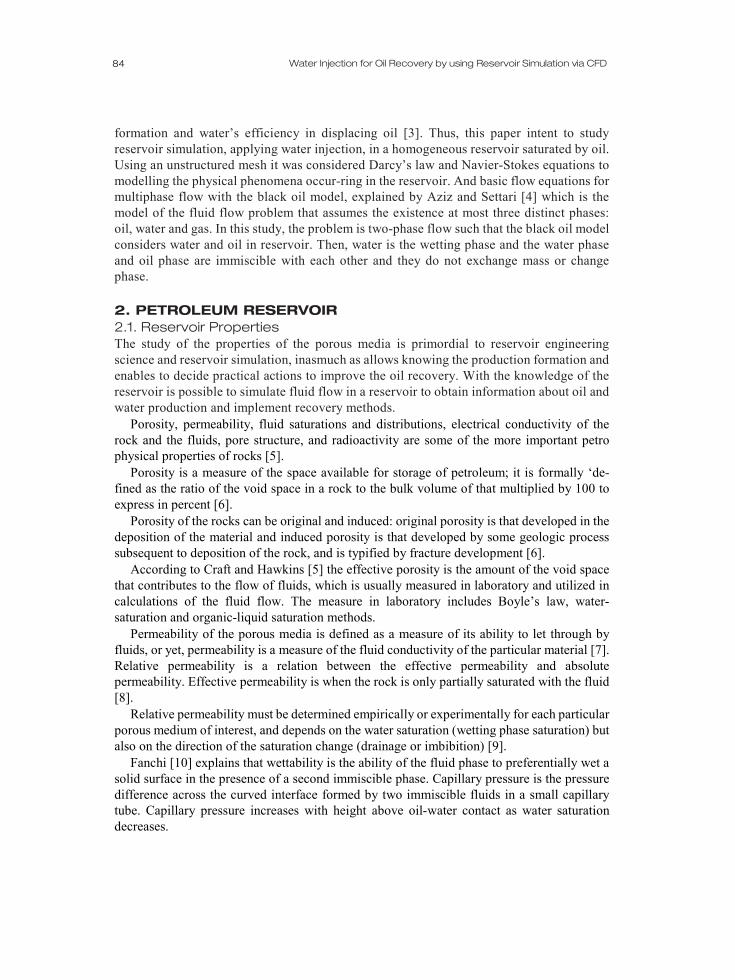
Water injection is a technique that uses injection wells and production wells to avail the energy with the water injected for displace oil to the production wells [16]. Figure 1 shows a scheme of water injection:
In water flooding, water would displace oil from pores in a formation in a manner representing a leaky piston. ‘In addition, the higher viscosity of crude oil in comparison to water will contribute to non-ideal displacement behavior. Several concepts will be defined
86 Water Injection for Oil Recovery by using Reservoir Simulation via CFD
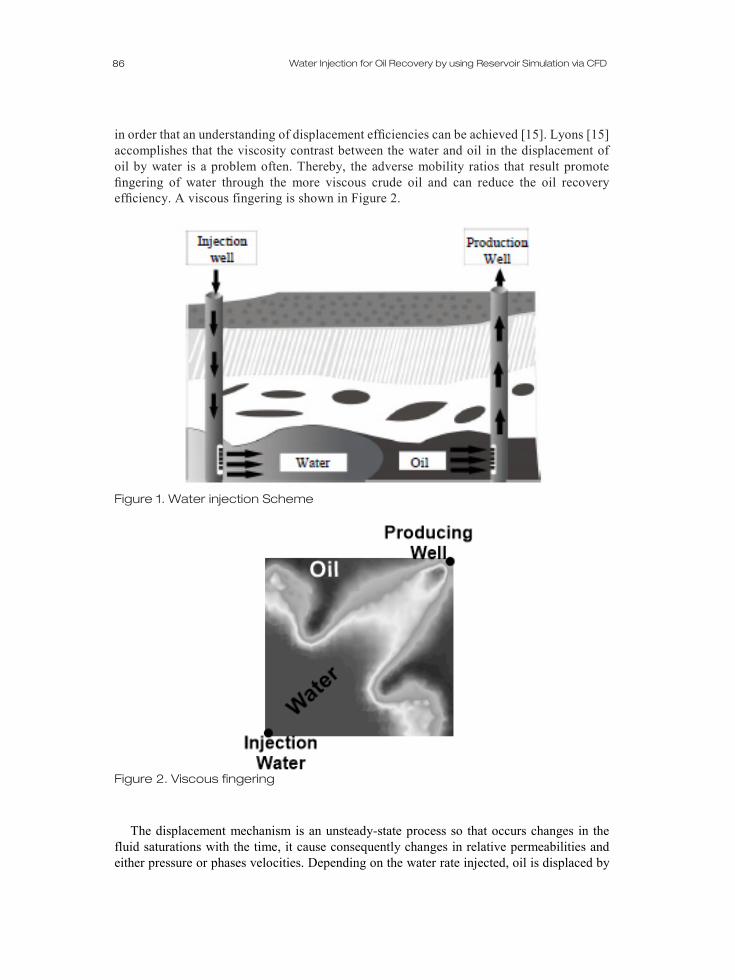
in order that an understanding of displacement efficiencies can be achieved [15]. Lyons [15] accomplishes that the viscosity contrast between the water and oil in the displacement of oil by water is a problem often. Thereby, the adverse mobility ratios that result promote fingering of water through the more viscous crude oil and can reduce the oil recovery efficiency. A viscous fingering is shown in Figure 2.
Figure 1. Water injection Scheme
Figure 2. Viscous fingering
The displacement mechanism is an unsteady-state process so that occurs changes in the fluid saturations with the time, it cause consequently changes in relative permeabilities and either pressure or phases velocities. Depending on the water rate injected, oil is displaced by
87 Int. Jnl. of Multiphysics Volume 11 · Number 1 · 2017
the water from the reservoir to the production wells. In the reservoir, water and oil flow simultaneously in the region behind the saturation change.
When the water zone reaches the end of the reservoir it is called Breakthrough, the point at which the water fraction increases significantly in the producing wells [17].
Dake [18] presents an equation for calculating the recovery factor (RF) using the ultimate oil recovery (UR). The recovery factor (RF) is used in discussion for analyzing the efficiency of the recovery with water injection applied, which is a number between zero and unity representing the fraction of recoverable oil, thus:
URSV
BRFwc
oi ⋅−
=)1(φ
(4)
where wcS represents the connate water saturation, Vϕ is the porous volume and oiB is
initial oil formation volume-factor. The ultimate oil recovery (UR) is the accumulated oil produced from the reservoir due to water injection. Accordingly, the recovery factor expresses the ratio of the recovered oil volume and the volume of oil in place. 3. MATHEMATICAL MODELING 3.1 Transport Equation Conservation equations that are used in this study to describe the flow in porous media correspond to a generalization of the Navier-Stokes and Darcy's law, used by ANSYS 12.0 CFX®. Specifically, the mass and momentum conservation equations are as follows:
( ) ( ) 0K Utφρ ρ∂
+ ∇• ⋅ =∂
(5)
( ) ˆ( ( ) )
2ˆ( ( ))3
T Me i
U KU Ut
K U U U S P
ρφ ρφ
µ δ φ φ
∂+∇• ⊗ −
∂
∇• ∇ +∇ − ∇⋅ = − ∇
(6)
where t is the time, φ is the porosity, ρ is the specific mass, K it is the absolute
permeability of the porous medium and U
is the actual velocity vector, the effective viscosity (or laminar viscosity) e 𝐾𝐾� = (𝐾𝐾𝑖𝑖𝑖𝑖) corresponding to a second order symmetric tensor, called area porosity tensor and M
iS is the source of linear momentum, represented by:
1 2 | |M R R Specii i iS C U C U U S= − − +
(7)
In Equation (7), the parameter CR1 is the linear coefficient of resistance, CR2 is quadratic coefficient of resistance, Spec
iS represents the other sources of momentum associated with the species present, and U and Ui are superficial velocities.
For low-velocity regime, fluid flowing in a porous medium, then one can represent the general equation of the Darcy’s law as follows:
| | Ui loss ii
P U K UX K
µ ρ∂− = +∂
(8)
where µ is the dynamic viscosity and lossK is the loss empirical coefficient. In ANSYS

88 Water Injection for Oil Recovery by using Reservoir Simulation via CFD
CFX® 12.0 the value is zero. So, it will be adopted in the same way in this work. Therefore,
Kµ must to be different from zero.
Comparing the equations (7) and (8), and using the superficial velocities, one can find the values of the coefficients CR1 and CR2 which are shown below:
1RCKµ
= (9)
2RlossC K ρ= (10)
Then denoting CR1 as R̂ = ( R̂ ij), this parameter will represent the resistance to flow in porous media.
In steady-state conditions and high strength, a high pressure gradient must be assigned to balance the resistance. In this situation, the two terms on the right side of the equation (6) are large and of opposite sign, and the convective and diffusion terms on the left side of the equation are negligible, thus, the term SiM may be found as shown below:
1M Ri iS C U= −
(11)
Putting equation (9) into equation (11) we have:
Mi iS U
Kµ
= − (12)
or yet,
Mi iS RU= −
(13)
Therefore, the high resistance limit, are obtained by an anisotropic version of Darcy's law, with the relative permeability tensor which is inverse of flow resistance.
3.2. Reservoir Geometrical Model The studied domain is a fraction of a given oil reservoir, with the top 200 meters depth, as pictured in Figure 3.
Figure 3. Model and distribution of wells

89 Int. Jnl. of Multiphysics Volume 11 · Number 1 · 2017
Table 1. Reservoir and Fluid Data Parameters Value Source Temperature (°C) 37.8 Cunha [18] Initial oil saturation (%) 100 Cunha [18] Initial water saturation (%) 0 Cunha [18] Horizontal Permeability (m²) 9.869233x10⁻¹³ Aires [19] Vertical Permeability (m²) 9.869233x10⁻¹³ Aires [19] Porosity (%) 28 Ruiz [20] Initial pressure (kPa) 12,159 Cunha [18] Oil Viscosity @ 37.8 ° C (Pa.s) 0.17 Cunha [18] Oil volume "in place" (m³) 186,876 - Reservoir volume (m³) 667,415 - Oil specific mass (kg/m³) 868.7 Cunha [18] Molecular weight of oil (kg/kmol) 105.47 Cunha [18] Water specific mass (kg/m³) 942.5 Cunha [18] Molecular weight of water (kg/kmol) 18.02 Cunha [18] Surface tension of water/oil (N/m) 0.03 Cunha [18]
The geometrical model consists of two meshes "five-spot" inverted in parallel, as can be observed in the Figure 3. The grid consists of a homogeneous reservoir with dimensions of 270 m x 180 m x 15 m, created in ICEM CFD-12.0. Thereafter, it decided on an unstructured mesh, yielding a total of 1,221,614 tetrahedral elements.
3.3. Boundary conditions and reservoir characteristics In Table 1 are shown the properties and characteristics of the reservoir model being studied. The characteristics of the porous media and fluid were adopted upon conception of the studied literature.
Impermeable surface conditions were adopted in the top, bottom and side, that represent the boundaries of the reservoir as well as the walls of the injector and producing wells, i.e., all components of the velocities on the three directions are equal to zero.
3.4 Studied cases Herein were simulated different physical situations with variations in the injected water volumetric flow rate, for appraising the influence of this operational parameter in the efficiency of injected the method. The variations of water injected rate are shown in Table 2. Table 2. Operational parameters Parameters Value Injected water rate (m³/d) 45.8 91.7 137.5
Beyond to the variation in the injection flow rate, also it was varied the position regarding the injection wells. For the simulated cases two situations were analyzed: well 1.5 m from the top of the model and the other with well disposed on the surface of the reservoir.
90 Water Injection for Oil Recovery by using Reservoir Simulation via CFD
Thus, for the simulations were fixed the characteristics of the formation and fluid, and
varying the positions of injection wells and injected water volumetric flow rates. The aim was to observe the behavior of water front advancement, and final oil recovery.
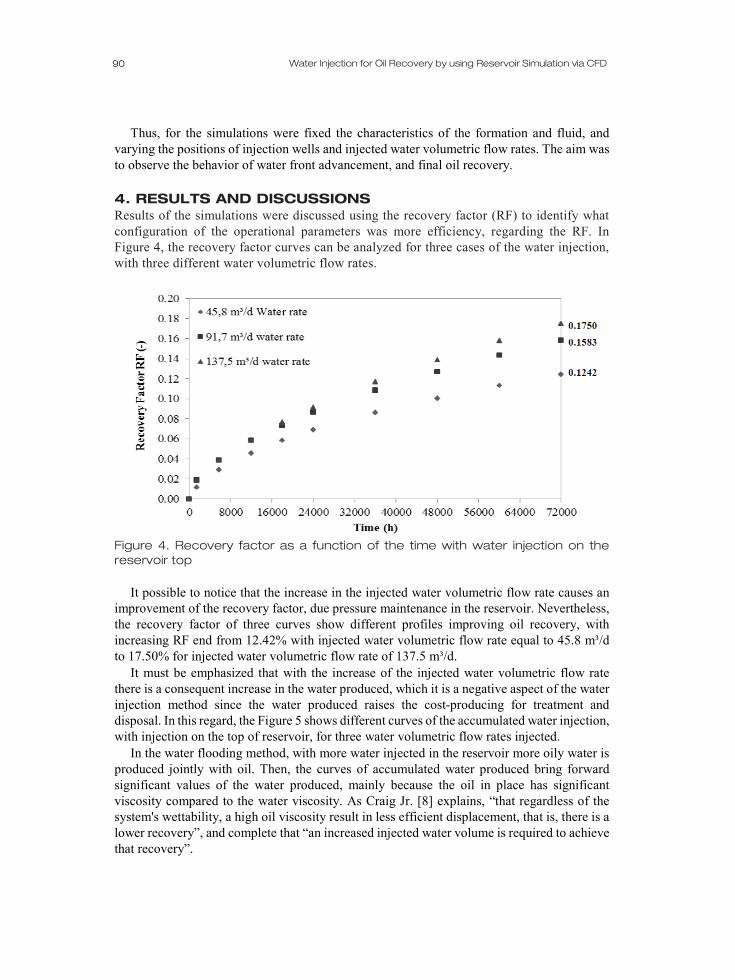
4. RESULTS AND DISCUSSIONS Results of the simulations were discussed using the recovery factor (RF) to identify what configuration of the operational parameters was more efficiency, regarding the RF. In Figure 4, the recovery factor curves can be analyzed for three cases of the water injection, with three different water volumetric flow rates.
Figure 4. Recovery factor as a function of the time with water injection on the reservoir top
It possible to notice that the increase in the injected water volumetric flow rate causes an
improvement of the recovery factor, due pressure maintenance in the reservoir. Nevertheless, the recovery factor of three curves show different profiles improving oil recovery, with increasing RF end from 12.42% with injected water volumetric flow rate equal to 45.8 m³/d to 17.50% for injected water volumetric flow rate of 137.5 m³/d.
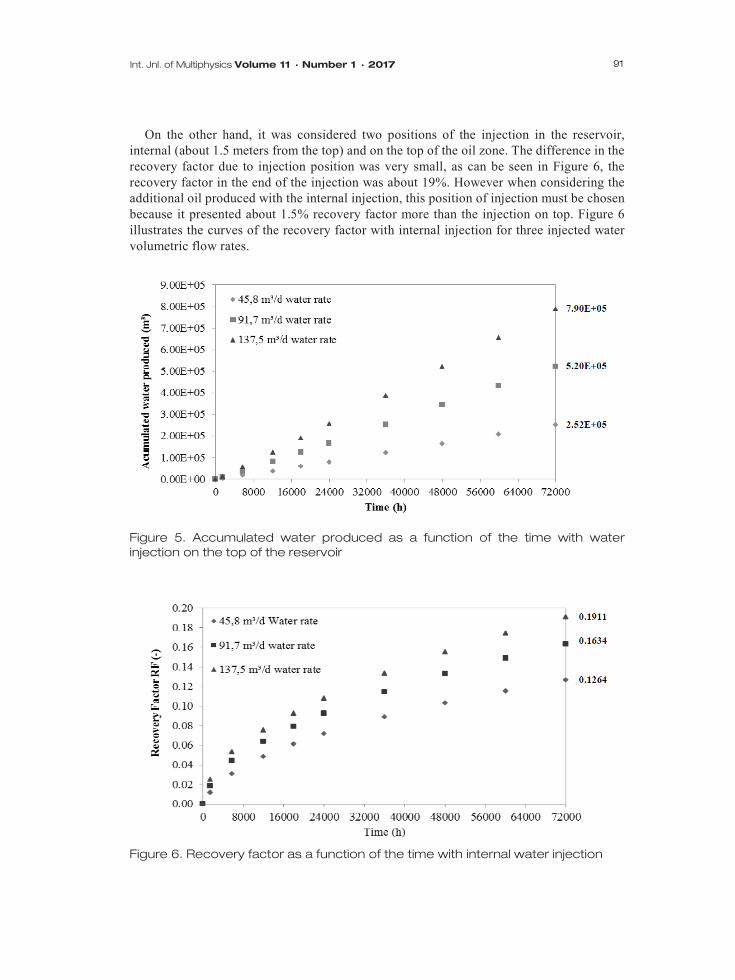
It must be emphasized that with the increase of the injected water volumetric flow rate there is a consequent increase in the water produced, which it is a negative aspect of the water injection method since the water produced raises the cost-producing for treatment and disposal. In this regard, the Figure 5 shows different curves of the accumulated water injection, with injection on the top of reservoir, for three water volumetric flow rates injected.
In the water flooding method, with more water injected in the reservoir more oily water is produced jointly with oil. Then, the curves of accumulated water produced bring forward significant values of the water produced, mainly because the oil in place has significant viscosity compared to the water viscosity. As Craig Jr. [8] explains, “that regardless of the system's wettability, a high oil viscosity result in less efficient displacement, that is, there is a lower recovery”, and complete that “an increased injected water volume is required to achieve that recovery”.
91 Int. Jnl. of Multiphysics Volume 11 · Number 1 · 2017
On the other hand, it was considered two positions of the injection in the reservoir, internal (about 1.5 meters from the top) and on the top of the oil zone. The difference in the recovery factor due to injection position was very small, as can be seen in Figure 6, the recovery factor in the end of the injection was about 19%. However when considering the additional oil produced with the internal injection, this position of injection must be chosen because it presented about 1.5% recovery factor more than the injection on top. Figure 6 illustrates the curves of the recovery factor with internal injection for three injected water volumetric flow rates.
Figure 5. Accumulated water produced as a function of the time with water injection on the top of the reservoir
Figure 6. Recovery factor as a function of the time with internal water injection

92 Water Injection for Oil Recovery by using Reservoir Simulation via CFD
The curves shown in the Figure 6 presents almost the same behavior of the Figure 4, the
difference is that Figure 6 indicates that the oil bank reaches production wells faster as compared with injection on the top of the reservoir, a subtle way.
The accumulated water produced is illustrated in Figure 7, as internal water injection is used.
Figure 7. Accumulated water produced as a function of the time with internal water injection
The accumulated water produced had reduced with the internal injection comparing with
the injection on the top, from 790,218 m³ to 789,585 m³ for 137.5 m³/d of water volumetric flow rate injected, about 600 m³ less produced oily water. Consequently, according to the increment of the recovery factor and produced water reduction, the configuration chosen is the internal injection with 137.5 m³/d of the water rate to check the advance of the water injected and pressure on time into the reservoir.
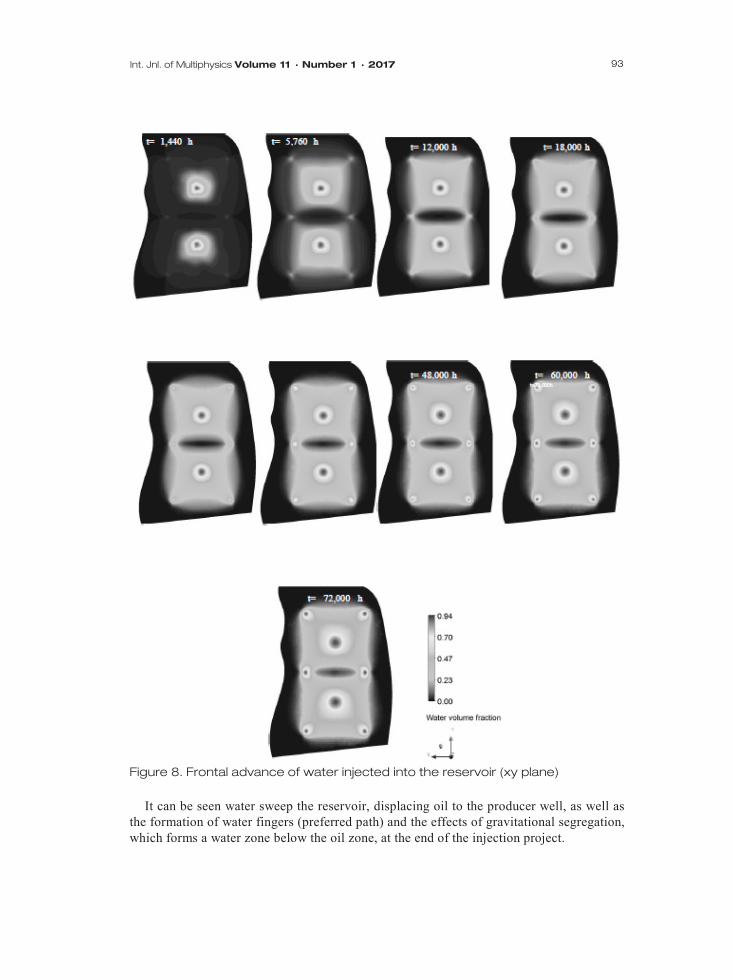
Figure 8 brings out the frontal view of the water front position into the reservoir, from the injection well to the production wells, in the specified injection times.
In Figure 8 was possible to identify that the breakthrough time is between 5,760 and 12,000 hours of the injection, in other words, the frontal advance of water injected occurs near the beginning of the injection process, and from that moment the production of water increases considerably. On the other hand, it should be noted that water could sweep significantly the reservoir, displacing oil.
Notwithstanding, Craig Jr. [8] reports that at the time of the water breakthrough, only a portion of the reservoir area lying between injected well and production wells is contacted by water, and complement that this contacted reservoir fraction is the pattern areal sweep efficiency at breakthrough.
Figure 9 shows up the water frontal advance in a cross section area, plane xz, which presents one injection well (in the center) and two production wells, for three different times of injection.
93 Int. Jnl. of Multiphysics Volume 11 · Number 1 · 2017
Figure 8. Frontal advance of water injected into the reservoir (xy plane)
It can be seen water sweep the reservoir, displacing oil to the producer well, as well as the formation of water fingers (preferred path) and the effects of gravitational segregation, which forms a water zone below the oil zone, at the end of the injection project.

94 Water Injection for Oil Recovery by using Reservoir Simulation via CFD
Another relevant aspect is about the evolution of the pressure in to the reservoir. In Figure
10, it is verified that the pressure distribution in the reservoir in a vertical plane 7.5 m from the base of the reservoir, for the case of injected water volumetric flow rate 137.5 m³ / d, with injection into the reservoir.
Figure 9. Frontal advance of water injected into the reservoir (xz plane)
Figure 10. Pressure distribution in the xz plane
The main effects of water injection into the reservoir are oil displacement by water front
advancement and maintaining the pressure [7,8,17,21,22], which is a direct consequence of the conservation of mass in the reservoir. Nevertheless, as seen in the image will be noticed that during the oil production process, the reservoir pressure drops continuously, even with the injection of water trying to maintain or increase the pressure in the reservoir, it is not enough to keep the constant pressure in the reservoir.
Water volumetric fraction
95 Int. Jnl. of Multiphysics Volume 11 · Number 1 · 2017
5. CONCLUSIONS Based on successful numerical analysis, it can be seen that the recovered oil percentage showed a direct relationship with increasing water flooding, so the recovery factor ranged from approximately 12.64% to 19.11% for a minimum water volumetric flow rate of 45.8 m³/d and maximum water volumetric flow rate of 137.5 m³/d, respectively, as internal injection is used. Analyzing the data injection on top of the reservoir there was obtained a recovery factor ranging from 12.42% to 17.5% also for same minimum and maximum water volumetric flow rate, respectively. For the higher injection flow (internal), was obtained accumulated oil production of 35,713.68 m³ and for lower flow rate the value of this parameter was 23,612.28 m³.
Through numerical simulations, it has been observed that the water tends to form preferential paths towards the production wells, in view of the difference between the oil and water viscosities is very significant. Due to the low pressure gradient between injector and producer wells, occurs the segregation of water to the bottom of the reservoir forming cones toward the producing wells. The characteristics of the producing formation and fluid properties have great influence on the final oil recovery and success of the chosen recovery method.
ACKNOWLEDGEMENTS The authors thanks to CAPES, CNPq, ANP/UFCG-PRH-25 and PETROBRAS S/A, for financial support to the project and the grant of scientific initiation scholarship.
REFERENCES [1] Jahn, F. Cook, M. and Graham, M., 2003. Hydrocarbon exploration and production.
Developments in Petroleum science, 46, Elsevier Science, Aberdeen, United Kingdom, 7th edition.
[2] Alvarado, V. and Manrique, E., 2010. Enhanced oil recovery: field planning and development strategies. Elsevier, Gulf Professional Publishing, Burlington, USA.
[3] Asadollahi, M., 2012. Waterflooding optimization for improved reservoir management. Ph.D. thesis, Norwegian University of Science and technology, Trondheim, Norway.
[4] Aziz, K., and Settari, A., 1979. Petroleum reservoir simulation. Applied Science Publishers LTD, London.
[5] Craft, B. C., M. Hawkins, and R. E. Terry. Applied Petroleum Reservoir Engineering. 2nd. (1991).
[6] Amyx,J.W, Bass Jr., D.M. and Whiting,R.L., 1960. Petroleum reservoir engineering: Pysical properties. McGraw-Hill Classic Texbook Reissue, Texas.
[7] Rosa, A. J. C., R. S.; Xavier, J. A. D., 2006. Petroleum Reservoir Engineering. Editora Interciência. Rio de Janeiro, Brazil (In Portuguese).
[8] Craig Jr., F.F., 1971. The reservoir engineering aspects of waterflooding. Society of Petroleum Engineers of AIME, New York/Dallas, USA, 2nd edition.
[9] Chen, Z., Huan, G., & Ma, Y. ,2006. Computational methods for multiphase flows in porous media. Society for Industrial and Applied Mathematics.

96 Water Injection for Oil Recovery by using Reservoir Simulation via CFD
[10] Fanchi, J.R., 2001. Principles of applied reservoir simulation: clear, concise computer-based introduction to practical reservoir modeling complete with fully-functioning reservoir simulator. Gulf Professional Publishing of Elsevier, 2nd edition, Houston, TX.
[11] Donaldson, E.C., Chilingarian, G.V. and Yen, T.F., 1989. Enhanced oil recovery II: processes and operations. Developments in Petroleum Science, 17B, Elsevier science publishing, Amsterdam, Netherlands.
[12] Teknica Petroleum Services Ltda., 2001. Enhanced oil recovery. Alberta. [13] Terry, R.E., 2001. Enhanced Oil Recovery. In Encyclopedia of Physical Science and
Tchnology, 3rd Edition, vol. 18. Robert A. Meyers Ed., Academic Press, 2001, pp 503-518.
[14] Farouq Ali, S.M.; Jones, J.A.; Meldau, R.F., 1997. Practical heavy oil recovery. University of Alberta, Alberta.
[15] Lyons, W.C., 2010. Working guide to reservoir engineering. Published by Elsevier Inc, Oxford.
[16] Thomas, J.L., 2001. Petroleum engineering fundamentals. Ed. Interciência, 2nd edition, Rio de Janeiro (In Portugese).
[17] Willhite, G.P., 1986. Waterflooding. Society of Petroleum Engineers – SPE, Richardson, USA, 3th edition.
[18] Cunha, A. L., 2010. Advanced recovery not isothermal heavy oil in petroleum reservoirs via numerical simulation. Chemical Engineering, Master's thesis, Federal university of Campina Grande, Brazil (In Portuguese).
[19] Aires, J. D. M., 2013. Study and development of a heavy oil field subjected to the continuous steam injection process. Term paper, Federal University of Rio Grande do Norte, Natal, Brazil (In Portuguese).
[20] Ruiz, C. P. A. Comparative study of the water injection using vertical and horizontal wells. Master's thesis, Federal University of Rio Grande do Norte, Natal, Brazil 2012 (In Portuguese).
[21] Dake, L.P., 1998. Fundamentals of numerical reservoir simulation. Developments in Petroleum Science, 8, Elsevier Science, Shell Learning and development, Amsterdam, Netherlands, 17th edition.
[22] Ahmed, T., 2006. Reservoir engineering handbook. Elsevier Science - Gulf Professional Publishing, Burlington, USA, 3th edition.