Water in the Western Cape region of the Gulf of ... · PDF fileWater in the Western Cape...
74
Water in the Western Cape region of the Gulf of Carpentaria Drainage Division A report to the Australian Government from the CSIRO Northern Australia Sustainable Yields Project August 2009
Transcript of Water in the Western Cape region of the Gulf of ... · PDF fileWater in the Western Cape...

Water in the Western Cape region of the Gulf of Carpentaria Drainage DivisionA report to the Australian Government from the CSIRO Northern Australia Sustainable Yields Project
August 2009

ii Water in the Western Cape region August 2009 © CSIRO 2009
Northern Australia Sustainable Yields Project acknowledgments
Prepared by CSIRO for the Australian Government under the Raising National Water Standards Program of the National Water Commission (NWC). Important aspects of the work were undertaken by the Northern Territory Department of Natural Resources, Environment, The Arts and Sport (NRETAS); the Queensland Department of Environment and Resource Management (QDERM); the New South Wales Department of Water and Energy; Sinclair Knight Merz; Environmental Hydrology Associates and Jolly Consulting.
The Project was guided and reviewed by a Steering Committee (Kerry Olsson, NWC – co-chair; Chris Schweizer, Department of the Environment, Water, Heritage and the Arts (DEWHA) – co-chair; Tom Hatton, CSIRO; Louise Minty, Bureau of Meteorology (BoM); Lucy, Vincent, Bureau of Rural Sciences (BRS); Tom Crothers, QDERM; Lyall Hinrichsen, QDERM; Ian Lancaster, NRETAS; Mark Pearcey, DoW; Michael Douglas, Tropical Rivers and Coastal Knowledge (TRaCK); Dene Moliere, Environmental Research Institute of the Supervising Scientist (eriss); secretariat support by Angus MacGregor, DEWHA) and benefited from additional reviews by a Technical Reference Panel and other experts, both inside and outside CSIRO.
Northern Australia Sustainable Yields Project disclaimers
Derived from or contains data and/or software provided by the Organisations. The Organisations give no warranty in relation to the data and/or software they provided (including accuracy, reliability, completeness, currency or suitability) and accept no liability (including without limitation, liability in negligence) for any loss, damage or costs (including consequential damage) relating to any use or reliance on the data or software including any material derived from that data or software. Data must not be used for direct marketing or be used in breach of the privacy laws. Organisations include: the Northern Territory Department of Natural Resources, Environment, The Arts and Sport; the Queensland Department of Environment and Resource Management; the New South Wales Department of Water and Energy.
CSIRO advises that the information contained in this publication comprises general statements based on scientific research. The reader is advised and needs to be aware that such information may be incomplete or unable to be used in any specific situation. No reliance or actions must therefore be made on that information without seeking prior expert professional, scientific and technical advice. To the extent permitted by law, CSIRO (including its employees and consultants) excludes all liability to any person for any consequences, including but not limited to all losses, damages, costs, expenses and any other compensation, arising directly or indirectly from using this publication (in part or in whole) and any information or material contained in it. Data are assumed to be correct as received from the organisations.
Citation
CSIRO (2009) Water in the Western Cape region, pp 417-479 in CSIRO (2009) Water in the Gulf of Carpentaria Drainage Division. A report to the Australian Government from the CSIRO Northern Australia Sustainable Yields Project. CSIRO Water for a Healthy Country Flagship, Australia. xl + 479pp
Publication Details
Published by CSIRO © 2009 all rights reserved. This work is copyright. Apart from any use as permitted under the Copyright Act 1968, no part may be reproduced by any process without prior written permission from CSIRO.
ISSN 1835-095X
Cover photograph: Wetlands near Weipa
Courtesy of the National Water Commission
Photographer: Kerry Olsson
© CSIRO 2009 August 2009 Water in the Western Cape region ▪ iii
Director’s Foreword Following the November 2006 Summit on the southern Murray-Darling Basin (MDB), the then Prime Minister and MDB state Premiers commissioned CSIRO to undertake an assessment of sustainable yields of surface and groundwater systems within the MDB. The project set an international benchmark for rigorous and detailed basin-scale assessment of the anticipated impacts of climate change, catchment development and increasing groundwater extraction on the availability and use of water resources.
On 26 March 2008, the Council of Australian Governments (COAG) agreed to expand the CSIRO assessments of sustainable yield so that, for the first time, Australia would have a comprehensive scientific assessment of water yield in all major water systems across the country. This would allow a consistent analytical framework for water policy decisions across the nation. The Northern Australia Sustainable Yields Project, together with allied projects for Tasmania and south-west Western Australia, will provide a nation-wide expansion of the assessments.
The CSIRO Northern Australia Sustainable Yields Project is providing critical information on current and likely future water availability. This information will help governments, industry and communities consider the environmental, social and economic aspects of the sustainable use and management of the precious water assets of northern Australia.
The projects are the first rigorous attempt for the regions to estimate the impacts of catchment development, changing groundwater extraction, climate variability and anticipated climate change on water resources at a whole-of-region scale, explicitly considering the connectivity of surface and groundwater systems. To do this, we are undertaking the most comprehensive hydrological modelling ever attempted for the region, using rainfall-runoff models, groundwater recharge models, river system models and groundwater models, and considering all upstream-downstream and surface-subsurface connections.
To deliver on the projects CSIRO is drawing on the scientific leadership and technical expertise of national and state government agencies in Queensland, Tasmania, the Northern Territory and Western Australia, as well as Australia’s leading industry consultants. The projects are dependent on the cooperative participation of over 50 government and private sector organisations. The projects have established a comprehensive but efficient process of internal and external quality assurance on all the work performed and all the results delivered, including advice from senior academic, industry and government experts.
The projects are led by the Water for a Healthy Country Flagship, a CSIRO-led research initiative established to deliver the science required for sustainable management of water resources in Australia. By building the capacity and capability required to deliver on this ambitious goal, the Flagship is ideally positioned to accept the challenge presented by this complex integrative project.
CSIRO has given the Sustainable Yields Projects its highest priority. It is in that context that I am very pleased and proud to commend this report to the Australian Government.
Dr Tom Hatton
Director, Water for a Healthy Country
National Research Flagships
CSIRO

iv Water in the Western Cape region August 2009 © CSIRO 2009
Contributors to the Northern Australia Sustainable Yields Project
Project director Tom Hatton
Sustainable Yields coordination Mac Kirby
Project Leader Richard Cresswell
Project Support Andrea Davis, Malcolm Hodgen, Sue Jackson, Helen Beringen, Justin Story, Siobhan Duffy, Therese McGillion, Jeff Camkin
Data Management Mick Hartcher
Climate Tim McVicar, Randall Donohue, Janice Bathols, Francis Chiew, Dewi Kirono, Lingtao Li, Steve Marvanek, David Post, Nick Potter, Ian Smith, Tom Van Neil, Wenju Cai
New South Wales Department of Water and Energy: Jin Teng
Catchment Yield Cuan Petheram, Paul Rustomji, Jamie Vleeshouwer, Donna Hughes, Jean-Michel Perraud, Ang Yang, Lu Zhang
Sinclair Knight Merz: Brad Neal, Amanda Bell, Werner Hennecke, Damon Grace, Derek Goodin, Rory Nathan, David Stephens, Nicola Logan, Sarah Gosling, Zuzanna Graszkiewicz
Queensland Department of Environment and Resource Management: Alex Loy, Greg Hausler, Sarah Giles, David Li, Amanda Casey
Groundwater Glenn Harrington, Russell Crosbie, Phil Davies, James McCallum, Warrick Dawes, Matthew Lenahan, David Rassam
Sinclair Knight Merz: Rick Evans, Roger Cranswick, Eliza Wiltshire
Jolly Consulting: Peter Jolly
Environmental Hydrology Associates: Peter Evans, Jerome Arunakumaren, Wesley Burrows, Judith Raue
Northern Territory Department of Natural Resources, Environment, The Arts and Sport: Anthony Knapton, Lynton Fritz, Steven Tickell
Queensland Department of Environment and Resource Management: Linda Foster, Ralph DeVoil
Environment Dave McJannet, Anne Henderson, Joe McMahon, Jim Wallace
Reporting Susan Cuddy, Becky Schmidt, Heinz Buettikofer, Elissa Churchward, Alex Dyce, Simon Gallant, Chris Maguire, Frances Marston, Linda Merrin, Ben Wurcker
dmwcreative: Maureen Wicks, David Wicks
CSIRO unless otherwise indicated; Team Leaders underlined

© CSIRO 2009 August 2009 Water in the Western Cape region ▪ v
Table of contents WC-1 Water availability and demand in the Western Cape region........................................ 419
WC-1.1 Regional summary .......................................................................................................................................................420 WC-1.2 Water resource assessment ........................................................................................................................................421 WC-1.3 Changes to flow regime at environmental assets ........................................................................................................422 WC-1.4 Seasonality of water resources ....................................................................................................................................423 WC-1.5 Surface–groundwater interaction .................................................................................................................................423 WC-1.6 Water storage options ..................................................................................................................................................425 WC-1.7 Data gaps.....................................................................................................................................................................426 WC-1.8 Knowledge gaps...........................................................................................................................................................426 WC-1.9 References...................................................................................................................................................................426
WC-2 Contextual information for the Western Cape region .................................................... 427 WC-2.1 Overview of the region .................................................................................................................................................428 WC-2.2 Data availability ............................................................................................................................................................437 WC-2.3 Hydrogeology ...............................................................................................................................................................440 WC-2.4 Legislation, water plans and other arrangements ........................................................................................................444 WC-2.5 References...................................................................................................................................................................448
WC-3 Water balance results for the Western Cape region....................................................... 449 WC-3.1 Climate .........................................................................................................................................................................449 WC-3.2 WAVES potential diffuse recharge estimations............................................................................................................456 WC-3.3 Conceptual groundwater models .................................................................................................................................460 WC-3.4 Groundwater modelling results ....................................................................................................................................461 WC-3.5 Rainfall-runoff modelling results...................................................................................................................................461 WC-3.6 River system water balance .........................................................................................................................................474 WC-3.7 Changes to flow regime at environmental assets ........................................................................................................475 WC-3.8 References...................................................................................................................................................................479

vi ▪ Water in the Western Cape region August 2009 © CSIRO 2009
Tables Table WC-1. Estimated groundwater contribution (baseflow) to streamflow, modelled diffuse recharge and groundwater extraction for the Western Cape region under historical climate......................................................................................................................421 Table WC-2. List of Wetlands of National Significance located within the Western Cape region....................................................433 Table WC-3. Estimated stock and domestic groundwater use and sum of groundwater entitlements for the Western Cape region.........................................................................................................................................................................................................444 Table WC-4. Current unallocated waterreserves for the Western Cape region ..............................................................................446 Table WC-5. Mean annual (water year), wet season and dry season rainfall and areal potential evapotranspiration in the Western Cape region under historical climate and Scenario C......................................................................................................................453 Table WC-6. Recharge scaling factors in the Western Cape region for scenarios A, B and C .......................................................456 Table WC-7. Summary results under 45 Scenario C simulations (numbers show percentage change in mean annual rainfall and recharge under Scenario C relative to Scenario A) .........................................................................................................................459 Table WC-8. Summary results under the 45 Scenario C simulations for the modelling subcatchments in the Western Cape region (numbers show percentage change in mean annual rainfall and modelled runoff under Scenario C relative to Scenario A) .........469 Table WC-9. Water balance over the entire Western Cape region under Scenario A and under scenarios B and C relative to Scenario A .......................................................................................................................................................................................471 Table WC-10. Standard metrics for changes to surface water flow regime at environmental assets in the Western Cape region under scenarios A, B, C and D ........................................................................................................................................................476
Figures Figure WC-1. Major rivers, towns and location of environmental assets selected for assessment of changes to hydrological regime in the Western Cape region .............................................................................................................................................................419 Figure WC-2. Surface geology and modelled mean dry season baseflow of the Western Cape region .........................................424 Figure WC-3. Locations of spring groups and potential river baseflow in the Western Cape region...............................................425 Figure WC-4. Surface geology of the Western Cape region overlaid on a relative relief surface....................................................429 Figure WC-5. Historical (a) annual and (b) mean monthly rainfall averaged over the Western Cape region. The low-frequency smoothed line in (a) indicates longer term variability .......................................................................................................................430 Figure WC-6. Map of current vegetation types across the Western Cape region (source DEWR, 2005) .......................................431 Figure WC-7. Map of dominant land uses of the Western Cape region (after BRS, 2002) .............................................................432 Figure WC-8. False colour satellite image of the Archer River Aggregation (derived from ACRES, 2000). Clouds may be visible in image ...............................................................................................................................................................................................433 Figure WC-9. False colour satellite image of the Jardine River Wetlands Aggregation (derived from ACRES, 2000). Clouds may be visible in image ................................................................................................................................................................................434 Figure WC-10. False colour satellite image of the Northern Holroyd Plain Aggregation (derived from ACRES, 2000). Clouds may be visible in image ...........................................................................................................................................................................435 Figure WC-11. False colour satellite image of the Port Musgrave Aggregation (derived from ACRES, 2000). Clouds may be visible in image ...........................................................................................................................................................................................436 Figure WC-12. Location of streamflow gauging stations overlaid on a relative relief surface showing the proportion of gauges with flow above maximum gauged stage height across the Western Cape region.................................................................................438 Figure WC-13. Current groundwater monitoring bores in the Western Cape region.......................................................................439 Figure WC-14. Groundwater salinity (as electricalconductivity – EC) distribution for all bores drilled in the Western Cape region 443 Figure WC-15. Groundwater management areas of the Great Artesian Basin in the Western Cape region...................................445 Figure WC-16. (a) Historical annual rainfall and (b) its divergence from the long-term mean; and (c) historical annual areal potential evapotranspiration and (d) its deviation from the long-term mean averaged over the Western Cape region. The low-frequency smoothed line in (a) indicates longer term variability .......................................................................................................................450 Figure WC-17. Historical mean monthly (a) rainfall and (b) areal potential evapotranspiration and their temporal variation (range and ± one standard deviation) averaged over the Western Cape region ........................................................................................450 Figure WC-18. Spatial distribution of historical mean annual (water year), wet season and dry season rainfall and areal potential evapotranspiration (potential evaporation) and their difference (rainfall less areal potential evapotranspiration) across the Western Cape region .....................................................................................................................................................................................451 Figure WC-19. Spatial distribution of (a) historical and (b) recent mean annual rainfall; and (c) their relative percent difference and (d) the statistical significance of these differences across the Western Cape region. (Note that historical in this case is the 66-year period 1930 to 1996)........................................................................................................................................................................452 Figure WC-20. Mean monthly (a) rainfall and (b) areal potential evapotranspiration averaged over the Western Cape region under historical climate and Scenario C. (C range is the range under the 45 Scenario C simulations – the lower and upper limits in C range are therefore not the same as scenarios Cdry and Cwet) .....................................................................................................453 Figure WC-21. Spatial distribution of mean annual (water year), wet season and dry season rainfall across the Western Cape region under historical climate and Scenario C ...............................................................................................................................454
© CSIRO 2009 August 2009 Water in the Western Cape region ▪ vii
Figure WC-22. Spatial distribution of mean annual (water year), wet season and dry season areal potential evapotranspiration across the Western Cape region under historical climate and Scenario C......................................................................................455 Figure WC-23. Spatial distribution of historical mean recharge rate; and recharge scaling factors across the Western Cape region for scenarios A, B and C. Recharge scaling factors are the ratio of the projected recharge in a scenario to that under Scenario A.........................................................................................................................................................................................................457 Figure WC-24. Percentage change in mean annual recharge under the 45 Scenario C simulations (15 global climate models and three global warming scenarios) relative to Scenario A recharge ...................................................................................................458 Figure WC-25. Map of the modelling subcatchments, calibration catchments and calibration gauging stations used for the Western Cape region with inset highlighting (in red) the extent of the calibration catchments ......................................................................462 Figure WC-26. Modelled and observed monthly runoff and daily flow exceedance curve for each calibration catchment in the Western Cape region. (Red text denotes catchments located outside the region; blue text denotes catchments used for streamflow modelling only).................................................................................................................................................................................465 Figure WC-27. Spatial distribution of mean annual (a) rainfall and (b) modelled runoff across the Western Cape region under Scenario A .......................................................................................................................................................................................466 Figure WC-28. Annual (a) rainfall and (b) modelled runoff in the Western Cape region under Scenario A ....................................466 Figure WC-29. Minimum, maximum and A range monthly (a) rainfall and (b) modelled runoff; and mean, median and A range monthly (c) rainfall and (d) modelled runoff in the Western Cape region under Scenario A (A range is the 25th to 75th percentile monthly rainfall or runoff) .................................................................................................................................................................467 Figure WC-30. Spatial distribution of mean annual (a) rainfall and (b) modelled runoff across the Western Cape region under Scenario B .......................................................................................................................................................................................468 Figure WC-31. Percentage change in mean annual modelled runoff under the 45 Scenario C simulations (15 global climate models and three global warming scenarios) relative to Scenario A............................................................................................................469 Figure WC-32. Spatial distribution of mean annual rainfall and modelled runoff across the Western Cape region under Scenario A and under Scenario C relative to Scenario A...................................................................................................................................470 Figure WC-33. Mean monthly (a) rainfall and (b) modelled runoff in the Western Cape region under scenarios A and C (C range is based on the consideration of each month separately – the lower and upper limits in C range are therefore not the same as scenarios Cdry and Cwet)................................................................................................................................................................471 Figure WC-34. Daily flow exceedance curves for (a) rainfall and (b) modelled runoff in the Western Cape region under scenarios A, B and C (C range is based on the consideration of each rainfall and runoff percentile separately – the lower and upper limits in C range are therefore not the same as scenarios Cdry and Cwet) .....................................................................................................472 Figure WC-35. Level of confidence of the modelling of runoff for (a) mid- to high flow events and (b) monthly dry season flow events for the modelling subcatchments of the Western Cape region. 1 is the highest level of confidence and 5 is the lowest ....473 Figure WC-36. Location of streamflow reporting nodes (gauging stations, environmental sites, dummy nodes and storage inflows) in the Western Cape region. (Note no storage inflows are reported for this region)........................................................................474

viii ▪ Water in the Western Cape region August 2009 © CSIRO 2009
Abbreviations and acronyms
Abbreviation or acronym
Description
AHD Australian Height Datum AMTD Adopted Middle Thread Distance (the distance along a river upstream from its outlet) APET Areal potential evapotranspiration AR4 The fourth assessment report of the Intergovernmental Panel on Climate Change ARI Average recurrence interval – the statistical length of time that might be expected to pass
before a similar condition is repeated AWRC Australian Water Resources Council BFI Baseflow index – the ratio of baseflow volume to total flow volume over a specified period,
commonly assumed to be the amount of groundwater input to stream flow BRS Bureau of Rural Sciences, Department of Agriculture, Fisheries and Forestry CLW CSIRO Division of Land and Water CMAR CSIRO Division of Marine and Atmospheric Research CMB Chloride mass balance CO2 Carbon dioxide COAG Council of Australian Governments CSIRO Commonwealth Scientific and Industrial Research Organisation DEM Digital elevation model DERM (Queensland) Department of Environment and Resource Management DEWHA Department of the Environment, Water, Heritage and the Arts, Australian Government DNRM Previous incantation of DERM DNRW Previous incantation of DERM DTW Depth to watertable E Extraction E/B Extraction to baseflow ratio E/R Extraction to recharge ratio Ef Future groundwater extraction EC Electrical conductivity, a measure of salinity. 1 EC (S/cm) ≈ 0.6 mg/L TDS ET Evapotranspiration FDC Flow duration curve GAB Great Artesian Basin GCM Global climate model, also known as general circulation model GDA Geographic datum of Australia GDE Groundwater-dependent ecosystem GRCI Groundwater resource condition indicator IQQM Integrated Quantity and Quality Model – a river systems model MAR Managed aquifer recharge MDB Murray-Darling Basin MGSH Maximum gauged stage height MSLP Mean sea level pressure NAILSMA Northern Australia Indigenous Land and Sea Management Alliance NAS Network attached storage NALWT Northern Australia Land and Water Taskforce (http://www.nalwt.gov.au/) NAWFA Northern Australia Water Futures Assessment (http://www.environment.gov.au/nawfa/) NRETA Previous incantation of NRETAS NRETAS Northern Territory Department of Natural Resources, Environment, the Arts and Sport NSE Nash-Sutcliffe Efficiency coefficient used to assess the predictive power of hydrological
models. Values range from -∞ to +1, where +1 is a perfect match to observations. Analogous to the R2 coefficient of determination
PET Potential evapotranspiration R Recharge RAM Random access memory RSF Recharge scaling factor SAN Storage area network

© CSIRO 2009 August 2009 Water in the Western Cape region ▪ ix
Abbreviation or acronym
Description
SILO Enhanced meteorological datasets (http://www.bom.gov.au/silo/index.shtml) SRN Streamflow reporting node TDS Total Dissolved Solids (mg/L ≈ 1.7 EC) TRaCK Tropical Rivers and Coastal Knowledge Research Hub WRON Water Resources Observation Network
Units of measurement
Measurement units Description ML Megalitres, 1,000,000 litres GL Gigalitres, 1,000,000,000 litres TL Teralitres, 1,000,000,000,000 litres Cumecs Cubic metres per second; m3/sec; equivalent to 1,000 litres per second 1 Sydney Harbour ~500 GL 1 Lake Argyle 10,380 GL
x ▪ Water in the Western Cape region August 2009 © CSIRO 2009
Glossary of terms
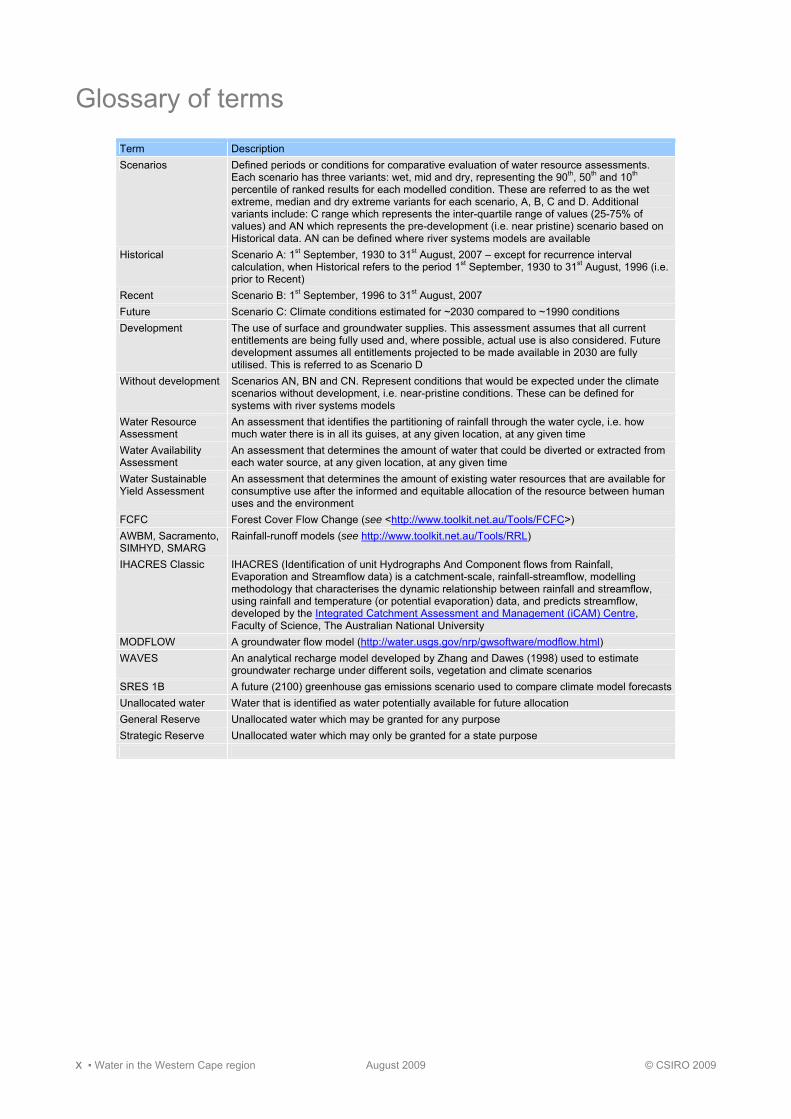
Term Description Scenarios Defined periods or conditions for comparative evaluation of water resource assessments.
Each scenario has three variants: wet, mid and dry, representing the 90th, 50th and 10th percentile of ranked results for each modelled condition. These are referred to as the wet extreme, median and dry extreme variants for each scenario, A, B, C and D. Additional variants include: C range which represents the inter-quartile range of values (25-75% of values) and AN which represents the pre-development (i.e. near pristine) scenario based on Historical data. AN can be defined where river systems models are available
Historical Scenario A: 1st September, 1930 to 31st August, 2007 – except for recurrence interval calculation, when Historical refers to the period 1st September, 1930 to 31st August, 1996 (i.e. prior to Recent)
Recent Scenario B: 1st September, 1996 to 31st August, 2007 Future Scenario C: Climate conditions estimated for ~2030 compared to ~1990 conditions Development The use of surface and groundwater supplies. This assessment assumes that all current
entitlements are being fully used and, where possible, actual use is also considered. Future development assumes all entitlements projected to be made available in 2030 are fully utilised. This is referred to as Scenario D
Without development Scenarios AN, BN and CN. Represent conditions that would be expected under the climate scenarios without development, i.e. near-pristine conditions. These can be defined for systems with river systems models
Water Resource Assessment
An assessment that identifies the partitioning of rainfall through the water cycle, i.e. how much water there is in all its guises, at any given location, at any given time
Water Availability Assessment
An assessment that determines the amount of water that could be diverted or extracted from each water source, at any given location, at any given time
Water Sustainable Yield Assessment
An assessment that determines the amount of existing water resources that are available for consumptive use after the informed and equitable allocation of the resource between human uses and the environment
FCFC Forest Cover Flow Change (see <http://www.toolkit.net.au/Tools/FCFC>) AWBM, Sacramento, SIMHYD, SMARG
Rainfall-runoff models (see http://www.toolkit.net.au/Tools/RRL)
IHACRES Classic IHACRES (Identification of unit Hydrographs And Component flows from Rainfall, Evaporation and Streamflow data) is a catchment-scale, rainfall-streamflow, modelling methodology that characterises the dynamic relationship between rainfall and streamflow, using rainfall and temperature (or potential evaporation) data, and predicts streamflow, developed by the Integrated Catchment Assessment and Management (iCAM) Centre, Faculty of Science, The Australian National University
MODFLOW A groundwater flow model (http://water.usgs.gov/nrp/gwsoftware/modflow.html) WAVES An analytical recharge model developed by Zhang and Dawes (1998) used to estimate
groundwater recharge under different soils, vegetation and climate scenarios SRES 1B A future (2100) greenhouse gas emissions scenario used to compare climate model forecastsUnallocated water Water that is identified as water potentially available for future allocation General Reserve Unallocated water which may be granted for any purpose Strategic Reserve Unallocated water which may only be granted for a state purpose

Water in the Western Cape region


© CSIRO 2009 August 2009 Water in the Gulf of Carpentaria Drainage Division ▪ 419
WC
-1 W
ateravailabilityand
demand
inthe W
esternC
aperegion
WC-1 Water availability and demand in the Western Cape region
The first part of this report (the Preamble, Chapter 1 and Chapter 2) reports at the division level, including division-wide descriptions of climate and geology and methods which apply to all regions. Subsequent chapters report at the region level. In particular, Chapters WC-1, WC-2 and WC-3 focus on the Western Cape region (Figure WC-1).
This chapter summarises the water resources of the Western Cape region, using information from Chapter WC-2 and Chapter WC-3, and directly addresses the Terms of Reference, specifically terms 3, 4 and 5 as listed in the Preamble. Essentially, this chapter provides a synoptic view of the region and covers:
regional observations water resource assessment changes to flow regime at environmental assets seasonality of water resources surface–groundwater interaction water storage options data and knowledge gaps.
For further details on the context of the region (physical and climate descriptions, hydrogeology and legislation) see Chapter WC-2. Region-specific methods and results are provided in Chapter WC-3. Modelling results are reported under climate and development scenarios as defined at the division level in Section 2.1 of Chapter 2.
Figure WC-1. Major rivers, towns and location of environmental assets selected for assessment of changes to hydrological regime in the Western Cape region

420 ▪ Water in the Western Cape region August 2009 © CSIRO 2009
WC
-1 W
ater
ava
ilabi
lity
and
dem
and
in th
e W
este
rn C
ape
regi
on
WC-1.1 Regional summary
These regional observations summarise key modelling results and other relevant water resource information about the Western Cape region.
The Western Cape region has a moderate inter-annual variability in rainfall and hence runoff and recharge. Coefficients of variation are relatively low compared to the other regions across northern Australia and reflect the combined climatic influence of the northern monsoon and the influence of the orographic rain driven by the south-east trade winds rising over the Great Dividing Range to the east. The region may, however, experience multiple years of below average or above average rainfall. Typically, three to four months of the year are without rain.
The mean annual rainfall for the region is 1417 mm. Mean annual areal potential evapotranspiration (APET) is 2033 mm. The mean annual runoff averaged over the modelled area of the Western Cape region is 479 mm, 34 percent of rainfall. Compared to other regions, average rainfall is highest of all regions and APET is amongst the highest. Under the historical climate the mean annual streamflow over the Western Cape region is estimated to be 31,981 GL.
There is a strong seasonality in rainfall patterns, with 97 percent of rainfall falling between November and May, and a very high dry season potential evapotranspiration. The region has a relatively high rainfall intensity, and short lag between rainfall and runoff, with a slightly increasing amount and intensity of rainfall over the historical (1930 to 2007) period. Under the historical climate, the mean annual stream flow for the Western Cape region is modelled to be 32 GL.
The Gilbert River Formation and Eulo Queen Group aquifers of the Great Artesian Basin (GAB) provide groundwater discharge to streams, allowing surface water flows in many rivers to be maintained well into the dry season. The Gilbert River Formation is the main groundwater resource in the region. This formation is predominantly a confined aquifer, but is found in rock outcrop to the south and east where it is known to provide groundwater baseflow to a number of rivers. The most significant perennial river in the region is the Jardine, which receives an estimated 15,000 L/second or 485 GL/year baseflow from the GAB (GABCC, 1998).
There is a strong north-west to south-east rainfall gradient. With decreasing rainfall, runoff decreases from 50 to 15 percent of rainfall.
The region is annually water-limited; there is more energy available to remove water than there is water available to be removed.
Under the recent (1996 to 2007) climate the Western Cape region has been similar to the historical (1930 to 2007) record. Modelling suggests that future (~2030) conditions may be slightly drier than historical conditions. Future runoff is likely to be similar to historical levels, but potential diffuse recharge may be higher, as modelling suggests future rainfall intensity may be higher than historical levels.
The major groundwater use from the Gilbert River Formation aquifer is for industrial and mining processes associated with the Comalco bauxite mines near Weipa. The water resource planning process has allowed for potentially up to 10.1 GL/year (10 GL from the total GAB allocation; 0.1 GL from the Cape management area) to be set aside for projects of state or regional significance (to encourage sustainable development opportunities) or for town water supply purposes. Currently applications for groundwater extraction have been submitted for more than 9 GL/year of State Reserve from the Cape Management Area.
The Great Artesian Basin springs discharging in the region provide an important source of water for maintaining surface water flow during the dry season.
The Archer River has been declared as a wild river under the Wild Rivers Act 2005. The Coleman, Holroyd, Watson, Wenlock, Ducie and Jardine river basins have been identified as potential wild river areas.
At environmental assets, total flow volumes are highly dominated by wet season flows (in November to April) with dry season flows (in May to October) only a small fraction of total annual flow. However, environmental assets depend on this strong seasonality and any significant changes in the frequency and duration of floods and dry season flows are likely to have an environmental impact. In the recent past there has been more flow, resulting in fewer low flow days and more high flow days relative to the historical record.
Under the median future climate, future flows are expected to be similar to historical levels. However, under the wet and dry extreme future climates, large changes to the high flow threshold exceedance occur which could have negative

© CSIRO 2009 August 2009 Water in the Western Cape region ▪ 421
WC
-1 W
ateravailabilityand
demand
inthe W
esternC
aperegion
environmental impact. At asset nodes associated with perennial reaches, there is little change, but at sites where zero flow is frequent, there are moderate changes in the number of zero flow days which may have environmental impacts.
The region is generally datapoor.
WC-1.2 Water resource assessment
WC-1.2.1 Under historical climate and current development
Mean annual rainfall over the Western Cape region is 1417 mm, with a standard deviation of 200 mm. Maximum recorded rainfall fell in 1999 with 2033 mm; the lowest was in 1961 with 735 mm. Rainfall is high relative to other regions across northern Australia. Mean annual areal potential evapotranspiration (APET) is 1874 mm, with a small annual variation (standard deviation of 47 mm). Highest APET occurred in 1992 (2003 mm); lowest in 1944 (1696 mm). The mean annual runoff averaged over the modelled area of the Western Cape region is 479 mm, 34 percent of rainfall. Rainfall and runoff both decline with distance from the coast. While rainfall shows little spatial variation, spatial variation in runoff is high ranging from over 800 mm/year in the Jardine River basin and amidst the coastal lowlands in the middle of the Western Cape region, to less than 130 mm/year for the south-eastern corner of region.
Rainfall is very seasonal, with 97 percent falling during the wet season, and runoff is highest in February and March.
Current groundwater entitlements in the Western Cape region amount to about 30.6 GL/year, of which about two-thirds is allocated from Cainozoic sediments and one-third from Great Artesian Basin (GAB) aquifers. The level of utilisation of these entitlements is largely unknown, although Rio Tinto uses in the order of 6 to 7 GL/year out of an allocation of 9 GL/year from the GAB at Weipa. Unlicensed stock and domestic use is estimated to be about 0.5 GL/year. Natural groundwater discharge from the Gilbert River Formation of the GAB plays an important role in providing dry season flows in several major perennial rivers including the Archer, Coen, Delhunty, Holroyd, Jardine and Wenlock rivers (Table WC-1 and Figure WC-2). It should be noted that Table WC-1 does not include the Jardine River as the gauging stations for this river failed to satisfy the selection criteria for baseflow analysis (see Section 2.4.1 in the division-level Chapter 2).
Table WC-1. Estimated groundwater contribution (baseflow) to streamflow, modelled diffuse recharge and groundwater extraction for the Western Cape region under historical climate
Station River Station name Annual BFI *
Dry season BFI *
Dry season baseflow *
GL 920002A Coleman King Junction 0.22 0.46 3.2 922001A Archer Telegraph Crossing 0.23 0.47 32.5 922101A Coen Coen 0.26 0.62 4.1 925001A Wenlock Moreton 0.35 0.65 60.8 925002A Wenlock Wenlock 0.26 0.51 10.5 926001A Ducie Bertiehaugh 0.32 0.52 7.4 926002A Dulhunty Dougs Pad 0.53 0.75 37.2
Historical recharge ** Estimated groundwater extraction GL/y Entire Western Cape region 22,390 31 * BFI (baseflow index) and baseflow volume derived from gauged data. ** Aggregated recharge using Zhang and Dawes (1998).
Under a continued historical climate, mean annual groundwater recharge to the unconfined aquifers of the Western Cape region is likely to be similar to the historical (1930 to 2007) average. Given that the majority of existing groundwater use is for mining and industrial purposes around Weipa, it is likely that continued extraction at current levels will cause localised drawdown in groundwater levels. Whilst this cannot be quantified without a detailed groundwater model, the greatest potential impacts are likely to be through reduced discharge to springs and, in turn, perennial watercourses.
Term of Reference 3a
Term of Reference 3a (i)

422 ▪ Water in the Western Cape region August 2009 © CSIRO 2009
WC
-1 W
ater
ava
ilabi
lity
and
dem
and
in th
e W
este
rn C
ape
regi
on
WC-1.2.2 Under recent climate and current development
The mean annual rainfall and runoff under the recent (1996 to 2007) climate are 9 percent and 27 percent higher, respectively, than the historical (1930 to 2007) mean values, but there is spatial variability across the region, with the north and south-east being statistically significantly wetter.
Under a continued recent climate, mean annual groundwater recharge to the unconfined aquifers of the Western Cape region is likely to be similar to the historical average rate.
WC-1.2.3 Under future climate and current development
Future rainfall is expected to be similar to the historical climate. Under the wet extreme future climate, mean annual rainfall is 1570 mm; under the median future climate, 1435 mm; and under the dry extreme future climate, 1320 mm (or a range of 7 percent lower to 11 percent higher than historically). Corresponding mean annual APET under these scenarios is 1902, 1897 and 1944 mm, respectively (or a range of 4 to 1 percent higher than historically).
Rainfall-runoff modelling indicates that mean annual runoff in the future in the Western Cape region is equally likely to increase as decrease. For the high global warming scenario, rainfall-runoff modelling with climate change projections from four of the GCMs indicates a decrease in mean annual runoff greater than 10 percent while two of the GCMs indicate an increase in mean annual runoff greater than 10 percent. Under the wet extreme, median and dry extreme future climates, mean annual runoff changes by 30, 1 and -19 percent relative to historical levels. By comparison, the range based on the low global warming scenario is a -11 to 16 percent change in mean annual runoff.
Under the future climate, mean annual groundwater recharge to the unconfined aquifers of the Western Cape region is likely to be higher than the historical average rate. Without a detailed model for the main aquifers in the region, it is not possible to quantify the impacts of increased recharge rates on the groundwater balance, either under current or future development scenarios.
WC-1.2.4 Under future climate and future development
The majority of catchments in this region are either under wild river declaration or a moratorium pending decision, hence future development is likely to have minimal consequence to water resources. Future development is most likely to be related to mining and will be subject to environmental impact assessments.
The Embley River basin contains a number of world-class bauxite mines. Development controls are in place to preserve the local environment and absolute water use is low.
WC-1.3 Changes to flow regime at environmental assets
Section 1.3 of the division-level Chapter 1 describes how environmental assets were shortlisted for assessment by this project. Four environmental assets were shortlisted for the Western Cape region: the Archer River Aggregation, Jardine River Wetlands Aggregation, Northern Holroyd Plain Aggregation and Port Musgrave Aggregation. These assets are characterised in Chapter WC-2.
In deciding whether it is feasible to report hydrological regime metrics for these shortlisted assets, it is important to consider the confidence levels in modelled streamflow (as described in Section 2.2.6 of the division-level Chapter 2). Confidence in results for low flows and high flows was calculated separately. Hydrological regime metrics (as defined in Section 2.5 of the division-level Chapter 2) for either low flows or high flows are reported only where confidence levels are sufficiently high. If confidence in the low flow or high flow is too low, metrics are not reported, and hence an important gap in our knowledge is identified.
Some of the assets in this region have multiple nodes at which streamflow modelling results are available. When reporting hydrological regime metrics for such assets a single node was selected. The selected node was that with the
Term of Reference 3a (ii)
Term of Reference 3a (iii)
Term of Reference 3a (iv)
Term of Reference 3b

© CSIRO 2009 August 2009 Water in the Western Cape region ▪ 423
WC
-1 W
ateravailabilityand
demand
inthe W
esternC
aperegion
highest streamflow confidence level and the largest proportion of streamflow to the asset. The location of nodes for each asset are shown on satellite images in section WC-2.1.3. Results for all nodes are presented in McJannet et al. (2009).
The confidence levels in modelled streamflow are sufficiently high to report hydrological regime metrics at all assets in this region with one exception. The surface water flow confidence level for the Jardine River Wetlands Aggregation is considered unreliable for high flows so metrics relating to such flows will not be reported. In contrast, the confidence level for low flows at this asset is considered moderately reliable and thus low flow metrics are reported.
Annual flow into all assets is dominated by wet season flow, which has been 16 percent higher under the recent climate. Dry season flows have been significantly (>40 percent) higher under the recent climate.
Under the future climate, stream flows are expected to be similar to the historical record, though the wet extreme future climate may see increases, while the extreme dry future climate may see moderate decreases.
The number of days when flow is below the low flow threshold is projected to be similar under both the historical and future climates. Zero flow days are generally rare, and this is unlikely to change. Where we have confidence in the data (Archer River Aggregation, Northern Holroyd Plain Aggregation) there is similarly little change expected from historical levels.
WC-1.4 Seasonality of water resources
The rivers have a marked seasonal flow regime of high water levels during the wet season (November to April) and minimal flow during the dry season. Approximately 97 percent of rainfall, and 96 percent of runoff, occurs during the wet season months under both the historical and recent climate. Very similar seasonal percentages (1 percent) of rainfall and runoff are projected for 2030.
Approximately 4 percent of runoff occurs in the dry season. This is high relative to other regions across northern Australia and perennial streamflow occurs in a number of rivers within the region, most notably the Jardine River.
WC-1.5 Surface–groundwater interaction
The Great Dividing Range trends north-northwest along the eastern margin of the Western Cape region. The country west of the divide slopes gently westward towards the Gulf of Carpentaria and is drained by eight major rivers; the Coleman, Holroyd, Archer, Watson, Embley, Wenlock, Ducie and Jardine rivers.
The presence of highly permeable surficial bauxite, sands and clays means that infiltration rates are high and hence there is minimal runoff following even high rainfall events across much of the region. Subsequently creek flows during the wet season are high, mainly due to interflow (i.e. rainfall that infiltrates the surface and moves laterally through the unsaturated zone).
Analysis of gauged streamflow data indicates that dry season baseflow (the low portion of streamflow mostly contributed from regional groundwater discharge) is particularly high in this region compared with other regions in the Gulf of Carpentaria Division, with the Jardine, Archer, Dulhunty and Wenlock rivers having the highest dry season baseflow in the region (Table WC-1 and Figure WC-2). DNRM (2005) identified a number of rivers that receive groundwater discharge from the Gilbert River Formation aquifer (and its equivalents) including the Jardine, Wenlock, Archer, Coen, Holroyd and Delhunty rivers (Figure WC-3).
The Jardine River flows all year round, with the continual flow of water attributed to baseflow derived from the shallow sandstones of the Gilbert River Formation and to high annual rainfall (over 1500 mm). Unlike other northern tropical rivers which are subject to seasonal rainfall patterns, the Jardine River catchment experiences rain all year around, even during the dry season (EPA, 2009). The Wenlock, Archer and Holroyd rivers are also known to flow through the dry season. Figure WC-3 shows the river reaches potentially receiving baseflow as well as the location of GAB springs.
Term of Reference 4
Term of Reference 4

424 ▪ Water in the Western Cape region August 2009 © CSIRO 2009
WC
-1 W
ater
ava
ilabi
lity
and
dem
and
in th
e W
este
rn C
ape
regi
on
Figure WC-2. Surface geology and modelled mean dry season baseflow of the Western Cape region

© CSIRO 2009 August 2009 Water in the Western Cape region ▪ 425
WC
-1 W
ateravailabilityand
demand
inthe W
esternC
aperegion
Figure WC-3. Locations of spring groups and potential river baseflow in the Western Cape region
WC-1.6 Water storage options
WC-1.6.1 Surface water storages
Under current and planned development, no major water storages are reported, or are expected, in the region.
WC-1.6.2 Groundwater storages
The high annual rainfall in this region contributes to very high estimated groundwater recharge rates – and significantly higher than all other regions within the Northern Australia Sustainable Yields project area. Accordingly, most near-surface aquifers, including outcropping areas of the Gilbert River Formation, are completely replenished each wet season. Managed aquifer recharge (MAR) has limited prospects in this region, simply because there is no additional storage capacity within the aquifers at the end of each wet season.
Term of Reference 5

426 ▪ Water in the Western Cape region August 2009 © CSIRO 2009
WC
-1 W
ater
ava
ilabi
lity
and
dem
and
in th
e W
este
rn C
ape
regi
on
WC-1.7 Data gaps
Time series groundwater level and salinity data is required for each of the main aquifer types in the Western Cape region to provide greater understanding of recharge processes and inter-aquifer leakage, particularly for the Great Artesian Basin aquifers. Water quality information, including chemical and isotopic data, from the eight large perennial rivers in the region (Coleman, Holroyd, Archer, Watson, Embley, Wenlock, Ducie and Jardine rivers) would provide insight to the source of dry season flows – that is, whether the baseflow is derived from shallow Cainozoic sediments or the Great Artesian Basin aquifers.
WC-1.8 Knowledge gaps
The potential for diffuse upward leakage of water out of the Great Artesian Basin aquifers and into overlying Tertiary sediments is unknown. Further research is required to estimate these discharge fluxes so that a detailed groundwater balance can be developed for the aquifers to guide future management in the region.
Research is also required to ascertain the sources of water for dry season flows in the eight large perennial rivers in the region. Obtaining this knowledge is crucial for ensuring future groundwater developments in the region do not adversely impact the ecosystems that depend on the perennial rivers.
None of the environmental assets in this region have any site-specific metrics by which to gauge the potential impacts of changes in future climate and development. In the absence of site-specific metrics a set of standard metrics related to high and low flows have been utilised. However the conversion of these metrics into environmental impacts still requires development of quantitative relationships between flow and specific ecological entities (for example, macrophyte populations, fish passage, faunal and floral habitats, etc.).
Many environmental assets depend not simply on duration above or below certain flow levels, but on triggers (e.g. for reproduction or migration) set by the rate of change of flow. In addition, some environmental assets depend on the frequency and duration of events that occur less than annually (i.e. once every 5, 10 or 20 years or more). Further analysis is therefore required to look at how the timing, duration and rate of rise and fall in flow rates at critical times of the season will vary under the various scenarios.
Flooding is an important factor that sustains many environmental assets and this occurs when the stream breaks out of its banks (a level known as bankfull stage or discharge). However, bankfull discharge is not known for many streams, nor is the dependence of area flooded on increasing stream depth, so it is difficult to predict when assets are inundated. Further information about bankfull stage and discharge are needed for most environmental assets.
Dry season flows are poorly understood in this region therefore the ability to predict the potential impacts of the various scenarios on low flows at environmental assets is very limited. Improved monitoring of low streamflow conditions is needed along with the development of hydrological models that combine surface and groundwater regimes. Further monitoring of groundwater levels is also required so that the potential impacts of climate and development change on groundwater-dependent ecosystems can be better understood.
WC-1.9 References
DNRM (2005) Hydrogeological framework report for the Great Artesian Basin resource plan area. Queensland Department of Natural Resources and Mines.
EPA (2009) Queensland Environment Protection Agency. <http://www.epa.qld.gov.au/parks_and_forests/find_a_park_or_forest/jardine_river_national_park_heathlands_and_jardine_river_resources_reserves/jardine_river_national_park_and_heathlands_resources_reserve__nature_culture_and_history/> visited 9/1/00
GABCC (1998) Great Artesian Basin Resource Study, November 1998. Editors Cox R and Barron A. Great Artesian Basin Consultative Council.
McJannet DL, Wallace JW, Henderson A and McMahon J (2009) High and low flow regime changes at environmental assets across northern Australia under future climate and development scenarios. A report to the Australian Government from the CSIRO Northern Australian Sustainable Yields Project. CSIRO Water for a Healthy Country Flagship, CSIRO, Australia. In prep.
Zhang L and Dawes W (1998) WAVES - An integrated energy and water balance model. Technical Report No. 31/98, CSIRO Land and Water.
Term of Reference 1e
Term of Reference 1e

© CSIRO 2009 August 2009 Water in the Western Cape region ▪ 427
WC
-2 C
ontextualinformation
fortheW
estern Cape
region
WC-2 Contextual information for the Western Cape region
This chapter summarises the background information for the region, outlining existing knowledge of water resources and prior and current investigations relevant to the water resources of the region. This chapter also outlines the current and potential future legislation, water plans and other water resource management arrangements. This chapter is arranged into four sections:
physical and climate descriptions data availability hydrogeology legislation, water plans and other arrangements.

428 ▪ Water in the Western Cape region August 2009 © CSIRO 2009
WC
-2 C
onte
xtua
l inf
orm
atio
n fo
r the
Wes
tern
Cap
e re
gion
WC-2.1 Overview of the region
WC-2.1.1 Geography and geology
The Western Cape region covers a total of 66,766 km2 and comprises nine Australian Water Resource Council (AWRC) river basins: Coleman (13,130 km2), Holroyd (10,542 km2), Archer (14,227 km2), Watson (4832 km2), Embley (4796 km2), Wenlock (7807 km2), Ducie (7050 km2), Jardine (3447 km2) and the Torres Strait Islands (the largest being Home Island (56 km2) and Thursday Island (4 km2).
The Coleman River rises near the Musgrave Roadhouse on the Peninsula Development Road and ends its journey between Pormpuraaw to the north and Kowanyama to the south where it drains into the Gulf of Carpentaria.
The Holroyd and Archer rivers rise in the rainforests of the McIlwraith Range and traverse the vast savannah landscape and enormous wetlands of western Cape York.
The Watson River just south of Weipa on the west coast of Cape York tumbles into Archer Bay in the Gulf of Carpentaria from its journey through the Cape’s distinct savannah forest landscape and plentiful wetlands.
The region consists of a complex geology dominated by the Torres Strait Volcanics in the north (Figure WC-4). The metamorphic rocks and acid intrusive rocks of various ages of the Coen-Yambo Inlier run north to south along the eastern margin of the region and encompass the high-altitude/high-rainfall areas of Iron Range and McIlwraith Range. The deeply dissected sandstone plateaus and ranges of the Battle Camp Sandstones lie in the south of the region adjacent to the undulating Laura Lowlands composed of residual weathered sands and flat plains of colluvial and alluvial clays, silts and sands. The west of the region is dominated in the south by the extensive Tertiary sand sheets dissected by the intricate drainage systems of the Holroyd Plain, the Tertiary laterite of the undulating Weipa Plateau and the low rises of Mesozoic sandstones. The northern extension of the Weipa Plateau and extensive coastal plains adjoin the Gulf of Carpentaria. Extensive aeolian dunefields lie in the east associated with Cape Bedford/Cape Flattery in the south and the Olive and Jardine rivers.

© CSIRO 2009 August 2009 Water in the Western Cape region ▪ 429
WC
-2 C
ontextualinformation
fortheW
estern Cape
region
Figure WC-4. Surface geology of the Western Cape region overlaid on a relative relief surface
WC-2.1.2 Climate, vegetation and land use
The Western Cape region receives an average of 1417 mm of rainfall over the September to August water year, most of which (1370 mm) falls in the November to April wet season (Figure WC-5). Across the region there is a strong east–west gradient in annual rainfall, ranging from 1054 mm in the east to 1809 mm in the west. Over the 1930 to 2007 period, annual rainfall has been gradually increasing from an initial average of around 1300 mm to approximately 1500 mm later in the period. The highest regionally averaged yearly rainfall received was 2033 mm which fell in 1974, and the lowest was 735 mm in 1961.
Areal potential evapotranspiration (APET) is very high across the region, averaging 1874 mm over a water year, and varies moderately across the seasons. APET generally remains higher than rainfall from April until November resulting in water-limited conditions over these months. Between December and March conditions are energy-limited meaning more rain falls than can potentially be evaporated.

430 ▪ Water in the Western Cape region August 2009 © CSIRO 2009
WC
-2 C
onte
xtua
l inf
orm
atio
n fo
r the
Wes
tern
Cap
e re
gion
(a) (b)
0
600
1200
1800
50/ 51 70/ 71 90/ 91 06/ 07
Ann
ual r
ainf
all (
mm
) ,,,,
0
100
200
300
400
J F M A M J J A S O N D
Mon
thly
rai
nfal
l (m
m) ,,,
,,
Figure WC-5. Historical (a) annual and (b) mean monthly rainfall averaged over the Western Cape region. The low-frequency smoothed line in (a) indicates longer term variability
The most extensive vegetation types are predominantly Eucalyptus tetrodonta woodlands, usually in association with bloodwoods Corymbia nesophila, C. hylandii or C. clarksoniana, and Melaleuca viridiflora low open-woodlands (Figure WC-6) Other extensive vegetation types include Corymbia clarksoniana, Eucalyptus chlorophylla and E. cullenii woodlands; grasslands and grassy open-woodlands; heathlands; sedgelands; and notophyll vine forests, with semi-deciduous mesophyll vine forests on the eastern ranges and deciduous vine thickets on drier western slopes. Extensive mangrove forests are found in Kennedy Inlet in the north-east of the region and estuaries on both the west and east coasts.

© CSIRO 2009 August 2009 Water in the Western Cape region ▪ 431
WC
-2 C
ontextualinformation
fortheW
estern Cape
region
Figure WC-6. Map of current vegetation types across the Western Cape region (source DEWR, 2005)
Pastoralism is the dominant land use throughout the region (Figure WC-7). There are also large areas of nature conservation, Indigenous land use and forestry.

432 ▪ Water in the Western Cape region August 2009 © CSIRO 2009
WC
-2 C
onte
xtua
l inf
orm
atio
n fo
r the
Wes
tern
Cap
e re
gion
Figure WC-7. Map of dominant land uses of the Western Cape region (after BRS, 2002)
WC-2.1.3 Regional environmental asset description
Environmental assets were chosen from wetlands which are listed in the Directory of Important Wetlands in Australia (Environment Australia, 2001). From this directory, environmental assets were shortlisted for assessing changes to the hydrological regime under the climate and development scenarios. The selection of this shortlist was undertaken in consultation with state governments and the Australian Government through direct discussions and through internal reviews (see Section 1.3 in the division-level Chapter 1 for further detail).
All nationally, or internationally, important wetlands listed for the Western Cape region in the Directory of Important Wetlands in Australia (Environment Australia, 2001) are detailed in Table WC-2, with asterisks identifying the four shortlisted assets: Archer River Aggregation, Jardine River Wetlands Aggregation, Northern Holroyd Plain Aggregation, and Port Musgrave Aggregation. The location of these shortlisted wetlands is shown in Figure WC-1. There are no wetlands classified as Ramsar sites in this region. Wetlands may be nationally or regionally significant depending on more locally specific criteria. All wetlands are important for a variety of ecological reasons or because they bear historical significance or have high cultural value, particularly to Indigenous people.

© CSIRO 2009 August 2009 Water in the Western Cape region ▪ 433
WC
-2 C
ontextualinformation
fortheW
estern Cape
region
The following section characterises these shortlisted wetlands and is based largely on the description of these assets as outlined by Environment Australia (2001). Chapter ID-3 presents the assessment of those shortlisted assets, and reports hydrological regime metrics for those assets which have sufficient confidence in the modelled streamflow to enable analysis.
Table WC-2. List of Wetlands of National Significance located within the Western Cape region
Site code Name Area Ramsar site ha QLD056 Archer Bay Aggregation 29,900 No QLD057 * Archer River Aggregation 150,000 No QLD058 Bull Lake 27 No QLD063 * Jardine River Wetlands Aggregation 81,800 No QLD067 Northeast Karumba Plain Aggregation 183,000 No QLD068 * Northern Holroyd Plain Aggregation 1,110,000 No QLD071 * Port Musgrave Aggregation 52,700 No QLD074 Skardon River - Cotterell River Aggregation 63,200 No QLD075 Somerset Dunefield Aggregation 7,940 No QLD113 Southeast Karumba Plain Aggregation 336,000 No
* Asterisk against the site code identifies those assets which are shortlisted for assessment of changes to flow regime.
Archer River Aggregation
The Archer River Aggregation (Figure WC-8) is probably the best example of a large, relatively pristine system of riverine and associated wetland types characteristic of the western Cape York Peninsula. The site has an area of 150,000 ha and an elevation between 2 m and 139 m above sea level (Environment Australia, 2001).
Figure WC-8. False colour satellite image of the Archer River Aggregation (derived from ACRES, 2000). Clouds may be visible in image

434 ▪ Water in the Western Cape region August 2009 © CSIRO 2009
WC
-2 C
onte
xtua
l inf
orm
atio
n fo
r the
Wes
tern
Cap
e re
gion
This site has very high wilderness value and contains many vegetation communities that are either rare or are amongst the best examples of their class on Cape York Peninsula. The riparian forest is an important corridor for the dispersal of many species between the extensive rainforests on the east coast and the smaller sand-ridge rainforests on the west coast. It is also an important dry season corridor for woodland species. The coastal extents are important habitat for seasonal waterfowl and the Archer system has a significant hydrological role in maintaining the extensive permanent and semi-permanent Aurukun coastal wetlands (Environment Australia, 2001).
Jardine River Wetlands Aggregation
The Jardine River Wetlands Aggregation (Figure WC-9) contain the largest area and amongst the best examples of sedgeland on Cape York Peninsula (Abrahams et al., 1995). The wetland vegetation of the area is very diverse, reflecting differences in development and hydrology. The site is centred on the large floodplain of the Jardine River and the alluvial plains of its major tributaries. This area contains the largest and most widely spaced series of beach ridges on Cape York Peninsula. The site has an area of 81,800 ha and an elevation between zero and 40 m above sea level (Environment Australia, 2001). The area contains well-developed and representative examples of the landforms associated with an aggrading coastline.
Figure WC-9. False colour satellite image of the Jardine River Wetlands Aggregation (derived from ACRES, 2000). Clouds may be visible in image
Most of the site is of high to very high wilderness value. The site supports mangrove communities, swampy woodland, pure stands of northern paperbark forest and palm forests. The shoreline of the site is important habitat for numerous bird species while terrestrial areas support populations of bats, frogs, snakes and turtles.

© CSIRO 2009 August 2009 Water in the Western Cape region ▪ 435
WC
-2 C
ontextualinformation
fortheW
estern Cape
region
Northern Holroyd Plain Aggregation
The Northern Holroyd Plain Aggregation (Figure WC-10) contains the best examples of a characteristic suite of wetlands occurring on one of the most striking land surfaces of the Cape York Peninsula. Certain areas have never been grazed and contain some of the most pristine inland wetlands in western Cape York (Environment Australia, 2001). The aggregation comprises a huge area of wetland totally within an area of uniformly very high wilderness quality (Abrahams et al., 1995). It contains significant drought and seasonal habitat refuge for waterbird species which disperse in relatively small flocks over the hundreds of individual wetlands which make up the aggregation. The area contains large tracts of the highest quality wilderness recognised for the Cape York Peninsula. The site has an area of 1,110,000 ha and an elevation between 10 m and 90 m above sea level (Environment Australia, 2001).
Figure WC-10. False colour satellite image of the Northern Holroyd Plain Aggregation (derived from ACRES, 2000). Clouds may be visible in image
The vegetation of ephemeral lakes and ponds is dominated by grasses and sedges. There is a seasonal variation reflecting the waxing and waning of the water bodies; grasses tend to dominate during the dry season and sedges during the wet (Environment Australia, 2001). The site contains areas of high cultural significance to Indigenous people associated with the Kowanyama, Pormpuraaw and Aurukun communities.

436 ▪ Water in the Western Cape region August 2009 © CSIRO 2009
WC
-2 C
onte
xtua
l inf
orm
atio
n fo
r the
Wes
tern
Cap
e re
gion
Port Musgrave Aggregation
The Port Musgrave Aggregation (Figure WC-11) has been identified as one of the most important areas of crocodile habitat on the Cape York Peninsula (Taplin, 1987; Magnusson et al., 1980). The number of crocodiles recorded in the area was nearly double that recorded at any of the other surveyed sites on Cape York Peninsula. The large numbers recorded are considered to be related to the large extent of good nesting habitat present. The mangrove forests of the Wenlock and Ducie rivers are outstanding representative examples of their type. The site has an area of 52,700 ha and an elevation between zero and 5 m above sea level (Environment Australia, 2001).
Figure WC-11. False colour satellite image of the Port Musgrave Aggregation (derived from ACRES, 2000). Clouds may be visible in image
There are approximately 4800 ha of seagrass beds in shallow water at the mouth of Port Musgrave. A little over half of the area of these beds is located within the site (Environment Australia, 2001). There are numerous mangrove communities and small but significant areas of evergreen notophyll riparian vine forest.

© CSIRO 2009 August 2009 Water in the Western Cape region ▪ 437
WC
-2 C
ontextualinformation
fortheW
estern Cape
region
WC-2.2 Data availability
WC-2.2.1 Climate
The rainfall-runoff modelling uses historical daily climate data (Scenario A) from the SILO database for the period 1 September 1930 to 31 August 2007 at 0.05 x 0.05 degree (~ 5 x 5 km) grid cells. Full details and characterisation of the SILO database are provided at the division level in Section 2.1 of Chapter 2. Scenario B and Scenario C climate data are rescaled versions of the Scenario A data; this is also discussed in Section 2.1 of Chapter 2.
WC-2.2.2 Surface water
Streamflow gauging stations are or have been located at 20 locations within the Western Cape region. Six of these gauging stations either: (i) are flood warning stations and measure stage height only; or (ii) have less than ten years of measured data. Of the remaining 14 stations, five recorded more than half of their total volume of flow during events that exceed the maximum gauged stage height. Figure WC-12 shows the spatial distribution of good quality data (duration) for flows above maximum gauged stage height (MGSH). There are six gauging stations currently operating in the Western Cape region at density of one gauge for every 11,100 km2. For the 13 regions the median number of gauging stations per region is 12 and the median density of gauging stations per region is one gauge for every 9,700 km2. The Western Cape region has a slightly lower density of current gauging stations than the median of the 13 regions across northern Australia. The density of stations in the Western Cape region is considerably lower than the Murray-Darling Basin average. The mean density of current stream gauging stations across the entire Murray-Darling Basin is one gauge for every 1,300 km2.

438 ▪ Water in the Western Cape region August 2009 © CSIRO 2009
WC
-2 C
onte
xtua
l inf
orm
atio
n fo
r the
Wes
tern
Cap
e re
gion
Figure WC-12. Location of streamflow gauging stations overlaid on a relative relief surface showing the proportion of gauges with flow above maximum gauged stage height across the Western Cape region

© CSIRO 2009 August 2009 Water in the Western Cape region ▪ 439
WC
-2 C
ontextualinformation
fortheW
estern Cape
region
WC-2.2.3 Groundwater
The Western Cape region contains a total of 585 registered groundwater bores. Of these, 245 bores have surveyed elevations that could enable watertable surfaces to be constructed for the main aquifers. However these bores are not necessarily monitored on a regular basis. There are 13 water level monitoring bores in the region; four are historical and nine are current (Figure WC-13). Of the nine current monitoring bores, one is for the Great Artesian Basin (GAB) aquifer and eight are for sub-artesian aquifers.
Figure WC-13. Current groundwater monitoring bores in the Western Cape region
WC-2.2.4 Data gaps
Time series groundwater level and salinity data are required for each of the main aquifer types in the Western Cape region to provide greater understanding of recharge processes and inter-aquifer leakage, particularly for the Great Artesian Basin aquifers.

440 ▪ Water in the Western Cape region August 2009 © CSIRO 2009
WC
-2 C
onte
xtua
l inf
orm
atio
n fo
r the
Wes
tern
Cap
e re
gion
WC-2.3 Hydrogeology
This section describes the key sources of groundwater in the Western Cape region.
WC-2.3.1 Aquifer types
The majority of the Western Cape region is underlain by aquifers of the GAB. The exception is the Coen Inlier which occurs in the east of the region (Figure WC-2). A veneer of Tertiary and Quaternary sediments also provides shallow, localised aquifers.
Fractured rock aquifers of the Coen Inlier
The Coen Inlier resides along the eastern margin of the Western Cape region. It comprises Precambrian age metamorphics and predominantly Carboniferous to Permian age intrusive rocks that have experienced tectonic compression and metamorphism (Horn et al., 1995). The fractured rock aquifers derive groundwater storage capability from secondary porosity features such as joints, faults and voids. Aquifer yields are generally low, but are also highly variable depending on the character of fractures intersected when drilling.
The primary source of groundwater is contained within the weathered zones of the granite of the Coen Inlier, with water bores typically constructed to depths of less than 25 m (Horn et al., 1995). Below this depth the granite becomes massive, with negligible groundwater storage capacity.
Great Artesian Basin aquifers
The Great Artesian Basin comprises a multi-layered confined aquifer system, with aquifers occurring in Triassic, Jurassic and Cretaceous continental quartzose sandstones, predominantly confined by low permeability mudstones and siltstones.
The Gilbert River Formation occurs across the entire region, west of the Great Dividing Range. It comprises fine- to coarse-grained quartzose sandstone with pebble conglomerate and siltstone. The Gilbert River Formation is confined in the south of the region, by the mudstones of the overlying Rolling Downs Group. Large supplies (>60 L/second) of medium quality groundwater can be obtained from the Gilbert River Formation aquifer from bores that intersect the entire sandstone sequence (Figure WC-2). The Helby Beds are considered an equivalent of the Gilbert River Formation, the main difference being that they are unconfined. Shallow bores that intersect the unconfined Gilbert River Formation typically provide yields of 1 to 5 L/second of good quality groundwater (DNRM, 2005).
The Garraway Beds underlie the Gilbert River Formation in the Aurukun and Holroyd areas. The Garraway Beds are similar to the Gilbert River Formation in lithology and the combined thickness of these two units is 200 to 300 m in the area around the Edward River (McEniery, 1979).
Cainozoic aquifers
The Bulimba Formation occurs across the entire Western Cape region, west of the Great Dividing Range, with significant areas of outcrop occurring north of the Holroyd River. The Bulimba Formation comprises fluvial sediments derived mainly from the weathering of the Gilbert River Formation outcrop in the eastern part of the region. Aquifers are typically constrained to old stream channels which trend easterly and meander through a matrix of clayey, less transmissive sediments and hence are not continuous and not always in hydraulic connection with one another. In the Aurukun area, the easterly trending sand bodies are in the order of 100 m wide and are utilised for stock and domestic purposes (Pettifer et al., 1976). South of approximately the Archer River, the Bulimba Formation is overlain by the Wyaaba Beds and contains locally artesian aquifers (Pettifer et al., 1976).
The Bulimba Formation has been affected by several episodes of lateritic weathering which has formed a highly permeable, pisolitic, bauxite cap. The bauxite is typically 20 m thick and underlain by approximately 80 m of Bulimba Formation (Coffey & Hollingsworth, 1975). The bauxite is usually unsaturated, with the watertable residing in the underlying Bulimba Formation.
The Upper Tertiary Wyaaba Beds are typically 80 m thick (Grimes, 1977) and have a similar lithology to the Bulimba Formation. The marine facies of the Wyaaba Beds is characterised by muddy, coralline limestone and forms the main

© CSIRO 2009 August 2009 Water in the Western Cape region ▪ 441
WC
-2 C
ontextualinformation
fortheW
estern Cape
region
aquifer of this formation. The limestone aquifer of the Wyaaba Beds is found near the base of the formation and is up to 50 m thick (DNRMW, 2006). The Wyaaba Beds limestone aquifer is limited to the present day coastline and only supplies artesian water up to 50 km inland from the coast (Horn et al., 1995). The Wyaaba Beds are not considered a significant groundwater resource outside of the area where the limestone occurs.
There is negligible information available for either the Quaternary alluvial or coastal deposits. Overall they do not provide a viable groundwater resource, as extraction is difficult due to the fine-grained nature of the sediments. Furthermore, the saline conditions and risk of saltwater intrusion are key factors against development of the coastal aquifers. Shallow groundwater may be obtained from the valley alluvium associated with the larger rivers.
WC-2.3.2 Inter-aquifer connection and leakage
There is potential for inter-connection and leakage via upward vertical flow from the Gilbert River and the Bulimba Formations, to the overlying alluvial sediments. Typical positive head pressures of bores tapping the confined Gilbert River Formation aquifers are 25 m in the western onshore margins (DNRM, 2005). Upward leakage is likely to occur where the confining beds are thin and hydraulic gradients are high, conditions typical of marginal areas of the basin. It will also occur where faults act as conduits for the upward migration of groundwater. Despite the low permeability and percolation rates, this leakage probably accounts for considerable volumes of discharge (DNRM, 2005). The presence of springs along the eastern margin of the region (in the recharge area) predominantly results from the rejection of aquifer recharge.
During the wet season this process is essentially reversed, as stream leakage recharges the unconfined aquifers through which they are incised.
Tidal influences have been recognised in bores constructed in the Wyaaba Beds, which was interpreted by Horn et al. (1995) to indicate aquifer outcrop on the seabed to the west. The aquifer is hydraulically connected to seawater under the Gulf of Carpentaria and thus is at risk of saltwater intrusion if the groundwater levels of the aquifer decline.
WC-2.3.3 Recharge, discharge and groundwater storage
Fractured rock aquifers of the Coen Inlier
Fractured rock aquifers of the Coen Inlier are recharged via the vertical infiltration of rainfall where the basement outcrops. Recharge to fracture zones will be rapid in areas where fractures persist to great depths. Where fractures are exposed to ephemeral streams, a significant volume of groundwater recharge is likely to occur during the wet season.
Great Artesian Basin aquifers
Groundwater moves in a westerly direction from what are known as ‘recharge beds’ or ‘intake beds’ (Figure WC-3) to the Gulf of Carpentaria, along an estimated gradient of 1 in 1000 (Coffey and Hollingsworth, 1975).
The primary recharge mechanisms to the GAB aquifers include diffuse rainfall, preferred pathway flow, and localised recharge beneath rivers, creeks and alluvial groundwater systems overlying the intake beds (Kellett et al., 2003). Preferred pathway flow involves the movement of water through conduits such as fissures, joints, remnant tree roots or highly permeable beds and is considered the dominant recharge process for the intake beds. Diffuse rainfall recharge and localised recharge occurs where the GAB sandstone aquifers outcrop along the elevated western slopes of the Great Dividing Range.
Discharge from the GAB occurs in a number of ways, including:
natural discharge from springs. Springs are quite common in the recharge areas to the north-east of the region where the GAB aquifers are recharged. The location of springs can be seen in Figure WC-3. They are mainly associated with ‘overflow’ or the ‘rejection’ of recharge into aquifers, or from the interaction between the local topography and aquifers.
upward vertical leakage through the confining beds towards the regional watertable. This occurs throughout the basin and, despite the slow percolation rates, may constitute a significant volume of water
subsurface outflow from the GAB into the Gulf of Carpentaria (although little is known about the volume or significance of this form of discharge)

442 ▪ Water in the Western Cape region August 2009 © CSIRO 2009
WC
-2 C
onte
xtua
l inf
orm
atio
n fo
r the
Wes
tern
Cap
e re
gion
artificial discharge, via artesian flow and pumped extraction from wells drilled into aquifers.
Cainozoic aquifers
The Bulimba Formation is predominantly recharged via the vertical infiltration of rainfall. The watertable tends to rise and fall simultaneously over the whole Bulimba Formation aquifer without any lag, which indicates that recharge does not occur at a distant source, but via direct rainfall infiltration (Coffey and Hollingsworth, 1971). The watertable rises each wet season by an amount which is dependent upon, but not directly proportional to, rainfall. A rise in watertable level is typically not observed until wet season rainfall has exceeded approximately 1 m. Prior to this, rainfall is accounted for by evapotranspiration, surface runoff and wetting of the upper strata (Coffey and Hollingsworth, 1975).
Discharge from the Bulimba Formation occurs as discharge to creeks. Drainage from the aquifer helps maintain flow in a number of creeks during the dry season.
The Wyaaba Beds limestone aquifer is completely confined and has no known onshore outcrop. The primary recharge mechanism is suspected to be via lateral groundwater inflow from the east (NRMW, 2006). Given that the water levels of the aquifer have remained relatively stable throughout the 1980s and early 1990s, it is unlikely that the aquifer receives no recharge (WRC, 1993).
WC-2.3.4 Groundwater quality
Figure WC-14 shows groundwater salinity at approximately 100 bores in the Western Cape region. The majority of the bores have groundwater salinity of less than 5000 µS/cm. These bores have measurement dates ranging from 1967 to 1997, and represent total depths of between 3 m and more than 1000 m below ground surface. Hence there are no apparent trends in the spatial distribution of groundwater salinity in this map because the data represents groundwater from multiple aquifers (shallow and deep).
Groundwater salinity within the fractured rock aquifers of the Coen Inlier is typically higher when derived from the granites as opposed to the metamorphic rocks (Horn et al., 1995). The Department of Natural Resources and Water (DNRW) records groundwater quality information for 17 bores constructed in the fractured rock aquifers. These bores have groundwater salinity observations ranging from 255 to 4760 µS/cm EC. The median salinity observation is 1700 µS/cm.
Groundwater from deeper sections of the Gilbert River Formation is not suitable for human consumption, due to the high fluoride concentration of between 2 and 10 mg/L (Horn et al., 1995). In the Western Cape region, the DNRW has groundwater quality information for three bores constructed in the Gilbert River Formation and equivalents. These three bores have depths of 54, 101 and 121 m and latest salinity measurements of 158, 210 and 691 µS/cm EC, respectively.
The DNRW has groundwater quality information for 42 bores constructed in the Bulimba Formation. Salinity observations range from 24 to 3750 µS/cm, with a mean value from all records of 53 µS/cm.
Groundwater quality for the Pormpuraaw Town bore, constructed in the Wyaaba Beds, averages 790 mg/L TDS (WRC, 1993). The salt/fresh water interface for the Wyaaba Beds aquifer occurs approximately 2 km offshore and hence seawater intrusion is not currently an issue. Successions of poor wet seasons, however, are likely to have caused the landward movement of the saltwater interface.
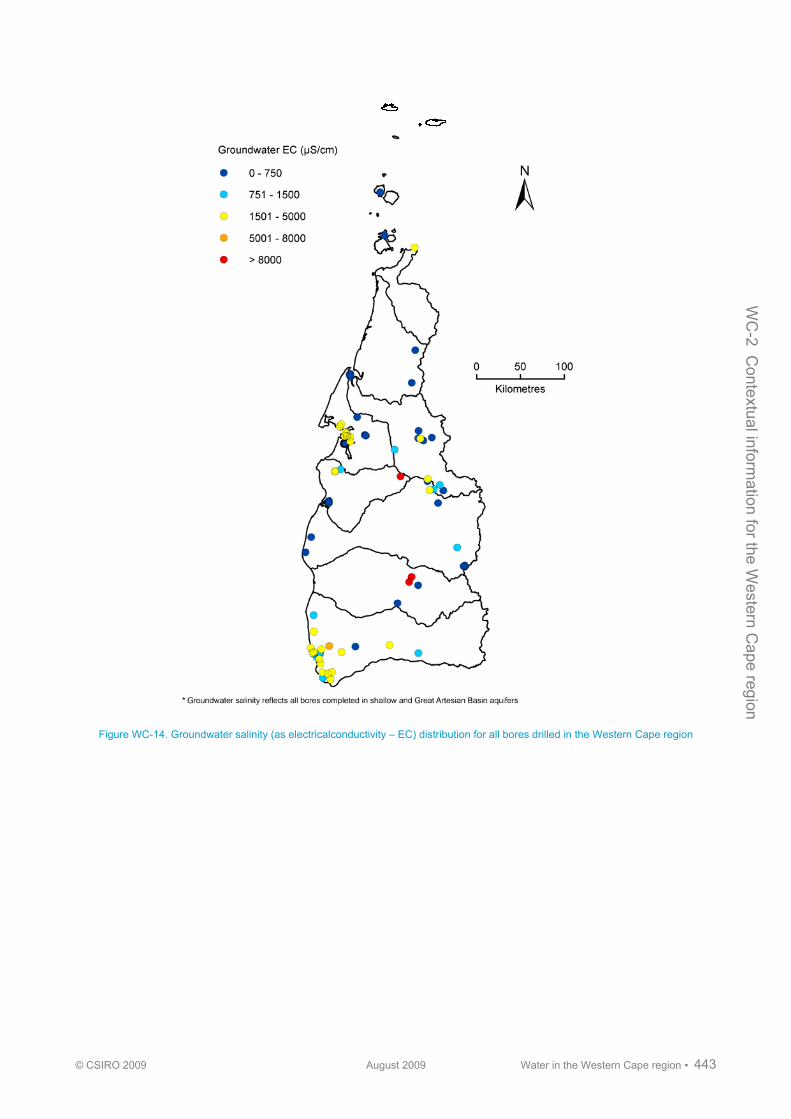
© CSIRO 2009 August 2009 Water in the Western Cape region ▪ 443
WC
-2 C
ontextualinformation
fortheW
estern Cape
region
Figure WC-14. Groundwater salinity (as electricalconductivity – EC) distribution for all bores drilled in the Western Cape region

444 ▪ Water in the Western Cape region August 2009 © CSIRO 2009
WC
-2 C
onte
xtua
l inf
orm
atio
n fo
r the
Wes
tern
Cap
e re
gion
WC-2.4 Legislation, water plans and other arrangements
WC-2.4.1 Legislated water use, entitlements and purpose
Seven river basins in the Western Cape region are either declared or potential wild river areas. The Wild Rivers Act 2005 includes a process for the Minister for Natural Resources to declare wild river areas. The intent of the legislation it preserve the natural values of rivers that have all or almost all of their natural values intact - wild rivers. It does this by regulating most future development activities and resource allocations within a declared wild river and its catchment - the wild river area. A wild river declaration will include water allocation limits by including unallocated water held in reserves for specific purposes. New development activities will be regulated through existing development assessment process with wild river requirements applied through a wild river declaration or the wild rivers code. Development and authorisations in place at the time a declaration is made are not affected and continue.
WC-2.4.2 Groundwater use and entitlements
Groundwater entitlement volumes and estimated stock and domestic use volumes were reported as part of the Water
Resource (Great Artesian Basin) Plan 2006 (listed under the Water Act 2000). This information was collated in terms of the management areas defined for the GAB in Queensland (Table WC-3) and has been reconfigured by DNRW to estimate volumes for the Northern Australia Sustainable Yields Project reporting regions.
Groundwater sourced from the GAB aquifers is vital to the outback regions of Queensland, as it is often the only reliable water supply for towns, stock and domestic purposes. The GAB aquifers also provide water for industrial purposes such as mining, power generation, aquaculture, feedlots and piggeries. In the Western Cape region groundwater extraction from the GAB aquifers is dominated by mining use at Weipa.
For the Western Cape region the estimated volume of stock and domestic use is less than 1 GL/year and the volume of licensed entitlements is approximately 30 GL/year (Table WC-3). This table shows that the Cainozoic sediments of the Karumba Basin are the most extensively utilised groundwater source, with approximately 21 GL/year of entitlements assigned to this aquifer, whilst a relatively smaller portion (i.e. approximately 10 GL/year) is assigned to the GAB aquifers.
Table WC-3. Estimated stock and domestic groundwater use and sum of groundwater entitlements for the Western Cape region
Formation Stock & domestic use Entitlement GL/y Quaternary alluvium 0.00 0.055Cainozoic sediments (including Karumba Basin) 0.24 21.461Cretaceous sedimentary rocks 0.05 0.000Jurassic – Early Cretaceous Great Artesian Basin aquifers 0.20 9.007Paleozoic rocks 0.01 0.100Proterozoic rocks 0.00 0.000Total volume 0.51 30.623
Fractured rock aquifers of the Coen Inlier
Groundwater occurs in both the granites and metamorphic rocks of the Coen Inlier. There are three bores in the town of Coen that extract water from the metamorphic rocks and although they provide small groundwater yields (approximately 1 L/second) they are used from September to December in most years when surface water supplies diminish (Horn et al., 1995). Groundwater use is limited in the fractured rock aquifers of the Coen Inlier, due to the variability of groundwater yields.

© CSIRO 2009 August 2009 Water in the Western Cape region ▪ 445
WC
-2 C
ontextualinformation
fortheW
estern Cape
region
Great Artesian Basin aquifers
The majority of the Western Cape region is represented by the Cape Management Area (Figure WC-15). This management area serves to protect the groundwater resources of the GAB sediments in the Carpentaria Basin north of the Holroyd River.
The southern portion of the Cape Management Area includes the Gilbert River Formation and the underlying Garraway Beds (which are considered equivalents and hence managed as one resource) which occur between Dulhunty and Holroyd rivers. The major water use from the Gilbert River Formation in this area is for industrial and mining purposes associated with the Comalco bauxite mines near Weipa. The small number of stock and domestic bores that exist in the area are restricted to areas of outcrop to the east, where only shallow bores are required (DNRM, 2005).
The northern third of the Cape Management Area comprises the Helby Beds (equivalent to unconfined Gilbert River Formation). Water use is restricted to stock and domestic purposes in this area.
The springs, streams and associated riparian environments have significant environmental, cultural and economic value. Environmental tourism is the second most important industry after mining in this area.
Figure WC-15. Groundwater management areas of the Great Artesian Basin in the Western Cape region

446 ▪ Water in the Western Cape region August 2009 © CSIRO 2009
WC
-2 C
onte
xtua
l inf
orm
atio
n fo
r the
Wes
tern
Cap
e re
gion
DNRM (2005) concluded that there was no capacity for further allocation of water from the GAB aquifers in the Cape Management Area. This was based on the following issues related to current and future extraction from the Cape area:
management of current groundwater use potential future groundwater use under the existing agreement acts potential future groundwater use as part of the Aurukun Project mining proposal interaction between the two existing Agreement Acts and the Water Act 2000 preservation of spring discharge and river baseflows and the ecosystems that they maintain.
The current situation is that unallocated water has been made available under the Water Resource (Great Artesian
Basin) Plan 2006 - 100ML in the Gilbert River Equivalents in the Cape area and 10000ML in a State reserve (across the whole GAB). Unallocated water may be granted from the State reserve for a project of State significance, project of regional significance or for water granted to a local government - town water supply purposes. There are applications for 9000ML for State Reserve in the Cape area.
Cainozoic aquifers
Good supplies of water can be obtained from small easterly-trending permeable bodies of sand within the Bulimba Formation. These intermittent aquifers occupy approximately 10 percent of the formation and around half of these aquifers reside below the watertable (Pettifer et al., 1976).
The Pormpuraaw community is centred on the alluvial plains dissected by the Edward River. The Wyaaba Beds provide stock and town water supplies in this area. Bores are constructed in the sandy limestone aquifer, at depths of 45 to 65 m below ground surface. The town supply bore provides groundwater yields of 7 L/second.
Underlying the bauxite deposits at Weipa, a sandy aquifer of the Bulimba Formation contains groundwater suitable for industrial and domestic use. It occurs between 5 to 10 m below the surface and is typically 3 to 12 m thick. In excess of 15 bores are constructed in this aquifer.
WC-2.4.3 Rivers and storages
There are no storages on any rivers in the Western Cape region.
WC-2.4.4 Unallocated water
Under the Cape York Peninsula Heritage Act 2007 (Qld) a wild river declaration must ‘provide for a reserve of water in the area to which the declaration or plan relates for the purpose of helping indigenous communities in the area achieve their economic and social aspirations’. This allocation is known as the Indigenous reserve.
The Archer basin wild river declaration provides for 6000 ML/year as the Indigenous reserve. Additional unallocated water reserves include a Strategic Reserve of 6000 ML/year and a General Reserve of 2000 ML/year.
Table WC-4. Current unallocated waterreserves for the Western Cape region
Reserve type Location Total volume ML/y Archer River Basin General reserve Undefined 2,000 Strategic reserve (state purpose) Undefined 6,000 Indigenous reserve Undefined 6,000 Total volume 14,000
© CSIRO 2009 August 2009 Water in the Western Cape region ▪ 447
WC
-2 C
ontextualinformation
fortheW
estern Cape
region
WC-2.4.5 Social and cultural considerations
The Western Cape region is typified by a low mobility of population, low employment in agriculture, manufacturing or mining and high reemployment by government, and low incomes. Most people rent from community organisations. A high percentage, however, have ten years or more of schooling, though there are relatively few vehicles and little Internet access. There is a medium to high percentage of Indigenous people in the region. Indigenous owners are represented by 24 language groups (Thaayorre, Bakanh, Yir Yoront, Kunjen, Wik, Thaayorre, Kaanju, Mungkan, Southern Kaanju, Ayapathu, Winda Winda, Mbeiwum, Kaanju, Yinwum, Luthig, Teppathiggi, Yupangathi, Tjungandi, Thanakwithi, Anggamudi, Mpalitjahn, Teppathiggi, Wuthahti and Yadhaigana).
The exception to these statistics is the Embley River basin, which contains the Weipa bauxite mines and hence has a high percentage of people working in the mining and manufacturing industries.
WC-2.4.6 Changed diversion and extraction regimes
Only minor diversions and extractions will be permitted across the Western Cape region.
WC-2.4.7 Changed land use
There is unlikely to be any substantial land use change in the near future.
WC-2.4.8 Environmental and legislative constraints and implications of future development
Major threats to the wild river values of this region include encroaching invasive weeds, growing numbers of feral pigs, and under-investment in land management. Wild river protection, as well as the Indigenous Wild River Ranger program, will help address these impacts and resourcing issues.
The Queensland Parliament passed the Wild Rivers Act 2005 in October 2005. The purpose of this Act is to preserve the natural values of rivers that have not been significantly affected by development and thus have all, or almost all, of their natural values intact. It does this by regulating development within a declared wild river and its catchment area, and by regulating the taking of natural resources from the area. The Act establishes a framework that includes the declaration of wild river areas that may include:
high preservation areas preservation areas floodplain management areas subartesian management areas.
The Wild Rivers and Other Legislation Amendment Act 2006 was assented to on 7 December 2006. This Act amended the Wild Rivers Act (and a number of associated Acts) as well as other unrelated legislation.
The amendments removed a number of unintended consequences and constraints on low-impact economic development, while retaining the original intent of the wild rivers policy. These included allowing low-impact development for mining, transport, agricultural and other industries, and removing many wild river requirements for development in urban areas.

448 ▪ Water in the Western Cape region August 2009 © CSIRO 2009
WC
-2 C
onte
xtua
l inf
orm
atio
n fo
r the
Wes
tern
Cap
e re
gion
WC-2.5 References
Abrahams H, Mulvaney M, Glasco D and Bugg A (1995) Areas of Conservation Significance on Cape York Peninsula. Australian Heritage Commission.
ACRES (2000) ACRES Landsat 7 Mosaic of Australia, 1999–2000. Australian Centre for Remote Sensing. Australian Government - Geoscience Australia, Canberra.
BRS (2002) Land use of Australia, Version 3, 2001/2002. Australian Government -Bureau of Rural Sciences. Metadata at <http://adl.brs.gov.au/anrdl/php/full.php?fileidentifier=http://adl.brs.gov.au/findit/metadata_files/pa_luav3r9eg__00112a06.xml>
Coffey and Hollingsworth (1971) Shallow Aquifer Investigation – Wiepa, North Queensland Coffey and Hollingsworth (1975) Summary report on water availability, Aurukun area – North Queensland. DEWR (2005) Australia - Present Major Vegetation Groups - NVIS Stage 1, version 3. Australian Government Department of the
Environment and Water Resources. <http://www.environment.gov.au/erin/nvis/mvg/index.html> DNRM (2005) Hydrogeological framework report for the Great Artesian Basin resource plan area. Queensland Department of Natural
Resources and Mines DNRMW (2006) Gulf and Mitchell report on the subartesian water resources in the Gulf and Mitchell water resource plan areas.
Queensland Department of Natural Resources, Mines and Water. Environment Australia (2001) A directory of important wetlands in Australia. Environment Australia, Canberra, Third Edition. Available at
<http://www.environment.gov.au/water/publications/environmental/wetlands/pubs/directory.pdf>. Grimes K (1977) Holroyd, Queensland, 1:250 000 geological series explanatory notes. Sheet SD/54-11. Bureau of Mineral Resources,
Australia & Geological Survey of Qld 1v, 20pp. Horn AM, Derrington EA, Herbert GC, Lait RW and Hillier JR (1995) Groundwater Resources of Cape York Peninsula. Strategy office of
the co-ordinator general of Queensland, Brisbane, Department of the Environment, Sport and Territories, Canberra, Queensland Department of Primary Industries, Brisbane and Mareeba, and Australian Geological Survey Organisation, Mareeba.
Kellett JR, Ransley TR, Coram J, Jaycock J, Barclay DF, Mcmahon GA, Foster LM and Hillier JR (2003) Groundwater Recharge in the Great Artesian Basin Intake Beds, Queensland, Final Report for NHT Project #982713 Sustainable Groundwater Use in the GAB Intake Beds, Queensland, BRS, Natural Resources and Mines, Queensland Government.
Magnusson WE, Grigg GC and Taylor JA (1980) An aerial survey of potential nesting areas of Crocodylus porosus on the west coast of Cape York Peninsula. Australian Wildlife Research 7, 465-478.
McEniery MB (1979) Report on Groundwater Hydrology – Edward River locality. Prepared for the Queensland Water Resources Commission, Groundwater branch
Pettifer GR, Smart J, McDowell MI, Horsfall CL and Gibson DL (1976) Cape York Peninsula geophysical and geological groundwater investigation, Queensland 1974.
Taplin LE (1987) The Management of Crocodiles in Queensland, Australia. In: Wildlife Management: Crocodiles and Alligators (eds Webb GJW, Manolis SC and Whitehead PJ). Surrey Beatty and Sons/Conservation Commission of the Northern Territory.
WRC (1993) Preliminary report on groundwater investigations into Pormpuraaw – Western Cape York North Queensland. Prepared by the Mareeba District Office of the Queensland Department of Primary Industries. Water Resources Commission.

© CSIRO 2009 August 2009 Water in the Western Cape region ▪ 449
WC
-3 W
aterbalanceresults
fortheW
estern Cape
region
WC-3 Water balance results for the Western Cape region
This chapter describes modelling results and the assessment of the water resources undertaken by this project for the Western Cape region. Detailed, quantified assessments are made where possible, and relevant, and confidence is estimated. Modelling results are reported under climate and development scenarios as defined at the division level in Section 2.1 of Chapter 2. This chapter is sub-divided into:
climate recharge estimation conceptual groundwater models groundwater modelling results rainfall-runoff modelling results river system water balance changes to flow regimes at environmental assets.
WC-3.1 Climate
WC-3.1.1 Historical climate
The Western Cape region receives an average of 1417 mm of rainfall over the September to August water year (Figure WC-16), most of which (1370 mm) falls in the November to April wet season (Figure WC-17). Across the region there is a strong east–west gradient in annual rainfall (Figure WC-18), ranging from 1054 mm in the east to 1809 mm in the west. During the historical (1930 to 2007) period, annual rainfall has been gradually increasing from an initial average of around 1300 mm to approximately 1500 mm later in the period. The highest yearly rainfall received was 2033 mm which fell in 1999, and the lowest was 735 mm in 1961.
Areal potential evapotranspiration (APET) under the historical climate is very high across the region, averaging 1874 mm over a water year (Figure WC-16), and varies moderately across the seasons (Figure WC-17). APET generally remains higher than rainfall from April until November resulting in water-limited conditions over these months. Between December and March conditions are energy-limited meaning more rain falls than can potentially be evaporated.

450 ▪ Water in the Western Cape region August 2009 © CSIRO 2009
WC
-3 W
ater
bal
ance
resu
lts fo
r the
Wes
tern
Cap
e re
gion
(a) (b)
0
600
1200
1800
50/ 51 70/ 71 90/ 91 06/ 07
Ann
ual r
ainf
all (
mm
) ,,,,
-750-600-450-300-150
0150300450600750
50/ 51 70/ 71 90/ 91 06/ 07Ann
ual r
ainf
all d
iver
genc
e (m
m)
,,,
,,,
(c) (d)
1650
1700
1750
1800
1850
1900
1950
2000
2050
50/ 51 70/ 71 90/ 91 06/ 07
Ann
ual A
PE
T (
mm
) ,,,,
-180
-120
-60
0
60
120
180
Ann
ual A
PE
T d
iver
genc
e (m
m)
,,,,,
Figure WC-16. (a) Historical annual rainfall and (b) its divergence from the long-term mean; and (c) historical annual areal potential evapotranspiration and (d) its deviation from the long-term mean averaged over the Western Cape region. The low-frequency smoothed
line in (a) indicates longer term variability
(a) (b)
0
100
200
300
400
500
J F M A M J J A S O N D
Mon
thly
rai
nfal
l (m
m)
,,,
,,, Range
± Sdev
Mean
60
100
140
180
220
260
J F M A M J J A S O N D
Mon
thly
rai
nfal
l (m
m)
,,,
,,, Range
± Sdev
Mean
Figure WC-17. Historical mean monthly (a) rainfall and (b) areal potential evapotranspiration and their temporal variation (range and ± one standard deviation) averaged over the Western Cape region

© CSIRO 2009 August 2009 Water in the Western Cape region ▪ 451
WC
-3 W
aterbalanceresults
fortheW
estern Cape
region
Figure WC-18. Spatial distribution of historical mean annual (water year), wet season and dry season rainfall and areal potential evapotranspiration (potential evaporation) and their difference (rainfall less areal potential evapotranspiration) across the Western Cape
region
WC-3.1.2 Recent climate
Figure WC-19 compares recent (1996 to 2007) to historical (in this case the 66-year period 1930 to 1996) mean annual rainfall for the Western Cape region. Across the whole region, recent rainfall is between zero and 30 percent higher than historical rainfall. In the north and south-west of the region there have been statistically significant increases in rainfall.

452 ▪ Water in the Western Cape region August 2009 © CSIRO 2009
WC
-3 W
ater
bal
ance
resu
lts fo
r the
Wes
tern
Cap
e re
gion
(a) (b)
(c) (d)
Figure WC-19. Spatial distribution of (a) historical and (b) recent mean annual rainfall; and (c) their relative percent difference and (d) the statistical significance of these differences across the Western Cape region. (Note that historical in this case is the 66-year period
1930 to 1996)
WC-3.1.3 Future climate
Under Scenario C rainfall varies between 1320 and 1570 mm/year (Table WC-5) compared to the historical mean of 1417 mm/year. Similarly, APET ranges between 1897 and 1944 mm/year compared to the historical mean of 1874 mm/year.
A total of 45 variants of Scenario C were modelled (15 global climate models (GCMs) for each of the high, medium and low global warming scenarios). Subsequently, results from an extreme ‘wet’, median and extreme ‘dry’ variant are shown (referred to as scenarios Cwet, Cmid and Cdry). Under Scenario Cwet annual rainfall and APET increase by 11 percent

© CSIRO 2009 August 2009 Water in the Western Cape region ▪ 453
WC
-3 W
aterbalanceresults
fortheW
estern Cape
region
and 2 percent, respectively. Under Scenario Cmid both annual rainfall and APET increase by 1 percent. Under Scenario Cdry annual rainfall decreases by 7 percent and APET increases by 4 percent.
Under Scenario Cmid monthly averages of rainfall and APET do not differ much from historical values (Figure WC-20). Under Scenario Cmid rainfall lies well within the range in values from all 45 future climate variants. The seasonality of rainfall is expected to change in that wet season rainfall decreases slightly. In contrast the seasonality of APET remains the same as any changes occur uniformly across the year. Under Cmid (and the majority of all Scenario C variants) APET is lower than historical values for every month of the year.
The spatial distributions of rainfall and APET under Scenario C are compared to the historical distribution in Figure WC-21 and Figure WC-22. Under Scenario C the strong east–west gradient in rainfall is retained in the wet season, with greatest changes in rainfall in the north. The spatial distribution of APET under Scenario C is similar to the highly regionalised historical distribution. The greatest changes to APET occur in the south of the region.
Table WC-5. Mean annual (water year), wet season and dry season rainfall and areal potential evapotranspiration in the Western Cape region under historical climate and Scenario C
Water year* Wet season Dry season mm/y mm/season
Rainfall Historical 1417 1370 47 Cwet 1570 1502 48 Cmid 1435 1369 48 Cdry 1320 1265 39 Areal potential evapotranspiration Historical 1874 974 900 Cwet 1902 979 921 Cmid 1897 982 913 Cdry 1944 1013 929 * Note that the sum of the wet season and dry season values does not always equal the water year values because the combined wet season and dry season period (November to October) is different to the water year period (September to August).
(a) (b)
0
80
160
240
320
400
480
J F M A M J J A S O N D
Mon
thly
rai
nfal
l (m
m) …
. C range
Cmid
Historical
100
140
180
220
J F M A M J J A S O N D
Mon
thly
AP
ET
(m
m) …
. C range
Cmid
Historical
Figure WC-20. Mean monthly (a) rainfall and (b) areal potential evapotranspiration averaged over the Western Cape region under historical climate and Scenario C. (C range is the range under the 45 Scenario C simulations – the lower and upper limits in C range are
therefore not the same as scenarios Cdry and Cwet)

454 ▪ Water in the Western Cape region August 2009 © CSIRO 2009
WC
-3 W
ater
bal
ance
resu
lts fo
r the
Wes
tern
Cap
e re
gion
Figure WC-21. Spatial distribution of mean annual (water year), wet season and dry season rainfall across the Western Cape region under historical climate and Scenario C

© CSIRO 2009 August 2009 Water in the Western Cape region ▪ 455
WC
-3 W
aterbalanceresults
fortheW
estern Cape
region
Figure WC-22. Spatial distribution of mean annual (water year), wet season and dry season areal potential evapotranspiration across the Western Cape region under historical climate and Scenario C

456 ▪ Water in the Western Cape region August 2009 © CSIRO 2009
WC
-3 W
ater
bal
ance
resu
lts fo
r the
Wes
tern
Cap
e re
gion
WC-3.1.4 Confidence levels
Analysis of confidence of the climate data is presented at the division level and is reported in Section 2.1.4 in Chapter 2.
WC-3.2 WAVES potential diffuse recharge estimations
The WAVES model (Zhang and Dawes, 1998) was used to estimate the change in groundwater recharge across the Western Cape region under a range of different climate scenarios. WAVES is a vertical recharge flux model that can model plant physiological feedbacks in response to increased CO2, as well as modelling the water balance of different soil, vegetation and climate regimes. It was chosen for its balance in complexity between plant physiology and soil physics. It was also used to assess recharge for the Murray-Darling Basin Sustainable Yields Project (Crosbie et al., 2008).
WC-3.2.1 Under historical climate
The calculated historical recharge for the Western Cape region shows that recharge is greatest in the north and decreases progressively to the south following the rainfall gradient. The historical record was assessed to establish any difference between wet and dry periods of recharge. A 23-year period was used, which allows the projection of recharge estimates to 2030 – in other words, to estimate recharge in 2030 assuming future climate is similar to historical climate (Scenario A). Under a wet historical climate (Scenario Awet) recharge increases 13 percent. Under the median estimate of historical climate (Scenario Amid) recharge decreases 3 percent. Under a dry historical climate (Scenario Adry) recharge decreases 15 percent.
Table WC-6. Recharge scaling factors in the Western Cape region for scenarios A, B and C
Region Awet Amid Adry B Cwet Cmid CdryWestern Cape 1.13 0.97 0.85 1.04 1.49 1.12 1.01

© CSIRO 2009 August 2009 Water in the Western Cape region ▪ 457
WC
-3 W
aterbalanceresults
fortheW
estern Cape
region
Figure WC-23. Spatial distribution of historical mean recharge rate; and recharge scaling factors across the Western Cape region for scenarios A, B and C. Recharge scaling factors are the ratio of the projected recharge in a scenario to that under Scenario A

458 ▪ Water in the Western Cape region August 2009 © CSIRO 2009
WC
-3 W
ater
bal
ance
resu
lts fo
r the
Wes
tern
Cap
e re
gion
WC-3.2.2 Under recent climate
The recent (1996 to 2007) climate in the Western Cape region has been wetter than the historical (1930 to 2007) average and consequently the calculated recharge increases by 4 percent under Scenario B relative to Scenario A (Table WC-6). This increase has not been spatially uniform with some areas in the east and south showing a decrease in recharge (Figure WC-23).
WC-3.2.3 Under future climate
Figure WC-24 shows the percentage change in modelled mean annual recharge averaged over the Western Cape region for Scenario C relative to Scenario A for the 45 scenarios (15 GCMs for each of the high, medium and low global warming scenarios). The percentage change in the mean annual rainfall and recharge from the corresponding GCMs are also tabulated in Table WC-7. Under some scenarios the recharge is projected to increase despite a decrease in rainfall. This is because total rainfall is not the only climate variable that has an influence over recharge. Daily rainfall intensity, temperature and CO2 concentration are also important drivers (see Section 2.3.3 in the division-level Chapter 2), and specific situations can result in this counter-intuitive result. In particular, rainfall intensity is seen as a significant factor in this relationship.
-60
-40
-20
0
20
40
60
mri
giss
_aom
miro
ccs
iro
ncar
_pcm
inm
cm
ncar
_ccsm ip
slcn
rm iap
cccm
a_t6
3m
iub
mpi
gfdl
cccm
a_t4
7
% c
hang
e in
mea
n an
nual
rec
harg
e ...
High global warming
Medium global warming
Low global warming
Figure WC-24. Percentage change in mean annual recharge under the 45 Scenario C simulations (15 global climate models and three global warming scenarios) relative to Scenario A recharge

© CSIRO 2009 August 2009 Water in the Western Cape region ▪ 459
WC
-3 W
aterbalanceresults
fortheW
estern Cape
region
Table WC-7. Summary results under 45 Scenario C simulations (numbers show percentage change in mean annual rainfall and recharge under Scenario C relative to Scenario A)
High global warming Medium global warming Low global warming GCM Rainfall Recharge GCM Rainfall Recharge GCM Rainfall Rechargemri -7% -7% mri -5% -5% mri -3% -3%giss_aom -5% 1% giss_aom -3% -1% giss_aom -2% 0%miroc -2% 2% miroc -2% 2% miroc -1% 0%csiro -9% 2% csiro -8% 0% csiro -5% 1%ncar_pcm 2% 7% ncar_pcm 1% 6% ncar_pcm 1% 5%inmcm 1% 15% inmcm 1% 11% inmcm 1% 7%ncar_ccsm 5% 17% ncar_ccsm 4% 12% ncar_ccsm 3% 9%ipsl 2% 17% ipsl 2% 12% ipsl 1% 9%cnrm 2% 19% cnrm 2% 13% cnrm 1% 11%iap 2% 22% iap 2% 17% iap 1% 12%cccma_t63 11% 24% cccma_t63 8% 20% cccma_t63 6% 15%miub 3% 28% miub 2% 22% miub 2% 13%mpi 0% 30% mpi 0% 23% mpi 0% 13%gfdl -3% 49% gfdl -3% 36% gfdl -2% 22%cccma_t47 26% 53% cccma_t47 20% 47% cccma_t47 14% 37%
Under Scenario Cwet recharge increases 49 percent. Under Scenario Cmid recharge increases 12 percent. Under Scenario Cdry recharge increases 1 percent. Due to the way the GCMs were selected for scenario Cwet and Cdry, an area near the tip of Cape York is calculated to have a decrease in recharge under Scenario Cwet and an increase in recharge under Scenario Cdry.
WC-3.2.4 Confidence levels
The estimation of recharge from WAVES is only indicative of the actual recharge and has not been validated with field measurements. A steady state groundwater chloride mass balance has been conducted as an independent measure of recharge (Crosbie et al., 2009). The results for the Western Cape region show that the historical estimate of recharge using WAVES (mean 346 mm/year) is much greater than the best estimate using the chloride mass balance (124 mm/year) and is outside of the confidence limits of the chloride mass balance (34 to 246 mm/year). These inconsistencies between methods are in part due to the different scales of each method, and they demonstrate the difficulty associated with deriving an accurate estimate of recharge in data poor areas.

460 ▪ Water in the Western Cape region August 2009 © CSIRO 2009
WC
-3 W
ater
bal
ance
resu
lts fo
r the
Wes
tern
Cap
e re
gion
WC-3.3 Conceptual groundwater models
The fractured rock aquifers in the east of the region are recharged via the direct infiltration of rainfall and via leakage from incised streams. Discharge occurs predominantly as throughflow and as baseflow where rivers incise the fractured rock. Evapotranspiration is not considered a significant process in the fractured rock aquifer in the Western Cape region. Only small groundwater supplies are obtained from this aquifer, as groundwater from these fractured rock aquifers contains relatively poor quality groundwater and the yields obtained are low.
The Gilbert River Formation aquifer is present across the entire Western Cape region, to the west of the Great Dividing Range. It is confined and artesian to the south of the region where it is overlain by the Rolling Downs Group. Here it capable of supplying large groundwater supplies. To the north of the region, the Gilbert River Formation is unconfined and typical bore yields are much lower.
The groundwater salinity of the Gilbert River Formation aquifer is typically low (i.e. less than 700 µS/cm EC). However the high fluoride concentration of groundwater from deeper parts of the aquifer precludes its use for human consumption or stock watering purposes.
Upward vertical leakage from the Gilbert River Formation to the overlying units is likely to occur; given that typical positive head pressures are about 25 m. Groundwater springs exist along the flanks of the Great Dividing Range, providing groundwater baseflow to many streams. The Jardine, Wenlock, Archer, Coen, Holroyd and the Dulhunty rivers all receive groundwater baseflow from the Gilbert River Formation aquifer. The Jardine River flows all year and is considered Queensland's largest perennial river. The continual flow of water is attributed to baseflow derived from the shallow sandstones of the Gilbert River Formation and to high annual rainfall which (unlike other northern tropical rivers which are subject to seasonal rainfall patterns) occurs all year around, even during the dry season.
During the wet season the process of groundwater discharge to rivers is essentially reversed, such that stream leakage recharges the unconfined aquifers through which they are incised. The primary recharge mechanism for GAB aquifers however, is the direct infiltration of rainfall where the GAB sandstone outcrops.
The Bulimba Formation overlies the GAB aquifers and occurs across the entire Western Cape region, west of the Great Dividing Range. It outcrops significantly north of the Holroyd River and is overlain by the Wyaaba Beds to the south, where it contains locally artesian aquifers. Aquifers are typically constrained to old stream channels and hence are not always in hydraulic connection with each other. Recharge occurs where the Bulimba Formation is found in outcrop and also potentially from upward vertical leakage from underlying GAB aquifers. Discharge occurs as baseflow to creeks, which helps maintain flow into the dry season.
The marine facies of the Wyaaba Beds is completely confined with the primary recharge mechanism thought to be via lateral groundwater inflow from the east. It is not considered a significant groundwater resource outside of the area where the limestone occurs, which is within approximately 50 km of the coastline.
Groundwater use in the Western Cape region is predominantly sourced from the Gilbert River Formation aquifer. For much of this region, DNRM (2005) recommend that no further allocations should be made from the GAB aquifers. The basis for this recommendation is to preserve spring discharge and river baseflow, thereby maintaining groundwater dependent ecosystems in the Cape Managemenat Area.
WC-3.3.1 Baseflow index analysis
The results of the baseflow analysis for suitable gauges in the Western Cape region are provided in Table WC-1 (in Chapter WC-1). The annual base flow index (BFI) values range from 0.221 to 0.532 (n=7, median = 0.261). Figure WC-2 (in Chapter WC-1) shows the surface geology of the Western Cape region and the average volume of dry season baseflow to rivers. A clear relationship is seen between higher dry season baseflow volumes and rivers that incise GAB aquifers. For these river reaches, the volume of groundwater derived stream flow ranges from 5 to 200 GL/year; whilst rivers that incise the older fractured rock aquifers have a much smaller volume of dry season baseflow, ranging from 1 to 5 GL/year.

© CSIRO 2009 August 2009 Water in the Western Cape region ▪ 461
WC
-3 W
aterbalanceresults
fortheW
estern Cape
region
WC-3.4 Groundwater modelling results
The limited data for the region precluded the development of quantitative groundwater models.
WC-3.5 Rainfall-runoff modelling results
In this section the term runoff is the sum of overland flow, interflow and baseflow. It is equivalent to streamflow expressed as a mm depth equivalent. All plots show data averaged over the modelled subcatchments of the Western Cape region. For this reason rainfall reported in this section may vary slightly from that reported elsewhere due to differences between the catchment boundaries (shown in Figure WC-1) and the DEM-derived catchment boundaries used here. In this section, where annual data are reported years are represented by numbers 1 through 77. Consistently throughout this report, annual data are based on the water year (1 September to 31 August) and the dry season is defined as 1 May to 31 October. Unless stated otherwise scenarios Cwet, Cmid and Cdry are selected on the basis of the ranked mean annual runoff. For more details on methods refer to Section 2.2 of the division-level Chapter 2.
WC-3.5.1 Regional synopsis
The rainfall-runoff modelling estimates runoff in 0.05 degree grid cells in 47 subcatchments (Figure WC-25). Optimised parameter values from ten calibration catchments are used. Nine of these calibration catchments are in the Western Cape region, the remaining calibration catchment is to the east in the Northern Coral region. The calibration catchments are sparsely located throughout the region.

462 ▪ Water in the Western Cape region August 2009 © CSIRO 2009
WC
-3 W
ater
bal
ance
resu
lts fo
r the
Wes
tern
Cap
e re
gion
Figure WC-25. Map of the modelling subcatchments, calibration catchments and calibration gauging stations used for the Western Cape region with inset highlighting (in red) the extent of the calibration catchments
WC-3.5.2 Model calibration
Figure WC-26 compares the modelled and observed monthly runoff and the modelled and observed daily flow exceedance curves for the 14 calibration catchments. Nash-Sutcliffe efficiency (NSE) values provide a quantitative measure of how well simulated values match observed values. NSE values are described in more detail in Section 2.2.3 of the division-level Chapter 2. On the monthly plots NSE is the monthly Nash-Sutcliffe efficiency value and NSE (dry season) is the dry season monthly Nash-Sutcliffe efficiency value. On the daily flow exceedance plots, NSE is the daily flow exceedance curve Nash-Sutcliffe efficiency value and NSE (50 to 100 percent) is the lower half of the daily flow exeedance curve Nash-Sutcliffe efficiency value.
The results indicate that the ensemble calibration of the rainfall-runoff models Sacramento and IhacresClassic can reasonably reproduce the observed monthly runoff series (NSE values generally greater than 0.8) and the daily flow exceedance curve (NSE values generally greater than 0.85). The volumetric constraint used in the model calibration also ensures that the total modelled runoff is within 5 percent of the total observed runoff.

© CSIRO 2009 August 2009 Water in the Western Cape region ▪ 463
WC
-3 W
aterbalanceresults
fortheW
estern Cape
region
The calibration method places more importance on the simulation of high runoff, and therefore rainfall-runoff modelling of the medium and high runoff is considerably better than the modelling of low runoff. It should be noted, however, that while the relative difference between the observed and simulated low flow values may be large, (which is what gives rise to the low monthly dry season NSE values for example) the absolute difference between the observed and simulated low flow values is generally small because both values are small. Nevertheless, an optimisation to reduce overall error variance can result in some underestimation of high runoff and overestimation of low runoff. This is evident in some of the scatter plots comparing the modelled and observed monthly runoff and many of the daily flow exceedance curves. For the majority of calibration catchments the disagreement between the modelled and observed daily runoff curves is discernable for runoff that is exceeded less than 5 percent of the time. This is accentuated in the plots because of the linear scale on the y-axis and normal probability scale on the x-axis. In any case, the volumetric constraint used in the model calibration ensures that the total modelled runoff is always within 5 percent of the total observed runoff. As indicated by the relatively low NSE values for the lower half of the daily flow exceedance curve and monthly dry season there may be considerable disagreement between observed and modelled low flow values (i.e. cease-to-flow). Overall the monthly NSE values are considered sufficient for the general purposes of estimating long-term mean annual runoff.

464 ▪ Water in the Western Cape region August 2009 © CSIRO 2009
WC
-3 W
ater
bal
ance
resu
lts fo
r the
Wes
tern
Cap
e re
gion

© CSIRO 2009 August 2009 Water in the Western Cape region ▪ 465
WC
-3 W
aterbalanceresults
fortheW
estern Cape
region
Figure WC-26. Modelled and observed monthly runoff and daily flow exceedance curve for each calibration catchment in the Western Cape region. (Red text denotes catchments located outside the region; blue text denotes catchments used for streamflow modelling
only)
WC-3.5.3 Under historical climate
Figure WC-27 shows the spatial distribution of mean annual rainfall and runoff under Scenario A (averaged over 1930 to 2007) across the Western Cape region. Figure WC-28 shows the mean annual rainfall and runoff averaged over the region.
The mean annual rainfall and runoff averaged over the Western Cape region are 1407 mm and 479 mm respectively. The mean wet season and dry season runoff averaged over the Western Cape region are 458 mm and 21 mm respectively.
In this project, all runoff grids are presented as long-term mean annual values. However the distributions of monthly and annual runoff data in northern Australia can be highly skewed, consequently the median and additional percentile values spatially averaged over the region are also reported. The 10th percentile, median and 90th percentile annual runoff values across the Western Cape region are 722, 471 and 221 mm respectively. The median wet season and dry season runoff averaged over the Western Cape region are 454 mm and 17 mm respectively.
The mean annual rainfall varies from about 1800 mm along parts of the west coast to 1000 mm in the south-east. The mean annual runoff varies from over 800 mm along parts of the west coast to less 160 mm in the south-west (Figure WC-27) and runoff coefficients vary from about 15 percent to nearly 50 percent. The majority of rainfall and runoff occurs during the wet season months December to April (Figure WC-29). Rainfall and runoff can vary considerably from year to year with long periods over several years or decades that are considerably wetter or drier than others (Figure WC-28). The coefficients of variation of annual rainfall and runoff averaged over the Western Cape region are 0.19 and 0.43 respectively.
The Western Cape is one of 13 regions which cover the three divisions studied in this project. Mean annual rainfall and runoff, as well as coefficients of variation, have been calculated for all of these 13 regions, and it is useful to compare the Western Cape results to results across all 13 regions. Across all 13 regions in this project 10th percentile, median and 90th percentile values are 1371, 936 and 595 mm respectively for mean annual rainfall and 374, 153 and 78 mm respectively for mean annual runoff. The mean annual rainfall (1407 mm) and runoff (479 mm) averaged over the Western Cape region are the highest of the 13 regions. Across all 13 regions in this project the 10th percentile, median and 90th percentile values are 0.34, 0.26 and 0.19 respectively for the coefficient of variation of annual rainfall and 1.39, 0.69 and 0.48 for the coefficient of variation of runoff. The coefficients of variation of annual rainfall (0.19) and runoff (0.43) averaged over the Western Cape region are among the lowest of the 13 reporting regions.

466 ▪ Water in the Western Cape region August 2009 © CSIRO 2009
WC
-3 W
ater
bal
ance
resu
lts fo
r the
Wes
tern
Cap
e re
gion
(a) (b)
Figure WC-27. Spatial distribution of mean annual (a) rainfall and (b) modelled runoff across the Western Cape region under Scenario A
(a) (b)
0
700
1400
2100
1 21 41 61 77
Water year
Ann
ual r
ainf
all (
mm
)...
0
400
800
1200
1 21 41 61 77
Water year
Ann
ual r
unof
f (m
m) ..
.
Figure WC-28. Annual (a) rainfall and (b) modelled runoff in the Western Cape region under Scenario A
Figure WC-29 (a,b) shows the minimum and maximum monthly rainfall and runoff and the range of values between the 25th and 75th percentile monthly rainfall and runoff. Figure WC-29(c,d) shows the mean and median monthly flows and the range of values between the 25th and 75th percentile monthly rainfall and runoff. In the Western Cape region the mean monthly runoff during the wet season is similar to the median monthly runoff during the wet season.
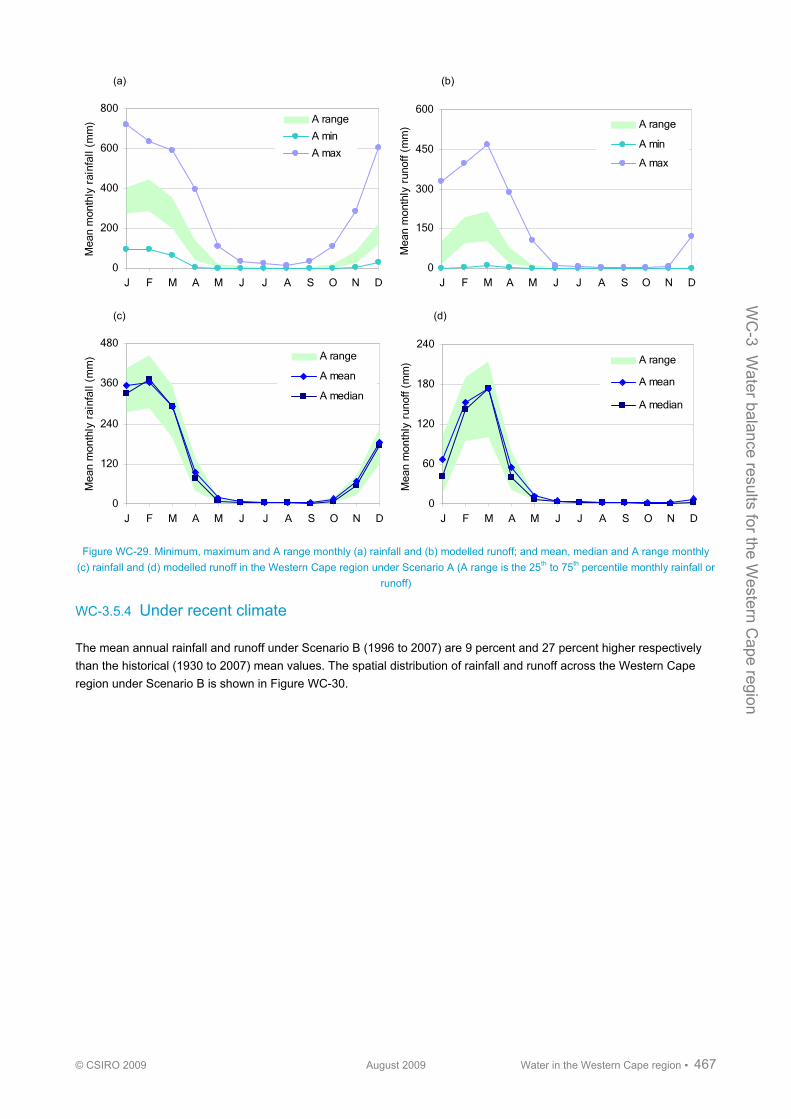
© CSIRO 2009 August 2009 Water in the Western Cape region ▪ 467
WC
-3 W
aterbalanceresults
fortheW
estern Cape
region
(a) (b)
0
200
400
600
800
J F M A M J J A S O N D
Mea
n m
onth
ly r
ainf
all (
mm
) ..
. A range
A min
A max
0
150
300
450
600
J F M A M J J A S O N D
Mea
n m
onth
ly r
unof
f (m
m) ... A range
A min
A max
(c) (d)
0
120
240
360
480
J F M A M J J A S O N D
Mea
n m
onth
ly r
ainf
all (
mm
) ..
. A range
A mean
A median
0
60
120
180
240
J F M A M J J A S O N D
Mea
n m
onth
ly r
unof
f (m
m) ... A range
A mean
A median
Figure WC-29. Minimum, maximum and A range monthly (a) rainfall and (b) modelled runoff; and mean, median and A range monthly (c) rainfall and (d) modelled runoff in the Western Cape region under Scenario A (A range is the 25th to 75th percentile monthly rainfall or
runoff)
WC-3.5.4 Under recent climate
The mean annual rainfall and runoff under Scenario B (1996 to 2007) are 9 percent and 27 percent higher respectively than the historical (1930 to 2007) mean values. The spatial distribution of rainfall and runoff across the Western Cape region under Scenario B is shown in Figure WC-30.

468 ▪ Water in the Western Cape region August 2009 © CSIRO 2009
WC
-3 W
ater
bal
ance
resu
lts fo
r the
Wes
tern
Cap
e re
gion
(a) (b)
Figure WC-30. Spatial distribution of mean annual (a) rainfall and (b) modelled runoff across the Western Cape region under Scenario B
WC-3.5.5 Under future climate
Figure WC-31 shows the percentage change in the mean annual runoff averaged over the Western Cape region under Scenario C relative to Scenario A for the 45 scenarios (15 global climate models (GCMs) for each of the high, medium and low global warming scenarios). The percentage change in the mean annual runoff and rainfall from the corresponding GCMs are also tabulated in Table WC-8.
The figure and table indicate that the potential impact of climate change on runoff can be very significant. Although there is considerable uncertainty in the estimates, the results indicate that runoff in ~2030 in the Western Cape region is as likely to increase as decrease. Rainfall-runoff modelling with climate change projections from half of the GCMs shows a reduction in mean annual runoff, while rainfall-runoff modelling with climate change projections from the other half of the GCMs shows an increase in mean annual runoff. The wide range of mean annual runoff values shown in Figure WC-31 and Table WC-8 is primarily due to the wide range of future projections of rainfall by the 15 GCMs.
Because of the large variation between GCM simulations and the method used to obtain the climate change scenarios, the biggest increase and biggest decrease in runoff come from the high global warming scenario. For the high global warming scenario, rainfall-runoff modelling with climate change projections from four of the GCMs indicates a decrease in mean annual runoff greater than 10 percent while rainfall-runoff modelling with climate change projections from two of the GCMs indicates an increase in mean annual runoff greater than 10 percent.
In subsequent reporting here and in other sections, only results from an extreme ‘wet’, ‘mid’ and extreme ‘dry’ variant are shown (referred to as scenarios Cwet, Cmid and Cdry). Under Scenario Cwet, results from the second highest increase in mean annual runoff from the high global warming scenario are used. Under Scenario Cdry, results from the second highest reduction in mean annual runoff from the high global warming scenario are used. Under Scenario Cmid, the median mean annual runoff results from the medium global warming scenario are used. These are shown in bold in Table WC-8.
Under scenarios Cwet, Cmid and Cdry, mean annual runoff increases by 30 and 1 percent and decreases by 19 percent relative to Scenario A. By comparison, the range based on the low global warming scenario is a 16 to -11 percent change in mean annual runoff. Figure WC-32 shows the mean annual runoff across the Western Cape region under scenarios A and C. The linear discontinuities that are evident in Figure WC-32 are due to GCM grid cell boundaries.

© CSIRO 2009 August 2009 Water in the Western Cape region ▪ 469
WC
-3 W
aterbalanceresults
fortheW
estern Cape
region
-40
-20
0
20
40
60
80
mri
csiro
giss
_aom
miro
cm
pigf
dl
inm
cm ipsl
cnrm
ncar
_pcm ia
p
ncar
_ccsm m
iub
cccm
a_t6
3
cccm
a_t4
7
% c
hang
e in
mea
n an
nual
run
off ..
.High global warming
Medium global warming
Low global warming
Figure WC-31. Percentage change in mean annual modelled runoff under the 45 Scenario C simulations (15 global climate models and three global warming scenarios) relative to Scenario A
Table WC-8. Summary results under the 45 Scenario C simulations for the modelling subcatchments in the Western Cape region (numbers show percentage change in mean annual rainfall and modelled runoff under Scenario C relative to Scenario A)
High global warming Medium global warming Low global warming GCM Rainfall Runoff GCM Rainfall Runoff GCM Rainfall Runoff mri -7% -21% mri -6% -16% mri -4% -11% csiro -10% -19% csiro -8% -15% csiro -6% -11% giss_aom -5% -15% giss_aom -4% -11% giss_aom -3% -8% miroc -3% -12% miroc -2% -9% miroc -2% -7% mpi 0% -4% mpi 0% -3% mpi 0% -2% gfdl -4% -2% gfdl -3% -2% gfdl -2% -1% inmcm 1% -1% inmcm 1% -1% inmcm 0% -1% ipsl 1% 1% ipsl 1% 1% ipsl 1% 1% cnrm 2% 1% cnrm 1% 1% cnrm 1% 1% ncar_pcm 1% 2% ncar_pcm 1% 2% ncar_pcm 1% 1% iap 2% 4% iap 1% 3% iap 1% 2% ncar_ccsm 5% 8% ncar_ccsm 4% 6% ncar_ccsm 3% 4% miub 2% 9% miub 2% 7% miub 1% 5% cccma_t63 10% 30% cccma_t63 8% 23% cccma_t63 6% 16% cccma_t47 25% 70% cccma_t47 19% 52% cccma_t47 14% 36%

470 ▪ Water in the Western Cape region August 2009 © CSIRO 2009
WC
-3 W
ater
bal
ance
resu
lts fo
r the
Wes
tern
Cap
e re
gion
Figure WC-32. Spatial distribution of mean annual rainfall and modelled runoff across the Western Cape region under Scenario A and under Scenario C relative to Scenario A

© CSIRO 2009 August 2009 Water in the Western Cape region ▪ 471
WC
-3 W
aterbalanceresults
fortheW
estern Cape
region
WC-3.5.6 Summary results for all scenarios
Table WC-9 shows the mean annual rainfall, runoff and actual evapotranspiration under Scenario A averaged over the Western Cape region, and the percentage changes in the rainfall, runoff and actual evapotranspiration under scenarios B and C relative to Scenario A. The Cwet, Cmid and Cdry results are based on the mean annual runoff, and the rainfall changes shown in Table WC-9 are the changes in the mean annual value of the rainfall series used to obtain the runoff under scenarios Cwet, Cmid and Cdry. The changes in mean annual rainfall do not necessarily translate directly to the changes in mean annual runoff because of changes in seasonal and daily rainfall distributions and the relationship between rainfall and runoff is non-linear. The latter factor usually results in small changes in rainfall to be amplified in runoff (Table WC-8).
Figure WC-33 shows the mean monthly rainfall and runoff under scenarios A and C averaged over 1930 to 2007 for the region. Figure WC-34 shows the daily rainfall and flow exceedance curves under scenarios A and C averaged over the region. In Figure WC-33 scenarios Cwet, Cmid and Cdry are selected on a month-by-month basis, while in Figure WC-34 scenarios Cwet, Cmid and Cdry are selected for every day of the daily flow exceedance curve.
Table WC-9. Water balance over the entire Western Cape region under Scenario A and under scenarios B and C relative to Scenario A
Scenario Rainfall Runoff Evapotranspiration mm A 1407 479 928 percent change from Scenario A B 9 27 0 Cwet 10 30 0 Cmid 1 1 1 Cdry -10 -19 -5
(a) (b)
0
110
220
330
440
J F M A M J J A S O N D
Mon
thly
rai
nfal
l (m
m)
... C range
Cmid
A
0
60
120
180
240
J F M A M J J A S O N D
Mon
thly
run
off (
mm
) ... C range
Cmid
A
Figure WC-33. Mean monthly (a) rainfall and (b) modelled runoff in the Western Cape region under scenarios A and C (C range is based on the consideration of each month separately – the lower and upper limits in C range are therefore not the same as scenarios
Cdry and Cwet)

472 ▪ Water in the Western Cape region August 2009 © CSIRO 2009
WC
-3 W
ater
bal
ance
resu
lts fo
r the
Wes
tern
Cap
e re
gion
(a) (b)
0
20
40
60
80
0% 25% 50% 75%Percent of time equalled or exceeded
Dai
ly r
ainf
all (
mm
) ..
. C rangeCmidBA
0
5
10
15
20
0% 25% 50% 75%Percent of time equalled or exceeded
Dai
ly r
unof
fl (m
m) ... C range
CmidBA
Figure WC-34. Daily flow exceedance curves for (a) rainfall and (b) modelled runoff in the Western Cape region under scenarios A, B and C (C range is based on the consideration of each rainfall and runoff percentile separately – the lower and upper limits in C range
are therefore not the same as scenarios Cdry and Cwet)
WC-3.5.7 Confidence levels
The rainfall-runoff model verification analysis with data from 123 catchments from across all of northern Australia indicates that the mean annual runoff for ungauged catchments are under estimated or over estimated, when using optimised parameter values from a nearby catchment, by less than 20 percent in 40 percent of catchments and by less than 50 percent in 80 percent of the catchments.
The runoff estimates for the Western Cape region are reasonable considering the remoteness of the area. The lowest levels of confidence in the runoff predictions are in the southern coastal parts of the region due to the long distances between donor calibration catchments and target ungauged subcatchments. Diagrams illustrating which calibration catchments donated rainfall-runoff model parameter sets to which ungauged subcatchments are shown in Petheram et al. (2009).
Figure WC-35 illustrate the level of confidence in the modelling of the mid to high runoff events (i.e. peak flows) and dry season runoff (respectively) for the subcatchments of the Western Cape region. It should be noted that these maps of level of confidence are not statistical confidence levels and are intended to only convey a broad reliability of prediction. Note the level of confidence in streamflow predictions will vary slightly from the level of confidence in runoff predictions shown below and as discussed in Section 2.2.6 of the division-level chapter.
There is a high degree of confidence that dry season runoff in the Western Cape region is low because it is known that rainfall and baseflow are low during the dry season. The map of level of confidence for dry season flow shown in Figure WC-35 provides a relative indication of how well dry season metrics, such as mean annual dry season flow and cease-to-flow criteria, are simulated.
Although there is uncertainty associated with annual runoff volumes for individual ungauged catchments in the Western Cape region, they are not all biased to one direction. The non-systematic errors therefore tend to cancel one another to some extent, and across the entire Western Cape region the long-term average monthly and annual results are reasonable. As shown in Figure WC-35, in many areas of the Western Cape region localised studies will require more detailed analysis than undertaken and reported here and would most likely require the site to be visited and additional field measurements made.

© CSIRO 2009 August 2009 Water in the Western Cape region ▪ 473
WC
-3 W
aterbalanceresults
fortheW
estern Cape
region
(a) (b)
Figure WC-35. Level of confidence of the modelling of runoff for (a) mid- to high flow events and (b) monthly dry season flow events for the modelling subcatchments of the Western Cape region. 1 is the highest level of confidence and 5 is the lowest

474 ▪ Water in the Western Cape region August 2009 © CSIRO 2009
WC
-3 W
ater
bal
ance
resu
lts fo
r the
Wes
tern
Cap
e re
gion
WC-3.6 River system water balance
The Western Cape region is comprised of eight AWRC river basins and has an area of 66,766 km2. Under the historical climate the mean annual runoff across the region is 479 mm (Section WC-3.5.3), which equates to a mean annual streamflow across the region of 31,981 GL.
Across the region there is very little water use and future development is likely to be related to mine development, some ecotourism and indigenous enterprises. Hence, little information on infrastructure, water demand, water management, sharing rules or future development is currently available, and consequently there is no river modelling section to the Western Cape region report. Streamflow time series have been generated for each streamflow reporting node (SRN) based on the upstream grid cell rainfall-runoff simulations, as described in Section 2.2.5 of the division-level Chapter 2. The locations of these nodes are shown in Figure WC-36. Summary streamflow statistics for each SRN are reported in Petheram et al. (2009). In addition to the streamflow time series generated by the rainfall-runoff model ensemble, a range of hydrological metrics computed using regression analysis are also available for each SRN (as described in Section 2.2.7 of the division-level Chapter 2). The complete set of results for the multiple regression analysis is reported in SKM (2009). The merit of each approach is discussed in Section 2.2.7 of the division-level Chapter 2.
Figure WC-36. Location of streamflow reporting nodes (gauging stations, environmental sites, dummy nodes and storage inflows) in the Western Cape region. (Note no storage inflows are reported for this region)

© CSIRO 2009 August 2009 Water in the Western Cape region ▪ 475
WC
-3 W
aterbalanceresults
fortheW
estern Cape
region
WC-3.7 Changes to flow regime at environmental assets
Section 1.3 of the division-level Chapter 1 describes how environmental assets were shortlisted for assessment by this project. Four environmental assets have been shortlisted in the Western Cape region: Archer River Aggregation, Jardine River Wetlands Aggregation, Northern Holroyd Plain Aggregation, and Port Musgrave Aggregation. The locations of these assets are shown in Figure WC-1 and the assets are characterised in Chapter WC-2.
This section presents the assessment of these shortlisted assets and reports metrics for those assets which have sufficient confidence in the modelled streamflow to enable analysis. Confidence in results for low flows and high flows was calculated separately on a scale of 1 to 5, with 1 indicating results with the highest confidence (as described in Section 2.2.6 of the division-level Chapter 2). Hydrological regime metrics (as defined in Section 2.5 of the division-level Chapter 2) for either low flows or high flows are reported only where confidence levels are 1, 2 or 3. If confidence levels in the low flows or high flows are ranked 4 or 5, results are not reported and are labelled NR (not reported).
Some of the assets in this region have multiple nodes at which streamflow modelling results are available. When reporting hydrological regime metrics for such assets a single node was selected. The selected node was that with the highest streamflow confidence level and the largest proportion of streamflow to the asset. Results for all nodes are presented in McJannet et al. (2009).
In the absence of site-specific metrics for the Western Cape region a set of standard metrics related to high and low flows have been utilised. However the conversion of these metrics into environmental impacts still requires development of quantitative relationships between flow and ecology.

476 ▪ Water in the Western Cape region August 2009 © CSIRO 2009
WC
-3 W
ater
bal
ance
resu
lts fo
r the
Wes
tern
Cap
e re
gion
WC-3.7.1 Standard metrics
Table WC-10. Standard metrics for changes to surface water flow regime at environmental assets in the Western Cape region under scenarios A, B, C and D
Standard metrics Units A B Cwet Cmid Cdry Dwet Dmid Ddry change from Scenario A
Archer River Aggregation - Node 2 (confidence level: low flow = 3, high flow = 2) Annual flow (mean) GL 1550 +18% +33% +1% -21% nm nm nmWet season flow (mean)* GL 1470 +16% +34% +1% -22% nm nm nmDry season flow (mean)** GL 76.2 +43% +17% -3% -19% nm nm nmLow flow threshold (discharge exceeded 90% of the time under Scenario A) GL/d 0.0006
Number of days below low flow threshold (mean) d/y 36.5 -3.3 -4.9 +0.6 +17 nm nm nmNumber of days of zero flow (mean) d/y 11.2 -0.8 -1.9 +0.5 +8.5 nm nm nmHigh flow threshold (discharge exceeded 5% of the time under Scenario A) GL/d 22.5
Number of days above high flow threshold (mean) d/y 18.3 +3.6 +6.9 +0.1 -5.6 nm nm nmJardine River Wetlands Aggregation - Node 2 (confidence level: low flow = 3, high flow = 4) Annual flow (mean) GL NR NR NR NR NR nm nm nmWet season flow (mean)* GL NR NR NR NR NR nm nm nmDry season flow (mean)** GL 193 +31% +22% +0% -14% nm nm nmLow flow threshold (discharge exceeded 90% of the time under Scenario A) GL/d 0.291
Number of days below low flow threshold (mean) d/y 36.5 -26.3 -14.7 -0.8 +16.1 nm nm nmNumber of days of zero flow (mean) d/y 1.55 -0.1 0 0 0 nm nm nmHigh flow threshold (discharge exceeded 5% of the time under Scenario A) GL/d NR
Number of days above high flow threshold (mean) d/y NR NR NR NR NR nm nm nmNorthern Holroyd Plain Aggregation - Node 3 (confidence level: low flow = 2, high flow = 2) Annual flow (mean) GL 1230 +20% +52% +2% -23% nm nm nmWet season flow (mean)* GL 1190 +16% +53% +3% -23% nm nm nmDry season flow (mean)** GL 42.7 +115
% +38% -6% -25% nm nm nm
Low flow threshold (discharge exceeded 90% of the time under Scenario A) GL/d 0
Number of days below low flow threshold (mean) d/y 88.2 -14 -12.5 -2.1 +11.1 nm nm nmNumber of days of zero flow (mean) d/y 88.2 -14 -12.5 -2.1 +11.1 nm nm nmHigh flow threshold (discharge exceeded 5% of the time under Scenario A) GL/d 20.7
Number of days above high flow threshold (mean) d/y 18.3 +3.7 +15 +0.5 -6.8 nm nm nmPort Musgrave Aggregation - Node 6 (confidence level: low flow = 3, high flow = 3) Annual flow (mean) GL 3330 +17% +34% +1% -22% nm nm nmWet season flow (mean)* GL 3140 +16% +35% +1% -22% nm nm nmDry season flow (mean)** GL 190 +36% +21% -2% -16% nm nm nmLow flow threshold (discharge exceeded 90% of the time under Scenario A) GL/d 0.0727
Number of days below low flow threshold (mean) d/y 36.5 -12.6 -11.9 -0.1 +15.3 nm nm nmNumber of days of zero flow (mean) d/y 1.88 -1.4 0 0 0 nm nm nmHigh flow threshold (discharge exceeded 5% of the time under Scenario A) GL/d 52.3
Number of days above high flow threshold (mean) d/y 18.3 +3.3 +11.9 +0.6 -6.7 nm nm nm* Wet season covers the six months from November to April; ** Dry season covers the six months from May to October NR – metrics not reported because streamflow confidence level is ranked 4 or 5 nm – not modelled

© CSIRO 2009 August 2009 Water in the Western Cape region ▪ 477
WC
-3 W
aterbalanceresults
fortheW
estern Cape
region
Archer River Aggregation
The surface water flow confidence level for the selected reporting node for the Archer River Aggregation (see location on Figure WC-8) is considered fairly reliable (2) for wet season flows and moderately reliable (3) for dry season flows (Table WC-10). Under Scenario A annual flow into this asset is dominated by wet season flows (95 percent) which have been 16 percent higher under Scenario B. Dry season flows have also been (43 percent) higher under Scenario B when compared to Scenario A. Annual and seasonal flows do not change much under Scenario Cmid compared to Scenario A, but there are large increases under Scenario Cwet (17 to 34 percent) and more moderate decreases under Scenario Cdry (19 to 22 percent). There are no development scenarios for the area upstream of this asset.
Compared to Scenario A, the number of days when flow is less than the low flow threshold does not change very much under Scenario Cmid, but there is a large increase in low flow days under Scenario Cdry and a moderate decrease in low flow days under Scenario Cwet (Table WC-10). Zero flow days only occur 3 percent of the year on average under Scenario A, with little change in any of the scenarios except Scenario Cdry where the number of days without flow almost doubles. Under Scenario B high flows have been more frequent than under Scenario A. Compared to Scenario A there is little change in high flow threshold exceedance under Scenario Cmid. Under Scenario Cwet high flow exceedance increases considerably from Scenario A; conversely, there is a more moderate decrease in high flow days under Scenario Cdry.
Jardine River Wetlands Aggregation
The surface water flow confidence level for the selected reporting node for the Jardine River Wetlands Aggregation (see location on Figure WC-9) is considered unreliable (4) for wet season flows and moderately reliable (3) for dry season flows (Table WC-10). Because of the low confidence in wet season flows, metrics relating to such flows will not be reported. Compared to Scenario A, dry season flows have been 31 percent higher under Scenario B. Dry season flows do not change much under Scenario Cmid compared to Scenario A, but there is a moderate increase under Scenario Cwet (22 percent) and a moderate decrease under Scenario Cdry (14 percent). There are no development scenarios for the area upstream of this asset.
Compared to Scenario A, the number of days when flow is less than the low flow threshold does not change very much under Scenario Cmid , but there is a large increase in low flow days under Scenario Cdry and also a large decrease in low flow days under Scenario Cwet (Table WC-10). Under Scenario B low flows have been much more frequent than under Scenario A. Zero flow days are rare at this point in this river under Scenario A (less than 2 days per year on average) and this does not change under any of the scenarios. There are no high flow metrics reported for this asset.
Northern Holroyd Plain Aggregation
The surface water flow confidence level for the selected reporting node for the Northern Holroyd Plain Aggregation (see location on Figure WC-10) is considered fairly reliable (2) for both wet and dry season flows (Table WC-10). Under Scenario A annual flow into this asset is highly dominated by wet season flows (97 percent) which have been 16 percent higher under Scenario B. Dry season flows have also been a lot higher (115 percent) under Scenario B when compared to Scenario A. Annual and seasonal flows do not change much under Scenario Cmid compared to Scenario A, but there are large increases under Scenario Cwet (38 to 53 percent) and more moderate decreases under Scenario Cdry (23 to 25 percent). There are no development scenarios for the area upstream of this asset.
Under Scenario A the low flow threshold for this asset is zero with flow ceasing for 24 percent of the year on average (Table WC-10). The number of days when flow stops does not change very much under Scenario Cmid compared to Scenario A, but there is a moderate increase in low flow days under Scenario Cdry and a moderate decrease in low flow days under Scenario Cwet. Under Scenario B high flows have been more frequent than under Scenario A. There is little change in high flow threshold exceedance under Scenario Cmid. Under Scenario Cwet high flow exceedance increases very markedly from Scenario A; conversely, there is a large decrease in high flow days under Scenario Cdry.

478 ▪ Water in the Western Cape region August 2009 © CSIRO 2009
WC
-3 W
ater
bal
ance
resu
lts fo
r the
Wes
tern
Cap
e re
gion
Port Musgrave Aggregation
The surface water flow confidence level for the selected reporting node for the Port Musgrave Aggregation (see location on Figure WC-11) is considered moderately reliable (3) for both wet and dry season flows (Table WC-10). Under Scenario A annual flow into this asset is highly dominated by wet season flows (94 percent) which have been 16 percent higher in Scenario B. Dry season flows have also been (36 percent) higher in Scenario B than under Scenario A. Annual and seasonal flows do not change much under Scenario Cmid when compared to Scenario A, but there are fairly large increases under Scenario Cwet (21 to 35 percent) and moderate decreases under Scenario Cdry (16 to 22 percent). There are no development scenarios for the area upstream of this asset.
Compared to Scenario A, the number of days when flow is less than the low flow threshold does not change under Scenario Cmid , but there is a large increase in low flow days under Scenario Cdry and a large decrease in low flow days under Scenario Cwet (Table WC-10). Zero flow days are rare at this point in this river and this does not change under any of the scenarios. Under Scenario B high flows have been more frequent than in Scenario A. There is little change in high flow threshold exceedance under Scenario Cmid when compared to Scenario A. Under Scenario Cwet high flow exceedance increases greatly from Scenario A; conversely, there is also a large decrease in high flow days under Scenario Cdry.
© CSIRO 2009 August 2009 Water in the Western Cape region ▪ 479
WC
-3 W
aterbalanceresults
fortheW
estern Cape
region
WC-3.8 References
Crosbie RS, McCallum JL, Walker GR and Chiew FHS (2008) Diffuse groundwater recharge modelling across the Murray-Darling basin. A report to the Australian Government from the CSIRO Murray-Darling Basin Sustainable Yields Project. CSIRO, Australia. 108pp.
Crosbie RS, McCallum JL and Harrington GA (2009) Diffuse groundwater recharge modelling across Northern Australia. A report to the Australian Government from the CSIRO Northern Australian Sustainable Yields Project. CSIRO Water for a Healthy Country Flagship, CSIRO, Australia. In prep.
DNRM (2005) Hydrogeological framework report for the Great Artesian Basin resource plan area. Department of Natural Resources and Mining
Petheram C, Rustomji P and Vleeshouwer J (2009) Rainfall-runoff modelling across northern Australia. A report to the Australian Government from the CSIRO Northern Australian Sustainable Yields Project. CSIRO Water for a Healthy Country Flagship, CSIRO, Australia. In prep.
McJannet DL, Wallace JW, Henderson A and McMahon J (2009) High and low flow regime changes at environmental assets across northern Australia under future climate and development scenarios. A report to the Australian Government from the CSIRO Northern Australian Sustainable Yields Project. CSIRO Water for a Healthy Country Flagship, CSIRO, Australia. In prep.
SKM (2009) Regionalisation of hydrologic indices. Northern Australia sustainable yields. A report prepared by Sinclair Knight Merz for the CSIRO Northern Australia Sustainable Yields project.
Zhang L and Dawes W (1998) WAVES - An integrated energy and water balance model. Technical Report No. 31/98, CSIRO Land and Water.

Web: www.csiro.au/flagships
For further information:
Water for a Healthy Country Flagship Project LeaderDr Richard CresswellPhone: 07 3214 2767Email: [email protected]: www.csiro.au/partnerships/NASY
Northern Australia Water Futures Assessment Department of the Environment, Water, Heritage and the Arts Phone: 02 6274 1111 Email: [email protected] Web: http://www.environment.gov.au/nawfa
About the project
The Northern Australia Sustainable Yields (NASY) Project has assessed the water resources of northern Australia. The project modelled and quantified, within the limits of available data, the changes to water resources under four scenarios: historical climate; recent climate; future climate considering current water use and future climate with potential future water demand. The project identified regions that may come under increased, or decreased, stress due to climate change and increased water use.
The assessments made in this project provide key information for further investigations carried out through the Australian Government’s Northern Australia Water Futures Assessment. This initiative aims to develop a knowledge base so that any development proceeds in an ecologically, culturally and economically sustainable way.
The NASY project was commissioned by the National Water Commission in consultation with the Australian Government Department of the Environment, Water, Heritage and the Arts. This followed a March 2008 agreement by the Council of Australian Governments to undertake comprehensive scientific assessments of water yield in all major water systems across the country and provide a consistent analytical framework for water policy decisions across the nation. CSIRO is also undertaking assessments in south-west Western Australia and Tasmania.
The NASY project was reviewed by a Steering Committee and a Technical Reference Panel. Both include representation from federal and state governments, as well as independent experts.