Water in Metro Cebu: The Case for Policy and Institutional ... · PDF fileWater in Metro Cebu:...
24
p_ Journal of Philippine Development p_ -q Number46, VolumeXXV,No.2, SecondSemester1998 S Water in Metro Cebu: The Case for Policy and Institutional Reforms* Cristina C. David, Arlene B. Inocencio, Francisco M. Largo, and Ed L. WaIag'* INTRODUCTION Metro Cebu is the second largest urban center in the country, with a population of more than 1.3 million people and covering 3 cities and 5 municipalities within 544 sq. km. of land area._ It comprises almost half of the entire population of Cebu province, but only 14 percent of its land area. About half of Metro Cebu's population and land area are in Cebu City which has historically been the commercial and service center of the Visayas and Northern Mindanao regions, as well as the home base of the country's major shipping companies. Outside Metro Manila, Metro Cebu has the highest concentration of major hospital, educational, and medical trai_ing services. Over the past decade, Metro Cebu has been drawing substantial industrial investments, attracted by the rapid infrastructure (air, port, and land transport facilities) development, the presence of trainable manpower, strong trade and services network, and adequate living amenities. Metro Cebu currently accounts for 70 percent of Central Visayas' industrial output; the Mactan Export Processing Zone alone with its 101 firms and over 38,000 employees, contributes over 60 percent of the region's total exports. Tourism has also become a major source of growth of its economy, as Metro Cebu has become the top destination of foreign tourists. Aside from its historical significance and natural attractions, peace and order condition is relatively good, infrastructure is well-developed, and modern shipping facilities provide access to other tourist destinations in nearby island.s. *Paper presented at the workshop on "Urban Water Issues in Metro Cebu," Plenary Flail, Ramon Aboitiz Foundation, Inc., Cebu City, June 17, 1998. **ResearchFellows, Senior Instructor, Project Manager, Philippine Institute for Development Studies University of San Carlos, and Water Resources Center respectively. 19 Included are Cebu City, Mandaue City, Lapu-Lapu City, Cordova, Talisay, Consolacion, Liloan, and Compostela.
Transcript of Water in Metro Cebu: The Case for Policy and Institutional ... · PDF fileWater in Metro Cebu:...

p_ Journal of Philippine Development p_-q Number46, VolumeXXV,No.2, SecondSemester1998 S
Water in Metro Cebu: The Case for Policyand Institutional Reforms*
Cristina C. David, Arlene B. Inocencio, Francisco M. Largo,
and Ed L. WaIag'*
INTRODUCTION
Metro Cebu is the second largest urban center in the country, with
a population of more than 1.3 million people and covering 3 cities and
5 municipalities within 544 sq. km. of land area._ It comprises almost half
of the entire population of Cebu province, but only 14 percent of its land
area. About half of Metro Cebu's population and land area are in CebuCity which has historically been the commercial and service center of the
Visayas and Northern Mindanao regions, as well as the home base of the
country's major shipping companies. Outside Metro Manila, Metro Cebu
has the highest concentration of major hospital, educational, and medical
trai_ing services.
Over the past decade, Metro Cebu has been drawing substantial
industrial investments, attracted by the rapid infrastructure (air, port, and
land transport facilities) development, the presence of trainable manpower,
strong trade and services network, and adequate living amenities. Metro
Cebu currently accounts for 70 percent of Central Visayas' industrial
output; the Mactan Export Processing Zone alone with its 101 firms and
over 38,000 employees, contributes over 60 percent of the region's totalexports.
Tourism has also become a major source of growth of its economy,
as Metro Cebu has become the top destination of foreign tourists. Aside
from its historical significance and natural attractions, peace and order
condition is relatively good, infrastructure is well-developed, and modern
shipping facilities provide access to other tourist destinations in nearbyisland.s.
*Paper presented at the workshop on "Urban Water Issues in Metro Cebu," Plenary Flail,Ramon Aboitiz Foundation, Inc., Cebu City, June 17, 1998.
**ResearchFellows, Senior Instructor, Project Manager, Philippine Institute for DevelopmentStudies University of San Carlos, and Water Resources Center respectively.19
Included are Cebu City, Mandaue City, Lapu-Lapu City, Cordova, Talisay, Consolacion,Liloan, and Compostela.

231) JOURNAL OF PHILIPPINE DEVELOPMENT
In contrast to the overall progressive economic development of
Metro Cebu, the state of its water resource management and quality of
its water utility service is a serious concern of the various sectors of the
economy; 2 the watersheds surrounding Metro Cebu have long been
considered in a critical state; access to piped water connection is limited;
groundwater pumping is virtually unregulated, despite reported depletion
of groundwater reserves and saline intrusion of coastal aquifers. The lack
of sewerage collection and treatment efforts, as well as weak regulation
of industrial effluents and nonpoint sources of water pollution has adversely
affected people's health and quality of rivers, streams and other waterbodies.
The purpose of this paper is to analyze the policy and institutional
factors that may be constraining the efficient, equitable, and sustainable
management of water resource in Metro Cebu. Because of certain unique
characteristics of water (and related factors such as watersheds), purely
market mechanisms will fail to achieve an economically efficient, socially
equitable, and environmentally sustainable development, distribution, and
use of water resources. First, both surface and groundwater have public
good characteristics. Excluding nonpayers from its consumption is difficult
and costly. Even though overuse of ground or surface water may already
be raising cost of water withdrawal, the resulting cost increase is often
viewed as marginal, especially by large users. Hence, market prices may
not adequately reflect the diminishing availability of quality water.
Second, environmental effects or externalities arising from the
production and consumption of water impose costs to society. At the
production stage, the construction of dams to harness surface water run-
off may damage the ecosystem, dislocate affected population, and threaten
endangered species. Overpumping of groundwater resources will lead to
salt water intrusion, cause land subsidence, and raise cost of abstraction
for future users. At the consumption stage, negative externalities may
arise from untreated domestic sewer and industrial wastewater or effluents
21ndeed, a multi-stakeholder coalition called the Cebu Uniting for Sustainable Water(CUSW)was formed to lobby for improvements in water resource management policy. Thus far,this is the only such organized effort in the country, reflecting the serious nature of the problemin Metro Cebu.

DAVID ET AL.: WATER IN METRO CEBU 231
accompanying water use through the impact of water pollution on public
health and quality of water-bodies.
Finally, production and distribution of surface and groundwater are
typically characterized by strong economies of scale. Often, the operation
of a centralized water distribution system may be characterized as natural
monopolies that would need to be regulated to achieve efficiency and
prevent the extraction of monopoly rents.
The government, therefore, has a critical role in establishing an
incentive, regulatory, and institutional framework that will facilitate the
achievement of water resource management objectives. Failure to achieve
these objectives may often be attributed to the a) lack of an integrated,
holistic approach in addressing the inherently interrelated issues of water
supply planning, and operation, demand management, pollution control,
watershed and groundwater protection; b) over-reliance on "command and
control" or administrative/legal mechanisms in allocating scarce water
resources and controlling water pollution which have proven to be
inadequate; c) dominance and direct involvement of the public sector in
water supply operation although government operations are typically
characterized by faulty incentive structure and lack of effective competition;
and finally d) a water pricing policy that does not recognize water as a
scarce (and not a free) resource nor account for the pervasive externalities
associated with production and consumption of water.
WATER SUPPLY SITUATION
Almost all freshwater used in Metro Cebu is derived from groundwater
aquifers. The government-owned Metro Cebu Water District (MCWD)
abstracts about 110,000 cum/d through its 81 wells in various parts of
the service area. a Its piped water distribution system serves only about
23 percent of total households and a smaller proportion of the industrial
and commercial and establishments for an average of 18 hours per day.
Household or domestic use accounts for about 70 percent of the volume
_Only a small amount of water (1% of total) is derived from the Buhisan Dam which haslong been heavily silted.

2,32 JOURNAL OF PHILIPPINE DEVELOPMENT
of water sold; whereas industrial, commercial and other users take up
the remaining 30 percent.
The large majority of households, industrial and commercial firms,
therefore, have to rely on private wells (self-supplied or through private
waterworks) and private water vendors. Many of those with MCWD
connections also use own wells or vended water in conjunction with its
piped water, or invest in booster pumps, cisterns and storage tanks to
cope with the rationed supply (Largo et al. 1998; Inocencio et al. 1998;
Expertelligence 1997). Vended water may be picked up from the source,
frequently a neighbor with MCWD connection or delivered through a hose,
cart, jeep or large trucks.
Except for the MCWD wells, there are no available information to
estimate the rate of groundwater pumping directly. Although industries,
commercial establishments and other large users of groundwater are
required to register with the National Water Resource Board (represented
by MCWD in Metro Cebu), only a small fraction actually do so. As of 1997,
the total number of registered private wells was only 151, and these were
dominated by residential subdivisions (126) for domestic use (Table 1).
Table 1. Estimate of Urban Water Consumption by Source
of Supply, 1995 (Thousand cum/d)
Household Others Total
MCWD 47.6 19.5 67.1
(24)* (23) (24)
Private wells and others 148,1 64.4 212.5
(76) (77) (76)
Total 195.7 83.9 279.6
[70]** [30[
* Figures in parenthesis are percentage shares of MCWDor other sources to water useby households or other users.
** Figures in brackets are percentage shares of households or other users to total wateruse,
Note: The total water use is derived based on a conservative assumption about size ofwater demand for industrial, commercial, and other users. See PIDS i estimateof water demand in Table 3.
DAVID ET AL.: WATER IN METRO CEBU 233
The number of registered private wells for industrial/commercial uses wa.
only 16, 5 for irrigation, and 4 for fisheries. A recent inventory of wells--*
by the Water Resource Center (WRC) in Mactan, which included individual
household wells, reported a total of more than 5000. Based on fragmented
data, WRC also estimated that for Metro Cebu, the total number of wells
might be within the range of 20,000-25,000 (Walag 1996).
In the absence of any systematic data, total groundwater abstraction
has been typically estimated indirectly by deriving estimates of total water
consumption for various uses. None of the available estimates, however,
includes the use of groundwater for fishery, especially for prawn farming
in Talisay and Cordova, nor for agriculture, primarily for the vegetables,
cutflower, hog, and poultry farms. Moreover, there is hardly any reliable
basis for estimating consumption of water for nonhousehold uses. In most
cases, industrial and commercial uses of water are estimated quite crudely
by multiplying water intensity ratio per sq. meter to projected total industrial
and commercial lot area.
Interestingly, various estimates of groundwater abstraction since
1990 have been within a narrow range of 235,000 to 243,000 cum/d
(CIADPS 1994; Haman 1991.; Walag 1996). Based on a more recent
population census -- with a different assumption on per capita water use
and different methods for estimating nonhousehold water use -- our 1995
estimate of urban water consumption indicates an even higher figure for
groundwater abstraction ranging from a low of about 280,000 to a high
of 390,000 cum/d (see PIDS1 and PIDS2 rows in Table 3). Whichever
estimate of groundwater abstraction is correct, however, it is clear that
the Metro Cebu's groundwater aquifer is being rapidly depleted. Estimates
of natural recharge rate, a measure of safe or sustainable groundwater
yield, vary from 130,000 to 160,000 cum/d, only about half of the estimated
rates of groundwater abstraction (CIADPS 1994; Haman 1991; Walag
1996; JICA 1998). Consequently, saltwater has long intruded the coastal
areas and pumping costs have increased as water table has fallen.
The same estimate of total water consumption by use allows us to
infer the relative importance of private wells and water vendors together
as sources of water (Table 2). Based on PIDS 1, low estimate of total water
consumption, at least 75 percent of water consumption of both households

234. JOURNAL OF PHILIPPINE DEVELOPMENT
Table 2. Distribution of Registered Private Wells in Metro Cebu,by Municipality, 1997
Number
Municipality Wells Registrants
Cebu City 26 22
Compostela 1 1
Consolacion 3 3
Cordova 0 0
Lapu-Lapu 3 3
Liloan 21 18
Mandaue 16 6
Talisay 81 75
Total 151 128
and other users seems to originate from non-MCWD sources. Although
part of vended water, particularly those sold to households, is actually
MCWD water, the 75 percent may still underestimate the true value
because the estimated nonhousehold water consumption is a minimum
one. More likely, the proportion of industrial and commercial water
consumption obtained through private wells and water vendors would be
somewhere between 75 percent and 90 percent, the upper limit.
FUTURE SOURCES OF WATER SUPPLY
As early as the mid-1970s; the limited groundwater resources relative
to water demand of a rapidly growing Metro Cebu economy and the need
to develop surface sources of water supply have been recognized based
on the studies conducted by the Kampsax-Kruger Lahmeyer International

DAVID ET AL.: WATER IN METRO CEBU 2,35
(KKLI) and by the Cebu Consultants in the early 1980s. The Balamban
River and the Mananga River were identified as potential sources of
surface water, and in the late 1970s Camp Dresser and McKee already
designed and prepared the tender documents for the construction of the
Lusaran Dam to create a catchment area for the Balamban River which
can supply 160,000 cum/d of water for Metro Cebu. However, the high
cost of the project, together with the poor economic conditions in the early
1980s, prevented its implementation.
By 1985, Cebu Consultants have recommended the development of
the Mananga River as a lower cost alternative. In Phase i, an infiltration
system is envisaged to increase the recharge rate downstream and make
use of the storage capacity of alluvial material in the Jaclupan Valley. This
project involves the construction of a diversion weir, sedimentation and
infiltration facilities, and a wellfield which can produce 33,000 cum/d of
water, about three times higher than the natural safe groundwater yield
of about 10,000 cum/d. In Phase II, an additional water supply of 100,000
cum/d will be generated by building a 90 meter high dam upstream of
the Mananga Phase I project, a tunnel connecting the reservoir and a
proposed treatment plant at Tisa, above the ground concrete reservoir, and
additional transmission and distribution pipe lines.
Up until 1997, MCWD production capacity has been increased
primarily by exploiting more groundwater resources and reducing the rate
of nonrevenue water through investments under its "Program I." Between
1986 and 1997, water production increased from about 79,000 up to
122,000 cum/d and the rate nonrevenue water declined from 52 percent
down to 38 percent. These investments included the construction of a
well-field north of Cebu at Compostela and as part of "Program II", the
implementation of Phase I of the Mananga River project. These two
projects, however, have not yet been fully operational for a number ofreasons.
Although the Compostela wellfield was completed way back in 1992,
the local government has continually refused to allow its operation. Fears
have been strongly expressed about possible adverse effects on the pumping
yields of small wells within the area. These small wells are used not only
for domestic purposes but also for irrigation of vegetable farms, the main
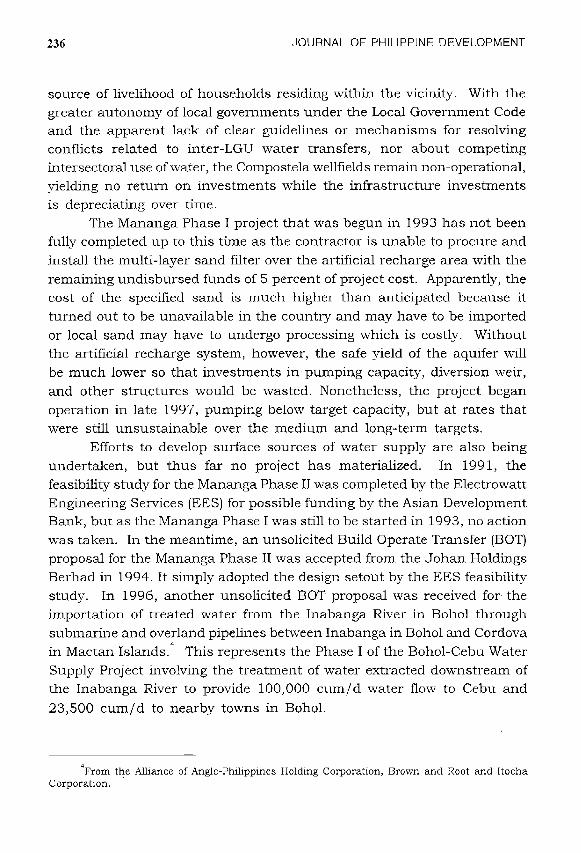
2,36 JOURNAL OF PHILIPPINEDEVELOPMENT
source of livelihood of households residing within the vicinity. With the
greater autonomy of local governments under the Local Government Code
and the apparent lack of clear guidelines or mechanisms for resolving
conflicts related to inter-LGU water transfers, nor about competing
intersectoral use of water, the Compostela wellfields remain non-operational,
yielding no return on investments while the infrastructure investments
is depreciating over time.
The Mananga Phase I project that was begun in 1.993 has not been
i\flly completed up to this time as the contractor is unable to procure and
install the multi-layer sand filter over the artificial recharge area with the
remaining undisbursed funds of 5 percent of project cost. Apparently, the
cost of the specified sand is much higher than anticipated because it
turned out to be unavailable in the country and may have to be imported
or local sand may have to undergo processing which is costly. Without
the artificial recharge system, however, the safe yield of the aquifer will
be much lower so that investments in pumping capacity, diversion weir,
and other structures would be wasted. Nonetheless, the project began
operation in late 1997, pumping below target capacity, but at rates that
were still unsustainable over the medium and long-term targets.
Efforts to develop surface sources of water supply are also being
undertaken, but thus far no project has materialized. In 1991, the
feasibility study for the Mananga Phase II was completed by the Electrowatt
Engineering Services (EES) for possible funding by the Asian Development
Bank, but as the Mananga Phase I was still to be started in 1993, no action
was taken. In the meantime, an unsolicited Build Operate Transfer (BOT)
proposal for the Mananga Phase II was accepted from the Johan Holdings
Berhad in 1994. It simply adopted the design setout by the EES feasibility
study. In 1996, another unsolicited BOT proposal was received for the
importation of treated water from the Inabanga River in Bohol through
submarine and overland pipelines between Inabanga in Bohol and Cordova
in Mactan Islands. 4 This represents the Phase I of the Bohol-Cebu Water
Supply Project involving the treatment of water extracted downstream of
the Inabanga River to provide 100,000 cum/d water flow to Cebu and
23,500 cum/d to nearby towns in Bohol.
_Fromthe Alliance of Angle-Philippines Holding Corporation, Brown and Root and ItochaCorporation.

DAVID ET AL.: WATER IN METRO CEBU 23,7
None of these proposals has been approved, however, in part because
of the apparently high price (in the order of P 20/cure at the old exchange
rate) proposed for the bulk water to be sold to MCWD.S More importantly,
these proposals required national government guarantees of purchase
which is not allowed under the unsolicited BOT category. Unlike solicited
BOT proposals which are evaluated through an open competitive bidding
procedure, unsolicited BOT proposals are more like a negotiated contract,
with a 60-day period provided for anyone to contest the proposal.
Supposedly, unsolicited BOT proposals may be accepted only for projects
embodying innovative technologies or ideas, which, strictly speaking, does
not apply to either of the two proposals.
In the case of the Bohol-Cebu Phase I proposal, concerns have been
raised about the potential political problems associated with inter-LGU
transfer as experienced in the Compostela case, as well as technical issues
related to the reliability of water supply from the Inabanga River during
the dry season in the absence of an upstream reservoir which would be
constructed only in the Phase II project.
Future surface water supply expansion projects of MCWD are
prioritized in the following order: the Mananga Phase II, the 100-meter
high dam along Balamban River in Lusaran to produce an additional
160,000 cum/d of raw water; the Inabanga River Phase I; and the inabanga
River Phase II which involves the construction of a 60-meter high dam
upstream, together with a mini-hydropower and additional water treatment
plant for an additional 260,000 cum/d raw water for Metro Cebu.
NET DEMAND - SUPPLY PROJECTIONS
In this section, alternative projections of demand and supply for
urban water up to the year 2020 are analyzed to put in perspective the
policy, institutional and regulatory reforms that will be needed to achieve
I a more efficient, socially equitable and sustainable water resourcemanagement in Metro Cebu,
5Infact, the proposed price of bulk water from the Mananga Phase II is substantially higherthan the per unit cost estimated by the Electrowatt study.

2,38 JOURNAL OF PHILIPPINE DEVELOPMENT
Table 3. Alternative Projections of Demand for Water in Metro Cebuby Type of User, 1995-2015 (Thousand cum/d)
1995 '2000 2005 2010 2015 2020
HouseholdsELWATT 179.7 215.0 251.9 289.6 - -
CIADP 184.2 230.4 286.9 356.0 - -
EXPERT 167.2 193,8 222,7 260.4 - -
JICA98 .......
PIDS1 195.7 238.4 286.2 338.7 395.0 453,9
PIDS2 195.7 238,4 286,2 338.7 395.0 453.9
Industrial and othersELWATT 43,9 66.8 97,6 135.0 - -
CIADP 32.2 40.1 45,0 50,8 - -
EXPERT 60.5 76.8 87.3 99.7 - -
JICA98 .......
PIDS1 83.9 102.2 122.7 145.2 169.3 194.5
PIDS2 195.7 238.4 286.2 338.7 395.0 453.9
TotalELWATT 223.5 281.8 349.5 424.5 - -
CIADPS 216.4 270.5 331.9 406.8 - -
EXPERT 227.7 270.7 310.0 360.1 - -
JICA98 161.9 211.5 316.2 478.4 609.3 763.3
PIDS1 279.6 340.6 408.9 483.9 564.3 648,4
PIDS2 391.4 476,8 572,4 677,4 790,0 907,8
Projection was conducted for total demand as a whole.
Source: Electrowatt Engineering Services, Ltd. 1991; Expertelligence DevelopmentCorporation 1997; JICA Cebu Integrated Area Development Plan 1994; JICA WaterMaster Plan 1998.

DAVID ET AL.: WATER IN METRO CEBU 2,39
DEMAND PROJECTIONS
Table 3 presents the various water demand projections conducted
since 1991. Our review of the methodologies used in past studies suggests
that projections of future water demand may have been underestimated,
particularly the estimates for the nonhousehold use of water. For household
demand, past studies assume base year per capita consumption for the
poor households or "blighted" population to be way below (about 40 cure/
capita) the average for the rest of the households (about 180 cure/capita)
based on the observed levels of water consumption. In the latter case,
the average per capita water consumption is based on observation from
households connected to MCWD, adjusted upwards to correct for suppressed
demand arising from water rationing. However, our study indicates that
the much lower observed water consumption of the poor compared to the
others reflects not only the effect of differences in income, but more
importantly, the 5 to 10 times higher price typically paid by the poor who
has to depend largely on vended water (Largo et al. 1998). Theoretically,
if the purpose of the demand projection is to analyze its implications on
water supply requirements, the appropriate method is to estimate the
demand relative to a common price across the households, the wide
difference in the price of water by source is expected to persist over time.
Because of limited data and empirical analysis of demand
relationships for nonhousehold use of water, available projections of
industrial, commercial and other water demand are even more problematic.
Typically, these were estimated based on assumptions on water use per
lot area and projections of industrial and commercial lot area (Expertelligence
1997; CIADP 1994). In the more recent JICA Water Resource Master Plan
Study (1998), no distinction across uses was even made; and total water
demand was projected on the basis of projected population growth and
arbitrarily high assumed per capita water consumption (355 cure/capita)which presumably includes nonhousehold use of water.
To address the weaknesses of past projection, two alternative water
demand projection (PIDS1 and PIDS2) are also reported in Table 3. The
main difference from past studies is the much higher estimate of base year
and projected water demand for nonhousehold uses. Given the limited
data available to estimate nonhousehold use of water and lack of theoretical

240 JOURNAL OF PHILIPPINE DEVELOPMENT
basis and crude nature of the estimates according to lot area, non-
household water demand was estimated by adopting the ratio of industrial/
commercial to total water consumption commonly observed internationally.
A high estimate is made by assmning a ratio of approximately 50 percent
(PIDS2), similar to the ratio in Bangkok, Kuala Lumpur, and Singapore
where the service coverage of water utility is 100 percent and to the
average ratio generally reported worldwide especially at the early stages
of economic development (Renzetti 1992; Water Utilities Data Book 1997).
A low estimate (PIDS1) is also provided, assuming the ratio of industrial/
commercial to total water consumption of 30 percent, the ratio observed
in developed countries where a relatively high water price and appropriate
sewer and effluent charges have reduced water consumption through
adoption of water saving technological processes, as well as recycling and ireuse of water. Both ratios are higher than those obtained in the other
projections, e.g., 1.2-15 percent for CIADP, 26 percent for Expertelligence ,
and 20-30 percent in the Electrowatt study.
Our projection of household demand for water is based on a higher
projected population growth rate than the Electrowatt study, but lowerthan those assumed in all the other three studies. Moreover, instead of
making separate demand projections for the poor and the rest of the
population, a relatively low rate of average per capita water consumption
was applied for the whole (150 lcpd, and increasing by 1% per year)
population.
Overall, our projected water demand is generally higher than past
projections; the low estimates (PIDS1) are about 20 percent higher, while
the high estimates (PIDS2) are as much as 60 percent more than the
earlier projections. It is interesting, however, that the 1998 JICA projections
for year 2015 and beyond are even higher that our low estimate as shownin PIDS1.
NET DEMAND - SUPPLY GAP
In Table 4, the alternative demand projections are shown together
with those of net water supply (i.e., net of assumed nonrevenue water),
the amount of water available for sale by MWCD. 6 In year 2000 column,
6The rate of nonrevenue water is assumed to decrease from 38 percent in 1995 down to
35 percent in 2000, 30 percent in 2005, and 25 percent in 2010 and beyond.

DAVID ET AL.: WATER IN METRO CEBU 2,11
Table 4. Alternative Projections of Net Demand Supply of Waterin Metro Cebu
1995 2000 2005 2010 2015 2020
Demand
ELWATT 223.5 281.8 349.5 424.5 - -
CIADPS 216.4 270,5 331.9 406.8 - -
EXPERT 227.7 270.7 310.0 360.1 - -
JICA98 161.9 211,5 316.2 478.4 6_ 763.3
PIDS1 279.6 340.6 408.9 483.9 564.3 648.4
PIDS2 391.4 476.8 572.4 677.4 790.0 907.8
Net MCWD
supply* 67.1 102.1 291.9 410.3 605.3 605.3
[179.91
Net D-S gap**ELWATT 156.4 179.7 57.6 14.2 - -
[169.6]
CIADPS 149.3 168.4 40.0 (3.5) - -[152.0]
EXPERT 160.6 168.6 18.1 (50.2) - -[130.1]
JICA98 94.8 109.4 24.3 68.1 4.0 1,58.0
PIDS1 212,4 238.5 117.0 73.6 (41.0) 43,1[229.Ol
PIDS2 324.2 374.7 280.6 267.2 184.7 302.4
[392.61
* Figures in brackets are supply and net D-S gap v4thout the Lusaran Dam project,
** Figures in parentheses are surpluses,

242, JOURNAL OF PHILIPPINE DEVELOPMENT
it is assumed that the Mananga Phase I and Corrlpostela wells will be fully
operational. The net supply figure for 2005 includes the water expected
from the Mananga Phase II and the Lusaran Dam, while the figure in
brackets excludes the potential water supply from the Lusaran Dam. In
year 2010, water from the Phase I of the Cebu-Bohol water supply project
is added and in 2015, Phase II of the project is assumed to be completed.
Although there are wide variations in the estimated net demand-
supply gaps, it is clear that groundwater mining will continue to worsen
even with the successful operation of the Compostela WelIfield, the Mananga
Phase I, and the completion of Mananga Phase II early in the next century.
in fact, the "low" PIDS1 projection indicates that only with development
of all the proposed surface water supply expansion projects can groundwater
depletion be controlled in Metro Cebu, at least up to 2025. Based on the
highest estimate of safe or sustainable groundwater extraction of 164,000
cum/day (JICA 1998), sustainable private groundwater extraction is only
about 52,000 cum/day. Indeed, if there are no efforts to conserve water
and the future demand for water is closer to the "high" PIDS2 projection,
supply-expansion strategies alone will fail to control groundwater mining.
CLOSING THE GAP
Undoubtedly, water demand management strategies must be adopted
immediately, together with efficiency improvements and surface water
supply development on the supply side. The key instrument for managing
water demand is to institute an optimal water pricing policy, i.e., the price
of water to users that reflect its full economic cost, including the direct
supply or financial cost of production and distribution, the opportunitycost of water, and the environmental or cost of externalities incurred in
water production and consumption.
Demand function estimates for households and industrial and
commercial firms do show significant price responsiveness (Largo et al.
1998; Inocencio et al. 1998). In other words, the scope for reducing the
water demand-supply gap by raising water tariffs and imposing sewerage
charge and effluent tax is substantial. The current pricing policy structure
fails to account for the scarcity or opportunity cost of groundwater as raw
water continues to be free for MCWD and self-supplied households,
industrial, commercial and other users. Neither does it consider the
environmental cost of domestic and industrial wastewater as no appropriate

DAVID ET AL.: WATER IN METRO CEBU 243
sewerage charges and effluent taxes have been levied. Such undervaluation
of water and related factors lead to a) wasteful usage of water by final
consumers and raw water by water utility firms (as evidenced by the high
rate of nonrevenue water), b) misallocation of freshwater in favor of less
valuable uses (e.g., fishery and irrigation over urban use), c) worsening
of water pollution problems, and d) failure to invest in the necessary
investments for water supply expansion in a timely manner,
Although the current water pricing policy of MCWD covers only the
financial cost of production and distribution (including the capital and
operation and maintenance costs), it should be noted that the structure
of its water tariffs is relatively high in comparison with other water
districts in the country (Table 5). For water consumption below 30 cum/
Table 5. Water Charges of Selected Water Districts (P/cum)
Water district Minimum charge Consumption bracket [¢um)(P/corm/) 11-20 21-30 31-40 41-50
(month)
Metro Cebu 90.65 I0.00 I 1.76 32.26 32,26
Metro Manila-
East Zone 19,60 2.15 2.20 2,20 3.71(7,78) (0.95) (1.00) (1,00) (2.37)
West Zone 29.40 3.33 5.36 5.36 6.70(16.69) (2.03) (3.87) (3.87) (5.09)
Dasmarifias 35.00 6.00 6.75 7.75 8.90
General Santos 50.00 5.60 6.08 7.04 8.00
Davao City 50.00 5.25 6.80 9.00 15.00
Dumaguete 54,00 5.50 6.50 7.50 8,50
O1ongapo 57.00 6.05 6.90 8.15 8_15
Laguna 58.50 5.85 6.90 8.40 9.85
Subic 72.00 8.00 9.00 10,50 10.50
Metro Iloflo 80.00 8,00 8.80 10.40 10.40
Metro Siquijor 99.00 14.70 16.30 18.40 18.40
Tagaytay 110.00 5.80 7.05 9.05 11.85
Baguio City 120.00 13.50 15.00 17.00 17.00
" For Metro Manila, these charges refer to households and include CERAI, and environ-mental fee. Figures in parenthesis refer to water tariffs alone. For other water districts,there is no price differentiation across types of users.
Source: LWUA and MWSS

244 JOURNAL OF PHILIPPINE DEVELOPMENT
month, MCWD's water tariff is higher than most major cities with the
exception of Baguio City and Metro Siquijor. At higher consumption
brackets, Metro Cebu has the highest water tariff at P32.26/cum. Indeed,
MCWD's average water tariff is also among the highest among major
ASEAN cities, next to Singapore, and about twice the average in the region
(Table 6). In fact, MCWD's water tariff is the highest at consumption
Table 6. Domestic Water Price Structure for Household in Selected Utilities
in the ASEAN Region, 1995 (US$/cum)"r
Water prices
Population Average Consumption bracket (cum.}coverage price_ 1-10 11-20 21-30 31-40 41-50 51-61
Cebu City _ .66 .33 .36 .42 1.16 1.16 1.16
Davao City .27 .08 .20 .26 .34 .46 .46
Bandung .37 .12" .20 .20 .24 .24 .32
Chiangmai .30 .15 .18 .26 .34 .34 .36
Penang .21 .09 .09 .17 .17 .17 .17
Manila _
East zone .14 .07 .08 .08 .08 .1.4 .14
West zone .25 .11 .13 .20 .20 .25 .25
Jakarta .61 .16 .16 .16 .31. .31 .35
Bangkok .31 .16 .16 .16 .22 .23 .25
Kuala Lumpur .34 .17 d ,26 .26 .26 .42 .42
Singapore .55 .39 .39 .56 .56 .82 .82
Source: ADB Water Utilities Data Book, 1997."_ Currency conversions are based on foreign exchange rates as of 1 July 1997, i.e.,
P26.384/$1.00b Refers to the composite price including a currency adjustment factor and an
environmental fee of 10 percent of base price.¢ Effective August 1996 to July 1997.
d 0.17 applies to consumption up to 15 cubic meters; 0,26 applies to consumptionfrom 15 to 40 cubic meters.
" 0,].2 refers to consumption up to 15 cubic meters; 0.20 refers to consumptionfrom 15 to 30 cubic meters.
_ In Cebu City, same rates apply to all users.Refers to average price across all users.

DAVID ET AL.: WATER IN METRO CEBU ,?,45
bracket above 30 cum/month. By contrast, with the privatization of the
MWSS, Metro Manila now has the lowest water charges among water
districts in the country as well as among ASEAN cities.
It should be noted that the scope for increasing efficiency of MCWD
and operations appear to be large and should be pursued vigorously,
considering the relatively high water tariffs, particularly for large-scale
users, and the relatively high cost of surface water supply development.
For example, the rate of nonrevenue water of MCWD is 38 percent, as
compared to a 30 percent overall average for developing countries and 10
percent for the more efficient water utility firms. The number of employees
per 1000 connections is a high 9.3 compared to 4.6 in Bangkok, and only
1.1. and 2.0 in Kuala Lumpur and Singapore, respectively. In Metro
Manila, the number of employees per 1000 connection has dropped from
over 10 to 5.5, less than a year after the MWSS privatization. The recent
problems encountered in the operations of Compostela wells and completion
of Mananga Phase I have significantly reduced returns to those investments
indicating the need to improve the legal framework for effecting inter-LGU
water transfers and upgrade institutional capacity for implementing water
supply expansion projects, in order to minimize losses in capital investments.
Clearly, an optimal water pricing policy will mean higher average
water charges, as a raw water charge will have to be imposed, together
with sewerage charge and effluent taxes. Privatization of MCWD can be
expected to lower the financial cost of operation, however, if conducted
in a transparent competitive manner and if a competent regulatory office
is put in place. And finally, improved water service will save final consumers
the additional costs incurred in coping with rationed water supply.
It should be emphasized that optimal water pricing may be expected
to improve the quality of water service and the environment, without
necessarily reducing the welfare of poor households, if this leads to greater
direct access to MCWD water. Our survey showed that with the limited
supply of MCWD water, most poor households rely on vended water that
is typically 5 to 1.0 times more expensive than the official price of MCWD
water though many are actually buying the same water from neighbors
with connections (Table 7). Furthermore, Table 8 which reports the
average cost of water by income class shows the highly regressive nature
of the actual water cost structure despite the progressive character of the
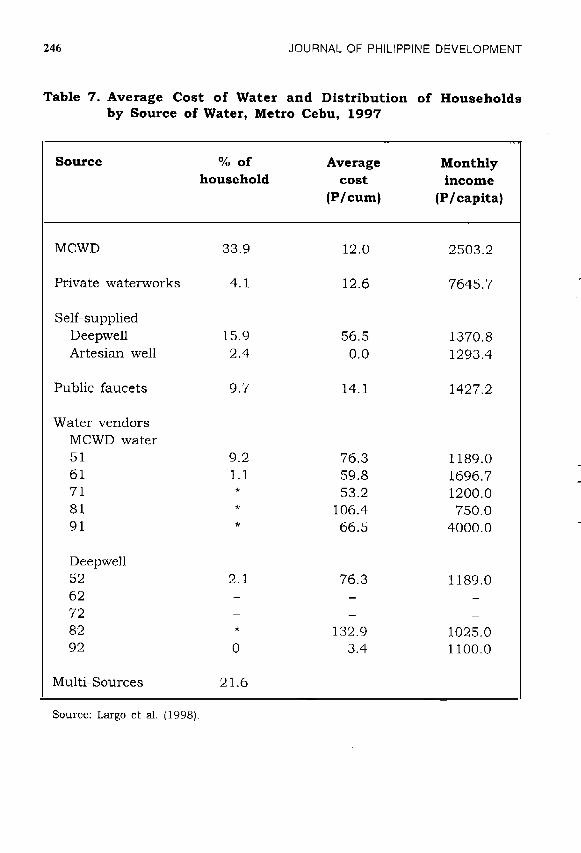
246 JOURNAL OF PHILIPPINE DEVELOPMENT
Table 7. Average Cost of Water and Distribution of Householdsby Source of Water, Metro Cebu, 1997
Source % of Average Monthlyhousehold cost income
(P/cure) (P/capita)
MCWD 33.9 12.0 2503.2
Private waterworks 4.1 12.6 7645.7
Self-supplied
Deepwell 15.9 56.5 1370.8
Artesian well 2.4 0,0 1293.4
Public faucets 9.7 14.1 1427.2
Water vendors
MCWD water
51 9.2 76.3 1189.0
61 1.1 59.8 ],696.7
71 * 53.2 1200.0
81 * 106.4 750.0
91 * 66.5 4000.0
Deepwell52 2.1 76.3 1189.062 - - -
72 - - -
82 * 132.9 1025,092 0 3.4 1100,0
Multi-Sources 21.6
Source: Largo et al. (1998).

DAVID ET AL.: WATER IN METRO CEBU 247
Table 8. Average Cost of Water by Income Class, Metro Cebu, 1997
Income class Average % ofcost water bill to
(P/cum) incomecost-inc
Under P30,O00 34.96 8.78
P30,000-39,999 30.59 4.07
P40,000-59,999 22.37 4.03
P60,000-99,999 24.68 3.22
PIO0 000-149,999 17.02 2.50
P150 000-199,999 17.50 1.84
P200 000-249,999 10.72 1.67
P250 000-499,999 10.50 0.82
P500 000-749,999 7.06 0.53
P750000-999,999 8.67 0.34
PI,O00,O00 & over 11.88 0.78
Source: Largo et al. (1998).

248 JOURNAL OF PHILIPPINE DEVELOPMENT
MCWD pricing structure. Hence, imposing raw water and domestic sewer
charges that facilitate the more efficient, equitable, and sustainable
management of urban water resources may actually lower the effective
cost of water to poor households, as they gain access to MCWD water that
would be less costly than vended water despite the additional charges.
Moreover, optimal water pricing need not threaten competitiveness
of industrial and commercial firms. There is widespread evidence in
developed countries that higher water tariffs and effluent taxes have
reduced water consumption without impairing industrial growth (Jaffe et
al. 1995). Firms responded by modifying processing and cooling methods,
and adopting water reusing and recycling practices. Potentials for water
conservation and use of water saving technologies for household use of
water are also strong.
IMPLICATIONS FOR POLICY AND INSTITUTIONAL REFORMS
To promote a more efficient, equitable, and sustainable urban water
resource management, in Metro Cebu, the following policy and institutionalreforms are called for:
1. Adoption of water (and its related components) pricing policy that
covers the full economic cost of urban water use, i.e., direct supply
or financial cost of water production and distribution; opportunity
cost of water where there are competing users; and cost of externalities
or negative environmental impacts. Specifically,
a) A raw water charge that should reflect the opportunity cost of
water and/or environmental cost of water extraction from surface
or groundwater sources must be imposed on MCWD as well as
self-supplied water users. The MCWD recently began collecting
raw water charge on groundwater used by self-supplied large
industrial firms, presumably for reforestation. We argue, however,
that this should be collected by the government and levied on
all users for as long as the additional cost of collection is less
than the additional revenue. The raw water charge should, in
principle, be ultimately high enough to reduce groundwater
abstraction down to sustainable yields and generate sufficient
revenues to finance the necessary water resource management

DAVID ET AL.: WATER IN METRO CEBU "249
activities. Further studies must be conducted to determine cost-
effective ways of collecting abstraction fees because of inherent
difficulties in enforcement.
b) Sewerage fees must be introduced among customers of MCWD,
as well as to self-supplied water users to cover the cost of its
effective regulation and the necessary collection, treatment, and
disposal sewerage disposal system.
c) Taxation of industrial effluents must be institutional as an
integral part of environmental management in Metro Cebu.
d) The progressive character of the water tariff structure should be
maintained for purposes of cross-subsidizing the poor and
encouraging water conservation. However, the wide differences
(2 to 3 times) in water tariffs between small and large users or
effectively between households and industry/commercial users
may be narrowed to further discourage groundwater pumping
by commercial and industrial firms. Of course, large water users
may still be expected to use their own wells because of economies
of scale.
2. Government revenues from raw water charges, effluent taxes and
sewerage fees should be earmarked for water resource management-
related activities. Whereas revenues from effluent taxes and sewerage
fees should finance the cost of environmental management, raw
water revenues may be used to:
a) finance part of the direct supply cost of surface water development
and replenishment of groundwater;
b) compensate poor farmers for the reallocation of irrigation water
to urban use either directly or by developing alternative sources
of irrigation water;
c) support cross-subsidies in favor of the poor, especially those
who may have to rely on higher cost sources of water supply;
d) finance part of the cost of watershed protection; and
e) strengthen the government's water resource management
capabilities by funding the following activities:
* improving the statistical database required for proper water
resource management including monitoring of stream flow

2,50 JOURNAL OF PHILIPPINE DEVELOPMENT
of relevant surface water sources, extraction and_recharge
rate of groundwater, water quality, and so forth;
* strengthening the analytical bases for more accurate water
demand projections and water supply and sewerage planning,
e.g., ex ante and ex post evaluations of potential and
completed water supply and sewerage projects; and
* conducting long-term research on water resource
management issues.
3. Introduce institutional reforms to improve efficiency in water
production and delivery; facilitate intersectoral, inter-basin and inter-
LGU water transfers; and strengthen planning, regulatory and overall
public sector water resource management capacity. For example:
* Where direct involvement of the public sector has led to
inefficiencies in water supply development and operations
of water utilities, privatization should be pursued under a
transparent and competitive bidding procedure. Clearly,
the privatization of the MCWD should be considered.
However, realization of the full potential gains from
privatization over the long term largely depends on the
ability of the regulatory office to monitor attainment of
performance targets at the same time ensuring reasonable
(not monopolistic) rates of return for the private
concessionaires. Therefore, there is an urgent need to
strengthen local capability for designing optimal contractual
arrangements and performing economic regulatory functions.
* The recent surge in unsolicited BOT proposals for the
development of water supply projects must be viewed with
extreme caution. In fact, these proposals such as that one
for Mananga Phase II for Metro Cebu should have been
solicited and chosen through the usual competitive bidding
procedure because these have been previously identified
and feasibility studies have already been undertaken. Since
unsolicited BOT proposals as well as BOT proposals solicited
with haste are typically more costly, the public sector must
be more vigilant in ensuring competition and invest more

DAVID ET AL.: WATER IN METRO CEBU 2,51
resources for water supply project planning, feasibility
studies, monitoring of implementation and ex post project
evaluations.
* With the passage of the Local Government Code and the
naturally limited supply of freshwater in Metro Cebu,
mechanisms for inter-basin or more specifically, inter-LGU
transfers of water resources will have to be developed. The
lack of legal basis and operational guidelines for effecting
such water transfers has proven to be very costly in the
case of the ongoing controversy over the operations of the
MCWD wells in Compostela.
* The complex nature of water resource management clearly
requires a more integrated and holistic approach in
addressing the inherently interrelated issues of water supply
planning and operation, demand management, pollution
control and watershed and groundwater protection. Thus,
the fragmented and relatively weak institutional structure
of the water resource management will have to be addressed
to ensure effective coordination of policies and programs.
REFERENCES
Asian Development Bank. Water Utilities Data Book and the Pacific Region,
Manila, Philippines, 1997.
Braadbaart, Okke and F. Braadbaart. "Policing the Urban Pumping Race:
Industrial Groundwater Overexploitation in Indonesia." World
Development 25, No. 2, (1997): 199-210.
Castro, Evelyn N. "When the Well Runs Dry: A Civil Initiative in Watershed
Planning and Management in the Philippines." Unpublished paper,
Eduardo Aboitiz Development Studies Center, Cebu City, 1997.

2,52 JOURNAL OF PHILIPPINE DEVELOPMENT
Electrowatt Engineering Services, Ltd. "Cebu Water Supply Project Phase
II." Volume I and Ii. TA No. 1268 PHI, Asian Development Bank,1991.
Expertelligence Development Corporation. "A Market Study for the
Metropolitan Cebu Water District (MCWD)," Volume 2, August, 1996.
Haman, Z.B. "Evaluation of the Coastal Aquifer Performance and Possibilities
for Increase in MCWD Withdrawal for the Area in between Mananga
River and Consolacion Well-Field." Paper prepared for the MCWD,
Cebu City, 1991.
Haman, Bruno Z. and M. M. Ebarvia. "Review of Brown and Root Feasibility
Study: Bohol-Cebu Water Supply Project." Unpublished paper DENR-
IEMSD, 1997.
Jaffe, Adam, B., S. R. Peterson, P.R. Portney, and R.N. Stains.
"Environmental Regulation and the Competitiveness of US
Manufacturing: What Does the Evidence Tell Us?" Journal of Economic
Literature 33 (March 1995): 132-163.
Japan International Cooperation Agency. "Cebu Integrated Area
Development Master Plan Study (CIADMPS)," 1994.
Logarta, Jose D. "Estimation of Groundwater Resource Depreciation in
Metro Cebu's Coastal Aquifer (An Exploratory Study)." Unpublished
paper, Philippine ENRAP-Phase III Project, USAID, 1995.
Local Water Utilities Administration. "History and Development of the
Metropolitan Cebu Water District (MCWD)." Unpublished paper,
PMO, LWUA-MCWD-Cebu Consultants, 1997.
Walag, Fe. "Cebu's Water Supply Situation." Unpublished paper for CUSW
Water Resource Center, 1996.