Water Governance: State Water Budgetingnwm.gov.in/sites/default/files/22.3.2018 State Water...
73
Water Governance: State Water Budgeting For Water Security, Safety & Sustainability Dr.M.Ariz Ahammed IAS Mission Director National Water Mission Ministry of Water Resources, River Development & Ganga Rejuvenation Dr.M.Ariz Ahammed IAS NWM
Transcript of Water Governance: State Water Budgetingnwm.gov.in/sites/default/files/22.3.2018 State Water...
Water Governance:
State Water BudgetingFor Water Security, Safety & Sustainability
Dr.M.Ariz Ahammed IAS
Mission Director
National Water Mission
Ministry of Water Resources, River Development & Ganga RejuvenationDr.M.Ariz Ahammed IAS NWM

NWM -Mandate
Constituted as a strategy to adapt to and to mitigate the effects of ClimateChange under -National Action Plan on Climate Change.
Some of possible implications of climate change on water resources
• Decline in the glaciers & snowfields in the Himalayas and rise of sea levels;
• Increased drought like situations due to overall decrease in the number of rainy days;
• Increased flood events due to overall increase in the rainy day intensity;
• Effect on groundwater quality in alluvial aquifers due to increased flood and drought events;
• Influence on groundwater recharge due to changes in precipitation and evapo-transpiration;and
• Increased saline intrusion of coastal & island aquifers due to rising sea levels
Dr.M.Ariz Ahammed IAS NWM

Personal Journey of ignorance: Water # Irrigation
• 2012 State Specific Action Plan on Water
• 2015 Fund flow
• 2017 June National Workshop
• 2017 October National Consultation
Dr.M.Ariz Ahammed IAS NWM

Dr.M.Ariz Ahammed IAS NWM

Water Dimensions
Dr.M.Ariz Ahammed IAS NWM
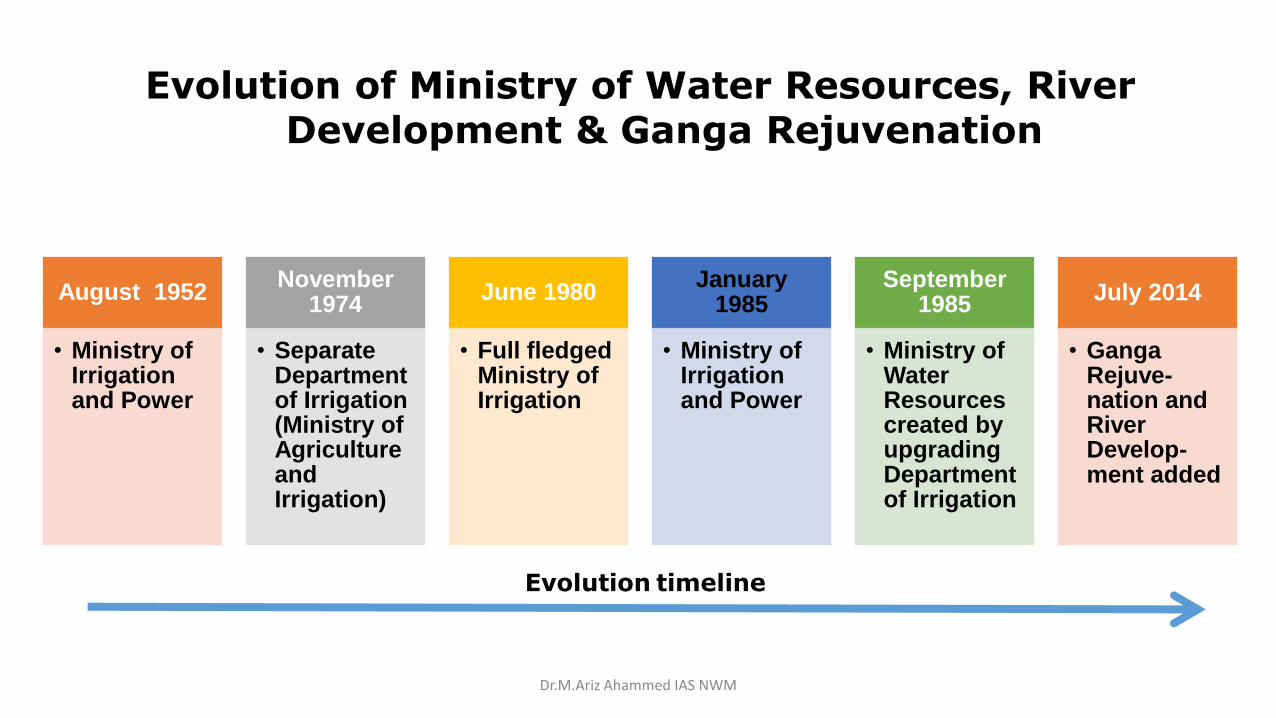
Evolution of Ministry of Water Resources, River Development & Ganga Rejuvenation
August 1952
• Ministry of Irrigation and Power
November 1974
• Separate Department of Irrigation (Ministry of Agriculture and Irrigation)
June 1980
• Full fledged Ministry of Irrigation
January 1985
• Ministry of Irrigation and Power
September 1985
• Ministry of Water Resources created by upgrading Department of Irrigation
July 2014
• Ganga Rejuve-nation and River Develop-ment added
Evolution timeline
Dr.M.Ariz Ahammed IAS NWM

Water Resources1. Source and Variability
2. Availability, Utilisable & Demand
3. Crisis - Illustrativea) Per capitab) GW exploitation- Agriculture, Industry, Withdrawalsc) Peninsular river- Shrinking / Low base flowd) Floods /Droughts /Reservoir storage/ Agrarian crisise) Quality-Chemical & Biological; Contaminationf) Investments-Results: Paradoxg) Climate Changeh) Nations’ water problem Statement
4. Water Governance1. Constitutional framework2. Challenges: Measurement & Single Agency Coordination3. Challenges: Hydrological unit and States4. Structural Limitations5. Water Financing and Economics6. State Water Budgeting7. Power of Technology8. SSAP-Water9. Reflection
Dr.M.Ariz Ahammed IAS NWM

Rainfall in cm
Annual Rainfall (Spatial & Temporal variability), Geomorphology & GW Recharge Potential
Dr.M.Ariz Ahammed IAS NWM

Dr.M.Ariz Ahammed IAS NWM
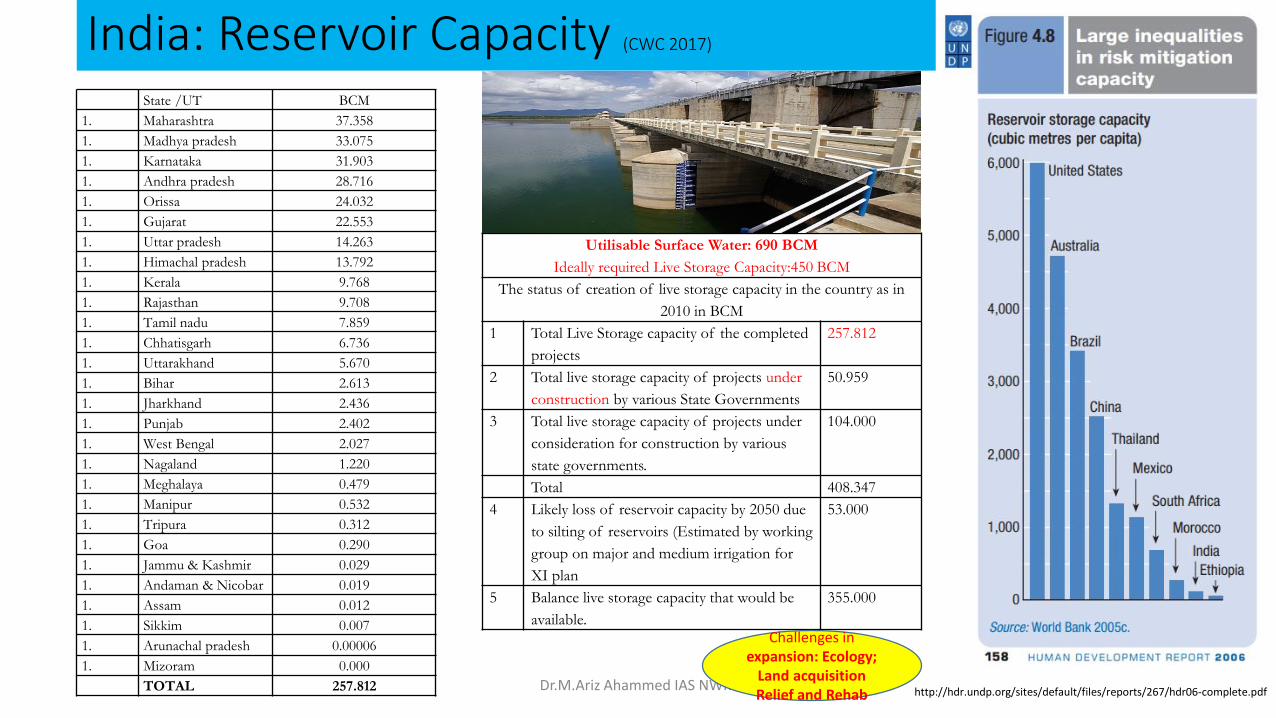
India: Reservoir Capacity (CWC 2017)
Dr.M.Ariz Ahammed IAS NWM
State /UT BCM
1. Maharashtra 37.358
1. Madhya pradesh 33.075
1. Karnataka 31.903
1. Andhra pradesh 28.716
1. Orissa 24.032
1. Gujarat 22.553
1. Uttar pradesh 14.263
1. Himachal pradesh 13.792
1. Kerala 9.768
1. Rajasthan 9.708
1. Tamil nadu 7.859
1. Chhatisgarh 6.736
1. Uttarakhand 5.670
1. Bihar 2.613
1. Jharkhand 2.436
1. Punjab 2.402
1. West Bengal 2.027
1. Nagaland 1.220
1. Meghalaya 0.479
1. Manipur 0.532
1. Tripura 0.312
1. Goa 0.290
1. Jammu & Kashmir 0.029
1. Andaman & Nicobar 0.019
1. Assam 0.012
1. Sikkim 0.007
1. Arunachal pradesh 0.00006
1. Mizoram 0.000
TOTAL 257.812
Utilisable Surface Water: 690 BCM
Ideally required Live Storage Capacity:450 BCM
The status of creation of live storage capacity in the country as in
2010 in BCM
1 Total Live Storage capacity of the completed
projects
257.812
2 Total live storage capacity of projects under
construction by various State Governments
50.959
3 Total live storage capacity of projects under
consideration for construction by various
state governments.
104.000
Total 408.347
4 Likely loss of reservoir capacity by 2050 due
to silting of reservoirs (Estimated by working
group on major and medium irrigation for
XI plan
53.000
5 Balance live storage capacity that would be
available.
355.000
Challenges in expansion: Ecology;
Land acquisitionRelief and Rehab http://hdr.undp.org/sites/default/files/reports/267/hdr06-complete.pdf

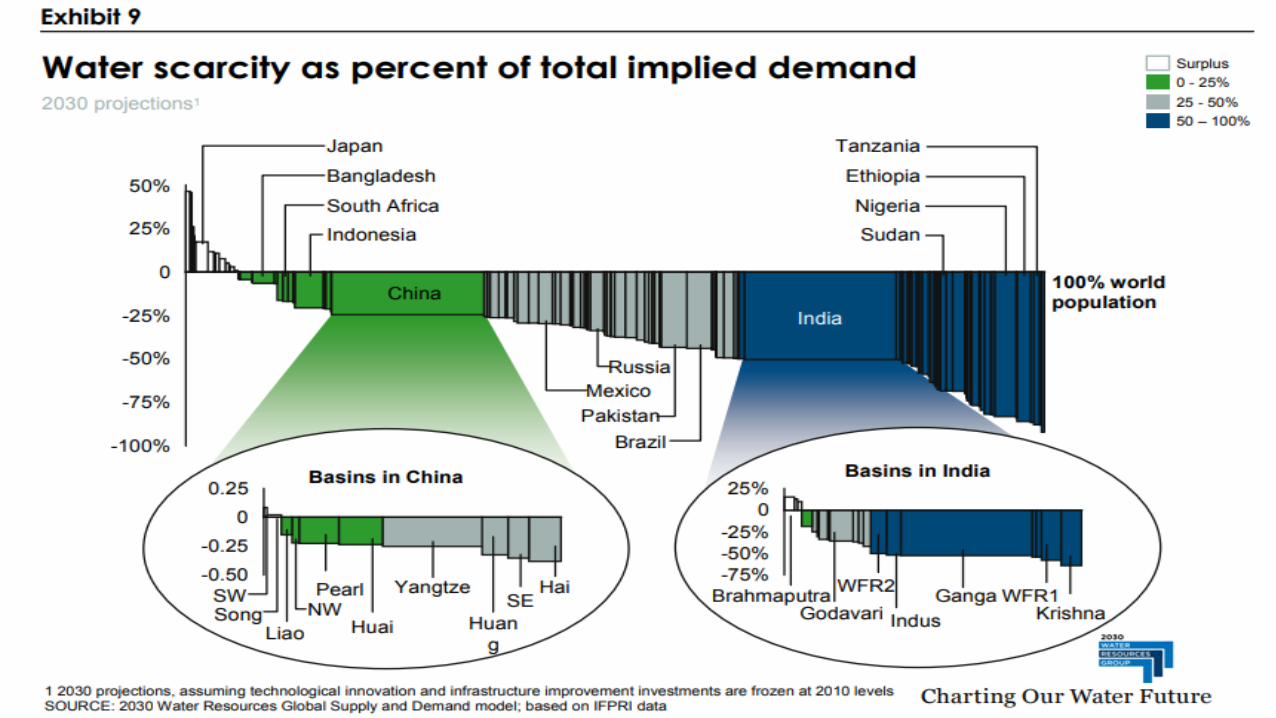
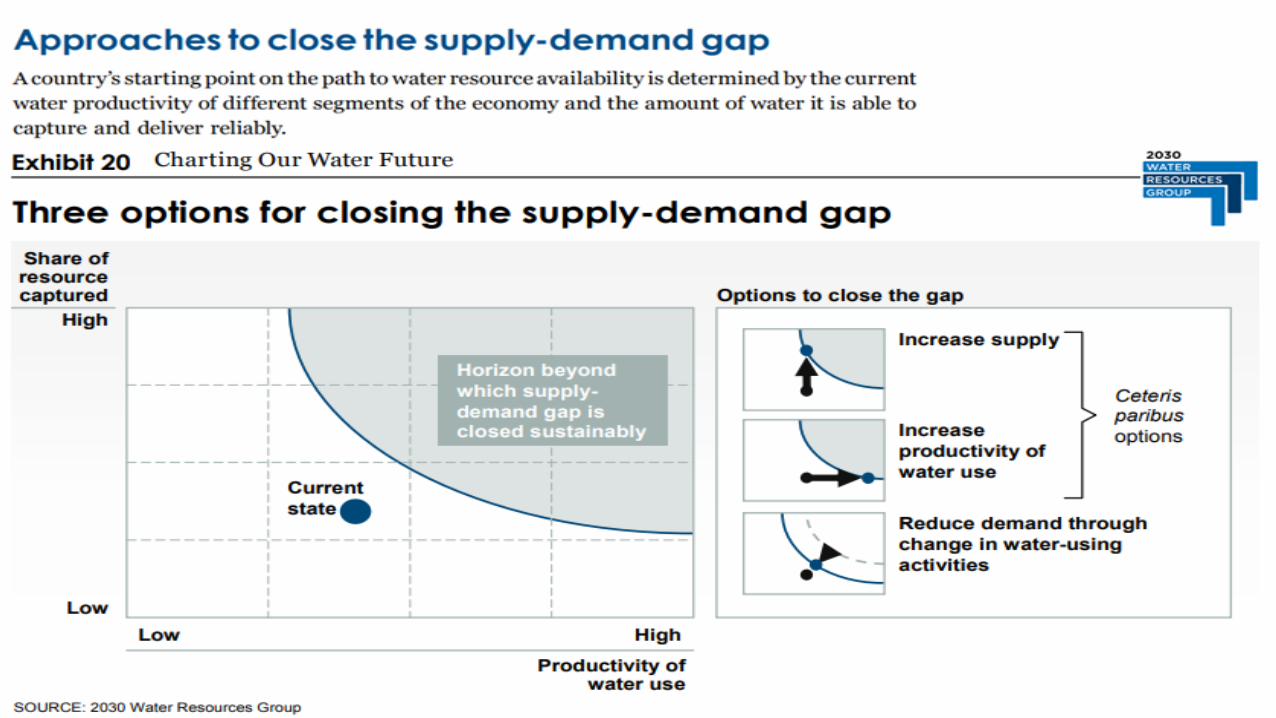
Future Water Demand Scenario
• 2030 Water Resource Group estimated that by 2030, demand in India will grow to almost 1.5 trillion m3 against current water supply of approximately 740 billion m³ with likely severe deficit unless concerted action is taken (2009)
(https://www.2030wrg.org/team/charting-our-water-future/)
• If current trends continue, in 20 years about 60% of India’s aquifers will be in a critical condition (World Bank, 2012) (http://www.worldbank.org/en/news/feature/2012/03/06/india-groundwater-critical-diminishing)
• The International Water Management Institute (IWMI) Water Scarcity Study reveals that, by 2025 one-third of the populations of India (280 million people) live in regions that will face absolute water scarcity.
Sou
rce
: Nat
ion
al C
om
mis
sio
n f
or
Inte
grat
ed
Wat
er R
eso
urc
es
Dev
elo
pm
ent
(NC
IWR
D-1
99
9)
Dr.M.Ariz Ahammed IAS NWM
Particulars Water Demand in Km3 or BCM
Year 2010 2025 2050
Water Demand from all Sectors 710 843 1180
Irrigation 557 611 807
Drinking Water 43 62 111
Industry 37 67 81
Energy 19 33 70
Others 54 70 111
Availability of Utilisable Water 1123 1123 1123
Excess/Short fall 413 280 -57
557 611807
4362
111
3767
81
1933
70
54
70
111
0
200
400
600
800
1000
1200
1400
2010 2025 2050
Others
Energy
Year
Wate
r D
em
an
d in
BC
M (
km
3)
710843
1180
Dr.M.Ariz Ahammed IAS NWM

Dr.M.Ariz Ahammed IAS NWM
PopulationTimeSpace
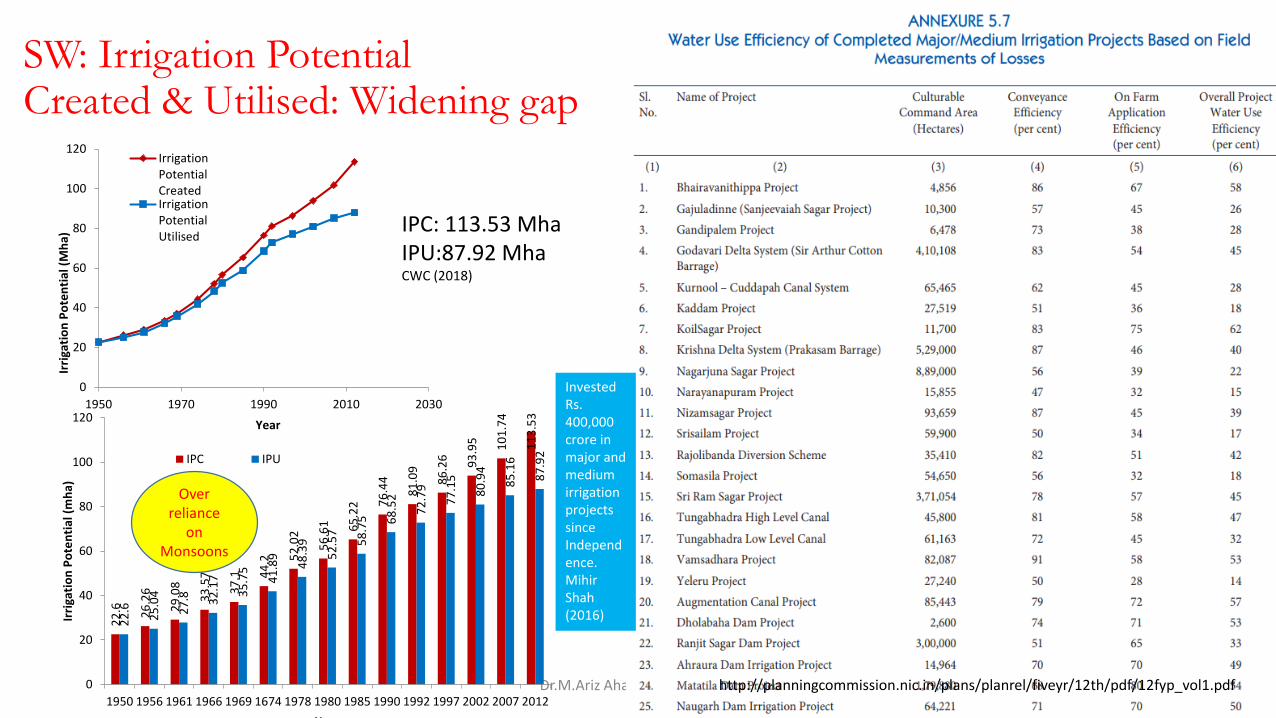
SW: Irrigation Potential Created & Utilised: Widening gap
Dr.M.Ariz Ahammed IAS NWMhttp://planningcommission.nic.in/plans/planrel/fiveyr/12th/pdf/12fyp_vol1.pdf
0
20
40
60
80
100
120
1950 1970 1990 2010 2030
Irri
gati
on
Po
ten
tial
(M
ha)
Year
IrrigationPotentialCreatedIrrigationPotentialUtilised
22
.6 26
.26
29
.08
33
.57
37
.1 44
.2 52
.02
56
.61 65
.22 7
6.4
4
81
.09
86
.26 93
.95 10
1.7
4
11
3.5
3
22
.6
25
.04
27
.8 32
.17
35
.75
41
.89
48
.39
52
.57
58
.75 68
.52
72
.79
77
.15
80
.94
85
.16
87
.92
0
20
40
60
80
100
120
1950 1956 1961 1966 1969 1674 1978 1980 1985 1990 1992 1997 2002 2007 2012
Irri
gati
on
Po
ten
tial
(m
ha)
Year
IPC IPU
IPC: 113.53 MhaIPU:87.92 MhaCWC (2018)
InvestedRs. 400,000 crore in major and medium irrigation projects since Independence.MihirShah (2016)
Over reliance
on Monsoons

Indian Agriculture-Continues to rely mostly on/ gamble with Monsoon
Dr.M.Ariz Ahammed IAS NWM
https://rbidocs.rbi.org.in/rdocs/Bulletin/PDFs/03ARE19041941BD1459CA876A339F836C520.PDF

Importance of Ground &Surface water- Sustainability?Ground water accounts for
• 60 % of irrigation needs
• 85% of rural drinking water needs
• 50% of urban water needs
• Last 40 years – GW contributed more than 80 % inincreasing Net Irrigated area
• Contributes about 9 % to GDP
• Since 1975 , Indian Agriculture has emerged as worldslargest user of ground water to grow food and fiber.
Can we sustain this level of Utilization of GW Resource…???https://www.oneindia.com/feature/no-drinking-water-india-2040-how-will-government-tackle-1492796.html
Dr.M.Ariz Ahammed IAS NWM
0
100
200
300
400
500
447
411
253
BC
M
Annual ReplenishableGW Resources
Net Annual GWAvailability
Annual GW Draft

http://www.unwater.org/publications/world-water-development-report-2015/
Bangladesh, China, India, Nepal and Pakistan together account for nearly half the world’s total groundwater use (IGRAC, 2010)
Dr.M.Ariz Ahammed IAS NWM

GW Regulation:CGWA / State Authorities
Dr.M.Ariz Ahammed IAS NWM
CGWA Regulation-NOCAP CGWA-NOCAP-Not Covered State State /UT State’s own Authority 1. ARUNACHAL PRADESH 1. ANDHRA PRADESH WALTA Act
Commissioner 2. ASSAM 2. GOA Act & CE (WR) 3. BIHAR 3. HIMACHAL PRADESH Act & Authority 4. CHHATTISGARH 4. JAMMU AND
KASHMIR Act & Authority
5. GUJARAT 5. KARNATAKA Act & Authority 6. HARYANA 6. KERALA Act & Authority 7. JHARKHAND 7. TAMIL NADU CE (GSW) GOs 8. MADHYA PRADESH 8. TELANGANA WALTA Act
Commissioner 9. MAHARASHTRA 9. WEST BENGAL Act & Water Investigation
Dir 10. MANIPUR 11. MEGHALAYA Union Territory 12. MIZORAM 10. CHANDIGARH Municipal Corpn. 13. NAGALAND 11. DELHI DC under EP Act 14. ODISHA 12. LAKSHADWEEP Regulation, Administrator 15. PUNJAB 13. PUDUCHERRY Act & Authority 16. RAJASTHAN 17. SIKKIM 18. TRIPURA 19. UTTAR PRADESH 20. UTTARAKHAND Union Territory 21. ANDAMAN AND NICOBAR
ISLANDS
22. DADRA AND NAGAR
HAVELI
23. DAMAN AND DIU

Source: NGWA: http://www.ngwa.org/Fundamentals/Documents/global-groundwater-use-fact-sheet.pdfDr.M.Ariz Ahammed IAS NWM

Dr.M.Ariz Ahammed IAS NWM

Ground Water: Over Exploitation: 2004-2013(CGWB)
Water Status Year wise total number of Blocks / Units in the country
2004 2009 2011 2013
Over exploited 839 802 1071 1034
Critical 226 169 217 253
Semi-Critical 550 523 697 681
Saline 30 71 92 96
Lakh Sq.Km % GW exploitable area
(23 Lakh Ha.)
Over Exploited 410605.5 17 %
Critical 85149.72
Semi-critical 243737.45
Saline 21114.84
760607.51
NREGS Expenditure in Water related works in Crores (Source: Dept.of RD)
2007-08 2008-09 2009-10 2010-11 2011-12 2012-13 2013-14 2014-15 2015-16 2016-17 2017-18
533 3047 5158 6360 10640 13453 13345 13156 15749 23635 21165Dr.M.Ariz Ahammed IAS NWM
http://www.wri.org/blog/2015/02/3-maps-explain-india%E2%80%99s-growing-water-risks

Dr.M.Ariz Ahammed IAS NWM
# StateNREGS-Expenditure in Water Related works (In Cr.) 2007-2018 (DORD)
FY 2017-18 FY 2016-17 FY 2015-16 FY 2014-15 FY 2013-14 FY 2012-13 FY 2011-12 FY 2010-11 FY 2009-10 FY 2008-09 FY 2007-08 Total
1ANDAMAN AND NICOBAR 0.21 0.11 0.55 1.12 2.71 0.00 0.00 0.00 0.00 0.00 0.00 4.69
2ANDHRA PRADESH 2579.30 2384.46 2186.09 1116.75 1283.04 1235.41 756.43 0.00 0.00 0.00 0.00 11541.48
3ARUNACHAL PRADESH 41.80 25.03 9.25 4.81 15.44 10.41 0.23 0.00 0.59 0.16 0.00 107.71
4ASSAM 181.29 245.26 79.74 58.29 76.94 79.09 104.17 113.24 74.48 38.43 3.20 1054.13
5BIHAR 505.11 415.01 264.24 118.08 253.62 280.70 131.42 174.91 45.03 18.44 0.91 2207.46
6DADRA & NAGAR HAVELI 0.00 0.00 0.00 0.00 0.00 0.00 0.00 0.00 0.00 0.00 0.00 0.00
7DAMAN & DIU 0.00 0.00 0.00 0.00 0.00 0.00 0.00 0.00 0.00 0.00 0.00 0.00
8GOA 1.84 2.56 1.77 2.42 1.13 0.29 1.55 1.61 0.86 0.00 0.00 14.02
9GUJARAT 220.54 273.66 177.86 110.25 130.08 190.09 199.86 278.41 321.36 20.22 0.11 1922.43
10HARYANA 138.94 145.15 68.25 75.27 95.52 96.55 69.41 60.41 40.50 24.05 1.33 815.39
11HIMACHAL PRADESH 192.45 187.29 138.47 183.43 305.99 275.89 217.30 183.93 142.91 60.20 1.86 1889.72
12JAMMU AND KASHMIR 238.48 195.65 184.54 136.68 240.95 273.09 140.49 18.58 6.49 1.51 0.02 1436.49
13KARNATAKA 1142.57 1358.37 617.70 510.04 816.38 561.69 524.11 517.82 797.66 113.58 10.23 6970.14
14KERALA 779.16 1153.52 713.55 866.98 689.42 591.58 428.47 0.00 0.00 0.00 0.00 5222.67
15MADHYA PRADESH 1263.31 1399.40 650.35 1050.90 881.90 1442.62 1583.64 878.61 458.31 366.80 198.58 10174.42
16MAHARASHTRA 803.15 990.33 881.82 510.50 414.10 891.89 685.92 162.42 87.95 65.22 24.93 5518.25
17LAKSHADWEEP 0.05 0.00 0.06 0.17 0.40 0.00 0.00 0.00 0.00 0.00 0.00 0.69
18MANIPUR 29.07 133.22 54.70 65.49 57.17 106.51 39.76 2.54 5.15 8.01 0.00 501.62
19MEGHALAYA 139.03 117.24 25.89 37.89 38.23 23.68 40.21 45.49 13.85 5.42 0.20 487.14
20MIZORAM 39.17 30.57 42.27 15.00 6.09 11.16 13.49 6.23 4.82 0.61 0.05 169.46
21NAGALAND 123.23 81.99 15.74 5.94 14.96 19.23 43.78 32.75 9.92 10.10 0.00 357.65
22ODISHA 365.06 507.06 295.41 200.60 320.99 451.93 261.07 55.80 261.94 138.94 141.00 2999.79
23PUDUCHERRY 10.39 9.08 8.05 5.27 10.35 11.24 9.67 1.43 0.00 0.00 0.00 65.48
24PUNJAB 186.17 159.84 92.50 81.02 81.53 49.61 45.32 64.09 47.33 4.19 0.12 811.73
25RAJASTHAN 1772.61 2172.16 1516.49 1320.42 1137.50 1385.20 1103.32 222.16 520.69 1113.49 2.82 12266.86
26SIKKIM 20.44 37.43 22.86 15.79 28.29 15.66 7.11 3.48 1.20 0.43 0.00 152.68
27TAMIL NADU 4121.59 3595.89 3636.92 2492.79 2948.15 2944.83 3.62 0.01 0.00 0.00 0.00 19743.82
28TRIPURA 148.31 300.06 240.74 236.68 234.40 172.51 208.67 89.85 158.54 92.70 0.16 1882.61
29UTTAR PRADESH 1259.68 1828.98 73.84 684.03 661.30 700.93 1301.89 1339.01 1054.26 477.47 4.30 9385.68
30WEST BENGAL 2176.26 2425.29 1523.10 1606.94 1294.42 0.00 1097.83 891.87 370.41 79.06 12.07 11477.25
31CHHATTISGARH 1054.79 1240.90 565.29 584.58 619.94 701.51 726.90 445.29 244.57 169.03 60.25 6413.05
32JHARKHAND 626.21 1244.98 761.10 560.46 512.83 775.06 769.51 681.02 456.43 228.67 69.31 6685.57
33UTTARAKHAND 234.45 277.16 197.90 134.83 172.11 155.22 125.33 89.93 33.04 11.05 2.19 1433.21
34TELANGANA 771.29 698.09 702.53 363.40 0.00 0.01 0.00 0.00 0.00 0.00 0.00 2535.32
Total 21165.96 23635.71 15749.55 13156.83 13345.89 13453.60 10640.48 6360.91 5158.27 3047.78 533.63 126248.61
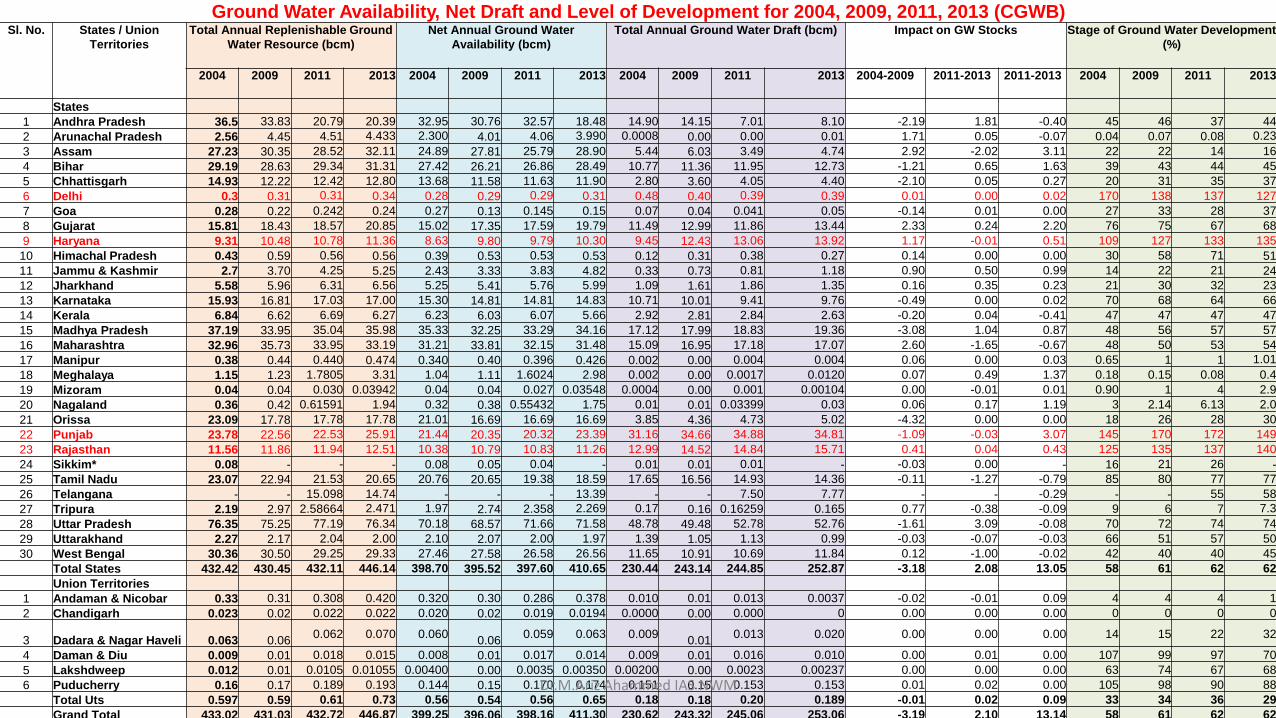
Ground Water Availability, Net Draft and Level of Development for 2004, 2009, 2011, 2013 (CGWB)Sl. No. States / Union
Territories
Total Annual Replenishable Ground
Water Resource (bcm)
Net Annual Ground Water
Availability (bcm)
Total Annual Ground Water Draft (bcm) Impact on GW Stocks Stage of Ground Water Development
(%)
2004 2009 2011 2013 2004 2009 2011 2013 2004 2009 2011 2013 2004-2009 2011-2013 2011-2013 2004 2009 2011 2013
States
1 Andhra Pradesh 36.5 33.83 20.79 20.39 32.95 30.76 32.57 18.48 14.90 14.15 7.01 8.10 -2.19 1.81 -0.40 45 46 37 44
2 Arunachal Pradesh 2.56 4.45 4.51 4.433 2.300 4.01 4.06 3.990 0.0008 0.00 0.00 0.01 1.71 0.05 -0.07 0.04 0.07 0.08 0.23
3 Assam 27.23 30.35 28.52 32.11 24.89 27.81 25.79 28.90 5.44 6.03 3.49 4.74 2.92 -2.02 3.11 22 22 14 16
4 Bihar 29.19 28.63 29.34 31.31 27.42 26.21 26.86 28.49 10.77 11.36 11.95 12.73 -1.21 0.65 1.63 39 43 44 45
5 Chhattisgarh 14.93 12.22 12.42 12.80 13.68 11.58 11.63 11.90 2.80 3.60 4.05 4.40 -2.10 0.05 0.27 20 31 35 37
6 Delhi 0.3 0.31 0.31 0.34 0.28 0.29 0.29 0.31 0.48 0.40 0.39 0.39 0.01 0.00 0.02 170 138 137 127
7 Goa 0.28 0.22 0.242 0.24 0.27 0.13 0.145 0.15 0.07 0.04 0.041 0.05 -0.14 0.01 0.00 27 33 28 37
8 Gujarat 15.81 18.43 18.57 20.85 15.02 17.35 17.59 19.79 11.49 12.99 11.86 13.44 2.33 0.24 2.20 76 75 67 68
9 Haryana 9.31 10.48 10.78 11.36 8.63 9.80 9.79 10.30 9.45 12.43 13.06 13.92 1.17 -0.01 0.51 109 127 133 135
10 Himachal Pradesh 0.43 0.59 0.56 0.56 0.39 0.53 0.53 0.53 0.12 0.31 0.38 0.27 0.14 0.00 0.00 30 58 71 51
11 Jammu & Kashmir 2.7 3.70 4.25 5.25 2.43 3.33 3.83 4.82 0.33 0.73 0.81 1.18 0.90 0.50 0.99 14 22 21 24
12 Jharkhand 5.58 5.96 6.31 6.56 5.25 5.41 5.76 5.99 1.09 1.61 1.86 1.35 0.16 0.35 0.23 21 30 32 23
13 Karnataka 15.93 16.81 17.03 17.00 15.30 14.81 14.81 14.83 10.71 10.01 9.41 9.76 -0.49 0.00 0.02 70 68 64 66
14 Kerala 6.84 6.62 6.69 6.27 6.23 6.03 6.07 5.66 2.92 2.81 2.84 2.63 -0.20 0.04 -0.41 47 47 47 47
15 Madhya Pradesh 37.19 33.95 35.04 35.98 35.33 32.25 33.29 34.16 17.12 17.99 18.83 19.36 -3.08 1.04 0.87 48 56 57 57
16 Maharashtra 32.96 35.73 33.95 33.19 31.21 33.81 32.15 31.48 15.09 16.95 17.18 17.07 2.60 -1.65 -0.67 48 50 53 54
17 Manipur 0.38 0.44 0.440 0.474 0.340 0.40 0.396 0.426 0.002 0.00 0.004 0.004 0.06 0.00 0.03 0.65 1 1 1.01
18 Meghalaya 1.15 1.23 1.7805 3.31 1.04 1.11 1.6024 2.98 0.002 0.00 0.0017 0.0120 0.07 0.49 1.37 0.18 0.15 0.08 0.4
19 Mizoram 0.04 0.04 0.030 0.03942 0.04 0.04 0.027 0.03548 0.0004 0.00 0.001 0.00104 0.00 -0.01 0.01 0.90 1 4 2.9
20 Nagaland 0.36 0.42 0.61591 1.94 0.32 0.38 0.55432 1.75 0.01 0.01 0.03399 0.03 0.06 0.17 1.19 3 2.14 6.13 2.0
21 Orissa 23.09 17.78 17.78 17.78 21.01 16.69 16.69 16.69 3.85 4.36 4.73 5.02 -4.32 0.00 0.00 18 26 28 30
22 Punjab 23.78 22.56 22.53 25.91 21.44 20.35 20.32 23.39 31.16 34.66 34.88 34.81 -1.09 -0.03 3.07 145 170 172 149
23 Rajasthan 11.56 11.86 11.94 12.51 10.38 10.79 10.83 11.26 12.99 14.52 14.84 15.71 0.41 0.04 0.43 125 135 137 140
24 Sikkim* 0.08 - - - 0.08 0.05 0.04 - 0.01 0.01 0.01 - -0.03 0.00 - 16 21 26 -
25 Tamil Nadu 23.07 22.94 21.53 20.65 20.76 20.65 19.38 18.59 17.65 16.56 14.93 14.36 -0.11 -1.27 -0.79 85 80 77 77
26 Telangana - - 15.098 14.74 - - - 13.39 - - 7.50 7.77 - - -0.29 - - 55 58
27 Tripura 2.19 2.97 2.58664 2.471 1.97 2.74 2.358 2.269 0.17 0.16 0.16259 0.165 0.77 -0.38 -0.09 9 6 7 7.3
28 Uttar Pradesh 76.35 75.25 77.19 76.34 70.18 68.57 71.66 71.58 48.78 49.48 52.78 52.76 -1.61 3.09 -0.08 70 72 74 74
29 Uttarakhand 2.27 2.17 2.04 2.00 2.10 2.07 2.00 1.97 1.39 1.05 1.13 0.99 -0.03 -0.07 -0.03 66 51 57 50
30 West Bengal 30.36 30.50 29.25 29.33 27.46 27.58 26.58 26.56 11.65 10.91 10.69 11.84 0.12 -1.00 -0.02 42 40 40 45
Total States 432.42 430.45 432.11 446.14 398.70 395.52 397.60 410.65 230.44 243.14 244.85 252.87 -3.18 2.08 13.05 58 61 62 62
Union Territories
1 Andaman & Nicobar 0.33 0.31 0.308 0.420 0.320 0.30 0.286 0.378 0.010 0.01 0.013 0.0037 -0.02 -0.01 0.09 4 4 4 1
2 Chandigarh 0.023 0.02 0.022 0.022 0.020 0.02 0.019 0.0194 0.0000 0.00 0.000 0 0.00 0.00 0.00 0 0 0 0
3 Dadara & Nagar Haveli 0.063 0.060.062 0.070 0.060
0.060.059 0.063 0.009
0.010.013 0.020 0.00 0.00 0.00 14 15 22 32
4 Daman & Diu 0.009 0.01 0.018 0.015 0.008 0.01 0.017 0.014 0.009 0.01 0.016 0.010 0.00 0.01 0.00 107 99 97 70
5 Lakshdweep 0.012 0.01 0.0105 0.01055 0.00400 0.00 0.0035 0.00350 0.00200 0.00 0.0023 0.00237 0.00 0.00 0.00 63 74 67 68
6 Puducherry 0.16 0.17 0.189 0.193 0.144 0.15 0.170 0.174 0.151 0.15 0.153 0.153 0.01 0.02 0.00 105 98 90 88
Total Uts 0.597 0.59 0.61 0.73 0.56 0.54 0.56 0.65 0.18 0.18 0.20 0.189 -0.01 0.02 0.09 33 34 36 29
Grand Total 433.02 431.03 432.72 446.87 399.25 396.06 398.16 411.30 230.62 243.32 245.06 253.06 -3.19 2.10 13.14 58 61 62 62
Dr.M.Ariz Ahammed IAS NWM

Comparison - Categorization of Blocks/ Mandals/ Taluks/Firka In India from 2004 to 2013 (CGWB)Sl.No States / Union
Territories
Total No. of Assessed Units Safe Semi-critical Critical Over-exploited Saline
2004 2009 2011 2013 2004 2009 2011 2013 2004 2009 2011 2013 2004 2009 2011 2013 2004 2009 2011 2013 2004 2009 2011 2013
States
1 Andhra Pradesh 1231 1108 662 670 760 867 534 497 175 93 42 54 77 26 7 17 219 84 41 61 0 38 38 41
2 Arunachal Pradesh 13 16 11 11 13 16 11 11 0 0 0 0 0 0 0 0 0 0 0 0 0 0 0 0
3 Assam 23 23 27 27 23 23 27 27 0 0 0 0 0 0 0 0 0 0 0 0 0 0 0 0
4 Bihar 515 533 533 534 515 529 522 520 0 4 11 14 0 0 0 0 0 0 0 0 0 0 0 0
5 Chhattisgarh 146 146 146 146 138 132 125 125 8 14 18 18 0 0 2 2 0 0 1 1 0 0 0 0
6 Delhi 9 27 27 27 2 2 2 5 0 5 5 7 0 0 2 0 7 20 18 15 0 0 0 0
7 Goa 11 11 20 12 11 11 20 12 0 0 0 0 0 0 0 0 0 0 0 0 0 0 0 0
8 Gujarat 223 223 223 223 97 156 171 175 69 20 13 9 12 6 5 6 31 27 24 23 14 14 10 10
9 Haryana 113 116 116 119 42 18 23 30 5 9 7 11 11 21 15 14 55 68 71 64 0 0 0 0
10 Himachal Pradesh 5 8 8 8 5 6 5 6 0 0 0 0 0 1 2 1 0 1 1 1 0 0 0 0
11 Jammu & Kashmir 8 14 14 22 8 14 14 22 0 0 0 0 0 0 0 0 0 0 0 0 0 0 0 0
12 Jharkhand 208 208 210 260 208 200 199 244 0 2 5 10 0 2 0 2 0 4 6 4 0 0 0 0
13 Karnataka 175 270 270 176 93 154 152 98 14 34 34 21 3 11 21 14 65 71 63 43 0 0 0 0
14 Kerala 151 152 152 152 101 126 126 131 30 22 23 18 15 3 2 2 5 1 1 1 0 0 0 0
15 Madhya Pradesh 312 313 313 313 264 224 218 228 19 61 67 58 5 4 4 2 24 24 24 25 0 0 0 0
16 Maharashtra 318 353 353 353 287 324 325 324 23 19 16 19 1 1 2 1 7 9 10 9 0 0 0 0
17 Manipur 7 8 8 9 7 8 8 9 0 0 0 0 0 0 0 0 0 0 0 0 0 0 0 0
18 Meghalaya 7 7 7 11 7 7 7 11 0 0 0 0 0 0 0 0 0 0 0 0 0 0 0 0
19 Mizoram 22 22 22 22 22 22 22 22 0 0 0 0 0 0 0 0 0 0 0 0 0 0 0 0
20 Nagaland 7 8 8 11 7 8 8 11 0 0 0 0 0 0 0 0 0 0 0 0 0 0 0 0
21 Odisha 314 314 314 314 308 308 308 308 0 0 0 0 0 0 0 0 0 0 0 0 6 6 6 6
22 Punjab 137 138 138 138 25 23 22 26 4 2 2 3 5 3 4 4 103 110 110 105 0 0 0 0
23 Rajasthan 237 239 243 248 32 31 25 44 14 16 20 28 50 25 24 9 140 166 172 164 1 1 2 3
24 Sikkim 1 4 4 - 1 4 1 0 0 0 0 0 0 0 0 0 0
25 Tamil Nadu 385 386 1129 1139 145 136 437 429 57 67 235 212 33 33 48 105 142 139 374 358 8 11 35 35
26 Telangana 448 443 343 311 55 74 8 12 0 42 46 0 0 0
27 Tripura 38 39 39 39 38 39 39 39 0 0 0 0 0 0 0 0 0 0 0 0 0 0 0 0
28 Uttar Pradesh 803 820 820 820 665 605 559 603 88 107 82 45 13 32 68 59 37 76 111 113 0 0 0 0
29 Uttarakhand 17 17 18 18 12 11 11 16 3 5 5 1 0 1 2 1 2 0 0 0 0 0 0 0
30 West Bengal 269 269 271 268 231 231 217 191 37 38 53 76 1 0 1 1.00 0 0 0 0 0 0 0 0
Total States 5705 5792 6554 6533 4067 4235 4481 4475 546 518 693 678 226 169 217 252 837 800 1069 1033 29 70 91 95
Union Territories
1 Andaman & Nicobar 1
33
36 34 1 33
3634
0 0
00
0 0
00
0 0
00 0
0
00
2 Chandigarh 1 1 1 1 1 1 1 1 0 0 0 0 0 0 0 0 0 0 0 0 0 0 0 0
3 Dadra & Nagar Haveli 1
1 1 1
1 1 11
0 0 00
0 0 00
0 0 00 0
0 00
4 Daman & Diu 2 2 2 2 0 0 0 1 1 1 1 0 0 0 0 1 1 1 1 0 0 0 0 0
5 Lakshdweep 9 9 9 9 6 5 6 6 3 4 3 3 0 0 0 0 0 0 0 0 0 0 0 0
6 Puducherry 4 4 4 4 2 2 2 2 0 0 0 0 0 0 0 0 1 1 1 1 1 1 1 1
Total Uts 18 50 53 51 11 42 46 45 4 5 4 3 0 0 0 1 2 2 2 1 1 1 1 1
Grand Total 5723 5842 6607 6584 4078 4277 4527 4520 550 523 697 681 226 169 217 253 839 802 1071 1034 30 71 92 96
Dr.M.Ariz Ahammed IAS NWM

Shrinking of Peninsular rivers
RIVER DISCHARGE CONTRIBUTION
HIMALAYAN RIVERS NON-HIMALAYAN RIVERS
Monsoon Season Dry Season Monsoon Season Dry Season
Glacier 5% 60% 0% 0%
Precipitation 90% 5% 95% 5%
Groundwater (Base flow) 5% 35% 5% 95%
Peninsular Rivers
Himalayan Rivers
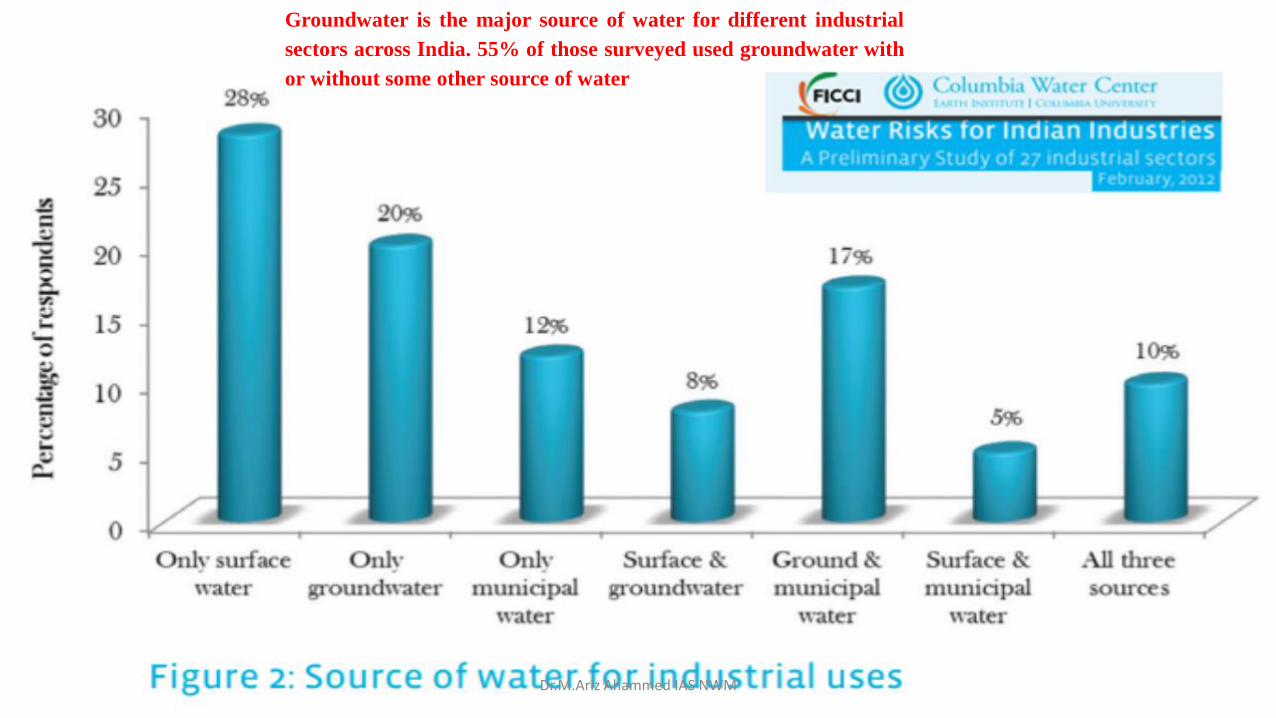
Groundwater is the major source of water for different industrial
sectors across India. 55% of those surveyed used groundwater with
or without some other source of water
Dr.M.Ariz Ahammed IAS NWM

Dr.M.Ariz Ahammed IAS NWM

Dr.M.Ariz Ahammed IAS NWM
During 2015,the estimated sewage generation in the country was 61754 MLD as against the developed sewage treatment capacity of 22963 MLD. 62% of the total sewage I
http://www.sulabhenvis.nic.in/Database/STST_wastewater_2090.aspxs discharged directly into nearby water bodies
• 5 states viz Maharashtra, Tamil Nadu, Uttar Pradesh, Delhi & Gujarat account for approximately 50% of the total sewage generated.
• Maharashtra, Gujarat, Delhi , Uttar Pradesh & Gujarat account for 67% of the total sewage treatment capacity installed
• No sewage treatment plant has been established in seven states/UTs viz. Arunachal Pradesh, Chhattisgarh, Daman Diu, Nagaland , Assam & Tripura.
• The capacity of STPs installed in the two states viz. HP & Sikkim is adequate to treat the total quality of sewage generated in these states.
National status of waste water generation & treatment

DILAPIDATED TANKS
Damaged Bund Dried tank full of silt
Damaged Weir Breached Bund Damaged Sluice Damaged Bund
30

Dr.M.Ariz Ahammed IAS NWM
http://farmer.gov.in/Drought/Droughtreport.aspx
Risks: Droughts- Regular feature?
Original source: http://journals.plos.org/plosone/article?id=10.1371/journal.pone.0032688http://www.downtoearth.org.in/news/climate-change-causes-about-1-5-per-cent-loss-in-india-s-gdp-57883
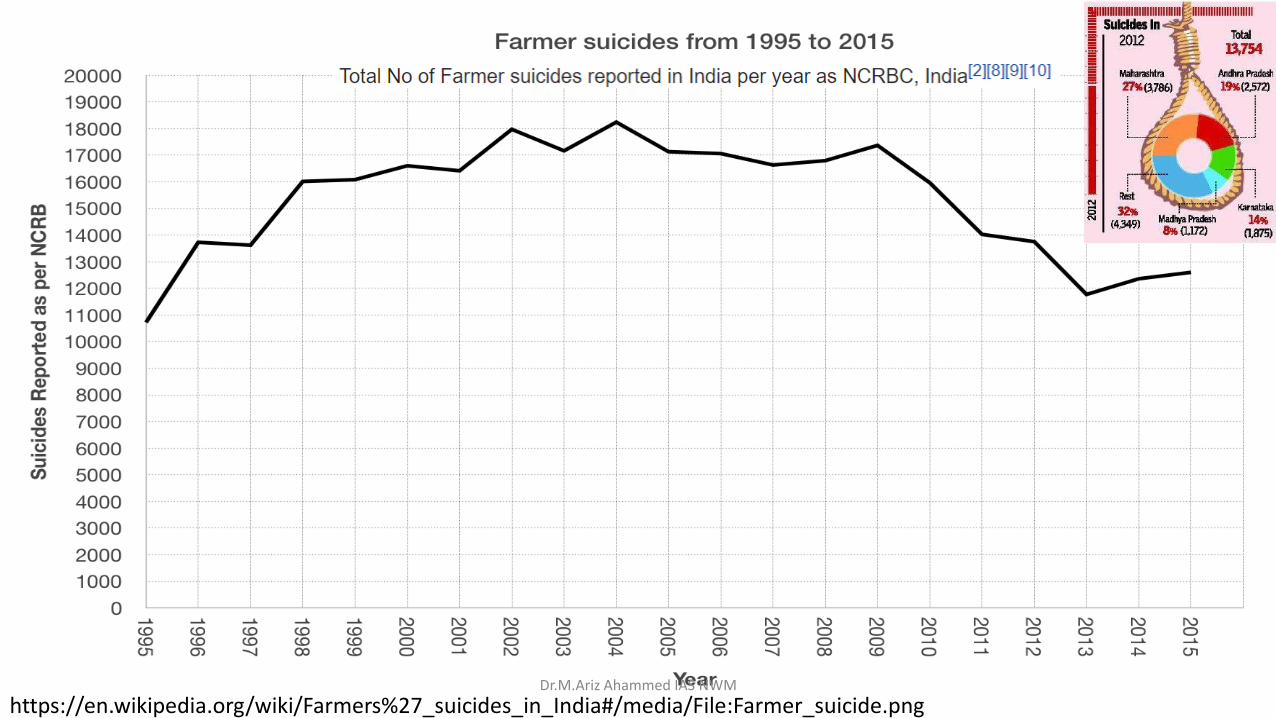
https://en.wikipedia.org/wiki/Farmers%27_suicides_in_India#/media/File:Farmer_suicide.pngDr.M.Ariz Ahammed IAS NWM

STATEWISE FLOOD INUNDATED AREA STATISTICS FOR 2017Source: NRSC
Mar , Apr , Jun
Jun , Jul ,
Aug , Sep
Aug , Sep
Jun , Jul , Aug
July
Nov , Dec
Nov , Dec
Aug
Jul , Aug , Sep
Aug
ASSAM
JAMMU &
KASHMIR
GUJARAT MADHYA PRADESH
BIHAR
WEST
BENGALODISHA
ANDHRA
PRADESH
MANIPUR
TAM
IL
NADU
State 2010 2015 2017
Andhra Pradesh 200372 238357
Arunachal Pradesh 3841
Assam 336597 720450 1164200
Bihar 319357 149552 866643
Chattisgarh 8800
Delhi 3192
Gujarat 80151 96686
Jammu & Kashmir 17726.7
Madhya Pradesh 7708.45
Manipur 5183 20321.3 82545
Odisha 53431.5 38320
Punjab & Haryana 266201
State 2010 2015 2017
Tamilnadu 181732
Tripura 1261
Uttar Pradesh 574635 285084
Uttarakhand 1708
West Bengal 3074 286247 445010
1724400 1759706.95 2984346
2017
2015
2010
8386.270
Flood Damage Data Period(India): 1953-2016 Source: CWC (2018)
Area Affected (mha) Affected Population (million) Total Damages (in Crores)
Average Maximum Average Maximum Average Maximum
7.2 17.5 (in 1978) 31.88 70.45 (in 1978) 5432 57394 (in 2015)Dr.M.Ariz Ahammed IAS NWM

Water Quality challenges (Chemical)Source: HDR, 2006 + CGWB
Number of Districts affected (CGWB)
2000 2005 2010 2015
Fe Not monitored annually 301
Arsenic* Not monitored annually 153
Fluoride 151 144 184 171
Nitrate 267 265 282 286
EC 167 144 162 154
Dr.M.Ariz Ahammed IAS NWM

Contamination Dr.M.Ariz Ahammed IAS NWM
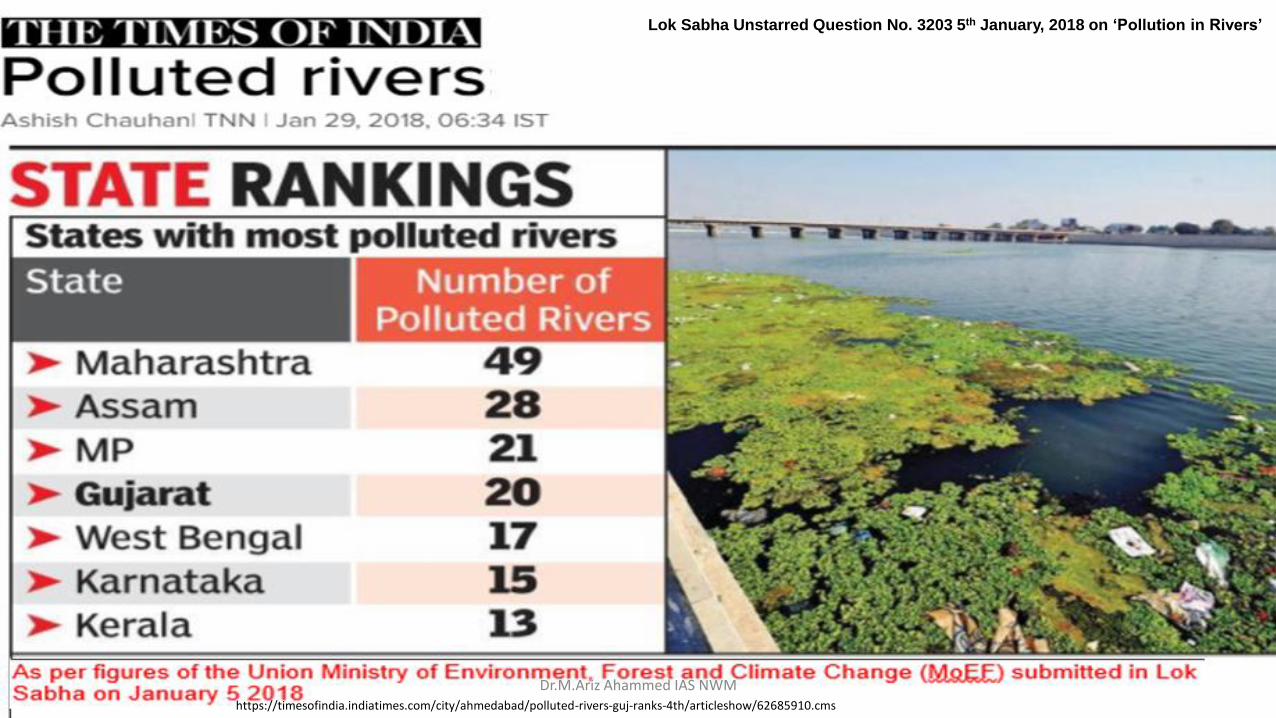
https://timesofindia.indiatimes.com/city/ahmedabad/polluted-rivers-guj-ranks-4th/articleshow/62685910.cms
Dr.M.Ariz Ahammed IAS NWM
Lok Sabha Unstarred Question No. 3203 5th January, 2018 on ‘Pollution in Rivers’

Dr.M.Ariz Ahammed IAS NWM

Dr.M.Ariz Ahammed IAS NWM

Dr.M.Ariz Ahammed IAS NWM

Water : Health (Biological)
Dr.M.Ariz Ahammed IAS NWM

India’s Water Problems’ Statement
Dr.M.Ariz Ahammed IAS NWM
Scenario / Impact Cause
Supply/
Source side
Ground Water Water Scarcity in North-western States Indiscriminate extraction /decline in water tables with distorted power policy; Inland salinity
Water scarcity: Western states Arid: Low recharge with low rainfall.
Water Stress/ scarcity in Central India States
(Bundelkhand region).
Geo-morphology / Hard rock formation with meagre discharge/ High runoff.
Water Stress/ Scarcity : Southern States Hard rock formation/ Limited yields / Poor storage
Shallow Water tables in Eastern States Underutilisation, Poor crop intensification; Poor farmers; Small & fragmented landholdings;
Poor (/no) power supply
Surface Water Decline in base flow in non-monsoon in
Peninsular rivers.
Over Extraction of GW; Inadequate afforestation & Water conservation
Flow of large runoff into sea Inadequate reservoir storage
Coastal zone Mixing of saline water; Sea water intrusion Tidal fluctuations; Cyclone/ Storm Surge induced forced recharging
Tanks &
Wetlands
Encroachment / ruin; Degradation of
Watershed
Human factors / Socio-economic issues
Springs Drying ; obstructions No inventory, Human factors and Climate change
Wastewater Underutilisation of Waste Water lack of water treatment plants;
underutilisation of capacity; Poor maintenance & poor enforcement
Precipitation Droughts Low rainfall, intense evaporation; Inadequate Storage
Floods & Erosion Uneven distribution of rainfall in time & space frame, inadequate capacity of drainage
system, unregulated development of flood plains, Inadequate flood storages
Demand side Drinking Water Less-availability of safe DW Stress / Scarcity at source; Poor Measurement, capital intensive infrastructure for water
treatment plant; Leakages, In efficient technology.
Farm Sector Irrigated: Largest consumer;
Poor WUE
Inadequate storage; Seasonal shortages
Rice, Wheat, Sugarcane, Cotton are in 60 M.Ha against total irrigated area of 87 MHa.
Rainfed: Droughts Extremes of Water availability
Industry Poor WUE; Inadequacy in supply;
Closure of Industries
Poor technology; Poor recycling
Location in water scarce areas;
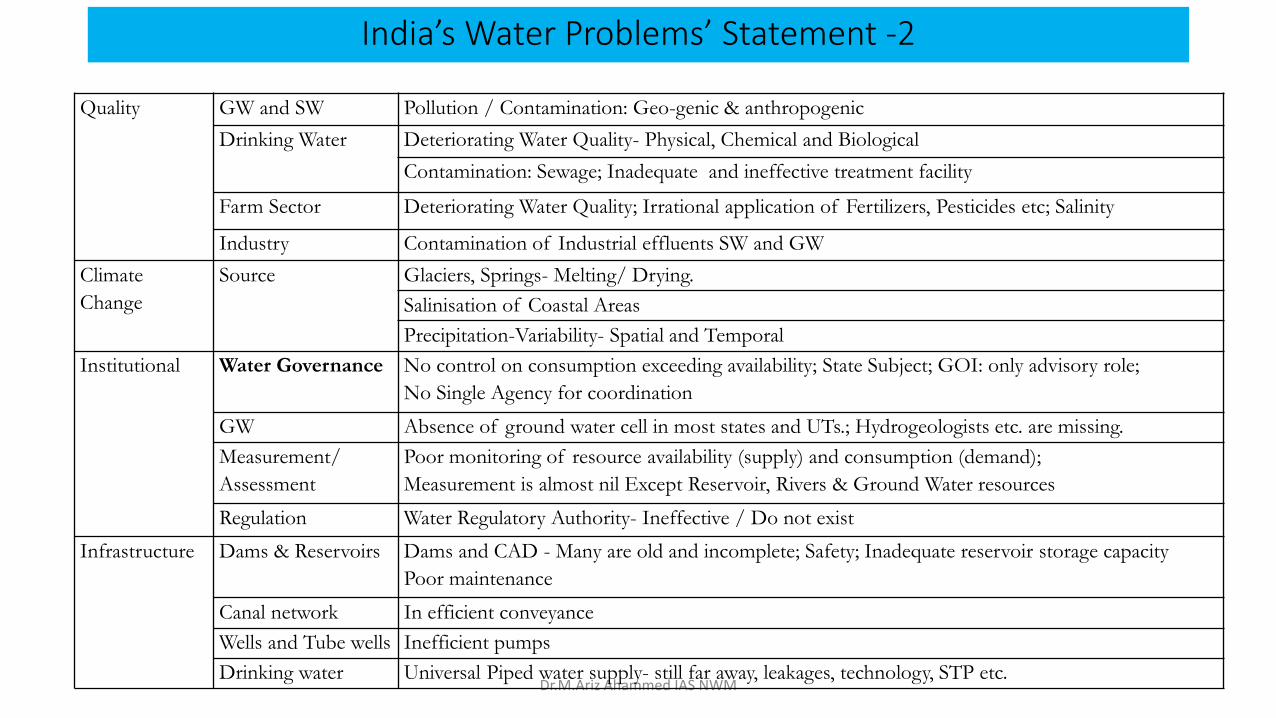
India’s Water Problems’ Statement -2
Dr.M.Ariz Ahammed IAS NWM
Quality GW and SW Pollution / Contamination: Geo-genic & anthropogenic
Drinking Water Deteriorating Water Quality- Physical, Chemical and Biological
Contamination: Sewage; Inadequate and ineffective treatment facility
Farm Sector Deteriorating Water Quality; Irrational application of Fertilizers, Pesticides etc; Salinity
Industry Contamination of Industrial effluents SW and GW
Climate
Change
Source Glaciers, Springs- Melting/ Drying.
Salinisation of Coastal Areas
Precipitation-Variability- Spatial and Temporal
Institutional Water Governance No control on consumption exceeding availability; State Subject; GOI: only advisory role;
No Single Agency for coordination
GW Absence of ground water cell in most states and UTs.; Hydrogeologists etc. are missing.
Measurement/
Assessment
Poor monitoring of resource availability (supply) and consumption (demand);
Measurement is almost nil Except Reservoir, Rivers & Ground Water resources
Regulation Water Regulatory Authority- Ineffective / Do not exist
Infrastructure Dams & Reservoirs Dams and CAD - Many are old and incomplete; Safety; Inadequate reservoir storage capacity
Poor maintenance
Canal network In efficient conveyance
Wells and Tube wells Inefficient pumps
Drinking water Universal Piped water supply- still far away, leakages, technology, STP etc.
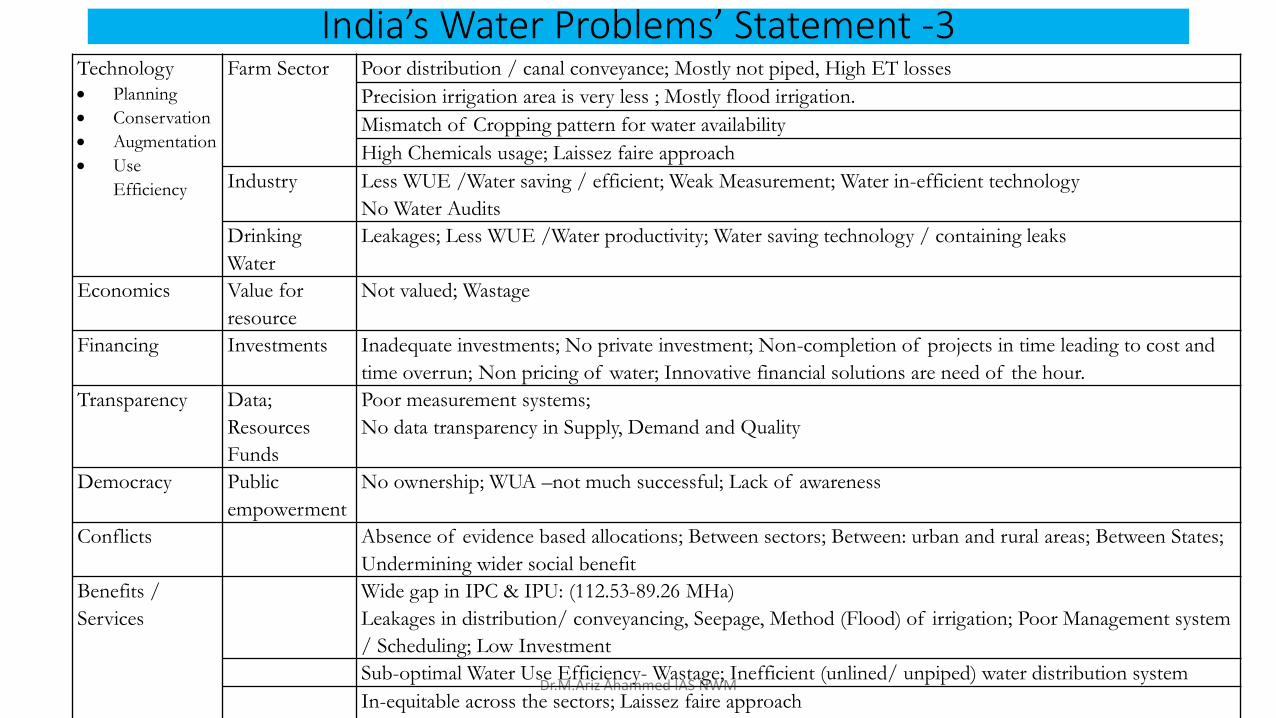
India’s Water Problems’ Statement -3
Dr.M.Ariz Ahammed IAS NWM
Technology
• Planning
• Conservation
• Augmentation
• Use
Efficiency
Farm Sector Poor distribution / canal conveyance; Mostly not piped, High ET losses
Precision irrigation area is very less ; Mostly flood irrigation.
Mismatch of Cropping pattern for water availability
High Chemicals usage; Laissez faire approach
Industry Less WUE /Water saving / efficient; Weak Measurement; Water in-efficient technology
No Water Audits
Drinking
Water
Leakages; Less WUE /Water productivity; Water saving technology / containing leaks
Economics Value for
resource
Not valued; Wastage
Financing Investments Inadequate investments; No private investment; Non-completion of projects in time leading to cost and
time overrun; Non pricing of water; Innovative financial solutions are need of the hour.
Transparency Data;
Resources
Funds
Poor measurement systems;
No data transparency in Supply, Demand and Quality
Democracy Public
empowerment
No ownership; WUA –not much successful; Lack of awareness
Conflicts Absence of evidence based allocations; Between sectors; Between: urban and rural areas; Between States;
Undermining wider social benefit
Benefits /
Services
Wide gap in IPC & IPU: (112.53-89.26 MHa)
Leakages in distribution/ conveyancing, Seepage, Method (Flood) of irrigation; Poor Management system
/ Scheduling; Low Investment
Sub-optimal Water Use Efficiency- Wastage; Inefficient (unlined/ unpiped) water distribution system
In-equitable across the sectors; Laissez faire approach

Climate change: Millions at Risk
https://digital.library.unt.edu/ark:/67531/metadc12057/m1/71/?q=%20date%3A2000-2099
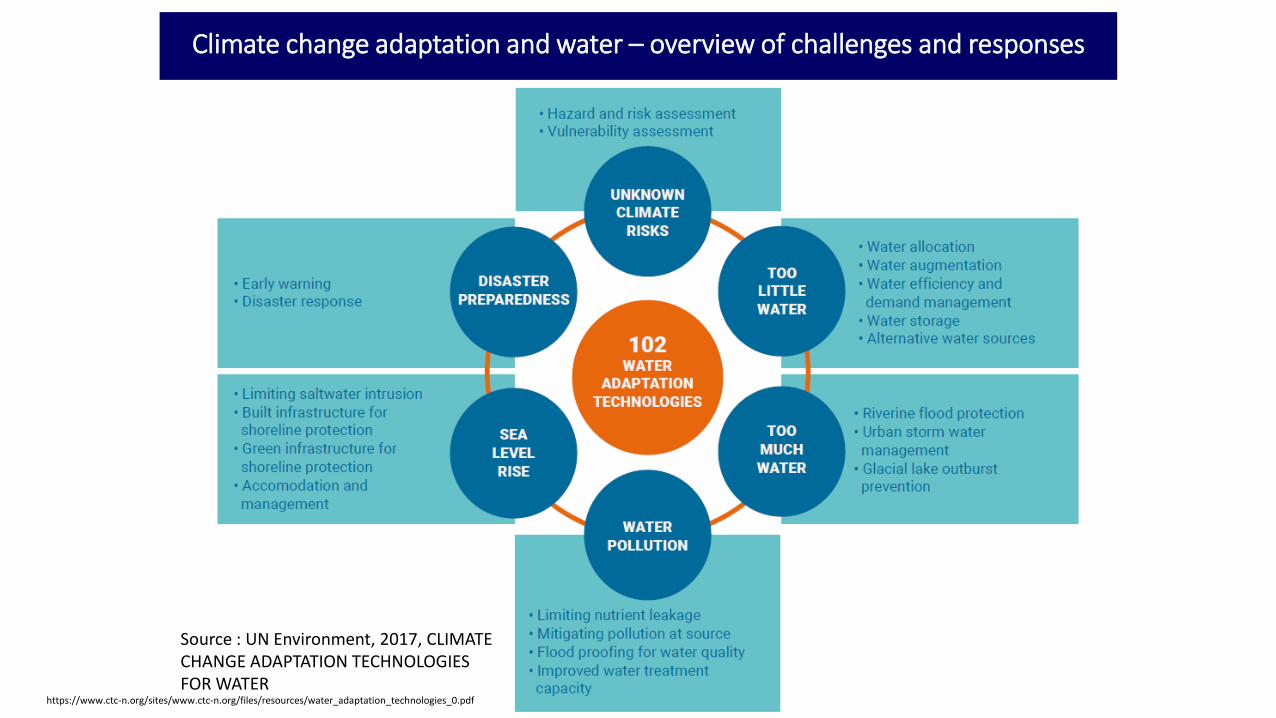
Source : UN Environment, 2017, CLIMATE CHANGE ADAPTATION TECHNOLOGIES FOR WATER
Climate change adaptation and water – overview of challenges and responses
https://www.ctc-n.org/sites/www.ctc-n.org/files/resources/water_adaptation_technologies_0.pdf

Water Governance -Salient features
Dr.M.Ariz Ahammed IAS NWM

Water Governance-National Perspective
State List- entry 17 of List-II subject to the provision of Entry 56 of List-I i.e. Union List.
Entry 17 of List II (State List): “Water, that is to say, water supplies, irrigation and canals, drainage andembankments, water storage and water power subject to provisions of entry 56 of List I.”
Entry 56 of List I (Union List):“Regulation and development of inter-state rivers and river valleys to the extent to which suchregulation and development under the control of the Union is declared by Parliament by law to be expedient in the publicinterest.”
River Boards Act, 1956 (Under Art.246, List 1, Entry 56)
Art.262. Adjudication of disputes relating to waters of inter-State rivers or river valleys
Inter State Water Disputes Act, 1956 –provides for setting up of Tribunals
National Water Framework Law (NWFL)
Dr.M.Ariz Ahammed IAS NWM
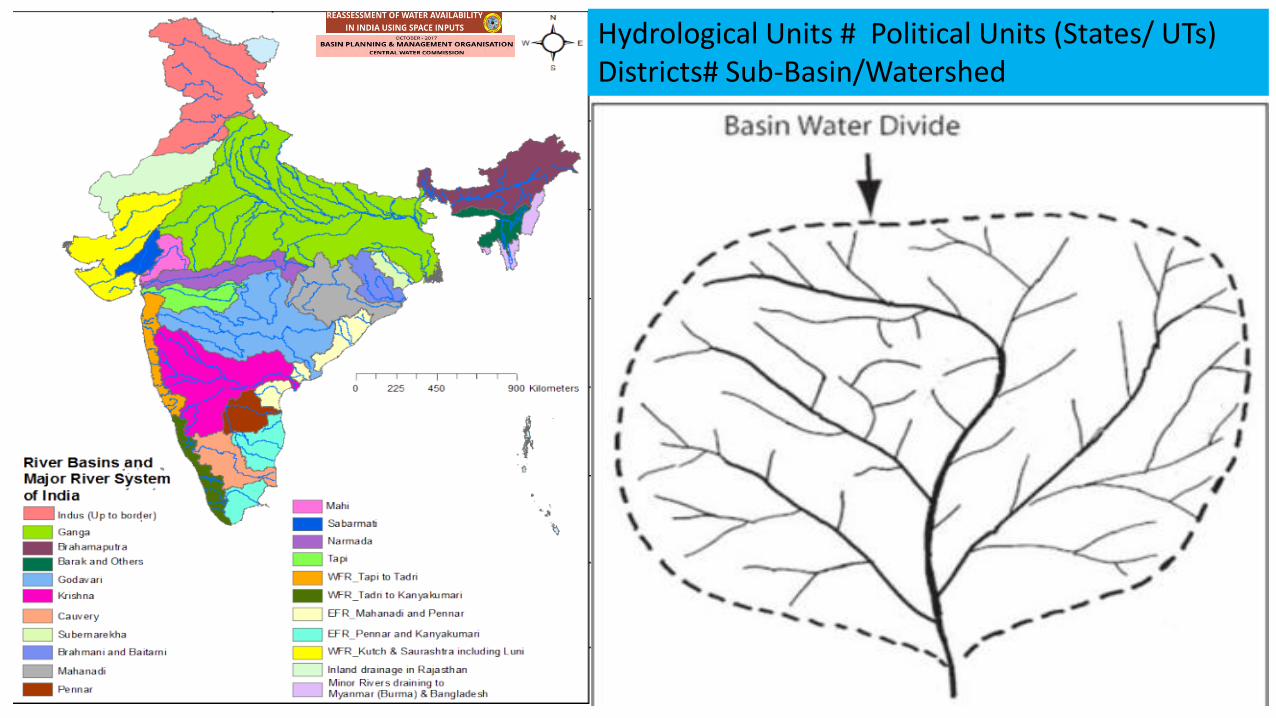
Dr.M.Ariz Ahammed IAS NWM
Hydrological Units # Political Units (States/ UTs)Districts# Sub-Basin/Watershed

Supply side
Demand Side
Water Dimensions
Dr.M.Ariz Ahammed IAS NWM

Water governance- DistributedNo single coordination Agency
Dr.M.Ariz Ahammed IAS NWM
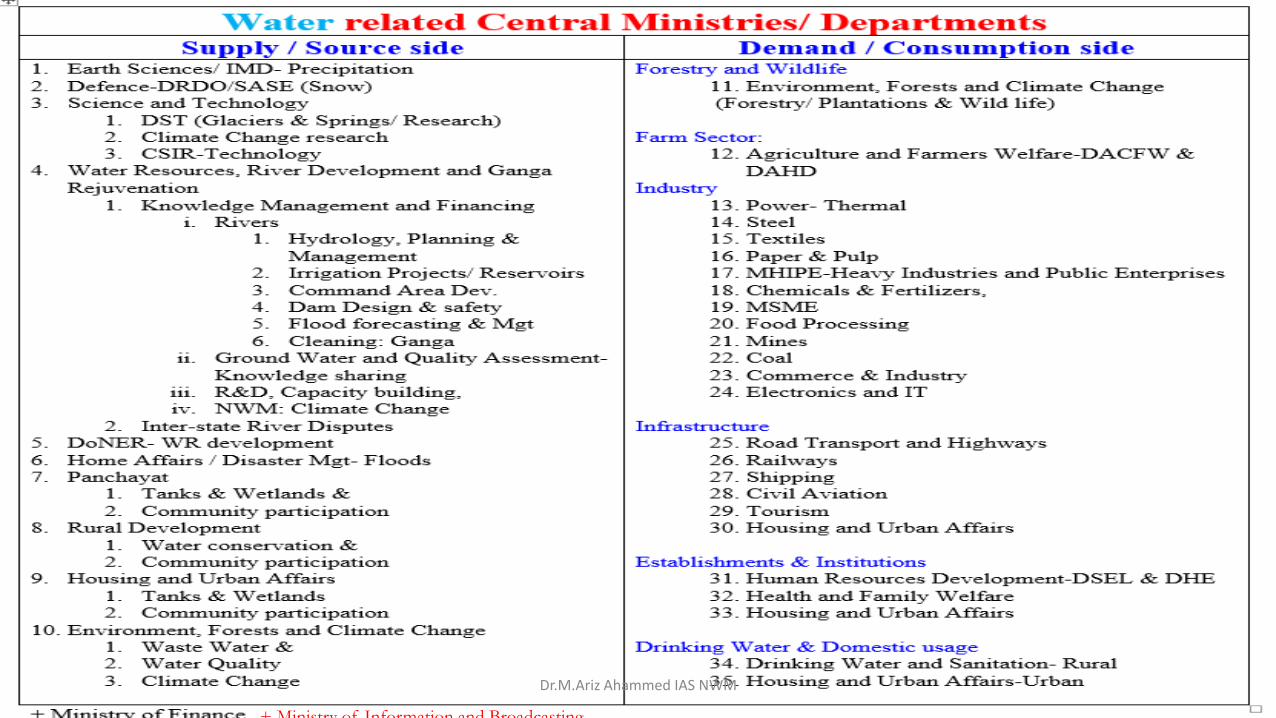
Dr.M.Ariz Ahammed IAS NWM
+ Ministry of Information and Broadcasting
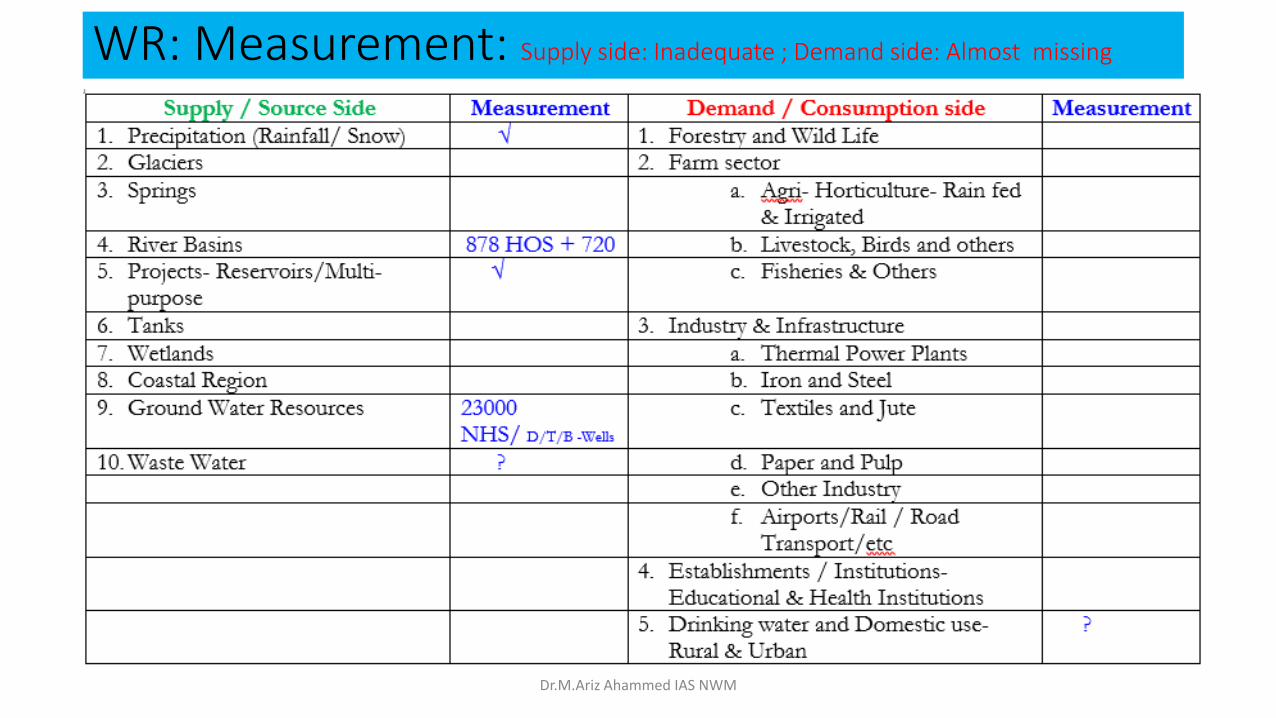
WR: Measurement: Supply side: Inadequate ; Demand side: Almost missing
Dr.M.Ariz Ahammed IAS NWM

Dr.M.Ariz Ahammed IAS NWM
AP CM Dashboardhttp://core.ap.gov.in/CMDashBoard/Index.aspx
MeasurementBest Practices
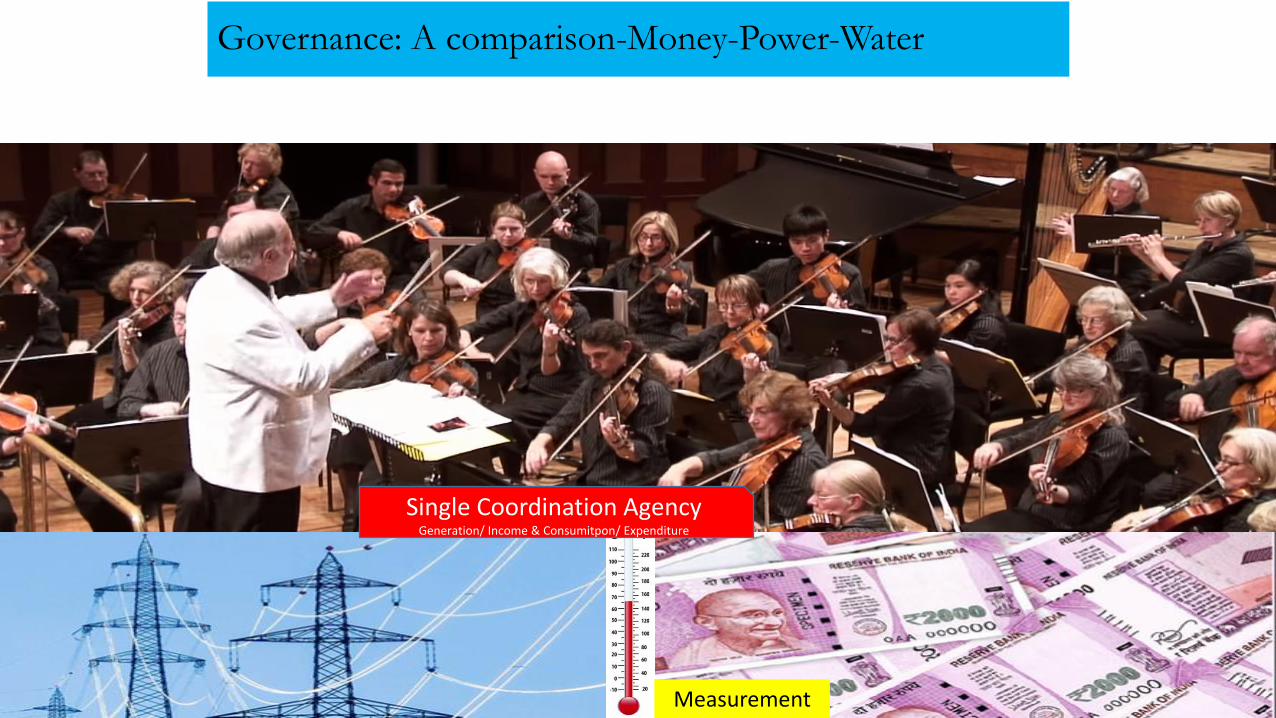
Governance: A comparison-Money-Power-Water
Single Coordination AgencyGeneration/ Income & Consumitpon/ Expenditure
Measurement
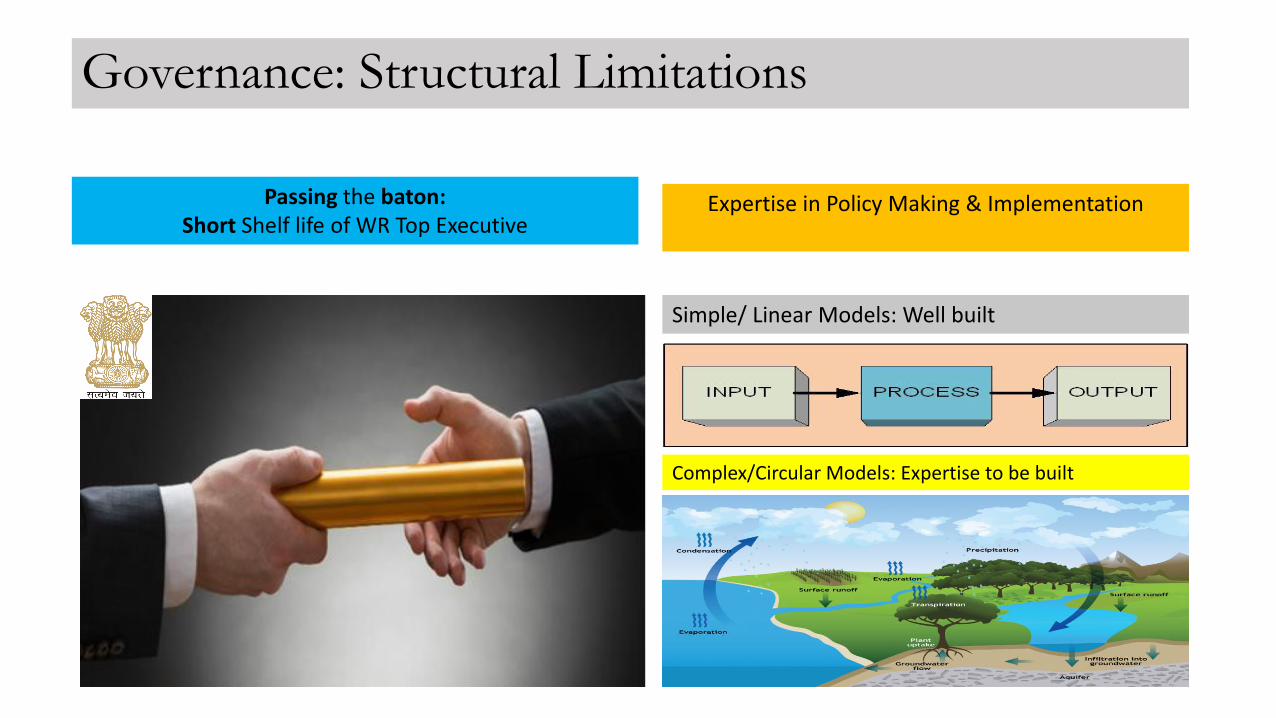
Governance: Structural Limitations
Passing the baton: Short Shelf life of WR Top Executive
Complex/Circular Models: Expertise to be built
Simple/ Linear Models: Well built
Expertise in Policy Making & Implementation
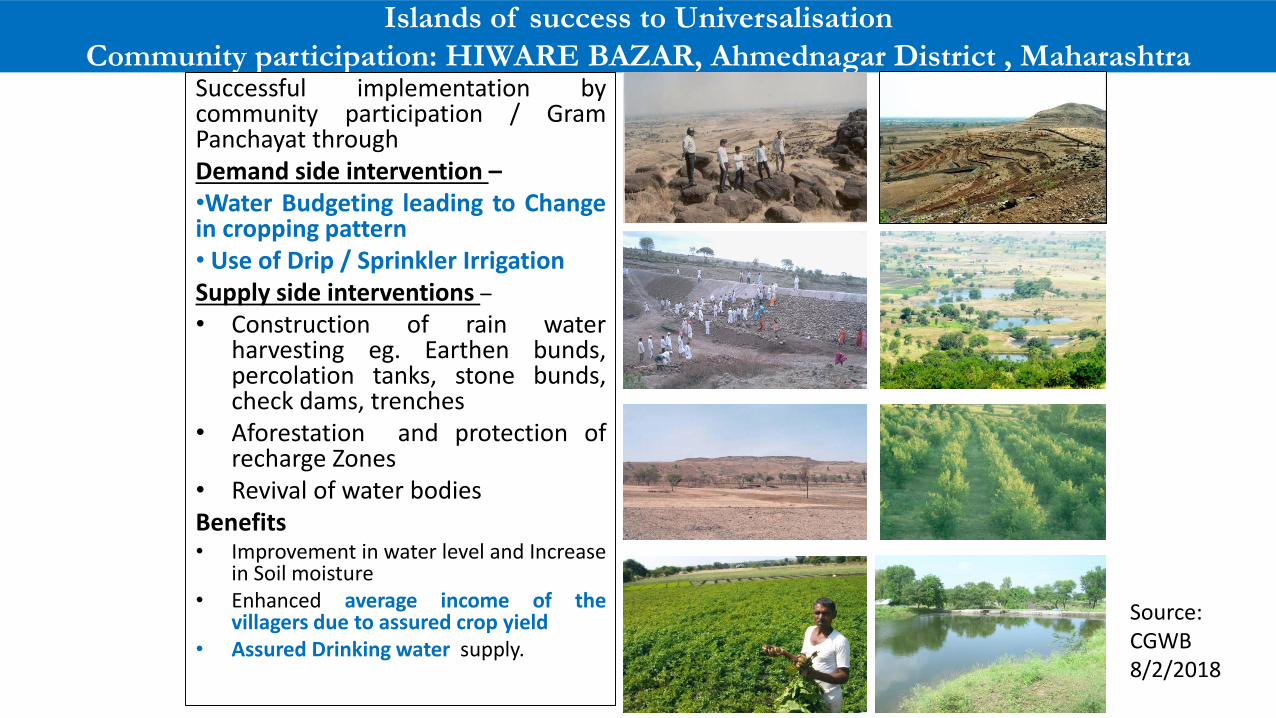
Islands of success to Universalisation
Community participation: HIWARE BAZAR, Ahmednagar District , MaharashtraSuccessful implementation bycommunity participation / GramPanchayat throughDemand side intervention –•Water Budgeting leading to Changein cropping pattern• Use of Drip / Sprinkler IrrigationSupply side interventions –
• Construction of rain waterharvesting eg. Earthen bunds,percolation tanks, stone bunds,check dams, trenches
• Aforestation and protection ofrecharge Zones
• Revival of water bodiesBenefits• Improvement in water level and Increase
in Soil moisture• Enhanced average income of the
villagers due to assured crop yield• Assured Drinking water supply.
Source:CGWB 8/2/2018

Dr.M.Ariz Ahammed IAS NWM
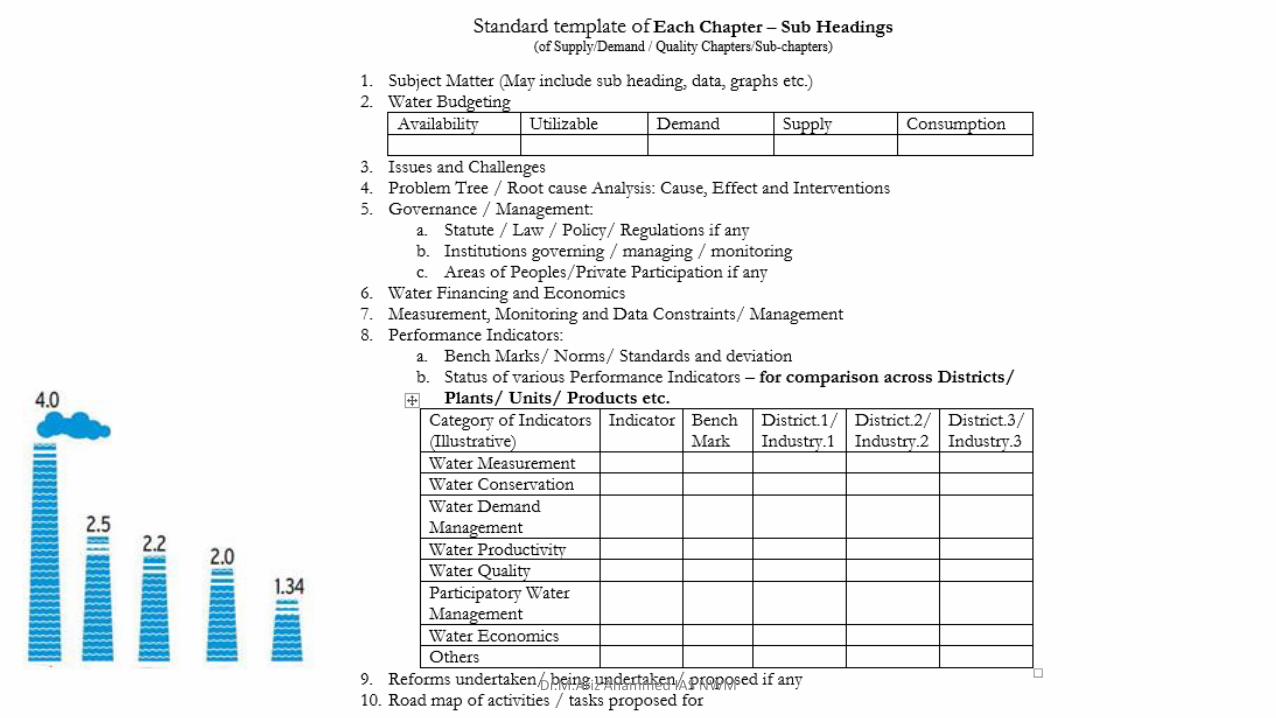
SlNo. Major Area Sub/Micro-area
1Water Planning
Irrigation distribution system (viz. Drone),
Industry, Drinking Water etc.
2 Water conservation Domestic/Municipal/Industrial
establishments
3 Water augmentation /
availability
Flood water recharge
Control of evaporation
Desalination
Waste water treatment and Water recycling
Hydrological budget
4 Water use
management
Irrigation
Increase water use efficiency
River flow/discharge
Drought and flood
Major Thematic Area for Technology Scouting Power of Technology
Saving of Water: 40-80%
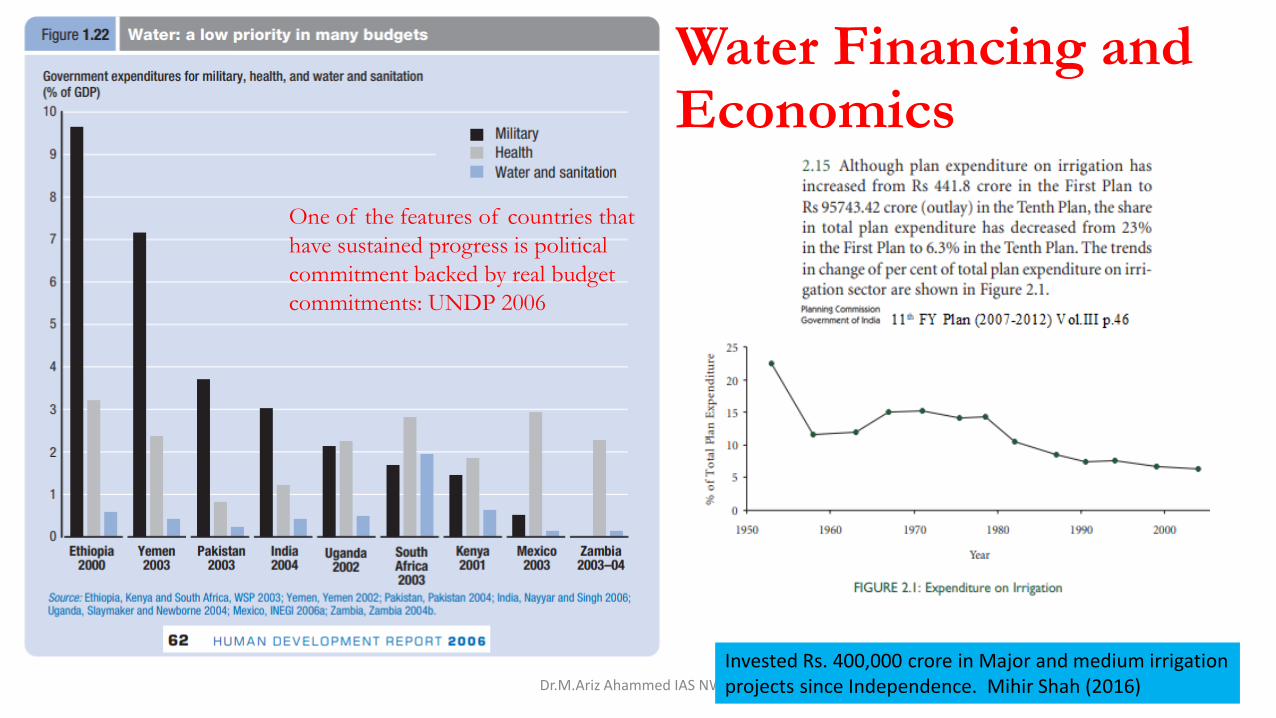
Water Financing and Economics
Dr.M.Ariz Ahammed IAS NWM
One of the features of countries that
have sustained progress is political
commitment backed by real budget
commitments: UNDP 2006
Invested Rs. 400,000 crore in Major and medium irrigation projects since Independence. Mihir Shah (2016)

Pareto principle: 80/20 rule
• For many events, roughly 80% of the effects come from 20% of the causes.
• Pareto noticed that 80% of Italy's land was owned by 20% of the population
Water Sector: Pareto 80/20
What constitutes 80% of each ofthe Sector/ component ?
Ex: Agriculture- Irrigated 87 M.ha
Rice, Wheat, Sugarcane, Cotton: 60 M.Ha
Dr.M.Ariz Ahammed IAS NWM

Dr.M.Ariz Ahammed IAS NWM

STATE / UT WATER BUDGET-ANNUAL EXERCISE
Challenge: Hydrological Unit vs Administrative Unit
Dr.M.Ariz Ahammed IAS NWM
Dr.M.Ariz Ahammed IAS NWM

Performance Mgt: Productivity
Dr.M.Ariz Ahammed IAS NWM
Demand side:
Water Productivity/
WUE
Specific Water Consumption
(Water required to produce a unit of
product)
And
Supply side Performance
Illustrative
Bench
Marking
District.1 District.2 District.3
Paddy 1 Tonne
Irrigated
200 TL 250 TL 500 TL 1000 TL
(Thousand
Litres)
Plant.1 Plant.2 Plant.3
Processed Milk
1 litre
1.5 m³ 1.5 m³ 2 m³ 3 m³
Farm.1 Farm.2 Farm.3
Poultry
100 Eggs
Thermal Power
1 MWh
Plant.1 Plant.2 Plant.3
0-2.5 m³ 2.5 m³ 5 m³ 10 m³
Steel
1 T of Crude Steel
Plant.1 Plant.2 Plant.3
5-20 m³ 5 20 30
TCS
% of total water consumption being met
from treated Waste Water
Zone.1 Zone.2 Zone.3
Reservoirs Performance

Dr.M.Ariz Ahammed IAS NWM
Dr.M.Ariz Ahammed IAS NWM

SWB: Envisioned Paradigm ShiftAs Usual Approach SWB Approach
Governance Compartmental Hydrological cycle-Multi-disciplinary
Department Multitude of Depts; No coordination Single Coordination Agency –Water Resources Department with enlarged mandate
Unit of Governance Varied Basin/ Sub-basin / Hydrologic unit
Focus Supply Oriented Equal emphasis on
1. Supply
2. Demand
3. Quality
4. Technology across-S,D & Q
Measurement Limited to
1. Rainfall
2. River Monitoring
3. GW Resource Assessment
4. DW Supply
All Components of
Supply, Demand, Quality
Transparency Opaque Transparent
Performance Mgt. No exercise Performance Mgt. of every component
Community participation Islands of success; No true empowerment True empowerment
Ground water Invisible Visible
Financing Supply & Crisis oriented Comprehensive
Economics Not developed Will develop
Consumption Vs. Availability Laissez faire approach Create organised conflict / Programmed Approach
Water Budget At local level in isolated areas by NGOs State level as an Annual exercise like that of Financial Budget
Empowerment & Accountability of
Stakeholders
Only at local level; Responsiveness? At all levels: Political executive/Bureaucracy, Farmers/Business/Industry/ Citizens
Strategy ChallengesState Water Budgeting-
Annually
like Financial Budgets
1. Govt.Will
2. Convergence
3. Measurement
4. Capacity building

Challenges
• Identification of Stakeholders• Convergence- Common
understanding• Single Identified Agency for
management• Measurement• Harmonising –Science
(Hydrology/Geology) and Administrative units
• Re-engineering of Governance
Way forward-Institutionalisation
•State Water Budgeting✓ As an Annual exercise
Way forward:Water Security, Safety & Sustainability
Dr.M.Ariz Ahammed IAS NWM

Water Security-Safety and Sustainability
1. Food Security2. Nutritional Security3. Health Security4. Energy Security5. Livelihoods6. Economy
Quality of LifeConstitutional Mandate- Right to life and Liberty
Dr.M.Ariz Ahammed IAS NWM

Reflection- Why State Water Budgeting:
Widely discussed bigger solutions to Nations’ Water Challenge
• Water- to make Union Subject or Concurrent Subject
• Water Pricing
• Common property / heritage / trust
• River Basin Organisation (RBO)
• Merger of CWC and CGWB
• 70 Years + Experience
• New NWM Offer
•State Water Budgeting✓ As an annual exercise
Features
• Evolving initiative
• Existing framework
• Support to States and Uts
• Empowerment and Engagement of Stakeholders
• Formulated involving
• State Governments
• 30 Central Ministries
• 60 National / Expert Institutions
• Industry Associations
• Civil Society
• Use of SWB: Intense communication for empowerment and engagement
Dr.M.Ariz Ahammed IAS NWM

Work in Progress
Dr.M.Ariz Ahammed IAS NWM

Role of Resource Persons / Participants
• To help NWM in State / UT level Workshops.• To sensitize political executive and civil servants on State Water
Budgeting- at all possible levels, based on facts.• To network and extend mentoring/ expertise.• To network with all Stakeholders in Water Sector.
• Communication- The exercise of undertaking State Water Budgeting-annually like that of Financial Budget at State / UT level.• Articles / Workshops / Seminars etc.• To make water -everybody’s responsibility• To build a national narrative

State / UT Specific Action Plan on Water
1. State Water Budgeting
2. Preparation of interim report on:1. Impact of Climate change on State.2. Alternative Interventions required to address each
of the issues/concerns identified in Status Report and Interim Report.
3. SSAP- Water 2050
Dr.M.Ariz Ahammed IAS NWM

Only by togetherwe can make a difference
Dr.M.Ariz Ahammed IAS NWM