Water Framework Directive (WFD) River Basin District ... Report/Background... · Water Framework...
18
Water Framework Directive (WFD) River Basin District Management Systems APPROACH TO DELINEATION OF GROUNDWATER BODIES Paper by the Working Group on Groundwater Guidance document no. GW2 This is a guidance paper on the Delineation of Groundwater Bodies. It documents the principles to be adopted by River Basin Districts and authorities responsible for implementing the Water Framework Directive in Ireland. REVISION CONTROL TABLE Status Approved by National Technical Co-ordination Group WFD Requirement Relevant EU Reporting Sheets Date Final March 2005 Characterisation GWB1 19 April 2003
-
Upload
nguyenkhanh -
Category
Documents
-
view
215 -
download
0
Transcript of Water Framework Directive (WFD) River Basin District ... Report/Background... · Water Framework...

Water Framework Directive (WFD) River Basin District Management Systems
APPROACH TO DELINEATION OF GROUNDWATER BODIES
Paper by the Working Group on Groundwater
Guidance document no. GW2 This is a guidance paper on the Delineation of Groundwater Bodies. It documents the principles to be adopted by River Basin Districts and authorities responsible for implementing the Water Framework Directive in Ireland.
REVISION CONTROL TABLE Status Approved by National Technical
Co-ordination Group WFD
Requirement Relevant EU Reporting Sheets Date
Final March 2005 Characterisation GWB1 19 April 2003

Contents
1. INTRODUCTION......................................................................................................................... 1 1.1 OVERVIEW ............................................................................................................................... 1 1.2 GROUNDWATER BODIES.......................................................................................................... 1
2. GROUNDWATER BODY DELINEATION METHODOLOGY ............................................ 1 2.1 STEP 1: AQUIFER DELINEATION AND DESCRIPTION................................................................ 1 2.2 STEP 2: PRELIMINARY GROUNDWATER BODY DELINEATION AND DESCRIPTION .................. 2 2.3 STEP 3: COMPLETION OF INITIAL CHARACTERISATION .......................................................... 3 2.4 STEP 4: DECIDE ON NEW MONITORING POINTS, INSTALL THEM WHERE NECESSARY AND COMMENCE MONITORING .................................................................................................................... 4 2.5 STEP 5: UNDERTAKE ‘FURTHER CHARACTERISATION’............................................................ 4
3. SUMMARY.................................................................................................................................... 4 4. MEMBERSHIP OF GROUNDWATER WORKING GROUP................................................ 4 5. REFERENCES .............................................................................................................................. 5 6. APPENDIX .................................................................................................................................... 6
Tables
TABLE A.1 INITIAL CHARACTERISATION – DESCRIPTIONS OF GROUNDWATER BODIES UNDERTAKEN BY GSI 8 TABLE A.2 INITIAL CHARACTERISATION – DESCRIPTIONS OF GWBS UNDERTAKEN BY CONSULTANTS 9 TABLE A.3 DUNGARVAN GWB: SUMMARY OF INITIAL CHARACTERISATION 10 TABLE A.4 CASTLEBRIDGE GWB: SUMMARY OF INITIAL CHARACTERISATION 12 TABLE A.5 KILMANAGH GRAVELS GWB: SUMMARY OF INITIAL CHARACTERISATION 15
i

Water Framework Directive Approach to Delineation of Groundwater Bodies
1. Introduction
1.1 Overview This document outlines the approach to delineating groundwater bodies that was agreed at the meeting of the Working Group on Groundwater (GW WG) on 22/10/2002. Section 4 lists the members of the Groundwater Working Group. The methodology was improved in the course of carrying out the delineation, which is recorded in the text. Examples of groundwater body descriptions are given in the tables in the Appendix.
1.2 Groundwater Bodies Groundwater bodies are discussed in Guidance Document GW1 “Technical Requirements for Groundwater and Related Aspects” (GW WG, 2001). The key aspect of the ‘groundwater body’ concept is that the groundwater body is the management unit under the WFD that is necessary for the subdivision of large geographical areas of aquifer in order for them to be effectively managed. The concept of ‘groundwater bodies’ embraces:
groundwater that can provide for the abstraction of significant quantities of water (i.e. the groundwater which can and should be managed to ensure sustainable, balanced and equitable water use); and
•
• groundwater which is in continuity with ecosystems and can place them at risk, either through the transmission of pollution or by unsustainable abstraction that reduces baseflows (i.e. the groundwater which can and should be managed to prevent environmental impacts on surface ecosystems).
2. Groundwater Body Delineation Methodology
2.1 Step 1: Aquifer Delineation and Description 1. Rock units1 were compiled for the country in approximate stratigraphical order.
Country-wide digital bedrock map with 1137 rock units prepared by GSI. 2. Rock units were grouped (e.g. pure limestones, impure limestones, Silurian metasediments, Old
Red Sandstones, Granites, etc.). The procedure for defining the rock unit groups is described in the Appendix, where all 27 rock unit groups are listed.
Groundwater Section in the GSI based aquifer delineation on 27 bedrock groups.
3. Hydrogeological data for each individual rock unit were compiled into holistic table.
1 Geologists commonly use the terms ‘Formation’ or ‘Member’ to describe stratigraphic units. The term ‘rock unit’ is used in this document so that it is more easily understandable by non-geologists.
page 1 of 16
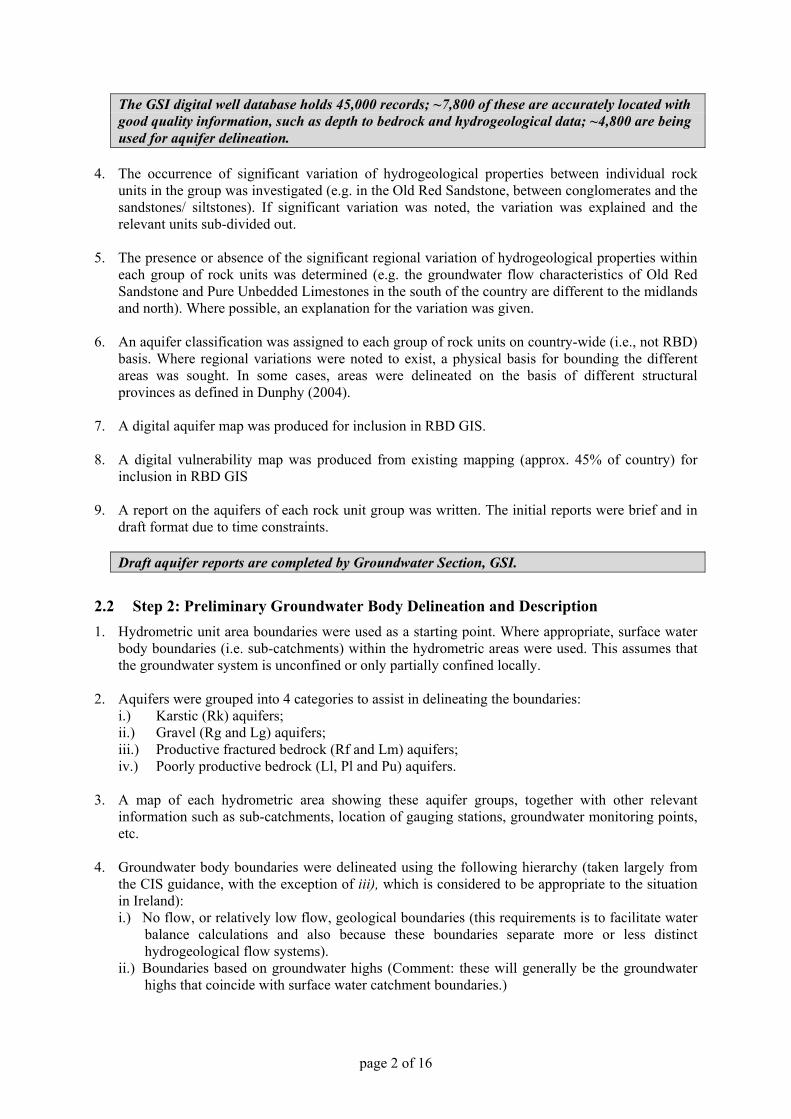
The GSI digital well database holds 45,000 records; ~7,800 of these are accurately located with good quality information, such as depth to bedrock and hydrogeological data; ~4,800 are being used for aquifer delineation.
4. The occurrence of significant variation of hydrogeological properties between individual rock
units in the group was investigated (e.g. in the Old Red Sandstone, between conglomerates and the sandstones/ siltstones). If significant variation was noted, the variation was explained and the relevant units sub-divided out.
5. The presence or absence of the significant regional variation of hydrogeological properties within
each group of rock units was determined (e.g. the groundwater flow characteristics of Old Red Sandstone and Pure Unbedded Limestones in the south of the country are different to the midlands and north). Where possible, an explanation for the variation was given.
6. An aquifer classification was assigned to each group of rock units on country-wide (i.e., not RBD)
basis. Where regional variations were noted to exist, a physical basis for bounding the different areas was sought. In some cases, areas were delineated on the basis of different structural provinces as defined in Dunphy (2004).
7. A digital aquifer map was produced for inclusion in RBD GIS. 8. A digital vulnerability map was produced from existing mapping (approx. 45% of country) for
inclusion in RBD GIS 9. A report on the aquifers of each rock unit group was written. The initial reports were brief and in
draft format due to time constraints. Draft aquifer reports are completed by Groundwater Section, GSI.
2.2 Step 2: Preliminary Groundwater Body Delineation and Description 1. Hydrometric unit area boundaries were used as a starting point. Where appropriate, surface water
body boundaries (i.e. sub-catchments) within the hydrometric areas were used. This assumes that the groundwater system is unconfined or only partially confined locally.
2. Aquifers were grouped into 4 categories to assist in delineating the boundaries:
i.) Karstic (Rk) aquifers; ii.) Gravel (Rg and Lg) aquifers; iii.) Productive fractured bedrock (Rf and Lm) aquifers; iv.) Poorly productive bedrock (Ll, Pl and Pu) aquifers.
3. A map of each hydrometric area showing these aquifer groups, together with other relevant information such as sub-catchments, location of gauging stations, groundwater monitoring points, etc.
4. Groundwater body boundaries were delineated using the following hierarchy (taken largely from
the CIS guidance, with the exception of iii), which is considered to be appropriate to the situation in Ireland): i.) No flow, or relatively low flow, geological boundaries (this requirements is to facilitate water
balance calculations and also because these boundaries separate more or less distinct hydrogeological flow systems).
ii.) Boundaries based on groundwater highs (Comment: these will generally be the groundwater highs that coincide with surface water catchment boundaries.)
page 2 of 16
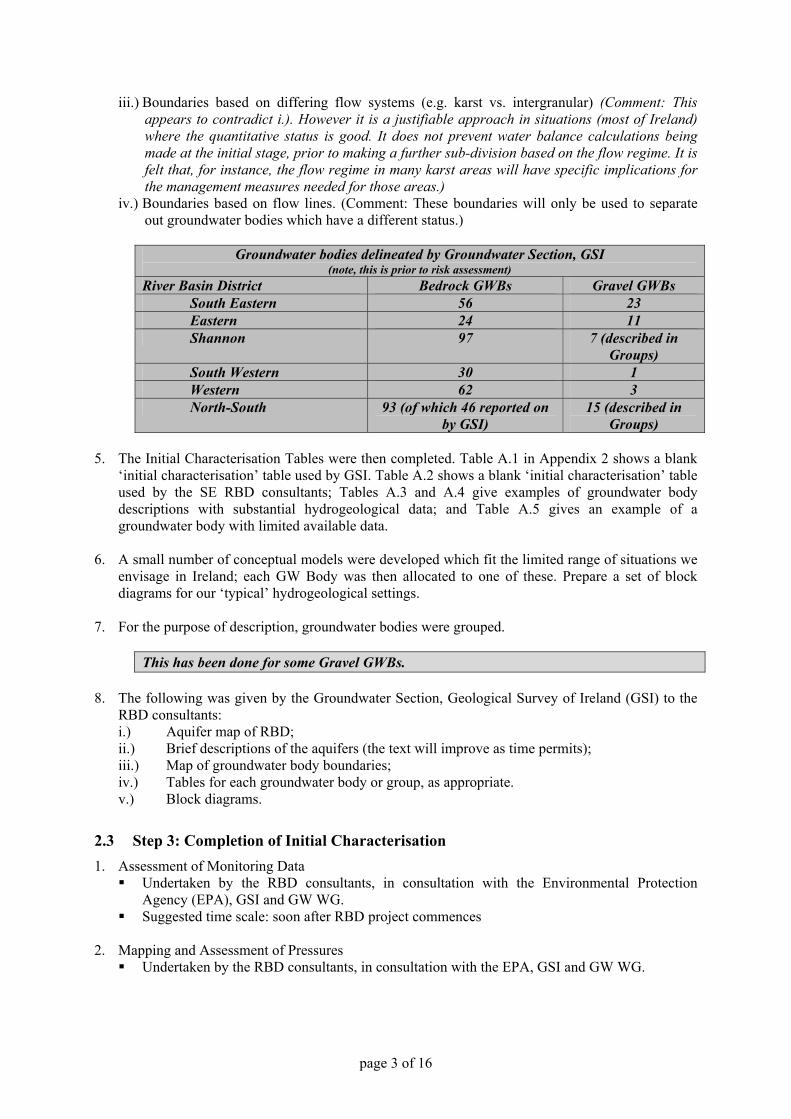
iii.) Boundaries based on differing flow systems (e.g. karst vs. intergranular) (Comment: This appears to contradict i.). However it is a justifiable approach in situations (most of Ireland) where the quantitative status is good. It does not prevent water balance calculations being made at the initial stage, prior to making a further sub-division based on the flow regime. It is felt that, for instance, the flow regime in many karst areas will have specific implications for the management measures needed for those areas.)
iv.) Boundaries based on flow lines. (Comment: These boundaries will only be used to separate out groundwater bodies which have a different status.)
Groundwater bodies delineated by Groundwater Section, GSI
(note, this is prior to risk assessment) River Basin District Bedrock GWBs Gravel GWBs
South Eastern 56 23 Eastern 24 11 Shannon 97 7 (described in
Groups) South Western 30 1 Western 62 3 North-South 93 (of which 46 reported on
by GSI) 15 (described in
Groups) 5. The Initial Characterisation Tables were then completed. Table A.1 in Appendix 2 shows a blank
‘initial characterisation’ table used by GSI. Table A.2 shows a blank ‘initial characterisation’ table used by the SE RBD consultants; Tables A.3 and A.4 give examples of groundwater body descriptions with substantial hydrogeological data; and Table A.5 gives an example of a groundwater body with limited available data.
6. A small number of conceptual models were developed which fit the limited range of situations we
envisage in Ireland; each GW Body was then allocated to one of these. Prepare a set of block diagrams for our ‘typical’ hydrogeological settings.
7. For the purpose of description, groundwater bodies were grouped.
This has been done for some Gravel GWBs. 8. The following was given by the Groundwater Section, Geological Survey of Ireland (GSI) to the
RBD consultants: i.) Aquifer map of RBD; ii.) Brief descriptions of the aquifers (the text will improve as time permits); iii.) Map of groundwater body boundaries; iv.) Tables for each groundwater body or group, as appropriate. v.) Block diagrams.
2.3 Step 3: Completion of Initial Characterisation 1. Assessment of Monitoring Data
Undertaken by the RBD consultants, in consultation with the Environmental Protection Agency (EPA), GSI and GW WG.
Suggested time scale: soon after RBD project commences 2. Mapping and Assessment of Pressures
Undertaken by the RBD consultants, in consultation with the EPA, GSI and GW WG.
page 3 of 16

3. ‘Extremely’ vulnerable areas delineated using depth to rock data supplied by GSI and subsoil map produced by Teagasc. Integrated with existing vulnerability maps. Undertaken by RBD consultants, in consultation with GSI.
4. Groundwater bodies examined in terms of ecosystems, pressures, trends and pollution risk.
Undertaken by consultant, in consultation with EPA, GSI and GW WG. 5. Water balances on groundwater bodies undertaken, to assess quantitative status and delineate
groundwater bodies potentially likely to be ‘at risk’. Undertaken by RBD consultants, in consultation with EPA, GSI and GW WG.
6. Chemical status assessed and groundwater bodies potentially likely to be ‘at risk’ delineated.
Undertaken by consultant, in consultation with EPA, GSI and GW WG.
(Comment: The recommended approach was to add to the initial characterisation table completed by Groundwater Section, GSI, with text under relevant headings, e.g. ‘water balance’, ‘quantitative status’, ‘qualitative status’, etc.)
2.4 Step 4: Decide on new monitoring points, install them where necessary and commence monitoring
This will be undertaken by the RBD consultants, in consultation with the EPA, GSI and GW WG. •
• •
2.5 Step 5: Undertake ‘further characterisation’ Delineate groundwater bodies ‘at risk’. To be undertaken by consultant, in consultation with EPA, GSI and GW WG.
3. Summary Sections 2.1 and 2.2 of this document summarise the methodology used for delineating groundwater bodies in Ireland. The methodology was developed by the GW WG, GSI and EPA, and undertaken by the Groundwater Section of the GSI. Completion of the Initial Characterisation, as described in Section 2.3, was undertaken by the RBD Consultants. Sections 2.4 and 2.5 are the logical extensions of the work-flow. However, as part of ‘Further Characterisation’, they have not yet been commenced.
4. Membership of Groundwater Working Group
Organisation Representative(s)
Geological Survey of Ireland (GSI) Donal Daly (Convenor) Geoff Wright Vincent Fitzsimons Coran Kelly Taly Hunter Williams Monica Lee
Camp Dresser McKee (CDM) Henning Moe
Compass Informatics Ltd. Paul Mills
Department of the Environment, Heritage and Local Government (DEHLG)
Pat Duggan Jim Ryan (NPWS) Aine O’Connor (NPWS)
page 4 of 16

Environment and Heritage Service/ Geological Survey of Northern Ireland (EHS/GSNI)
Peter McConvey
Environmental Protection Agency (EPA) Margaret Keegan Micheal McCarthaigh
Kirk McClure Morton (KMM) Grace Glasgow Kieran Fay
O’Callaghan Moran (OCM) Sean Moran Gerry Baker
O’Neill Groundwater Engineering (OGE) Shane O’Neill
Shannon Pilot River Basin – EPA/TCD Research Fellow Garrett Kilroy
Southeastern River Basin District (SERBD) Colin Byrne
Teagasc Karl Richards
Trinity College, Dublin (TCD) Paul Johnston Catherine Coxon
5. References Dunphy, R. (2004) The role of fracture systems in controlling groundwater yields in the post-Silurian rocks of Ireland. Final report to the GSI, 141 pp. Based on M. Res. Thesis, TCD.
Groundwater Working Group (2001) Guidance Document GW1. Water Framework Directive (WFD) River Basin District Management Systems: Technical Requirements for Groundwater and Related Aspects. Interim Report of Working Group on Groundwater, 32 pp.
page 5 of 16

6. Appendix
page 6 of 16

Appendix 1: Rock Unit Definition Methodology There are more than 1200 geological Formations and Members defined within the Republic. Their delineation is based on a variety of factors, many of which are of no relevance to the hydrogeological properties of the aquifer (for example, type of fossil). Groundwater Section have, therefore, evaluated these Formations and Members and have reduced them to 27 ‘Rock Unit Groups’.
We have defined the Rock Unit Groups within a stratigraphic framework on the basis of what we understand to be important differences between rock units/ rock unit groups in terms of groundwater flow properties (e.g., limestone purity and susceptibility to karstification; bedding presence or absence and it's influence on the prevalence of jointing, degree of deformation and its impact on flow properties (e.g., older rocks have been deformed many times since their formation, so lack pore spaces and connected fracture networks)).
The way in which we are undertaking the aquifer classification is on the basis of ‘Rock Unit Groups’ rather than the individual ‘rock units’ (Formations). Note that a particular Rock Unit Group can, and often does have, a different aquifer classification in different parts of the country (for example, the Dinantian Pure Unbedded Limestones aquifer classification ranges from Ll to Rkc and Rkd, depending upon location).
The 27 rock unit groups are as follows: 1. Permo-Triassic Sandstones 2. Permo-Triassic Mudstones and Gypsum 3. Westphalian Sandstones 4. Westphalian Shales 5. Namurian Shales 6. Namurian Sandstones 7. Namurian Undifferentiated 8. Dinantian Shales and Limestones 9. Dinantian Mixed Sandstones, Shales and Limestones 10. Dinantian Sandstones 11. Dinantian Pure Bedded Limestones 12. Dinantian Upper Impure Limestones 13. Dinantian Dolomitised Limestones 14. Dinantian Pure Unbedded Limestones 15. Dinantian Lower Impure Limestones 16. Dinantian (early) Sandstones, Shales and Limestones 17. Dinantian Mudstones and Sandstones (Cork Group) 18. Devonian Kiltorcan-type Sandstones 19. Devonian Old Red Sandstones 20. Silurian Metasediments and Volcanics 21. Ordovician Metasediments 22. Ordovician Volcanics 23. Cambrian Metasediments 24. Precambrian Quartzites, Gneisses & Schists 25. Precambrian Marbles 26. Granites & other Igneous Intrusive rocks 27. Basalts & other Volcanic rocks There is also an ‘unclassified’ class for areas of the map where the geology is undefined.
page 7 of 16

Table A.1 Initial Characterisation – Descriptions of Groundwater Bodies undertaken by GSI
Hydrometric Area Local Authority
Associated surface water bodies
Associated terrestrial ecosystems Area (km2)
Topography
Aquifer categories
Main aquifer lithologies
Key structures. Key properties
Geo
logy
and
Aqu
ifers
Thickness Lithologies
Thickness % area aquifer near surface
Ove
rlyi
ng S
trat
a
Vulnerability
Main recharge mechanisms
Rec
harg
e
Est. recharge rates
[Information will be added at a later date]
Large springs and known abstractions (m3/d)
Main discharge mechanisms
Dis
char
ge
Hydrochemical Signature
Groundwater Flow Paths
Groundwater & surface water interactions
Con
cept
ual
mod
el
Attachments Instrumentation Stream gauge:
Borehole Hydrograph: none EPA Representative Monitoring boreholes:
Information Sources
Disclaimer Note that all calculations and interpretations presented in this report represent estimations based on the information sources described above and established hydrogeological formulae
page 8 of 16
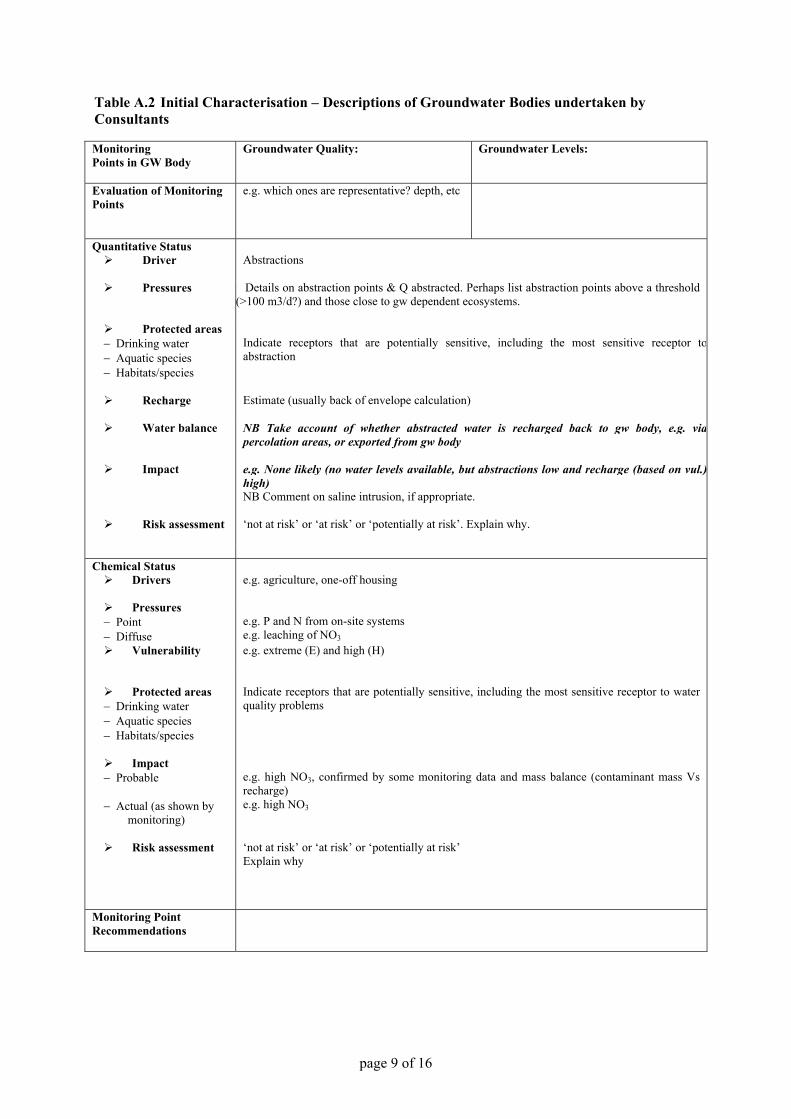
Table A.2 Initial Characterisation – Descriptions of Groundwater Bodies undertaken by Consultants Monitoring Points in GW Body
Groundwater Quality: Groundwater Levels:
Evaluation of Monitoring Points
e.g. which ones are representative? depth, etc
Quantitative Status Driver
Abstractions
Pressures
Details on abstraction points & Q abstracted. Perhaps list abstraction points above a threshold (>100 m3/d?) and those close to gw dependent ecosystems.
Protected areas
− Drinking water − Aquatic species − Habitats/species
Indicate receptors that are potentially sensitive, including the most sensitive receptor toabstraction
Recharge
Estimate (usually back of envelope calculation)
Water balance NB Take account of whether abstracted water is recharged back to gw body, e.g. viapercolation areas, or exported from gw body
Impact
e.g. None likely (no water levels available, but abstractions low and recharge (based on vul.)high) NB Comment on saline intrusion, if appropriate.
Risk assessment
‘not at risk’ or ‘at risk’ or ‘potentially at risk’. Explain why.
Chemical Status Drivers
e.g. agriculture, one-off housing
Pressures − Point − Diffuse
e.g. P and N from on-site systems e.g. leaching of NO3
Vulnerability
e.g. extreme (E) and high (H)
Protected areas
− Drinking water − Aquatic species − Habitats/species
Indicate receptors that are potentially sensitive, including the most sensitive receptor to water quality problems
Impact − Probable − Actual (as shown by
monitoring)
e.g. high NO3, confirmed by some monitoring data and mass balance (contaminant mass Vs recharge) e.g. high NO3
Risk assessment
‘not at risk’ or ‘at risk’ or ‘potentially at risk’ Explain why
Monitoring Point Recommendations
page 9 of 16

Table A.3 Dungarvan GWB: Summary of Initial Characterisation.
Hydrometric Area Local Authority
Associated surface water bodies
Associated terrestrial ecosystems Area (km2)
17 – Coastal Area Waterford Co Co
Brickey, Colligan Dungarvan Harbour 46.4
Top
ogra
phy Dungarvan is located in a broad east-west trending steep sided valley. The valley floor descends at a very low gradient from west to
east to the sea at Dungarvan. The highest elevations in this body are about 40m OD. In general drainage density is very low in the limestone valley. The soils and subsoils are relatively free draining. The land is grassland dominated and is largely used for grazing. There is little tillage in the area.
Aquifer categories
Rk: Regionally Important Karstified Aquifer. There is a small lens of poorer aquifer contained within this body.
Main aquifer lithologies
WA: Waulsortian Limestone - Massive unbedded limestone. BA : Ballysteen Limestone - Dark-grey fossiliferous shaly limestone
Key structures. Lismore-Dungarvan syncline: Folding during the Variscan mountain building event has deformed the rocks around Dungarvan, compressing them from north and south to produce an east-west trend to the current rock distribution and ultimately to the topography of the Dungarvan area. Commonly associated with folding is jointing and faulting – there are several faults to the north of Dungarvan which have a north-south trend.
Key properties Transmissivity estimated in the area of the supply boreholes at Dungarvan is 900 - 13,000 m2/d. The central area of the syncline has a higher permeability (15-180 m/d) than the limestones to the north and south (15-70 m/d). This is attributed to a higher degree of fracturing and faulting associated with a minor anticlinal axis. It is estimated that storage in these aquifers can be as high as 5%, but as low as 1% at depth. The effective porosity of the Waulsortian Limestone is estimated to be 2.5% and about 1% for the Ballysteen Limestone.
Geo
logy
and
Aqu
ifers
Thickness The majority of groundwater flow occurs in the top 30-40 metres of the limestones. Lithologies Sandy limestone-derived tills are the most extensive deposits in the Dungarvan area. They are best observed in
ditches and field cuttings, and contain small limestone and sandstone clasts. The matrix is predominately sandy but also contains some silt and clay.
Thickness Quaternary mapping in the general area suggests that the sandy till is often greater than 10m thick in the valley floor.
% area aquifer near surface
Ove
rlyi
ng S
trat
a
Vulnerability The sandy tills are considered moderately permeable and range from 0->10 m thickness in the valley floor which leads to a variable vulnerability. Areas of HIGH vulnerability bound this to the north and south.
Main recharge mechanisms
Recharge to the limestone synclines is likely to be increased as a result of surface water running off the surrounding less permeable and topographically higher Old Red Sandstone rocks onto the more permeable limestones. The sandy till probably allows significant recharge in most areas.
Rec
harg
e
Est. recharge rates
[Recharge estimates will be added at a later date] Average annual rainfall - 1112 mm, Effective Rainfall - 647 mm, Recharge - 582 mm
Large springs and known abstractions
The public supply at Ballynamuck is capable of producing at least 7300 m³/d; the largest recorded well yield in the Republic of Ireland. Current abstraction is approximately ??m3/d.
Main discharge mechanisms
Groundwater generally discharges in a narrow zone along major rivers; this may be in the form of general baseflow, via springs or through sand and gravels that are in continuity with the rivers. Significant quantities of groundwater from the limestones of the Lismore-Dungarvan syncline are believed to discharge into the Blackwater, Brickley, and lower Finisk and Colligan Rivers in addition to Dungarvan Harbour. D
isch
arge
Hydrochemical Signature
Moderately hard (212 - 244 mg/l CaCO3). Conductivities are in the range of 471 - 512 µS/cm. Chloride levels are slightly elevated, probably due to proximity to the sea. The groundwater has a Calcium Bicarbonate signature, which implies a relatively rapid flow system. The bedrock strata are Calcareous.
Groundwater Flow Paths
The upper weathered and fractured zone of bedrock acts as a zone of high permeability; large fissures or karstic conduits are often present within the bedrock, through which a large proportion of groundwater flow takes place; and where sand and gravel is present above the bedrock (e.g. at Ballynamuck), increased groundwater storage will be available to the well. The groundwater gradient is flatter in the more permeable limestone (0.0015) and flow direction in the vicinity of Ballynamuck is eastward toward the sea. A groundwater divide is present to the west of the public supply well in the Whitechurch area. Water to the west of the divide flows toward the River Blackwater and water to the east flows toward Dungarvan Harbour.
page 10 of 16

Groundwater and Surface water interactions.
The large abstractions at Dungarvan may have caused some saline intrusion from the Harbour. Drainage density in this area is quite low.
Con
cept
ual
mod
el
This groundwater body is defined to the north and south by the extent of the Waulsortian Limestone near Dungarvan. To the east the boundary is defined by the coast and to the west by the catchment divide between the SERBD and SWRBD. The limestone is unconfined, with the water table generally less than 10 metres below the surface and with an average annual fluctuation of 5 metres. Permeability is entirely secondary, as a result of faulting, dolomitisation and karstification. However at Ballynamuck, the static water level lies within an upper alluvial unit, which semi-confines the groundwater at the well site. Groundwater flow is in large conduits. Substantial recharge comes from north and south sides of the valley, enters the limestone at the geological contact and travels underground until it discharges at Dungarvan Harbour.
Attachments (Figure 1) Durov plot Instrumentation Stream gauge: 17010, 17007
Borehole Hydrograph: none EPA Representative Monitoring boreholes: Dungarvan WS (2 boreholes) (#41 - X236948)
Information Sources
Hudson M., Daly D., Duffy S., & Johnston P., 1997. County Waterford Groundwater Protection Scheme. Cronin C., Daly D., Meehan R. & Johnston P (1997) Dungarvan Public Supply Groundwater Source Protection Zones.
Disclaimer Note that all calculations and interpretations presented in this report represent estimations based on the information sources described above and established hydrogeological formulae
page 11 of 16
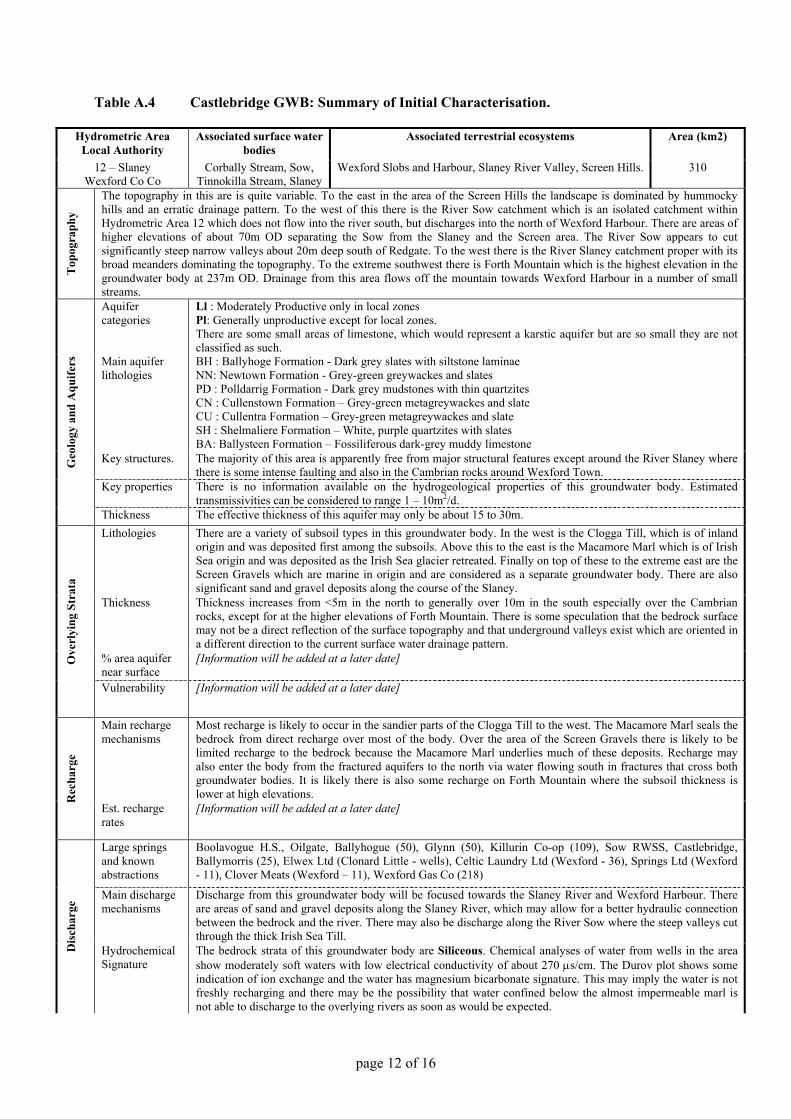
Table A.4 Castlebridge GWB: Summary of Initial Characterisation.
Hydrometric Area Local Authority
Associated surface water bodies
Associated terrestrial ecosystems Area (km2)
12 – Slaney Wexford Co Co
Corbally Stream, Sow, Tinnokilla Stream, Slaney
Wexford Slobs and Harbour, Slaney River Valley, Screen Hills. 310
Top
ogra
phy
The topography in this are is quite variable. To the east in the area of the Screen Hills the landscape is dominated by hummocky hills and an erratic drainage pattern. To the west of this there is the River Sow catchment which is an isolated catchment within Hydrometric Area 12 which does not flow into the river south, but discharges into the north of Wexford Harbour. There are areas of higher elevations of about 70m OD separating the Sow from the Slaney and the Screen area. The River Sow appears to cut significantly steep narrow valleys about 20m deep south of Redgate. To the west there is the River Slaney catchment proper with its broad meanders dominating the topography. To the extreme southwest there is Forth Mountain which is the highest elevation in the groundwater body at 237m OD. Drainage from this area flows off the mountain towards Wexford Harbour in a number of small streams. Aquifer categories
Ll : Moderately Productive only in local zones Pl: Generally unproductive except for local zones. There are some small areas of limestone, which would represent a karstic aquifer but are so small they are not classified as such.
Main aquifer lithologies
BH : Ballyhoge Formation - Dark grey slates with siltstone laminae NN: Newtown Formation - Grey-green greywackes and slates PD : Polldarrig Formation - Dark grey mudstones with thin quartzites CN : Cullenstown Formation – Grey-green metagreywackes and slate CU : Cullentra Formation – Grey-green metagreywackes and slate SH : Shelmaliere Formation – White, purple quartzites with slates BA: Ballysteen Formation – Fossiliferous dark-grey muddy limestone
Key structures. The majority of this area is apparently free from major structural features except around the River Slaney where there is some intense faulting and also in the Cambrian rocks around Wexford Town.
Key properties There is no information available on the hydrogeological properties of this groundwater body. Estimated transmissivities can be considered to range 1 – 10m2/d.
Geo
logy
and
Aqu
ifers
Thickness The effective thickness of this aquifer may only be about 15 to 30m. Lithologies There are a variety of subsoil types in this groundwater body. In the west is the Clogga Till, which is of inland
origin and was deposited first among the subsoils. Above this to the east is the Macamore Marl which is of Irish Sea origin and was deposited as the Irish Sea glacier retreated. Finally on top of these to the extreme east are the Screen Gravels which are marine in origin and are considered as a separate groundwater body. There are also significant sand and gravel deposits along the course of the Slaney.
Thickness Thickness increases from <5m in the north to generally over 10m in the south especially over the Cambrian rocks, except for at the higher elevations of Forth Mountain. There is some speculation that the bedrock surface may not be a direct reflection of the surface topography and that underground valleys exist which are oriented in a different direction to the current surface water drainage pattern.
% area aquifer near surface
[Information will be added at a later date] Ove
rlyi
ng S
trat
a
Vulnerability [Information will be added at a later date]
Main recharge mechanisms
Most recharge is likely to occur in the sandier parts of the Clogga Till to the west. The Macamore Marl seals the bedrock from direct recharge over most of the body. Over the area of the Screen Gravels there is likely to be limited recharge to the bedrock because the Macamore Marl underlies much of these deposits. Recharge may also enter the body from the fractured aquifers to the north via water flowing south in fractures that cross both groundwater bodies. It is likely there is also some recharge on Forth Mountain where the subsoil thickness is lower at high elevations. R
echa
rge
Est. recharge rates
[Information will be added at a later date]
Large springs and known abstractions
Boolavogue H.S., Oilgate, Ballyhogue (50), Glynn (50), Killurin Co-op (109), Sow RWSS, Castlebridge, Ballymorris (25), Elwex Ltd (Clonard Little - wells), Celtic Laundry Ltd (Wexford - 36), Springs Ltd (Wexford - 11), Clover Meats (Wexford – 11), Wexford Gas Co (218)
Main discharge mechanisms
Discharge from this groundwater body will be focused towards the Slaney River and Wexford Harbour. There are areas of sand and gravel deposits along the Slaney River, which may allow for a better hydraulic connection between the bedrock and the river. There may also be discharge along the River Sow where the steep valleys cut through the thick Irish Sea Till.
Dis
char
ge
Hydrochemical Signature
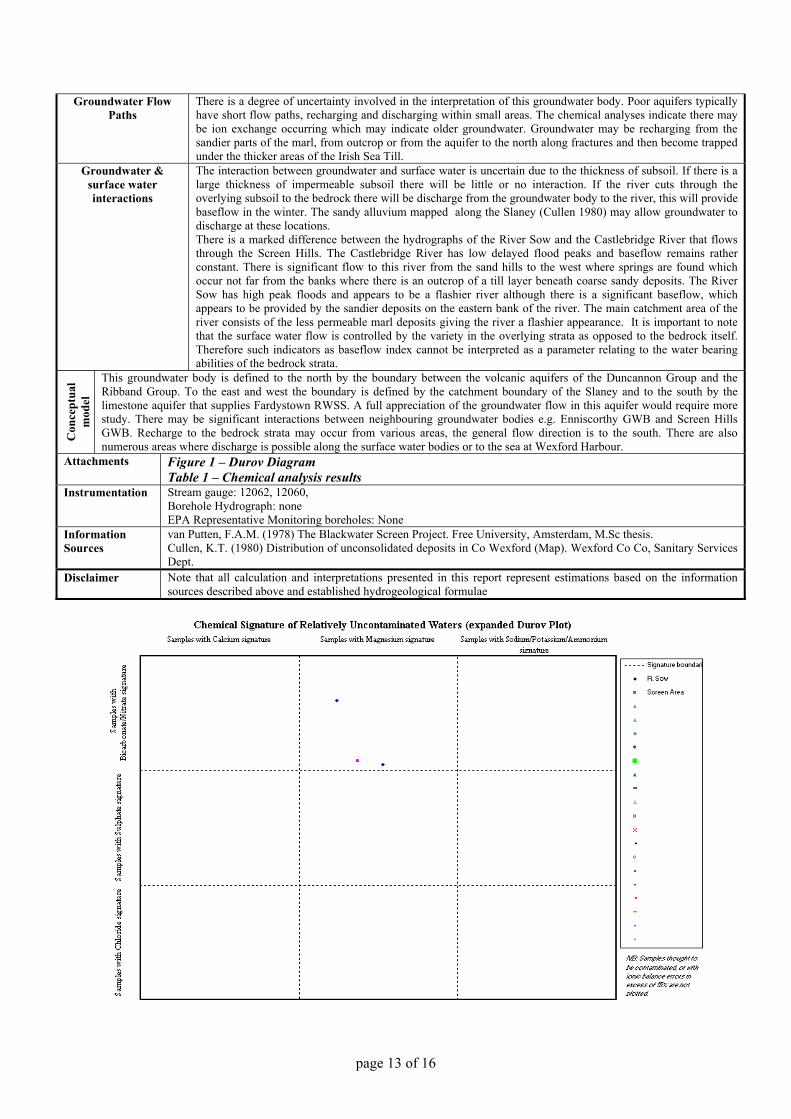
The bedrock strata of this groundwater body are Siliceous. Chemical analyses of water from wells in the area show moderately soft waters with low electrical conductivity of about 270 µs/cm. The Durov plot shows some indication of ion exchange and the water has magnesium bicarbonate signature. This may imply the water is not freshly recharging and there may be the possibility that water confined below the almost impermeable marl is not able to discharge to the overlying rivers as soon as would be expected.
page 12 of 16
Groundwater Flow Paths
There is a degree of uncertainty involved in the interpretation of this groundwater body. Poor aquifers typically have short flow paths, recharging and discharging within small areas. The chemical analyses indicate there may be ion exchange occurring which may indicate older groundwater. Groundwater may be recharging from the sandier parts of the marl, from outcrop or from the aquifer to the north along fractures and then become trapped under the thicker areas of the Irish Sea Till.
Groundwater & surface water interactions
The interaction between groundwater and surface water is uncertain due to the thickness of subsoil. If there is a large thickness of impermeable subsoil there will be little or no interaction. If the river cuts through the overlying subsoil to the bedrock there will be discharge from the groundwater body to the river, this will provide baseflow in the winter. The sandy alluvium mapped along the Slaney (Cullen 1980) may allow groundwater to discharge at these locations. There is a marked difference between the hydrographs of the River Sow and the Castlebridge River that flows through the Screen Hills. The Castlebridge River has low delayed flood peaks and baseflow remains rather constant. There is significant flow to this river from the sand hills to the west where springs are found which occur not far from the banks where there is an outcrop of a till layer beneath coarse sandy deposits. The River Sow has high peak floods and appears to be a flashier river although there is a significant baseflow, which appears to be provided by the sandier deposits on the eastern bank of the river. The main catchment area of the river consists of the less permeable marl deposits giving the river a flashier appearance. It is important to note that the surface water flow is controlled by the variety in the overlying strata as opposed to the bedrock itself. Therefore such indicators as baseflow index cannot be interpreted as a parameter relating to the water bearing abilities of the bedrock strata.
Con
cept
ual
mod
el
This groundwater body is defined to the north by the boundary between the volcanic aquifers of the Duncannon Group and the Ribband Group. To the east and west the boundary is defined by the catchment boundary of the Slaney and to the south by the limestone aquifer that supplies Fardystown RWSS. A full appreciation of the groundwater flow in this aquifer would require more study. There may be significant interactions between neighbouring groundwater bodies e.g. Enniscorthy GWB and Screen Hills GWB. Recharge to the bedrock strata may occur from various areas, the general flow direction is to the south. There are also numerous areas where discharge is possible along the surface water bodies or to the sea at Wexford Harbour.
Attachments Figure 1 – Durov Diagram Table 1 – Chemical analysis results
Instrumentation Stream gauge: 12062, 12060, Borehole Hydrograph: none EPA Representative Monitoring boreholes: None
Information Sources
van Putten, F.A.M. (1978) The Blackwater Screen Project. Free University, Amsterdam, M.Sc thesis. Cullen, K.T. (1980) Distribution of unconsolidated deposits in Co Wexford (Map). Wexford Co Co, Sanitary Services Dept.
Disclaimer Note that all calculation and interpretations presented in this report represent estimations based on the information sources described above and established hydrogeological formulae
page 13 of 16

Table 1 - Chemical Data for the R. Sow and Screen Area (Van Putten 1978)
Location T.D.S pH E.C. Fe Na Ca Mg Al K NH+4 HCO-
3 Cl- SO-4 PO-
4 NO-3
R. Sow
199
7.8 235 0.2 17.73 26 5.0 1.19 2.27 0.18 106 21.1 8 0.06 12
R. Sow 120
6.9 173 0.36 15.29 11 6.1 0.07 0.94 0.2 34 29.8 7 0.00 15.8
Screen Area
288 7.6 395 0.61 33.34 41 6.3 0.18 6.8 0.3 100 66.3 20 0.02 13.8
page 14 of 16

Table A.5 Kilmanagh Gravels GWB: Summary of Initial Characterisation.
Hydrometric Area Local Authority
Associated surface water bodies Associated terrestrial ecosystems
Area (km2)
Kings River Co. Kilkenny
King's River None 30 km2
Top
ogra
phy This body lies within the valley of the Kilmanagh River, extending 10km southwards from Tullaroan to Callan. The highest point
lies north of Tullaroan at 150 m OD. The lowest point lies south of Callan at 70m OD. Slopes are very low along the valley floor (typically 0.001 to 0.002). Away from the main river channels, the natural land drainage is moderate to good to the north of Kilmanagh, but very poor to the south.
Aquifer categories
Rg: Regionally important gravel aquifer. The portion (10 km2) north of Kilmanagh is generally unconfined. The remainder is confined.
Main aquifer lithologies
SAND & GRAVEL (Glacial outwash). Clays and silts are more common within the confined portion south of Kilmanagh. The underlying bedrock is mostly limestone and dolomite of other groundwater bodies. The dolomite is thought to contribute groundwater to the Sand and Gravel near the junction of the Munster and Kings Rivers near Callan.
Key structures. Bedrock dips upgradient below the Body, hindering significant flow within the uppermost bedrock. Deep faults occur in the limestone area and allow deeper groundwaters in the dolomite aquifer to flow up into the Sand & Gravel aquifer in this area.
Key properties Transmissivity 200 to 250 m2/day. Porosity 0.1 to 0.25 Geo
logy
and
Aqu
ifers
Thickness Saturated thickness typically 5 to 10m.
Lithologies Glacial till. Moderate to low permeability gravelly SILTS and CLAYS.
Thickness Typically less than 1m north of Kilmanagh to 3m - 5m near Callan. % area aquifer near surface
33% (comprising the unconfined portion north of Kilmanagh)
Ove
rlyi
ng S
trat
a
Vulnerability Typically HIGH. Some extreme is mapped along the course of the Kilmanagh River.
Main recharge mechanisms
Rainfall recharge in unconfined portion. Kilmanagh river recharges the unconfined portion at times of lower water table. The river course is dry in certain years just upstream of Kilmanagh. Upwelling from dolomite aquifer in southern portion.
Rec
harg
e
Est. recharge rates
[Recharge Estimates will be added at a later date] 430 mm in unconfined portion (est. effective rainfall 540 mm). Inputs from dolomite and sinking Kilmanagh River are not estimated.
Springs and large known abstractions
Kilmanagh and Tullaroan group schemes (est. combined discharge 800 m3/day). Callan public water supply spring (est. total flow 1440 m3/day) Several warm springs near junction of the Munster and Kings Rivers (est. combined flow 1000 m3/day). Oldtown, Lakyle Cross,
Main discharge mechanisms
Most discharge is to the Callan public water supply spring and the warm springs nearby. Some discharge to the Kilmanagh River upstream of Kilmanagh and to the Kings River near Callan. Low flows at Callan are very low (specific dry weather flow of 0.1 litres/sec/km2) suggesting that the overall groundwater component of flow is also low. D
isch
arge
Hydrochemical signature
The waters of this gravel body are “Hard” and have an average electrical conductivity of around 651 (µs/cm). The chemical is regarded as Calcium-Bicarbonate and it is therefore likely that the gravels are mostly Calcareous.
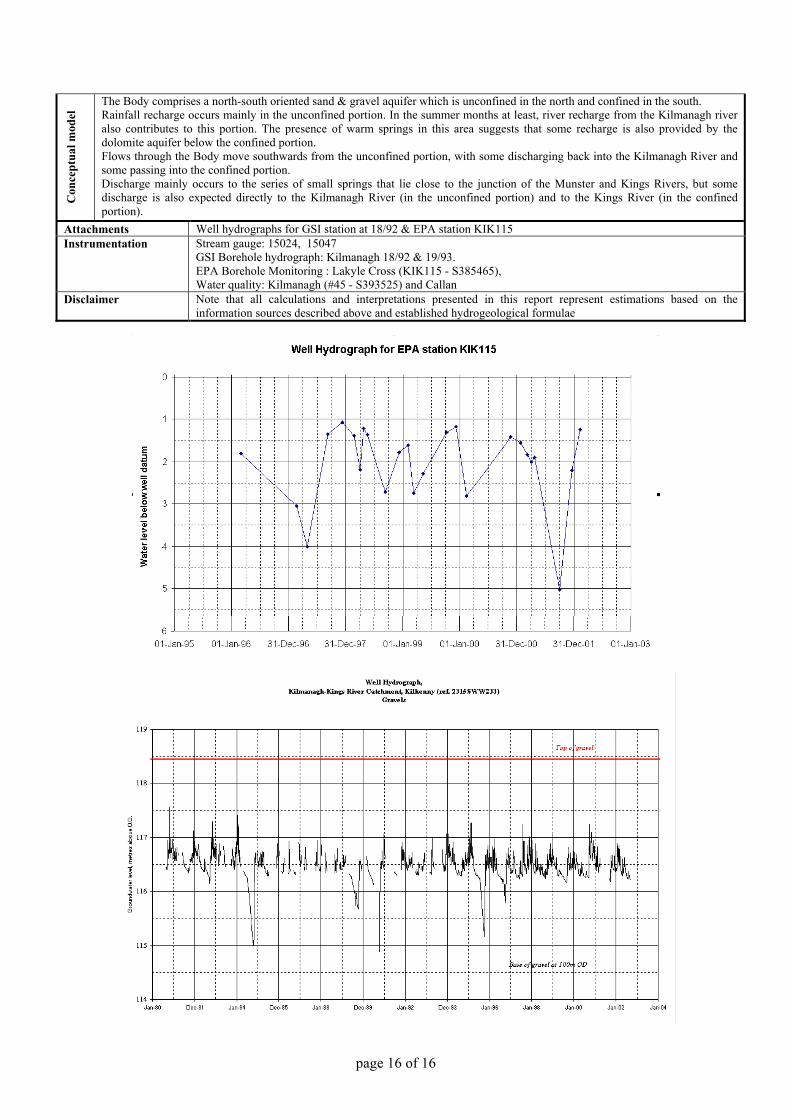
Groundwater Flow Paths
Figure X: No annual trends are apparent. Occasional sharp drops are observed, coinciding with periods when the Kilmanagh River has dried-up. This suggests that, in most summers, river recharge supports groundwater levels in the unconfined portion of the Body.
Groundwater and Surface water interactions
Abstractions in unconfined portion likely to return waters to the body.
page 15 of 16
page 16 of 16
Con
cept
ual m
odel
The Body comprises a north-south oriented sand & gravel aquifer which is unconfined in the north and confined in the south. Rainfall recharge occurs mainly in the unconfined portion. In the summer months at least, river recharge from the Kilmanagh river also contributes to this portion. The presence of warm springs in this area suggests that some recharge is also provided by the dolomite aquifer below the confined portion. Flows through the Body move southwards from the unconfined portion, with some discharging back into the Kilmanagh River and some passing into the confined portion. Discharge mainly occurs to the series of small springs that lie close to the junction of the Munster and Kings Rivers, but some discharge is also expected directly to the Kilmanagh River (in the unconfined portion) and to the Kings River (in the confined portion).
Attachments Well hydrographs for GSI station at 18/92 & EPA station KIK115 Instrumentation Stream gauge: 15024, 15047
GSI Borehole hydrograph: Kilmanagh 18/92 & 19/93. EPA Borehole Monitoring : Lakyle Cross (KIK115 - S385465), Water quality: Kilmanagh (#45 - S393525) and Callan
Disclaimer Note that all calculations and interpretations presented in this report represent estimations based on the information sources described above and established hydrogeological formulae