
Water, Energy and Food Nexus in Egypt - Nexus Country Profiles
8
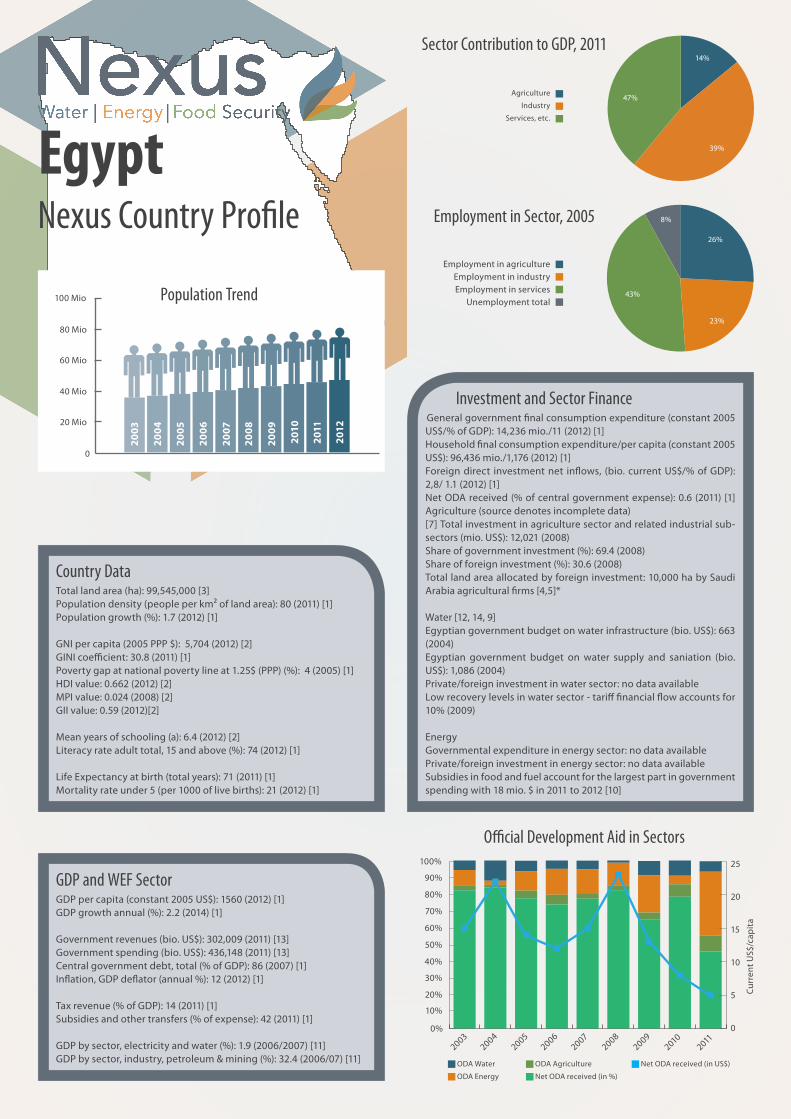
Egypt Nexus Country Profile Country Data Total land area (ha): 99,545,000 [3] Population density (people per km² of land area): 80 (2011) [1] Population growth (%): 1.7 (2012) [1] GNI per capita (2005 PPP $): 5,704 (2012) [2] GINI coefficient: 30.8 (2011) [1] Poverty gap at national poverty line at 1.25$ (PPP) (%): 4 (2005) [1] HDI value: 0.662 (2012) [2] MPI value: 0.024 (2008) [2] GII value: 0.59 (2012)[2] Mean years of schooling (a): 6.4 (2012) [2] Literacy rate adult total, 15 and above (%): 74 (2012) [1] Life Expectancy at birth (total years): 71 (2011) [1] Mortality rate under 5 (per 1000 of live births): 21 (2012) [1] Investment and Sector Finance General government final consumption expenditure (constant 2005 US$/% of GDP): 14,236 mio./11 (2012) [1] Household final consumption expenditure/per capita (constant 2005 US$): 96,436 mio./1,176 (2012) [1] Foreign direct investment net inflows, (bio. current US$/% of GDP): 2,8/ 1.1 (2012) [1] Net ODA received (% of central government expense): 0.6 (2011) [1] Agriculture (source denotes incomplete data) [7] Total investment in agriculture sector and related industrial sub- sectors (mio. US$): 12,021 (2008) Share of government investment (%): 69.4 (2008) Share of foreign investment (%): 30.6 (2008) Total land area allocated by foreign investment: 10,000 ha by Saudi Arabia agricultural firms [4,5]* Water [12, 14, 9] Egyptian government budget on water infrastructure (bio. US$): 663 (2004) Egyptian government budget on water supply and saniation (bio. US$): 1,086 (2004) Private/foreign investment in water sector: no data available Low recovery levels in water sector - tariff financial flow accounts for 10% (2009) Energy Governmental expenditure in energy sector: no data available Private/foreign investment in energy sector: no data available Subsidies in food and fuel account for the largest part in government spending with 18 mio. $ in 2011 to 2012 [10] GDP and WEF Sector GDP per capita (constant 2005 US$): 1560 (2012) [1] GDP growth annual (%): 2.2 (2014) [1] Government revenues (bio. US$): 302,009 (2011) [13] Government spending (bio. US$): 436,148 (2011) [13] Central government debt, total (% of GDP): 86 (2007) [1] Inflation, GDP deflator (annual %): 12 (2012) [1] Tax revenue (% of GDP): 14 (2011) [1] Subsidies and other transfers (% of expense): 42 (2011) [1] GDP by sector, electricity and water (%): 1.9 (2006/2007) [11] GDP by sector, industry, petroleum & mining (%): 32.4 (2006/07) [11] Employment in agriculture Employment in industry Employment in services Unemployment total 26% 8% 43% 23% ODA Water ODA Energy ODA Agriculture Net ODA received (in %) Net ODA received (in US$) 47% 39% 14% Agriculture Industry Services, etc. Sector Contribution to GDP, 2011 Employment in Sector, 2005 Official Development Aid in Sectors Population Trend 100 Mio 80 Mio 60 Mio 40 Mio 20 Mio 0 2003 2004 2005 2006 2007 2008 2009 2010 2011 2012 Current US$/capita 0 5 10 15 20 25 0% 10% 20% 30% 40% 50% 60% 90% 70% 80% 100% 2004 2005 2006 2007 2008 2009 2010 2003 2011
-
Upload
mohammad-al-saidi -
Category
Science
-
view
38 -
download
1
Transcript of Water, Energy and Food Nexus in Egypt - Nexus Country Profiles
EgyptNexus Country Profile
Country DataTotal land area (ha): 99,545,000 [3]Population density (people per km² of land area): 80 (2011) [1]Population growth (%): 1.7 (2012) [1]
GNI per capita (2005 PPP $): 5,704 (2012) [2]GINI coefficient: 30.8 (2011) [1]Poverty gap at national poverty line at 1.25$ (PPP) (%): 4 (2005) [1]HDI value: 0.662 (2012) [2]MPI value: 0.024 (2008) [2]GII value: 0.59 (2012)[2]
Mean years of schooling (a): 6.4 (2012) [2]Literacy rate adult total, 15 and above (%): 74 (2012) [1]
Life Expectancy at birth (total years): 71 (2011) [1]Mortality rate under 5 (per 1000 of live births): 21 (2012) [1]
Investment and Sector FinanceGeneral government final consumption expenditure (constant 2005 US$/% of GDP): 14,236 mio./11 (2012) [1]Household final consumption expenditure/per capita (constant 2005 US$): 96,436 mio./1,176 (2012) [1]Foreign direct investment net inflows, (bio. current US$/% of GDP): 2,8/ 1.1 (2012) [1]Net ODA received (% of central government expense): 0.6 (2011) [1]Agriculture (source denotes incomplete data)[7] Total investment in agriculture sector and related industrial sub-sectors (mio. US$): 12,021 (2008)Share of government investment (%): 69.4 (2008)Share of foreign investment (%): 30.6 (2008)Total land area allocated by foreign investment: 10,000 ha by Saudi Arabia agricultural firms [4,5]*
Water [12, 14, 9]Egyptian government budget on water infrastructure (bio. US$): 663 (2004) Egyptian government budget on water supply and saniation (bio. US$): 1,086 (2004)Private/foreign investment in water sector: no data availableLow recovery levels in water sector - tariff financial flow accounts for 10% (2009)
EnergyGovernmental expenditure in energy sector: no data availablePrivate/foreign investment in energy sector: no data availableSubsidies in food and fuel account for the largest part in government spending with 18 mio. $ in 2011 to 2012 [10]
GDP and WEF SectorGDP per capita (constant 2005 US$): 1560 (2012) [1]GDP growth annual (%): 2.2 (2014) [1]
Government revenues (bio. US$): 302,009 (2011) [13]Government spending (bio. US$): 436,148 (2011) [13]Central government debt, total (% of GDP): 86 (2007) [1]Inflation, GDP deflator (annual %): 12 (2012) [1]
Tax revenue (% of GDP): 14 (2011) [1]Subsidies and other transfers (% of expense): 42 (2011) [1]
GDP by sector, electricity and water (%): 1.9 (2006/2007) [11]GDP by sector, industry, petroleum & mining (%): 32.4 (2006/07) [11]
Employment in agricultureEmployment in industryEmployment in services
Unemployment total
26%
8%
43%
23%
ODA Water
ODA Energy
ODA Agriculture
Net ODA received (in %)
Net ODA received (in US$)
47%
39%
14%
Agriculture
Industry
Services, etc.
Sector Contribution to GDP, 2011
Employment in Sector, 2005
Official Development Aid in Sectors
Population Trend100 Mio
80 Mio
60 Mio
40 Mio
20 Mio
0
2003
2004
2005
2006
2007
2008
2009
2010
2011
2012
Curr
ent U
S$/c
apit
a
0
5
10
15
20
25
0%
10%
20%
30%
40%
50%
60%
90%
70%
80%
100%
20042005
20062007
20082009
20102003
2011

Nexus Country Profile Water
Water for Energy
Water for Land/Food
Water available per capita: 682.5 m³/cap*a (2011) [1]Water consumption per capita: 973.3 m³/cap*a (only 2000) [1]
Rainfall average: 51mm/a [2]Rainfall distribution spatial: 0-200mm/a [2]Rainfall distribution temporal: low, irregular & unpredictable [2]
Internal Renewable Water ResourcesSurface Water , actual: 56km³/a (99% Nile, 2011) [1]Groundwater, acutal: 1.3 km³ (2011) [1]Total renewable resources, acutal: 57.3 km³/a (2011) [1]
Direct use of agricultural drainage water: 11 km³/a (2001)[1]Produced/collected/treated municipal wastewater: 8.5, 6.5, 4.8 km³/a (2011) [1]Direct use of municipal wastewater/for irrigation: 0.7/0.29 km³/a (2011) [1]Desalination water: 0.1km³/a at North coast (2002) [1]Non renewable sources, estimated: 0.6 to 3.8 km³/a [2]
Balances:Surface water entering the country, natural: 84 km³/a (2011) [1]Surface water leaving the country, natural: 0km³/a (2011) [1]Surface water inflow secured/submitted through treaties: 55.5 km³/a (2011) [1]
HydropowerHydropower is the third largest source for electricity in Egypt and accounts for 8% (2011) of electricity generation [8]. Hydropower generated 12.93 TWh in 2011[9]. The installed capacity of 2,692 MW is often not exploited due to low water levels [10]. The existing two dams and reservoirs, the Aswan Dam and the low Aswan Dam, have a storage capacity of 162 and 5 km³[11]. FAO indicates that the overall use for hydropower accounts for 4km³ annually [2]. BiofuelsWastewater is being reused in Egypt for biofuel production with active governmental promotion. In total 0.26 bio. m³ of secondary treated waste-water and 0.44 bio. m³ of primary treated wastewater are reused for irrigati-on [16]. According to Abdel Shafy the extensive use of sewage water for irri-gation affects groundwater resources. His study revealed that the majority of water samples exceeded the maximum levels for BOD, COD and faecals.
Water Efficiency and Cropping PatternsOn the cultivated area in Egypt, 94% are annual crops and 6% permanent crops. There is a decrease in cultivation of fibre, oil, fodder and legume crops and a correlated increase in cereals, fruit, sugar and vegetables. The three cropping seasons are the summer, winter and Nil season. 0.2% of croplands are rainfed, the remaining area is irrigated. Surface irrigation accounts for 302,854 ha, 171,910 ha for sprinkler and 221,415 ha for drip or trickle irrigation [5]. Virtual Water[6] Major crops imported and associated with virtual water are soybeans followed by wheat and maize. Contrary major exported crops associated with virtual water are citrus and sugar.
PollutionThe main pollution source in Egypt is industry due to direct or after treat-ment discharge of sewage. While drainage water in the delta region is reused, it is directly discharged in the upstream region. Increasing use of fertilizers and pesticides caused flourishing of weed and therewith an in-crease in evapotranspiration. Also high levels of pollutants constitute be-cause of uncontrolled and accumulated discharge[7].
Total water withdrawal
Water resources: total renewable
Average precipitation in volume
Water resources: total exploitable
Agricultural
Minicipal
Industrial
Unimproved Water, Total
Unimproved Sanitation, Total
Unimproved Water, Rural
Unimproved Sanitation, Urban
Unimproved Water, Urban
Unimproved Sanitation, Rural
Access to Water and Sanitation, 2010
Water Withdrawal by Sector, 2004
Water Resources and Consumption, 2011
86%
8%
6%
[10^9m³/a]
Total Import (Mm3)
Total Export (Mm3)
Groundwater production (Mm3/Y)Soil water consumption for agriculture (Mm3/Y)
32206
13000
1062
- Rapidly decreasing water resources per capita due to population growth and contamination- Very high dependency on Nile water resources with growing vulnerability to changes in water use of upstream countries- Despite high access to improved water sources, several protest move-ments in the last years due to disruptions in supply, water quality and pri-cing [3]- 47% of rural population no access to sewer systems with correlated conta-mination of groundwater bodies due to low water levels [4],[7]- 6.5 km³ of 8.5 km³ generated wastewater is collected, but only 4.8 km³ are treated [1]
3500025000
30000
20000
1500010000
50000
Virtual Water, 2006
0
80
60
40
20
100
0
[Per
cent
%]
806040200

Nexus Country Profile Energy
Energy for Water Energy for Land/Food
Energy use per capita: 987 ktoe/cap*a (2011) [1]Electric power consumption per capita: 1743 kWh/cap*a (2011) [1]TPES: 77.69 Mtoe (2011) [2]
Reserves and Potential:Crude oil reserves: 4,400 mio. barrels (2013) [3]Natural gas: 2,186 trillion m³ (2013) [3]Coal reserves: 17 mio. short t (2008) [4]Solar potential, DNI: 74 bio. MWh, 1970 to 3200 kWh/m²/a [5]Biomass potential: 40 mio. tons, 3,600 ktoe [5]Wind potential, wind speed: 20,000 MW, > 7m/s in Western part [5]Geothermal potential: no data availableFalling water, total hydraulic resources: 125,000 mio. kWh (2008) [6]
Energy consumption for water is generally high in Egypt since water sup-ply is dependent on pumping water from the Nile to higher levels. Egypt has more than 560 pumping stations with more than 1,600 single pum-ping units for irrigation of cultivated land. The amount of electricity nee-ded to operate these stations is indicated in 930 GWh [10]
DesalinationDue to increasing water scarcity and demand, many desalination plants have been built in the last 30 years. In 2002, the amount of desalinated wa-ter was 100 mio. m³[11]. Water desalination leads to increasing energy con-sumptions. According to estimations by Garcia Rodrigez (2003), 13 mio. m³ of water require 130 mio. tons of oil, which furthermore could drastically increase the energy demand and CO2 emissions [11]. Although energy use for pumping and potable water production seems to be quite high, Egypt was reported to be one of the countries with the least energy intensity in water supply [13].
Energy Use in AgricultureThe energy use in agriculture in Egypt has experienced a high increase over the last year but remains small in general – around 60% of total ener-gy consumption in Egypt in 2010[2] The total energy consumption in 2000 was 292 ktoe with 75% accounting for electricity. In 2010, it increased to 3,685 ktoe. Energy use in agriculture is expected to increase due to incre-asing scarcity and production. When comparing the data reported by IEA, the highest electricity consumption in agriculture was recorded in 2010 with 494 GWh and does not nearly reach the required supply for pum-ping studied by Khaled. Further data on the specific use patterns are not available.
Machinization Since the late 1970s, agricultural machinery shows a steady increase - 103,188 tractors in use in 2008 [7]. In 2000, the area under power irrigati-on was 29,379 km³ [8]. While irrigation systems in the old land of the Nile Valley are based on combined gravity and water lifting systems, the sup-ply in the new lands is dependent on pumping stations [9]. In new lands, there is no permission for surface irrigation, thus irrigation is based on sprinkler and drip technologies. Modernization efforts towards efficient use of water in the agriculture sector might lead to an increase in ener-gy consumption.
Egypt is the largest energy consuming country in North Africa. Energy consumption per capita in the upper middle range. Highest energy consumption in Industry (35%), Transport (30%) and Residential (26%) [2]. Energy exports in 2011 (22,258 ktoe) exceeded imports (12,704 ktoe) [2]. Full coverage of access to electricity (100%) [1] Emissions in 2010 were around 205 Mt of CO2 (2.6 metric tons per capita). Methane emissions in the energy sector account for 29,711 metric tons of CO2 equivalent in 2010.
Energy Production and Consumption, 2011
Electricity production from hydroelectric sources
Electricity production from oil sources
Electricity production from natural gas sources
Electricity production from renewable sources excluding hydroelectric
crude oil
natural gas
hydropower
geothermal, solar, etc.
biofuels and waste
Industry
Transport
Residential
Commercial
Agriculture
Electricity Production, 2011
Energy Use by Sector, 2011
Energy Production Sources, 2011
Energy Imports Exports Balance
Energy imports net
Production and use
Imports to productionand use
20002001
20022003
20042005
20062007
20082009
20102011
1% 8%
16%
75%
35%
30%
26%
6%3%
56,6%
40,2%
0,2%
1,3%
1,8%
Electric power consumption
Electricity production
Energy production
Energy Use
kt of oil equivalent / GWh
kt o
f oil
equi
vale
nt
kt o
f oil
equi
vale
nt
-20000
-15000
-10000
-5000
0
-350-300-250-200-150-100-500
25020015010050
15000050000 100000 2000000
Nexus Country Profile Land
Land for WaterLand/Food for Energy
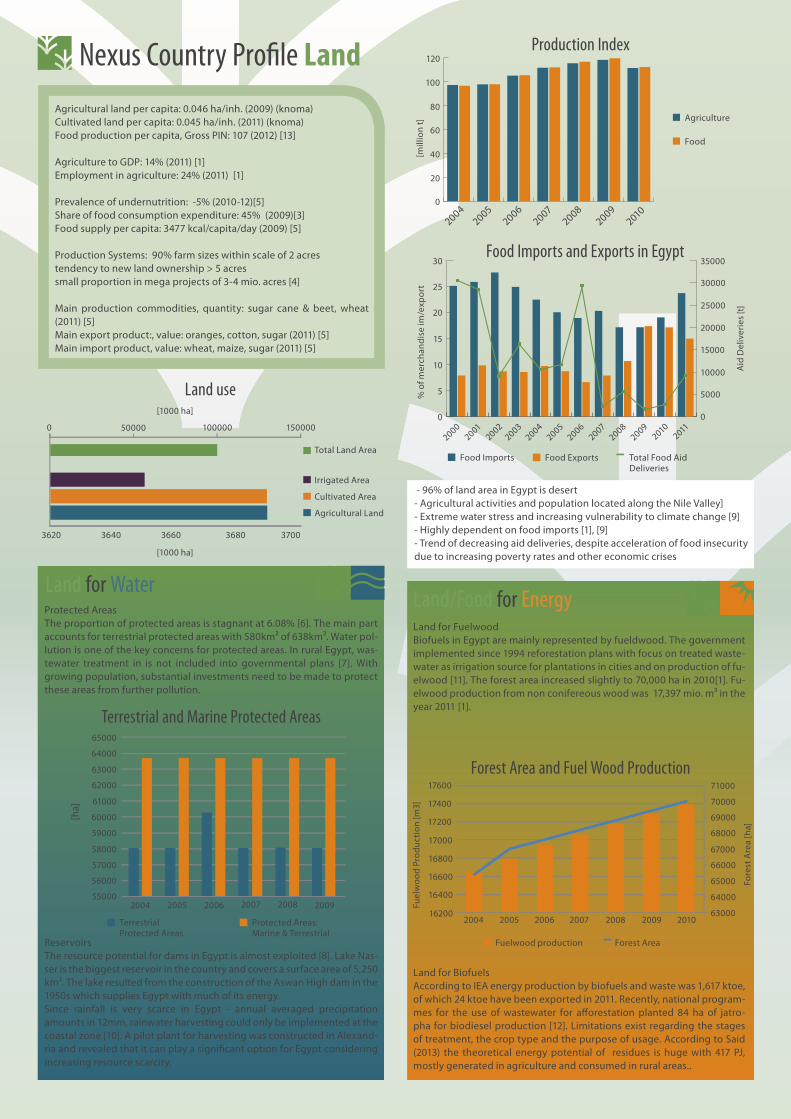
Protected AreasThe proportion of protected areas is stagnant at 6.08% [6]. The main part accounts for terrestrial protected areas with 580km² of 638km². Water pol-lution is one of the key concerns for protected areas. In rural Egypt, was-tewater treatment in is not included into governmental plans [7]. With growing population, substantial investments need to be made to protect these areas from further pollution.
ReservoirsThe resource potential for dams in Egypt is almost exploited [8]. Lake Nas-ser is the biggest reservoir in the country and covers a surface area of 5,250 km². The lake resulted from the construction of the Aswan High dam in the 1950s which supplies Egypt with much of its energy. Since rainfall is very scarce in Egypt - annual averaged precipitation amounts in 12mm, rainwater harvesting could only be implemented at the coastal zone [10]. A pilot plant for harvesting was constructed in Alexand-ria and revealed that it can play a significant option for Egypt considering increasing resource scarcity.
Land for FuelwoodBiofuels in Egypt are mainly represented by fueldwood. The government implemented since 1994 reforestation plans with focus on treated waste-water as irrigation source for plantations in cities and on production of fu-elwood [11]. The forest area increased slightly to 70,000 ha in 2010[1]. Fu-elwood production from non conifereous wood was 17,397 mio. m³ in the year 2011 [1].
Land for BiofuelsAccording to IEA energy production by biofuels and waste was 1,617 ktoe, of which 24 ktoe have been exported in 2011. Recently, national program-mes for the use of wastewater for afforestation planted 84 ha of jatro-pha for biodiesel production [12]. Limitations exist regarding the stages of treatment, the crop type and the purpose of usage. According to Said (2013) the theoretical energy potential of residues is huge with 417 PJ, mostly generated in agriculture and consumed in rural areas..
- 96% of land area in Egypt is desert - Agricultural activities and population located along the Nile Valley]- Extreme water stress and increasing vulnerability to climate change [9]- Highly dependent on food imports [1], [9]- Trend of decreasing aid deliveries, despite acceleration of food insecurity due to increasing poverty rates and other economic crises
Agricultural land per capita: 0.046 ha/inh. (2009) (knoma)Cultivated land per capita: 0.045 ha/inh. (2011) (knoma)Food production per capita, Gross PIN: 107 (2012) [13]
Agriculture to GDP: 14% (2011) [1]Employment in agriculture: 24% (2011) [1]
Prevalence of undernutrition: -5% (2010-12)[5]Share of food consumption expenditure: 45% (2009)[3]Food supply per capita: 3477 kcal/capita/day (2009) [5]
Production Systems: 90% farm sizes within scale of 2 acrestendency to new land ownership > 5 acressmall proportion in mega projects of 3-4 mio. acres [4]
Main production commodities, quantity: sugar cane & beet, wheat (2011) [5]Main export product:, value: oranges, cotton, sugar (2011) [5]Main import product, value: wheat, maize, sugar (2011) [5]
Food Imports and Exports in Egypt
Land use
2004 2005 2006 2007 2008 2009 2010
Forest AreaFuelwood production
Fore
st A
rea
[ha]
Fuel
woo
d Pr
oduc
tion
[m3]
% o
f mer
chan
dise
im/e
xpor
t
Aid
Del
iver
ies
[t]
Food Imports Food Exports Total Food AidDeliveries
20002001
20022003
20042005
20062007
20082009
20102011
Terrestrial Protected Areas
Protected Areas: Marine & Terrestrial
[ha]
Terrestrial and Marine Protected Areas
2004 2005 2006 2007 2008 2009
Forest Area and Fuel Wood Production
Production Index
Total Land Area
Agricultural Land
Cultivated Area
Irrigated Area
[1000 ha]
[1000 ha]
15000050000 100000
3620
0
3640 3660 3680 3700
55000
56000
57000
58000
59000
60000
61000
62000
63000
64000
65000
63000
64000
65000
66000
67000
68000
69000
70000
71000
16200
16400
16600
17200
17000
16800
17400
17600
20
15
10
5
25
0
30
25000
20000
10000
5000
30000
0
35000
15000
20042005
20062007
20082009
2010
[mill
ion
t]
80
60
40
20
100
0
120
Agriculture
Food

EgyptRapid Assessment
Overall AssessmentNEXUS CHALLENGES
Egypt faces major water, food and energy security challenges, that are enhanced by the political instability and severely decreasing economic growth since the 2011 revolution.
The Nile is Egypt’s only renewable water source, however the shifting geostrategic balance between states in the Nile Basin means it threatens Egypt’s share of the Nile’s flow. Pressures on water resources have increased with population growth, and the per capita share of water has decreased.
In regards to energy, Egypt is heavily dependent on its oil and gas reserves. The energy demand is likely to grow due to increasing energy consump-tion in the agriculture and water sector, and the growing population and economy.
One in five Egyptians are currently experiencing food insecurity as a result of structural issues in the food supply system. There is a growing gap between Egypt’s long-term agricultural production potential and its esti-mated population growth. The country is dependent on the global food market to secure the food demand of its population, but a reduction in imports appear difficult to obtain, given land availability and production yield.
Water shortages will have a severe impact on Egypt’s food security. Of Egypt’s total water supply, 80 per cent is used for agriculture. As water availability shrinks and available agricultural land is used, Egypt’s food production capacity will fall. The impacts of resource scarcity will be exac-erbated by the changing global climate.
In the longer term, environmental issues related to solid waste manage-ment, air pollution, small holder farming combined with land degrada-tion and the loss of biodiversity are intensified by increasing population and limited by arable land, desertification and climate change. These pose significant challenges for food security.
SOLUTIONS
To address the present challenges Egypt has to resolve the structural weaknesses of the economic sector and attract private investment to return sustainable economic growth.
In terms of water security Egypt could protect areas from further pollu-tion, in addition to improving the sanitation value chain in order to assure safe transportation and treatment of excreta. Part of the capital needed for the interventions could be gained through a more effective water tariff system. Despite the affordability of water and sewer tariffs, which are amongst the lowest in the world, only a fraction of costs is recovered through revenues from tariffs. To achieve this the Government will need to cooperate with regional stakeholders on water allocations.
Egypt currently has underutilised potential for renewable energy resources, these could be implemented to satisfy increasing energy demand. However, in the future Egypt will need to consider the importa-tion of energy produced by the Grand Ethiopian Renaissance Dam.
Considering the increasing population, Egypt will not be self-sufficient in terms of food security. The country needs to increase food imports without exacerbating the structural fiscal deficit. Trade based food secu-rity may not be viable in the long-term if Egypt is unable to amend its struggling economy. Therefore the country has to explore major gains that can be achieved in the efficient use of agricultural inputs, and reduc-tion of waste throughout the food system, including restructuring the food subsidy system. Comprehensive effort is required to improve agri-cultural productivity and reduce losses throughout the food and water supply chains.
Water SecurityEgypt is reliant for 98% of its water resources on the river Nile with a growing vulnerability to the changing water uses of upstream countries. Water inse-curity rises due to population growth and contamination. Despite high access to improved water sources, several protest movements have occurred in the last years due to disruptions in supply, water quality and pricing.
Water supply High access to improved water sources, low access to improved sanitation and weaknesses along the sanitation value chain in safe treatment and disposal of excreta.
Reservoir High loss in storage capacities of reservoirs due to increasing sedi-mentation.
Virtual water Virtual water embedded in food import is increasing. Major exported crops associated with virtual water are citrus and sugar.
Pollution High discharge of untreated excreta into water bodies, pollution of groundwater and high concentrations of DDT in potable water storages due to the use of pesticides in agriculture.
Protected Areas Missing monitoring programs and environmental regulations on protection of water bodies cause a high threat to nature and the population.

Food Security
Rating
The prevalence of combined food insecurity and income poverty in Egypt is increasing . Population growth and urbanisation are encroaching strips of fertile land adjacent to the Nile. The consequent environmental degradation is leading to contamination and desertification of the limited remaining fertile areas. Efforts to reclaim land from the desert in order to counteract this trend are restricted by the need to secure sufficient water supplies. Therefore, Egypt relies on the global market for up to 60 per cent of its food needs which is a major cause in the rise of Egypt’s food insecurity in the past.
The rapid assessment of the situation above, based on available data, was established following the UN Water Country Profiles. It provides an overview of trends according to the following:
insuffiscient data
trends are of significant concern
trends are of concern
trends are stable or, progressing on certain issues but not on others
trends show some measure of improvement in all relevant indicators assessed
trends show significant improvement and there is no concern
Cropping patterns The three cropping seasons are the summer, winter and Nile season. Only 3.5 per cent of Egypt’s landmass is potentially arable. The remaining land is arid desert.
Food markets Dependency on food imports increase, whereas self-sufficiency declines. Local food markets exist and are functioning.
Energy use in Agriculture Energy use in agriculture is expected to increase due to increasing scarcity and production but remains small in general.
Productivity in Agriculture Urbanisation and environmental degradation endanger Egypt’s already limited fertile areas. The total area of land cultivated decreased.
Water use efficiency Croplands are largely dependent on irrigation, of which surface irrigation is the most common technique. Water use efficiency is below international standards.
Energy SecurityEgypt is the largest energy consuming country in North Africa. Energy security is endangered because of the rising energy demand in the water and agri-culture sector.
Biofuels Wastewater is being reused in Egypt for biofuel production with active governmental promotion.
Hydropower Hydropower is the largest source of renewable energy. Yet, the contribution to total energy consumption is small.
Land for Biofuels Recently, national programmes for biodiesel production have been implemented.
Fossil fuels The main energy source is fossil fuels. Oil and gas reserves are the main energy suppliers.
Fuelwood Biofuels in Egypt are mainly represented by fuelwood. This can negatively affect soil quantity.
Access to Electricity Full coverage of access to electricity. Energy cuts and shortages have been a problem recently.
Wastewater for Energy Reforestation plans with focus on treated wastewater as irrigation source for plantations exist.

EgyptNexus Country Profile
References KeyFacts[1] World Bank, n.d., Ethiopia Country Database, retrieved at http://data.worldbank.org/country[2] UNDP, 2013, Human Development Report Egypt[3] Faostat, n.d., Country Profiles, retrieved at faostat.fao.org/site/666/default.aspx[4] FAO, IIED and IFAD, 2009, Land Grab or development opportunity—Agricultural In-vestment and intational land deals in Africa, written by Cotula, L,, Vermeulen, S., Leo-nard, R., Keeley, J.[5] IFPRI, 2009, „Land Grabbing“ by Foreign Investors in Developing Countries: Risks and Opportunities, IFPRI Policy Brief 13, written by [6] FAO, 2011, International Investment in Agriculture in the Near East—Evidence from Egypt Morocco and Sudan, edited by Tanyeri-Abur, A., Hag Elamin, N.[7] General Authority for Investment Egypt in FAO, 2011, International Investment in Ag-riculture in the Near East—Evidence from Egypt Morocco and Sudan, edited by Tanye-ri-Abur, A., Hag Elamin, N.[8] Central Bank of Egypt in FAO, 2011, International Investment in Agriculture in the Near East—Evidence from Egypt Morocco and Sudan, edited by Tanyeri-Abur, A., Hag Elamin, N.[9] World Bank, 2005, Cost-effectiveness and equity in Egypt`s water sector, Egypt Pub-lic Expenditure Review, Policy Note 3[10] Rohac, D., 2013, Solving Egypt‘s Subsidy Problem, Policy Analysis, No. 741[11] AfDB/OECD, 2008, African Economic Outlook—Egypt[12] OECD, 2010, Meeting the Challenge of Financing Water and Sanitation: Tools and Ap-proaches, OECD Studies on Water, OECD Publishing[13] Quandl, n.d., Economic Data—Egypt, retrieved at qund.com/egypt/egypt-econo-my-data[14] Online Currency Converter, n.d, EGP/USD exchange rate history, retrieved at freecur-rencyrates.com/exchange-rate-history/EGP-USD/2004
References Energy[1] World Bank, n.d., Country Database, retrieved at http://data.worldbank.org/country/[2] IEA, 2011, Indicators for 2011, retrieved at http://www.iea.org/statistics/statistics-search/report/?country=[3] CIA, 2010, WorldFactbook, retrieved at https://www.cia.gov/library/publications/the-world-factbook/geos/eg.html, accessed on January 21st, 2014[4] Eia, 2008, International Energy Statistics, retrieved at http://www.eia.gov/cfapps/ip-dbproject/iedindex3.cfm?tid=1&pid=7&aid=6&cid=EG,&syid=2008&eyid=2008&unit=MST[5] Reegle, REEEP Policy Database, 2012, Egypt Country Profile, retrieved at http://www.reegle.info/profiles/[6] UN, n.d., Country Database, retrieved at http://data.un.org/Data.aspx?q=Ethiopia+[from+1993]&d=EDATA&f=cmID%3AWF%3BcrID%3A231[7] Fao Faostat, 2012, Country Database, retrieved at http://faostat.fao.org/site/576/DesktopDefault.aspx?PageID=576#ancor[8] Fao, 2009, Egypt, retrieved at http://www.fao.org/nr/water/aquastat/countries_regi-ons/egypt/index.stm, accessed on January 21st[9] Fao, 1997, Irrigation in the Near East Regions in Figures, retrieved at http://www.fao.org/docrep/w4356e/w4356e0c.htm[10] Feytan, K., Younes, M., Helal, M., Hallouda, M., 2007, Energy Saving of Adjustable Speed Pump Stations in Egypt, IWTC, Sharm El Sheikh[11] Fao Aquastat, 2009, Egypt Country Profile, retrieved at http://www.fao.org/nr/water/aquastat/countries_regions/egypt/index.stm[12] L. Garcia-Rodriguez, Renewable energy applications in desalination: state of the art, Solar Energy 75 (2003) 381-393[13] ESMAP, 2012, A primer on energy efficiency for municipal water and wastewater uti-lities[14] http://en.openei.org/wiki/Egypt
References Land[1] Worldbank, n.d., Country Database, retrieved at http://data.worldbank.org/country[2] knoema, retrieved at http://knoema.de/[3] CAPMAS. Household Income Expenditure and Consumption Survey (HIECS). Vari-ous Issues (1990/1991, 1994/1995, 1999/2000, 2004/2005 and 2009/2010). Cairo, Egypt. [4] IFAD, 2003, Assessment of Rural Poverty—Near East and North Africa[5] Faostat, n.d., Country Profiles, retrieved at faostat.fao.org/site/666/default.aspx. Fao, 2000, Agriculture, Trade and Food Security Issues and Options in the WTO Negotiations from the Perspective of Developing Countries, Chapter 4 Egypt, retrieved at http://www.fao.org/docrep/003/x8731e/x8731e05.htm on February 26th, 2014[6] Fao, n.d., Country Profiles Database, retrieved at http://www.fao.org/countryprofi-les/data-sources/en/[7] Hussein, A.A. Gammal, 2011 Water Quality protection of Rural Egypt, Ministry of Wa-ter Resources on Fifteenth International Water Technology Conference, Alexandria[8] GEO, n.d., List and Profile of Hydro Powerplants, retrieved at http://globalenergyob-servatory.org/geoid/40408[9] Fao Aquastat, 2009, Country Profile, retrieved at http://www.fao.org/nr/water/aqua-stat/countries_regions/egypt/index.stm[10] Abdel-Shafy, H., El-Saharty, A., Regelsberger, M., Platzer, C., 2009, Rainwater in Egypt: Quantity, Distribution and Harvesting[11] Fao, 2000, Current Status of the Forest Sector, retrieved at http://www.fao.org/do-crep/004/ab580e/AB580E03.htm[12] EEAA, n.d., The National Programme for Safe Use of Treated Sewage Water for Affo-restation, retrieved at http://www.eeaa.gov.eg/English/main/env_forests_Jatropha.asp, accessed February 26th, 2014[13] UN World Food Programme, 2013, Hunger, Poverty Rates in Egypt up sharply over past three years, retrieved at http://www.un-foodsecurity.org/node/1389, accessed on January 21st, 2014[14] ElGanzori, A., 2012, Towards a Climate Change Adaption Strategy for the Water Sec-tor in Egypt, MDGIF MDG Achievement Fund, Cairo[15] [16] IEA, 2011, Egypt Data Base, Balances, retrieved at http://www.iea.org/statistics/stati-sticssearch/report/?country=EGYPT&product=balances&year=2000, accessed on Janu-ary 22nd, 2014[17] [18] Said, N., El-Shatoury, S.A., Díaz, L.F., Zamorano, M., 2013, Quantitative Apparaisal of Biomass Resources and their Energy Potential in Egypt, Renewable and Sustainable Ener-gy Reviews, Volume 24, 84-91
References Water[1] FAO Aquastat, n.d., Country Profile Database, retrieved at http://www.fao.org/nr/wa-ter/aquastat/data/query/index.html?lang=en[2] FAO Aquastat, 2009, retrieved at http://www.fao.org/nr/water/aquastat/countries_regions/egypt/index.stm, accessed on January 15th, 2013[3] Initiative for Policy Dialogue and Friedrich Eberg Stiftung in New York,2013, World Protests 2006—2013[4] USAID, 2010, Land Tenure Egypt Profile[5] FAO, n.d., Country Pasture/Forage Resource Profile, retrieved at http://www.fao.org/ag/AGP/AGPC/doc/Counprof/Egypt/Egypt.html[6] FAO, 2006, (bei Masha genaue Quelle hinterfragen-keine angegeben!)[7] Hussein I. Abdel-Shafy and Raouf O. Aly, 2002, Water Issues in Egypt: Resources, Pol-lution and Protection Endeavors, Water Research and Pollution Control Department, Cai-ro, Egypt[8] NREA, New and Renewable Energy Authority Egypt, retrieved on http://www.eia.gov/countries/cab.cfm?fips=EG, accessed on January 16th, 2014[9] IEA, 2011, Renewables and Waste for 2011, retrieved at http://www.iea.org/statistics/statisticssearch/report/?country=EGYPT&product=RenewablesandWaste&year=2011[10] REEEP/REEGLE, 2012, Resources and Services, retrieved at http://www.reegle.info/policy-and-regulatory-overviews/EG[11] Fao Aquastat, 2007, Dams and Agriculture in Africa[12] World Bank, n.d., Country Database, retrieved at http://data.worldbank.org/indica-tor/AG.LND.FRST.ZS[13] Fao, 2002, Treated Waste Water Use in Forest Plantation Development in the Near East Region, Near East Forestry Commission[14] UN Statistic Division, n.d., Energy Statistic Database, retrieved at http://knoema.de/UNSDESD2013/un-statistics-division-energy-statistics-database-2013?location=1000650-egypt[15] EEAA, Egyptian Environmental Affairs Agency, The National Programme for Safe Use of Treated Sewage Water for Afforestation, retrieved at http://www.eeaa.gov.eg/english/main/env_forests_jatropha.asp, accessed on January 17th, 2014[16] Hussein Abdel Shafy and Mona Mansour, 2013, Overview on Water Reuse in Egypt: Present and Future[17] Hussein Abdel Shafy, Guindi, K., Tawfik, N., 2008, Groundwater Contamination Af-fected By Longterm Sewage Irrigation in Egypt, Efficient Management of Wastewater, Chapter 5, 53—63[18] SURFACE AREA DAMS http://www.fao.org/docrep/005/ac675e/AC675E03.htm
EgyptNexus Country Profile
About and Copyright:
This publication is developed by the Research Focus on Water, Ener-gy and Food Security of the Cologne University of Applied Sciences. Speaker of the Research Focus: Prof. Dr. Lars Ribbe
Authors:Dr. Mohammad Al-Saidi, Tatjana Schellenberg, Emma Roach
Design:Aljoscha Nimz, Antonia Fedlmeier, Michael Mensing
Contact:Dr. Mohammad Al-Saidi ([email protected])Prof. Dr. Lars Ribbe ([email protected])Institute for Technology in the Tropics (ITT)TH Köln (University of Applied Sciences)[email protected]
When using these materials, include the following citation:Al-Saidi, Mohammad; Schellenberg, Tatjana; Roach, Emma (2016):„Nexus Country Profiles: Egypt“, Nexus Research Focus, TH Köln - Uni-versity of Applied Sciences.
© TH Köln (University of Applied Sciences)
https://www.th-koeln.de/http://www.water-energy-food-nexus.info/
Useful Resources:
Data Sources:
World Bank Country DatabaseIEA StatisticsFAO Country Profiles DatabaseFAO Aquastat Database
Nexus Websites:
www.water-energy-food.orgwww.thenexusnetwork.orgwww.gracelinks.org www.futureearth.org


![Nexus Belmonteetal Petra - IACiac.es/proyecto/arqueoastronomia/media/Belmonteetal_Nexus_Preprint.pdf · ancient Egypt [Belmonte, Shaltout and Fekri 2009] and shows a series of significant](https://static.fdocuments.in/doc/165x107/5e7d41a39a5c5f6ba2299a54/nexus-belmonteetal-petra-ancient-egypt-belmonte-shaltout-and-fekri-2009-and.jpg)

