water drivers S of change Ec T water En - SPML Infra Limited · c population growth James Cridland...
56
2.0 water S T Ec En P drivers of change water
Transcript of water drivers S of change Ec T water En - SPML Infra Limited · c population growth James Cridland...

2.0
wat
er
S
T
Ec
En
P
driversof change water
wat
erw
ater
S
T
Ec
En
P
© Text: the authors © Images: the authors
Edition Chris Luebkeman Arup Fellow and Director Global Foresight + Research + Innovation
Project Manager Josef Hargrave Associate, Foresight + Research + Innovation
Editor William Newton
Graphic design Mark Pearsall
Research Josh Treuhaft, Lynne Goulding, Marcus Morrell, Jenna Beckett
Thanks to Mark Fletcher, Justin Abbott, Jennifer Laight, David Hetherington, Tevon Strand-Brown, Felicitas zu Dohna, Arup’s Water Skills Network, all Arup workshop participants, and all contributing photographers.
2015

c J
ames
Crid
land
population growthhow much water will 9bn people need?
Historically, the rate of global water consumption has doubled every 20yrs — which is double the rate of population growth. If population and consumption trajectories continue, 1.8bn people will be living in water scarce regions by 2025. —Population Institute (July 2010)
soci
alw
ater

Fig 1: Global water demand: Baseline scenario 2000and 2050[OECD, 2012]
Irrigation
Domestic
Livestock
Manufacturing
Electricity
Km3
2000
3000
4000
5000
6000
1000
02000 2050 2000 2050 2000 2050 2000 2050
WorldRoWBRICSOECD
soci
alw
ater
population growthThe global population reached 7bn in 2011 and is projected to reach 9bn by 2050. Growth is driven by increasing life expectancy and a rise in the number of women surviving to reproductive age, particularly in developing Africa and Asia. Sub-Saharan Africa — which accounted for 10% of the world’s population in 2000 — will host 17% of the world’s population by 2050. By 2050 , the population of every country in East-, Southeast-, South- and Central Asia (excl. Japan and Kazakhstan) will grow substantially, with numbers nearly doubling in Pakistan, Nepal, Bangladesh, Afghanistan, Cambodia, and Laos.
As populations expand, demand for water will increase dramatically. This will be driven primarily by a growing demand for food — which is expected to increase by 70% by 2050 — and associated agricultural water use, expected to increase by at least 19% by 2050. A growth in overall consumption will lead to more water use in the manufacturing and production sectors. Consumer spending in India, for example, is expected to expand from US$991bn in 2010 to US$3.6tr by 2020.
01

urbanisationis your city too thirsty?
Brazil is ‘blessed’ with 1/8 of the world’s freshwater, but its natural disaster monitoring service estimates that Sao Paulo’s main reservoir could run dry within the next year. The water utility has already lowered pressure in the system to reduce flow. —New York Times Online (16 February 2015)
soci
alw
ater
c A
nton
Baw
ab

soci
alw
ater
urbanisationThe percentage of the global population living in urban areas is expected to reach 66% by 2050. A review of the world’s developing regions reveals that Africa and Asia are the two regions suffering most from lack of urban water supply and sanitation. Major concerns include over-exploitation and pollution of water sources. According to The Times of India, 22 out of 32 major Indian cities deal with daily water shortages. This is driven by a steady increase in demand, inefficiencies in transfer and use, and persistent water pollution. Inadequate infrastructure — such as lack of wastewater treatment and drainage facilities — can lead to pollution of ground- and surface water supplies.
In addition to a shortage of reliable water supplies, the street surfaces of many cities continue to be highly impermeable to water. As a consequence, stormwater management has become a high priority to prevent floods and sewer overflows. Investment in green infrastructure — such as bioswales which use vegetation at street level and subterranean storage to soak up storm water — is leading to more sustainable forms of urban water management.
02
Fig 1: Urban population 2050[UNICEF, 2012]
% and number of total population that is urban
Greater than 75%
Mexico 113M
USA 365M
Brazil 204M
UK 64M
France 64M
Turkey 82M
Egypt 82M
Nigeria 218M
Ethopia 65M
Iran (Islamic Republic of)
82M
RussianFederation
96M
Pakistan 199M
India 875M
Bangladesh 875M
China 1038M
Indonesia 190M
Vietnam 56M
Philippines
101M
Japan 83M
Fig 1.1: Largest cities under water stress[Global Enviromental Change, 2014]
Urban Agglomeration Country Population
Tokyo Japan 36,933,000
Delhi India 21,935,000
Mexico City Mexico 20,142,000
Shanghai China 19,554,000
51–75% 25–50%

water accesshow far should you walk to get water?
82% of those who lack access to improved water live in rural areas, while just 18% live in urban areas. —World Health Organization and UNICEF Joint Monitoring Programme (2014)
soci
alw
ater
c E
urop
ean
Com
mis
sion
DG
EC
HO

soci
alw
ater
water accessThe World Health Organization defines reasonable water access as the availability of at least 20 litres of water per person per day from a source within 1km of the user’s dwelling. From 1990 to 2012, an additional 2.3bn people received access to an improved drinking water source, such as piped water or protected wells. This represents a global coverage of 89% of the world’s population with access to clean drinking water in 2012. Despite this improvement, 748M people globally still have no access to clean, safe water. These people continue to rely on unimproved drinking water sources, and almost a quarter (173M people) still rely on direct use of surface water.
Furthermore, despite lower per-capita water consumption in the developing world (31 litres/person/day in African countries vs 307 litres/person/day in developed countries), achieving universal access will be difficult. The population in developing regions is expected to increase and middle-class consumption will rise, while at the same time usable supply may diminish due to over-extraction, pollution, and climate change. This could reverse previous global gains towards improved freshwater access for all.
03
1212
Fig 1: Proportion of the population using improveddrinking water sources in 2012[WHO and UNICEF, 2012]
91–100%
76–90%
50–75%
<50%
Insufficient data or not applicable

sanitation and hygienedid you wash your hands?
Of the approximately 7bn people in the world today, almost 6bn have access to a mobile phone, while only 4.5bn have access to working toilets.—TIME Magazine Online (25 March 2013)
soci
alw
ater
c E
urop
ean
Com
mis
sion
DG
EC
HO

soci
alw
ater
Water is critical to staying clean and healthy. Yet, according to international charity WaterAid, about 2.5bn of the world’s population lack adequate sanitation facilities, and 1.1bn still practice open defecation. More than 3.4M people die annually from water, sanitation and hygiene-related causes (99% of which occur in the developing world).
It is estimated that nearly 10% of the global disease burden could be reduced through improved water supply, sanitation, hygiene, and water resource management. Good hygiene behaviour can combat the ill effects of diseases that are caused by poor personal hygiene and skin or eye contact with contaminated water. SuperAmma, a successful handwashing campaign in rural India, used emotional motivators (instead of health messaging) to improve hand-washing behaviours. Six months after the campaign, washing hands with soap in programme-targeted areas had increased by 31% compared with areas without the programme. Organisations such as UNICEF often combine improved sanitation facilities with hygiene education at schools.
04
Fig 1: Number of people (in millions) without access to an improved sanitation facility in 2012
[WHO and UNICEF, 2012]
Asia
Africa
Oceania
Latin America and the Caribbean
Developed Regions
sanitation and hygiene
1693
658
7
110
54

water consciousnesshow much water do you waste?
According to a study by the Energy Saving Trust, consumers in the UK could collectively save US$318.5M a year, if every household reduced their daily shower time by just one minute. —Energy Saving Trust, At Home With Water Report (2013)
soci
alw
ater
c T
hom
as B
erg

soci
alw
ater
water consciousnessIn 2012 Americans consumed 1053bn m3 of water whereas China and India consumed 1207bn m3 and 1182bn m3 respectively. Fuelled by population growth and a rise in middle- and upper-class consumption, developing countries will also see increasing pressure on their static (or even shrinking) water supplies.
Growing water scarcity increases the need for more efficient water consumption. This starts with consciousness at the individual and community level. World Water Day spread the word about water conservation to more than 700M people in 2014 alone. Water use efficiency can be achieved through better education, behaviour change and technical efficiency. For example, the average American family could save 60,000 litres a year by installing low-flow toilets, or save 1.3M litres a year by not eating beef. Some corporations are helping to elevate consciousness regarding water use as well; Unilever, for example, has pledged to halve the water associated with using their products by 2020.
05
Fig 1: Annual water withdrawals per person by country[Seametrics, 2012]
Fig 1.2: Impact of water withdrawal by 2025[Seametrics, 2012]
< 100
250–500
500–1000
1000+Cubic metres a year
severely stressed (2–2.8)
extremely stressed (2.8–8x)
exceptionally stressed (>8)
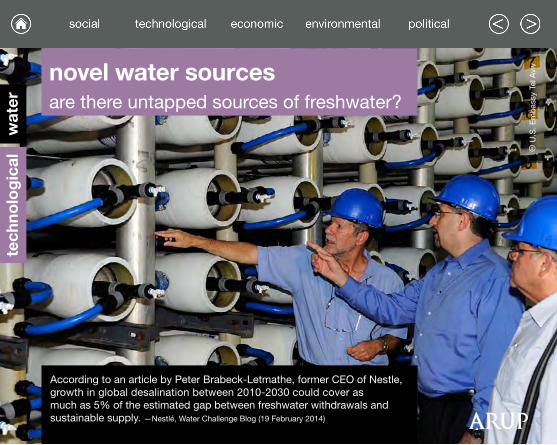
novel water sourcesare there untapped sources of freshwater?
According to an article by Peter Brabeck-Letmathe, former CEO of Nestle, growth in global desalination between 2010-2030 could cover as much as 5% of the estimated gap between freshwater withdrawals and sustainable supply. —Nestlé, Water Challenge Blog (19 February 2014)
tech
nolo
gic
alw
ater
c U
.S. E
mb
assy
Tel
Avi
v

tech
nolo
gic
alw
ater
novel water sourcesDesalination enables the conversion of salt water to fresh water. Between 2001 and 2011, industrial desalination capacity expanded by 276%. As of 2013, there were 17,277 commissioned desalination plants in the world with a total capacity of 80.9M m³/day. Countries leading the way in capacity are Saudi Arabia, UAE, Spain, Kuwait and Algeria. In Israel, nearly 25% of the water supply comes from desalination. The practice is highly energy intensive, but as salt water is seen as a limitless resource — and with many urban centres facing water shortfalls located on coastlines — the technology continues to gain traction.
In areas of Chile and Peru with limited rainfall and water infrastructure, fog-harvesting technology is being developed and adopted. A team at the Massachusetts Institute of Technology (MIT) developed a mesh fog net in 2013 which can capture 12l/m2. In cities, the creation of blue roofs and the building of integrated water capture systems are resulting in the use of under-utilised physical assets for water creation. Hundreds of schools across Israel, for example, collect enough rainwater during the rainy season to meet 1/3 of their water demands for the entire year. 06
Saud
i Ara
bia UAE
Spain USA
China
Alge
ria
Austr
alia
Israe
l
India
Qata
r
Milli
on m
3 /d
6
5
4
3
2
1
0
Fig 1: Top ten countries by total installed desalination capacity since 2003[DesalData, 2012]
Fig 2: Reverse osmosis method of desalination[New Sky 24, 2015]
Ocean Reverse Osmosis Fresh Water
Pretreatment
Debrine
Energy
tech
nolo
gic
alw
ater
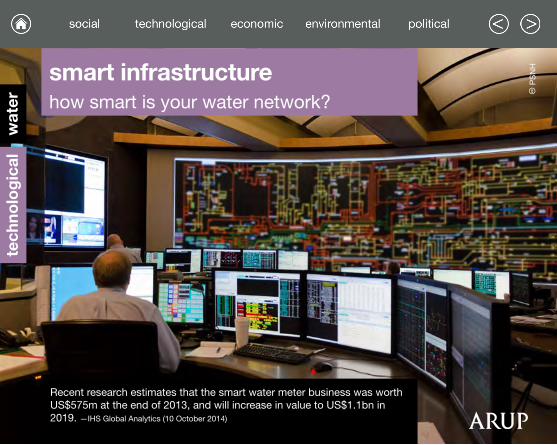
smart infrastructurehow smart is your water network?
Recent research estimates that the smart water meter business was worth US$575m at the end of 2013, and will increase in value to US$1.1bn in 2019. —IHS Global Analytics (10 October 2014)
c P
SN
H

tech
nolo
gic
alw
ater
smart infrastructureIn 2013, the average American city lost 30% of its water through leaks or unbilled usage. In New Delhi, India, losses are estimated to be closer to 53%, and for many developing nations around 38%. New smart systems aim to improve the efficiency and function of water infrastructure through increased automation, distributed sensor networks and geo-spatial information systems (GIS). These help to observe, understand and manage water systems in real-time, improving system efficiency. In Singapore, 130 network sensors take readings every millisecond and feed the data back to a central server. Leakage and flow is monitored and controlled remotely, giving unparalleled insight into the system and radically reducing leakage. Sensors measure pH, temperature, electrical conductivity and other properties useful to ensure water quality and safety.
Though criticised for its high up-front cost, smart infrastructure helps operators optimise capital allocation, improving system-wide assessment, maintenance and replacement practices. Smart technologies can also help the end-user monitor and reduce water usage by providing data-driven feedback loops and smart metering. The East Bay Municipal Utility in California, US, for example, reduced residential water usage by 5% after the installation of smart meters. 07
2013
2014
2015
2016
2017
2018
2019
2020
Milli
ons
of U
S do
llars
1,400
1,200
1,000
800
600
400
200
0
Fig 1: Global revenue forecast for smart water meters [IHS Technology, 2014]

waterless designcan our systems function without water?
Between 2013 and 2014, Toyota North America reduced its freshwater usage by 16.6M gallons (63M litres) at the South Paint Shop of its TMMC facility. —Toyota Environment Report (2014)
wat
erte
chno
log
ical
c L
and
Rov
er M
EN
A

08
tech
nolo
gic
alw
ater
waterless designFrom cars to computers, soap to soft drinks, most products require water at some stage in their manufacture and distribution. One pair of jeans, for instance, requires about 12,000 litres of water for growing, dyeing and washing the required cotton, even before the product reaches the consumer. The manufacture of one ton of steel can require up to 340,000 litres. Assembling the average smartphone requires 1,000 litres; as of 2013 there were more than 1.4bn smartphones produced globally. On the whole, industry accounts for roughly 20% of the total freshwater withdrawals across the globe.
Increasingly, though, companies are looking to minimise water use in their design and production processes to limit their dependency and exposure to water-based financial risks. In 2013, Kia Motors’ total water consumption at the Hwasung, Sohari and Gwangju plants decreased by 305M litres from the previous year (down 30% since 2003). Similarly, Cascade Tissue Group, based in Canada, employs a range of state-of-the-art water reuse technologies, enabling the company to use one-fifth of the industry average. This approach saves 2.6bn gallons annually, reducing the company’s operating costs by US$20M.
Fig 1: Ford’s global water use per vehicle produced[Ford, 2014]
2000
2009
2010
2011
2012
2013
Cubi
c m
etre
12
10
8
6
4
2
0

usage efficiencyhow much unused water are you paying for?
A standard western toilet has historically used up to 30 litres of water per flush, whereas a high-efficiency toilet can use as little as 4 litres, or 86% less water, per flush. —Southern Nevada Water Authority (2015)
tech
nolo
gic
alw
ater
© L
isa
Pic
ard

09
tech
nolo
gic
alw
ater
usage efficiencyIn Hyderabad, India, up to 40% of the water in the city is wasted every day. In many countries, 17% is seen as the “admissible rate of water loss” and system inefficiency. According to a 2014 UN Water report, if efficiency does not improve, worldwide water demand will outstrip supply by 40% by 2030. Increasing water usage efficiency is critical to effectively managing water supplies.
Weather-based irrigation controllers (WBICs) can automatically adjust water volume and timing in response to changing weather conditions. Residential users can save an estimated 60,000 litres of water per year using this technology. At agricultural scale, researchers at the University of Georgia have developed a GPS-based system which enables farmers to accurately target irrigation through geo-spatial data and sensor networks, thus reducing water consumption by as much as 15%. At the urban scale, IBM and Veolia have announced a strategic partnership to use software and analytics for the integration, analysis and optimisation of all data related to water use in municipalities.
Amou
nt u
sed
(litre
s)
100
75
50
25
0
95
40
3.510
15
Fig 1: Average water used for daily activities [Anglian Water, 2014]
Dishwasher cycle
Single flush toilet,
per flush
Brushing teeth with tap
running
Half Bath+5 minutes of showering

tech
nolo
gic
alw
ater
c E
urop
ean
Com
mis
sion
DG
EC
HOwater reuse and recycling
do you drink recycled water?
After a successful 3-year trial, the government of Perth, Australia, is scaling up a water recycling program to supply 7bn litres of water per year. In the coming decades, it will be able to supply 20% of Perth’s drinking water. —Government of Western Australia (1 August 2013).

tech
nolo
gic
alw
ater
water reuse and recyclingNew filtration, recycling and treatment technologies will continue to increase the amount of wastewater available for both industrial processes and human consumption. Global markets for wastewater recycling and reuse technologies grew from US$6.7bn in 2009 to US$9.5bn in 2012 and are forecast to reach US$23.4bn by 2017. Greywater recycling — collecting used water from sinks, showers and baths, and cleaning it for use in toilets, washing machines, and landscaping — has the potential to reduce freshwater usage by 50% at a building level.
NEWater is a high-grade, drinkable water produced by passing waste-water though membrane purification and UV disinfection. In 2014, Singapore met 30% of its total water needs through NEWater, with a target of expanding this to 55% by 2060. In January 2015, Bill Gates publicly drank a glass of water filtered at a local sewage facility. The sewage sludge had been converted to drinking water by the OmniProcessor, a technology that the Gates Foundation hopes will provide clean, safe water in the developing world. Reuse and recycling fall below avoidance and reduction in the hierarchy of water management strategies, but can help make the most of a limited supply. 10
Local Surface Water
Water Importation
Water Conservation (Agriculture)
Water Recycling
Ground Water
Seawater Desalination
Water Conservation (Urban)
Fig 1: Trends in water supply sources, San Diego, CA[San Diego County Water Authority, 2011]
1991 2020
96%
4%
32%
37%
14%
6%
7%8%
4%

ecosystem serviceshow much is your local ecosystem worth?
A study on The Economics of Ecosystems and Biodiversity (TEEB) in Southeast Asia predicted that under business-as-usual circumstances, mangrove losses would account for roughly US$2.2bn in foregone annual benefits by 2050. —UNEP et al (12 October 2013).
eco
nom
icw
ater
c U
.S. F
ish
and
Wild
life
Ser
vice
Nor
thea
st R
egio
n

11
eco
nom
icw
ater
ecosystem servicesEcosystem Services are the human and economic benefits provided by natural ecosystems. The term was popularised by the Millennium Ecosystem Assessment in the UK, and typically covers four categories: Provisioning (eg producing potable water and food); regulating (eg controlling climatic conditions); supporting (eg crop pollination); and cultural (eg spiritual and recreational benefits).
Aquatic ecosystems provide immense value, from transportation, to recreation, to resilience, to stormwater management and water filtration. According to the UK’s 2011 National Ecosystem Assessment, the benefits of inland wetlands for water quality were worth up to £1.5bn per year to the UK. In 2013 the New York City Department of Environmental Protection started a US$2bn investment programme into green infrastructure — green spaces, bioswales, and more — using nature to help manage stormwater runoff. According to a 2014 Oxfam report, every dollar invested in wetland restoration returns US$15 in net economic and social benefits, such as buffering storm surges, safeguarding coastal homes, creating nursery habitats for fish, and supporting recreation.
Fig 1: The value of ecosystem services[Global Environmental Change, 2014]
US$4.3–20.2tn/yrGlobal loss of ecosystem services due to land use change
US$125tn/yrThe estimate for the total value of global ecosystem services in 2011

energy supplyhow much water is needed to run your power plant?
India generates 19% of its energy from hydroelectric power plants. Due to a season of low rainfall in 2012, hydroelectric production fell 19% from the previous year. A resulting blackout that left nearly 670M people without power in the height of summer. —World Resources Institute (6 August 2012).
eco
nom
icw
ater
c J
enni
fer
Will
iam
s

eco
nom
icw
ater
energy supplyThe UN has predicted that by 2030, adequately supporting the growing global population will require at least 40% more water and 50% more energy. Water is a critical input in the production and transmission of energy. In 2010, roughly 15% of the world’s total water withdrawals were directed to energy generation, particularly for hydroelectric, nuclear, and thermal energy sources. A large nuclear power plant using once-through cooling technology can withdraw up to 4.5bn litres of water per day. According to a 2013 GlobalData report, installed hydropower capacity is expected to grow 32% from 1,064GW in 2012 to 1,407GW in 2020.Hydroelectricity, however, can have a significant impact on marine ecosystems, changing water temperatures, limiting downstream river flow, and disrupting wildlife migration.
In addition to power stations, increased use and production of biofuels has led to an incremental increase in demand for water, as many biofuel processes require highly water intensive agricultural feedstock. According to UN Water’s 2012 World Water Development Report, a small increase in biofuel demand could elevate agricultural water demand by as much as 20% worldwide. 12
Fig 1: The water / energy cycle[WUIM, 2012]
Water for Energy
Energy for Water
Extraction & Refining Hydropower
Energy Associated with Uses of Water
Drinking Water Treatment
Fuel Production (Ethanol, Hydrogen)
Thermo electric Cooling
Wastewater Treatment
Extraction and Transmission
Fig 2: Water for energy[GE, 2014]
16
25
2030
Gallons of water used to power a single 60-watt light bulb for 12 hours
Gallons of water needed to power a mobile device for an entire year
The year energy use is projected to increase by 30% and demand for water by 40%
eco
nom
icw
ater
c J
ohn
Don
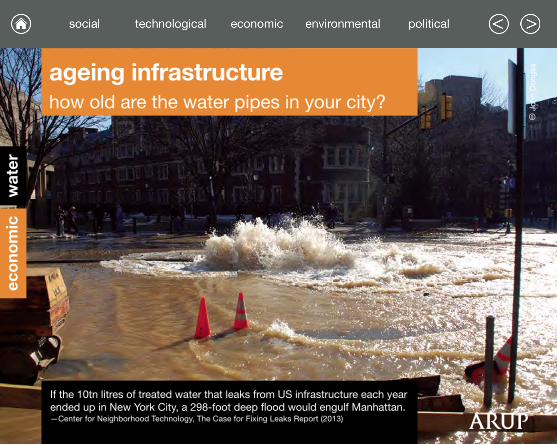
gesageing infrastructure
how old are the water pipes in your city?
If the 10tn litres of treated water that leaks from US infrastructure each year ended up in New York City, a 298-foot deep flood would engulf Manhattan. —Center for Neighborhood Technology, The Case for Fixing Leaks Report (2013)

eco
nom
icw
ater
ageing infrastructureA lot of developed countries require upgrades or replacement of failing critical assets such as treatment plants or distribution pipelines. This includes improving water asset management practices to make the most of existing and new investments. On a macro scale, the OECD estimates that by 2025, water infrastructure will be the largest recipient of infrastructure investment globally, with water spending in OECD and BRIC countries topping US$1tn.
In the US, researchers estimate that 27bn litres of treated water are lost each day due to ageing and leaky pipes, broken water mains and faulty meters. That amounts to 540,000 individual breaks each year. The US Environmental Protection Agency estimates the minimum repair investment at US$335bn for fresh water and US$298bn for wastewater in the coming decades. Similarly, England and Wales invested US$136bn between 1992 and 2012 to try to keep their water infrastructure up to standards, but according to the Institution of Civil Engineers, they will need to invest even more in the coming decade to reduce leakage and improve system efficiency to serve the needs of their population.
13
Fig 1: Top utilities industry issues for North America[Black & Veatch, 2014]
Aver
age
scor
e
1 2 3 4 5Scale
4.66
4.48
4.45
4.38
4.21
4.08
4.06
4.04
3.94
3.70
Ageing water and sewer infrastructure
Managing capital costs
Managing operational costs (eg, energy, chemicals)
Funding or availability of capital
Increasing / expanding regulation
Information technology
Treatment technology
Ageing workforce
Water scarcity or availability and / or conservation
Water loss (non revenue water)
Very importantVery unimportant
Fig 2: Ageing infrastructure[The World Bank and Environmental Protection Agency, 2012]
$14bn60%30%
Global cost of leaky water pipes annually
Worldwide loss of water due to leaky pipes
Pipes between 40 and 80 years old

virtual waterhow much water is in a smartphone?
It takes approximately 1,000 litres of water to produce one smartphone — including everything from mining metals to polishing the glass screens to making microchips. —Stephen Leahy, Your Water Footprint: The Shocking Facts About How Much Water We Use to Make Everyday Products (2014)
eco
nom
icw
ater
c A
ndy
Mal
min

eco
nom
icw
ater
virtual waterVirtual Water (also called Embedded or Embodied Water) characterises the ‘unseen’ water required to produce food and non-food services and products. About 65% of the water that most people consume is actually embedded in their food. For example, it takes nearly 10,000 litres of water to produce just 0.5kg of beef, or around 2,000 litres for 0.5kg of chicken. Most goods require water at some point in their production. A pair of blue jeans, for instance, requires up to 13,000 litres of water to produce. One computer chip requires roughly 45 litres of water to produce. And one pound of plastic can require up to 100 litres.
Water Footprinting is one approach to evaluating and communicating the total virtual water content of any product and service, enabling consumers and producers to better understand the quantity and geography of the water embedded in their products. The water footprint of Chinese consumption, for example, is about 1070m3 per year per capita, while in the US it is 2840m3 per year per capita.
14
Amou
nt u
sed
(litre
s)
30,000
20,000
10,000
0
11K
30K
13–15K
8K
1–3K
1 car1 kilo of beef
1 pair of jeans
1 pair of shoes
1 kilo of rice
Fig 1: Water footprint[World Water Forum, 2012]
Fig 2: Water footprint of consumers by country[Waterfootprint.org, 2014]
m3 p
er y
ear
3000
3500
2500
2000
1500
1000
500
0
UAE
Unite
d St
ates
Glob
al av
erag
e
India
China

eco
nom
icw
ater
climate adaptationis your city prepared for the impacts of climate change?
In 2013, the Rockefeller Foundation pledged US$100M to enable at least 100 cities around the world to hire resilience officers to improve response to climate change and other shocks. —Philanthropy News Digest, Thirteen New Commitments Announced at 2013 Clinton Global Initiative Meeting (2013)
c G
raem
e B
unto
n, S
ara
Bun
ton,
Pee
l

eco
nom
icw
ater
climate adaptationThe UN estimates that between 2000-2013, direct losses from disasters globally were roughly US$2.5tn. Climate change increases the frequency and intensity of extreme weather events. Responding to and preparing for extreme weather patterns incurs both economic and societal costs. The charity Oxfam recently reported that between 2009 and 2014, approximately $490bn was spent on climate-related disasters on a global scale. A 2014 UNEP report on the state of climate change adaptation found that the global cost of adaptation is likely to be US$250-500bn by 2050, two to three times higher than original estimates by the Intergovernmental Panel on Climate Change (IPCC).
Given that extreme weather events are likely to increase in both frequency and severity, many governments and municipalities are developing strategies to prepare for the future, both in terms of mitigation and adaptation. In the wake of Hurricane Sandy, the Mayor of New York City outlined a US$20bn plan to protect the city from rising sea levels and powerful storm surges. Adaptation measures included building an extensive network of flood walls, levees and bulkheads along the cities shoreline. The City of Chicago is investing in permeable pavement and enlarging the size of its street tree wells to significantly increase stormwater absorption. 15
Fig 1: National flood insurance programme debt post Hurricane Katrina[White House Federal Budget and Congressional Research Service, 2013]
Billi
ons
of d
olla
rs
1997
1998
1999
2000
2001
2002
2003
2004
2005
2006
2007
2008
2009
2010
2011
2012
25
20
15
10
5
0
Fig 2: 48-hour hurricane relief vs 2012 Federal budgets[White House Federal Budget and Congressional Research Service, 2013]
Billi
ons
of d
olla
rs
60
50
40
30
20
10
0Hurricane
Sandy reliefEducation
(elementary, secondary, vocational)
Natural resources + environment
General science
Agriculture
flood riskwhat if a 100-year storm happened yearly?
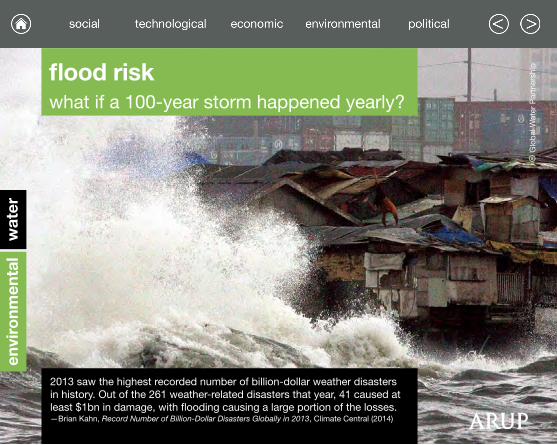
2013 saw the highest recorded number of billion-dollar weather disasters in history. Out of the 261 weather-related disasters that year, 41 caused at least $1bn in damage, with flooding causing a large portion of the losses. —Brian Kahn, Record Number of Billion-Dollar Disasters Globally in 2013, Climate Central (2014)
envi
ronm
enta
lw
ater
c G
lob
al W
ater
Par
tner
ship

envi
ronm
enta
lw
ater
flood riskAccording to a 2015 report by the World Resources Institute, the number of people affected by river flooding alone could triple between 2015-2030, affecting nearly 50M and costing the world economy roughly US$500bn. The World Bank and OECD predict that global flood losses could rise from US$6bn in 2005 to US$1tn in 2050 in light of urbanisation, population growth, sea level rise and sinking land. The ten cities most vulnerable to flood events (as a percentage of GDP) are Guangzhou, China; New Orleans, US; Guayaquil, Ecuador; Ho Chi Minh City, Vietnam; Abidjan, Ivory Coast; Zhanjing; China; Mumbai, India; Khulna, Bangladesh; Palembang, Indonesia; and Shenzen, China.
In most of Europe, flooding is the most common extreme weather event. In the coming years , winter floods are expected to increase, affecting an additional 1.6M people each year in the EU alone. Southeast Asia, however, is widely considered to be the most flood-prone region globally in terms of magnitude, frequency and severity.
16
Billi
ons
of d
olla
rs
400
300
200
100
0
DroughtCycloneTsunamiEarthquakeFloods
Fig 1: Cost of natural disasters[Centre for Research on the Epidemiology of Disasters, 2013]
Most Vunerable Cities to Natural Disasters
1 Guangzhou
2 New Orleans
3 Guayaquil, Ecuador
4 Ho Chi Minh City
5 Abidjan
6 Zhanjing
7 Mumbai
8 Khulna, Bangladesh
9 Palembang, Indonesia
10 Shenzen
Fig 2: Most vunerable cities based on GDP[The World Bank, 2013]

envi
ronm
enta
lw
ater
persistent droughtwhat happens if the rains stop coming?
A protracted drought in Australia has had significant impacts on the country’s economy. There are forecast falls of 8.2% in wheat production, 17% in canola production, and 11.4% in cotton production. —Sydney Morning Herald (4 March 2014).
c G
lob
al W
ater
Par
tner
ship

envi
ronm
enta
lw
ater
persistent droughtPrecipitation in the form of rain is the main source of freshwater for humans and natural ecosystems. However, geographic and temporal rainfall patterns are shifting in unpredictable ways, in many cases leading to protracted droughts and shortages of freshwater. In India, there have been “statistically significant decreases in peak-season precipitation over the core monsoon region” causing significant shortages to regional water supplies, and affecting agricultural and economic production.
The US has recently experienced its most severe drought conditions in decades; at the peak of 2012, 81% of the US was under abnormally dry conditions, causing an estimated US$30bn in damages. California experienced the worst regional drought in 1,200 years from 2012-2014, with devastating ecological and economic consequences for the region, specifically in the agricultural sector. As of July 2014, the drought was expected to cost the state US$2.2bn for the year and result in the loss of 17,000 jobs.
17
Peop
le in
mill
ions
Fig 1: Fatalities from natural disasters in Asia, 1900–2013[Centre for Research on the Epidemiology of Disasters, 2013]
10
8
6
4
2
0
TsunamiCycloneEarthquakeFloodsDrought

envi
ronm
enta
lw
ater
groundwater depletionwhen will your aquifer run dry?
As of July 2013, 18 major countries (containing approximately half the world’s population) were over-pumping their aquifers, far beyond the replenishment rate. Among these are the three largest global grain producers - China, India and the US. —The Guardian (6 July 2013)
c E
urop
ean
Com
mis
sion
DG
EC
HO

envi
ronm
enta
lw
ater
groundwater depletionGroundwater is water found below the earth’s surface, typically in cracks and gaps in rock, sand and soil. According to the US National Groundwater Association, this water is the most extracted raw material in the world, with estimated withdrawal rates of about 982 km3/year. According to a 2012 UN Report, it is estimated that almost half the global population uses groundwater as the main source of their drinking water. Agriculture is by far the largest user of groundwater, accounting for 60% of the global usage.
Depletion of groundwater reserves can lead to long-term food and water insecurity and geo-structural instability. As of 2011, Bangladesh was extracting groundwater at a rate of 53bn cubic metres a year, despite a recharge rate of only 50bn cubic metres annually. This could prove problematic for sustaining major cities like Dhaka, where 97% of water demands are met by groundwater. In many coastal communities groundwater extraction is causing the ground and water to sink. In Japan, parts of Tokyo are reported to have sunk by up to two metres before groundwater abstraction in the city was banned.
18
Fig 1: Groundwater depletion [NASA GRACE and Quartz, 2014]
Fig 1: Declining storage in major global aquifers [NASA GRACE and Quartz, 2014]
Annual Groundwater Depletion in Major Aquifiers (Cubic Kilometers)
1.0
6.7
12.3
18.0
Tota
l wat
er s
tora
ge a
nom
aly
(mm
eq
wat
er h
eigh
t)
2002
2003
2004
2005
2006
2007
2008
2009
2010
2011
2012
150
100
50
0
-50
-100
-150
-200
-250
-300
-350
2013
GuaraniSouthern PlainsNW IndiaMiddle EastCanningN China PlainCentral Valley

envi
ronm
enta
lw
ater
food productionshould we all become vegetarians?
Vegetables require 50,000 litres of water per ton to produce, and fruits need 175,000 litres per ton. Pork, on the other hand, consumes 550,000 litres of water per ton of meat produced and beef, about 660,000 litres per ton. —New York Times Online (7 March 2014)
c A
griL
ife T
oday

envi
ronm
enta
lw
ater
food productionThe world population is predicted to grow to 8.3bn by 2030. By that time, food demand is predicted to increase by 60%. Roughly 70% of global freshwater is used by the agricultural sector, making it the largest consumer of freshwater by a significant margin. Primary uses are for irrigation and in the production of animal feed, fertilizer and pesticides. For example, as of 2013, nearly 1/3 of the world’s water went to livestock production.
Concurrently, economic growth and globalisation are fueling a shift to diets containing more meat and dairy, both of which require more water to produce than traditional grain and vegetable diets. Producing half a kilo of beef, for example, requires nearly 10,000 litres of water, whereas producing one pound of wheat requires only 800 litres. To complicate matters, industrial agriculture required to produce enough food has, in many cases, led to irrigation salinisation, a condition resulting from excessive watering wherein a rising water table brings increased salt to the surface. If salt concentrations in soils reach 0.5-1.0%, the land becomes toxic to plant life.
19
Fig 1: World water use by sector[OECD Environmental Outlook Baseline, 2007]
Agriculture
Domestic
Electricity
Manufacturing
Fig 1: Meat consumption in China[USDA, 2014]
Kilo
gram
s pe
r per
son
1980
1985
1990
1995
2000
2005
2010
2015
2020
70
60
50
40
30
20
10
0
ProjectionsPork Poultry Beef
Wat
er u
se (k
m3 )
2000
2010
2020
2030
2040
2050
7,000
6,000
5,000
4,000
3,000
2,000
1,000
0

ecosystem pollutionare you poisoning your own well?
According to research by the United Nations Environment Program (UNEP), every year, lakes, rivers, and deltas take in pollution that is equivalent to the weight of the entire human population — nearly 7bn people. —UNEP, Clearing The Waters Report (2010)
envi
ronm
enta
lw
ater
c G
usta
vo V
erís
sim
o

envi
ronm
enta
lw
ater
ecosystem pollutionA 2012 report by the Chinese Ministry of Environmental Protection found that 40% of China’s rivers were “seriously polluted” and 20% were too toxic for human contact. Chemical spills, industrial waste discharge, acidified rain, sewage overflows and fracking fluids are all examples of man-made pollutants affecting aquatic and marine ecosystems.
According to a 2010 UNEP report, industry releases about 300–400M tons of heavy metals, solvents, toxic sludge, and other wastes into the world’s waters each year. Beyond industry, in some developing countries roughly 80% of sewage is discharged directly into communal waterways without treatment. Degraded water costs countries in North Africa and the Middle East between 0.5 and 2.5% of GDP per year. According to the World Resources Institute, as of 2011 more than 25% of the world’s reefs were considered to be “threatened” by water-based pollution, with nearly 10% considered to be “highly threatened.” The resultant losses in biodiversity could be extremely damaging to the food chain and other ecological systems upon which humans, and other species, rely.
20
In DevelopingCountries
70%of industrial wastes are dumped untreated into waters where they pollute the usable water supply
Fig 1: Water pollution[World Water Assessment Programme, 2012]

water stressshould we fight over water?
According to UN Water, in 2014, roughly 1.2bn people — or approximately 1/5 of the world’s population — were living in areas of physical water scarcity. —United Nations Water (24 December 2014)
po
litic
alw
ater
© S
iegf
ried
Mod
ola/
IRIN
po
litic
alw
ater
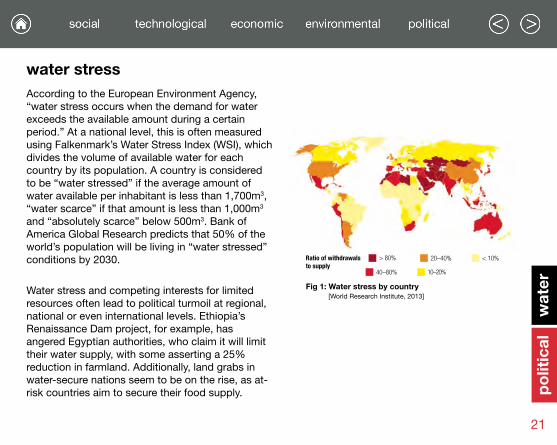
water stressAccording to the European Environment Agency, “water stress occurs when the demand for water exceeds the available amount during a certain period.” At a national level, this is often measured using Falkenmark’s Water Stress Index (WSI), which divides the volume of available water for each country by its population. A country is considered to be “water stressed” if the average amount of water available per inhabitant is less than 1,700m3, “water scarce” if that amount is less than 1,000m3 and “absolutely scarce” below 500m3. Bank of America Global Research predicts that 50% of the world’s population will be living in “water stressed” conditions by 2030.
Water stress and competing interests for limited resources often lead to political turmoil at regional, national or even international levels. Ethiopia’s Renaissance Dam project, for example, has angered Egyptian authorities, who claim it will limit their water supply, with some asserting a 25% reduction in farmland. Additionally, land grabs in water-secure nations seem to be on the rise, as at-risk countries aim to secure their food supply.
21
Fig 1: Water stress by country[World Research Institute, 2013]
> 80%
40–80%
20–40%
10–20%
Ratio of withdrawals to supply
< 10%

Eur
opea
n C
omm
issi
on D
G E
CH
O -
CC
-BY-
ND
ownership modelswho owns your water supply?
In 2013, 102 new private water contracts were signed in the BRIC nations alone, serving 53.9M people (roughly 88% of the global total of people served by new contracts). —Global Water Intelligence (2015)
po
litic
alw
ater
c G
lob
al W
ater
Par
tner
ship

po
litic
alw
ater
ownership modelsAs of 2013, nearly 15% of the global population received water and/or wastewater services from private providers. International financial institutions such as the World Bank and the IMF have encouraged privatisation, particularly in the developing world. Between 1990 and 2013 the World Bank invested US$74.5bn in privatising water infrastructure. Around 28% of this investment, however, went to projects that were cancelled or under distress. Although privatisation does work to finance, develop and operate infrastructure, many see it as turning a low-return public utility into a profit-making venture, thus putting the needs of shareholders above the public good.
The relationship between public water utilities and their citizens is fundamentally different to that between private water utilities and their customers. The relationship between a customer and a private utility is much more transactional — customers expect a certain standard of service and there is little connection to the private company. Citizens, on the other hand, feel a sense of ownership, as they may pay for the service indirectly through taxation or rates, and are more likely to act for the common good. How people engage with their water suppliers can have a significant impact on behaviour. 22
Popu
latio
n se
rved
(mill
ions
)
400
300
200
100
0
Fig 1: Water/wastewater PPP contracts signed by region [Global Water Intelligence, 2015]
1980
–84
1985
–89
1990
–94
1995
–99
2000
–04
2005
–09
2010
–15
OECD BRIC ROW
Fig 2: People served by private water or sewage services[Pinsent Masons LLP, 2012 ]
Mill
ions
of P
eopl
e
2000
1500
1000
500
02012 2015 2025

watershed cooperationshould you share with your neighbour?
According to Resolution A/RES/65/154, in December 2010, the UN General Assembly decided to proclaim 2013 International Year of Water Cooperation. —UN General Assembly (2011)
po
litic
alw
ater
© K
laus
Lei
dor
f

po
litic
alw
ater
watershed cooperationGlobally, there are 276 river basins and at least 200 aquifers that cut across international borders. 148 out of 195 nations have territory in international basins. 18 of these basins worldwide are shared by more than 5 different nations. Sharing these limited resources may result in potentially conflicting upstream and downstream uses, yet despite the possible conflicts arising from these shared resources, studies suggest that cooperation is highly likely in shared basins. Between 1820 and 2007, 450 agreements on international waters were signed. Many of these treaties remain weak due to lack of water allocations, poor water quality provision, lack of monitoring and enforcement or conflict resolution mechanisms, and failure to include all parties with a water interest.
Integrated Water Resources Management (IWRM) is an approach that supports the co-ordinated development and management of water, land and related resources. The aim is to maximise the resultant economic and social welfare in an equitable manner without compromising the sustainability of vital ecosystems. In 2012, UN Water reported that 80% of the 130 countries surveyed had made reforms to enable integrated water resources management. 23
Fig 1: Transboundary river basins by continent[Unwater.org, United Nations, 2013]
80
60
40
20
0
S AmericaN AmericaEuropeAsiaAfrica
300
37
Fig 2: Watershed cooperation [United Nations, 2013]
Since 1947 there have been
international water agreements
against
conflicts between states over war
276There are
international river basins and transboundary aquifer systems in the world
international river basins and transboundary aquifer systems in the world
60%of these lack any type of cooperative management framework
system vulnerabilityhow secure is your supply?
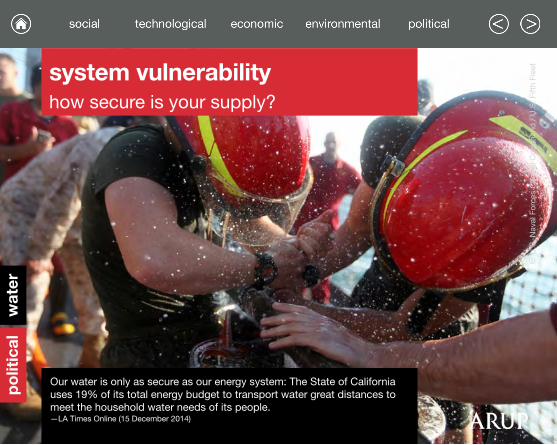
Our water is only as secure as our energy system: The State of California uses 19% of its total energy budget to transport water great distances to meet the household water needs of its people. —LA Times Online (15 December 2014)
po
litic
alw
ater
c U
.S. N
aval
For
ces
Cen
tral
Com
man
d /
U.S
. Fift
h Fl
eet

po
litic
alw
ater
system vulnerabilityAccording to a 2010 study in the journal Nature, 80% of the world’s population lives in areas where the water supply is not secure. In general, leakage in the water system is one of the most prevalent vulnerabilities. In the US specifically, according to the 2013 Infrastructure Report Card, there are approximately 240,000 water main breaks every year.
The contamination of drinking water or distribution chain sabotage are often regarded as likely terrorist acts, yet the quantity of toxic chemical needed to contaminate a municipal water supply is hard to define. In the developed world, most biological pathogens would fail to survive in water as a contaminant due to standard water treatment practices. While the vulnerability of the water supply increases post-treatment, the population size affected diminishes as well. In response, vulnerability assessment can help water utilities evaluate their susceptibility to potential threats and identify corrective actions that could reduce the risk of serious consequences. New safety measures such as remote monitoring technologies and critical system redundancies are being developed, and protocols are being adopted in an effort to fortify water supplies. 24
Fig 1: Overall water risk[World Research Institute, 2013]
Extreme high risk (4–5)
High risk (3–4)
Medium to high (2–3)
Low to medium (1–2)
Low risk (0–1)

water rightsis water a human right?
The human right to safe drinking water and sanitation is derived from the right to an adequate standard of living and inextricably related to the right to the highest attainable standard of physical and mental health. As well as the right to life and human dignity. —UN Human Rights Council (2010)
po
litic
alw
ater
c G
lob
al W
ater
Par
tner
ship
po
litic
alw
ater
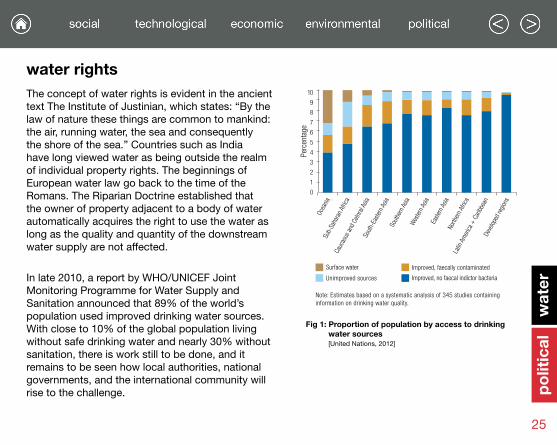
water rightsThe concept of water rights is evident in the ancient text The Institute of Justinian, which states: “By the law of nature these things are common to mankind: the air, running water, the sea and consequently the shore of the sea.” Countries such as India have long viewed water as being outside the realm of individual property rights. The beginnings of European water law go back to the time of the Romans. The Riparian Doctrine established that the owner of property adjacent to a body of water automatically acquires the right to use the water as long as the quality and quantity of the downstream water supply are not affected.
In late 2010, a report by WHO/UNICEF Joint Monitoring Programme for Water Supply and Sanitation announced that 89% of the world’s population used improved drinking water sources. With close to 10% of the global population living without safe drinking water and nearly 30% without sanitation, there is work still to be done, and it remains to be seen how local authorities, national governments, and the international community will rise to the challenge.
25
Fig 1: Proportion of population by access to drinking water sources[United Nations, 2012]
Surface water
Unimproved sources
Improved, faecally contaminated
Improved, no faecal indictor bacteria
Note: Estimates based on a systematic analysis of 345 studies containing information on drinking water quality.
Perc
enta
ge
Ocea
niaSu
b-Sa
hara
n Afri
ca
Cauc
asus
and
Cet
nral
Asia
Sout
h-Ea
stern
Asia
So
uthe
rn A
siaW
este
rn A
siaEa
stern
Asia
North
ern A
frica
Latin
Am
erica
+ C
aribb
ean
Deve
loped
regio
ns
10
9
8
7
6
5
4
3
2
1
0
social01 population growth
Population Institute (2010). Population and Water. http://bit.ly/1HovmX1
United Nations Population Fund (2014). World Populaiton Trends. http://bit.ly/1QaRbxq
United Nations Economic and Social Affairs (2004). World Population to 2300. http://bit.ly/1krrnOZ
World Population Statistics (2013). Asia Population 2013. http://bit.ly/NxqaI6
UNESCO (2012). World Water Development Report 4 - Brief. http://bit.ly/1P6l8xg
Mall, A et al (2012). The Tiger Roars: Capturing India’s Explosive Growth in Consumer Spending, Boston Consulting Group Report. http://on.bcg.com/1JZU144
image: James Cridlan, Flickr, CC-BY-2.0
02 urbanisation
Romero, S (2015). Tap Starts to Run Dry in Brazil’s Largest City, New York Times. http://nyti.ms/1yLJfxm
United Nations (2014). World Population Incresingly Urban. http://bit.ly/1BCKdal
Dash, D (2013). 22 of India’s 32 Big cities Face Water Crisis, The Times of India. http://bit.ly/1EkPNoL
image: Anton Bawab, Flickr CC-BY-NC-ND
03 water access
Leonard, T (2006). Water Resources and Distribution. Encyclopedia of the Developing World. http://bit.ly/1DENEAN
United Nations (2014). Millenium Development Goals Report 2014. http://bit.ly/1qDMdg9
World Health Organization (2012). Millennium Development Goal Drinking Water Target Met. http://bit.ly/1F8te5A
Water.org (2014). Millions Lack Safe Water. http://bit.ly/1aa4eri
Davis, S (2014). How Much Water is Enough? Determining Realistic Water Use in Developing Countries, Improve International. http://bit.ly/1E3gkF7
image: European Commission DG ECHO, Flickr, CC-BY-ND
04 sanitation and hygiene
Wang, Y (2013). More People Have Cell Phones Than Toilets, U.N. Study Shows. Time. http://ti.me/1lcwdfo
World Health Organization & UNICEF Joint Monitoring Program (2014). Progress on Drinking Water and Sanitation 2014 Update. http://uni.cf/1s3zyWY
Mehta, D et all (2014). Open Defecation in Cities: A Faltering India Story, Ideas for India. http://bit.ly/1GbD0T2
Center for Disease Control and Prevention (2014). Show Me the Science - Why Wash Your Hands? http://1.usa.gov/1miTUrY
Science Daily (2014). ‘SuperMum’ Campaign Results in Startling Imporvements in People’s Handwashing Behavior. http://bit.ly/1G1eAZO
image: European Commission DG ECHO, Flickr, CC-BY-ND
05 water consciousness
Energy Saving Trust (2013). At Home With Water. http://bit.ly/1HoM9t0
Fischetti, M (2012). How Much Water Do Nations Consume, Scientific American http://bit.ly/1EudNVI
Unilever (2014). Water Use, Unilever Sustainable Living. http://bit.ly/1H9Q4vj
image: Thomas Berg, Flickr, CC-BY-SA
technological06 novel water sources
Brabeck-Letmathe, P (2014). Seawater Desallination A Solution to Reduce Water Shortage, Nestlé Water Challenge Blog. http://bit.ly/1DFwlQh
Craze, M (2013). Desalination Seen Booming at 15% a Year as Water Dries Up, Bloomberg Business. http://bloom.bg/1zDwNdU
Faversham House Group (2013). Desalination Capacity Increasing by 50% in 2013 says IDA, International Desalination & Water Reuse Quarterly. http://bit.ly/1J3IZgu
Odenheimer, A et al (2014). Israel Desalination Shows California Not to Fear Drought, Bloomberg Business. http://bloom.bg/1Fvn0uR
Poppick, L (2013). Fog Collectors Could Ease Water Woes in Arid Lands, LiveScience.com. http://bit.ly/1Dv3HOw
Kloosterman, J (2013). Israel’s ‘Rain Man’ Conserves School Water, Israel21c.org. http://bit.ly/1Dv437T
image: © U.S. Embassy Tel Aviv,
Flickr, CC-BY-SA
07 smart infrastructure
IHS Press, (2014). Global Smart Water Meter Market to Eclipse $1 Billion in Five Years, Thanks to Rising Adoption. http://bit.ly/1JnQpI2
Clancy, H (2013). With Annual Losses Estimated at $14 billion, It’s Time to Get Smarter About Water, Forbes. http://onforb.es/1O8PSk7
Hodson, H (2014). Smart Sensors Warn Instantly of Citywide Water Leaks, New Scientist. http://bit.ly/1bmm6Ht
Slater, A (2012). Smart Water Global Survey, Sensus. http://bit.ly/1OzHDsa
Wang, U (2014). Drought Fighting Tool: Using Water Data to Change Behavior, Promote Conservation, Forbes. http://onforb.es/L0nPEq
image: PSNH, Flickr, CC-BY-ND
08 waterless design
Koel, J (2013). How 5 Manufacturers Reduce Water Use, Sustainable Manufacturer Network. http://bit.ly/1GbXVFB
Mis, M (2014). How Big is Your Water Footprint? You May be Surprised, Reuters. http://reut.rs/1s4YkGr
Grace Communications Foundation (2012). The Hidden
Water in Everyday Products. http://bit.ly/1OzKe5h
United Nations Water (2014). Agriculture is the Biggest Water User, With Irrigation Accounting for 70% of Global Water Withdrawals. http://bit.ly/1ui1BlR
Kia (2014). Kia improves sustainability of domestic manufacturing operations. http://bit.ly/1FoBN8P
Koel, J (2013). How 5 Manufacturers Reduce Water Use, Sustainable Manufacturer Network. http://bit.ly/1GbXVFB
image: Land Rover MENA, Flickr, CC-BY-2.0
09 usage efficiency
TNN (2013). 40% of Water Wasted Daily in Hyderabad, The Times of India. http://bit.ly/1D93DEI
United Nations Environment Program (2014). Water and Energy Efficiency Information Brief. http://bit.ly/1cSp0E6
SoCal WaterSmart (2014). Weather-Based Irrigation Controllers. http://bit.ly/1Iz60EI
Gies, E (2011). New Technology Reduces Agricultural Water Consumption, Forbes. http://onforb.es/1wzkMUT
image: © Lisa Picard
10 water reuse and recycling
Government of Western Australia (2013). Advanced recycling to help secure water supply. http://bit.ly/1FOF6sn
Global information Inc. (2013). Global Wastewater Reuse, Recycling Markets Expected to Expand, Research Says, Water World. http://bit.ly/1yMd6pv
Ferguson, D (2014). Greywater Systems: Can They Really Reduce your Bills?, The Guardian. http://bit.ly/1paARim
PUB, Singapore’s National Water Agency (2014). The Singapore Water Story. http://bit.ly/1hD84gF
Alba, D (2015). Bill Gates’ Plan to Help the Developing World Profit from its Sewage, Wired. http://wrd.cm/17fuE0b
image: European Commission DG ECHO, Flickr, CC-BY-SA
economic11 ecosystem services
UNEP et al (2013). Valuing ecosystem services in Southeast Asia. http://bit.ly/1FXgcI7
Hails, R et al (2011). Major Study Reveals the Hidden Value of UK Nature, Centre for Ecology
& Hydrology. http://bit.ly/1D98FkC
Lloyd, E. et al. (2013). NYC Green Infrastructure 2013 Annual Report, NYC Environmental Protection. http://on.nyc.gov/1fUkVQ4
Conathan, M. et al. (2014). The Economic Case for Restoring Coastal Ecosystems, OXFAM. http://ampr.gs/1ElrW8t
image: U.S. Fish and Wildlife Service Northeast Region, Flickr, CC-BY
12 energy supply
Kimball, R. (2012). 4 Ways Water Is Connected to India’s Blackouts. World Resources Institute. http://bit.ly/1QjMnTA
Couffe, D. et al. (2014). World Water Day 2014: UN Stresses Water and Energy Issues, United Nations University. http://bit.ly/1G1yCDG
UN Water (2014). Water and Energy Facts and Figures, The UN World Water Development Report 2014. http://bit.ly/1gilRwT
Union of Concerned Scientists (2011). Nuclear Power and Water. http://bit.ly/1O92szU
GlobalData (2013). Hydropower - Global Market Size, Competitive Landscape, Regulations & Investment Analysis to 2020. http://bit.ly/1O92Nm2

UN Water (2014). Water and Energy. http://bit.ly/1cSwaYX
image: Jennifer Williams, Flickr, CC-BY-SA
13 ageing infrastructure
Gallet, D (2013). Op-Ed: Nation’s Pipes Leak Enough Water to Drown Manhattan and Chicago, NextCity. http://bit.ly/1F9pEbm
Rodriguez, D. et al. (2012). Investing in Water Infrastructure: Capital, Operations & Maintenance, World Bank. http://bit.ly/1O93Br2
LaFrance, D. et al. (2013). The Case for Fixing the Leaks, Center for Neighborhood Technology. http://bit.ly/1bmztXW
Schelmetic, T. (2013). Water Infrastructure Upgrades: A $1 Trillion Market Opportunity Waiting to Happen, Thomasnet. http://bit.ly/1D9ePBs
Institute of Civil Engineers (2012). The State of the Nation Water 2012. http://bit.ly/1O94Bvl
image: John Donges, Flickr, CC-BY-ND
14 virtual water
McCarthy, E. (2014). The Surprising Water Footprints of 15
Common Things, Mental Floss. http://bit.ly/12cPJWB
Waterwise (N/A). Hidden Water: Embedded Water and Our True Consumption. http://bit.ly/TOerIw
National Geographic (N/A). The Hidden Water We Use. http://on.natgeo.com/1aM2X0e
Helms, C. (1996). Can Computer Chip Makers Reduce Environmental Impact, Stanford News Service. http://stanford.io/1D9i7Vf
Grace Communications Foundation (2012). The Hidden Water in Everyday Products. http://bit.ly/1OzKe5h
Water Footprint Network (N/A). waterfootprint.org.
image: Andy Malmin, Flickr, CC-BY
15 climate adaptation
Philanthropy News Digest (2013). Thirteen New Commitments Announced at 2013 Clinton Global Initiative Meeting. http://bit.ly/1QbWfS1
UNISDR (2013). UN Secretary-General Warns: Economic Losses from Disasters are Out of Control. http://bit.ly/1D9jALh
Brinicombe, L (2014). Half a Trillion Dollars, 650 Million People Affected, 112,000 Lives Lost, The Unacceptable Cost of Extreme
Weather Over Last 5 Years, Oxfam. http://bit.ly/1zDYt27
UN Environment Programme (2014). The Adaptation Gap Report 2014. http://bit.ly/1G2K9Vs
Gregory, K. et al. (2013)
Bloomberg Outlines $20 billion Storm Protection Plan, New York Times. http://nyti.ms/1yKpV3a
City of Chicago (2014). Green Stormwater Infrastructure Strategy.http://bit.ly/1spwejj
image: Graeme & Sara Bunton & Peel, Flickr, CC-BY-NC-SA
environmental16 flood risk
Kahn, B (2014). Record Number of Billion-Dollar Disasters Globally in 2013, Climate Central. http://bit.ly/1e94CqZ
Marshall, C (2015). Global Flood Toll to Triple by 2030, BBC. http://bbc.in/1B6AJaX
The World Bank, (2013). Which Coastal Cities Are at Highest Risk of Damaging Floods? http://bit.ly/1HaCO9P
Sinisi, L. et al. (2010). Guidance on Water Supply and Sanitation in Extreme Weather Events, World Health Organization.
http://bit.ly/11jQJHo
image: Global Water Partnership, Flickr, CC-BY-NC-SA
17 persistent drought
Sydney Morning Herald (2014). Drought to hit wheat, beef exports. http://bit.ly/1ENxMsZ
Chandra, N (2014). India’s Rain Pattern has Changed: Researchers Warn of Extreme Weather in Future, Mail Onilne India. http://dailym.ai/1HdvJ8v
Brewer, M (2015). U.S. Drought Monitor, Centre for Climate and Energy Solutions. http://bit.ly/1rYkGW4
Oskin, B (2014). California’s Worst Drought Ever Is 1st Taste of Future, livescience. http://bit.ly/1so7ZmB
Chaussee, J. (2014). California Drought Expected to Cost State $2.2 Billion in Losses, Reuters. http://reut.rs/1K1uRly
image: Global Water Partnership, Flickr, CC-BY-NC-SA
18 groundwater depletion
Brown, L (2013). The Real Threat to Our Future is Peak Water, The Guardian. http://bit.ly/1i90Foc

Groundwater Foundation. The Basics - What is Groundwater? groundwater.org. http://bit.ly/1bELLWI
National Ground Water Association (2015). Facts About Global Groundwater Usage, ngwa.org. http://bit.ly/1GdYjn0
UNEP GEAS (2012). A Glass Half Empty. http://bit.ly/1yNx0jS
IRIN (2011). Bangladesh: “Invisible Hazard” of Groundwater Depletion, irinnews.org. http://bit.ly/1OalLIR
Amos, J (2014). Megacities Contend with Sinking Land, BBC News. http://bbc.in/1HdHCeA
image: European Commission DG ECHO, Flickr CC-BY-ND
19 food production
McWilliams, J (2014). Meat Makes the Planet Thirsty, NY Times. http://nyti.ms/1k4HkIU
UN Water (2014). Water, Food and Energy Nexus, unwater.org. http://bit.ly/1OamOZy
Kekeritz, T (2010). Water Footprint: Virtual Water Embedded in Products, Virtualwater.eu http://bit.ly/1QeYtjP
Goldsmith, E. et al. (1984). Salting the Earth: The Problem of Salinisation, The Social and
Environmental Effects of Large Dams: Volume 1. http://bit.ly/1FbRpjz
image: AgriLife Today, Flickr, CC-BY-NC-ND
20 ecosystem pollution
UNEP (2010). Clearing the Waters, A Focus on Water Quality Solutions. http://bit.ly/1Gf2yBI
Economy, E (2013). China’s Water Pollution Crisis, The Diplomat. http://bit.ly/1Ge44kG
National Geographic. Freshwater Threats, nationalgeographic.com. http://on.natgeo.com/1HPKhtV
image: Gustavo Veríssimo, Flickr, CC-BY
political21 water stress
UNDESA (2014). Water Scarcity, un.org. http://bit.ly/LlYSTM
European Environmental Agency. Water Stress, eea.europa.eu. http://bit.ly/1zFUmm9
White, C (2012). Understanding Water Scarcity: Definitions and Measurements, Global Water Forum. http://bit.ly/1bQ0jEh
Kennedy, B (2014). Global Demand for Fresh Water Set
to Exceed Supply, CBS money watch. http://cbsn.ws/1pwVlor
Kingsley, P (2013). Ethiopia Rejects Egyptian Protest Over Nile Dam, The Guardian. http://bit.ly/1zFVRAY
image: © Siegfried Modola/IRIN
22 ownership models
Owen, D (2013). Market Profile: The Year in Private Water, Global Water Intelligence, Volume 14, Issue 11. http://bit.ly/1GfD4Em
Worldbank (2014). Sector Data Snapshot: Water and Sewage, worldbank.org. http://bit.ly/1J61BfJ
image: Global Water Partnership, Flickr, CC-BY-NC-SA
23 watershed cooperation
UN General Assembly (2011). Resolution adopted by the General Assembly on 20. December 2010. http://bit.ly/1Gem7qS
UN Water (2013). Transboundary Waters, unwater.org. http://bit.ly/1J63ARf
UNDESA (2014). Transboundary Waters, un.org. http://bit.ly/1zGakwC
UNDESA (2014). Integrated Water
Resources Management, un.org. http://bit.ly/1yNN0SY
UN Water (2012). Water Resource Management, un.org. http://bit.ly/1G35XhC
image: © Klaus Leidorf
24 system vulnerability
Water Aid (2012). Water Security Framework, Water Aid, London.http://bit.ly/1K1UYJ5
Vörösmarty, C. et al. (2010). Global Threats to Human Water Security and River Biodiversity, nature.com. http://bit.ly/1OaNERb
ASCE (2013). Drinking Water, 2013 Report Card for America’s Infrastructure. http://bit.ly/1zGf7hQ
image: U.S. Naval Forces Central Command/U.S. Fifth Fleet, Flickr, CC-BY-2.0
25 water rights
UNDESA (2014). The Human Right to Water and Sanitation, un.org. http://bit.ly/1uvjM5B
WHO (2012). Millennium Development Goal Drinking Water Target, World Health Organisation. http://bit.ly/1F8te5A
WHO, unicef (2013). Progress on Sanitation and Drinking-Water, unicef.org. http://uni.cf/1eXzoKO
image: Global Water Partnership, Flickr, CC-BY-NC-SA


![Chapter 7 Decoding [Sólo lectura] - UC3Mocw.uc3m.es/periodismo/media-theory/lecture-notes-1/chapter-7-decoding.pdf · Decoding MEDIA THEORY Week 9 Image courtesy of James Cridland](https://static.fdocuments.in/doc/165x107/5ec54f509b45101bce17a0ee/chapter-7-decoding-slo-lectura-decoding-media-theory-week-9-image-courtesy.jpg)